Embed Size (px)
Citation preview
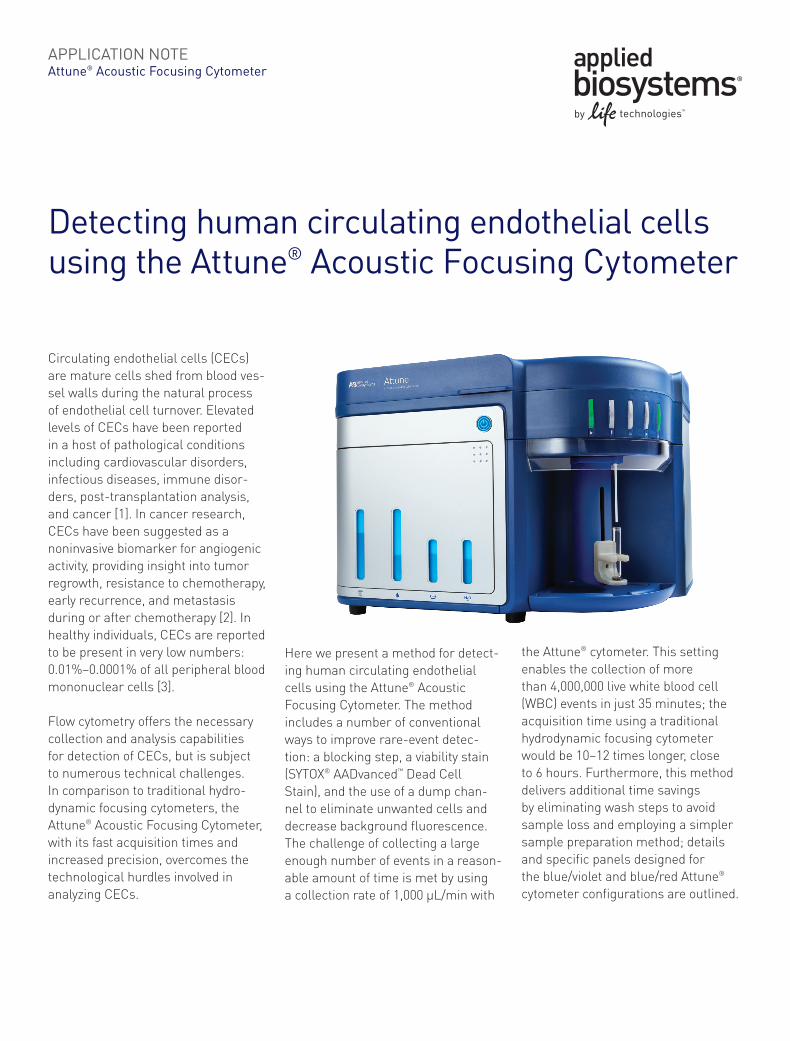
APPLICATION NOTEAttune® Acoustic Focusing Cytometer
Circulating endothelial cells (CECs) are mature cells shed from blood ves-sel walls during the natural process of endothelial cell turnover. Elevated levels of CECs have been reported in a host of pathological conditions including cardiovascular disorders, infectious diseases, immune disor-ders, post-transplantation analysis, and cancer [1]. In cancer research, CECs have been suggested as a noninvasive biomarker for angiogenic activity, providing insight into tumor regrowth, resistance to chemotherapy, early recurrence, and metastasis during or after chemotherapy [2]. In healthy individuals, CECs are reported to be present in very low numbers: 0.01%–0.0001% of all peripheral blood mononuclear cells [3].
Flow cytometry offers the necessary collection and analysis capabilities for detection of CECs, but is subject to numerous technical challenges. In comparison to traditional hydro-dynamic focusing cytometers, the Attune® Acoustic Focusing Cytometer, with its fast acquisition times and increased precision, overcomes the technological hurdles involved in analyzing CECs.
Detecting human circulating endothelial cells using the Attune® Acoustic Focusing Cytometer
Here we present a method for detect-ing human circulating endothelial cells using the Attune® Acoustic Focusing Cytometer. The method includes a number of conventional ways to improve rare-event detec-tion: a blocking step, a viability stain (SYTOX® AADvanced™ Dead Cell Stain), and the use of a dump chan-nel to eliminate unwanted cells and decrease background fluorescence. The challenge of collecting a large enough number of events in a reason-able amount of time is met by using a collection rate of 1,000 µL/min with
the Attune® cytometer. This setting enables the collection of more than 4,000,000 live white blood cell (WBC) events in just 35 minutes; the acquisition time using a traditional hydrodynamic focusing cytometer would be 10–12 times longer, close to 6 hours. Furthermore, this method delivers additional time savings by eliminating wash steps to avoid sample loss and employing a simpler sample preparation method; details and specific panels designed for the blue/violet and blue/red Attune® cytometer configurations are outlined.
Basic protocolMaterials needed• Attune® Acoustic Focusing
Cytometer• Attune® Performance Tracking
Beads (Cat. No. 4449754)• 12 x 75 mm tubes or other flow
cytometry tubes• 50 mL conical vials• AbC™ Anti-Mouse Bead Kit (Cat. No.
A10344)• Phosphate-buffered saline (PBS)
(Cat. No. 10010-023)• Anti-coagulant coated collection
tubes with EDTA (0.5 M), sodium heparin (140 USP units/mL), or sodium citrate (3.8% w/v)
• Human peripheral blood (use within 3 hr of collection)
• High-Yield Lyse fixative-free lysing solution (HYL) (Cat. No. HYL250)
• Normal Mouse IgG (Cat. No. 10400C)
• SYTOX® AADvanced™ Dead Cell Stain Kit (Cat. No. S10274)
• Directly fluorescent dye–labeled monoclonal mouse anti-human antibodies as described in Table 1
Titrate antibodiesTitrate each fluorescent dye–labeled monoclonal mouse anti-human antibody conjugate individually, and choose the dilution that provides the maximal separation of positive cells with minimal background of the negative population to determine the optimal staining concentrations.
NOTE: As with all immunophenotyp-ing experiments, successful results depend on testing and titration of conjugated antibodies prior to prepar-ing mixed antibody cocktails. We recommend using only directly labeled or Zenon® labeled antibodies; indirect antibody staining is not compatible with this no-wash staining protocol.
Obtain and block blood samples1. Collect human peripheral blood
following institutional and regional guidelines. Collect samples in anticoagulant-containing collection devices, or add 1/10 volume of anticoagulant (0.5 M EDTA, 3.8% w/v sodium citrate, or 140 USP units/mL sodium heparin) to samples just after collection. In either case, mix well immediately upon collection.
2. Block Fc-binding receptors by adding 50 µL normal mouse IgG per milliliter of whole blood. Incubate for a minimum of 20 min.
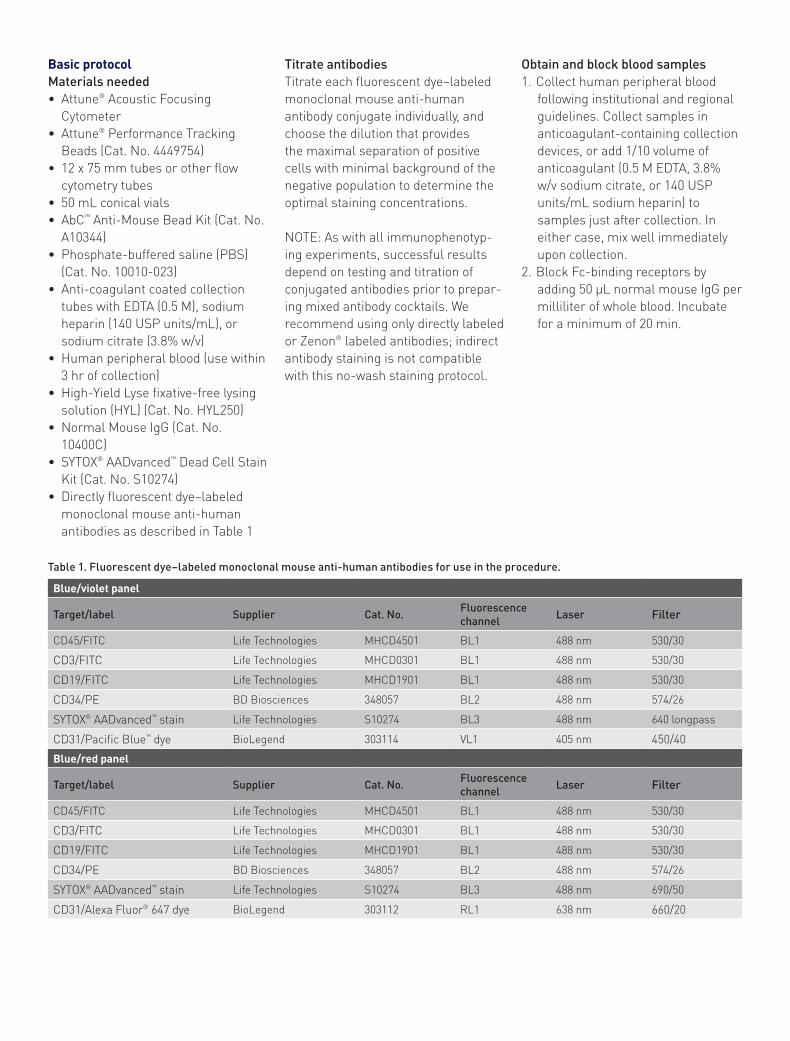
Table 1. Fluorescent dye–labeled monoclonal mouse anti-human antibodies for use in the procedure.
Blue/violet panel
Target/label Supplier Cat. No. Fluorescence channel Laser Filter
CD45/FITC Life Technologies MHCD4501 BL1 488 nm 530/30
CD3/FITC Life Technologies MHCD0301 BL1 488 nm 530/30
CD19/FITC Life Technologies MHCD1901 BL1 488 nm 530/30
CD34/PE BD Biosciences 348057 BL2 488 nm 574/26
SYTOX® AADvanced™ stain Life Technologies S10274 BL3 488 nm 640 longpass
CD31/Pacific Blue™ dye BioLegend 303114 VL1 405 nm 450/40
Blue/red panel
Target/label Supplier Cat. No. Fluorescence channel Laser Filter
CD45/FITC Life Technologies MHCD4501 BL1 488 nm 530/30
CD3/FITC Life Technologies MHCD0301 BL1 488 nm 530/30
CD19/FITC Life Technologies MHCD1901 BL1 488 nm 530/30
CD34/PE BD Biosciences 348057 BL2 488 nm 574/26
SYTOX® AADvanced™ stain Life Technologies S10274 BL3 488 nm 690/50
CD31/Alexa Fluor® 647 dye BioLegend 303112 RL1 638 nm 660/20
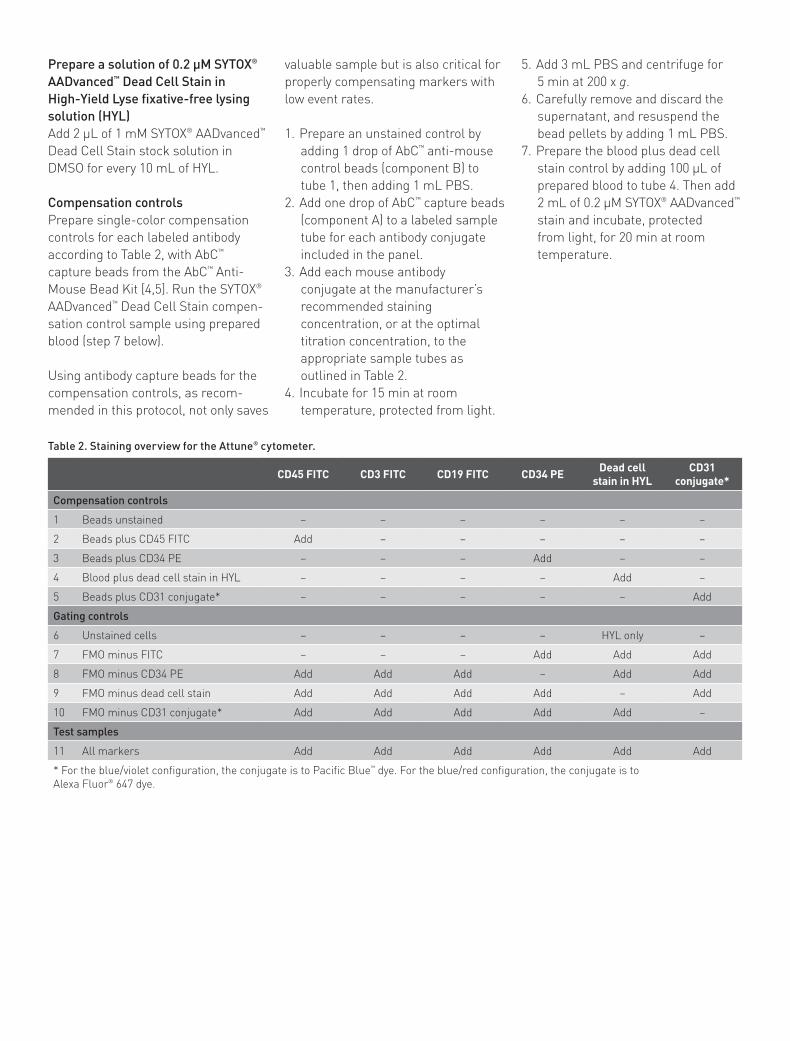
Table 2. Staining overview for the Attune® cytometer.
CD45 FITC CD3 FITC CD19 FITC CD34 PE Dead cell stain in HYL
CD31 conjugate*
Compensation controls
1 Beads unstained – – – – – –
2 Beads plus CD45 FITC Add – – – – –
3 Beads plus CD34 PE – – – Add – –
4 Blood plus dead cell stain in HYL – – – – Add –
5 Beads plus CD31 conjugate* – – – – – Add
Gating controls
6 Unstained cells – – – – HYL only –
7 FMO minus FITC – – – Add Add Add
8 FMO minus CD34 PE Add Add Add – Add Add
9 FMO minus dead cell stain Add Add Add Add – Add
10 FMO minus CD31 conjugate* Add Add Add Add Add –
Test samples
11 All markers Add Add Add Add Add Add
* For the blue/violet configuration, the conjugate is to Pacific Blue™ dye. For the blue/red configuration, the conjugate is toAlexa Fluor® 647 dye.
Prepare a solution of 0.2 µM SYTOX® AADvanced™ Dead Cell Stain in High-Yield Lyse fixative-free lysing solution (HYL)Add 2 µL of 1 mM SYTOX® AADvanced™ Dead Cell Stain stock solution in DMSO for every 10 mL of HYL.
Compensation controlsPrepare single-color compensation controls for each labeled antibody according to Table 2, with AbC™ capture beads from the AbC™ Anti-Mouse Bead Kit [4,5]. Run the SYTOX® AADvanced™ Dead Cell Stain compen-sation control sample using prepared blood (step 7 below).
Using antibody capture beads for the compensation controls, as recom-mended in this protocol, not only saves
valuable sample but is also critical for properly compensating markers with low event rates.
1. Prepare an unstained control by adding 1 drop of AbC™ anti-mouse control beads (component B) to tube 1, then adding 1 mL PBS.
2. Add one drop of AbC™ capture beads (component A) to a labeled sample tube for each antibody conjugate included in the panel.
3. Add each mouse antibody conjugate at the manufacturer’s recommended staining concentration, or at the optimal titration concentration, to the appropriate sample tubes as outlined in Table 2.
4. Incubate for 15 min at room temperature, protected from light.
5. Add 3 mL PBS and centrifuge for 5 min at 200 x g.
6. Carefully remove and discard the supernatant, and resuspend the bead pellets by adding 1 mL PBS.
7. Prepare the blood plus dead cell stain control by adding 100 µL of prepared blood to tube 4. Then add 2 mL of 0.2 µM SYTOX® AADvanced™ stain and incubate, protected from light, for 20 min at room temperature.
Staining protocol—fluorescence minus one (FMO) gating controls and test samples [6,7]1. Pipet all antibodies into each of
seven labeled 50 mL conical vials as outlined in Table 2, depending on your Attune® cytometer configuration.
2. Add 1 mL prepared blood to each vial and mix well.
3. Incubate for 20 min at room temperature (or as recommended by the manufacturer), protected from light.
4. Add 20 mL HYL (without dead cell stain) to tube 6, the unstained cell control.
5. Add 20 mL of 0.2 µM SYTOX® AADvanced™ Stain in HYL to each remaining tube and incubate all tubes for 20 min at room temperature, protected from light.
6. Place samples on ice.
Data collectionGet started1. Verify instrument performance with
the Attune® Performance Tracking Beads.
2. Create a new experiment using the instrument settings optimized for HYL staining.
Perform compensation setup1. In the experiment browser, right-
click “Compensation” and select “Compensation Setup”.
2. In the Compensation Setup dialog box, select to Compensate on “Height” and select the parameters required for your panel: BL1, BL2, BL3, and VL1 for the blue/violet configuration; or BL1, BL2, BL3, and RL1 for the blue/red configuration. Deselect any unused parameters so that only the channels of interest are recorded.
—Pulse height is used for both scatter and fluorescence signals because it provides lower measurement standard deviations than pulse area.
NOTE: For this application, pulse height will provide better scatter and fluorescence precision than pulse area. Unused parameters should be deselected because the Attune® software limits acquisition to 500,000 events if more than 10 parameters are recorded. When 10 parameters or fewer are selected, the limit is 2 million events, although this can be increased to 20 million by appending files together. —Match one single-color compensation control sample to each parameter selected.
3. Click “OK” to create the compensation control samples.
Optimize cytometer settings 1. Create the workspace for your
specimen by double-clicking on the first sample for the specimen in the experiment browser. Alternatively, the workspace may be made by double-clicking on the “Workspace” option in the experiment explorer.
2. Create a bivariate plot of forward scatter (FSC) vs. side scatter (SSC).
3. Run the unstained cells without recording the data and optimize FSC vs. SSC voltages so that all the cells are on-scale and the typical populations of lymphocytes, monocytes, and granulocytes can be distinguished. Use the standard collection rate of 1,000 μL/min. Alternatively, you may use a slower collection rate of 200 μL/min for the initial phases of determining the optimal voltages because this will provide more time to observe changes while adjusting thresholds and PMT voltages. However, it is best to use a 1,000 μL/min flow rate to fine-tune final adjustments and for acquisition of controls and test samples.
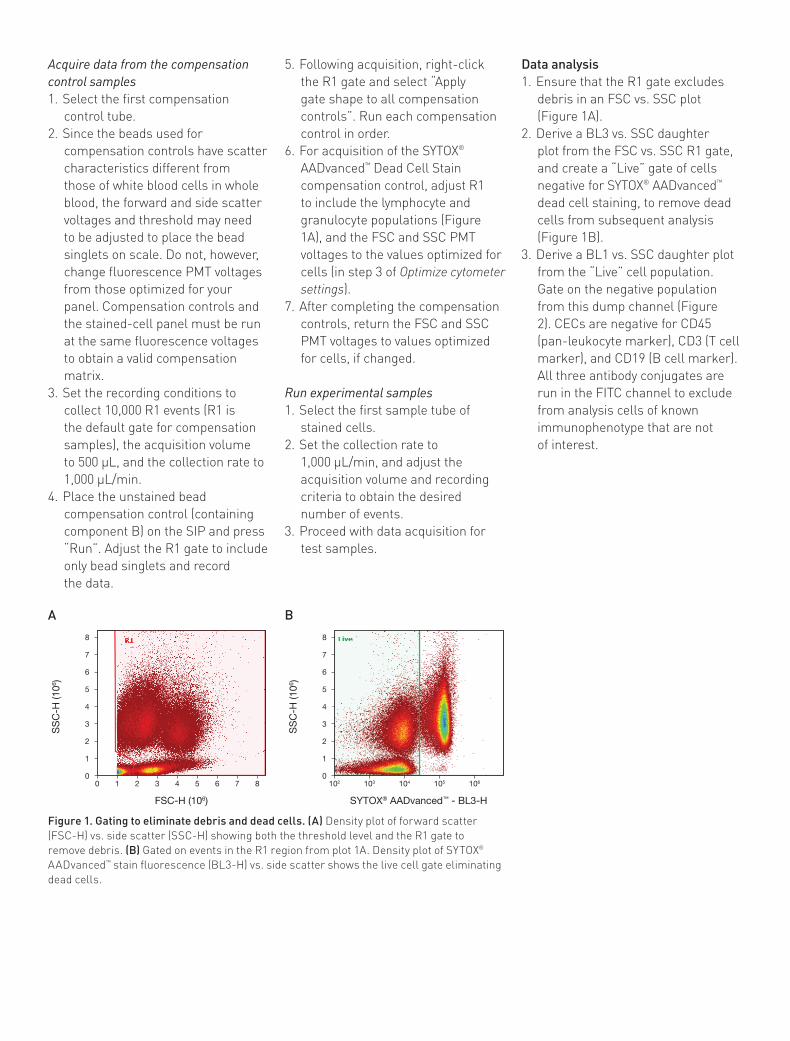
4. Place a polygon gate around the events in the FSC vs. SSC plot to eliminate the debris (Figure 1A).
5. Optimize the FSC threshold to include all events within the
lymphocyte and granulocyte populations.
6. Optimize remaining fluorescence PMT voltage levels by running each of the single-color bead control tubes without recording data. Adjust fluorescence PMT voltages so that cell autofluorescence is well above system noise by placing the autofluorescence around a median fluorescence of 103. Next, verify that all stained beads for each of the labeled antibodies remain on-scale. Where events become off-scale, you should lower PMT voltages or reconsider what dyes are being used for your targets. In multicolor staining, use the brightest dyes (e.g., PE) for the lowest-expressing targets. Save the optimized settings and use these to create an experimental template to simplify instrument setup when running your study samples. NOTE: It is best to optimize instrument PMT voltages and threshold values during antibody titration and panel development experiments. As you determine optimal instruments settings, save them in a “.gis” instrument settings file named for your panel. This settings file can then be loaded as your default instrument settings when creating new experiments, and should require, at most, minimal adjustment. You will save valuable time and sample when running your panel by simply loading your predefined instrument settings at the start of your experiment.
Acquire data from the compensation control samples1. Select the first compensation
control tube.2. Since the beads used for
compensation controls have scatter characteristics different from those of white blood cells in whole blood, the forward and side scatter voltages and threshold may need to be adjusted to place the bead singlets on scale. Do not, however, change fluorescence PMT voltages from those optimized for your panel. Compensation controls and the stained-cell panel must be run at the same fluorescence voltages to obtain a valid compensation matrix.
3. Set the recording conditions to collect 10,000 R1 events (R1 is the default gate for compensation samples), the acquisition volume to 500 µL, and the collection rate to 1,000 µL/min.
4. Place the unstained bead compensation control (containing component B) on the SIP and press “Run”. Adjust the R1 gate to include only bead singlets and record the data.
5. Following acquisition, right-click the R1 gate and select “Apply gate shape to all compensation controls”. Run each compensation control in order.
6. For acquisition of the SYTOX® AADvanced™ Dead Cell Stain compensation control, adjust R1 to include the lymphocyte and granulocyte populations (Figure 1A), and the FSC and SSC PMT voltages to the values optimized for cells (in step 3 of Optimize cytometer settings).
7. After completing the compensation controls, return the FSC and SSC PMT voltages to values optimized for cells, if changed.
Run experimental samples1. Select the first sample tube of
stained cells.2. Set the collection rate to
1,000 µL/min, and adjust the acquisition volume and recording criteria to obtain the desired number of events.
3. Proceed with data acquisition for test samples.
Data analysis1. Ensure that the R1 gate excludes
debris in an FSC vs. SSC plot (Figure 1A).
2. Derive a BL3 vs. SSC daughter plot from the FSC vs. SSC R1 gate, and create a “Live” gate of cells negative for SYTOX® AADvanced™ dead cell staining, to remove dead cells from subsequent analysis (Figure 1B).
3. Derive a BL1 vs. SSC daughter plot from the “Live” cell population. Gate on the negative population from this dump channel (Figure 2). CECs are negative for CD45 (pan-leukocyte marker), CD3 (T cell marker), and CD19 (B cell marker). All three antibody conjugates are run in the FITC channel to exclude from analysis cells of known immunophenotype that are not of interest.
SS
C-H
(106 )
0 1 2 3 4 5 6 7 8
1
0
2
3
4
6
7
5
8
FSC-H (106)
SS
C-H
(106 )
102 103 104 105 106
1
0
2
3
4
6
7
5
8
SYTOX® AADvanced™ - BL3-H
Figure 1. Gating to eliminate debris and dead cells. (A) Density plot of forward scatter (FSC-H) vs. side scatter (SSC-H) showing both the threshold level and the R1 gate to remove debris. (B) Gated on events in the R1 region from plot 1A. Density plot of SYTOX® AADvanced™ stain fluorescence (BL3-H) vs. side scatter shows the live cell gate eliminating dead cells.
A B
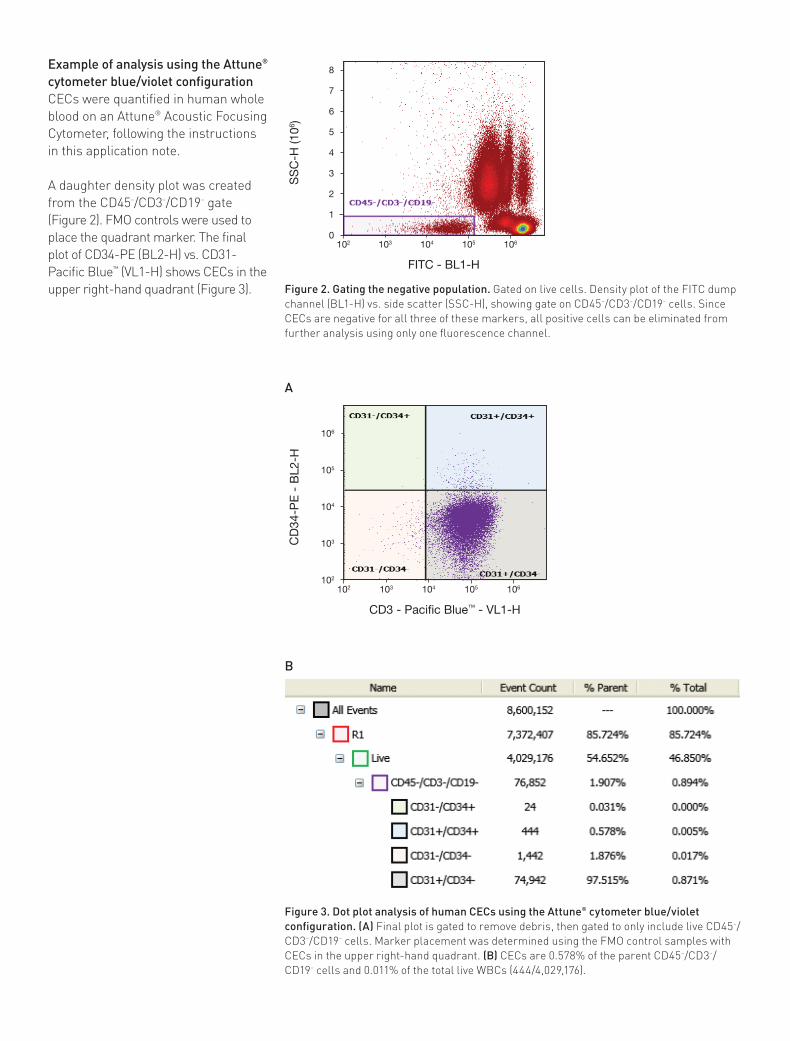
Example of analysis using the Attune® cytometer blue/violet configurationCECs were quantified in human whole blood on an Attune® Acoustic Focusing Cytometer, following the instructions in this application note.
A daughter density plot was created from the CD45–/CD3–/CD19– gate (Figure 2). FMO controls were used to place the quadrant marker. The final plot of CD34-PE (BL2-H) vs. CD31-Pacific Blue™ (VL1-H) shows CECs in the upper right-hand quadrant (Figure 3).
CD
34-P
E -
BL2
-H
102 103 104 105 106
103
102
104
105
106
CD3 - Paci�c Blue™ - VL1-H
Figure 3. Dot plot analysis of human CECs using the Attune® cytometer blue/violet configuration. (A) Final plot is gated to remove debris, then gated to only include live CD45–/CD3–/CD19– cells. Marker placement was determined using the FMO control samples with CECs in the upper right-hand quadrant. (B) CECs are 0.578% of the parent CD45–/CD3–/CD19– cells and 0.011% of the total live WBCs (444/4,029,176).
A
B
Figure 2. Gating the negative population. Gated on live cells. Density plot of the FITC dump channel (BL1-H) vs. side scatter (SSC-H), showing gate on CD45–/CD3–/CD19– cells. Since CECs are negative for all three of these markers, all positive cells can be eliminated from further analysis using only one fluorescence channel.
SS
C-H
(106 )
102 103 104 105 106
1
0
2
3
4
6
7
5
8
FITC - BL1-H
CD
34 P
E -
BL2
-H
102 103 104 105 106
103
102
104
105
106
CD31 - Alexa Fluor® 647 - RL1-H
SS
C-A
(106 )
102 103 104 105 106
1
0
2
3
4
6
7
5
8
FITC - BL1-H
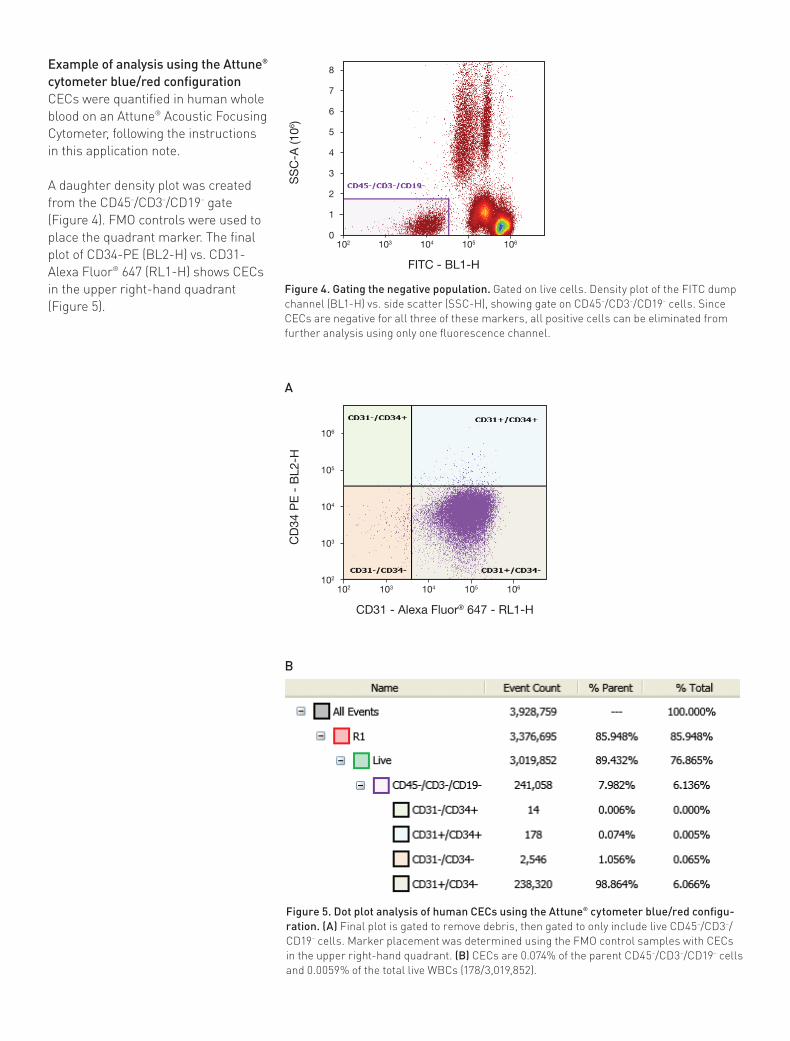
Figure 5. Dot plot analysis of human CECs using the Attune® cytometer blue/red configu-ration. (A) Final plot is gated to remove debris, then gated to only include live CD45–/CD3–/CD19– cells. Marker placement was determined using the FMO control samples with CECs in the upper right-hand quadrant. (B) CECs are 0.074% of the parent CD45–/CD3–/CD19– cells and 0.0059% of the total live WBCs (178/3,019,852).
Figure 4. Gating the negative population. Gated on live cells. Density plot of the FITC dump channel (BL1-H) vs. side scatter (SSC-H), showing gate on CD45–/CD3–/CD19– cells. Since CECs are negative for all three of these markers, all positive cells can be eliminated from further analysis using only one fluorescence channel.
A
Example of analysis using the Attune® cytometer blue/red configurationCECs were quantified in human whole blood on an Attune® Acoustic Focusing Cytometer, following the instructions in this application note.
A daughter density plot was created from the CD45–/CD3–/CD19– gate (Figure 4). FMO controls were used to place the quadrant marker. The final plot of CD34-PE (BL2-H) vs. CD31-Alexa Fluor® 647 (RL1-H) shows CECs in the upper right-hand quadrant (Figure 5).
B
lifetechnologies.com
For Research Use Only. Not intended for any animal or human therapeutic or diagnostic use.© 2012 Life Technologies Corporation. All rights reserved. The trademarks mentioned herein are the property of Life Technologies Corporation or their respective owners. Printed in the USA. CO24210 0112
References1. Widemann A et al. (2008) CD146-based immunomagnetic enrichment followed by
multiparameter flow cytometry: a new approach to counting circulating endothelial cells. J Thromb Haemost 6:869–876.
2. Roodhart JM et al. (2010) Late release of circulating endothelial cells and endothelial progenitor cells after chemotherapy predicts response and survival in cancer patients. Neoplasia 12:87–94.
3. Khan SS et al. (2005) Detection of circulating endothelial cells and endothelial progenitor cells by flow cytometry. Cytometry B Clin Cytom 64:1–8.
4. McLaughlin BE et al. (2008) Nine-color flow cytometry for accurate measurement of T cell subsets and cytokine responses. Part I: Panel design by an empiric approach. Cytometry A 73:400–410.
5. Roederer M (2001) Spectral compensation for flow cytometry: visualization artifacts, limitations, and caveats. Cytometry 45:194–205.
6. Baumgarth N, Roederer M (2000) A practical approach to multicolor flow cytometry for immunophenotyping. J Immunol Methods 243:77–97.
7. Maecker HT, Trotter J (2006) Flow cytometry controls, instrument setup, and the determination of positivity. Cytometry A 69:1037–1042.