Embed Size (px)
Citation preview
Arq Bras Oftalmol. 2008;71(5):759-63
Detecção do edema foveal diabético com biomicroscopia,angiografia fluoresceínica e tomografia de coerência óptica
Trabalho realizado no Departamento de Oftalmologia daUniversidade Federal de Goiás - UFG - Goiânia (GO) -Brasil.
1 Pós-graduanda e voluntária do CEROF da Universida-de Federal de Goiás - UFG - Goiânia (GO) - Brasil.
2 Professor Doutor e Chefe do CEROF da UFG - Goiânia(GO) - Brasil.
Endereço para correspondência: Rosana Zacarias Han-nouche. Av. T-8, 171 - Goiânia (GO) CEP 74210-270E-mail: [email protected]
Recebido para publicação em 06.10.2007Última versão recebida em 18.05.2008Aprovação em 15.08.2008
Nota Editorial: Depois de concluída a análise do artigosob sigilo editorial e com a anuência do Dr. João CarlosMiranda Gonçalves sobre a divulgação de seu nome comorevisor, agradecemos sua participação neste processo.
Rosana Zacarias Hannouche1
Marcos Pereira Ávila2
Detection of diabetic foveal edema with biomicroscopy,fluorescein angiography and optical coherencetomography
ATUALIZAÇÃO CONTINUADA
Keywords: Fovea centralis; Tomography, optical coherence/methods; Retina/pathology;Diabetic, retinopathy; Visual acuity
To describe different techniques for the detection of diabetic fovealedema. A retrospective review of the detection of diabetic foveal edema.Noncontact lens biomicroscopy is relatively insensitive in mild fovealthickening apparent on optical coherence tomography. Optical coherencetomography measurements can detect early retinal damage in diabeticretinopathy patients.
ABSTRACT
INTRODUCTION
Diabetic retinopathy remains one of the main causes of blindness evenin developed countries(1-3) and is also a common cause of visual impair-ment and legal blindness(1,4). Abnormal fluid accumulation within theretina and an increase in retinal thickness usually result from the break-down of the blood-retinal barrier(1,3).
The standard clinical method to determine the presence of diabeticmacular edema (DME) is the subjective detection of macular thickening byvarious methods, using slit-lamp fundus biomicroscopy, such as the 78-diopter noncontact or contact lens, indirect funduscopy, fluorescein angio-graphy and fundus stereophotography. However, these methods are subjec-tive and do not provide quantitative results.
Early detection of diabetic retinopathy (DR) is particularly important forpatients with diabetes mellitus (DM), because advanced DR is more re-fractory to treatment. Previous studies have shown retinal thickening due toDR and morphological changes of the retina, even in the early stages of thedisease(2).
The various methods used to evaluate macular thickening are relati-vely insensitive both to small changes in retinal thickness and in thosecases in which visual acuity has not been affected yet(5).
Optical coherence tomography (OCT) is a relatively new technique forhigh resolution cross-sectional imaging of the retina(6-7). Additionally, sinceit is a noninvasive and noncontact procedure, without any iatrogenic fea-tures, OCT has been widely employed in the diagnosis of retinal diseases(8).
With such an objective and accurate technique, it is possible to not onlydetect small changes in thickness, but also to determine the practical impli-cations in the follow-up and efficacy of this treatment in our patients(1,9).
71(5)29.pmd 3/11/2008, 09:25759
760 Detection of diabetic foveal edema with biomicroscopy, fluorescein angiography and optical coherence tomography
Arq Bras Oftalmol. 2008;71(5):759-63
Thus, the aim of this paper is to present a review of thedifferent propedeutic methods used to diagnose diabetic fo-veal edema.
DISCUSSION
Different techniques for the detection ofdiabetic foveal edema
Diabetic retinopathy is responsible for a significant de-gree of visual loss and legal blindness in diabetic patients.
The pathogenesis of diabetic macular edema has not beencompletely understood. It begins with the intracytoplasmicswelling of the Müller cells due to ischemia, thereby causinga cytotoxic edema(10). This condition progresses to a vasoge-nic edema with a subsequent release of permeable substan-ces, such as prostaglandins, and vascular endothelial growthfactor from the ischemic retina(11).
The main procedure (gold standard) to determine the pre-sence of diabetic macular edema is a subjective analysisperformed by slit-lamp fundus biomicroscopy with the 78-Dnoncontact lens(12). Although Goldmann contact lens bio-microscopy was the clinical examination technique used inthe ETDRS(13), and is considered more sensitive than 78-D fordetecting DME, examination with noncontact lens is morecommon in clinical practice. Some factors contribute to thisresult, such as the lack of observers with experience, patientcompliance, adequate pupil dilatation, opaque media and theextension of the retinal edema.
Detecting diabetic macular edema with a slit lamp is sub-jective and can be difficult in the early stages of the disease(14).
Excellent correlation was observed between OCT andslit-lamp biomicroscopy, with a 78-diopter noncontact lensexamination, for the absence or presence of foveal edema,when OCT thickness is normal (<200 µm) or moderately toseverely increased (>300 µm). It does not reflect the severityand the extent of the edema and the retinal layer involved inthe thickening(12).
Strom et al. show that there is a high level of correlationbetween fundus stereophotography and OCT, for the detec-tion and location of retinal thickening. The first has theadvantage of presenting good lateral resolution, while withOCT this is only possible through several scans. However,OCT is capable of detecting earlier signs of macular edemaand structural modification(4).
Early detection of DR and DME can substantially reducethe risk of visual impairment and blindness caused by dia-betes(14).
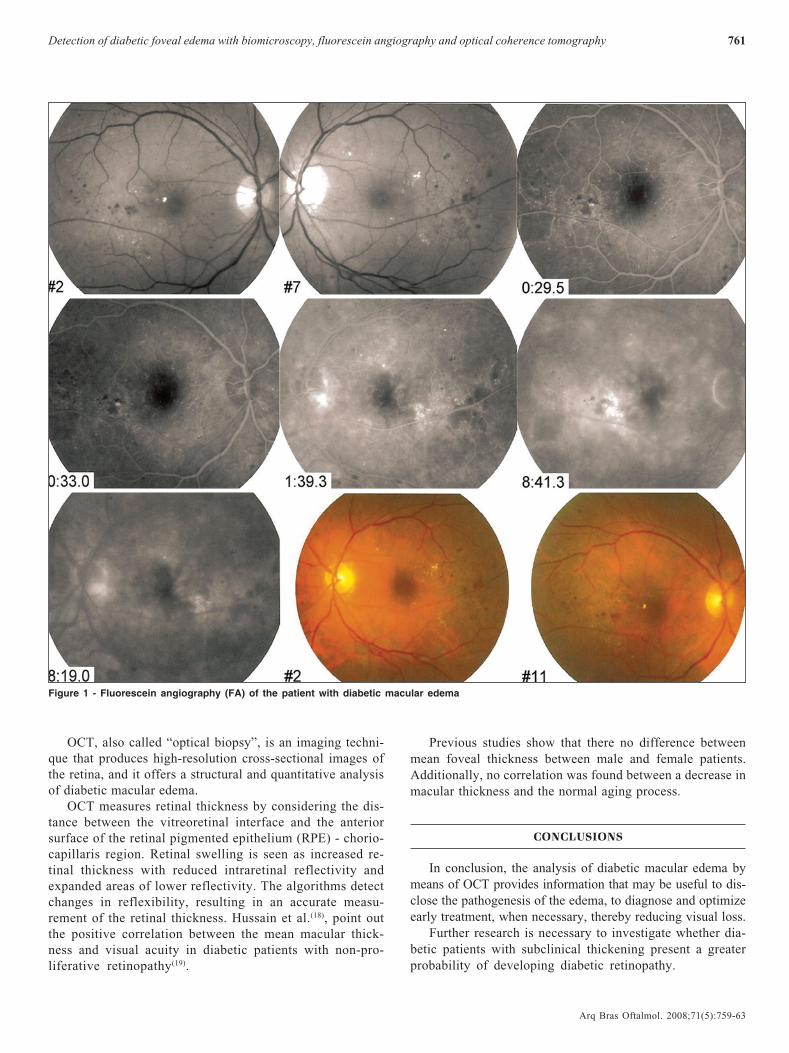
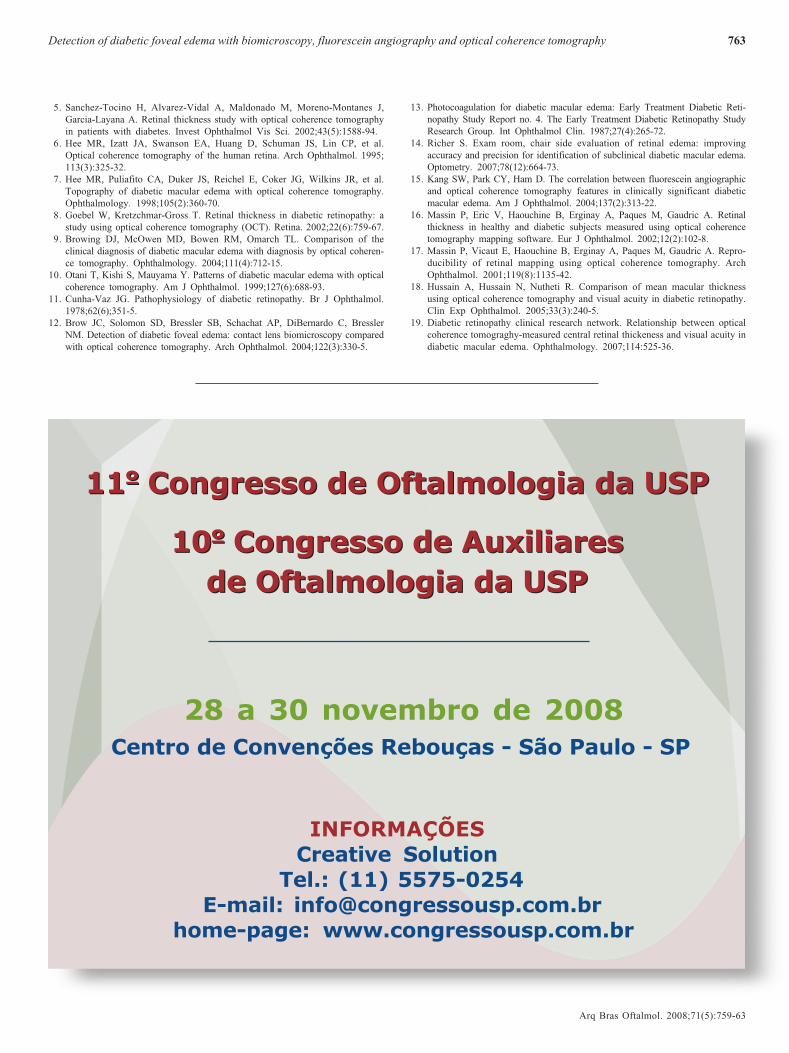
Fluorescein angiography (FA) is one of the most efficientmethods to identify areas of vascular leakage in retinal andfunctional studies. FA has been able to show early edema in21% to 42% of diabetic adults who had results that wereconsidered negative for retinopathy with other methods(14).However, there is a significant correlation between OCT andfluorescein angiography features in diabetic macular edema
(Figure 1). Nevertheless, this evaluation is qualitative andsubjective, so small changes may not be detected and correla-ted to visual acuity(15). FA is an invasive diagnostic test thatcarries a limited but real risk of an anaphylactic reaction tosodium fluorescein and FA causes discomfort and sometimesnausea or vomiting to patients undergoing the procedure(14).
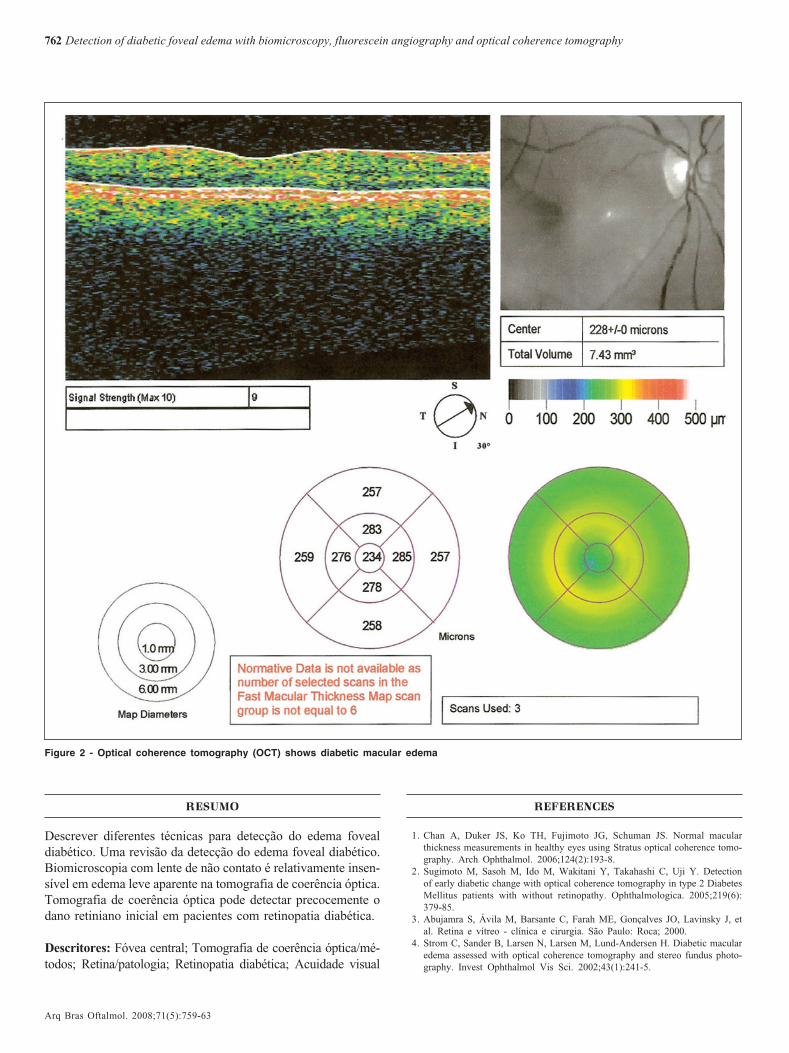
Many types of optical imaging instruments, such as theretinal thickness analyzer (RTA) and optical coherence to-mography (OCT), have been used to detect early diabeticdamage(16-17). Several studies have shown that OCT and theretinal thickness analyzer can quantify the retinal edema inthese cases with greater accuracy(2). OCT is more sensitive tosmall changes in retinal thickness than slit-lamp biomicros-copy(5). OCT-3, which became commercially available in2002, offers increased imaging speed and better axial (<10 µm)view, when compared to previous versions of the instrument.It should also be noticed that a shorter scanning time and theconsequent absence of movement by the patient, in additionto more refined algorithms, result in better image quality, inspite of being a high-cost procedure.
The images are obtained via six radial scans, centered onthe fovea. The cross-sectional images were analyzed with theOCT-3 software, with the strongest borders of each tomo-graphy and supposing they were located on the internal vi-treous-retinal face and on the external face of the retinalpigmented epithelium-choriocapillaris zone.
The thickness is measured between the two faces. Thefoveal thickness is usually defined as the mean thickness atthe 1000 µm diameter in the ETDRS layout, while the centralfoveal thickness is defined at the point of intersection of thesix radial scans. This analysis protocol operates with sixradial line scans or four macular thickness scans. The algo-rithm calculates, separately, the retinal thickness and combi-nes the results in order to build the circular maps. Two mapsare included in the analysis results.
One of them presents the retinal thickness through a colorscale, and the other shows the thickening in each area, inmicrometers (μm). Each map consists of three concentric cir-cles, and the two external ones are divided into sectors.
Numerical information is also obtained, and includes thecenter, which represents the average thickness (μm), the stan-dard deviation for the central point and the total volume ofthe retinal map, in millimeters (mm). The map with pseudo-colors presents an intuitive and efficient method to comparethe retinal thickness with the observation made with slit-lamp fundus biomicroscopy (Figure 2).
For the analysis of each eye, six consecutive OCT scansare usually made, with equal angular spacing and a radial pat-tern centered on the fovea. Each one of the six tomographiesis oriented along the line that crosses the central fovea andcontains 100 equally spaced axial profiles (A-scan).
Therefore, measurements of retinal thickness were madeon a total of 600 points along these six intersected lines, andsix lines were located through the central fovea. Each of theA-scans was run at 70 μm from the nearest one.
71(5)29.pmd 3/11/2008, 09:25760
761Detection of diabetic foveal edema with biomicroscopy, fluorescein angiography and optical coherence tomography
Arq Bras Oftalmol. 2008;71(5):759-63
OCT, also called “optical biopsy”, is an imaging techni-que that produces high-resolution cross-sectional images ofthe retina, and it offers a structural and quantitative analysisof diabetic macular edema.
OCT measures retinal thickness by considering the dis-tance between the vitreoretinal interface and the anteriorsurface of the retinal pigmented epithelium (RPE) - chorio-capillaris region. Retinal swelling is seen as increased re-tinal thickness with reduced intraretinal reflectivity andexpanded areas of lower reflectivity. The algorithms detectchanges in reflexibility, resulting in an accurate measu-rement of the retinal thickness. Hussain et al.(18), point outthe positive correlation between the mean macular thick-ness and visual acuity in diabetic patients with non-pro-liferative retinopathy(19).
Previous studies show that there no difference betweenmean foveal thickness between male and female patients.Additionally, no correlation was found between a decrease inmacular thickness and the normal aging process.
CONCLUSIONS
In conclusion, the analysis of diabetic macular edema bymeans of OCT provides information that may be useful to dis-close the pathogenesis of the edema, to diagnose and optimizeearly treatment, when necessary, thereby reducing visual loss.
Further research is necessary to investigate whether dia-betic patients with subclinical thickening present a greaterprobability of developing diabetic retinopathy.
Figure 1 - Fluorescein angiography (FA) of the patient with diabetic macular edema
71(5)29.pmd 3/11/2008, 09:25761
762 Detection of diabetic foveal edema with biomicroscopy, fluorescein angiography and optical coherence tomography
Arq Bras Oftalmol. 2008;71(5):759-63
RESUMO
Descrever diferentes técnicas para detecção do edema fovealdiabético. Uma revisão da detecção do edema foveal diabético.Biomicroscopia com lente de não contato é relativamente insen-sível em edema leve aparente na tomografia de coerência óptica.Tomografia de coerência óptica pode detectar precocemente odano retiniano inicial em pacientes com retinopatia diabética.
Descritores: Fóvea central; Tomografia de coerência óptica/mé-todos; Retina/patologia; Retinopatia diabética; Acuidade visual
REFERENCES
1. Chan A, Duker JS, Ko TH, Fujimoto JG, Schuman JS. Normal macularthickness measurements in healthy eyes using Stratus optical coherence tomo-graphy. Arch Ophthalmol. 2006;124(2):193-8.
2. Sugimoto M, Sasoh M, Ido M, Wakitani Y, Takahashi C, Uji Y. Detectionof early diabetic change with optical coherence tomography in type 2 DiabetesMellitus patients with without retinopathy. Ophthalmologica. 2005;219(6):379-85.
3. Abujamra S, Ávila M, Barsante C, Farah ME, Gonçalves JO, Lavinsky J, etal. Retina e vítreo - clínica e cirurgia. São Paulo: Roca; 2000.
4. Strom C, Sander B, Larsen N, Larsen M, Lund-Andersen H. Diabetic macularedema assessed with optical coherence tomography and stereo fundus photo-graphy. Invest Ophthalmol Vis Sci. 2002;43(1):241-5.
Figure 2 - Optical coherence tomography (OCT) shows diabetic macular edema
71(5)29.pmd 3/11/2008, 09:25762
763Detection of diabetic foveal edema with biomicroscopy, fluorescein angiography and optical coherence tomography
Arq Bras Oftalmol. 2008;71(5):759-63
5. Sanchez-Tocino H, Alvarez-Vidal A, Maldonado M, Moreno-Montanes J,Garcia-Layana A. Retinal thickness study with optical coherence tomographyin patients with diabetes. Invest Ophthalmol Vis Sci. 2002;43(5):1588-94.
6. Hee MR, Izatt JA, Swanson EA, Huang D, Schuman JS, Lin CP, et al.Optical coherence tomography of the human retina. Arch Ophthalmol. 1995;113(3):325-32.
7. Hee MR, Puliafito CA, Duker JS, Reichel E, Coker JG, Wilkins JR, et al.Topography of diabetic macular edema with optical coherence tomography.Ophthalmology. 1998;105(2):360-70.
8. Goebel W, Kretzchmar-Gross T. Retinal thickness in diabetic retinopathy: astudy using optical coherence tomography (OCT). Retina. 2002;22(6):759-67.
9. Browing DJ, McOwen MD, Bowen RM, Omarch TL. Comparison of theclinical diagnosis of diabetic macular edema with diagnosis by optical coheren-ce tomography. Ophthalmology. 2004;111(4):712-15.
10. Otani T, Kishi S, Mauyama Y. Patterns of diabetic macular edema with opticalcoherence tomography. Am J Ophthalmol. 1999;127(6):688-93.
11. Cunha-Vaz JG. Pathophysiology of diabetic retinopathy. Br J Ophthalmol.1978;62(6);351-5.
12. Brow JC, Solomon SD, Bressler SB, Schachat AP, DiBernardo C, BresslerNM. Detection of diabetic foveal edema: contact lens biomicroscopy comparedwith optical coherence tomography. Arch Ophthalmol. 2004;122(3):330-5.
13. Photocoagulation for diabetic macular edema: Early Treatment Diabetic Reti-nopathy Study Report no. 4. The Early Treatment Diabetic Retinopathy StudyResearch Group. Int Ophthalmol Clin. 1987;27(4):265-72.
14. Richer S. Exam room, chair side evaluation of retinal edema: improvingaccuracy and precision for identification of subclinical diabetic macular edema.Optometry. 2007;78(12):664-73.
15. Kang SW, Park CY, Ham D. The correlation between fluorescein angiographicand optical coherence tomography features in clinically significant diabeticmacular edema. Am J Ophthalmol. 2004;137(2):313-22.
16. Massin P, Eric V, Haouchine B, Erginay A, Paques M, Gaudric A. Retinalthickness in healthy and diabetic subjects measured using optical coherencetomography mapping software. Eur J Ophthalmol. 2002;12(2):102-8.
17. Massin P, Vicaut E, Haouchine B, Erginay A, Paques M, Gaudric A. Repro-ducibility of retinal mapping using optical coherence tomography. ArchOphthalmol. 2001;119(8):1135-42.
18. Hussain A, Hussain N, Nutheti R. Comparison of mean macular thicknessusing optical coherence tomography and visual acuity in diabetic retinopathy.Clin Exp Ophthalmol. 2005;33(3):240-5.
19. Diabetic retinopathy clinical research network. Relationship between opticalcoherence tomograghy-measured central retinal thickeness and visual acuity indiabetic macular edema. Ophthalmology. 2007;114:525-36.
11º Congresso de Oftalmologia da USP
10º Congresso de Auxiliaresde Oftalmologia da USP
11º Congresso de Oftalmologia da USP
10º Congresso de Auxiliaresde Oftalmologia da USP
28 a 30 novembro de 2008 Centro de Convenções Rebouças - São Paulo - SP
INFORMAÇÕESCreative Solution
Tel.: (11) 5575-0254 E-mail: [email protected]
home-page: www.congressousp.com.br
71(5)29.pmd 3/11/2008, 09:25763