Embed Size (px)
Citation preview
1
Determinants of Performance of QDII Equity Funds
Xin Rena Xu
MMSS Senior Thesis
Advisor: Professor Mark Finn
June 2016
2
Table of Contents:
Abstract .................................................................................................................3
Acknowledgements ...............................................................................................4
1 Introduction ........................................................................................................5
2 Literature ............................................................................................................5
3 Data and Methodology .......................................................................................7
Sample Selection and Data Source ................................................................7
Variable Definition and Descriptive Data .........................................................8
Correlation Analysis ...................................................................................... 13
Methodology and Model Construction ........................................................... 13
4 Empirical Results.............................................................................................. 14
Fund Performance Measure ......................................................................... 14
Explanatory Variables and Performance under Overall Sample Period ........ 15
5 Conclusion ....................................................................................................... 18
6 Limitation .......................................................................................................... 19
7 References ....................................................................................................... 21
8 Appendix .......................................................................................................... 22
3
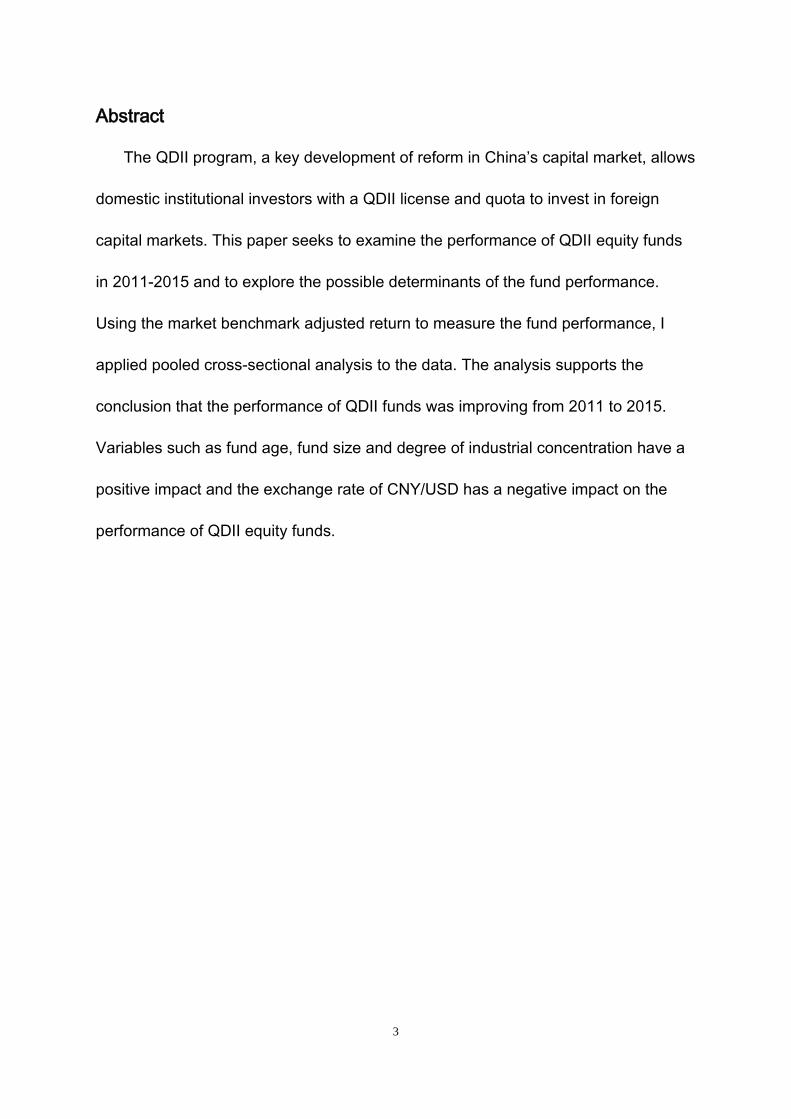
Abstract
The QDII program, a key development of reform in China’s capital market, allows
domestic institutional investors with a QDII license and quota to invest in foreign
capital markets. This paper seeks to examine the performance of QDII equity funds
in 2011-2015 and to explore the possible determinants of the fund performance.
Using the market benchmark adjusted return to measure the fund performance, I
applied pooled cross-sectional analysis to the data. The analysis supports the
conclusion that the performance of QDII funds was improving from 2011 to 2015.
Variables such as fund age, fund size and degree of industrial concentration have a
positive impact and the exchange rate of CNY/USD has a negative impact on the
performance of QDII equity funds.

4
Acknowledgements:
I would like to take this opportunity to thank the people who have made this
thesis possible. First, I would like to thank my advisor, Professor Mark Finn for his
patience and insight throughout the thesis process. I also would like to thank
Professor Joseph Ferrie for his invaluable guidance in the senior seminar. Finally, I
would like to thank my families and friends for their endless support.
5
1 Introduction
As the financial market grow dramatically, more and more investment vehicles
have come out, such as the Qualified Domestic Institutional Investor (QDII) Program.
The program is associated with Chinese capital being invested in foreign market.
China has now entered a crucial stage of capital market liberation and structural
economic transformation. In recent years, policy regarding liberating the interest rate
with the market force and reducing regulatory controls on capital accounts (PBC
2012). The QDII program is a key development of reform of China’s capital market.
This paper seeks to examine the performance of QDII equity funds and the
factors affecting the performance. The rest of the paper is organized as follows.
Section 2 discusses in detail the relevant issues related to QDII fund performance
and surveys earlier work that have covered the topic. Section 3 provides the data
and methodology for the paper, while Section 5 discusses the empirical results.
Section 6 discusses the conclusion and the limitation lies in the final section.
2 Literature
The QDII program allows domestic institutional investors with a QDII license and
quota to invest in foreign capital markets. Each QDII is approved a specific quota by
the State Administration of Foreign Exchange (SAFE) in China. Under the
background of capital account liberation, QDII program was officially launched in
April 2006, where the People’s Bank of China (PBOC) issued Circular No.5 and
6
policies allowing qualified institutions to invest offshore within approved Quota from
the State Administration of Foreign Exchange. There are four kinds of SAFE-
approved QDII institutions, banks, trust companies, security companies and
insurance companies. By May 30th, 2016, a total quota of 89.933 billion dollars have
been issued for all the approved QDII institutions to investing in overseas products
(SAFE). QDII security companies have the largest market share of all QDII
institutions because they are under a less restrictive regulation by China Securities
Regulatory Commission (KWM).
QDII funds are international portfolios managed by Chinese institution. The
international mutual funds should allow Chinese investors to further diversify their
portfolios by moving from mainland-only ones. Diversification of less correlated and
more international indices will greatly reduce the risk of the portfolio (Agati 2007).
Thus, compared to similar funds consisting of domestic underlying assets, QDII
funds should be more appealing to investors. Indeed, when the program was first
launched, Chinese investors flocked to this new type of investment. The first four
QDII funds set up in the second half of 2007 raised a sum of RMB119.4 billion and
were remarkably over-subscribed. Nevertheless, QDII funds suffered significant
losses during the 2008 financial crisis and the average net asset value of the funds
has dropped substantially and remained low in 2009-2010 (Yao and Wang 2012).
Previous studies analyze the performance and its determinants of QDII funds,
but come to different results. Huang and Wu (2012) indicate that QDII funds
investment choose to overweight in Hong Kong stocks and this local preference in
7
the asset allocation of QDII funds lowers the risk diversification effect and the return
of the funds. Yao and Wang (2012) state that the local preference in Hong Kong is
due to a lack of expertise about offshore products, which in return aggravate the
home bias behavior of QDII fund managers. Chen and Zhang (2013) find that
expense ratio is the main determinant of QDII fund performance, using DEA model.
Cao and Jin (2013) state that industrial allocation, regional allocation and exchange
rate all play a very important part in affecting the fund performance.
In this paper, I substantiate some of the findings of previous research and state
some new results. Focusing on the framework of Cao and Jin (2013), I introduce
different determinant factors using the data from Bloomberg. Since there is little
research on the performance of QDII funds from 2011-2015, this paper will be
focusing on the fund performance in this period.
3 Data and Methodology
Sample Selection and Data Source
The earliest QDII funds were introduced in September 2006 and most were
open-ended equity funds. QDII index funds, followed by bond funds, mixed funds
and alternative funds were established after 2010. From the Morningstar database,
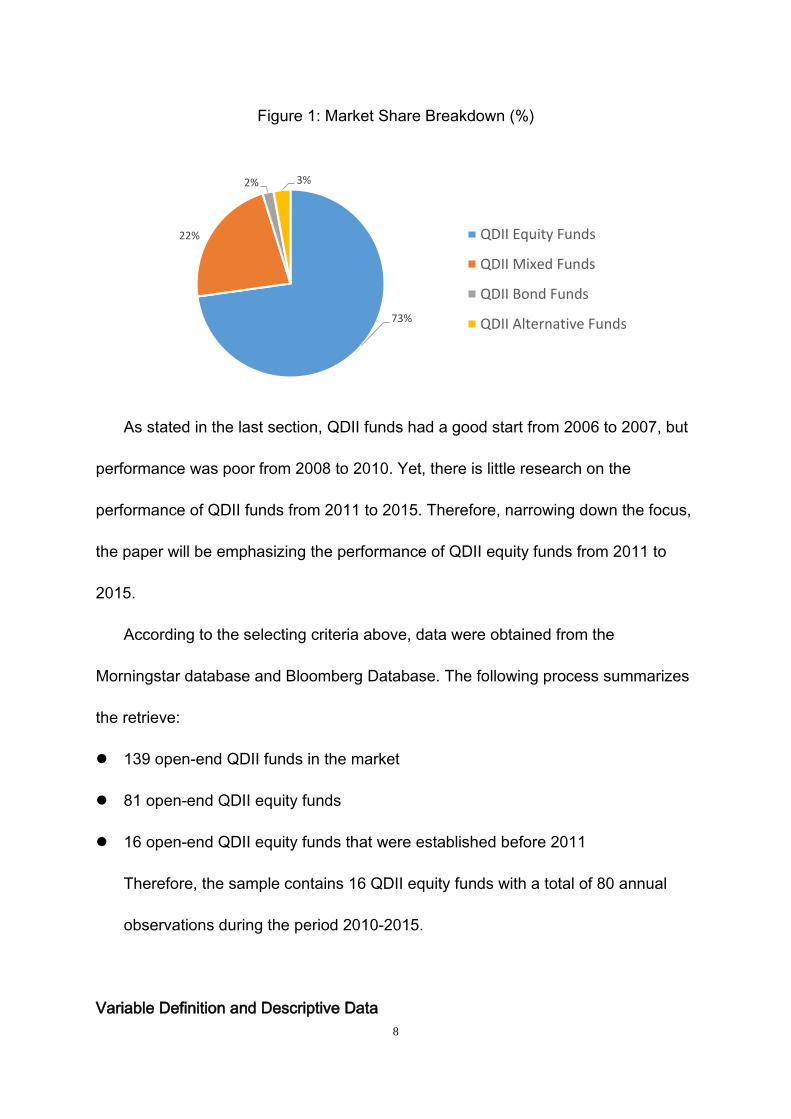
among all the 139 QDII funds, 81 are equity funds. Since equity funds take up 73%
of all QDII market, the primary focus of this paper will be on QDII equity funds.
Figure 1 describes the market share breakdown of QDII funds.
8
Figure 1: Market Share Breakdown (%)
As stated in the last section, QDII funds had a good start from 2006 to 2007, but
performance was poor from 2008 to 2010. Yet, there is little research on the
performance of QDII funds from 2011 to 2015. Therefore, narrowing down the focus,
the paper will be emphasizing the performance of QDII equity funds from 2011 to
2015.
According to the selecting criteria above, data were obtained from the
Morningstar database and Bloomberg Database. The following process summarizes
the retrieve:
139 open-end QDII funds in the market
81 open-end QDII equity funds
16 open-end QDII equity funds that were established before 2011
Therefore, the sample contains 16 QDII equity funds with a total of 80 annual
observations during the period 2010-2015.
Variable Definition and Descriptive Data
73%
22%
2% 3%
QDII Equity Funds
QDII Mixed Funds
QDII Bond Funds
QDII Alternative Funds
9
The dependent variable fund performance and the potential explanatory
variables, according to literature, are calculated in the following ways.
Dependent Variable
1. ARitm: fund performance measure
ARitm=Rit-Rmt (1)
ARitm is fund I’s market benchmark adjusted returns at period t. Since it is not
useful to compare the absolute return of different QDII equity funds, the returns
are market benchmark adjusted for a more comparable result. If the absolute
return of the fund beat that of the benchmark, it will be considered a good
performance.
Rit is fund I’s absolute return at period t
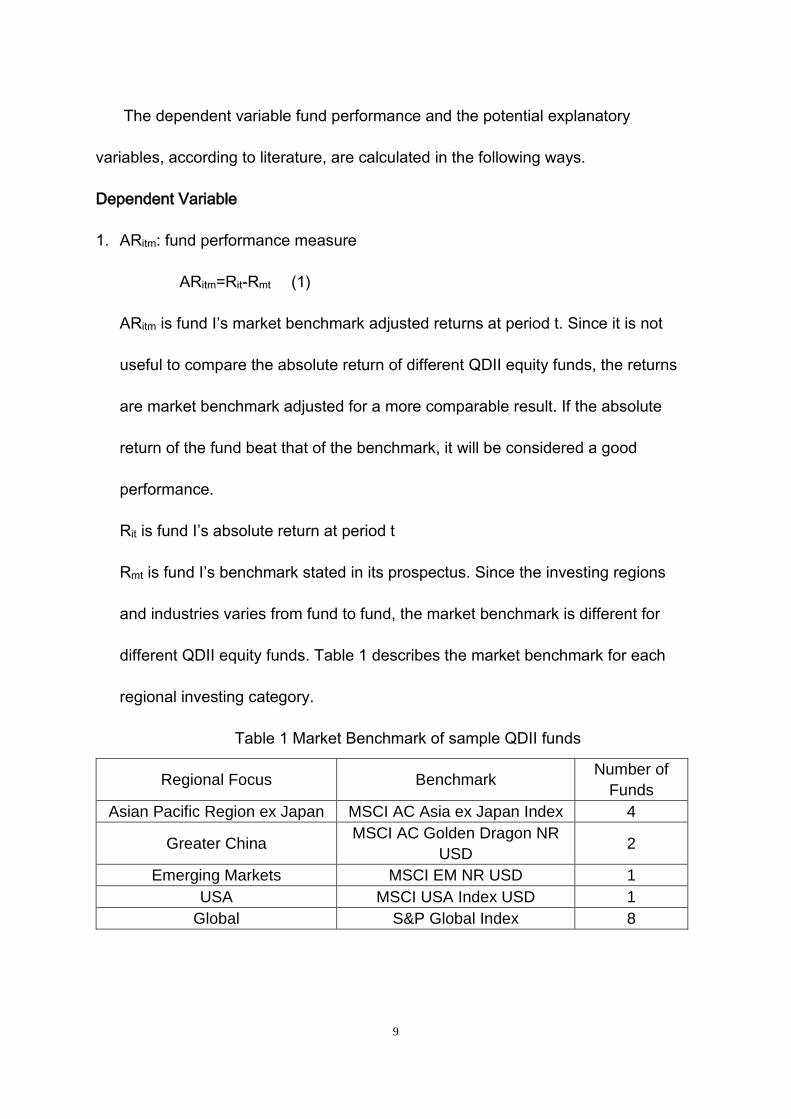
Rmt is fund I’s benchmark stated in its prospectus. Since the investing regions
and industries varies from fund to fund, the market benchmark is different for
different QDII equity funds. Table 1 describes the market benchmark for each
regional investing category.
Table 1 Market Benchmark of sample QDII funds
Regional Focus Benchmark Number of Funds
Asian Pacific Region ex Japan MSCI AC Asia ex Japan Index 4
Greater China MSCI AC Golden Dragon NR USD 2
Emerging Markets MSCI EM NR USD 1 USA MSCI USA Index USD 1
Global S&P Global Index 8
10
Explanatory Variables
2. FundSize: net asset value (NAV) for a fund at the end of time t
3. FundAge: the number of years that a fund has been founded
4. ExpenseRatio: total fund expenses as a percentage of fund average NAV. Total
fund expense include manager fee, exchange fee, interest fee and other fee.
5. IndConcn: the degree of industrial concentration of the fund.
Using the method from Cao and Jin (2013), the degree of industrial concentration
of fund can be measured by calculating the CIR ratio:
𝐼𝐼𝐼𝐼𝐼𝐼𝐼𝐼𝐼𝐼𝐼𝐼𝐼𝐼𝐼𝐼 = 𝐼𝐼𝐼𝐼𝐶𝐶𝑖𝑖𝑖𝑖 = �𝐼𝐼𝐼𝐼𝑖𝑖𝑖𝑖
𝑇𝑇𝑇𝑇𝑇𝑇𝑖𝑖
𝑖𝑖
𝑖𝑖=1
(2)
Where 𝐼𝐼𝐼𝐼𝐶𝐶𝑖𝑖𝑖𝑖 represents the proportion of investment to N industries for fund 𝑖𝑖,
𝑇𝑇𝑇𝑇𝑇𝑇𝑖𝑖 represents the total net asset value of fund 𝑖𝑖 , and 𝐼𝐼𝐼𝐼𝑖𝑖𝑖𝑖 represents the
market value of stock 𝑗𝑗 hold by fund 𝑖𝑖.
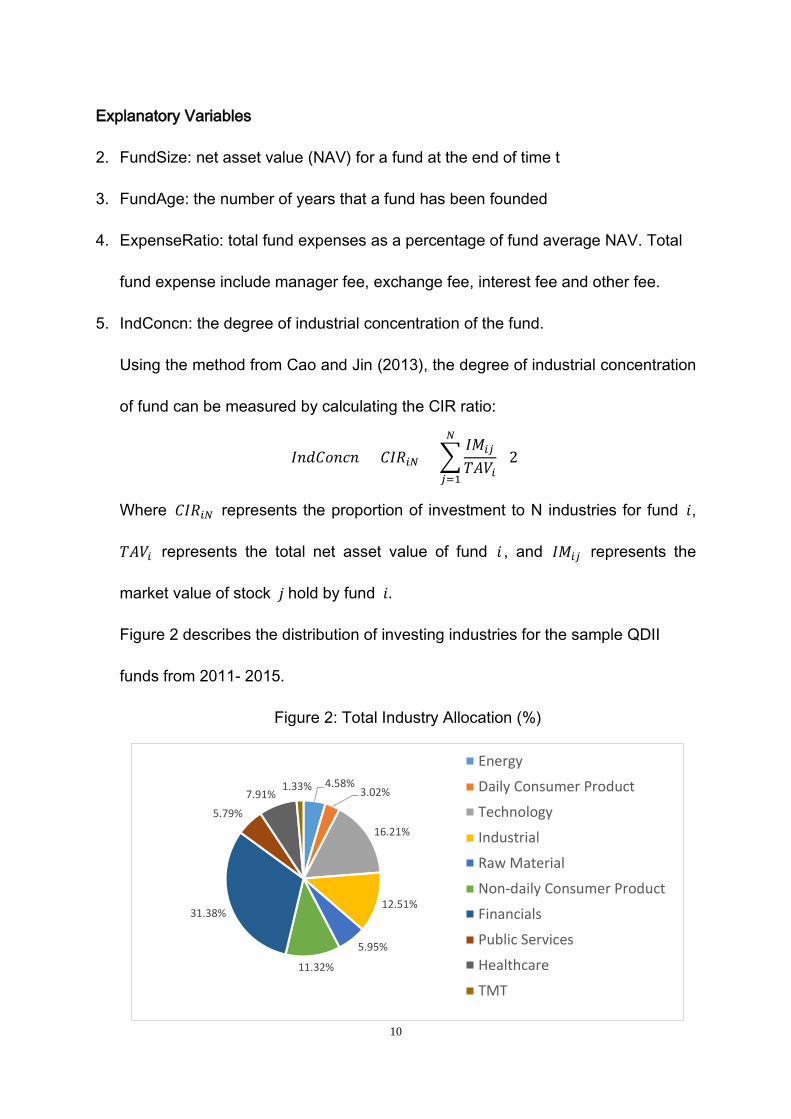
Figure 2 describes the distribution of investing industries for the sample QDII
funds from 2011- 2015.
Figure 2: Total Industry Allocation (%)
4.58%3.02%
16.21%
12.51%
5.95%
11.32%
31.38%
5.79%
7.91%1.33%
Energy
Daily Consumer Product
Technology
Industrial
Raw Material
Non-daily Consumer Product
Financials
Public Services
Healthcare
TMT
11
Figure 2 shows that the top ten investing sectors of QDII equity funds take up
almost 100% of the market shares for all investing industries. The top three
investing sectors are finance, technology and industries. The proportion of
finance is 31.38%, indicating that the fund managers are positive about the
development of the financial industry. TMT, with 1.33%, takes up the smallest
proportion among the ten industries.
6. RegConcn: the degree of regional concentration of the fund.
According to Cao and Jin (2013), the paper uses the HHI index as followed to
compute the degree of regional concentration of fund investment:
RegConcn=HHI=∑ 𝑌𝑌𝑖𝑖𝑛𝑛𝑖𝑖=1
2 (3)
Where 𝑌𝑌𝑖𝑖 represents the proportion of market value of stocks in region 𝑖𝑖 in the
total net asset value of the fund and n represents the number of regions.
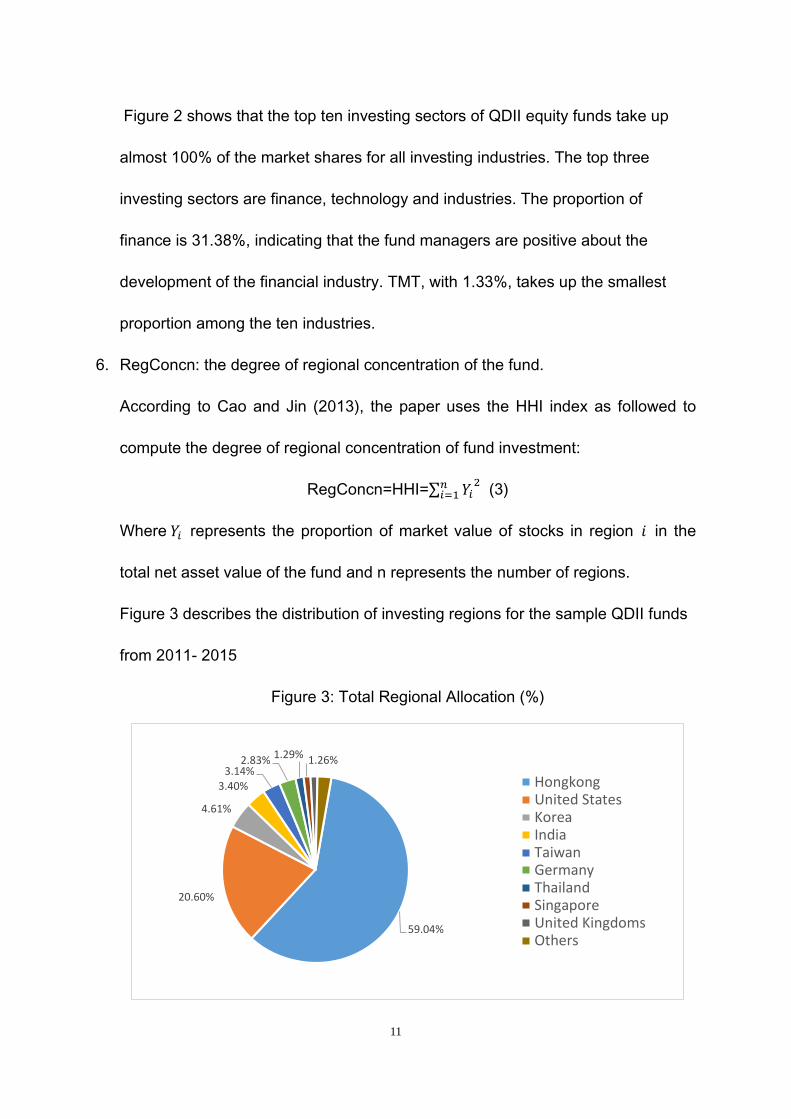
Figure 3 describes the distribution of investing regions for the sample QDII funds
from 2011- 2015
Figure 3: Total Regional Allocation (%)
59.04%
20.60%
4.61%
3.40%3.14%
2.83% 1.29% 1.26%
HongkongUnited StatesKoreaIndiaTaiwanGermanyThailandSingaporeUnited KingdomsOthers
12
The top three regions are Hong Kong, the United States and Korea. Most
countries/ areas in the figure are Asian ones, which means that the main
investing region for QDII funds is Asia-Pacific ex Japan. Among the region, Hong
Kong market is the most devoted for investment, with a market share of 59.04%.
Figure 3 shows that the regional diversification is not very high for QDII funds.
7. FX: the exchange rate of CNY/USD
The domestic investors use CNY to buy QDII funds and get the return from the
offshore market in forms of foreign currency, but the foreign currency is
eventually converted to CNY again. Thus, the exchange rate of CNY/USD
matters for the performance of QDII funds.
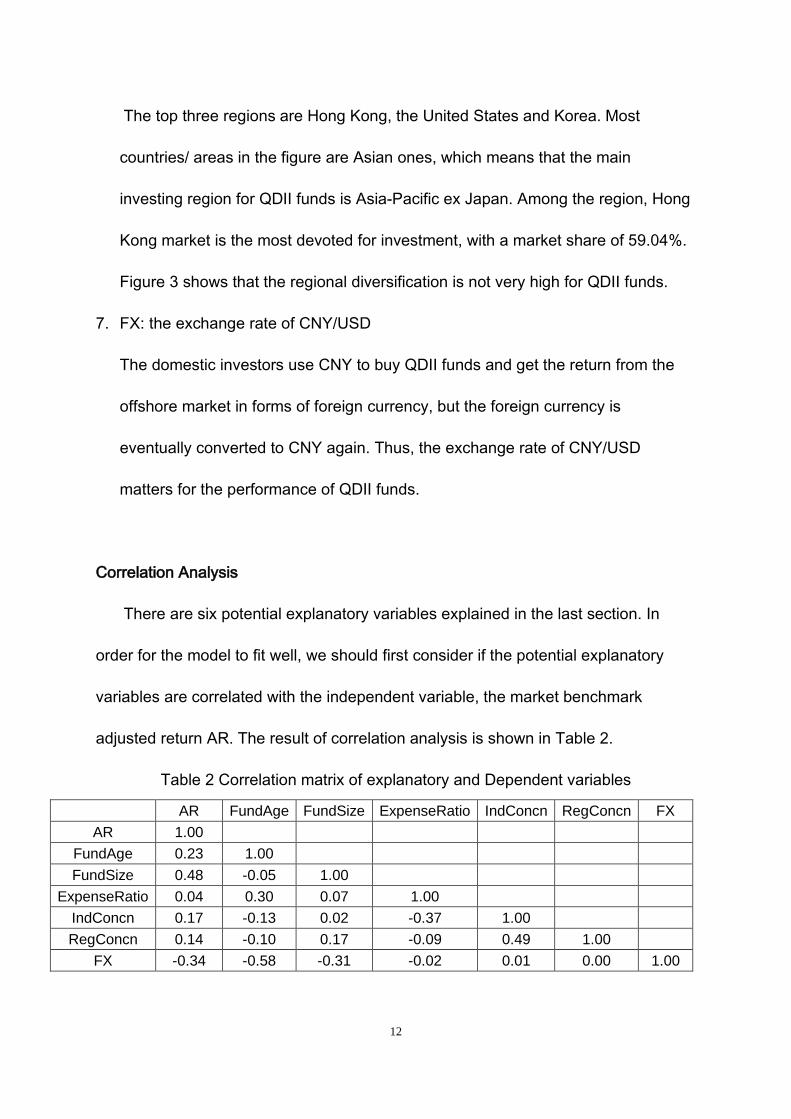
Correlation Analysis
There are six potential explanatory variables explained in the last section. In
order for the model to fit well, we should first consider if the potential explanatory
variables are correlated with the independent variable, the market benchmark
adjusted return AR. The result of correlation analysis is shown in Table 2.
Table 2 Correlation matrix of explanatory and Dependent variables
AR FundAge FundSize ExpenseRatio IndConcn RegConcn FX AR 1.00
FundAge 0.23 1.00 FundSize 0.48 -0.05 1.00
ExpenseRatio 0.04 0.30 0.07 1.00 IndConcn 0.17 -0.13 0.02 -0.37 1.00 RegConcn 0.14 -0.10 0.17 -0.09 0.49 1.00
FX -0.34 -0.58 -0.31 -0.02 0.01 0.00 1.00
13
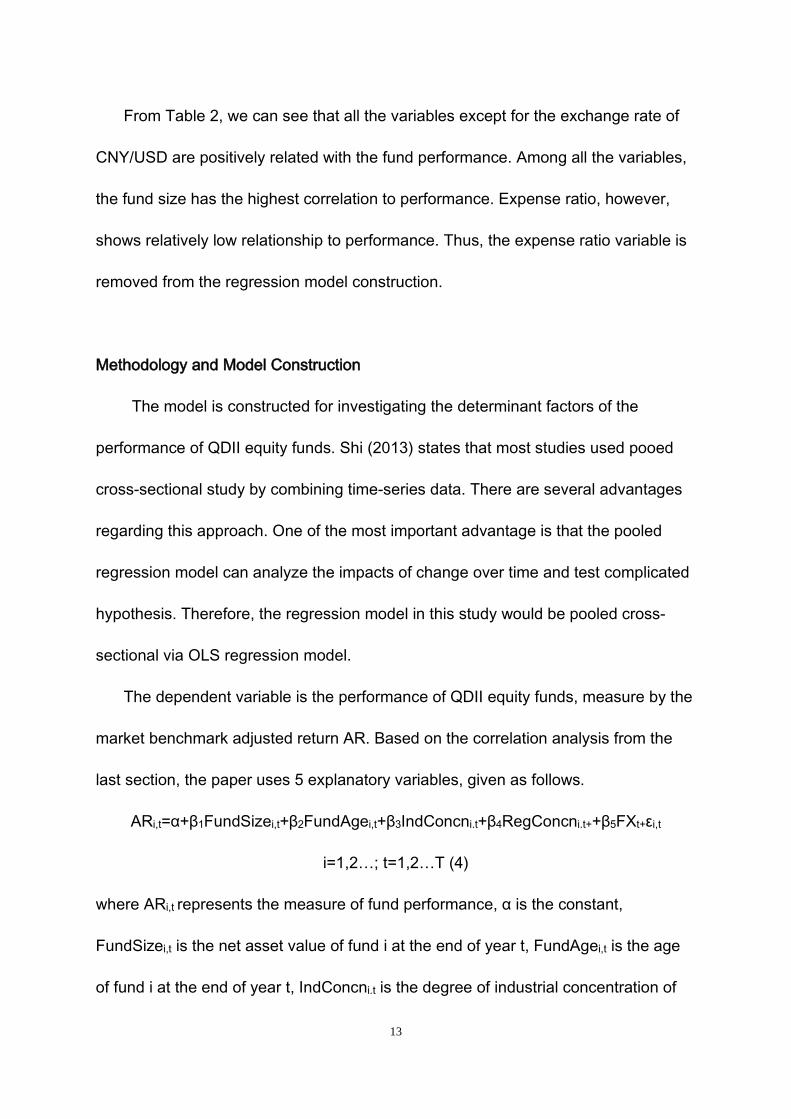
From Table 2, we can see that all the variables except for the exchange rate of
CNY/USD are positively related with the fund performance. Among all the variables,
the fund size has the highest correlation to performance. Expense ratio, however,
shows relatively low relationship to performance. Thus, the expense ratio variable is
removed from the regression model construction.
Methodology and Model Construction
The model is constructed for investigating the determinant factors of the
performance of QDII equity funds. Shi (2013) states that most studies used pooed
cross-sectional study by combining time-series data. There are several advantages
regarding this approach. One of the most important advantage is that the pooled
regression model can analyze the impacts of change over time and test complicated
hypothesis. Therefore, the regression model in this study would be pooled cross-
sectional via OLS regression model.
The dependent variable is the performance of QDII equity funds, measure by the
market benchmark adjusted return AR. Based on the correlation analysis from the
last section, the paper uses 5 explanatory variables, given as follows.
ARi,t=α+β1FundSizei,t+β2FundAgei,t+β3IndConcni.t+β4RegConcni.t++β5FXt+εi,t
i=1,2…; t=1,2…T (4)
where ARi,t represents the measure of fund performance, α is the constant,
FundSizei,t is the net asset value of fund i at the end of year t, FundAgei,t is the age
of fund i at the end of year t, IndConcni.t is the degree of industrial concentration of
14
fund i, RegConcni.t is the degree of regional concentration of fund I, FXt is the
exchange rate of CNY/USD at the end of year t and εi,t is the error term.
According to the literature review and correlation analysis, the hypothesis is that
β1, β2, β3 and β4 are positive while β5 is negative.
4 Empirical Results
Fund Performance Measure
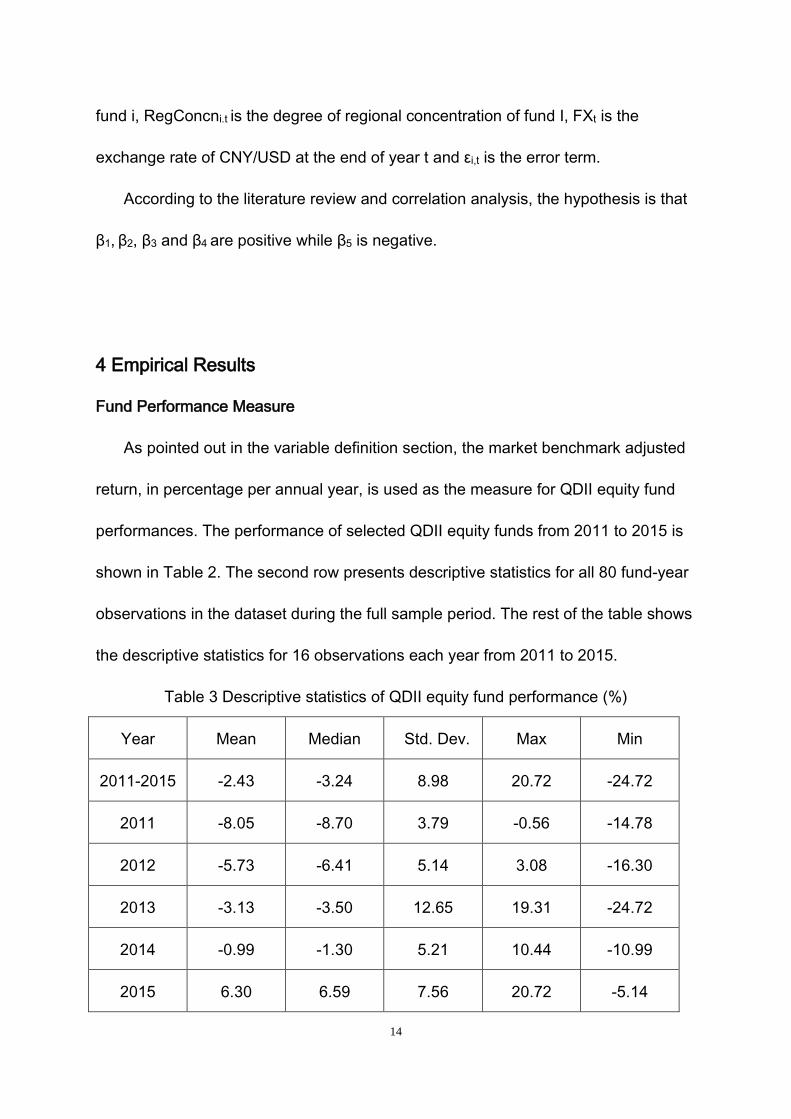
As pointed out in the variable definition section, the market benchmark adjusted
return, in percentage per annual year, is used as the measure for QDII equity fund
performances. The performance of selected QDII equity funds from 2011 to 2015 is
shown in Table 2. The second row presents descriptive statistics for all 80 fund-year
observations in the dataset during the full sample period. The rest of the table shows
the descriptive statistics for 16 observations each year from 2011 to 2015.
Table 3 Descriptive statistics of QDII equity fund performance (%)
Year Mean Median Std. Dev. Max Min
2011-2015 -2.43 -3.24 8.98 20.72 -24.72
2011 -8.05 -8.70 3.79 -0.56 -14.78
2012 -5.73 -6.41 5.14 3.08 -16.30
2013 -3.13 -3.50 12.65 19.31 -24.72
2014 -0.99 -1.30 5.21 10.44 -10.99
2015 6.30 6.59 7.56 20.72 -5.14
15
From the table, we can see that from 2001 to 2015, the majority of the funds
underperformed the market benchmark, with a mean of -2.43% and a median of
-3.24%. This is a continuation from the QDII funds’ loss in 2009 and 2010, stated in
Yao and Wang (2012).
However, examining the return of fund for each period, we realize that the
performance of QDII equity fund is improving each year from 2011 to 2015. The
performance of the funds is lowest in 2011, with a mean of -8.05% and a median of -
6.30%. Since the end of 2009, the performance of QDII funds have been strongly
impacted by the European Debt Crisis. From 2009 to 2011, the QDII funds were
continuously suffering from the negative effect of the crisis, which explains the poor
performance in 2011, mentioned by Yao and Wang (2012). Since 2012, the QDII
funds began to have better performance due to the recovery of overseas market.
Domestic investors gradually formed an optimistic view about the performance of
QDII performances, which boosted the performance as well. In 2015, both the mean
and median became positive, suggesting a big improvement in QDII funds’
performance.
Thus, although the majority of the funds underperformed the market benchmark
from the whole sample period 2011-2015, the performance of QDII equity funds
improved significantly each year.
Explanatory Variables and Performance under Overall Sample Period
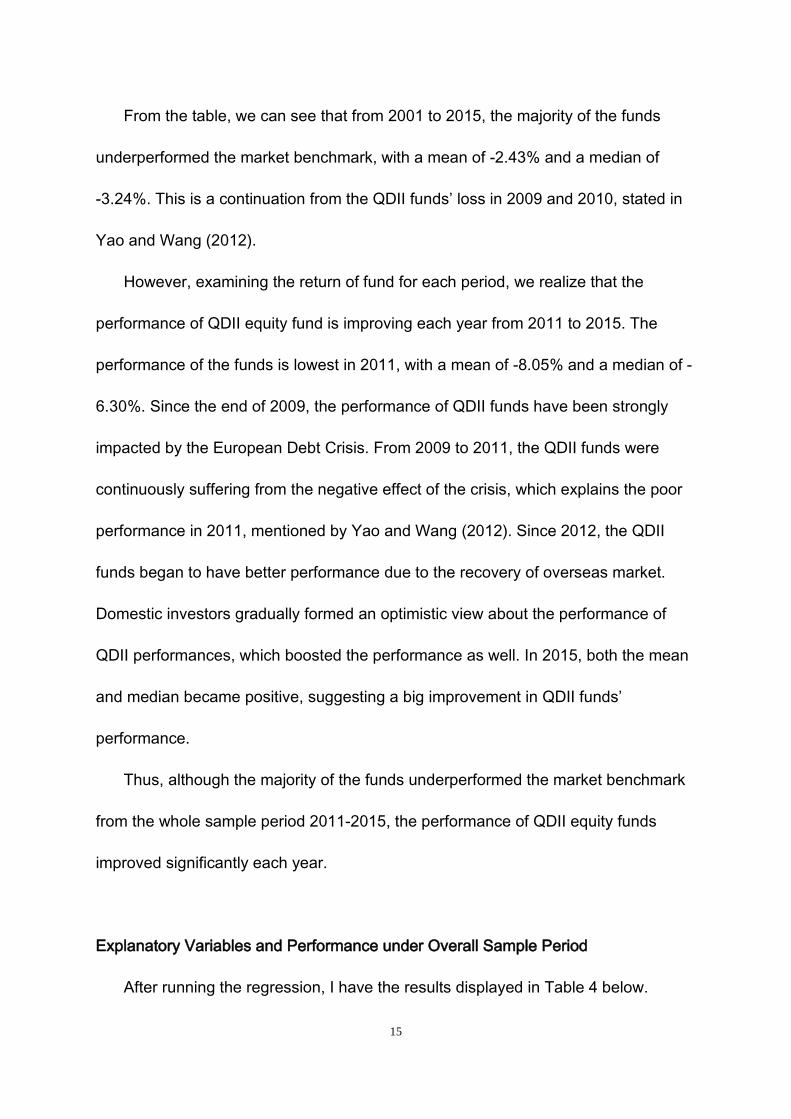
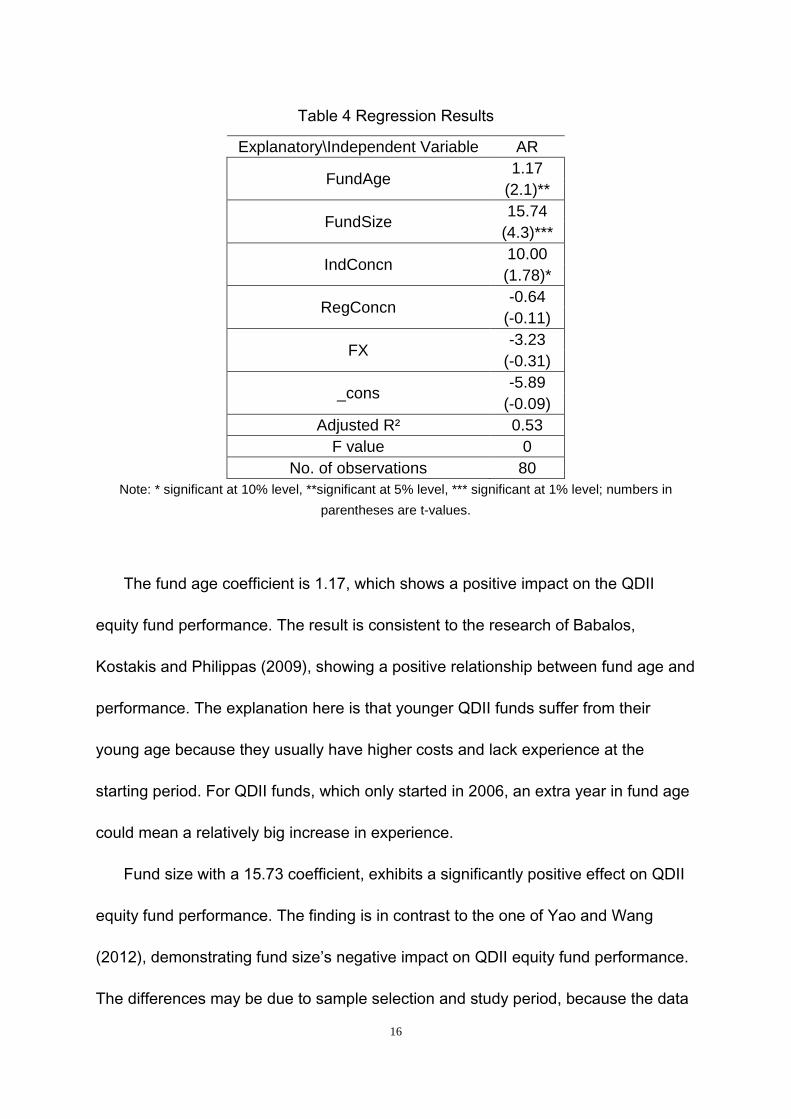
After running the regression, I have the results displayed in Table 4 below.
16
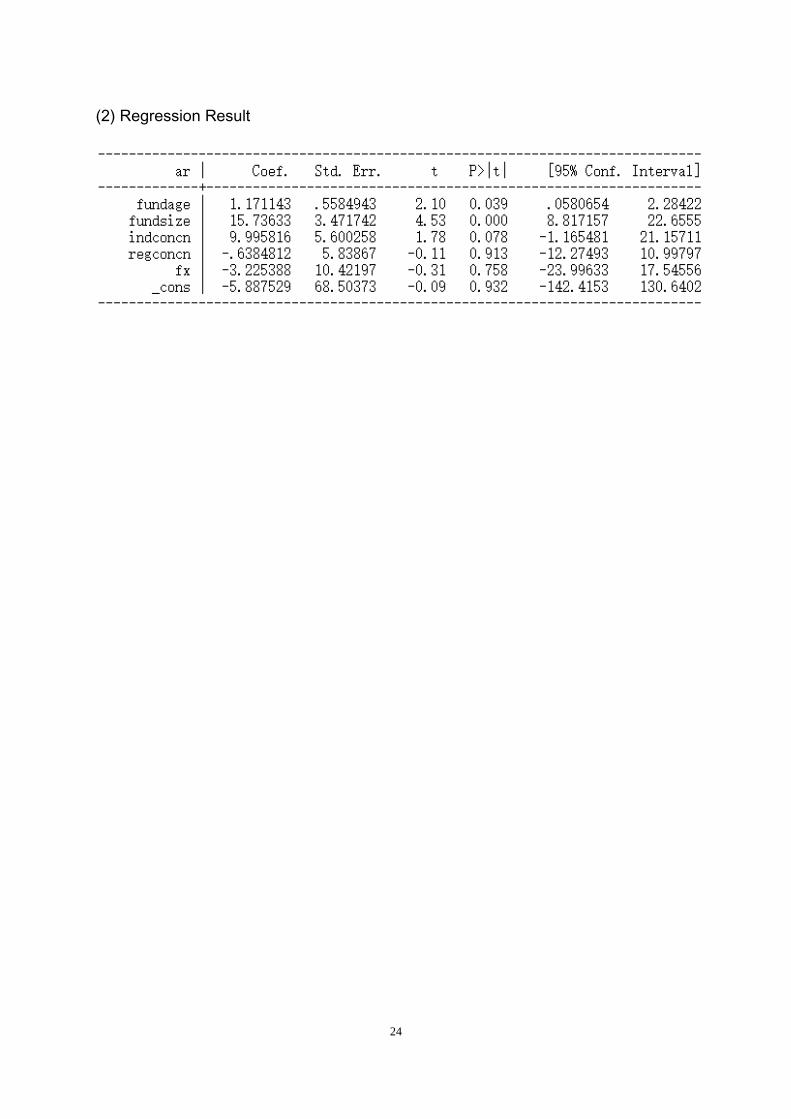
Table 4 Regression Results
Explanatory\Independent Variable AR
FundAge 1.17
(2.1)**
FundSize 15.74
(4.3)***
IndConcn 10.00 (1.78)*
RegConcn -0.64
(-0.11)
FX -3.23
(-0.31)
_cons -5.89
(-0.09) Adjusted R² 0.53
F value 0 No. of observations 80
Note: * significant at 10% level, **significant at 5% level, *** significant at 1% level; numbers in parentheses are t-values.
The fund age coefficient is 1.17, which shows a positive impact on the QDII
equity fund performance. The result is consistent to the research of Babalos,
Kostakis and Philippas (2009), showing a positive relationship between fund age and
performance. The explanation here is that younger QDII funds suffer from their
young age because they usually have higher costs and lack experience at the
starting period. For QDII funds, which only started in 2006, an extra year in fund age
could mean a relatively big increase in experience.
Fund size with a 15.73 coefficient, exhibits a significantly positive effect on QDII
equity fund performance. The finding is in contrast to the one of Yao and Wang
(2012), demonstrating fund size’s negative impact on QDII equity fund performance.
The differences may be due to sample selection and study period, because the data
17
in Yao and Wang (2012) is from 2006 to 2011, which shows a different result
compared to this paper. The possible explanation to the positive coefficient is that
larger QDII funds have more resources to support their research, which is especially
important for an international mutual fund that needs more managerial expertise.
Large QDII funds are also expected to be more cost effective, since fixed costs such
as trading and operation ones can be spread over many different fund units (Indro
2009).
The industrial concentration coefficient is 10.00, indicating a significantly positive
impact on QDII equity fund performance. The result shows that the more industrially
concentrated the investing, the better the performance, which violates the principle of
diversification. The interpretation is that managers who lack overseas investing
experience may invest in sectors that they are familiar with to help with the
performance of the fund.
The regional concentration, however, has a slight negative impact on fund
performance with a coefficient of -0.64 and a small t-value of -0.11. The
insignificance may be due to sample selection. Some funds have a higher regional
concentration which helps managers who lack overseas investing experience to
invest in familiar regions such as Hong Kong and seek for better performance. Other
may try to diversify their risks and invest in different areas. Since both ways can lead
to a good performance, the result about regional concentration is ambiguous.
The exchange rate of CNY/USD coefficient is -3.23, indicating that the exchange
rate has a negative effect on QDII equity fund performance. The result is consistent
18
with Cao and Jin (2014). The domestic investors use CNY to buy QDII funds and get
the return from the offshore market in forms of foreign currency, but the foreign
currency is eventually converted to CNY again. Since the RMB has been
continuously appreciated from 2011 to early 2015, the return of the QDII equity funds
decreases.
Therefore, fund age, fund size and degree of industrial concentration have a
positive impact on the performance of QDII equity funds while the exchange rate of
CNY/USD have a negative influence, which are consistent with our hypothesis
except for the sign of degree of regional concentration. However, the result of
regional concentration is different from our hypothesis, showing insignificant negative
impact on the performance.
5 Conclusion
The QDII program, a key development of reform of China’s capital market, allows
domestic institutional investors with a QDII license and quota to invest in foreign
capital markets. when the program was first launched, Chinese investors flocked to
this new type of investment in 2006 and 2007. Nevertheless, QDII funds suffered
significant losses during the 2008 financial crisis and the average net asset value of
the funds has dropped substantially and remained low in 2009-2010.
The topic of the thesis is about the determinants of QDII equity fund
performances. More specifically, a general and extensive analysis of 16 funds with
19
80 annual observations in 2011-2015 was applied. According to the analysis, from
2001 to 2015, the majority of the funds underperformed the market benchmark.
However, the performance of QDII equity fund is improving each year from 2011 to
2015.
For the explanatory variables, fund age, fund size and degree of industrial
concentration have a positive impact on the performance of QDII equity funds while
the exchange rate of CNY/USD have a negative influence, which are consistent with
our hypothesis except for the sign of degree of regional concentration. However, the
result of regional concentration is different from our hypothesis, showing insignificant
negative impact on the performance.
From the good start in 2006 to the low in 2009-2011 and then to the gradual
improvement in 2012-2015, the QDII program has experienced both the bull and
bear market and has found its way to a better performance in how to cope with
different market conditions.
6 Limitation
There are some limitations and concerns for the current study. First, the research
period of 5 years is relatively short and the sample selection is rather small. This is
mainly due to QDII program’s relatively short history and the small number of funds
available in the market.
Another limitation is that the majority of the data is hard to access and time-

20
consuming to collect. Thus, the effects of some explanatory variables such as the
percentage of manager ownership in the fund cannot be examined.
21
7 References Agati, Angela. The Effects of International Diversification on Portfolio Risk. Thesis.
Illinois Wesleyan University, 2007. N.p.: Honors Project, n.d. Web. 10 Apr. 2016.
Cao, Yanka, and Hui Jin. Panel Data Analysis of Performance of QDII Equity Funds
in China. Thesis. Hangzhou Dianzi Univeristy, 2014. N.p.: MPRA, n.d. Print. Chen, Weibin, and Jun Zhang. “QDII Funds Performance Analysis based on
Nonparametric Tests”. Review of Investment Studies. 5(2013). Print.
Mazzochi, Richard, Minny Siu, and Hayden Flinn. "QDII- An Offshore Perspective."
KWM Connect (n.d.): n. pag. Web. 10 Apr. 2016. PBC. "Improving the Exchange Rate Reforms and the Liberalization of the Capital
Accounts." China Securities Journal (2012): n. pag. Print. Shi, Qiqiang. Equity Mutual Fund Performance: Evidence from China. Thesis.
University of Twente, 2013. N.p.: n.p., n.d. Print. SAFE. "QDII Quota Form." State Administration of Foreign Exchange. N.p., 31 May
2016. Web. 01 June 2016. Wu, Liguang and Zhen Huang. “Internationally Diversified Capital Investment and
Home Bias”. Industrial Economic Review. 1(2012). Print
Yao, Aidan, and Honglin Wang. "What Are the Challenges and Problems Facing
China's Outward Portfolio Investment." Hong Kong Institute for Monetary Research 31 (2012): n. pag. Web. 10 Apr. 2016.
22
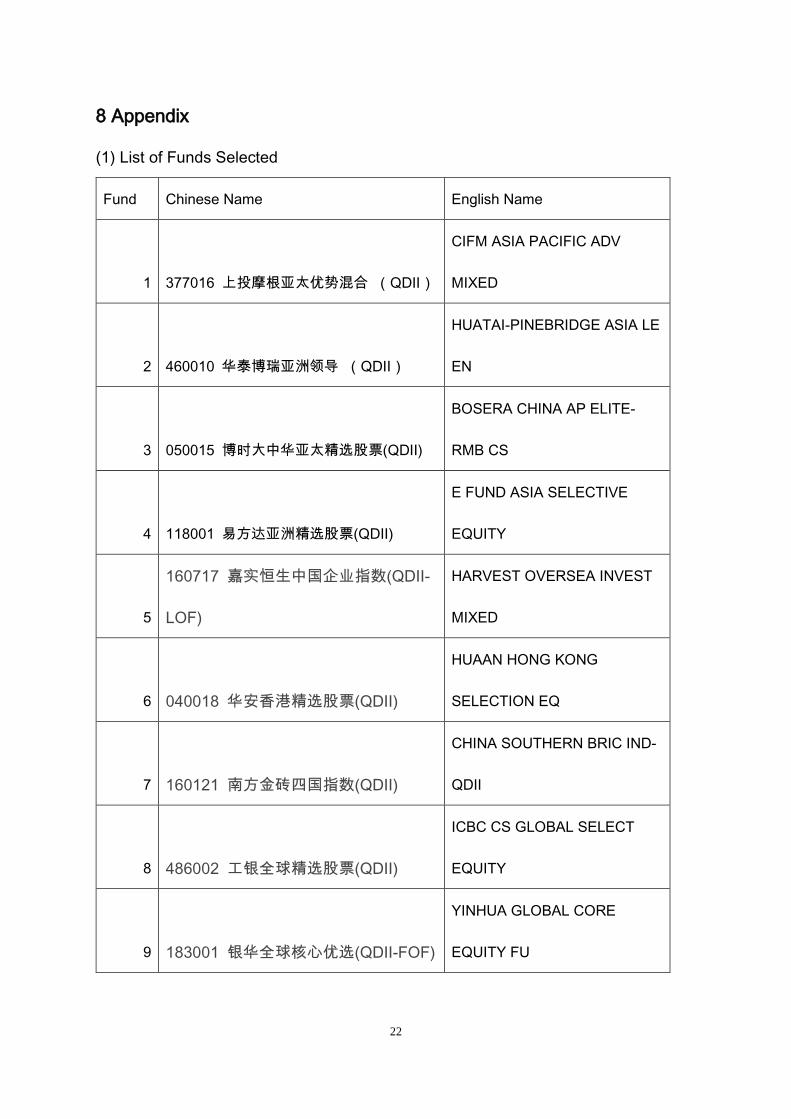
8 Appendix
(1) List of Funds Selected
Fund Chinese Name English Name
1 377016 上投摩根亚太优势混合 (QDII)
CIFM ASIA PACIFIC ADV
MIXED
2 460010 华泰博瑞亚洲领导 (QDII)
HUATAI-PINEBRIDGE ASIA LE
EN
3 050015 博时大中华亚太精选股票(QDII)
BOSERA CHINA AP ELITE-
RMB CS
4 118001 易方达亚洲精选股票(QDII)
E FUND ASIA SELECTIVE
EQUITY
5
160717 嘉实恒生中国企业指数(QDII-
LOF)
HARVEST OVERSEA INVEST
MIXED
6 040018 华安香港精选股票(QDII)
HUAAN HONG KONG
SELECTION EQ
7 160121 南方金砖四国指数(QDII)
CHINA SOUTHERN BRIC IND-
QDII
8 486002 工银全球精选股票(QDII)
ICBC CS GLOBAL SELECT
EQUITY
9 183001 银华全球核心优选(QDII-FOF)
YINHUA GLOBAL CORE
EQUITY FU
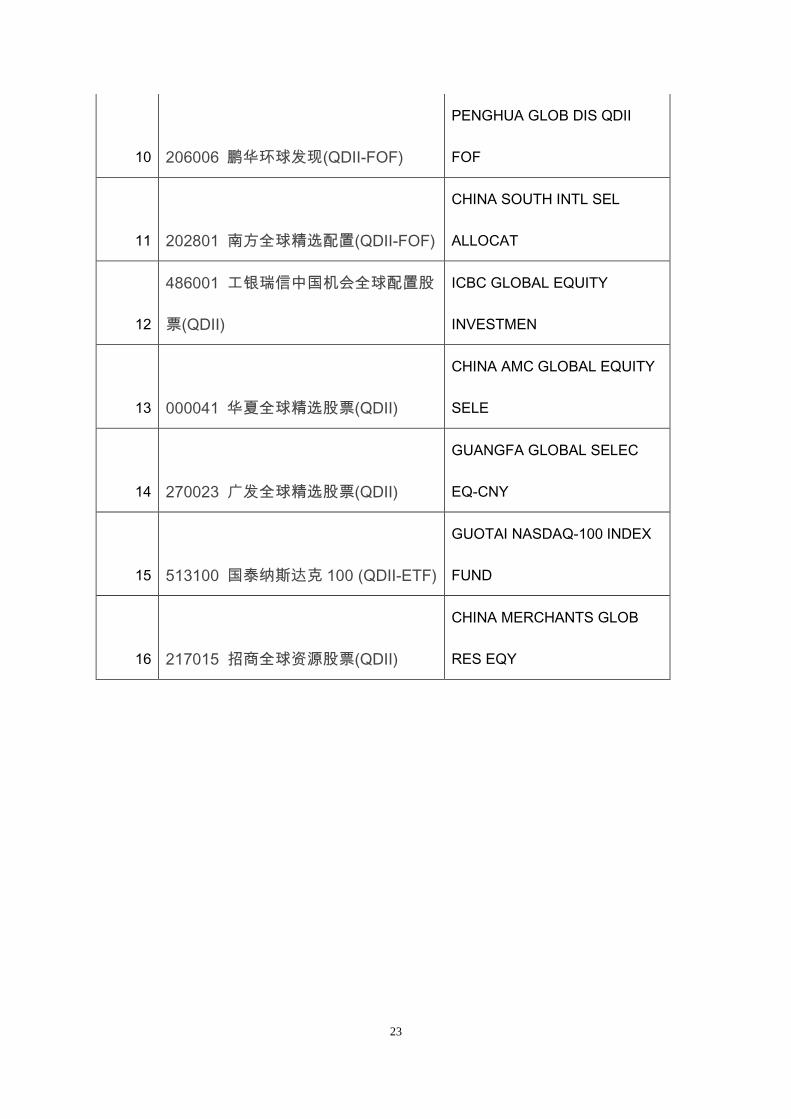
23
10 206006 鹏华环球发现(QDII-FOF)
PENGHUA GLOB DIS QDII
FOF
11 202801 南方全球精选配置(QDII-FOF)
CHINA SOUTH INTL SEL
ALLOCAT
12
486001 工银瑞信中国机会全球配置股
票(QDII)
ICBC GLOBAL EQUITY
INVESTMEN
13 000041 华夏全球精选股票(QDII)
CHINA AMC GLOBAL EQUITY
SELE
14 270023 广发全球精选股票(QDII)
GUANGFA GLOBAL SELEC
EQ-CNY
15 513100 国泰纳斯达克 100 (QDII-ETF)
GUOTAI NASDAQ-100 INDEX
FUND
16 217015 招商全球资源股票(QDII)
CHINA MERCHANTS GLOB
RES EQY
24
(2) Regression Result