Embed Size (px)
Citation preview
Determinants of Property Prices in Hong Kong SAR: Implications for Policy
R. Sean Craig and Changchun Hua
WP/11/277
© International Monetary Fund WP/11/277
IMF Working Paper
Asia and Pacific Department
Determinants of Property Prices in Hong Kong SAR: Implications for Policy
Prepared by R. Sean Craig and Changchun Hua
Authorized for distribution by Nigel Chalk
November 2011
Abstract
This paper uses an econometric model of residential property prices in Hong Kong SAR to assess the effectiveness of alternative policies in slowing the increase in property prices. The rapid rise in property prices is well explained by macroconomic fundamentals; real GDP per capital, real domestic credit, construction costs, land supply, and the real interest rate. Policy can influence the property market though land supply and prudential and tax policy, with the latter policies taking the form of a stamp duty on property transactions and a tighter loan-to-value ratio (LTV) on lending. Land supply is the most effective policy insturment for restraining property price increases but it operates with a significant lag. The LTV and stamp duty dampen speculative activity that drives up property prices. While these policies can slow the increase in the short run, they should be guided by their long run objectives of financial stability and counteracting speculation.
JEL Classification Numbers: R21, R31, R38
Keywords: Property price, Co-Integration, Land Supply, Stamp Duty, Loan-to-Value Ratio
Author’s E-Mail Address: [email protected]; [email protected]
This Working Paper should not be reported as representing the views of the IMF. The views expressed in this Working Paper are those of the author(s) and do not necessarily represent those of the IMF or IMF policy. Working Papers describe research in progress by the author(s) and are published to elicit comments and to further debate.
2
Content Page I. Introduction ................................................................................................................................. 3
II. Policies to Restrain Residential Property Prices in Hong Kong SAR ........................................ 3
III. An Econometric Model of Property Prices in Hong Kong SAR .............................................. 6
IV. Model Estimation Results ......................................................................................................... 8
V. Explaining the Rapid Rise in Property Prices .......................................................................... 11
VI. Conclusions............................................................................................................................. 11
References ..................................................................................................................................... 14
3
I. INTRODUCTION
This paper uses an econometric model of residential property prices in Hong Kong SAR to assess the effectiveness of alternative policies in curbing pressures on property prices. The fundamental drivers of the real property price are real GDP per capital, real domestic credit, construction costs, land supply, and the real interest rate. Policy can influence the property market through land supply and interest rates but also prudential and tax policy. The latter include two instruments that the authorities have recently relied on extensively: a stamp duty on property transactions; and the loan-to-value (LTV) ratio on bank lending. Since these instruments are adjusted infrequently, we supplement model estimation with an event-study of their impact on property market transactions as well as price.
A co-integration estimation methodology is used because tests show that property prices and the macroeconomic fundamentals are co-integrated. This involves a two stage process where we first estimate the long run co-integrating relationship among these variables and, second, the short run dynamic relationship using an error correction equation. In the latter equation we can include the stationary (i.e. not co-integrated) policy variables – the LTV and stamp duty – to assess their impact. The model performs well statistically in that the recent, rapid rise in property prices is well explained by highly supportive macroeconomic fundamentals and the “equilibrium” price derived from the model tracks the actual price relatively closely.
The estimation results show that real GDP per capita has the strongest long run influence on property prices followed by land supply, which works with a significant lag. The real interest rate and an index of construction costs have less strong effects while real domestic credit has the weakest impact. The LTV ratio and stamp duty both have statistically significant effects on price, although the latter is very small. These effects are temporary and, thus, can slow, but not fundamentally alter, the rising trend in property prices.
The results suggest that policy should focus on raising land supply to restrain property price increases over the long run. However, the significant lag with which it has an effect means that care is needed to avoid exacerbating the property price cycle. The real interest rate also has a long run influence on price and may rise with a tightening of liquidity conditions related to stricter macroprudential policies. The LTV and stamp duty dampen speculative activity that drives up property prices. While these policies can slow the increase in the short run, they should be guided by their long run objectives of financial stability and counteracting speculation.
II. POLICIES TO RESTRAIN RESIDENTIAL PROPERTY PRICES IN HONG KONG SAR
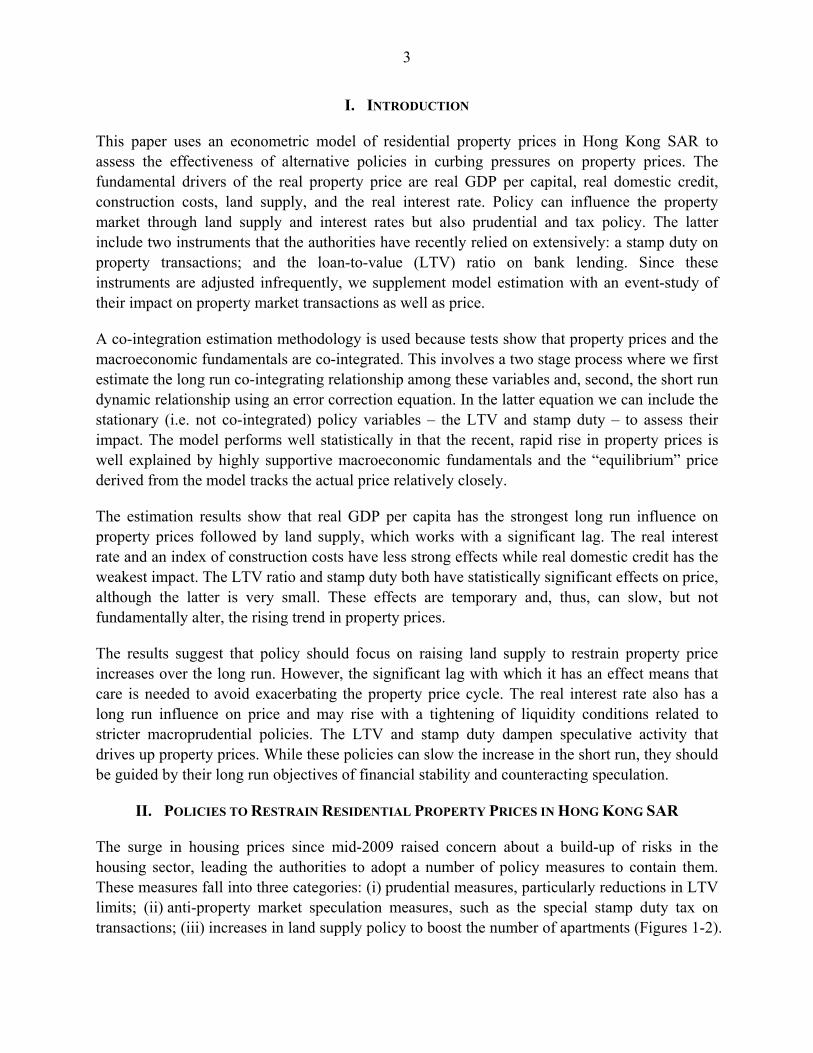
The surge in housing prices since mid-2009 raised concern about a build-up of risks in the housing sector, leading the authorities to adopt a number of policy measures to contain them. These measures fall into three categories: (i) prudential measures, particularly reductions in LTV limits; (ii) anti-property market speculation measures, such as the special stamp duty tax on transactions; (iii) increases in land supply policy to boost the number of apartments (Figures 1-2).
4
A tightening of macroprudential policies aimed at strengthening financial stability can also help contain upward pressure on property prices by raising borrowing costs.
The LTV ratio has long been the most actively used prudential tool to limit the buildup of credit risk in the property sector (Wong et al., 2011). The Hong Kong Monetary Authority (HKMA) tightened LTV ratio several times over the last few years. At present, properties valued HK$10 million or above are subject to a 50 percent LTV ratio (Figure 1). A cut in the LTV reduces the amount of credit available to borrowers with a given level of assets for a down payment, slowing mortgage lending and property purchases. LTV limits are tighter (i.e. lower) in the luxury market segment but their impact on price should spillover into the mass market segment. Over time, the effect is likely to erode, however, as borrowers accumulate more assets.
The stamp duty on residential property transactions aims to curb speculative activities in the property market. The Government introduced a special stamp duty (SSD) in November 2010 on residential properties resold within 24 months of purchases in addition to an existing stamp duty (of 4.25 percent). The SSD tax rate is 15 percent for properties resold within six months but declines in steps the longer a property is held, falling to zero after 24 months. It raises the cost of buying properties and then reselling them quickly (a practice called “flipping”), thus encouraging buyers to hold property for longer. A hike in SSD will reduce transaction volumes, although with an ambiguous effect on price. The tax-incidence impact could initially push up sales price although this effect should quickly fade as buyers hold property for longer to avoid the duty.
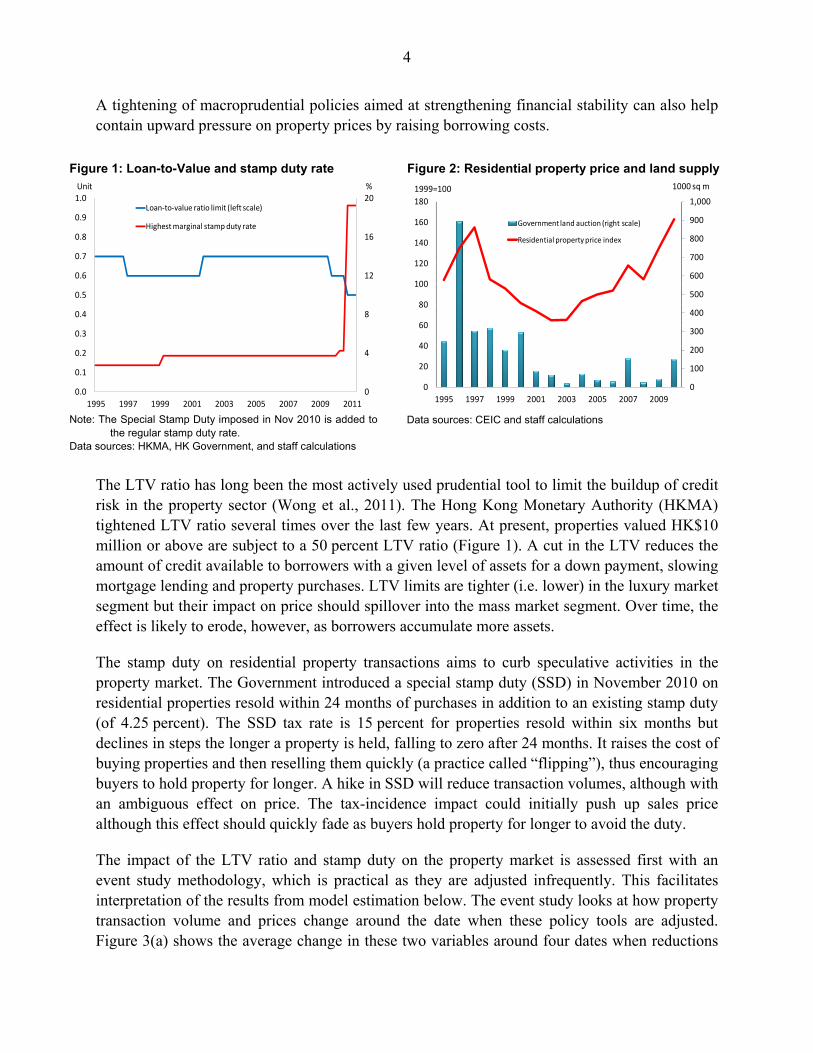
The impact of the LTV ratio and stamp duty on the property market is assessed first with an event study methodology, which is practical as they are adjusted infrequently. This facilitates interpretation of the results from model estimation below. The event study looks at how property transaction volume and prices change around the date when these policy tools are adjusted. Figure 3(a) shows the average change in these two variables around four dates when reductions
Figure 1: Loan-to-Value and stamp duty rate
Note: The Special Stamp Duty imposed in Nov 2010 is added to
the regular stamp duty rate. Data sources: HKMA, HK Government, and staff calculations
0
4
8
12
16
20
0.0
0.1
0.2
0.3
0.4
0.5
0.6
0.7
0.8
0.9
1.0
1995 1997 1999 2001 2003 2005 2007 2009 2011
Loan-to-value ratio limit (left scale)
Highest marginal stamp duty rate
%Unit
Figure 2: Residential property price and land supply
Data sources: CEIC and staff calculations
0
100
200
300
400
500
600
700
800
900
1,000
0
20
40
60
80
100
120
140
160
180
1995 1997 1999 2001 2003 2005 2007 2009
Government land auction (right scale)
Residential property price index
1000 sq m1999=100
5
in the LTV limits and/or increases in the stamp duty took place (October 2009, April 2010, August 2010, and November 2010). The study does not look at the LTV and stamp duty separately since recent changes have often occurred on the same dates. Figure 3(b) shows price and transactions for just November 2010, which is when the 15 percent SSD was introduced and the LTV was cut by 10 percentage points. The figures show that residential property price growth slowed in the month after the policy adjustments but then rebounded. Similarly, transaction volumes fell for two months after the policy adjustments but then rebounded. In sum, the event study suggests a short-lived impact on price from these measures.
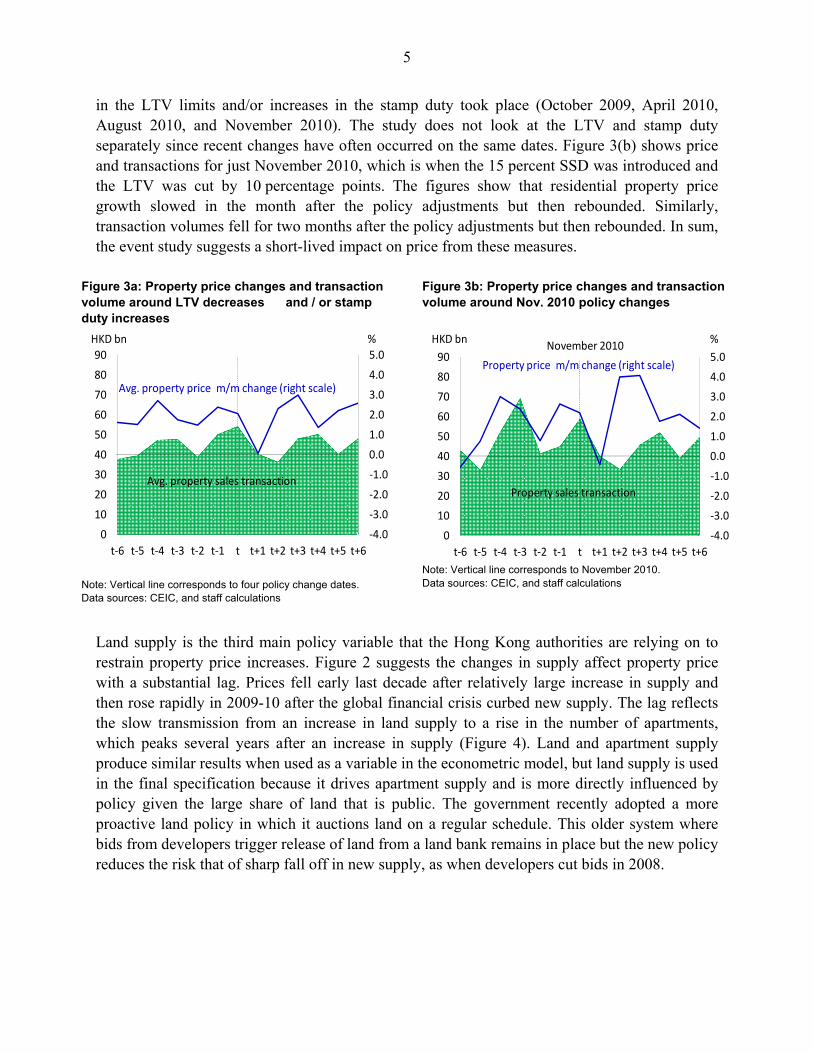
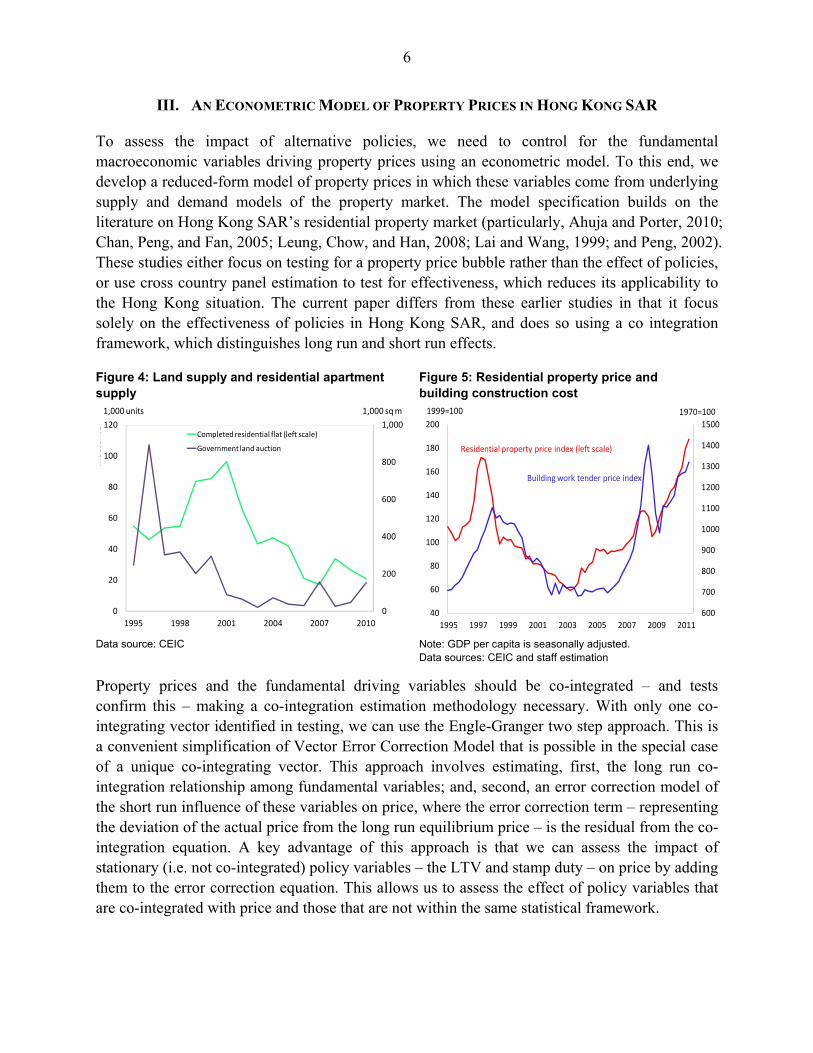
Land supply is the third main policy variable that the Hong Kong authorities are relying on to restrain property price increases. Figure 2 suggests the changes in supply affect property price with a substantial lag. Prices fell early last decade after relatively large increase in supply and then rose rapidly in 2009-10 after the global financial crisis curbed new supply. The lag reflects the slow transmission from an increase in land supply to a rise in the number of apartments, which peaks several years after an increase in supply (Figure 4). Land and apartment supply produce similar results when used as a variable in the econometric model, but land supply is used in the final specification because it drives apartment supply and is more directly influenced by policy given the large share of land that is public. The government recently adopted a more proactive land policy in which it auctions land on a regular schedule. This older system where bids from developers trigger release of land from a land bank remains in place but the new policy reduces the risk that of sharp fall off in new supply, as when developers cut bids in 2008.
Figure 3a: Property price changes and transaction volume around LTV decreases and / or stamp duty increases
Note: Vertical line corresponds to four policy change dates. Data sources: CEIC, and staff calculations
-4.0
-3.0
-2.0
-1.0
0.0
1.0
2.0
3.0
4.0
5.0
0
10
20
30
40
50
60
70
80
90
t-6 t-5 t-4 t-3 t-2 t-1 t t+1 t+2 t+3 t+4 t+5 t+6
Avg. property sales transaction
Avg. property price m/m change (right scale)
HKD bn %
Figure 3b: Property price changes and transaction volume around Nov. 2010 policy changes
Note: Vertical line corresponds to November 2010. Data sources: CEIC, and staff calculations
-4.0
-3.0
-2.0
-1.0
0.0
1.0
2.0
3.0
4.0
5.0
0
10
20
30
40
50
60
70
80
90
t-6 t-5 t-4 t-3 t-2 t-1 t t+1 t+2 t+3 t+4 t+5 t+6
Property sales transaction
Property price m/m change (right scale)
HKD bnNovember 2010
%
6
III. AN ECONOMETRIC MODEL OF PROPERTY PRICES IN HONG KONG SAR
To assess the impact of alternative policies, we need to control for the fundamental macroeconomic variables driving property prices using an econometric model. To this end, we develop a reduced-form model of property prices in which these variables come from underlying supply and demand models of the property market. The model specification builds on the literature on Hong Kong SAR’s residential property market (particularly, Ahuja and Porter, 2010; Chan, Peng, and Fan, 2005; Leung, Chow, and Han, 2008; Lai and Wang, 1999; and Peng, 2002). These studies either focus on testing for a property price bubble rather than the effect of policies, or use cross country panel estimation to test for effectiveness, which reduces its applicability to the Hong Kong situation. The current paper differs from these earlier studies in that it focus solely on the effectiveness of policies in Hong Kong SAR, and does so using a co integration framework, which distinguishes long run and short run effects.
Figure 4: Land supply and residential apartment supply
Data source: CEIC
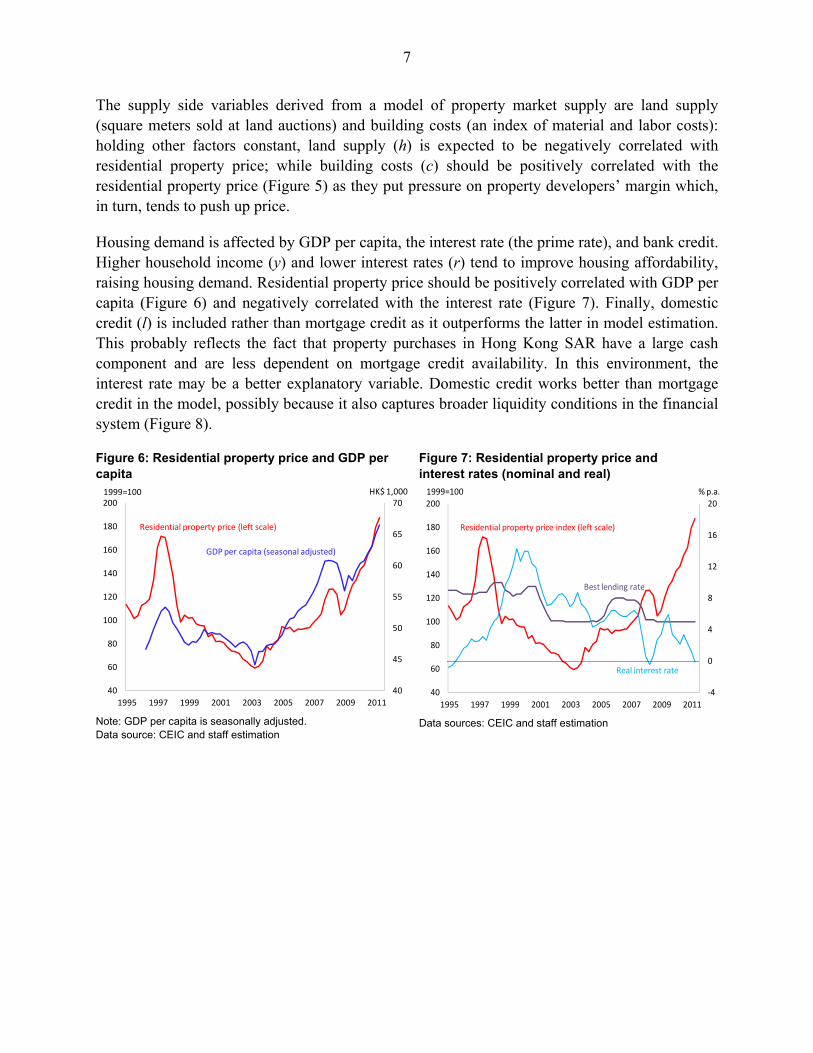
Figure 5: Residential property price and building construction cost
Note: GDP per capita is seasonally adjusted. Data sources: CEIC and staff estimation
Property prices and the fundamental driving variables should be co-integrated – and tests confirm this – making a co-integration estimation methodology necessary. With only one co-integrating vector identified in testing, we can use the Engle-Granger two step approach. This is a convenient simplification of Vector Error Correction Model that is possible in the special case of a unique co-integrating vector. This approach involves estimating, first, the long run co-integration relationship among fundamental variables; and, second, an error correction model of the short run influence of these variables on price, where the error correction term – representing the deviation of the actual price from the long run equilibrium price – is the residual from the co-integration equation. A key advantage of this approach is that we can assess the impact of stationary (i.e. not co-integrated) policy variables – the LTV and stamp duty – on price by adding them to the error correction equation. This allows us to assess the effect of policy variables that are co-integrated with price and those that are not within the same statistical framework.
0
200
400
600
800
1,000
0
20
40
60
80
100
120
1995 1998 2001 2004 2007 2010
Th
ou
san
ds
Completed residential flat (left scale)
Government land auction
1,000 sq m1,000 units
600
700
800
900
1000
1100
1200
1300
1400
1500
40
60
80
100
120
140
160
180
200
1995 1997 1999 2001 2003 2005 2007 2009 2011
Residential property price index (left scale)
Building work tender price index
1999=100 1970=100
7
The supply side variables derived from a model of property market supply are land supply (square meters sold at land auctions) and building costs (an index of material and labor costs): holding other factors constant, land supply (h) is expected to be negatively correlated with residential property price; while building costs (c) should be positively correlated with the residential property price (Figure 5) as they put pressure on property developers’ margin which, in turn, tends to push up price.
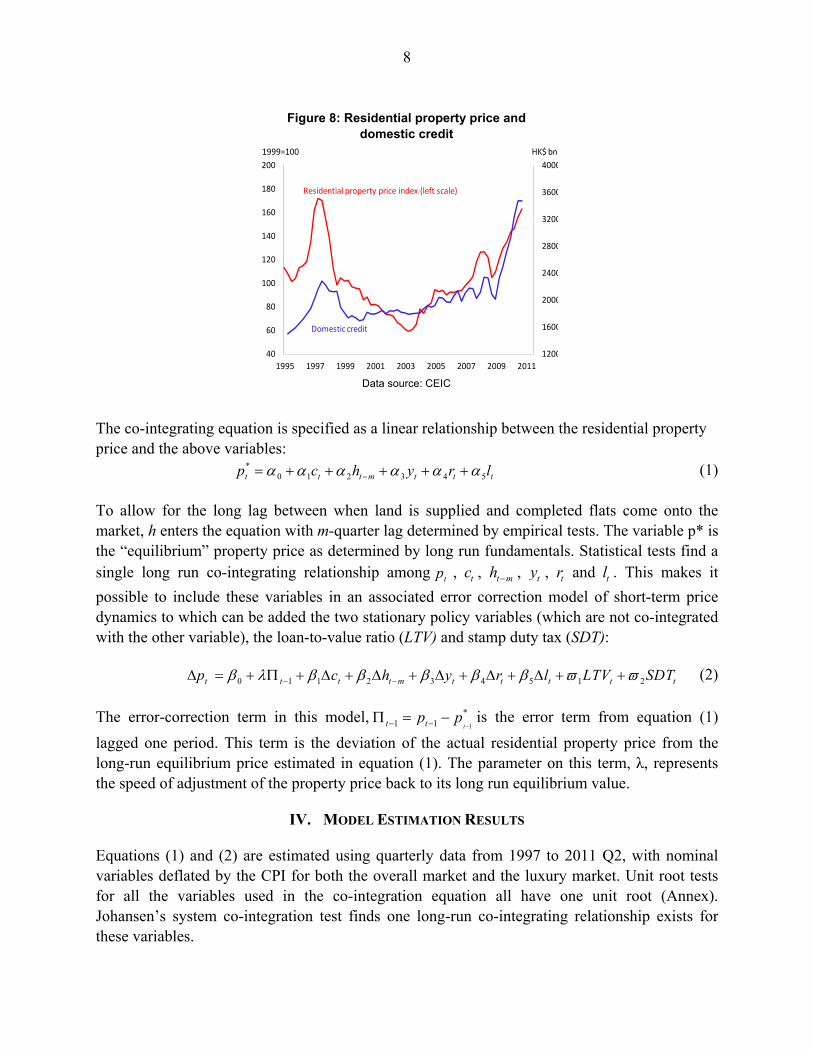
Housing demand is affected by GDP per capita, the interest rate (the prime rate), and bank credit. Higher household income (y) and lower interest rates (r) tend to improve housing affordability, raising housing demand. Residential property price should be positively correlated with GDP per capita (Figure 6) and negatively correlated with the interest rate (Figure 7). Finally, domestic credit (l) is included rather than mortgage credit as it outperforms the latter in model estimation. This probably reflects the fact that property purchases in Hong Kong SAR have a large cash component and are less dependent on mortgage credit availability. In this environment, the interest rate may be a better explanatory variable. Domestic credit works better than mortgage credit in the model, possibly because it also captures broader liquidity conditions in the financial system (Figure 8).
Figure 6: Residential property price and GDP per capita
Note: GDP per capita is seasonally adjusted. Data source: CEIC and staff estimation
Figure 7: Residential property price and interest rates (nominal and real)
Data sources: CEIC and staff estimation
40
45
50
55
60
65
70
40
60
80
100
120
140
160
180
200
1995 1997 1999 2001 2003 2005 2007 2009 2011
Residential property price (left scale)
GDP per capita (seasonal adjusted)
1999=100 HK$ 1,000
-4
0
4
8
12
16
20
40
60
80
100
120
140
160
180
200
1995 1997 1999 2001 2003 2005 2007 2009 2011
Residential property price index (left scale)
Best lending rate
1999=100 % p.a.
Real interest rate
8
The co-integrating equation is specified as a linear relationship between the residential property price and the above variables:
*0 1 2 3 4 5t t t m t t tp c h y r l (1)
To allow for the long lag between when land is supplied and completed flats come onto the market, h enters the equation with m-quarter lag determined by empirical tests. The variable p* is the “equilibrium” property price as determined by long run fundamentals. Statistical tests find a single long run co-integrating relationship among tp , tc , t mh , ty , tr and tl . This makes it
possible to include these variables in an associated error correction model of short-term price dynamics to which can be added the two stationary policy variables (which are not co-integrated with the other variable), the loan-to-value ratio (LTV) and stamp duty tax (SDT):
0 1 1 2 3 4 5 1 2t t t t m t t t t tp c h y r l LTV SDT (2)
The error-correction term in this model,1
*1 1 tt tp p
is the error term from equation (1)
lagged one period. This term is the deviation of the actual residential property price from the long-run equilibrium price estimated in equation (1). The parameter on this term, λ, represents the speed of adjustment of the property price back to its long run equilibrium value.
IV. MODEL ESTIMATION RESULTS
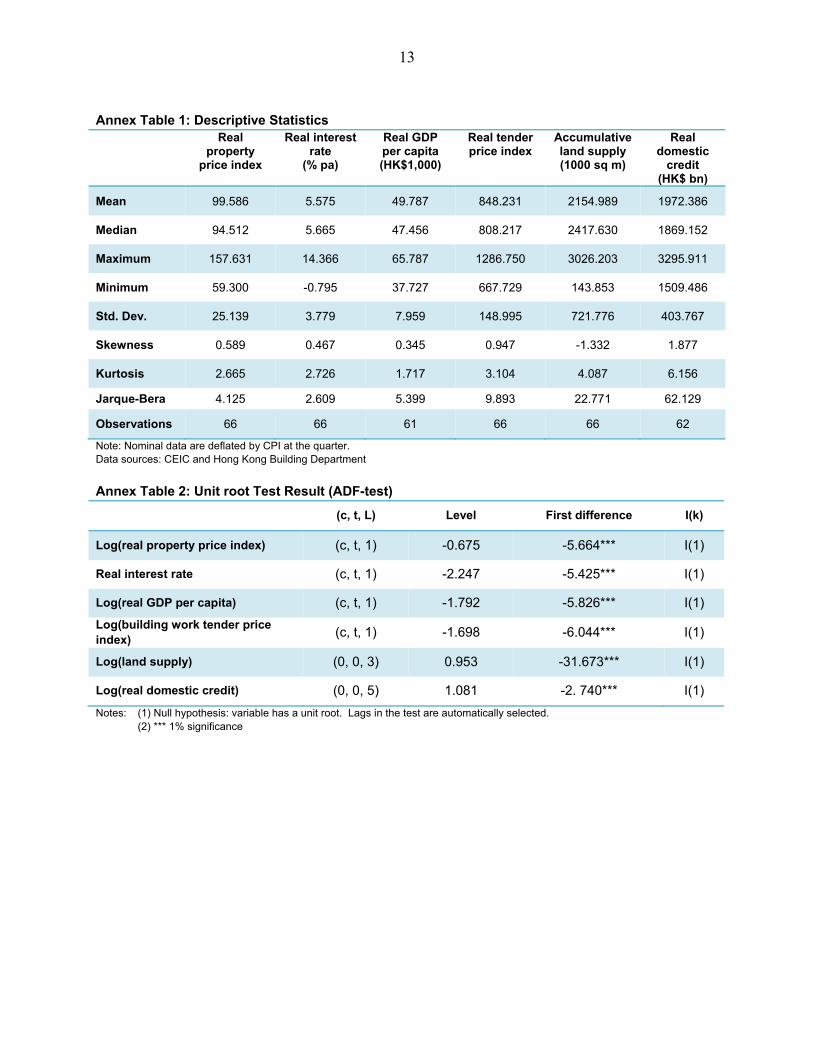
Equations (1) and (2) are estimated using quarterly data from 1997 to 2011 Q2, with nominal variables deflated by the CPI for both the overall market and the luxury market. Unit root tests for all the variables used in the co-integration equation all have one unit root (Annex). Johansen’s system co-integration test finds one long-run co-integrating relationship exists for these variables.
Figure 8: Residential property price and domestic credit
Data source: CEIC
1200
1600
2000
2400
2800
3200
3600
4000
40
60
80
100
120
140
160
180
200
1995 1997 1999 2001 2003 2005 2007 2009 2011
Residential property price index (left scale)
Domestic credit
1999=100 HK$ bn
9
Table 1: Estimation Results of Co-Integration Model for Residential Property Prices
Dependent variable: Log(real property price)
Overall Market Beta (t-stat)
Luxury market Beta (t-stat)
Constant 5.342*** (3.085)
6.872*** (4.055)
Real interest rate -0.016** (-2.331)
-0.027*** (-3.627)
Log( real GDP per capita) 1.492*** (6.510)
2.370*** (10.916)
Log(real domestic credit) 0.245** (2.660)
-0.132 (-1.316)
Log(real construction cost index) 0.479*** (7.336)
0.262*** (3.976)
Log (Land supply) with 5-quarter lag -0.800*** (-7.336)
-0.828*** (-8.142)
Adjusted-R2 0.966 0.980
DW-Statistic 1.577 1.538
Obs. 56 (1997Q3-2011Q2) 56 (1997Q3-2011Q2)
Notes: (1) Relationships are estimated using dynamic least squares (DOLS) method with two lags heteroskedasticity-autocorrelation consistent (HAC) standard errors.
(2) *** 1% significance, ** 5% significance, * 10% significance.
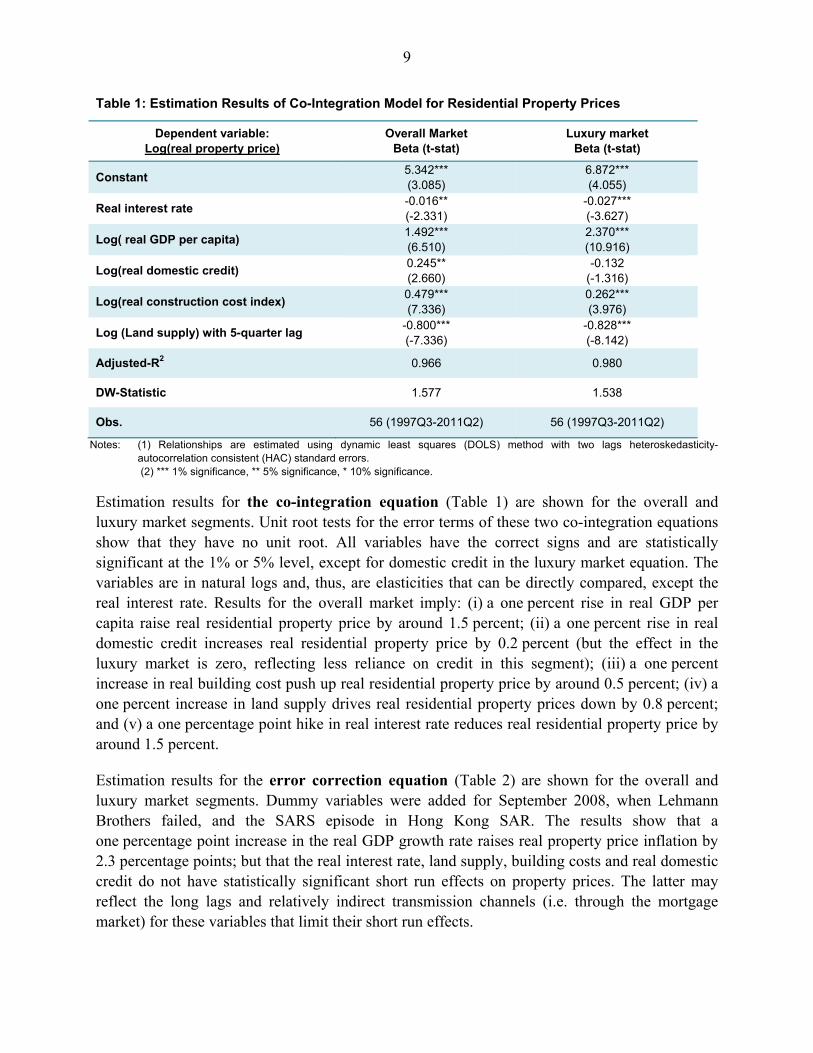
Estimation results for the co-integration equation (Table 1) are shown for the overall and luxury market segments. Unit root tests for the error terms of these two co-integration equations show that they have no unit root. All variables have the correct signs and are statistically significant at the 1% or 5% level, except for domestic credit in the luxury market equation. The variables are in natural logs and, thus, are elasticities that can be directly compared, except the real interest rate. Results for the overall market imply: (i) a one percent rise in real GDP per capita raise real residential property price by around 1.5 percent; (ii) a one percent rise in real domestic credit increases real residential property price by 0.2 percent (but the effect in the luxury market is zero, reflecting less reliance on credit in this segment); (iii) a one percent increase in real building cost push up real residential property price by around 0.5 percent; (iv) a one percent increase in land supply drives real residential property prices down by 0.8 percent; and (v) a one percentage point hike in real interest rate reduces real residential property price by around 1.5 percent.
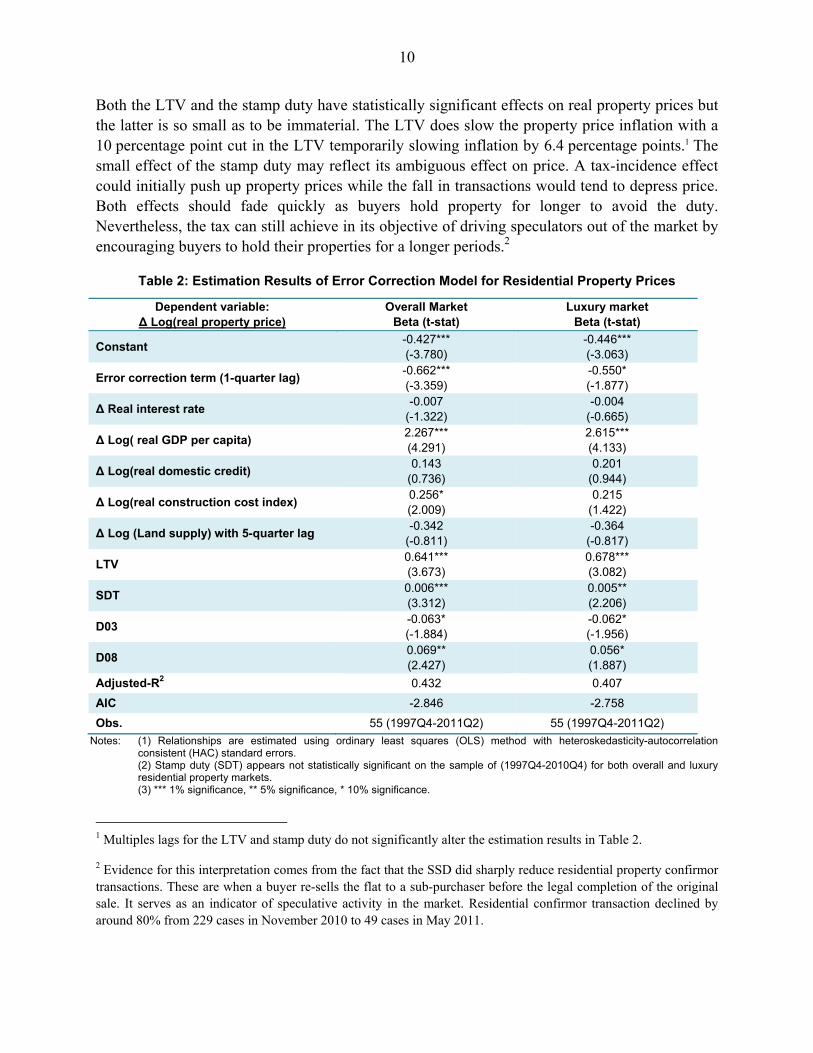
Estimation results for the error correction equation (Table 2) are shown for the overall and luxury market segments. Dummy variables were added for September 2008, when Lehmann Brothers failed, and the SARS episode in Hong Kong SAR. The results show that a one percentage point increase in the real GDP growth rate raises real property price inflation by 2.3 percentage points; but that the real interest rate, land supply, building costs and real domestic credit do not have statistically significant short run effects on property prices. The latter may reflect the long lags and relatively indirect transmission channels (i.e. through the mortgage market) for these variables that limit their short run effects.
10
Both the LTV and the stamp duty have statistically significant effects on real property prices but the latter is so small as to be immaterial. The LTV does slow the property price inflation with a 10 percentage point cut in the LTV temporarily slowing inflation by 6.4 percentage points.1 The small effect of the stamp duty may reflect its ambiguous effect on price. A tax-incidence effect could initially push up property prices while the fall in transactions would tend to depress price. Both effects should fade quickly as buyers hold property for longer to avoid the duty. Nevertheless, the tax can still achieve in its objective of driving speculators out of the market by encouraging buyers to hold their properties for a longer periods.2
Table 2: Estimation Results of Error Correction Model for Residential Property Prices
Dependent variable: ∆ Log(real property price)
Overall MarketBeta (t-stat)
Luxury market Beta (t-stat)
Constant -0.427*** (-3.780)
-0.446*** (-3.063)
Error correction term (1-quarter lag) -0.662*** (-3.359)
-0.550* (-1.877)
∆ Real interest rate -0.007
(-1.322) -0.004
(-0.665)
∆ Log( real GDP per capita) 2.267*** (4.291)
2.615*** (4.133)
∆ Log(real domestic credit) 0.143
(0.736) 0.201
(0.944)
∆ Log(real construction cost index) 0.256* (2.009)
0.215 (1.422)
∆ Log (Land supply) with 5-quarter lag -0.342
(-0.811) -0.364
(-0.817)
LTV 0.641*** (3.673)
0.678*** (3.082)
SDT 0.006*** (3.312)
0.005** (2.206)
D03 -0.063* (-1.884)
-0.062* (-1.956)
D08 0.069** (2.427)
0.056* (1.887)
Adjusted-R2 0.432 0.407
AIC -2.846 -2.758
Obs. 55 (1997Q4-2011Q2) 55 (1997Q4-2011Q2)
Notes: (1) Relationships are estimated using ordinary least squares (OLS) method with heteroskedasticity-autocorrelation consistent (HAC) standard errors.
(2) Stamp duty (SDT) appears not statistically significant on the sample of (1997Q4-2010Q4) for both overall and luxury residential property markets.
(3) *** 1% significance, ** 5% significance, * 10% significance.
1 Multiples lags for the LTV and stamp duty do not significantly alter the estimation results in Table 2.
2 Evidence for this interpretation comes from the fact that the SSD did sharply reduce residential property confirmor transactions. These are when a buyer re-sells the flat to a sub-purchaser before the legal completion of the original sale. It serves as an indicator of speculative activity in the market. Residential confirmor transaction declined by around 80% from 229 cases in November 2010 to 49 cases in May 2011.
11
V. EXPLAINING THE RAPID RISE IN PROPERTY PRICES
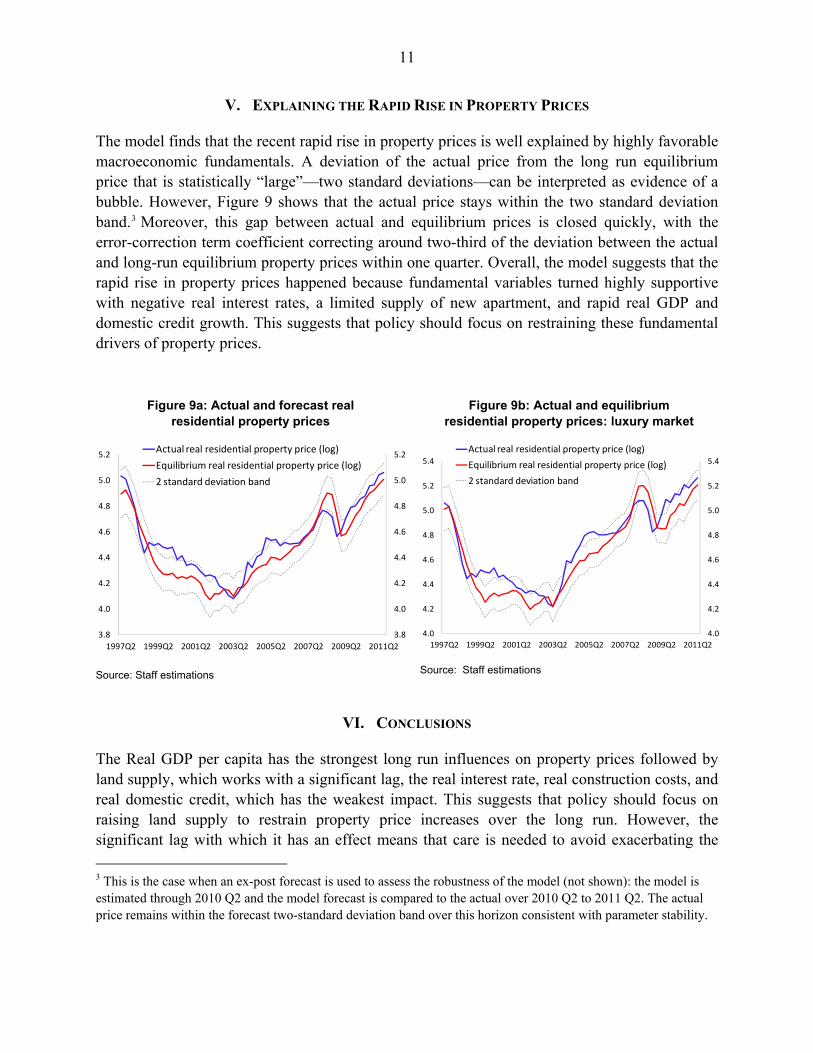
The model finds that the recent rapid rise in property prices is well explained by highly favorable macroeconomic fundamentals. A deviation of the actual price from the long run equilibrium price that is statistically “large”—two standard deviations—can be interpreted as evidence of a bubble. However, Figure 9 shows that the actual price stays within the two standard deviation band.3 Moreover, this gap between actual and equilibrium prices is closed quickly, with the error-correction term coefficient correcting around two-third of the deviation between the actual and long-run equilibrium property prices within one quarter. Overall, the model suggests that the rapid rise in property prices happened because fundamental variables turned highly supportive with negative real interest rates, a limited supply of new apartment, and rapid real GDP and domestic credit growth. This suggests that policy should focus on restraining these fundamental drivers of property prices.
Figure 9a: Actual and forecast real residential property prices
Source: Staff estimations
Figure 9b: Actual and equilibrium residential property prices: luxury market
Source: Staff estimations
VI. CONCLUSIONS
The Real GDP per capita has the strongest long run influences on property prices followed by land supply, which works with a significant lag, the real interest rate, real construction costs, and real domestic credit, which has the weakest impact. This suggests that policy should focus on raising land supply to restrain property price increases over the long run. However, the significant lag with which it has an effect means that care is needed to avoid exacerbating the
3 This is the case when an ex-post forecast is used to assess the robustness of the model (not shown): the model is estimated through 2010 Q2 and the model forecast is compared to the actual over 2010 Q2 to 2011 Q2. The actual price remains within the forecast two-standard deviation band over this horizon consistent with parameter stability.
3.8
4.0
4.2
4.4
4.6
4.8
5.0
5.2
3.8
4.0
4.2
4.4
4.6
4.8
5.0
5.2
1997Q2 1999Q2 2001Q2 2003Q2 2005Q2 2007Q2 2009Q2 2011Q2
Actual real residential property price (log)
Equilibrium real residential property price (log)
2 standard deviation band
4.0
4.2
4.4
4.6
4.8
5.0
5.2
5.4
4.0
4.2
4.4
4.6
4.8
5.0
5.2
5.4
1997Q2 1999Q2 2001Q2 2003Q2 2005Q2 2007Q2 2009Q2 2011Q2
Actual real residential property price (log)
Equilibrium real residential property price (log)
2 standard deviation band
12
property price cycle. The real interest rate also has a long run influence on price and may rise with a tightening of liquidity conditions resulting from more restrictive macroprudential policies.
The LTV ratio and stamp duty both have statistically significant effects on price, although the latter is very small. These effects are temporary, and, thus, can slow, but not fundamentally alter, the rising trend in property prices. The LTV and stamp duty dampen speculative activity that drives up property prices. While these policies can slow the increase in the short run, they should be guided by their long run objectives of financial stability and counteracting speculation, respectively. Finally, the analysis suggests that the recent, rapid rise in property prices is well explained by highly supportive macroeconomic fundamentals with the “equilibrium” price derived from the model tracking the actual price quite closely.
13
Annex Table 1: Descriptive Statistics Real
property price index
Real interest rate
(% pa)
Real GDP per capita (HK$1,000)
Real tender price index
Accumulative land supply (1000 sq m)
Real domestic
credit (HK$ bn)
Mean 99.586 5.575 49.787 848.231 2154.989 1972.386
Median 94.512 5.665 47.456 808.217 2417.630 1869.152
Maximum 157.631 14.366 65.787 1286.750 3026.203 3295.911
Minimum 59.300 -0.795 37.727 667.729 143.853 1509.486
Std. Dev. 25.139 3.779 7.959 148.995 721.776 403.767
Skewness 0.589 0.467 0.345 0.947 -1.332 1.877
Kurtosis 2.665 2.726 1.717 3.104 4.087 6.156
Jarque-Bera 4.125 2.609 5.399 9.893 22.771 62.129
Observations 66 66 61 66 66 62
Note: Nominal data are deflated by CPI at the quarter. Data sources: CEIC and Hong Kong Building Department
Annex Table 2: Unit root Test Result (ADF-test)
(c, t, L) Level First difference I(k)
Log(real property price index) (c, t, 1) -0.675 -5.664*** I(1)
Real interest rate (c, t, 1) -2.247 -5.425*** I(1)
Log(real GDP per capita) (c, t, 1) -1.792 -5.826*** I(1)
Log(building work tender price index)
(c, t, 1) -1.698 -6.044*** I(1)
Log(land supply) (0, 0, 3) 0.953 -31.673*** I(1)
Log(real domestic credit) (0, 0, 5) 1.081 -2. 740*** I(1)
Notes: (1) Null hypothesis: variable has a unit root. Lags in the test are automatically selected. (2) *** 1% significance
14
REFERENCES
Ahuja, A., and N. Porter, 2010, “Are House Prices Rising Too Fast in Hong Kong SAR?” IMF Working Paper WP/10/273, (December).
Chan, N., W. Peng, and K. Fan, 2005, “A Graphical Framework for Monitoring the Property Market in Hong Kong,” HKMA Quarterly Bulletin, (March).
Crowe, C., G. Dell'Ariccia, D. Igan, and P. Rabanal, 2011, “Policies for Macrofinancial Stability: Options to Deal with Real-Estate Booms,” IMF Staff Discussion Note SDN/11/02, (February).
Lai, N., and K. Wang, 1999, “Land-Supply Restrictions, Developer Strategies and Housing Policies: The Case in Hong Kong,” International Real Estate Review, 2:1, pp.143-59.
Lung, F., K. Chow, and G. Han, 2008, “Long-Term and Short-Term Determinants of Property Prices in Hong Kong,” HKMA Working Paper 15/2008, (October).
Peng, W., 2002, “What Drives Property Prices in Hong Kong?” HKMA Quarterly Bulletin, (August).
Wong, E., T. Fong, K.-F. Li, and H. Choi, 2011, “Loan-to-Value Ratio as A Macro-prudential Tool: Hong Kong’s Experience and Cross-Country Evidence,” HKMA Working Paper 01/2011, (February).