Embed Size (px)
Citation preview
International Journal of Asian Social Science, 2014, 4(12): 1163-1175
† Corresponding author
ISSN(e): 2224-4441/ISSN(p): 2226-5139
© 2014 AESS Publications. All Rights Reserved.
1163
DETERMINANTS OF UNEMPLOYMENT IN PAKISTAN: A STATISTICAL
STUDY
Tahir Mahmood1†
--- Amjid Ali2 --- Noureen Akhtar
3 --- Muhammad Iqbal
4 --- Sadia
Qamar5 --- Hafiz Zafar Nazir
6 --- Nasir Abbas
7 --- Iram Sana
8
1, 2, 3, 4, 5, 6, 8 Department of Statistics, University of Sargodha, Punjab, Pakistan
7 Departments of Statistics, Ripah International University, Punjab, Pakistan
ABSTRACT
The current study has been designed to investigate the relationship between unemployment and the
different factors having impact on unemployment directly or indirectly. The basic purpose of the
study is to check that either their effects are significant or insignificant. At first, normality,
independence, homoscedasticity and autocorrelation are checked. Stepwise regression with
forward selection technique is utilized for the model selection. Model selection criteria used is to
select a best fitted model. For the said purpose, yearly data of Pakistan from 1990 – 2010 is
utilized. In the study, unemployment is the dependent variable and GDP, FDI, Budget deficit,
Inflation, Literacy rate, population growth rate and Labor force are taken as explanatory
variables. Our results revealed that the Labor force has a positively effect on the unemployment
while inflation and FDI has a negative effect on the unemployment. SPSS, E-views, Mini tab and
Microsoft Excel software’s are used to analyze the data under study.
© 2014 AESS Publications. All Rights Reserved.
Keywords: Foreign direct investment (FDI), Inflation, Population growth, Pakistan, Stepwise regression,
Unemployment.
Contribution/ Originality
This study is one of very few studies which have investigated the potential factors such as
(Gross Domestic Product, Foreign Direct Investment, Budget deficit, Inflation, Literacy rate,
population growth rate and Labor force) that affect the unemployment rate in Pakistan and these
factors are in line with the theory.
International Journal of Asian Social Science ISSN(e): 2224-4441/ISSN(p): 2226-5139
journal homepage: http://www.aessweb.com/journals/5007
International Journal of Asian Social Science, 2014, 4(12): 1163-1175
© 2014 AESS Publications. All Rights Reserved.
1164
1. INTRODUCTION
In the recent times, there are three main problems generally faced by the developing and the
under developed countries i.e. inflation or depression/soothing economic instabilities, improving
fairness in income, inadequate economic growth and prosperity. The main cause of unemployment
is the income instability, inadequate economic growth and poverty. The definition of employed is
“do any work for pay, profit, or family gain during the past week, for at least one hour on any day”
or “help to work for family gain in a family business or family farm during the past week” or “have
a job or enterprise such as a shop, business, farm, or service establishment, even if did not work last
week for some reason” (International Labour organization, 2001). Keynes (1936) defined it as
“unemployment is an excess supply of labor resulting from a failure in the market economy”.
According to International Labour Organization (ILO) “unemployment is a situation of being out
of work or need a job and continuously searching for it in the last four week or unemployed (age 16
or above) but available to join work in the next two weeks. People who voluntarily do not want to
work, full time students, retired people and children are no included in unemployed category”.
The global employment trend survey organized by ILO in 2012 and a news story (business
week 2011) reported some of the figures of unemployment which are given as:
i. More than 200 million people globally are out of work. The unemployment rate of world
in 2011 was 6% that is decreased by 0.1% in the later year.
ii. Similarly, the unemployment rate of south Asia in 2011 was about 3.8% that was 3.9 %
recorded in 2010.
iii. Male unemployment of the world in 2010 was 5.8% whereas in South Asia it was 3.5%
that remained the same in 2011.
iv. Female unemployment rate of world in 2011 was 6.4% that was decreased by 0.1% from
the previous year.
v. Likewise, in south Asia, it was 4.8% in 2011 that got decreased by 0.2% from previous
year.
vi. In 2010 world youth unemployment rate was 12.8% while the south Asian youth
unemployment rate was 10.2%. In 2011 these figures were reported as 10.2% and 9.9%
respectively.
vii. Adult unemployment rate of world and south Asia in 2010 were 4.6% and 2.3% and these
figures also remained unchanged in 2011.
Pakistan has a large population (estimated as 179,572,000) and stands on 6th
in the ranking of
most populated countries. Pakistan shares 2.56% in world population, 9th
in world ranking with
75,880,000 labor force (2011). According to US central intelligence agency unemployment in
Pakistan is 5.50 and stands at 57th
in world ranking (2011). Pakistan has an economy growth rate of
just 2.6% which is the due to the political instability, growing security concern, impact of floods,
high inflation and inadequate infrastructure. Pakistan stands at 113th
out of 129 countries with a
7.73% youth unemployment rate, 153rd
out of 230 countries with a 4.2% old age rate, 174th
out of
257countries with 60.40% 15-64 years age rate, 59th
out of 257 countries with 0-14 year age rate
International Journal of Asian Social Science, 2014, 4(12): 1163-1175
© 2014 AESS Publications. All Rights Reserved.
1165
35.40%, Pakistan stands on 17th
out of main countries with 44.008 billion of US$ output in which
20.9% composition of GDP and 1% share in global agricultural output and 128th
out of 185
countries with 2.4% GDP growth rate.
In Pakistan there are a lot of factors that affect unemployment. Pakistan economy mostly
depends on agriculture sector that contribute 20.9% in GDP and 43.5% people employed in that
sector where male ratio is 34.9% and 74.2% females. In rural area ratio of employment is higher as
compare to urban area that is 35.97% overall and with respect to gender 22.49% male and 13.48%
females work in agriculture sector. Backwardness in this sector causes higher unemployment that is
due to lack of knowledge, less availability of fertilizers, pesticides and low quality seeds (Pakistan
Bureau of Statistics, 2011).
Industry is the second big sector in Pakistan that contributes 19% in GDP in which 21.8%
people engaged where male ratio is 24.6% and female ratio is 11.5%.backwardness in that sector is
due to Investors trend, political instability, bad law, lack of planning, terrorism and other crimes.
Tax system is also responsible because in Pakistan ratio of direct tax is higher than indirect tax and
government get less tax, due to this public projects will not develops that’s why unemployment
increases. One big factor is monetary and fiscal policies, Pakistan have fewer funds to invest on
new project about jobs. Every year budget shows deficit, if government increase the rate of interest
but it’s not beneficial for investor to get loans from banks.
Educational system is also responsible for unemployment in Pakistan because there’s no
institute that provides knowledge and skills according to the relevant job. 63.9% literate person
unemployed in Pakistan in which 63.59% get formal education and 0.31% person get non formal
education. 28.43% person get primary and secondary education, 16.4% are those whose education
level is matriculation, 9.29% and 9.38% are those whose education level is intermediate and
postgraduate and PH.D respectively (International Labour Force Survey, 2010-11).
46.15% literate males are unemployed out of 65.38% males in Pakistan, in which 45.91% gets
formal education and 0.24% gets non formal education. 22.04%, 12.13%, 6.2% and 5.54% are
those males whose education level is primary and secondary education, Matriculation, Intermediate
and postgraduate and PH.D respectively. Females play important role in economy of country
17.75% literate females are unemployed out of 34.62% females in Pakistan, in which 17.68% gets
formal education and 0.07% gets non formal education. 6.39%, 4.35%, 3.09% and 3.85% are those
females whose education level is primary and secondary education, Matriculation, Intermediate and
postgraduate and PH.D respectively (International Labour Force Survey, 2010-11).
The unemployment with respect to age show u shape pattern. There is high unemployment
among youth category, moderate values and high rates for the middle age and old age category
respectively. In 2011 International Labor Organization defines about Pakistan that 10.28%, 1.56%
and 14% unemployed people having age 4-10 years, 40-44 years and 65+ years respectively.
1.1. Objectives
The main objectives of this study are to determine
The main determinants which affect the unemployment rate in Pakistan
International Journal of Asian Social Science, 2014, 4(12): 1163-1175
© 2014 AESS Publications. All Rights Reserved.
1166
To present a model which helps in the planning and development of the country
To help the policy makers in order to control the unemployment rate in Pakistan.
2. LITERATURE REVIEW
Phillips (1967) revealed that there is a negative correlation between unemployment and
inflation. He also describes the two term prosperity index and misery index. Mortensen and
Pissaride (1994) modeled the job specification process in the matching model of unemployment
with non-cooperative wage behavior. They studied the properties of job creation and job
destruction process. Their study showed that aggregate shock induces creates a negative correlation
between job creation and job destruction as well as positive correlation by the dispersion shock
induces. Job destruction process shows more volatile dynamics as compared to the job creation
process. Amos (1995) introduced more market variables such as incentive wage theory of natural
rate and general equilibrium linkages with unemployment. Phelps (1995) described the three
models of unemployment rate with Government deficits, reflected interest rate and transfer
payment respectively which showed the information of labor product capital markets etc. Then he
combined all three models and made a good one equilibrium frame work. Foley (1997) described
the determinants of unemployment in Russia using the data from the Longitudinal Survey of
Russia. Applying discrete time waiting model, a competing risks and augmented to incorporate
unobserved heterogeneity concludes that older individuals can expect to be unemployed longer
than comparable younger workers. Married women are found to experience significantly longer
unemployment sorcery before departing to a job compared to married men. Having children has no
impact on the duration of unemployment; however they drop out the motivated women from the
labor force, significantly decreasing the time spent finding for work. Persons with higher education
do not have significantly longer unemployment sorcery than those with primary or even secondary
education. Individual duration for entering the unemployment is significantly affected by the
market demand conditions. Finally there was evidence in Russia about duration dependence in the
re-employment hazard, first seven months showed positive duration and then decline occurs until
eighteen months. These results were robust to the introduction of unobserved heterogeneity.
Kooros (2000) provided an analysis of unemployment with the objective of empirically
validating the long held unemployment theories. Their empirical study implemented cubic, linear,
and quadratic regression functions, while the cubic function was determined to be the most accurate
function. They concluded that other than unionization, all others are the predictive variables, such
as GNP, technology, globalization, minimum wages, government employment, and a host of other
variables. Aladkhani (2003) investigated the factors that affect unemployment in Iran by using time
series data from 1968 to 2000. He revealed that the rate of unemployment showed negative relation
with higher growth rates of real investment and inflation, positively to output gap and increasing
economic uncertainty. He also supported the view that there exists amount of switch between
inflation and unemployment. Kupets (2005) described the determinants of unemployment in
Ukraine using the data 1997 to 2003 from the Ukrainian Longitudinal Monitoring Survey (ULMS).
He utilized the conditional probability, gamma distributed unobserved heterogeneity and
International Journal of Asian Social Science, 2014, 4(12): 1163-1175
© 2014 AESS Publications. All Rights Reserved.
1167
independent competing risks framework with flexible baseline hazard rates. He revealed, there is
no significant effect of receiving unemployment benefits but income from the casual activities,
household income pension on the hazard re-employment and farming. To reduce the long-term
unemployment he suggested to do focus on less educated person, old workers, resident of rural area
and small towns having high unemployment rates.
Qayyum (2007) defined that the unemployment in NWFP region of Pakistan is affected by
determinants such as education, poverty, early marriages, less industries, increase in technology,
low income or wages, government policies and GDP. Subhan and Hayat (2008) identified the effect
of price instability on unemployment and economic growth in Pakistan. Annually data of 1980 to
2008 of volumes of imports, volumes of exports, inflation (CPI), GDP growth, balance of trade,
agriculture growth rate, service sector contribution in GDP, share of large scale manufacturing in
GDP, foreign direct investment, gross fixed capital formation by public and private sectors and
total consumption are used that purposed negative relation between price instability and economic
growth and positive with unemployment. Rafiq et al. (2008) determined the unemployment in
Pakistan economy for the period of 1998-2008 using simple Single Equation Linear Regression
Model (SELRM). Population growth, inflation rate (CPI based) and FDI are used as explanatory
variables. The population growth stimulated unemployment positively and inflation and FDI has
negative impact on unemployment.
Eita and Ashipala (2010) investigated the determinants of unemployment in Namibia for the
period 1971 to 2007 and concluded that unemployment reveals negative relation with inflation,
investment causes, aggregate demand, wage demand and investment by using Engle-Granger two
step econometric procedures and Phillips curve. Kyei and Gyekye (2011) defined the determinants
of unemployment in Limpopo by utilizing regression principal component and cluster analysis.
They introduced five independent variables race, age, education, gender and GDP categorized in to
fifteen finally concluded that unemployment is focusing at qualifications below the degree. They
also concluded that matriculation, GDP, youth, and male have no significant relationship with
unemployment. Rather the model showed that primary, postgraduate studies, females, middle aged,
race and incomplete secondary schooling are predictors of unemployment in Limpopo province in
South Africa. Gillani et al. (2011) defined a study about relationship between unemployment and
crimes in period of 1975 to 2008 by using co-integration analysis. They showed that there is long
run relation and the technique Granger causality test shows that unemployment causes the theft,
dacoity, robbery and cattle theft but there is no effect on burglary. Hou (2011) analyzed the
determinants of unemployment, determinants of working in the formal sector, rate of return on
education, and determinants of working hours.
Mahmood et al. (2011) determined the factors involved in unemployment rate of Peshawar,
Pakistan. The study was based on 442 individuals. The final model concludes that more important
determinants of unemployment is high growth of population, lack of resources, non-coordination
between education and job opportunity, red ribbon and role of attitude in getting high level jobs.
Katria et al. (2011) identified the relationship between unemployment and inflation by using
Phillips curves. They utilized the annual panel data (1980-2010) of 6 expected SAARC countries
International Journal of Asian Social Science, 2014, 4(12): 1163-1175
© 2014 AESS Publications. All Rights Reserved.
1168
(China, Russia, Indonesia, Iran, Myanmar and South Africa) and 8 SAARC countries (Afghanistan,
Bangladesh, Bhutan, India, Maldives, Nepal, Pakistan and Srilanka) and concluded that there is
negative relationship between unemployment and inflation in all SAARC countries. Casares et al.
(2012) showed that unemployment increases due to the difference between aggregate labor supply
and demand. There are three determinants of unemployment that are Wage push shock, Demand
shift and monetary policy. They also utilized clinical Dynamic stochastic general equilibrium
(DSGE) model and determine that wages is higher, labor supply is low, Philip curve is flatter one
and technology has increased that is why unemployment has increased.
3. MATERIALS AND METHODS
For this study the data has been taken from secondary sources of International Labour Force
Survey (2010-11) and publications of Ahmad and Cheema (2011). To test the normality of
observations, Jarque Bera test is used. Its statistic is given as:
(
( ) ) (3.1)
where is the number of observation or degrees of freedom, is the sample kurtosis and is
the sample skewness. The formulas of and are given as:
∑ ( ̅)
(
∑ ( ̅)
)
(3.2)
∑ ( ̅)
(
∑ ( ̅)
)
(3.3)
In this test null hypothesis is the joint hypothesis of the skewness being zero and excess
kurtosis being zero with alternative that the skewness is not zero and excess kurtosis is not zero
(Jarque and Bera, 1987).
When the residual variance of a variable in a regression model is not constant, that gives rise to
heteroscedasticity. To check the heteroscedasticity in this study, White test is used. White test is a
statistical test that establishes whether the residual variance of a variable in a regression model is
constant (homoscedastic) or not. For more details, see (White, 1980). Godfery test (which is also
used for the same purpose) is sensitive to the normality assumption but White test does not rely on
the normality assumption and is also easy to implement. In this we assume that more than two
variable are there in the regression. The numm hypothesis for the White test is that there is
heteroscedasticity against the alternative that there is some heteroscedasticity of unknown general
form. The test statistic is computed by auxiliary regression where we regress the squared residuals
on all possible cross product of regressors. The test statistic is given as:
(3.4)
The test statistic is asymptotically distributed as chi-square ( ) with degrees of freedom equal
to the number of slope coefficients (excluding the constant) in the test regression. That test is used
for both heteroscedasticity and for specification error(s).
International Journal of Asian Social Science, 2014, 4(12): 1163-1175
© 2014 AESS Publications. All Rights Reserved.
1169
To check the next assumption that there is no autocorrelation in observations; Durbin and
Watson (1971) d statistic is used. Tintner (1965) defines that autocorrelation is the lag correlation
of a given series with itself. He also defines that the serial correlation is the lag correlation between
two different series. A simple specification for first order correlation would be:
(3.5)
where is a random term that is normally distributed with a zero mean and constant variance
i.e. ( ) and is the autocorrelation coefficient that define as:
∑ ( ̅)( ̅)
√∑ ( ̅)
∑ ( ̅)
(3.6)
The value of | | is always less than 1 i.e. . In Durbin Watson test, the null
hypothesis is that there is no positive autocorrelation against the alternative that there is no negative
autocorrelation. The test statistic is represented as and is given as follows:
∑ ( )
∑ ( )
(3.7)
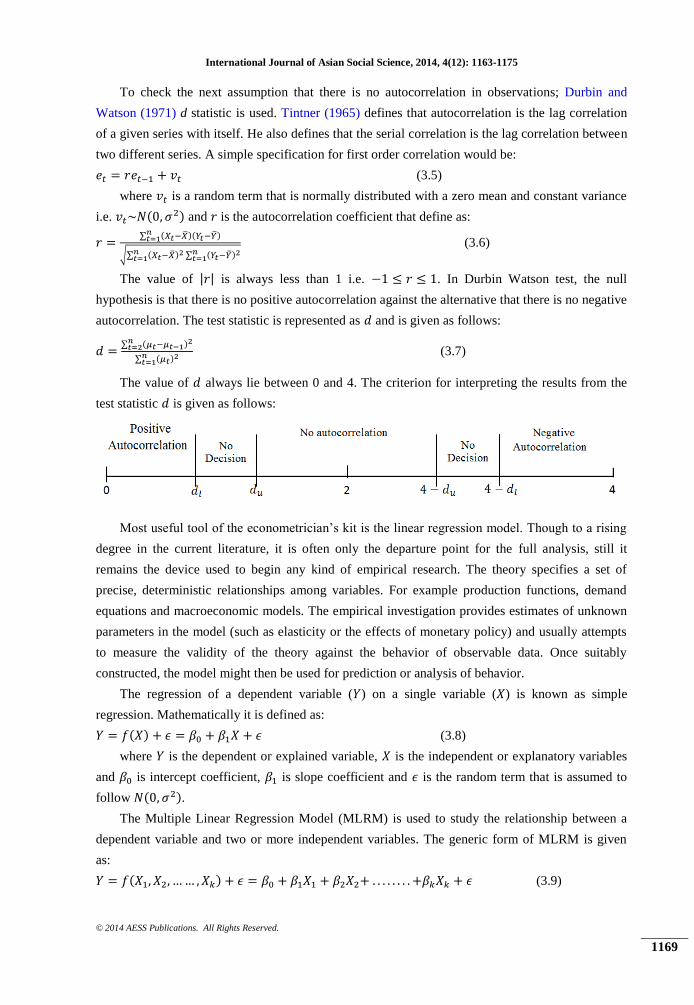
The value of always lie between 0 and 4. The criterion for interpreting the results from the
test statistic is given as follows:
Most useful tool of the econometrician’s kit is the linear regression model. Though to a rising
degree in the current literature, it is often only the departure point for the full analysis, still it
remains the device used to begin any kind of empirical research. The theory specifies a set of
precise, deterministic relationships among variables. For example production functions, demand
equations and macroeconomic models. The empirical investigation provides estimates of unknown
parameters in the model (such as elasticity or the effects of monetary policy) and usually attempts
to measure the validity of the theory against the behavior of observable data. Once suitably
constructed, the model might then be used for prediction or analysis of behavior.
The regression of a dependent variable ( ) on a single variable ( ) is known as simple
regression. Mathematically it is defined as:
( ) (3.8)
where is the dependent or explained variable, is the independent or explanatory variables
and is intercept coefficient, is slope coefficient and is the random term that is assumed to
follow ( ).
The Multiple Linear Regression Model (MLRM) is used to study the relationship between a
dependent variable and two or more independent variables. The generic form of MLRM is given
as:
( ) (3.9)
International Journal of Asian Social Science, 2014, 4(12): 1163-1175
© 2014 AESS Publications. All Rights Reserved.
1170
where is the dependent or explained variable, are the independent or
explanatory variables, is the residual term, is intercept coefficient and are slope
coefficients of explanatory variables , respectively.
In this paper forward selection and backward elimination techniques are utilized. The forward
selection procedure starts with no independent variables while in backward elimination all
explanatory variables are introduced first. In forward selection procedure, we add variables one at a
time as long as a significant in the error of sum of squares can be achieved whereas in backward
elimination one by one insignificant variables are excluded. McIntyre et al. (1981) Model selection
criterion such as coefficient of determination ( ), Adjusted , Akaike Information Criteria (AIC)
and Schwarz Bayesian Criteria (SBC) are used to select a best fitted model.
Information criteria are measures of goodness of fit or uncertainty for the range of values of the
data. In the context of multiple linear regressions, information criteria measure the difference
between a given model and the “true” underlying model.
Coefficient of determination R2 provides the measure of how well future outcomes are
likely to be predicted by model. If the intercept is included in the model the R2 is simply the
square of the sample correlation coefficient between the outcomes and their predicted values.
Coefficient of determination ranges between 0 and 1. The negative R2 comes when
regression is without intercept and when fitting nonlinear trends of data. It is defined as:
(3.10)
where ∑ ( ̅)
, ∑ ( ̂ ̅)
, ∑ ( ̂ )
and ̅
∑ . The model having high R
2 considered the best model.
The adjusted coefficient of determination R2 is the percentage of the variability of the
dependent variable that is explained by the variation of the independent variables after accounting
for the intercept and number of independent variables. Therefore, the adjusted R2 value ranges
from 0 to 1 and is a function of SST, SSE, and (number of independent variables). The
equation for adjusted R2 is
( )
( ) (3.11)
The adjusted R2 is calculated for all possible subset models. Using this technique, the
model with the largest adjusted R2 is declared the best linear model. This approach also includes
the number of variables in the model thus additional parameters will decrease both the numerator
and denominator. However, several models often will have an adjusted R2 = 1, so determining the
best model among tied values is problematic.
Akaike (1974) introduced the concept of information criteria as a tool for optimal model
selection which is further utilized by Akaike (1974) and Bozdogan (1987; 2000). AIC is a function
of the number of observations , SSE and . The expression of AIC is
International Journal of Asian Social Science, 2014, 4(12): 1163-1175
© 2014 AESS Publications. All Rights Reserved.
1171
(
) ( ) (3.12)
The model’s lack of fit is measured by the first term of (3.12) while the second term is a penalty
term for additional parameters in the model. The model with the smallest AIC is deemed the best
model since it minimizes the differences from the given model to the true model.
Schwarz (1978) introduced a model selection criterion that was derived from a Bayesian
modification of the AIC criteria. SBC is given as:
(
) ( ) ( ) (3.13)
The sample size is incorporating by addition of ( ) instead of ( ) in the penalty term.
So the model having fewer AIC and SBC is considered as the best linear model.
4. RESULTS AND ANALYSIS
This section provides the selected models and the analysis performed on those models. It is
further divided into 3 sub-sections. In the first sub-section a model is selected using the forward
selection technique while in the second sub-section backward elimination is used to find the
most influenced variable that significantly affect the unemployment in Pakistan. Finally, in the
third sub-section, a best model is chosen and Variance Inflation Factor (VIF) and residual
analyses are performed on the selected model.
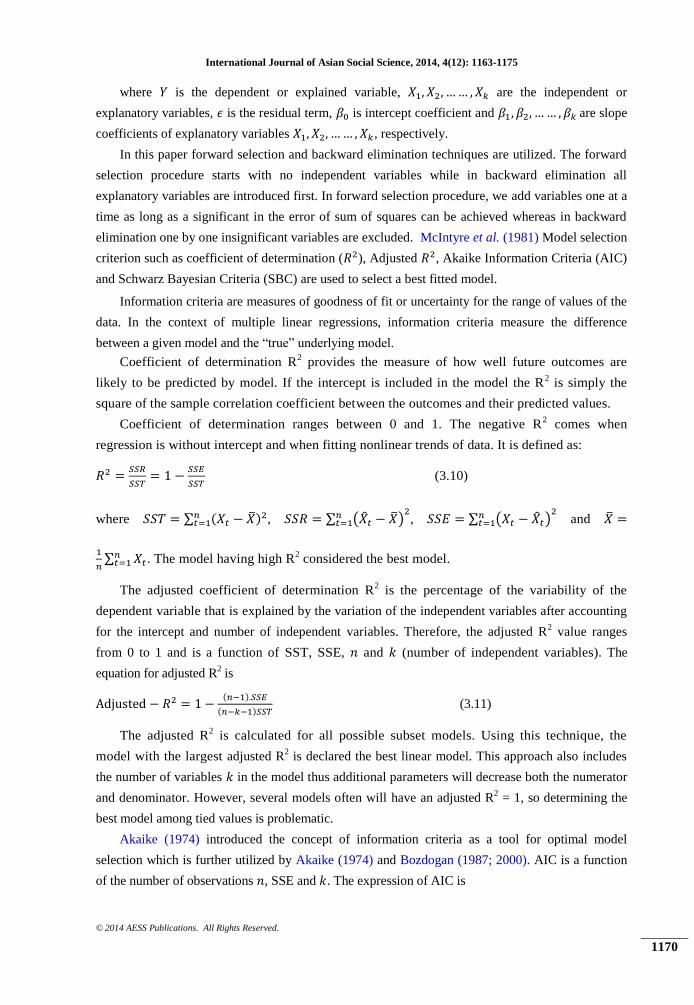
4.1. Model Fitting Using Forward Selection Technique
In forward selection technique, one by one, variables are added in the model. Variable that
has high correlation with unemployment is firstly introduced in model. If that variable is
significant, then the next highly correlated variable is added to the model and so on. At some
stage, if a newly added variable proves to be insignificant then the previous model is selected.
The finally selected model using the forward selection technique is given in the following
equation and the details are provided in Table 1:
( ) ( ) (4.1)
Table-1. Details regarding the model selected by forward selection technique
Dependent
variable
Unemployment
Unstandardized
Coefficients Standardized
Coefficients t Sig.
Collinearity
Statistics
Std.
Error Tolerance VIF
(Constant) 8.938 .493
18.143 0.000
Inflation -0.128 .039 -0.489 -3.297 0.004 0.818 1.223
Budget Deficit 0.339 .104 0.484 3.266 0.004 0.818 1.223
There are two variables in the model i.e. Inflation and Budget deficit. Both of them are
statistically significant with unemployment. Inflation revealed negative relation with
unemployment while budget deficit depicted positive affect on unemployment. The model
selection criteria’s R2, adjusted R
2, AIC and SBC resulted as 0.7065, 0.6739, 2.1141 and 2.2633
International Journal of Asian Social Science, 2014, 4(12): 1163-1175
© 2014 AESS Publications. All Rights Reserved.
1172
respectively. Similarly, the value of Durbin Watson statistic (1.5596) revealed that errors are
independent. VIF is also close to 1 so there is no problem of multicollinearity (cf. Table 1).
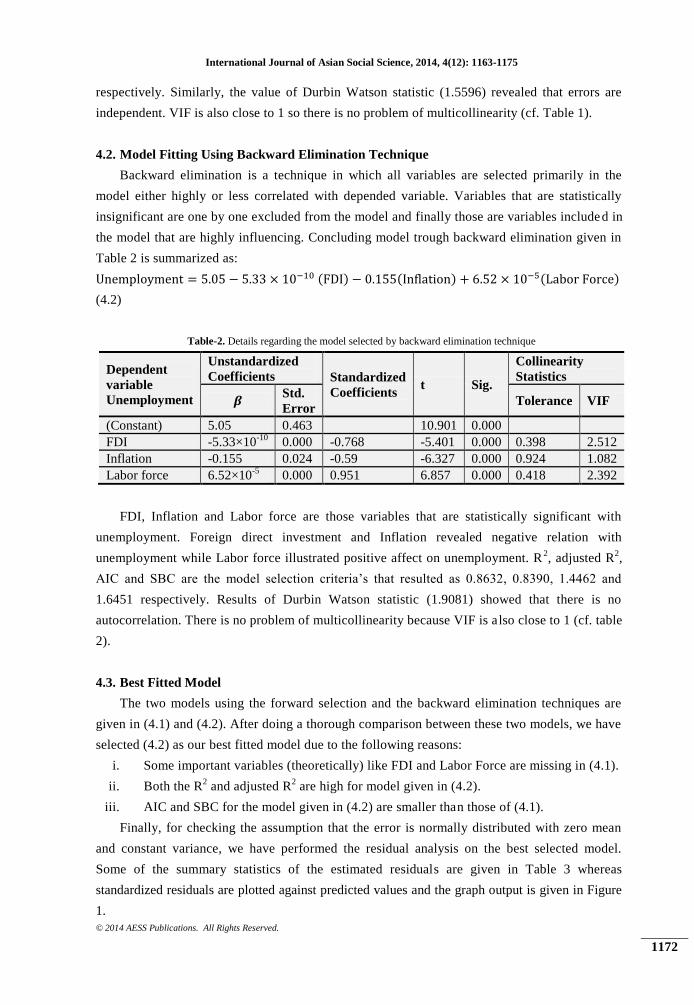
4.2. Model Fitting Using Backward Elimination Technique
Backward elimination is a technique in which all variables are selected primarily in the
model either highly or less correlated with depended variable. Variables that are statistically
insignificant are one by one excluded from the model and finally those are variables included in
the model that are highly influencing. Concluding model trough backward elimination given in
Table 2 is summarized as:
( ) ( ) ( )
(4.2)
Table-2. Details regarding the model selected by backward elimination technique
Dependent
variable
Unemployment
Unstandardized
Coefficients Standardized
Coefficients t Sig.
Collinearity
Statistics
Std.
Error Tolerance VIF
(Constant) 5.05 0.463
10.901 0.000
FDI -5.33×10⁻¹⁰
0.000 -0.768 -5.401 0.000 0.398 2.512
Inflation -0.155 0.024 -0.59 -6.327 0.000 0.924 1.082
Labor force 6.52×10⁻⁵
0.000 0.951 6.857 0.000 0.418 2.392
FDI, Inflation and Labor force are those variables that are statistically significant with
unemployment. Foreign direct investment and Inflation revealed negative relation with
unemployment while Labor force illustrated positive affect on unemployment. R2, adjusted R
2,
AIC and SBC are the model selection criteria’s that resulted as 0.8632, 0.8390, 1.4462 and
1.6451 respectively. Results of Durbin Watson statistic (1.9081) showed that there is no
autocorrelation. There is no problem of multicollinearity because VIF is also close to 1 (cf. table
2).
4.3. Best Fitted Model
The two models using the forward selection and the backward elimination techniques are
given in (4.1) and (4.2). After doing a thorough comparison between these two models, we have
selected (4.2) as our best fitted model due to the following reasons:
i. Some important variables (theoretically) like FDI and Labor Force are missing in (4.1).
ii. Both the R2 and adjusted R
2 are high for model given in (4.2).
iii. AIC and SBC for the model given in (4.2) are smaller than those of (4.1).
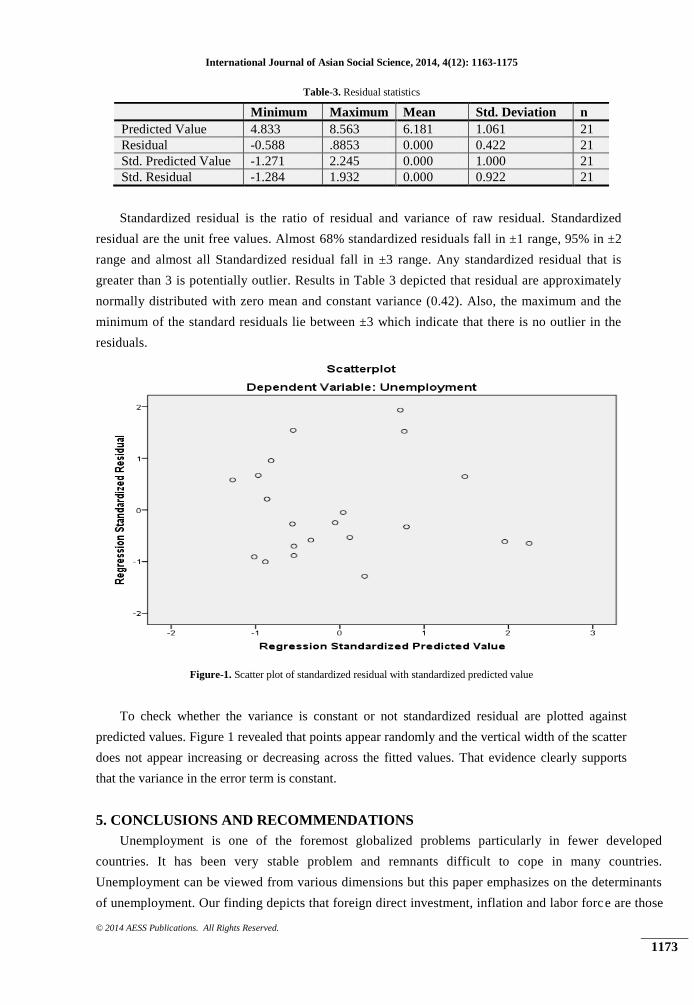
Finally, for checking the assumption that the error is normally distributed with zero mean
and constant variance, we have performed the residual analysis on the best selected model.
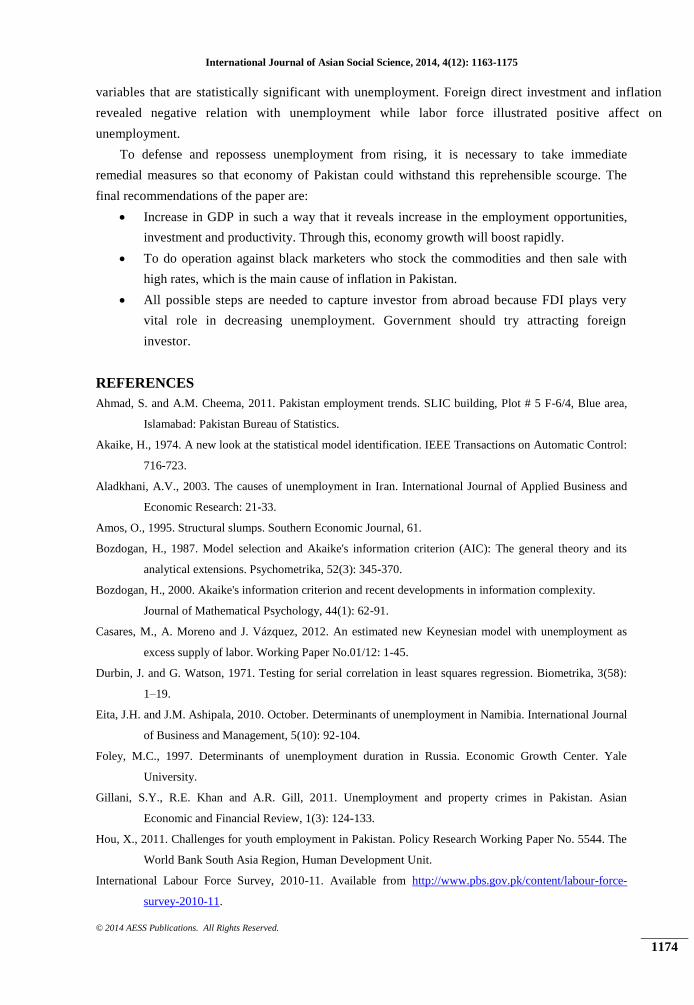
Some of the summary statistics of the estimated residuals are given in Table 3 whereas
standardized residuals are plotted against predicted values and the graph output is given in Figure
1.
International Journal of Asian Social Science, 2014, 4(12): 1163-1175
© 2014 AESS Publications. All Rights Reserved.
1173
Table-3. Residual statistics
Minimum Maximum Mean Std. Deviation n
Predicted Value 4.833 8.563 6.181 1.061 21
Residual -0.588 .8853 0.000 0.422 21
Std. Predicted Value -1.271 2.245 0.000 1.000 21
Std. Residual -1.284 1.932 0.000 0.922 21
Standardized residual is the ratio of residual and variance of raw residual. Standardized
residual are the unit free values. Almost 68% standardized residuals fall in ±1 range, 95% in ±2
range and almost all Standardized residual fall in ±3 range. Any standardized residual that is
greater than 3 is potentially outlier. Results in Table 3 depicted that residual are approximately
normally distributed with zero mean and constant variance (0.42). Also, the maximum and the
minimum of the standard residuals lie between ±3 which indicate that there is no outlier in the
residuals.
Figure-1. Scatter plot of standardized residual with standardized predicted value
To check whether the variance is constant or not standardized residual are plotted against
predicted values. Figure 1 revealed that points appear randomly and the vertical width of the scatter
does not appear increasing or decreasing across the fitted values. That evidence clearly supports
that the variance in the error term is constant.
5. CONCLUSIONS AND RECOMMENDATIONS
Unemployment is one of the foremost globalized problems particularly in fewer developed
countries. It has been very stable problem and remnants difficult to cope in many countries.
Unemployment can be viewed from various dimensions but this paper emphasizes on the determinants
of unemployment. Our finding depicts that foreign direct investment, inflation and labor force are those
International Journal of Asian Social Science, 2014, 4(12): 1163-1175
© 2014 AESS Publications. All Rights Reserved.
1174
variables that are statistically significant with unemployment. Foreign direct investment and inflation
revealed negative relation with unemployment while labor force illustrated positive affect on
unemployment.
To defense and repossess unemployment from rising, it is necessary to take immediate
remedial measures so that economy of Pakistan could withstand this reprehensible scourge. The
final recommendations of the paper are:
Increase in GDP in such a way that it reveals increase in the employment opportunities,
investment and productivity. Through this, economy growth will boost rapidly.
To do operation against black marketers who stock the commodities and then sale with
high rates, which is the main cause of inflation in Pakistan.
All possible steps are needed to capture investor from abroad because FDI plays very
vital role in decreasing unemployment. Government should try attracting foreign
investor.
REFERENCES
Ahmad, S. and A.M. Cheema, 2011. Pakistan employment trends. SLIC building, Plot # 5 F-6/4, Blue area,
Islamabad: Pakistan Bureau of Statistics.
Akaike, H., 1974. A new look at the statistical model identification. IEEE Transactions on Automatic Control:
716-723.
Aladkhani, A.V., 2003. The causes of unemployment in Iran. International Journal of Applied Business and
Economic Research: 21-33.
Amos, O., 1995. Structural slumps. Southern Economic Journal, 61.
Bozdogan, H., 1987. Model selection and Akaike's information criterion (AIC): The general theory and its
analytical extensions. Psychometrika, 52(3): 345-370.
Bozdogan, H., 2000. Akaike's information criterion and recent developments in information complexity.
Journal of Mathematical Psychology, 44(1): 62-91.
Casares, M., A. Moreno and J. Vázquez, 2012. An estimated new Keynesian model with unemployment as
excess supply of labor. Working Paper No.01/12: 1-45.
Durbin, J. and G. Watson, 1971. Testing for serial correlation in least squares regression. Biometrika, 3(58):
1–19.
Eita, J.H. and J.M. Ashipala, 2010. October. Determinants of unemployment in Namibia. International Journal
of Business and Management, 5(10): 92-104.
Foley, M.C., 1997. Determinants of unemployment duration in Russia. Economic Growth Center. Yale
University.
Gillani, S.Y., R.E. Khan and A.R. Gill, 2011. Unemployment and property crimes in Pakistan. Asian
Economic and Financial Review, 1(3): 124-133.
Hou, X., 2011. Challenges for youth employment in Pakistan. Policy Research Working Paper No. 5544. The
World Bank South Asia Region, Human Development Unit.
International Labour Force Survey, 2010-11. Available from http://www.pbs.gov.pk/content/labour-force-
survey-2010-11.
International Journal of Asian Social Science, 2014, 4(12): 1163-1175
© 2014 AESS Publications. All Rights Reserved.
1175
International Labour organization, 2001. Islamabad, Pakistan: Federal Bureau of Statistics.
Jarque, C.M. and A.K. Bera, 1987. A test for naormality of observations and regression residuals.
International Statistical Review, 55(2): 163-172.
Katria, S., N.A. Bhutto, F. Butt, A.A. Domki, H.A. Khawaja and J. Khalid, 2011. Trade off between inflation
and unemployment. International Conference on Business Management. pp: 1-18.
Keynes, J.M., 1936. The general theory of employment, interest and money. New York: Macmillan
Cambridge University Press.
Kooros, S.K., 2000. In A. A. Biberman, The theory of unemployment reassert year book. New York:
University Press.
Kupets, O., 2005. Determinants of unemployment duration in Ukraine. Moscow: Economics Education and
Research Consortium Working Paper Series.
Kyei, K.A. and K.B. Gyekye, 2011. Determinants of unemployment in limpopo province in South Africa:
Exploratory studies. Journal of Emerging Trends in Economics and Management Sciences, 2(1): 54-
61.
Mahmood, Z., N. Akhtar, M. Amin and M. Idrees, 2011. Causes of unemployment among the educated
segment in Peshawar Division, Pakistan: A statistical study. Sarhad J. Agric., 27(1): 139-142.
McIntyre, S.H., D.B. Montgomery, V. Srinivasan and B. Weitz, 1981. The statistical significance of stepwise
regression models developed by forward selection: A monte Carlo Calibration. Research Paper No.
624, Graduate School of Business Stanford University.
Mortensen, D.T. and C.A. Pissaride, 1994. July. Job creation and job destruction in the theory of
unemployment. Oxford University Press and The Review of Economic Studies Ltd, 61(3): 397-415.
Pakistan Bureau of Statistics, 2011. Available from http://www.pbs.gov.pk.
Phelps, E., 1995. The structuralist theory of unemployment. American Economic Review, 85(2): 22-26.
Phillips, A.W., 1967. The rationale between the unemployment rate and the rate of change in money wage in
United Kingdom. Journal of Economical: 283-299.
Qayyum, W., 2007. Causes of youth unemployment in Pakistan. The Pakistan Development Review, 46: 611-
621.
Rafiq, M., I. Ahmad, A. Ullah and Z. Khan, 2008. Determinantsof unemployment. A case study of Pakistan
economy (1998-2008). Abasyn Journal of Social Sciences, 3(1).
Schwarz, G.E., 1978. Estimating the dimension of a model. Annals of Statistics: 461-464.
Subhan, Q.A. and M.A. Hayat, 2008. Effect of price instability on unemployment and economic growth in
Pakistan. Islamabad, Pakistan: Department of Management Sciences Bahria University Islamabad,
Pakistan.
Tintner, G., 1965. Econometrics. New York: Wiley.
White, H., 1980. May. A heteroskedasticity-consistent covariance matrix and a direct test for
heteroskedasticity. Econometrica, 48(4): 817-838.
Views and opinions expressed in this article are the views and opinions of the authors, International Journal of Asian
Social Science shall not be responsible or answerable for any loss, damage or liability etc. caused in relation to/arising
out of the use of the content.