Embed Size (px)
Citation preview
DETERMINATION OF ROUGHNESS COEFFICIENTS FOR STREAMS IN WEST-CENTRAL FLORIDA
By Denis F. Gillen
U.S. GEOLOGICAL SURVEY
Open-File Report 96-226
Prepared in cooperation with the
SOUTHWEST FLORIDA WATER MANAGEMENT DISTRICT
Tampa, Florida
1996
U.S. DEPARTMENT OF THE INTERIOR
BRUCE BABBITT, Secretary
U.S. GEOLOGICAL SURVEY
Gordon P. Eaton, Director
The use of brand, firm, or trade names in this report is for identification purposes only and does
not constitute endorsement by the U.S. Geological Survey.
For additional information write to from:
District ChiefU.S. Geological SurveySuite 3015227 North Bronough StreetTallahassee, Florida 32301
Copies of this report can be purchased
U.S. Geological Survey Branch of Information Services Box 25286 Denver, Colorado 80225-0286
CONTENTS
Abstract ............................................................................................................................................................. 1
Introduction....................................................................................................................................................... 2
Acknowledgments............................................................................................................................................. 3
Description of Study Area ................................................................................................................................ 3
Methods of Study .............................................................................................................................................. 5
Hydraulic Principles................................................................................................................................ 7
Site Selection .......................................................................................................................................... 13
Data Collection ....................................................................................................................................... 13
Water-Surface Profiles .................................................................................................................. 13
Stream Discharge .......................................................................................................................... 15
Channel Geometry ........................................................................................................................ 15
Streambed Particle Size ................................................................................................................ 16
Photographs .................................................................................................................................. 18
Streambank Vegetation.................................................................................................................. 18
Data Computation Procedure .................................................................................................................. 19
Analysis of Roughness Coefficient Data........................................................................................................... 20
Hydraulic Radius..................................................................................................................................... 20
Water-Surface Slope ................................................................................................................................ 22
Streambank Vegetation............................................................................................................................ 23
Assessment of Published Equations......................................................................................................... 25
Procedure for Estimating Roughness Coefficients for West-Central Florida Streams ...................................... 30
Quantitative Methods............................................................................................................................... 30
Use of Photographs.................................................................................................................................. 37
Summary and Conclusions ................................................................................................................................ 38
Selected References........................................................................................................................................... 39
Appendix: Presentation of Site Information ..................................................................................................... 41
Payne Creek near Bowling Green ........................................................................................................... 42
Peace River at Zolfo Springs .................................................................................................................. 47
Horse Creek near Myakka Head ............................................................................................................. 52
South Creek near Vamo .......................................................................................................................... 57
111
CONTENTS-Continued
Walker Creek near Sarasota .................................................................................................................... 62
Bullfrog Creek near Wimauma ............................................................................................................... 67
Delaney Creek near Tampa ..................................................................................................................... 74
Baker Creek at Mclntosh Road near Antioch ......................................................................................... 79
Anclote River near Elfers ........................................................................................................................ 84
Withlacoochee River at Wysong Dam at Carlson.................................................................................... 89
FIGURES
1. Map showing location of the study area and study sites ........................................................................ 4
2. Sketch showing plan view of a hypothetical channel and flood plain ................................................... 6
3. Definition sketch of an open-channel flow reach ................................................................................... 9
4. Graph showing relation of stream power and median grain size to flow regime.................................... 12
5. Diagram showing a crest-stage gage ...................................................................................................... 14
6-8. Graph showing:
6. Relation between hydraulic radius and Manning's roughness coefficient for streams with similar
hydraulic characteristics................................................................................................................. 21
7. Relation between Manning's roughness coefficient and water-surface slope................................ 22
8. Relation between Manning's roughness coefficient and hydraulic radius showing the
effect of streambank vegetation..................................................................................................... 24
9. Roughness evaluation form..................................................................................................................... 31
10-12. Payne Creek near Bowling Green:
10. Plan sketch and cross-section plots................................................................................................ 44
11. Relation of Manning's roughness coefficient to discharge, hydraulic radius, and water-surface
slope .............................................................................................................................................. 45
12. Photographs of channel.................................................................................................................. 46
13-15. Peace River at Zolfo Springs:
13. Plan sketch and cross-section plots ............................................................................................... 49
14. Relation of Manning's roughness coefficient to discharge, hydraulic radius, and water-surface
slope............................................................................................................................................... 50
15. Photographs of channel.................................................................................................................. 51
iv
FIGURES-Continued
16-18. Horse Creek near Myakka Head:
16. Plan sketch and cross-section plots................................................................................................ 54
17. Relation of Manning's roughness coefficient to discharge, hydraulic radius, and water-surface
slope .............................................................................................................................................. 55
18. Photographs of channel.................................................................................................................. 56
19-21. South Creek near Vamo:
19. Plan sketch and cross-section plots................................................................................................ 59
20. Relation of Manning's roughness coefficient to discharge, hydraulic radius, and water-surface
slope .............................................................................................................................................. 60
21. Photographs of channel.................................................................................................................. 61
22-24. Walker Creek near Sarasota:
22. Plan sketch and cross-section plots................................................................................................ 64
23. Relation of Manning's roughness coefficient to discharge, hydraulic radius, and water-surface
slope .............................................................................................................................................. 65
24. Photographs of channel.................................................................................................................. 66
25-27. Bullfrog Creek near Wimauma:
25. Plan sketch and cross-section plots................................................................................................ 69
26. Relation of Manning's roughness coefficient to discharge, hydraulic radius, and water-surface
slope .............................................................................................................................................. 71
27. Photographs of channel.................................................................................................................. 72
28-30. Delaney Creek near Tampa:
28. Plan sketch and cross-section plots................................................................................................ 76
29. Relation of Manning's roughness coefficient to discharge, hydraulic radius, and water-surface
slope .............................................................................................................................................. 77
30. Photographs of channel.................................................................................................................. 78
FIGURES-Continued
31-33. Baker Creek at Mclntosh Road near Antioch:
31. Plan sketch and cross-section plots................................................................................................ 81
32. Relation of Manning's roughness coefficient to discharge, hydraulic radius, and water-surface
slope .............................................................................................................................................. 82
33. Photographs of channel.................................................................................................................. 83
34-36. Anclote River near Elfers:
34. Plan sketch and cross-section plots................................................................................................ 86
35. Relation of Manning's roughness coefficient to discharge, hydraulic radius, and water-surface
slope .............................................................................................................................................. 87
36. Photographs of channel.................................................................................................................. 88
37-39. Withlacoochee River at Wysong Dam at Carlson:
37. Plan sketch and cross-section plots................................................................................................ 91
38. Relation of Manning's roughness coefficient to discharge, hydraulic radius, and water-surface
slope .............................................................................................................................................. 92
39. Photographs of channel.................................................................................................................. 93
TABLES
1. Summary of bed material particle size data for study sites in west-central Florida............................ 16
2. Comparison of bed material particle size data from previous studies................................................. 18
3. Published w-value equations ............................................................................................................... 25
4. Best estimates of n values computed from study-site data for high within-bank flows with less than
70 percent of cross-section area vegetated......................................................................................... 28
5. Best estimates of n values computed from study-site data for high within-bank flows with more than
70 percent of cross-section area vegetated.......................................................................................... 29
6. Base values of Manning's roughness coefficient, n, for sand channels............................................... 32
7. Adjustment values for factors that affect the roughness of a channel................................................. 34
VI
CONVERSION FACTORS, VERTICAL DATUM, AND ABBREVIATIONS
Multiply By To obtain
inch (in.)foot (ft)foot per foot (ft/ft)foot per second (ft/s)square foot (ft2 )square mile (mi2 )cubic foot per second (ft 3/s)foot-pounds per second (ft-lbs/s)second
25.400.30480.30480.30480.09292.5900.028320.1383
millimetermetermeter per metermeter per secondsquare metersquare kilometercubic meter per secondkilogram-meters per
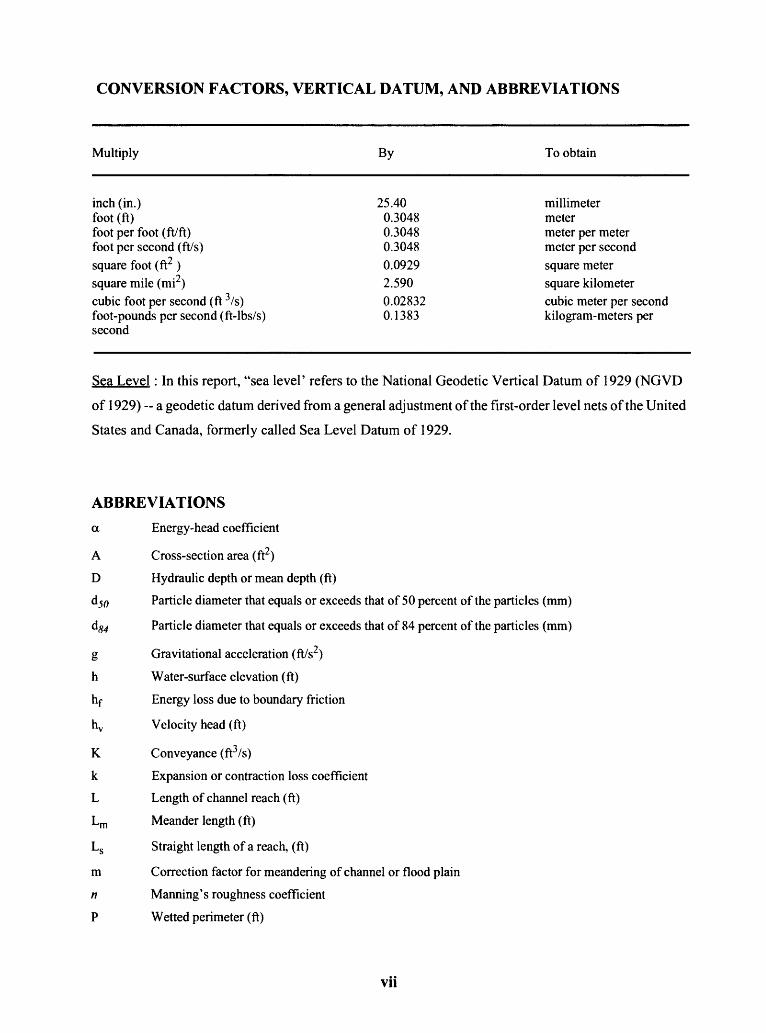
Sea Level: In this report, "sea level' refers to the National Geodetic Vertical Datum of 1929 (NGVD
of 1929) a geodetic datum derived from a general adjustment of the first-order level nets of the United
States and Canada, formerly called Sea Level Datum of 1929.
ABBREVIATIONS
a Energy-head coefficient
A Cross-section area (ft2 )
D Hydraulic depth or mean depth (ft)
d5f) Particle diameter that equals or exceeds that of 50 percent of the particles (mm)
d^ Particle diameter that equals or exceeds that of 84 percent of the particles (mm)
g Gravitational acceleration (ft/s2)
h Water-surface elevation (ft)
hf Energy loss due to boundary friction
hv Velocity head (ft)
K Conveyance (ft3 /s)
k Expansion or contraction loss coefficient
L Length of channel reach (ft)
Lm Meander length (ft)
Ls Straight length of a reach, (ft)
m Correction factor for meandering of channel or flood plain
n Manning's roughness coefficient
P Wetted perimeter (ft)
Vll
ABBREVIATIONS -Continued
Q Discharge (ft3/s)
R Hydraulic radius of channel cross-section (ft)
Sf Friction slope (ft/ft)
Sw Slope of the water-surface profile (ft/ft)
SP Stream power [(ft-lb/syft2]
T Top width of stream channel (ft)
V Mean velocity (ft/s)
Vlll
DETERMINATION OF ROUGHNESS
COEFFICIENTS FOR STREAMS IN
WEST-CENTRAL FLORIDA
By Denis F. Gillen
ABSTRACT
Physical and hydraulic characteristics are presented for 10 west-central Florida stream
reaches. These may be used as reference reaches for estimating Manning's roughness coefficient,
n, in similar rivers and channels. Discharge in these reaches ranged from 1.8 to 3,010 cubic feet
per second and water-surface slope ranged from 0.00002 to 0.00476 foot per foot. Sites were
selected at or near U.S. Geological Survey streamflow gaging stations at which the stage-
discharge relations were relatively stable. Crest-stage gages were installed at appropriate
locations in each study reach in order to obtain water-surface elevations.
Water-surface profiles were collected over a range of discharges at each of the 10 sites and
the roughness coefficient was computed for each discharge. For the 104 recorded streamflow
events used in this report, the computed roughness coefficients ranged from 0.021 to 0.218 and
the mean was 0.072. The median n value was 0.060; 70 percent of the time the n value was
greater than 0.047 and 80 percent of the time the computed n was greater than 0.043. Bed
material is so uniform at sites throughout west-central Florida that there is negligible variation in
roughness as a result of variation in bed material. Streambank vegetation appears to be the major
contributor to variations in roughness values for streams in west-central Florida.
Channel roughness can be estimated quantitatively by evaluating the interaction of all
roughness factors. Photographs of sites where n values have been computed can be used for
comparison to estimate values at similar sites. Using a base n value of 0.040 and increasing n for
factors of vegetation, channel obstructions, and other factors provides the best determination ofn
values for streams in west-central Florida.
INTRODUCTION
Hydraulic calculations to determine flow in open channels require an evaluation of all
characteristics that affect the roughness of the main channel. The Manning's roughness
coefficient, «, is used to describe the flow resistance or relative roughness of a channel and is a
function of the bed material, depth of flow, cross-section geometry, channel variations,
obstructions to flow, type and density of vegetation, and degree of channel meandering. Term n
appears in the general Manning equation for open-channel flow. The Manning equation, along
with energy and continuity equations, can be used for the indirect computations of streamflow
and has applications in flood-engineering studies, bridge and highway design, or other hydraulic
computations.
Extensive guidelines for the selection of roughness characteristics are available (Cowan,
1956; Chow, 1959; Aldridge and Garrett, 1973; Arcement and Schneider, 1989; Jarrett, 1985;
Coon, 1995). However, these studies for the field verification of roughness coefficients have not
included the low-gradient channels and densely vegetated overbank areas that are characteristic of
west-central Florida. The selection of roughness coefficients for stream channels and the
overbank areas common to west-central Florida has been a subjective art rather than a quantitative
science. The ability to determine roughness coefficients for natural channels representing a wide
range of conditions needs to be developed through experience. Experience can be obtained in
several ways, namely (1) understanding the factors that affect the value of the roughness
coefficient, and thus acquiring a basic knowledge of the problem, (2) consulting and using a table
of typical roughness coefficients for channels, and (3) examining and becoming acquainted with
the appearance of some typical channels whose roughness coefficients are known.
Photographs of channels with known H-values are useful in estimating the roughness
coefficients of similar channels. The photographs and data presented in this report cover a wide
range of conditions. Familiarity with channel geometry, appearance, and roughness coefficients
of these channels will improve the ability to select roughness coefficients for other similar
channels.
ACKNOWLEDGMENTS
The author gratefully acknowledges the assistance of Jim Mann and Tom Harrison of the
Southwest Florida Water Management District for help with project planning and data collection
reviews. The assistance of Kathleen Hammett, John Coffin, William Kaehrle, and William Coon,
hydrologists with the U.S. Geological Survey, in designing and conducting data collection
activities and providing technical guidance is greatly appreciated.
DESCRIPTION OF STUDY AREA
^
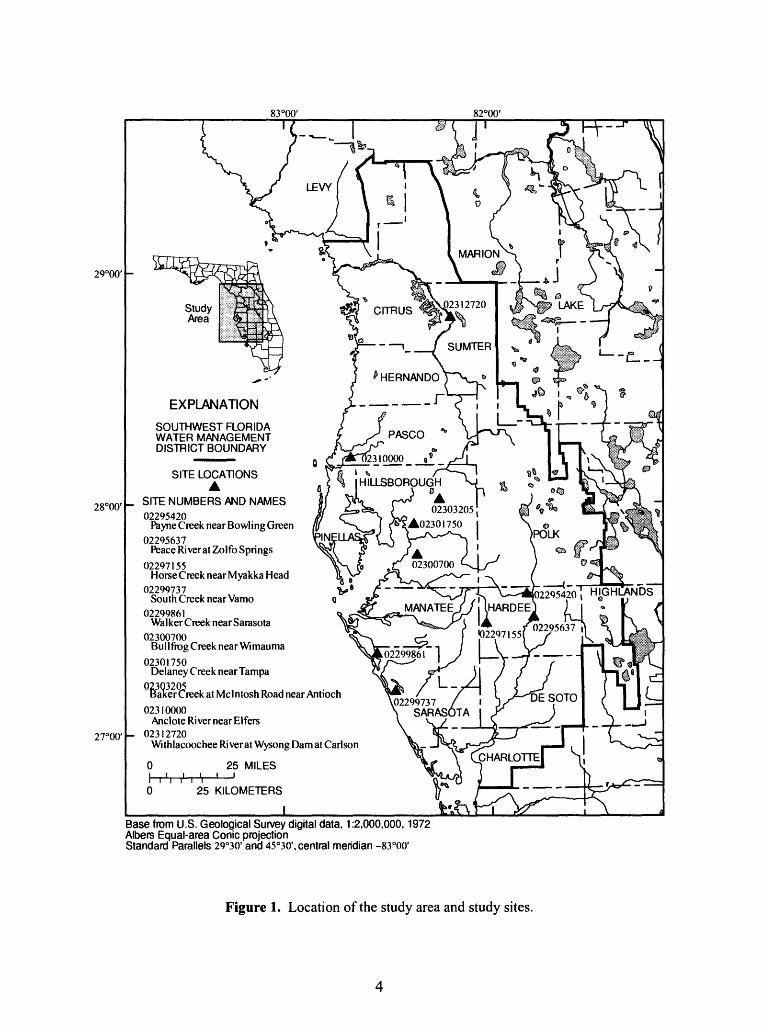
The study area covers approximately 10,000 mi and includes all or part of 16 counties of
west-central Florida (fig. 1). Included are all basins draining into the Gulf of Mexico from the
Withlacoochee River on the north to the Peace River on the south.
The west-central Florida area lies within two of the five natural topographic regions of
Florida ~ the Coastal Lowlands and the Central Highlands. Land-surface elevations in the study
area range from sea level in the Coastal Lowlands to just over 300 ft above sea level in the Central
Highlands. The two regions consist of low, nearly level plains and gently undulating to rolling
areas with many ponds, swamps, and marshes as well as numerous lakes and perennial streams. A
topographic high, which contains the headwaters of several major rivers, exists in the central part
of the study area.
The climate is characterized by warm, humid summers and mild, moderately dry winters.
Variation in land-surface elevations has little effect on the overall climate of the study area. The
proximity to the sea and numerous wetland areas contributes to the humid, temperate climate.
For most streams in west-central Florida, roughness characteristics are significantly affected
by streambank vegetation. At the study sites, streambank vegetation ranged from grasses along
the banks at Delaney Creek near Tampa to dense ground cover and vines along with very
prominent cypress trees and knees at Anclote River near Elfers. Two sites, South Creek near
Vamo and Withlacoochee River at Wysong Dam at Carlson, had considerable in-stream
vegetation during the study period.
83°00' 82°00'
29°00'
28°00'
27°00'
EXPLANATION
SOUTHWEST FLORIDA WATER MANAGEMENT DISTRICT BOUNDARY
02299861"] ) |_J
02299737 / I SARASOTA I
SITE LOCATIONSA
SITE NUMBERS AND NAMES02295420
Rayne Creek near Bowling Green02295637
Peace RiveratZolfo Springs02297155
Horse Creek near Myakka Head02299737
South Creek near Vamo02299861
Walker Creek nearSarasota02300700
Bullfrog Creek near Wimauma02301750
Delaney Creek near Tampa02303205
Baker Creek at Mclntosh Road near Antioch02310000
Anclote River near Elfers 02312720
Withlacoochee River at Wysong Dam at Carlson
25 MILES
25 KILOMETERS
Base from U.S. Geological Survey digital data, 1:2,000,000,1972Albers Equal-area Conic projectionStandard Parallels 29°30' and 45°30', central meridian -83°oo'
Figure 1. Location of the study area and study sites.
METHODS OF STUDY
Values of the Manning's roughness coefficient may be assigned for conditions that exist at
the time of a specific flow event, for average conditions over a range in stage, or for anticipated
conditions at the time of a future event. The «-values presented in this report are intended
primarily for use in one-dimensional, open-channel flow applications, such as slope-area
computations of discharge or step-backwater computations of water-surface elevation.
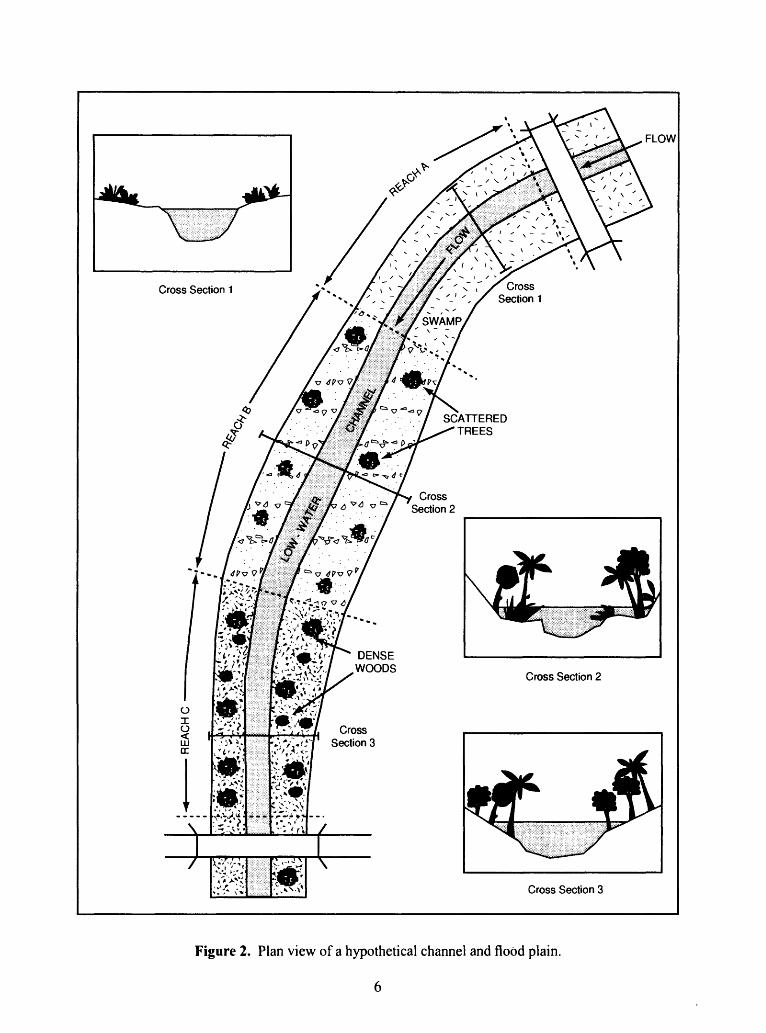
Roughness coefficients apply to a longitudinal reach of channel. A hypothetical channel,
reaches, and cross sections are shown in figure 2. Subreaches of the channel should reflect
representative conditions in that subreach rather than conditions just at the cross section. Cross
sections were located as nearly as possible at right angles to the direction of flow and were
established at locations where the conveyance appeared to vary uniformly between cross sections.
The cross sections of the reach may be of regular geometric shape (such as triangular, trapezoidal,
or semi-circular) or of an irregular shape typical of many natural channels. The flow may be
confined to one or more channels, and, especially during floods, the flow may occur both in the
channel and in the flood plain. Such cross sections are typically divided into sub-sections at points
where major roughness or shape changes occur, such as at the juncture of dense vegetation and
grassy areas or flood plain and main channel. During the period of study for this project, only two
sites had overbank flow. As a result of insufficient overbank data, only within-bank flows were
used to compute roughness coefficients in this study.
FLOW
* , A , ' '.
>V^7| Cross J-, */>"-"/' Section 3
Cross Section 3
Figure 2. Plan view of a hypothetical channel and flood plain.
6
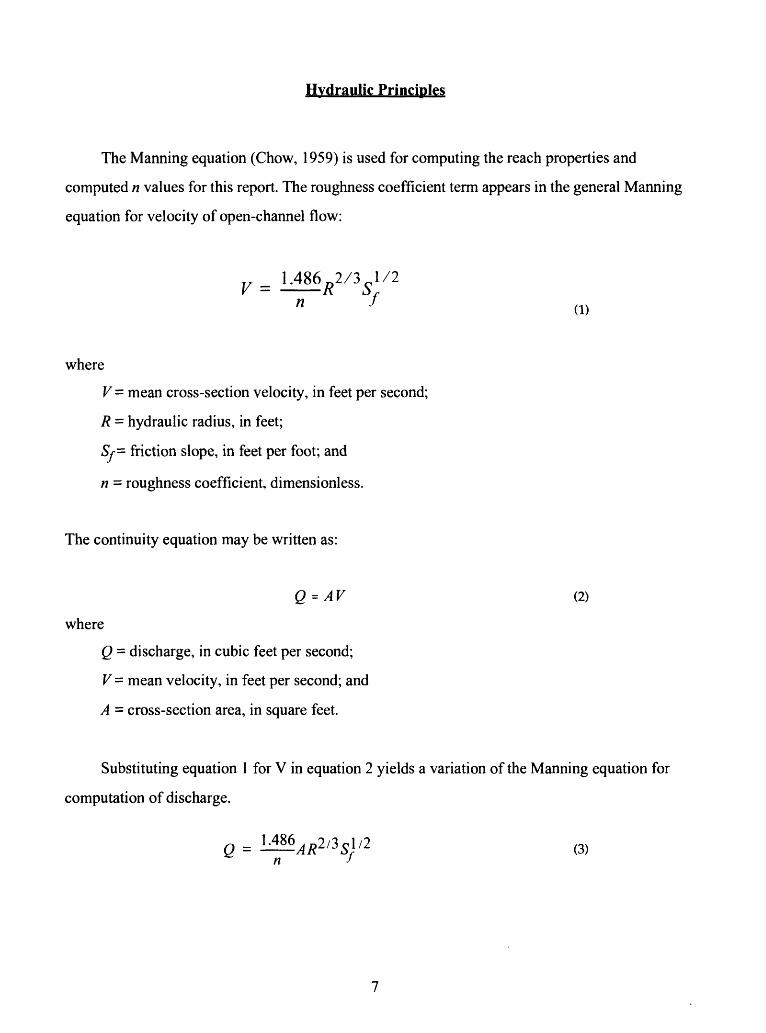
Hydraulic Principles
The Manning equation (Chow, 1959) is used for computing the reach properties and
computed n values for this report. The roughness coefficient term appears in the general Manning
equation for velocity of open-channel flow:
v =n f
where
V= mean cross-section velocity, in feet per second;
R = hydraulic radius, in feet;
Sf= friction slope, in feet per foot; and
n = roughness coefficient, dimensionless.
The continuity equation may be written as:
Q = AV (2)
where
Q = discharge, in cubic feet per second;
V = mean velocity, in feet per second; and
A = cross-section area, in square feet.
Substituting equation 1 for V in equation 2 yields a variation of the Manning equation for
computation of discharge.
J
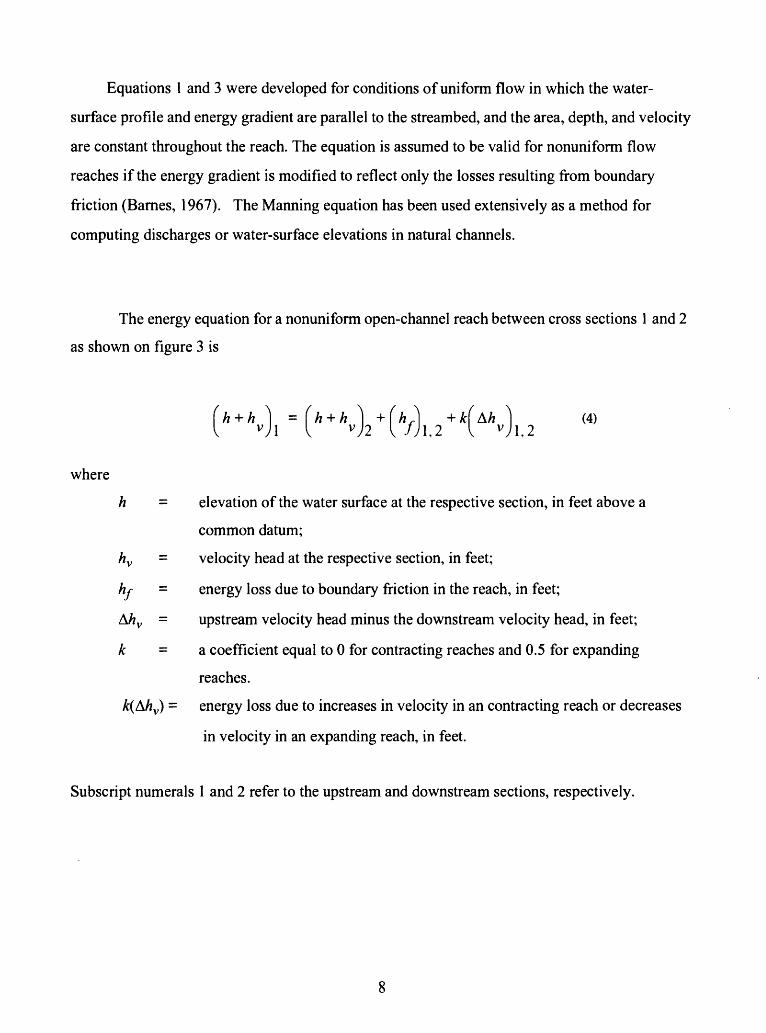
Equations 1 and 3 were developed for conditions of uniform flow in which the water-
surface profile and energy gradient are parallel to the streambed, and the area, depth, and velocity
are constant throughout the reach. The equation is assumed to be valid for nonuniform flow
reaches if the energy gradient is modified to reflect only the losses resulting from boundary
friction (Barnes, 1967). The Manning equation has been used extensively as a method for
computing discharges or water-surface elevations in natural channels.
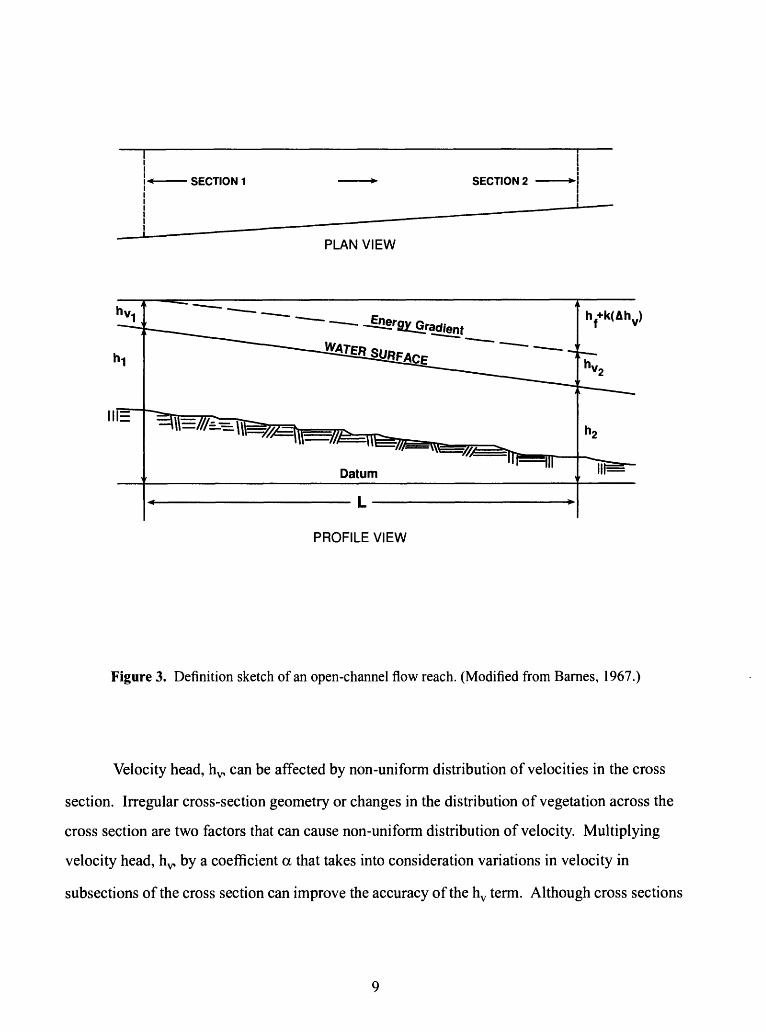
The energy equation for a nonuniform open-channel reach between cross sections 1 and 2
as shown on figure 3 is
h + h = h + h } + h,\ +k A/* (4) v)\ I v )2 I f)\,2 I vJl,2
where
h = elevation of the water surface at the respective section, in feet above a
common datum;
hv = velocity head at the respective section, in feet;
hf = energy loss due to boundary friction in the reach, in feet;
A/*v = upstream velocity head minus the downstream velocity head, in feet;
k = a coefficient equal to 0 for contracting reaches and 0.5 for expanding
reaches.
k(Ahv) = energy loss due to increases in velocity in an contracting reach or decreases
in velocity in an expanding reach, in feet.
Subscript numerals 1 and 2 refer to the upstream and downstream sections, respectively.
PLAN VIEW
h+k<Ahv)
PROFILE VIEW
Figure 3. Definition sketch of an open-channel flow reach. (Modified from Barnes, 1967.)
Velocity head, hy, can be affected by non-uniform distribution of velocities in the cross
section. Irregular cross-section geometry or changes in the distribution of vegetation across the
cross section are two factors that can cause non-uniform distribution of velocity. Multiplying
velocity head, h^ by a coefficient a that takes into consideration variations in velocity in
subsections of the cross section can improve the accuracy of the hv term. Although cross sections
used for this study were not subdivided on the basis of channel geometry or distribution of
vegetation, a basic understanding of the velocity-head coefficient is necessary for general
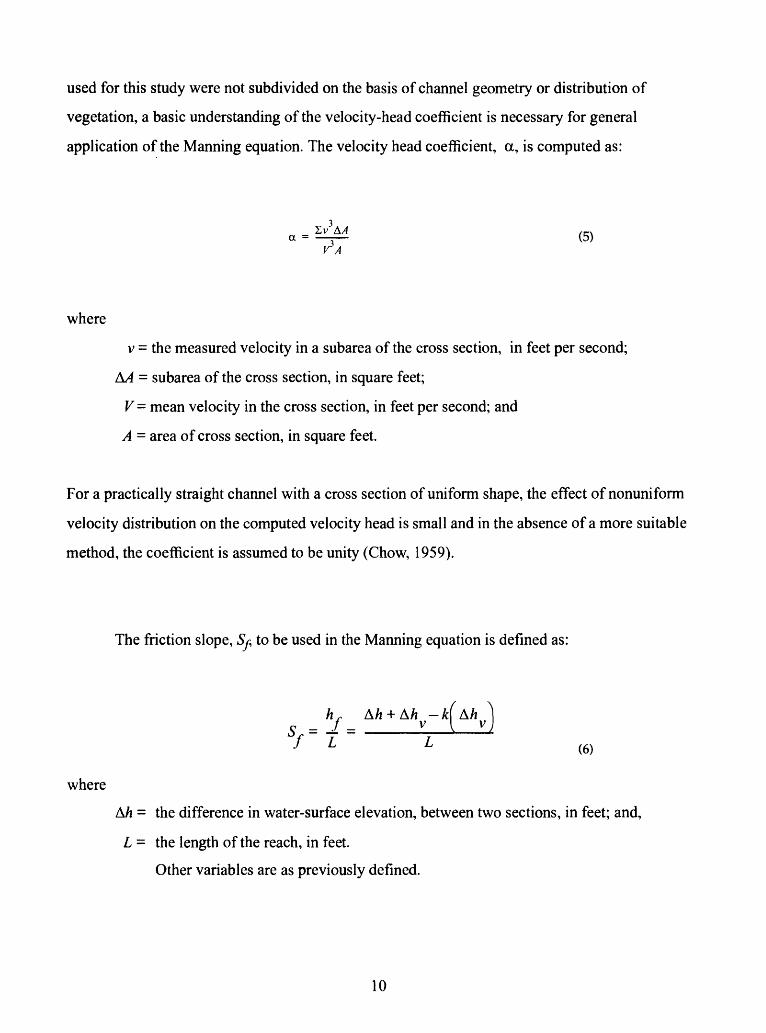
application of the Manning equation. The velocity head coefficient, a, is computed as:
Zv A/4 ,.-.. a = = (5)
\TA
where
v = the measured velocity in a subarea of the cross section, in feet per second;
A/4 = subarea of the cross section, in square feet;
V- mean velocity in the cross section, in feet per second; and
A = area of cross section, in square feet.
For a practically straight channel with a cross section of uniform shape, the effect of nonuniform
velocity distribution on the computed velocity head is small and in the absence of a more suitable
method, the coefficient is assumed to be unity (Chow, 1959).
The friction slope, 5^ to be used in the Manning equation is defined as:
h, A/j + A/i -A/A/*o _ / _ V 1 V
f L L (6)
where
A/z = the difference in water-surface elevation, between two sections, in feet; and,
L = the length of the reach, in feet.
Other variables are as previously defined.
10
The average value of the Manning roughness coefficient was computed for each reach from
the known discharge, the water-surface profile, and the hydraulic properties of the reach as defined
by the cross sections. The equation applicable to a multisection reach of M cross sections which
are designated 1, 2, 3,...M-1, M is:
M =1 AR£\ V* "v 7 I ^" "V 7 kJ \ "-"''v/ | -* V - -' .,/ « T \' VI " »,/ ,i*
.M-oO '1 v M v I. 2 * 2, 3___________* ( M -- I). A^ /T\
Q77Z,
where
Z=ARM
Other variables are as previously defined.
Manning's n was computed for each subreach or combination of cross sections within the
reach. A friction-head weighted average of the n values of the subreaches was computed to
represent the n value for the site. The weighting procedure is described in Jarrett and Petsch (1985).
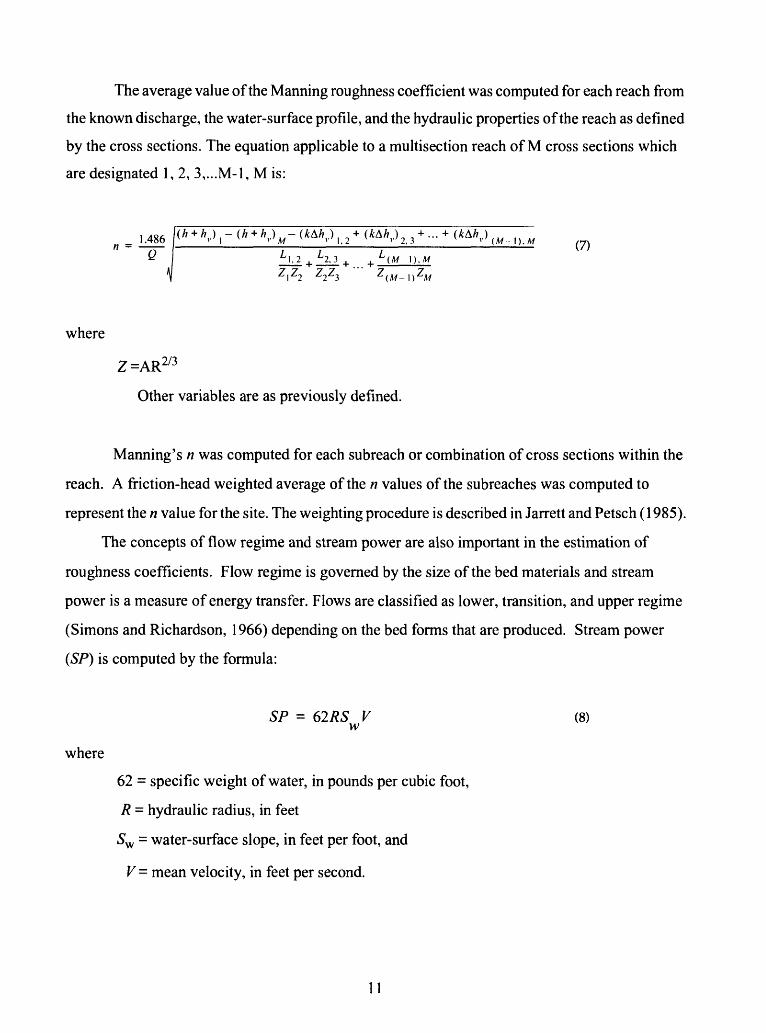
The concepts of flow regime and stream power are also important in the estimation of
roughness coefficients. Flow regime is governed by the size of the bed materials and stream
power is a measure of energy transfer. Flows are classified as lower, transition, and upper regime
(Simons and Richardson, 1966) depending on the bed forms that are produced. Stream power
(SP) is computed by the formula:
SP = 62RS V (8) w
where
62 = specific weight of water, in pounds per cubic foot,
R = hydraulic radius, in feet
5W = water-surface slope, in feet per foot, and
V- mean velocity, in feet per second.
11
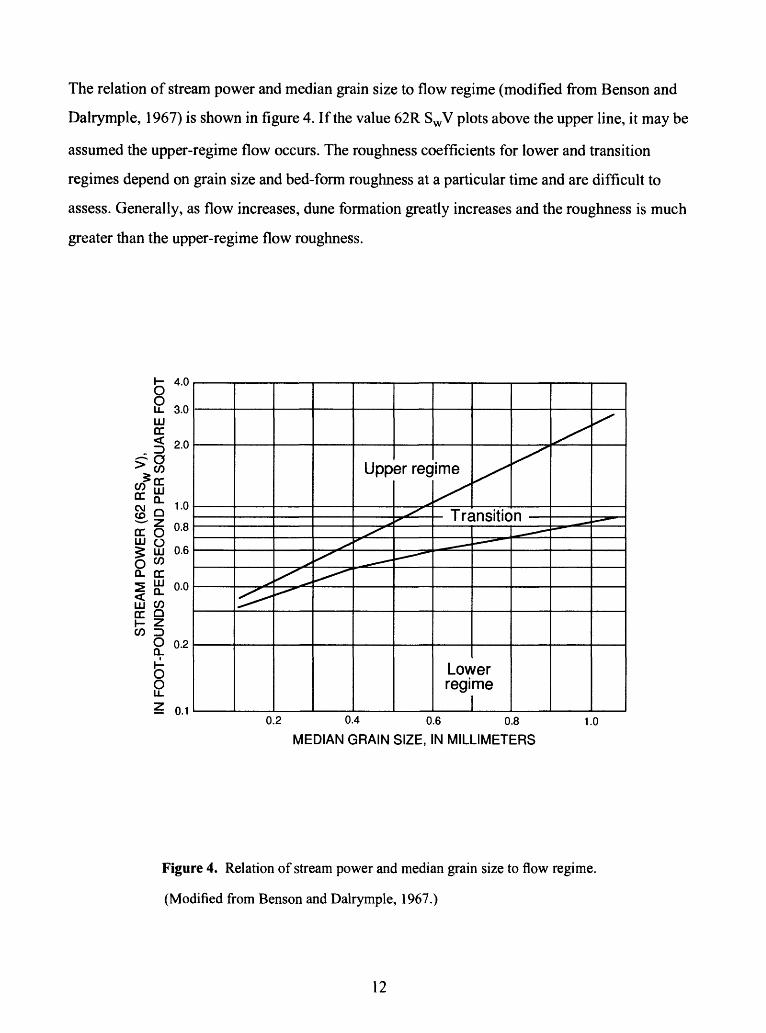
The relation of stream power and median grain size to flow regime (modified from Benson and
Dalrymple, 1967) is shown in figure 4. If the value 62R SWV plots above the upper line, it may be
assumed the upper-regime flow occurs. The roughness coefficients for lower and transition
regimes depend on grain size and bed-form roughness at a particular time and are difficult to
assess. Generally, as flow increases, dune formation greatly increases and the roughness is much
greater than the upper-regime flow roughness.
0.2 0.4 0.6 0.8
MEDIAN GRAIN SIZE, IN MILLIMETERS1.0
Figure 4. Relation of stream power and median grain size to flow regime.
(Modified from Benson and Dalrymple, 1967.)
12
Site Selection
The sites used in this study were selected to meet the following criteria: (1) a U.S.
Geological Survey streamflow-gaging station with a relatively stable stage-discharge relation was
nearby; (2) the study reaches were relatively uniform in shape. The sites selected represent a wide
range of channel types, flow widths and depths, channel slopes, vegetative characteristics, and
roughness conditions and are representative of streams in west-central Florida. Although most
sites had straight channels, there were three ~ Bullfrog Creek, Anclote River, and Horse Creek
with varying degrees of meander, and one Peace River, that curved gently throughout the reach.
It is desireable to avoid sites with expanding reaches so that energy losses due to decreases in
velocity (Eq. 4) can be avoided, but the Bullfrog Creek and South Creek sites each had some
expansion in one subreach. Because velocities in west-central Florida streams tend to be
relatively low, any energy losses due to decreases in velocity in expanding reaches would be
small and were not taken into account in the computations for this report.
Data Collection
Multiple water-surface profiles and stream discharges were obtained at each of the study
sites during 1992-94. A total of 104 measured events were included for analysis in this report.
Channel geometry was surveyed at the beginning of the study and resurveyed if fill or scour within
the reach occurred. Streambed particle size was measured, streambank vegetation identified, and
various perspectives of each reach were photographed. Stream-gaging stations and water-level
(crest-stage) gages were inspected and serviced on a regular basis.
Water-Surface Profiles
Water-surface profiles were computed using both recorded stages from stream-gaging
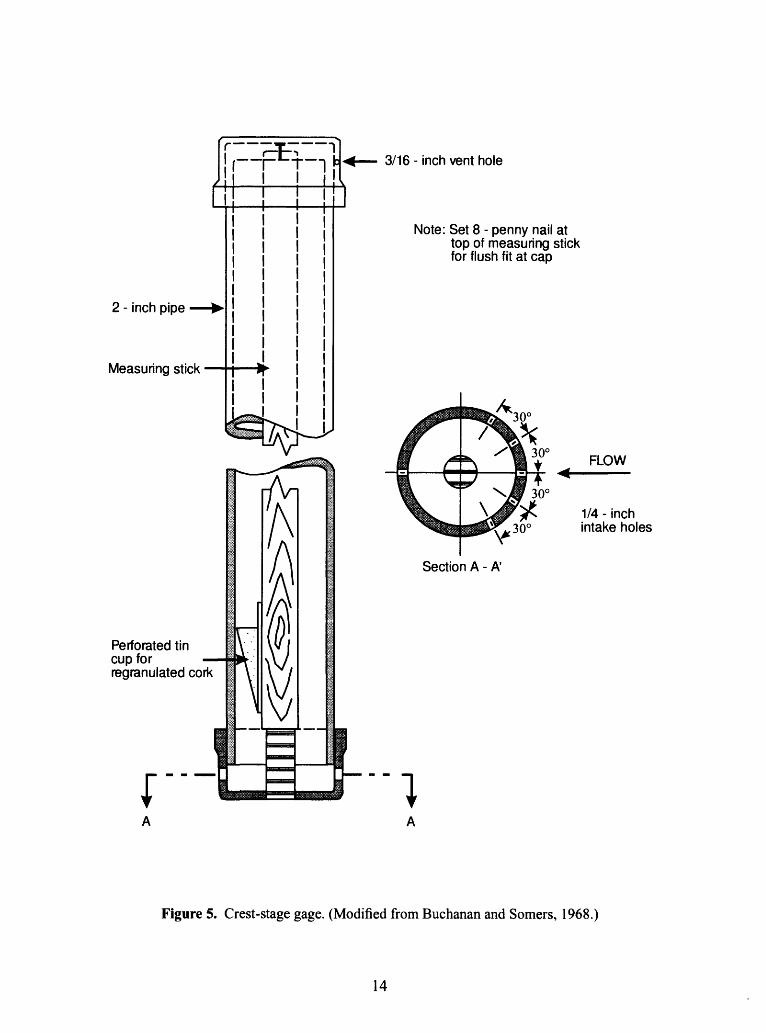
stations and recorded peaks from standard U.S. Geological Survey crest-stage gages (fig. 5). A
crest-stage gage records the peak water-surface elevation during an event by means of a
13
2 - inch pipe
Measuring stick
Perforated tin cup for regranulated cork
3/16 - inch vent hole
Note: Set 8 - penny nail at top of measuring stick for flush fit at cap
1/4 - inch intake holes
Figure 5. Crest-stage gage. (Modified from Buchanan and Somers, 1968.)
14
"corkline" that adheres to a wooden stick inside a 2-in. diameter pipe that has been secured to a
tree or post on the river bank. Granulated cork within the pipe floats on the surface of the water,
which enters the gage through holes in the bottom of the crest-stage gage and rises inside the pipe.
A line of cork granules is left on the wooden stick at a height equal to the peak water-surface
elevation of the stream. The peak stage is obtained by measuring the interval on the staff between
the reference point and the floodmark. The datum of each crest-stage gage was checked by levels
run from a reference mark at a nearby U.S. Geological Survey stream-gaging station. At most
locations, the nearby U.S. Geological Survey stream-gaging station was used to measure water-
surface elevation at one end of the selected reach and a crest-stage gage was used to measure the
water-surface elevation at the opposite boundary of the reach. At Bullfrog Creek and Anclote
River, both the upstream and downstream water-surface elevations of the reach were measured
using crest-stage gages. Some sites had additional crest-stage gages located at intermediate cross
sections to help define the water-surface profile. The water-surface elevation at intermediate cross
sections was determined using a straight line interpolation of the recorded water surfaces from the
upstream and the downstream gages. Water-surface elevations were also obtained from surveys
of high-water marks and by direct measurements of the water-surface elevation from reference
points.
Stream Discharge
The discharge for each recorded water-surface profile was obtained from discharge records
of the nearby U. S. Geological streamflow-gaging station. The stability of the stage-discharge
relation at each site was checked routinely by discharge measurements. Discharges used in the
study ranged from 1.8 ft3/s to 3,010 ft3/s.
Channel Geometry
Channel geometry was surveyed at the beginning of the study and surveys were repeated at
those sites where scour or fill changes were observed in the channel during the study. The cross
sections were chosen to represent typical conditions within each reach. Each site had a minimum
15
of two cross sections; most sites had three or more cross sections. Cross section 3 at Payne Creek
near Bowling Green (02295420) and cross section 1 at Peace River at Zolfo Springs (02295637)
were computed using data from numerous bridge measurements and boat measurements made at
those locations. Examinations of graphic plots for those cross sections showed little, if any,
variation with time. Historical photographs of those same cross sections did not show any major
changes in the vegetation and historical conditions were felt to be similar to current conditions.
Streambed Particle Size
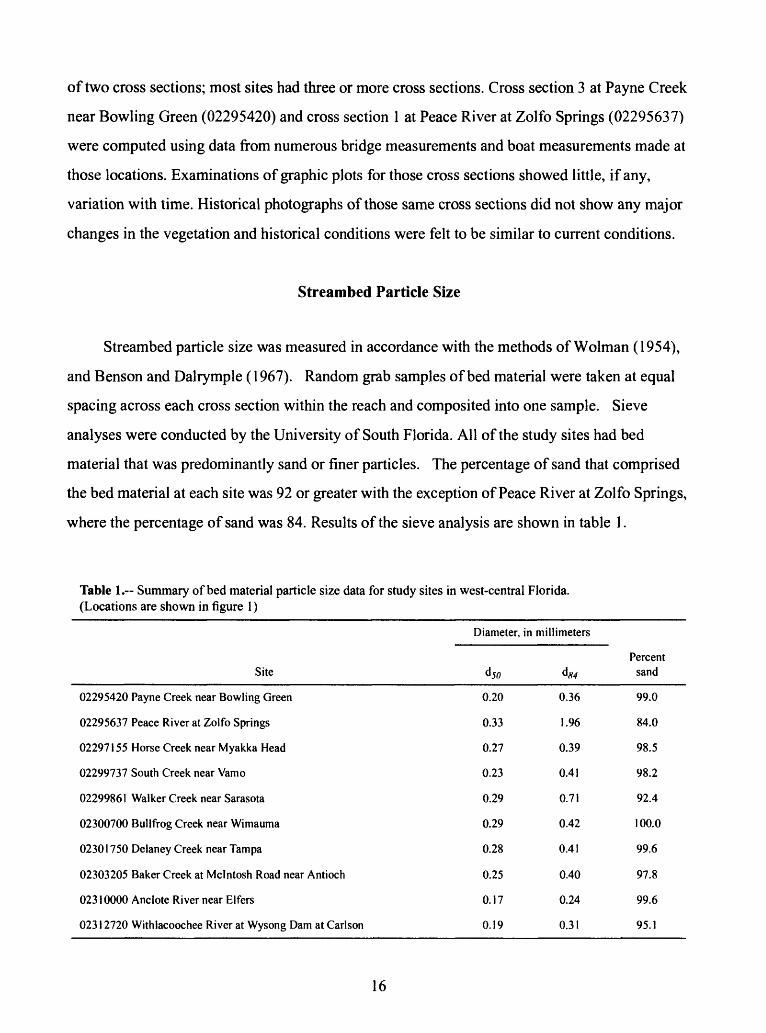
Streambed particle size was measured in accordance with the methods of Wolman (1954),
and Benson and Dalrymple (1967). Random grab samples of bed material were taken at equal
spacing across each cross section within the reach and composited into one sample. Sieve
analyses were conducted by the University of South Florida. All of the study sites had bed
material that was predominantly sand or finer particles. The percentage of sand that comprised
the bed material at each site was 92 or greater with the exception of Peace River at Zolfo Springs,
where the percentage of sand was 84. Results of the sieve analysis are shown in table 1.
Table l.~ Summary of bed material particle size data for study sites in west-central Florida. (Locations are shown in figure 1)
Site
02295420 Payne Creek near Bowling Green
02295637 Peace River at Zolfo Springs
022971 55 Horse Creek near Myakka Head
02299737 South Creek near Vamo
02299861 Walker Creek near Sarasota
02300700 Bullfrog Creek near Wimauma
02301 750 Delaney Creek near Tampa
02303205 Baker Creek at Mclntosh Road near Antioch
02310000 Anclote River near Elfers
023 1 2720 Withlacoochee River at Wysong Dam at Carlson
Diameter, in
d50
0.20
0.33
0.27
0.23
0.29
0.29
0.28
0.25
0.17
0.19
millimeters
<W
0.36
1.96
0.39
0.41
0.71
0.42
0.41
0.40
0.24
0.31
Percent sand
99.0
84.0
98.5
98.2
92.4
100.0
99.6
97.8
99.6
95.1
16
A sand-channel stream is defined as a stream which has an unlimited supply of sand in the
channel bed. Sand, by definition, has a size range from 0.062 to 2 mm. Since the bed material at
each site in this study is predominately sand, the d5f) and d^ values used in this report represent
those corresponding percentiles from the sieve analysis. The smallest sand for which reliable
laboratory tests are available is 0.2 mm. Sand of this size has a Manning's coefficient of 0.012 for
upper regime flow. Aldridge and Garrett (1973) extrapolated the laboratory data and concluded
that 0.1 mm sand has a base Manning's n value of 0.010.
While most studies of Manning's n use bed material size as one of the major contributors to
roughness determinations, bed material in west-central Florida streams is so similar from site to
site that the effect of variations in streambed particle size on differences in roughness coefficients
is negligible. A comparison of the bed material analyses from other studies is shown in table 2.
The data illustrate the uniqueness of streams in west-central Florida as compared to other regions.
A study of 21 Colorado streams (Jarrett, 1985) included statistical size distribution of the
intermediate diameter of bed material. The range of the d50 percentile was 62 to 427 mm (0.2 to
1.4 ft). For the 10 west-central Florida streams used in this study, the range of the d5f) percentile
was 0.17 to 0.33 mm (0.0006 to 0.0011 ft). Using the d84 percentile the range for the 21 Colorado
streams was from 91 to 792 mm (0.3 to 2.6 ft), while the west-central Florida streams had a range
for the d84 percentile of 0.24 to 1.96 mm (0.0008 to 0.0064 ft). Measurements of streambed
particle size for 78 New Zealand streams (Hicks and Mason, 1991) indicated only eight of the
streams had a d^Q of less than 2 mm. Six of those eight streams had particle-size-analysis data;
particle sizes for two were estimated. The average d5f) for the six streams where data were
available was 0.82 mm (0.0064 ft); the d50 ranged from 0.33 to 1.18 mm (0.0011 to 0.0039 ft).
17
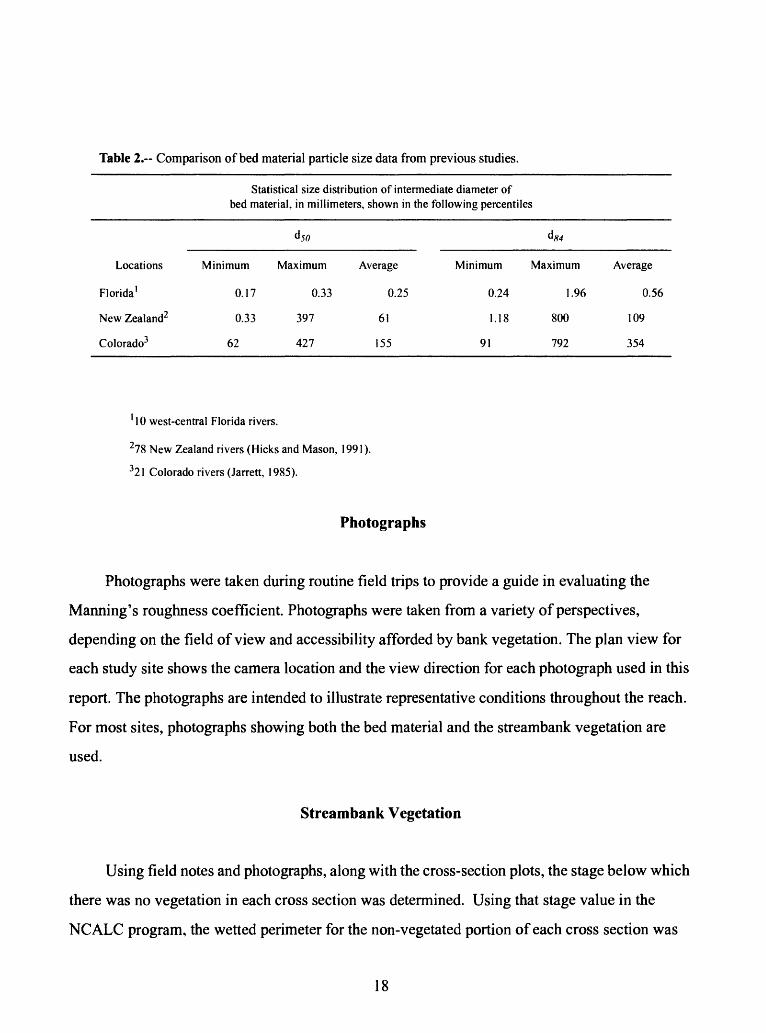
Table 2.-- Comparison of bed material particle size data from previous studies.
Statistical size distribution of intermediate diameter of bed material, in millimeters, shown in the following percentiles
Locations
Florida 1
New Zealand2
Colorado3
Minimum
0.17
0.33
62
d5«
Maximum
0.33
397
427
Average
0.25
61
155
<to
Minimum Maximum
0.24 1.96
1.18 800
91 792
Average
0.56
109
354
1 10 west-central Florida rivers.
278 New Zealand rivers (Hicks and Mason, 1991).
321 Colorado rivers (Jarrett, 1985).
Photographs
Photographs were taken during routine field trips to provide a guide in evaluating the
Manning's roughness coefficient. Photographs were taken from a variety of perspectives,
depending on the field of view and accessibility afforded by bank vegetation. The plan view for
each study site shows the camera location and the view direction for each photograph used in this
report. The photographs are intended to illustrate representative conditions throughout the reach.
For most sites, photographs showing both the bed material and the streambank vegetation are
used.
Streambank Vegetation
Using field notes and photographs, along with the cross-section plots, the stage below which
there was no vegetation in each cross section was determined. Using that stage value in the
NCALC program, the wetted perimeter for the non-vegetated portion of each cross section was
18
computed. The vegetated wetted perimeter was computed by subtracting the value of the non-
vegetated wetted perimeter from the total wetted perimeter for each cross section. The percentage
of vegetated wetted perimeter used for each site represents the average of all the cross sections at
that site.
Data Computation Procedure
In this study, Manning's equation was used to compute n based on a known discharge.
Cross-section elevations, water-surface elevations and their associated discharges were input to
NCALC; the n calculation computer program developed by Jarrett and Petsch (1985). For each
water-surface profile and discharge, the roughness coefficient for every combination of cross
sections and for the entire reach, along with the hydraulic properties for each cross section were
computed. Hydraulic data as well as the resulting computed roughness coefficient for each
discharge and water-surface profile, are presented with the site information. The tabulated values
for area, top width, hydraulic radius, and velocity are averages of values computed for each cross
section within a reach. In addition, Manning's n was computed for each individual subreach and
combinations of cross sections within the reach. A friction-head weighted average value of n was
used to represent the average conditions at each site.
Caution must be exercised when using the NCALC software to compute the n value. Just as
the computational process for calculating discharge using the slope-area method (Dalrymple and
Benson, 1967) is subject to assumptions and limitations, so too is the NCALC procedure. One
assumption of the method is that there is uniform (or near uniform) flow distribution and
conveyance with uniform energy losses across the section. When this is not found in nature, the
method requires calculation of a composite n value to account for within-bank variations in
roughness. Davidian (1984) discusses subdivision of cross sections. For overbank areas, cross
sections are subdivided into unit shapes that have complete or nearly complete wetted perimeters
(or into areas of consistent "roughness," such as an area of denser, more resistive vegetation). A
channel with overbank flow would be subdivided at the top of the bank (regardless of whether a
change in vegetative "roughness" was evident). If a panhandle section is not properly subdivided,
the computed n value will be erroneously low, which results from an erroneously low hydraulic
19
radius value. For higher stage calculations made on unsubdivided cross sections, the computed n
value will be lower than it otherwise would be and reflects not a decrease in energy losses, but a
limitation of the NCALC procedure.
ANALYSIS OF ROUGHNESS COEFFICIENT DATA
One hundred and four data sets (water-surface profiles and discharges) were obtained from
10 study sites in the west-central Florida area. Manning's roughness coefficients were computed
for each individual event. The hydraulic data and computed roughness coefficients were used (1)
to evaluate the change in the n value with discharge, hydraulic radius, slope, and vegetation; (2)
and to compare the differences in the relation of n value to hydraulic radius at individual sites.
Hydraulic Radius
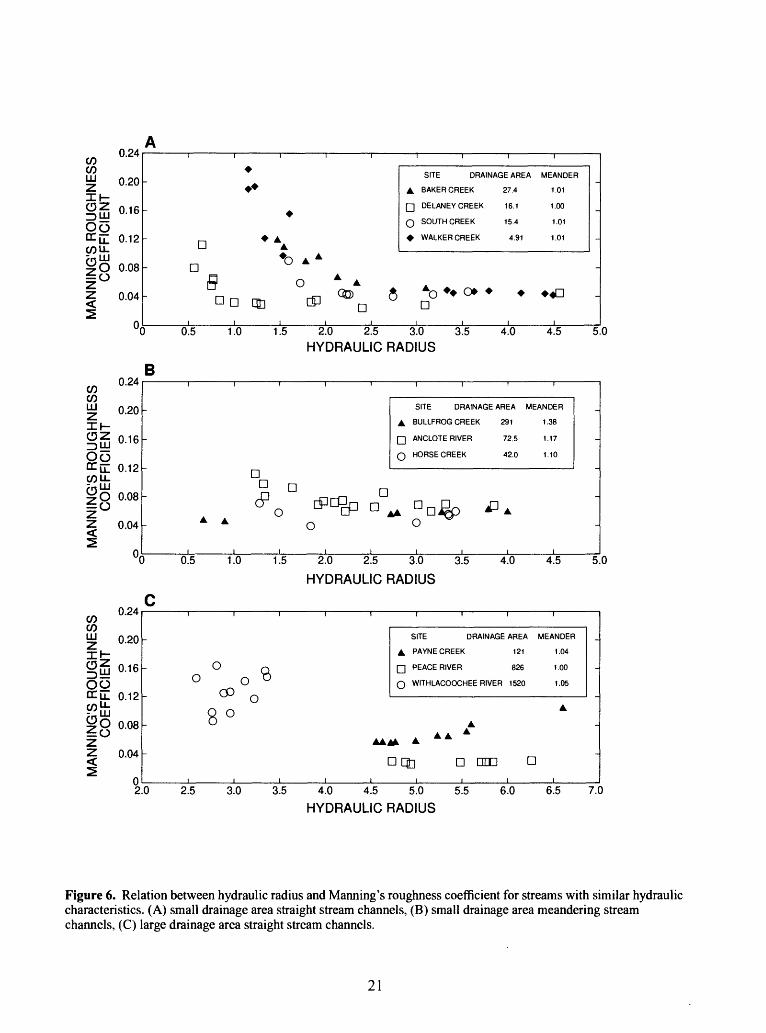
The relation of Manning's n to the hydraulic radius of all streams used in this study is
shown in figure 6. Streams were grouped according to hydraulic characteristics of drainage area
and stream alignment. There was little variation in roughness values at each of the study sites when
the hydraulic radius exceeded 2.5. The exceptions were Withlacoochee River and Payne Creek.
Both of these sites have considerable vegetation. The increase in n values at Payne Creek when the
hydraulic radius increases is the result of dense vegetation at higher stages, whereas at the
Withlacoochee River, variances in n values with hydraulic radius are attributable to extensive in-
stream vegetation.
20
O505
ZXI-CDZ
0(5LL
O5LL.
i°Z
IE
0.20
0.16
0.12
0.08
0.04
°(
111111111^k
^^
^
D * AA
SITE DRAIN
A BAKER CREEK
Q DELANEY CREEK
O SOUTH CREEK
WALKER CREEK
D ° Afl O A A
n n Li] cP ^n 6 a° ^ °* *i i i i i i i
) 0.5 1.0 1.5 2.0 2.5 3.0 3.5
AGE AREA
27.4
16.1
15.4
4.91
*
,4.0
MEANDER
1.01
1.00
1.01
1.01
_
*«D
,4.5 5.
B
O5 O5
OO
HYDRAULIC RADIUS
05O5LUZXI-
§mOo
O5LL
|8Z
IE
U.ltH
0.20
0.16
0.12
0.08
0.04
n
111111111
_
-
D
° D D C' rPC Qj~~i n
SITE DRAINAGE AREA MEANDER
A BULLFROG CREEK 291 1.38
Q ANCLOTE RIVER 72.5 1.17
O HORSE CREEK 42.0 1.10
n n &
_
-
-
L ° o " o ^
1 1 1 1 1 1 1 1 15.0
HYDRAULIC RADIUS
0.20
0.16
0.12
0.08
0.04
0
111111111
-
O £,O O
CD Q
SITE DRAINAGE AREA
A PAYNE CREEK 121
Q PEACE RIVER 826
O WITHLACOOCHEE RIVER 1520
8°AAM ± AA
_D LI] D DEC C
1 1 1 1 1 1 1 12.0 2.5 3.0 3.5 4.0 4.5 5.0 5.5 6.0
MEANDER
1.04
1.00
1.05
A
]
i6.5 7.C
HYDRAULIC RADIUS
Figure 6. Relation between hydraulic radius and Manning's roughness coefficient for streams with similar hydraulic characteristics. (A) small drainage area straight stream channels, (B) small drainage area meandering stream channels, (C) large drainage area straight stream channels.
21
Water-Surface Slope
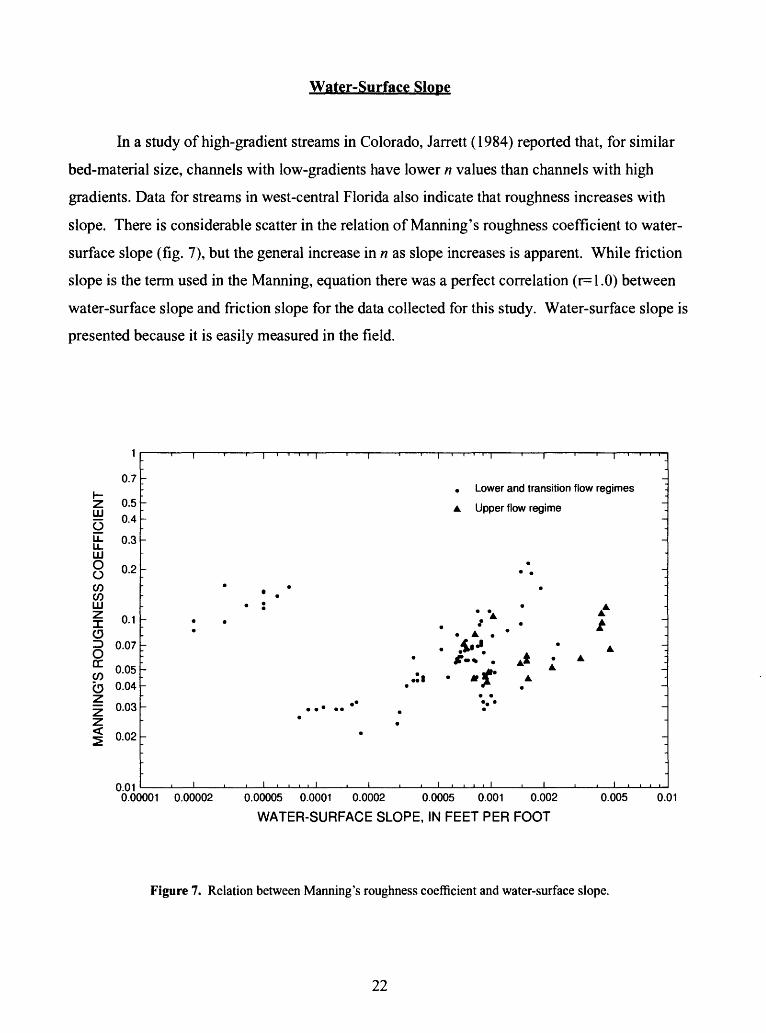
In a study of high-gradient streams in Colorado, Jarrett (1984) reported that, for similar
bed-material size, channels with low-gradients have lower n values than channels with high
gradients. Data for streams in west-central Florida also indicate that roughness increases with
slope. There is considerable scatter in the relation of Manning's roughness coefficient to water-
surface slope (fig. 7), but the general increase in n as slope increases is apparent. While friction
slope is the term used in the Manning, equation there was a perfect correlation (r=l .0) between
water-surface slope and friction slope for the data collected for this study. Water-surface slope is
presented because it is easily measured in the field.
0.7
Z 0.58 o, t °-3UJO 02 OCO CO UJ
i 0.1o5 0.07
O 0.04
^ 0.03z§ 0.02
0.01
Lower and transition flow regimes
Upper flow regime
V
"If \ A^
0.00001 0.00002 0.00005 0.0001 0.0002 0.0005 0.001 0.002
WATER-SURFACE SLOPE, IN FEET PER FOOT
0.005 0.01
Figure 7. Relation between Manning's roughness coefficient and water-surface slope.
22
Streambank Vegetation
Flow resistance within a vegetated area is a function of different variables, including
velocity, distribution of vegetation, roughness of the channel boundary, and the structural and
hydrodynamic properties associated with various plants, leaves and trees. In west-central Florida
streams, velocities are very low in comparison with other regions; vegetation is quite dense with
minimal seasonal variation; and a variety of vegetation types is present along most streams.
Typical reaches will include various hardwoods such as the live oak and sweetgum, bald cypress
with numerous cypress knees, sabal palms, palmetto palms, along with considerable short stemmed
grasses, ferns, and vines. In-stream aquatic vegetation such as water hyacinths or hydrilla, which
can extend throughout the water column, is also common in the streams of west-central Florida. In
this study, South Creek, Delaney Creek, and Withlacoochee River had various amounts of in-
stream vegetation in addition to streambank vegetation.
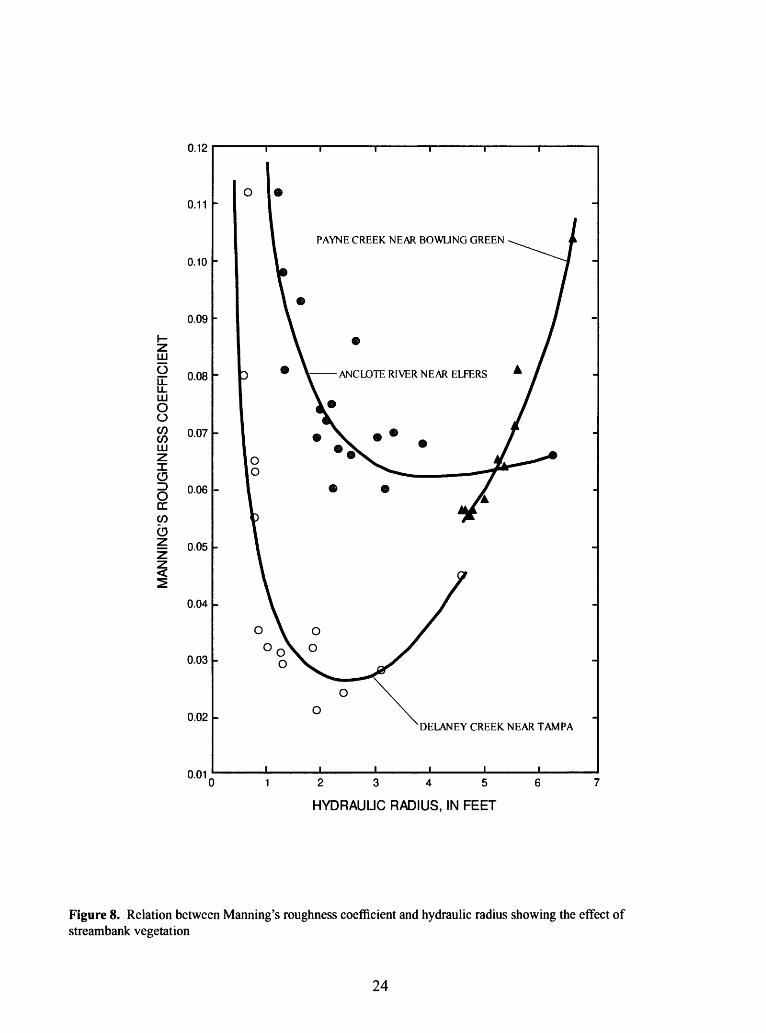
The relation between Manning's roughness coefficient and the hydraulic radius at Baker
Creek (fig. 6A) is typical of streams with little or no streambank vegetation. However, at most
streams in west-central Florida when flows increase, the effects of streambank vegetation increase
and this result in an increase in n values. The effect that dense brush along the streambank has on
Manning's roughness coefficient for Delaney Creek, Anclote River, and Payne Creek is illustrated
in figure 8. Figure 8 indicates that dense vegetation can have a marked effect on total flow
resistance for streams in west-central Florida and must be evaluated properly.
23
LJU
O
LU O O
LU
0.12
0.11
0.10
0.09
0.08
0.07
X CD g 0.06ccCO
u1 0.05
0.04
0.03
0.02
0.01
PAYNE CREEK NEAR BOWLING GREEN
ANCLOTE RIVER NEAR ELFERS
DELANEY CREEK NEAR TAMPA
123456
HYDRAUUC RADIUS, IN FEET
Figure 8. Relation between Manning's roughness coefficient and hydraulic radius showing the effect of streambank vegetation
24
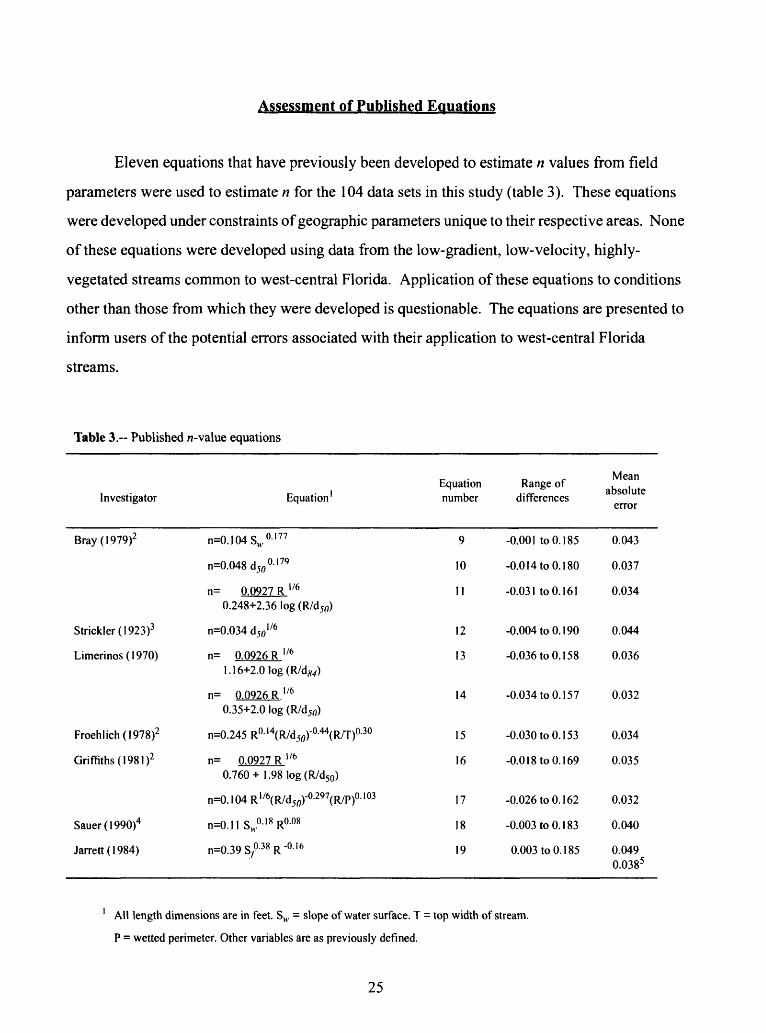
Assessment of Published Equations
Eleven equations that have previously been developed to estimate n values from field
parameters were used to estimate n for the 104 data sets in this study (table 3). These equations
were developed under constraints of geographic parameters unique to their respective areas. None
of these equations were developed using data from the low-gradient, low-velocity, highly-
vegetated streams common to west-central Florida. Application of these equations to conditions
other than those from which they were developed is questionable. The equations are presented to
inform users of the potential errors associated with their application to west-central Florida
streams.
Table 3.-- Published n-value equations
Investigator
Bray(1979)2
Equation 1
n=0.104SM,°- 177
n=0.048d5fl °- 179
Equation number
9
10
Range of differences
-0.001 to 0.1 85
-0.0 14 to 0.1 80
Mean absolute
error
0.043
0.037
n= 0.0927 R l/b 0.248+2.36 log (R/d5fl)
Strickler(1923)3
Limerinos(1970)
Froehlich(1978)2
Griffiths (198 1)2
Sauer(1990)4
Jarrett(1984)
n=0.034 d5fl ' /6
n= 0.0926 R l/6 1.1 6+2.0 log (R/dw)
0.35+2.0 log (R/d50)
n=0.245 R^'^R/d^r^R/T)0'30
n= 0.0927 R l/6 0.760 +1.98 log (R/d50)
n=0.104R 1/6(R/d5fl)-°-297(R/P)0 - 103
n=0.11SM °- 18 R0 - 08
n=0.39S^38 R-0 - 16
12
13
14
15
16
17
18
19
-0.004 to 0.1 90
-0.036 to 0.1 58
-0.034 to 0.1 57
-0.030 to 0.1 53
-0.0 18 to 0.1 69
-0.026 to 0.1 62
-0.003 to 0.1 83
0.003 to 0.1 85
0.044
0.036
0.032
0.034
0.035
0.032
0.040
0.049 0.038 5
1 All length dimensions are in feet. SM , = slope of water surface. T = top width of stream.
P = wetted perimeter. Other variables are as previously defined.
25
2 As published in Jobson and Froehlich (1988).
3 As published in Henderson (1966).
4 V. B. Sauer (U.S. Geological Survey, written commun., (1990), as published in Coon
(1995).
Based on 9 n-value computations from channels with friction slope greater than 0.002.
Bray (Eq. 9,10, and 11) presents equations that relate n to water-surface slope, intermediate
bed material size, d5Q, and hydraulic radius. The equations were based on high within-bank flow
data from 67 gravel-bed river reaches in Alberta, Canada. The intermediate bed material size (d5o)
ranged from 0.06 to 0.48 ft. Sites were selected that had minimal bed transport, no significant
vegetation in the channel, and no dominant bedform features.
Strickler's equation (Eq. 12) was devloped from mostly Swiss and French data of gravel-
bed streams and fixed bed-channels. Strickler is probably the first investigator who attempted to
relate a resistance coefficient explicitly to the sediment property of alluvial channels. Strickler's
equation yields poor results when the bedform effect is predominant because of the limitations of
the data that were used. The equation estimates the n value independently of stage and is
appropriate only for high within-bank flows.
Limerinos (Eq. 13 and 14) related n to hydraulic radius and bed particle size using data
from 11 stream channels having bed material ranging from small gravel to medium size boulders.
He related n to both the intermediate diameter, d50, and the minimum diameter, d^. Limerinos
selected reaches having a minimum amount of roughness other than that caused by bed material.
Froehlich (Eq. 15) developed an equation that relates n to hydraulic radius, relative
smoothness, and a depth-to-width factor. Froehlich used data from 15 sites described in Barnes
(1967) for which bed-material particle sizes were included. This equation is presented in Jobson
and Froehlich (1988).
Griffiths (Eq. 16 and 17) studied the hydraulic resistance in coarse gravel-bed rivers. He
proposed relations for gravel rivers with rigid and movable beds using 136 field data sets from 72
reaches on 46 New Zealand gravel-bed rivers.
Sauer's (Eq. 18) equation is based on data from Barnes (1967) and is applicable to channels
with water-surface slopes between 0.0003 and 0.018 and with hydraulic radii up to 19 ft. This
26
equation includes the roughness effects of not only the bed and bank material, but other flow-
resisting factors such as cross-sectional irregularities, variations in channel size and shape, along
with vegetated bank conditions. Roughness coefficients estimated by this equation would be
composite values. This equation would likely give reasonable estimates for stream channels whose
n values are significantly affected by multiple factors.
Jarrett (Eq. 19) relates n to hydraulic radius and friction slope using data from 21 high-
gradient (friction slope greater than 0.002) cobble and boulder streams in Colorado .
A comparison of the errors resulting from applying these equations to west-central Florida
streams is presented in table 3; for each event, the two best results from these equations are given
in tables 4 and 5. Only high within-bank flows for each site were used in an attempt to standardize
the equations. Results for lower flows in the same channels may be quite different from the high
flows listed. These flows were also separated into upper, transition, and lower regime flows. Table
4 lists the best estimates of n values by the published equations with less than 70 percent of the
cross-section area vegetated, whereas table 5 lists the same results for streams with more than 70
percent of the cross-section area vegetated.
None of the equations accurately estimated n values for streams in west-central Florida,
although results were generally better for events where the wetted perimeter was less than 70
percent vegetated. The average mean absolute error from using each equation for every event was
0.039 and ranged from -0.036 to 0.190. This range demonstrates the errors that can result if
published equations are used to estimate n values for streams in west-central Florida.
27
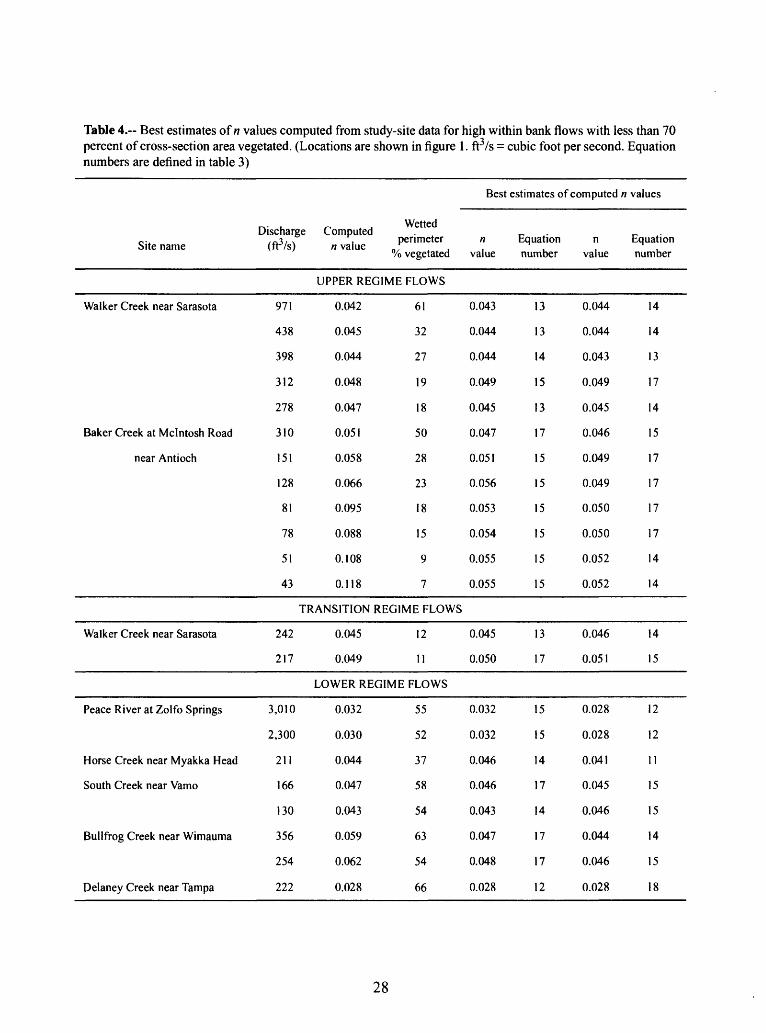
Table 4.-- Best estimates of n values computed from study-site data for high within bank flows with less than 70 percent of cross-section area vegetated. (Locations are shown in figure 1. ft3/s = cubic foot per second. Equation numbers are defined in table 3)
Best estimates of computed n values
Site nameDischarge
(ftVs)Computed
n value
Wetted perimeter
% vegetatedn
valueEquation number
n value
Equation number
UPPER REGIME FLOWS
Walker Creek near Sarasota
Baker Creek at Mclntosh Road
near Antioch
971
438
398
312
278
310
151
128
81
78
51
43
0.042
0.045
0.044
0.048
0.047
0.051
0.058
0.066
0.095
0.088
0.108
0.118
TRANSITION
Walker Creek near Sarasota 242
217
0.045
0.049
61
32
27
19
18
50
28
23
18
15
9
7
REGIME FLOWS
12
11
0.043
0.044
0.044
0.049
0.045
0.047
0.051
0.056
0.053
0.054
0.055
0.055
0.045
0.050
13
13
14
15
13
17
15
15
15
15
15
15
13
17
0.044
0.044
0.043
0.049
0.045
0.046
0.049
0.049
0.050
0.050
0.052
0.052
0.046
0.051
14
14
13
17
14
15
17
17
17
17
14
14
14
15
LOWER REGIME FLOWS
Peace River at Zolfo Springs
Horse Creek near Myakka Head
South Creek near Vamo
Bullfrog Creek near Wimauma
Delaney Creek near Tampa
3,010
2,300
211
166
130
356
254
222
0.032
0.030
0.044
0.047
0.043
0.059
0.062
0.028
55
52
37
58
54
63
54
66
0.032
0.032
0.046
0.046
0.043
0.047
0.048
0.028
15
15
14
17
14
17
17
12
0.028
0.028
0.041
0.045
0.046
0.044
0.046
0.028
12
12
11
15
15
14
15
18
28
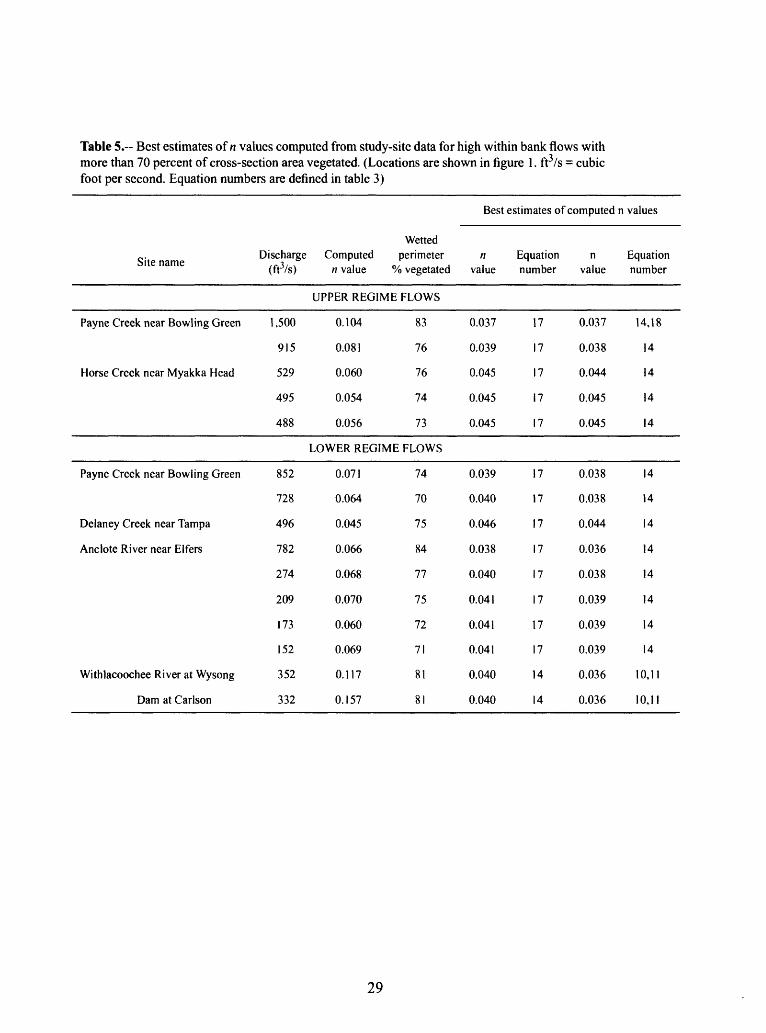
Table 5.-- Best estimates of n values computed from study-site data for high within bank flows with more than 70 percent of cross-section area vegetated. (Locations are shown in figure 1. ft3/s = cubic foot per second. Equation numbers are defined in table 3)
Best estimates of computed n values
Site nameDischarge
(ft3/s)Computed
n value
Wettedperimeter
% vegetatedn
valueEquation number
n value
Equation number
UPPER REGIME FLOWS
Payne Creek near Bowling Green
Horse Creek near Myakka Head
1,500
915
529
495
488
0.104
0.081
0.060
0.054
0.056
83
76
76
74
73
0.037
0.039
0.045
0.045
0.045
17
17
17
17
17
0.037
0.038
0.044
0.045
0.045
14,18
14
14
14
14
LOWER REGIME FLOWS
Payne Creek near Bowling Green
Delaney Creek near Tampa
Anclote River near Elfers
Withlacoochee River at Wysong
Dam at Carlson
852
728
496
782
274
209
173
152
352
332
0.071
0.064
0.045
0.066
0.068
0.070
0.060
0.069
0.117
0.157
74
70
75
84
77
75
72
71
81
81
0.039
0.040
0.046
0.038
0.040
0.041
0.041
0.041
0.040
0.040
17
17
17
17
17
17
17
17
14
14
0.038
0.038
0.044
0.036
0.038
0.039
0.039
0.039
0.036
0.036
14
14
14
14
14
14
14
14
10,11
10,11
29
PROCEDURE FOR ESTIMATING ROUGHNESS COEFFICIENTS FOR
WEST-CENTRAL FLORIDA STREAMS
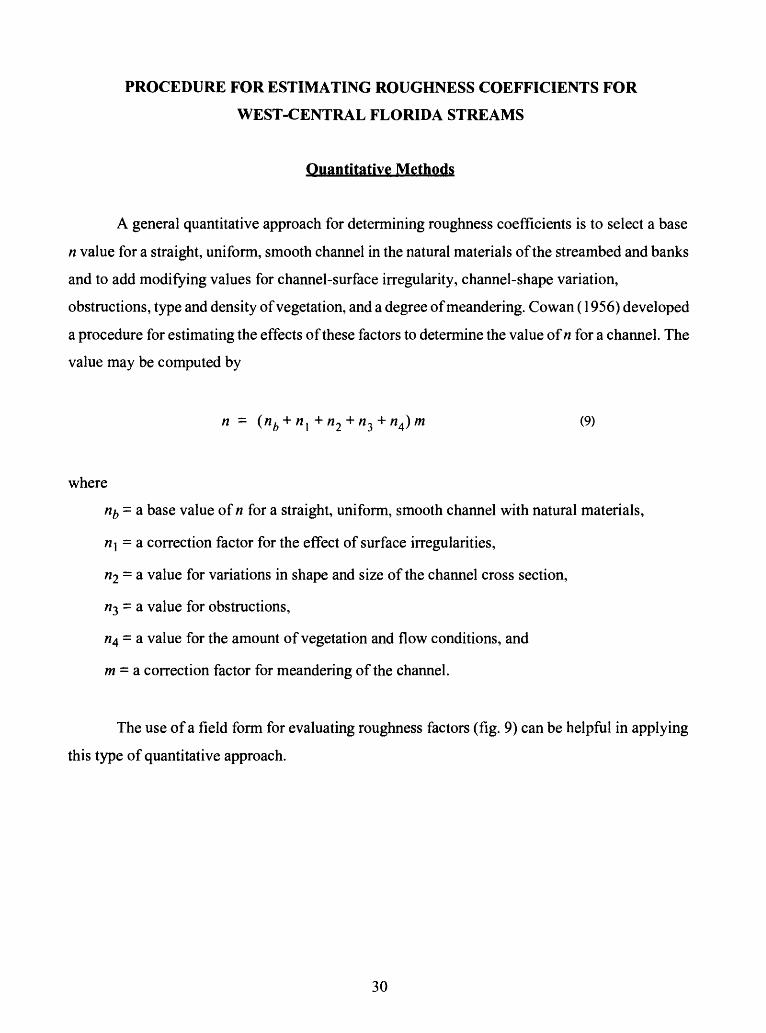
Quantitative Methods
A general quantitative approach for determining roughness coefficients is to select a base
n value for a straight, uniform, smooth channel in the natural materials of the streambed and banks
and to add modifying values for channel-surface irregularity, channel-shape variation,
obstructions, type and density of vegetation, and a degree of meandering. Cowan (1956) developed
a procedure for estimating the effects of these factors to determine the value of n for a channel. The
value may be computed by
n- (nb +n } +n 2 + n^ +n4)m (9)
where
njj = a base value of n for a straight, uniform, smooth channel with natural materials,
n] = a correction factor for the effect of surface irregularities,
«2 = a value for variations in shape and size of the channel cross section,
«3 = a value for obstructions,
«4 = a value for the amount of vegetation and flow conditions, and
m = a correction factor for meandering of the channel.
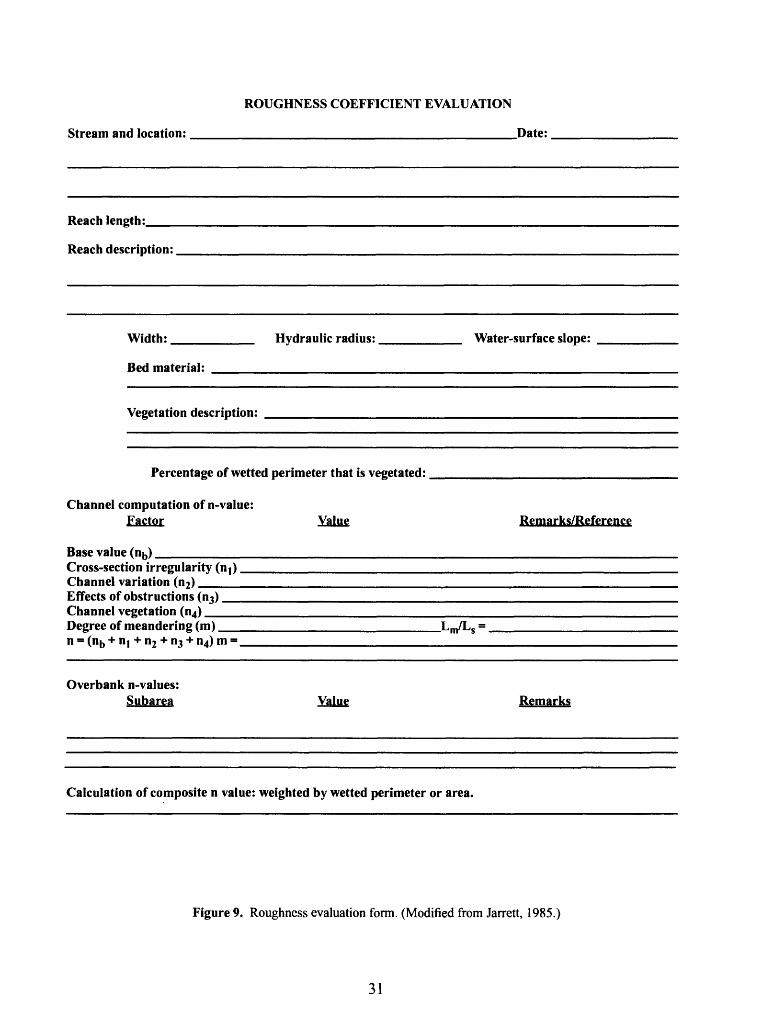
The use of a field form for evaluating roughness factors (fig. 9) can be helpful in applying
this type of quantitative approach.
30
ROUGHNESS COEFFICIENT EVALUATION
Stream and location: ________________________________Date:
Reach length:.
Reach description:
Width: ________ Hydraulic radius: ________ Water-surface slope:
Bed material: _______________________________________
Vegetation description:
Percentage of wetted perimeter that is vegetated:
Channel computation of n-value:Factor Value Remarks/Reference
Base value (nb) _______________________________________________ Cross-section irregularity (n T ) _______________________________________ Channel variation (n2) _____________________________________________ Effects of obstructions (n3) _________________________________________ Channel vegetation (n4) __________________________________________ Degree of meandering (m) ______________________Lm/Ls = ______________ n = (nj, + HJ + n2 + nj + n4) m = _______________________________________
Overbank n-values:Subarea Value Remarks
Calculation of composite n value: weighted by wetted perimeter or area.
Figure 9. Roughness evaluation form. (Modified from Jarrett, 1985.)
31
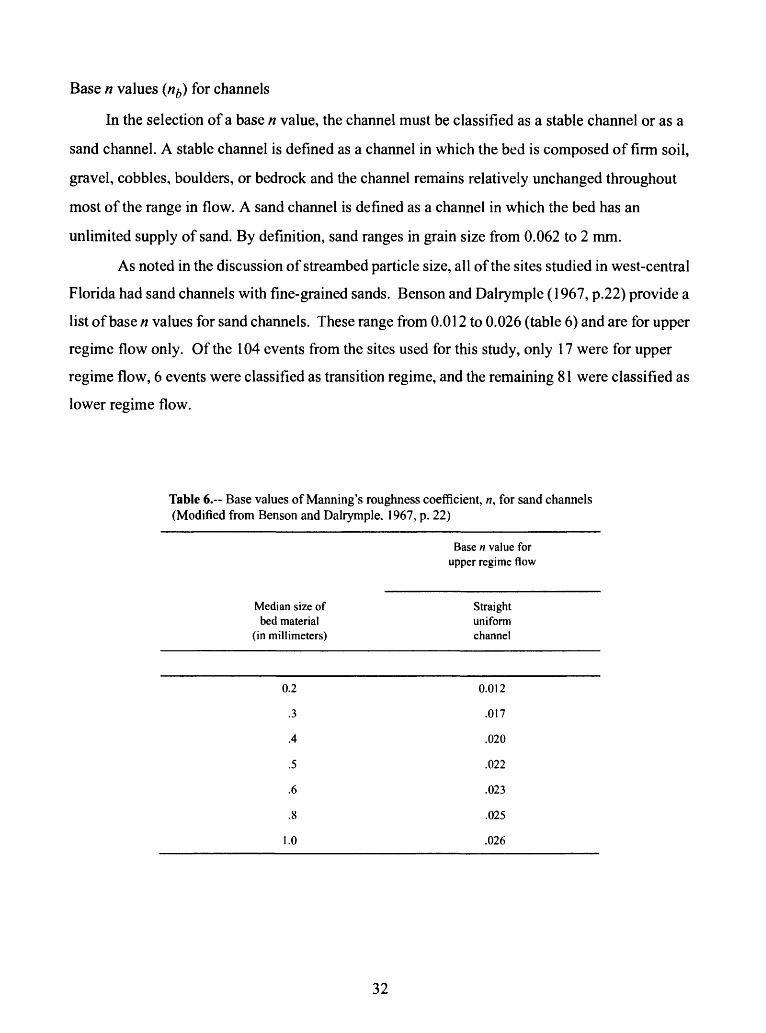
Base n values («£,) for channels
In the selection of a base n value, the channel must be classified as a stable channel or as a
sand channel. A stable channel is defined as a channel in which the bed is composed of firm soil,
gravel, cobbles, boulders, or bedrock and the channel remains relatively unchanged throughout
most of the range in flow. A sand channel is defined as a channel in which the bed has an
unlimited supply of sand. By definition, sand ranges in grain size from 0.062 to 2 mm.
As noted in the discussion of streambed particle size, all of the sites studied in west-central
Florida had sand channels with fine-grained sands. Benson and Dalrymple (1967, p.22) provide a
list of base n values for sand channels. These range from 0.012 to 0.026 (table 6) and are for upper
regime flow only. Of the 104 events from the sites used for this study, only 17 were for upper
regime flow, 6 events were classified as transition regime, and the remaining 81 were classified as
lower regime flow.
Table 6.-- Base values of Manning's roughness coefficient, w, for sand channels (Modified from Benson and Dalrymple, 1967, p. 22)
Base n value for upper regime flow
Median size of bed material
(in millimeters)
Straight uniform channel
0.2
.3
.4
.5
.6
.8
1.0
0.012
.017
.020
.022
.023
.025
.026
32
Although table 6 provides a starting point for selecting a base n value for sand channels
with upper regime flow, evaluation of the site information (Appendix) provides information that is
more useful in estimating a base n value for streams in west-central Florida where lower regime
flows predominate. The median n value for the events listed in the Appendix is 0.060; 80 percent
of the computed n values were greater than 0.043. Therefore, it seems reasonable that except for
the smoothest, non-vegetated sand channels, a base n value of 0.040 would be appropriate for
streams in west-central Florida.
Once a base n value has been selected then cross-section irregularities, channel alignment,
obstructions, vegetation, and other factors that contribute to the roughness are accounted for by
adding increments of roughness to the base value of n. Table 7, modified from Aldridge and Garrett
(1973), gives ranges of adjustments for the factors that affect channel roughness for the prevailing
channel conditions.
Cross-section irregularities, «j
Surface irregularities such as eroded and scalloped stream banks, exposed tree roots, and
rock outcrops increase the wetted perimeter, create turbulence, and increase roughness. Generally
the effect of these irregularities increases with depth of flow. Where the ratio of channel width to
depth is small, larger adjustments are needed.
Channel variations, n^
Changes in the size of cross sections and side-to-side shifting of the low-water channel in
successive cross sections will increase energy losses. Gradual changes in channel dimensions do
not increase turbulence; however, abrupt variations increase turbulence and need to be evaluated.
33
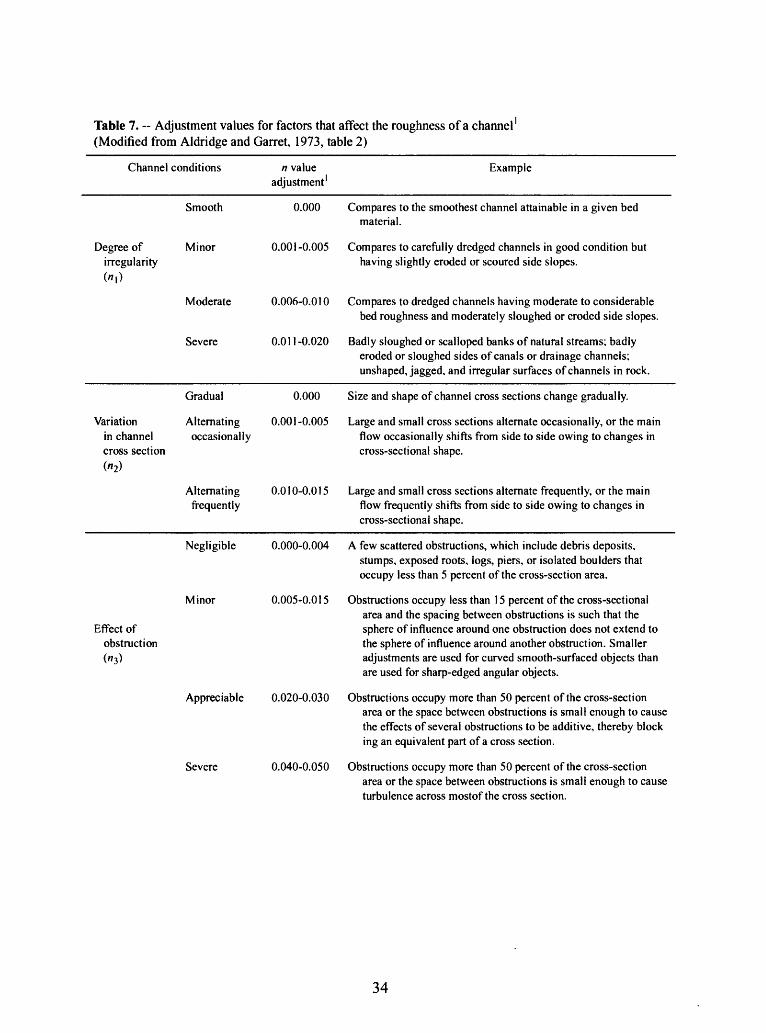
Table 7. ~ Adjustment values for factors that affect the roughness of a channel (Modified from Aldridge and Garret, 1973, table 2)
Channel conditions n value adjustment 1
Example
Smooth 0.000 Compares to the smoothest channel attainable in a given bedmaterial.
Degree of Minor 0.001-0.005 Compares to carefully dredged channels in good condition but irregularity having slightly eroded or scoured side slopes.
Moderate 0.006-0.010 Compares to dredged channels having moderate to considerablebed roughness and moderately sloughed or eroded side slopes.
Severe 0.011 -0.020 Badly sloughed or scalloped banks of natural streams; badlyeroded or sloughed sides of canals or drainage channels; unshaped, jagged, and irregular surfaces of channels in rock.
Gradual 0.000 Size and shape of channel cross sections change gradually.
Variation Alternating 0.001-0.005 Large and small cross sections alternate occasionally, or the mainin channel occasionally flow occasionally shifts from side to side owing to changes incross section cross-sectional shape.
Alternating 0.010-0.015 Large and small cross sections alternate frequently, or the main frequently flow frequently shifts from side to side owing to changes in
cross-sectional shape.
Negligible 0.000-0.004 A few scattered obstructions, which include debris deposits,stumps, exposed roots, logs, piers, or isolated boulders that occupy less than 5 percent of the cross-section area.
Minor 0.005-0.015 Obstructions occupy less than 15 percent of the cross-sectionalarea and the spacing between obstructions is such that the
Effect of sphere of influence around one obstruction does not extend to obstruction the sphere of influence around another obstruction. Smaller (^3) adjustments are used for curved smooth-surfaced objects than
are used for sharp-edged angular objects.
Appreciable 0.020-0.030 Obstructions occupy more than 50 percent of the cross-sectionarea or the space between obstructions is small enough to cause the effects of several obstructions to be additive, thereby block ing an equivalent part of a cross section.
Severe 0.040-0.050 Obstructions occupy more than 50 percent of the cross-sectionarea or the space between obstructions is small enough to cause turbulence across mostof the cross section.
34
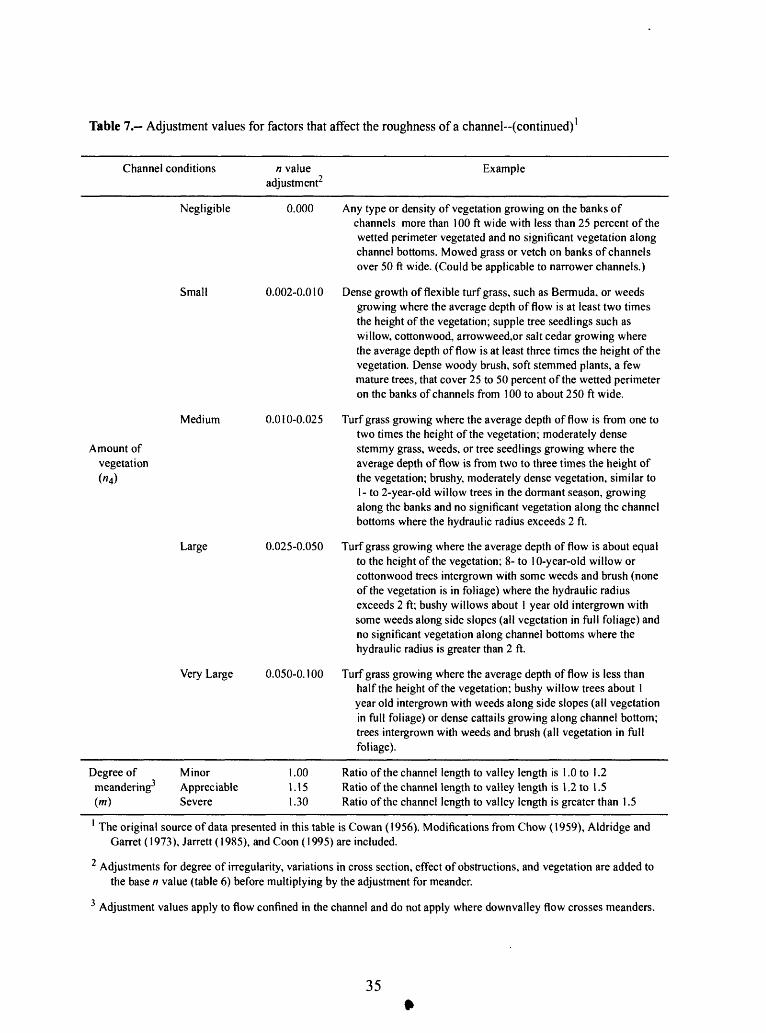
Table 7. Adjustment values for factors that affect the roughness of a channel--(continued) 1
Channel conditions n value adjustment2
Example
Negligible 0.000 Any type or density of vegetation growing on the banks ofchannels more than 100 ft wide with less than 25 percent of the wetted perimeter vegetated and no significant vegetation along channel bottoms. Mowed grass or vetch on banks of channels over 50 ft wide. (Could be applicable to narrower channels.)
Small 0.002-0.010 Dense growth of flexible turf grass, such as Bermuda, or weedsgrowing where the average depth of flow is at least two times the height of the vegetation; supple tree seedlings such as willow, cottonwood, arrowweed,or salt cedar growing where the average depth of flow is at least three times the height of the vegetation. Dense woody brush, soft stemmed plants, a few mature trees, that cover 25 to 50 percent of the wetted perimeter on the banks of channels from 100 to about 250 ft wide.
Medium 0.010-0.025 Turf grass growing where the average depth of flow is from one totwo times the height of the vegetation; moderately dense
Amount of stemmy grass, weeds, or tree seedlings growing where the vegetation average depth of flow is from two to three times the height of («4> the vegetation; brushy, moderately dense vegetation, similar to
1- to 2-year-old willow trees in the dormant season, growing along the banks and no significant vegetation along the channel bottoms where the hydraulic radius exceeds 2 ft.
Large 0.025-0.050 Turf grass growing where the average depth of flow is about equalto the height of the vegetation; 8- to 10-year-old willow or cottonwood trees intergrown with some weeds and brush (none of the vegetation is in foliage) where the hydraulic radius exceeds 2 ft; bushy willows about 1 year old intergrown with some weeds along side slopes (all vegetation in full foliage) and no significant vegetation along channel bottoms where the hydraulic radius is greater than 2 ft.
Very Large 0.050-0.100 Turf grass growing where the average depth of flow is less thanhalf the height of the vegetation; bushy willow trees about 1 year old intergrown with weeds along side slopes (all vegetation in full foliage) or dense cattails growing along channel bottom; trees intergrown with weeds and brush (all vegetation in full foliage).
Degree of Minor 1.00 Ratio of the channel length to valley length is 1.0 to 1.2meandering3 Appreciable 1.15 Ratio of the channel length to valley length is 1.2 to 1.5(m) Severe 1.30 Ratio of the channel length to valley length is greater than 1.5
1 The original source of data presented in this table is Cowan (1956). Modifications from Chow (1959), Aldridge and Garret (1973), Jarrett (1985), and Coon (1995) are included.
2 Adjustments for degree of irregularity, variations in cross section, effect of obstructions, and vegetation are added to the base n value (table 6) before multiplying by the adjustment for meander.
Adjustment values apply to flow confined in the channel and do not apply where downvalley flow crosses meanders.
35
Obstructions, w3
Obstructions that disturb the flow pattern in the channel will increase the n value. Trees,
stumps, large boulders, bridge piers, and debris deposits increase roughness and cause backwater
upstream and eddy losses downstream. The amount of increased roughness can be evaluated in
terms of the reduction in the cross-section area. This will depend on the type, size, shape,
distribution, and number of the obstructions. The effect of obstructions on the roughness
coefficient is also a function of velocity. When the velocity is high, an obstruction exerts a sphere
of influence that is much larger than the obstruction. At the velocities that generally occur in
channels with gentle to moderately steep slopes, the sphere of influence could be from 3 to 5 times
the width of the obstruction (Aldridge and Garret, 1973). However, with the low-gradient streams
and the low stream velocities found in west-central Florida, the sphere of influence of any single
obstruction will rarely exceed two times its size. Several obstructions, closely spaced in a channel,
can create overlapping spheres of influence and can cause a considerable increase in the roughness
coefficient. In this study, an example of overlapping spheres of influence can be seen at the Anclote
River site, where a substantial number of different-sized, closely-spaced, cypress knees cause a
significant increase in the n value.
Channel vegetation, w4
Streambank vegetation increases turbulence and roughness and reduces channel capacity.
This is particularly true for narrow channels. The magnitude of this effect depends, largely, on the
type of vegetation, the degree to which the vegetation is flattened by high water, the vegetation
height in relation to the depth of flow, and the amount of vegetation that reduces channel capacity
(the percentage of the wetted perimeter covered by vegetation). In some areas of the country,
seasonal changes produce large variances in the effect vegetation has on roughness. While there is
some measure of that same effect on streams in west-central Florida, because of the mild winter
climate that normally occurs in west-central Florida, seasonal changes are not as important as the
other vegetation factors. Streams in west-central Florida commonly have in excess of 70 percent
of a cross section vegetated (table 5) throughout the year. In addition, stream velocities are low, so
there is minimal bending of the vegetation. This is especially true when plant growth along the
36
streambank includes palmettos, cypress knees, and densely matted underbrush commonly found
along the streams in west-central Florida. Aldridge and Garret (1973) suggested n values for
brush- and tree-covered channels, when the n value is assigned for the vegetation, would be the
same as that for brush- and tree-covered flood plains.
Degree of meandering, m
The increase in channel roughness due to small curves and bends is considered to be
insignificant. However, the effects of sharp bends may extend downstream for some distance. The
degree of meandering is computed as the ratio of the channel length of the reach (Lm) divided by
the valley length (Ls). The modified value for meandering is obtained by multiplying the total
additive effects of the other factors for this reach by Lm/Ls
Use of Photographs
Photographs of stream channels where n values have been determined can be used for
comparison with field situations to help verify selected n values. Published reports that include
photographs of channels for which n values have been computed include Chow (1959), Barnes
(1967), Aldridge and Garrett (1973), Jarrett (1985), Hicks, and Mason, (1991), Thomsen and
Hjalmarson, (1991) and Coon (1995). Barnes (1967) illustrates 50 channels in color photographs
of streams from across the United States that represent a wide range of hydraulic characteristics.
Hicks and Mason (1991) include color photographs for 78 New Zealand river and canal reaches.
Thomsen and Hjalmarson, (1991) included color photographs for 16 sites representing desert
channels in Maricopa County, Arizona.
Arcement and Schneider (1989) include color photographs of 15 densely vegetated flood
plains in Mississippi, Alabama, and Louisiana for which roughness coefficients were computed.
The use of these photographs would be beneficial when considering n values for brush- and tree-
covered channels, when streambank vegetation is the major roughness factor.
37
Photographs of the west-central Florida stream channels used in this report are presented
to aid in the determination of roughness coefficients. The photographs can be used for comparison
with field situations to help assign reasonable n values for the many types of streams and rivers
commonly encountered in west-central Florida.
SUMMARY AND CONCLUSIONS
Manning's roughness coefficients are presented for 10 streams that are representative of
stream conditions in the west-central Florida area. The sites provide information for a wide range
of discharges, water surface profiles, and streambank vegetation conditions. Data collected
indicate Manning's roughness coefficient, «, decreases as depth increases, until the water surface
somes in contact with streambank vegetation, and then the roughness coefficient increases sharply.
Bed material for all sites presented in this report was fine sand and, consequently, there was little
variation in roughness as a result of variations in bed material. Streambank vegetation appears to
be the major contributor to variations in roughness values for streams in west-central Florida.
The mean computed n for 104 events was 0.072; the range was from 0.021 to 0.218 - an
order of magnitude. The median n value for the 104 events used in this report was 0.060, which
means that half of the time n was greater 0.060. In addition, 70 percent of the time, the computed
n was greater than 0.047; 80 percent of the time, the computed n was greater than 0.043.
Several previously published equations were used to compute roughness coefficients for
the study sites. Results were generally better for high within-bank flows when the vegetated
wetted perimeter was less than 70 percent. All of the existing published equations tend to
underestimate n values for this area.
Channel roughness can be estimated quantitatively by evaluating the interaction of all
roughness factors. Photographs of sites where n values have been computed can be used for
comparison to estimate values at similar sites. Using a base n value of 0.040 and increasing n for
factors of vegetation, channel obstructions, and other factors provides the best determination of n
values for streams in west-central Florida.
38
SELECTED REFERENCES
Aldridge, B.N., and Garrett, J.M., 1973, Roughness coefficients for streams in Arizona: U.S.
Geological Survey Open-File Report 78-3, 87 p.
Arcement, G.J. and Schneider, V.R., 1989, Guide for selecting Manning's roughness coefficients
for natural channels and flood plains: U.S. Geological Survey Water-Supply Paper 2339,
38 p.
Barnes, H.H., Jr., 1967, Roughness characteristics of natural channels: U.S. Geological
Water-Supply Paper 1849, 213 p.
Benson, M.A., and Dalrymple, T., 1967, General field and office procedures for indirect
measurements: U.S. Geological Survey Techniques of Water-Resources Investigations, book
3, chap. Al, 48 p.
Buchanan, T. J. and Somers, W. P., 1968, Stage measurement at gaging stations: U.S. Geological
Survey Techniques of Water-Resources Investigations, book 3, chap. A7,
28 p.
Chow, V.T., 1959, Open channel hydraulics: New York, McGraw-Hill, 680 p.
Coon, W. F., 1995, Estimates of roughness coefficients for selected natural stream channels with
vegetated banks in New York: U.S. Geological Survey Open-File Report 93-161, 127 p.
Cowan, W.L., 1956, Estimating hydraulic roughness coefficients: Agricultural Engineering, v. 37,
no. 7, p. 473-475.
Dalrymple, Tate, and Benson, M.A., 1967, Measurement of peak discharge by slope-area method:
U.S. Geological Survey Techniques of Water-Resources Investigations, book 3, chap. A2,
12 p.
Davidian, Jacob, 1984, Computation of water-surface profiles in open channels: U.S. Geological
Survey Techniques of Water-Resources Investigations, book 3, chap. A15,
48 p.
Henderson, F.M., 1966, Open channel flow: New York, Macmillan, 522 p.
Hicks, D.M., and Mason, P.O., 1991, Roughness characteristics of New Zealand rivers: Water
Resources Survey, DSIR Marine and Freshwater, Wellington, New Zealand, 329 p.
Jarrett, R.D., 1984, Hydraulics of high-gradient streams: Journal of Hydraulic Engineering, v. 110,
no. 11, November 1984, p. 519-1939.
39
Jarrett, R.D., 1985, Determination of roughness coefficients for streams in Colorado: U.S.
Geological Survey Water-Resources Investigations Report 85-4004, 54 p.
Jarrett, R.D., and Petsch, H.E., Jr., 1985, Computer program NCALC user's manual-verification
of Manning's roughness coefficient in channels: U.S. Geological Survey Water-Resources
Investigations Report 85-4317, 27 p.
Jobson, H.E., and Froehlich, D.C., 1988, Basic hydraulic principles of open-channel flow: U.S.
Geological Survey Open-File Report 88-707, 150 p.
Limerinos, J.T., 1970, Determination of the Manning coefficient from measured bed roughness in
natural channels: U.S. Geological Survey Water-Supply Paper 1898-B, 47 p.
Petryk, Sylvester, and Bosmajian III, George, 1975, Analysis of flow through vegetation: Journal
of the Hydraulics Division, July 1975, p. 871-883.
Seijo M.A., Giovannelli, R.F., and Turner, J.F., Jr., 1979, Regional flood-frequency relations for
west-central Florida: U.S. Geological Survey Open-File Report 79-1293, 41 p.
Simons, D.B. and Richardson, E.V., 1966, Resistance to flow in alluvial channels: U.S. Geological
Survey Professional Paper 422-J, 61 p.
Thomsen, B.W., and Hjalmarson, H.W., 1991, Estimated Manning's roughness coefficients for
stream channels and flood plains in Maricopa County, Arizona: U.S. Geological Survey,
Maricopa County Flood Control District Cooperator Report, Phoenix, Arizona, 126 p.
Wolman, M.G., 1954, A method of sampling coarse river-bed material: American Geophysical
Union, Transactions, v. 35, no. 6, p. 951-956.
40
APPENDIX
PRESENTATION OF SITE INFORMATION
The following sets of site information consist of a site description, a tabulation of the
hydraulic properties related to each determination of roughness coefficient, a plan sketch of the
site reach, channel cross-section plots, graphs showing the relation between Manning's roughness
coefficient, n, and discharge, hydraulic radius, and slope. Photographs from different vantage
points are also included for each site. Each data set is identified by the downstream number and
name used by the U.S. Geological Survey in publication of streamflow records.
The tabulation of hydraulic parameters includes the date, gage height, discharge, cross-
section area, top width, hydraulic radius, velocity, water-surface slope, friction slope, percent of
wetted perimeter vegetated, type of flow regime, and the computed roughness coefficient for each
event. The cross-section area, width, hydraulic radius, velocity, and percentage of vegetated wetted
perimeter are averages of values computed for each cross section within the reach.
The plan-view sketch, not to scale, is presented to show the general shape of the study reach
along with the location of the cross sections, and photographs. Channel cross-section plots are
arranged in an upstream to downstream order. The initial station for each cross section is at the
left bank. Plots are arranged so that the left bank appears on the reader's left. Horizontal lines on
the cross-section plots are used to define the maximum and minimum gage heights at each
cross-section used in the computation of the n values.
Variations in roughness coefficient values are illustrated by the plots of Manning's n and
discharge, hydraulic radius, and water-surface slope.
Photographs are intended to show the channel alignment, streambank vegetation, and
channel size in relation to flow-resisting features. Photographs were taken from a variety of
perspectives, depending on accessibility afforded by bank vegetation. The camera positions and
view directions are shown in the plan sketch.
41
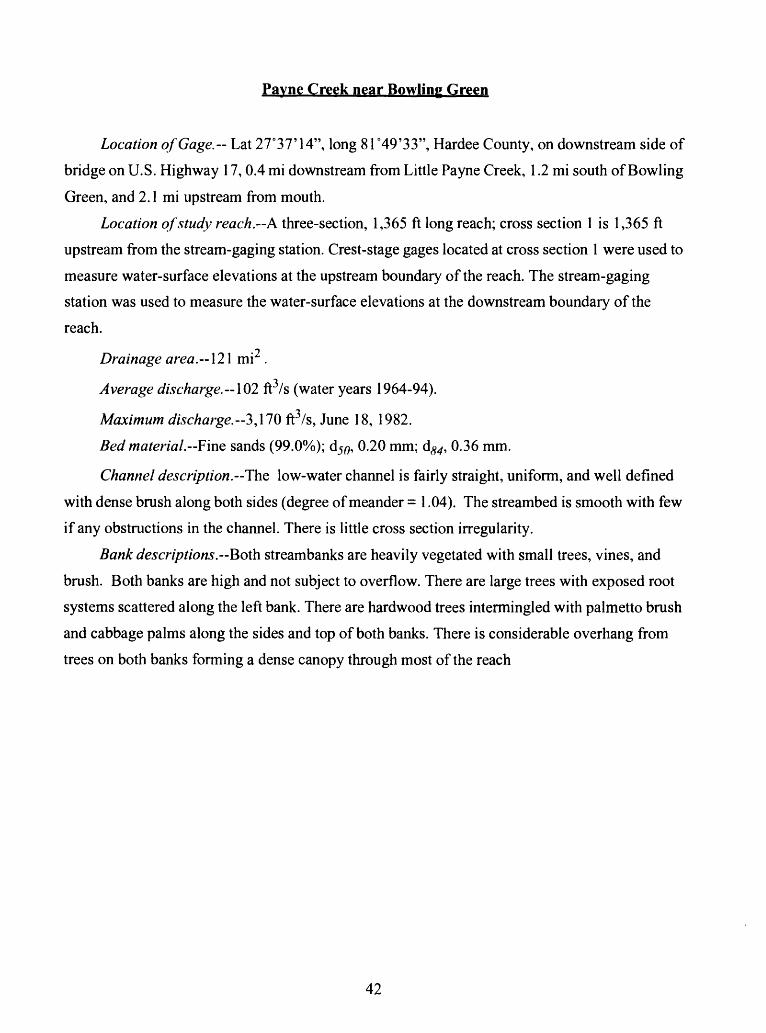
Pavne Creek near Bowling Green
Location of Gage. Lat 27°37'14", long 81°49'33", Hardee County, on downstream side of
bridge on U.S. Highway 17,0.4 mi downstream from Little Payne Creek, 1.2 mi south of Bowling
Green, and 2.1 mi upstream from mouth.
Location of study reach.--A three-section, 1,365 ft long reach; cross section 1 is 1,365 ft
upstream from the stream-gaging station. Crest-stage gages located at cross section 1 were used to
measure water-surface elevations at the upstream boundary of the reach. The stream-gaging
station was used to measure the water-surface elevations at the downstream boundary of the
reach.^Drainage area.-- 121 mi .
Average discharge. 102 ft3/s (water years 1964-94).
Maximum discharge. 3, 170 ft3/s, June 18, 1982.
Bed material--Fine sands (99.0%); d50, 0.20 mm; &84, 0.36 mm.
Channel description. The low-water channel is fairly straight, uniform, and well defined
with dense brush along both sides (degree of meander = 1.04). The streambed is smooth with few
if any obstructions in the channel. There is little cross section irregularity.
Bank descriptions.--Both streambanks are heavily vegetated with small trees, vines, and
brush. Both banks are high and not subject to overflow. There are large trees with exposed root
systems scattered along the left bank. There are hardwood trees intermingled with palmetto brush
and cabbage palms along the sides and top of both banks. There is considerable overhang from
trees on both banks forming a dense canopy through most of the reach
42
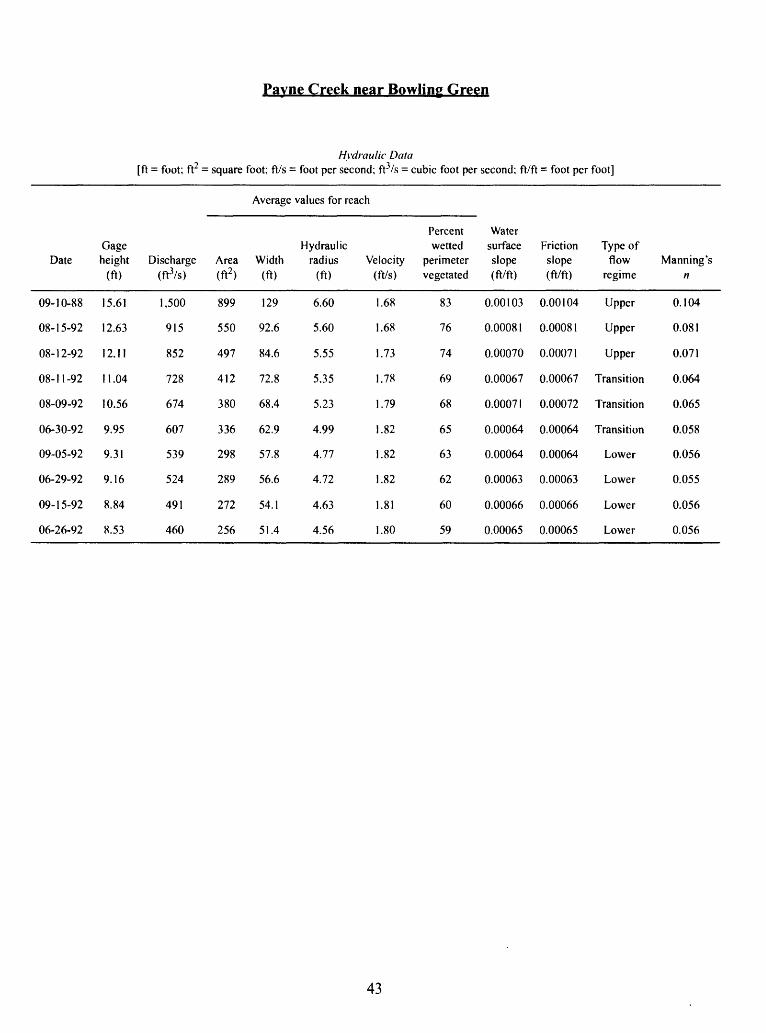
Pavne Creek near Bowling Green
Hydraulic Data [ft = foot; ft2 = square foot; ft/s = foot per second; ft3/s = cubic foot per second; ft/ft = foot per foot]
Average values for reach
Date
09-10-88
08-15-92
08-12-92
08-11-92
08-09-92
06-30-92
09-05-92
06-29-92
09-15-92
06-26-92
Gage height
(ft)
15.61
12.63
12.11
11.04
10.56
9.95
9.31
9.16
8.84
8.53
Discharge (ft3/s)
1,500
915
852
728
674
607
539
524
491
460
Area (ft2 )
899
550
497
412
380
336
298
289
272
256
Width (ft)
129
92.6
84.6
72.8
68.4
62.9
57.8
56.6
54.1
51.4
Hydraulic radius
(ft)
6.60
5.60
5.55
5.35
5.23
4.99
4.77
4.72
4.63
4.56
Velocity(ft/s)
1.68
1.68
1.73
1.78
1.79
1.82
1.82
1.82
1.81
1.80
Percentwetted
perimeter vegetated
83
76
74
69
68
65
63
62
60
59
Watersurface slope (ft/ft)
0.00103
0.00081
0.00070
0.00067
0.00071
0.00064
0.00064
0.00063
0.00066
0.00065
Friction slope (ft/ft)
0.00104
0.00081
0.00071
0.00067
0.00072
0.00064
0.00064
0.00063
0.00066
0.00065
Type of flow
regime
Upper
Upper
Upper
Transition
Transition
Transition
Lower
Lower
Lower
Lower
Manning's n
0.104
0.081
0.071
0.064
0.065
0.058
0.056
0.055
0.056
0.056
43
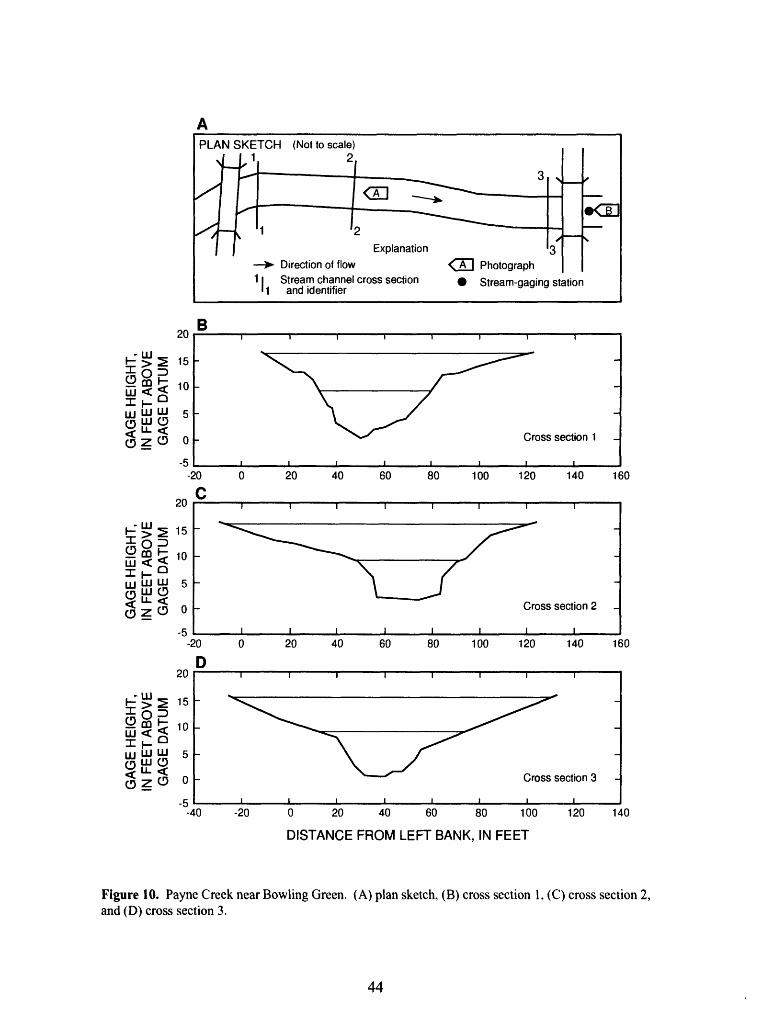
PLAN SKETCH (Not to scale) 1 2
Explanation >- Direction of flow11 Stream channel cross section
1 and identifier
Photograph
Stream-gaging station
20
15
10
5
0
B
-5
20
-20
C
2§g,o
7f "- <.gzo o
-5
8
20
15
5
0
-20
D
-5
I i
Cross section 1
20 40 60 80 100 120 140 160
Cross section 2
20 40 60 80 100 120 140 160
Cross section 3
-40 -20 0 20 40 60 80 100
DISTANCE FROM LEFT BANK, IN FEET
120 140
Figure 10. Payne Creek near Bowling Green. (A) plan sketch, (B) cross section 1, (C) cross section 2, and (D) cross section 3.
44
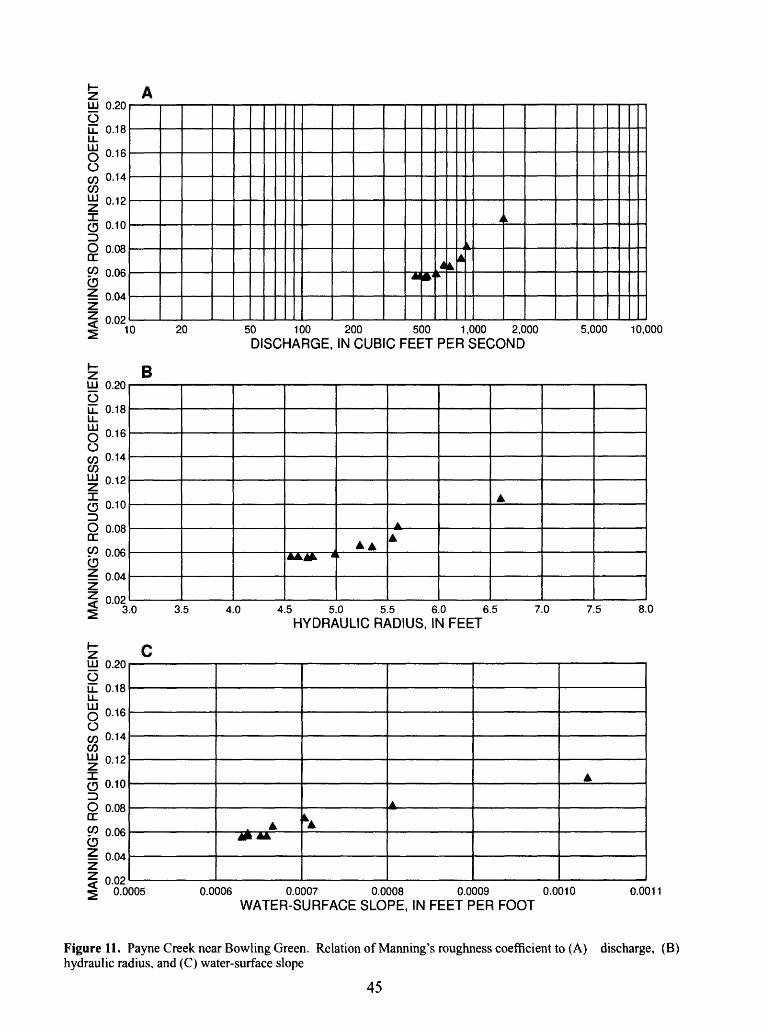
O.W
Q
11
MA
q?
ol3
b*
a.
"d
o
&3
oC
v<
« U
ly
3'as
o
^ 5
o
Is
§CD
O
V
CO
05
c«
O
§*
^ftV
K
' ^
S o
^
0.0007
0.0008
0.0009
0.0010
0.001
{-SURFACE
SLOPE, IN
FEET
PER
FOOT
reen. Relation
of
Manning's
roughness coefficie
nt to
(A
) discha
rge,
ope
NN
ING
'S R
(3
0
0
C3
b
b
c j
*k
o>
o
1
DU
GH
NE
SS
CO
EF
FIC
IE3
0
0
0
0
0
C
o o
rv>
.&.
o>
oo
c
"
ENT
MA
3 C
J
C>
00^
O
O
CO
U
l o Ul
T: 0 c°
r~ o 5« c CO 2. b
Tl m
Ul
'si
0 'si
Ul
00
0
NN
ING
'S R
OU
GH
NE
SS
CO
EF
FIC
IEN
T
MA
NN
ING
'S R
C3
OO
OO
OO
OO
O
OO
OC
sb
bb
^ .L
kli
LkK
a
bbbc
t 1 : ^1
>
^
o
to o 50
100
200DISCHAR
GE, IN
CUBI
O Tl
fflg
« J
C
O
TJ m C/)
§m
8
o
O §e8 U
lb
o 0
0 b 0
-1 1
w^
)UG
HN
ES
SC
OE
FF
ICIE
3 0
0
0
0
0
C
3 o
rvj
*k
oj
oo
c
^
ENT
3 3
>
DO
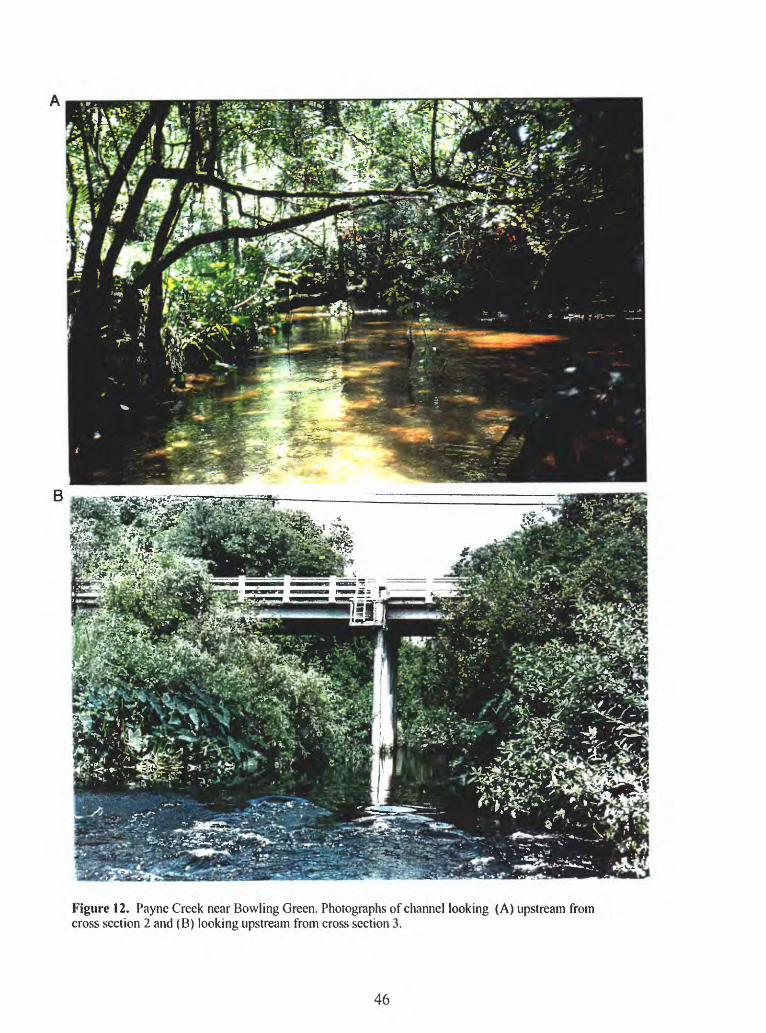
Figure 12. Payne Creek near Bowling Green. Photographs of channel looking (A) upstream from cross section 2 and (B) looking upstream from cross section 3.
46
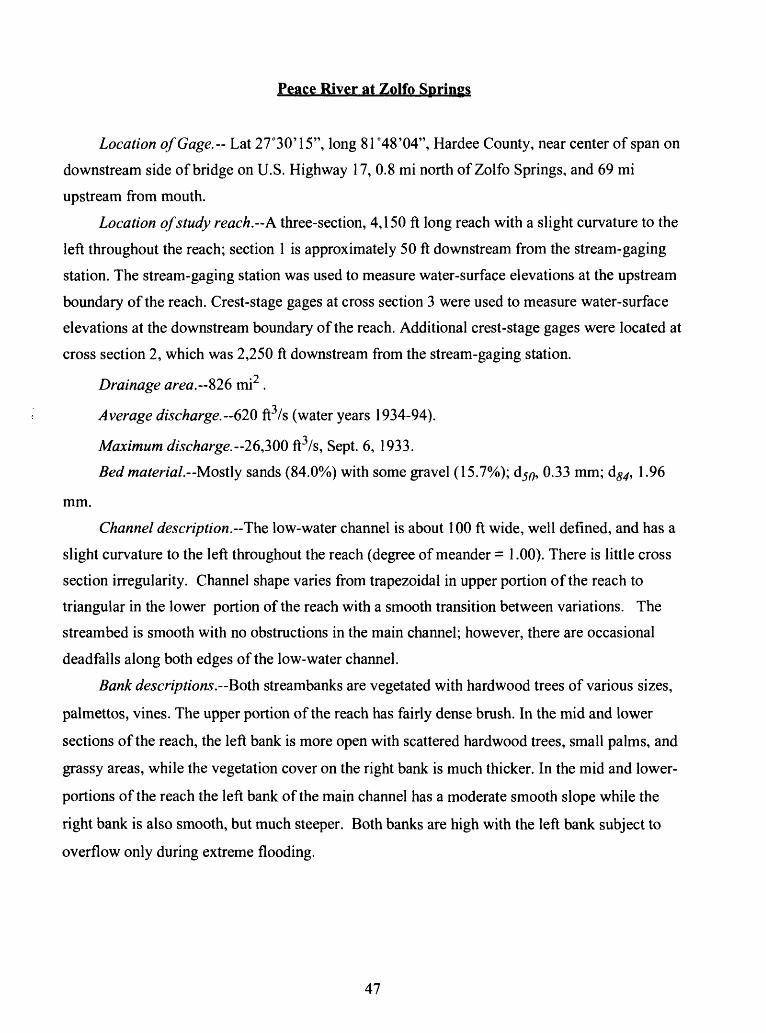
Peace River at Zolfo Springs
Location of Gage.-- Lat 27°30'15", long 81 °48'04", Hardee County, near center of span on
downstream side of bridge on U.S. Highway 17, 0.8 mi north of Zolfo Springs, and 69 mi
upstream from mouth.
Location of study reach.-- A three-section, 4,150 ft long reach with a slight curvature to the
left throughout the reach; section 1 is approximately 50 ft downstream from the stream-gaging
station. The stream-gaging station was used to measure water-surface elevations at the upstream
boundary of the reach. Crest-stage gages at cross section 3 were used to measure water-surface
elevations at the downstream boundary of the reach. Additional crest-stage gages were located at
cross section 2, which was 2,250 ft downstream from the stream-gaging station.^Drainage area.---826 mi .
Average discharge. 620 ft3/s (water years 1934-94).
Maximum discharge. -26,300 ft3/s, Sept. 6, 1933.
Bed material.-Mostly sands (84.0%) with some gravel (15.7%); d50, 0.33 mm; d^, 1.96
mm.
Channel description.--The low-water channel is about 100 ft wide, well defined, and has a
slight curvature to the left throughout the reach (degree of meander = 1.00). There is little cross
section irregularity. Channel shape varies from trapezoidal in upper portion of the reach to
triangular in the lower portion of the reach with a smooth transition between variations. The
streambed is smooth with no obstructions in the main channel; however, there are occasional
deadfalls along both edges of the low-water channel.
Bank descriptions.--Both streambanks are vegetated with hardwood trees of various sizes,
palmettos, vines. The upper portion of the reach has fairly dense brush. In the mid and lower
sections of the reach, the left bank is more open with scattered hardwood trees, small palms, and
grassy areas, while the vegetation cover on the right bank is much thicker. In the mid and lower-
portions of the reach the left bank of the main channel has a moderate smooth slope while the
right bank is also smooth, but much steeper. Both banks are high with the left bank subject to
overflow only during extreme flooding.
47
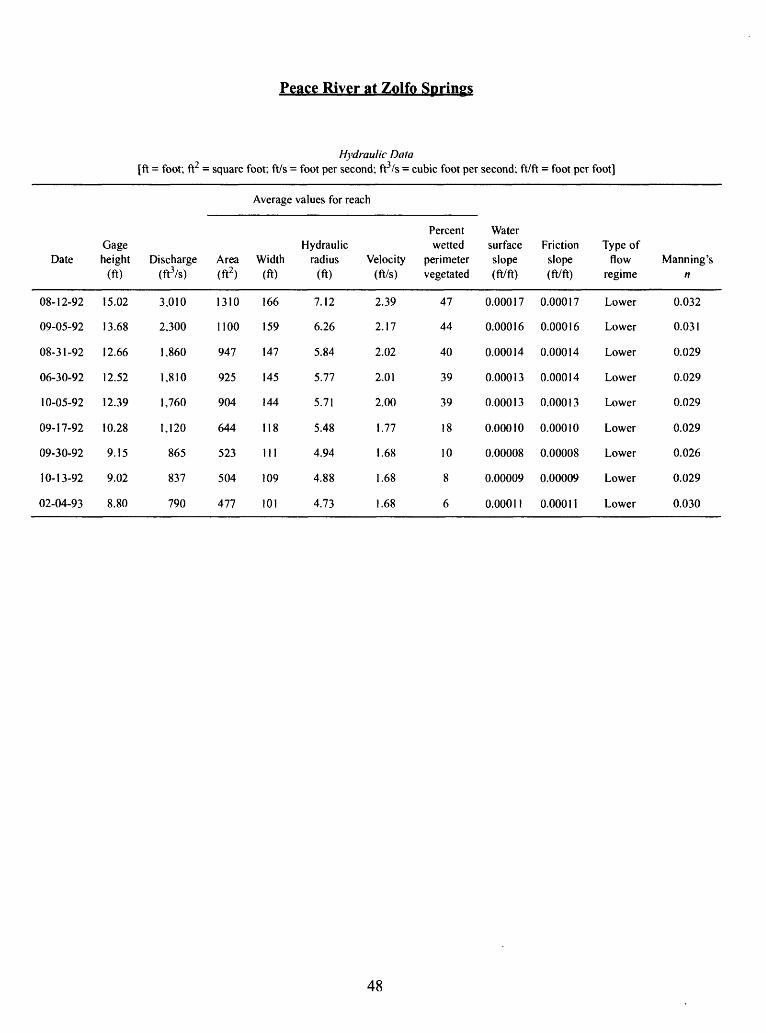
Peace River at Zolfo Springs
Hydraulic Data [ft = foot; ft2 = square foot; ft/s = foot per second; ft3/s = cubic foot per second; ft/ft = foot per foot]
Average values for reach
Date
08-12-92
09-05-92
08-31-92
06-30-92
10-05-92
09-17-92
09-30-92
10-13-92
02-04-93
Gage height
(ft)
15.02
13.68
12.66
12.52
12.39
10.28
9.15
9.02
8.80
Discharge (ft3/s)
3,010
2,300
1,860
1,810
1,760
1,120
865
837
790
Area (ft2)
1310
1100
947
925
904
644
523
504
477
Width (ft)
166
159
147
145
144
118
111
109
101
Hydraulic radius
(ft)
7.12
6.26
5.84
5.77
5.71
5.48
4.94
4.88
4.73
Velocity (ft/s)
2.39
2.17
2.02
2.01
2.00
1.77
1.68
1.68
1.68
Percentwetted
perimeter vegetated
47
44
40
39
39
18
10
8
6
Watersurface slope (ft/ft)
0.00017
0.00016
0.00014
0.00013
0.00013
0.00010
0.00008
0.00009
0.0001 1
Friction slope(ft/ft)
0.00017
0.00016
0.00014
0.00014
0.00013
0.00010
0.00008
0.00009
0.00011
Type of flow
regime
Lower
Lower
Lower
Lower
Lower
Lower
Lower
Lower
Lower
Manning's n
0.032
0.031
0.029
0.029
0.029
0.029
0.026
0.029
0.030
48
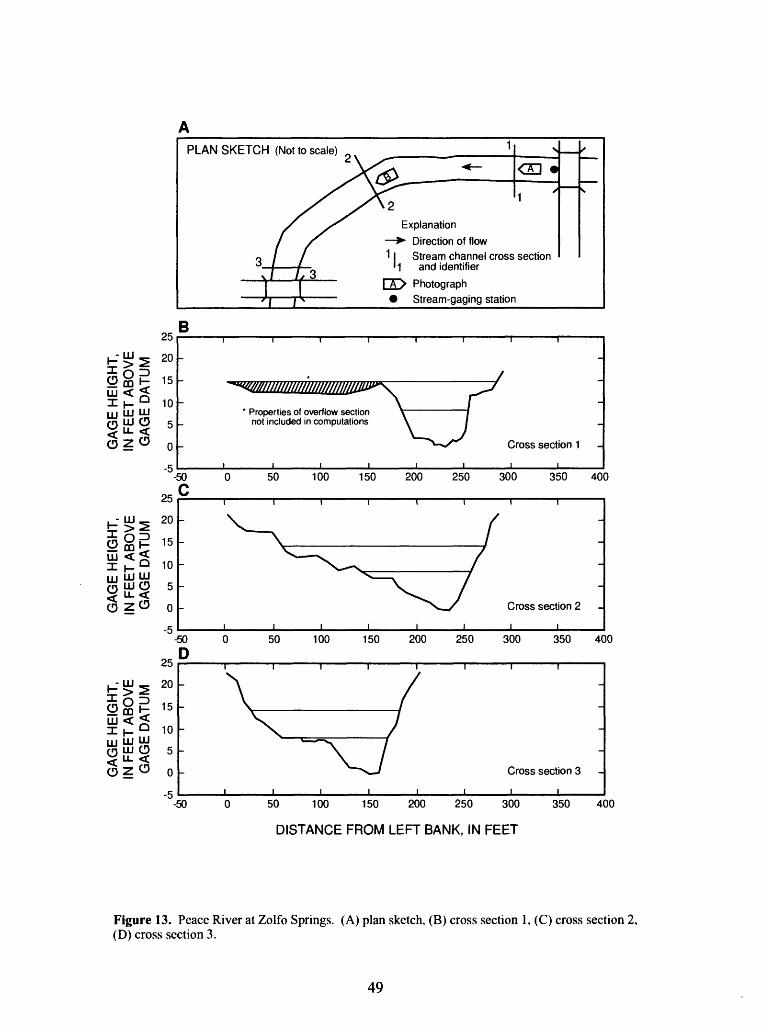
<-§20
PLAN SKETCH (Not to scale)
25
tfg 20
B
g& H 15 -I H Q 10 lij LJJ LJJrn 111 CD 5 -
§ZO 0 .
25
-50
C
,,-UI 20- I <^
15 -
10 -
5 -
0 -
-50
D25
20 -
15 -
10 -
5 -
0 -
-5-50
Explanation > Direction of flow11 Stream channel cross section
' 1 and identifierI A> Photograph Stream-gaging station
* Properties of overflow section not included in computations
Cross section 1
50 100 150 200 250 300 350 400
Cross section 2
50 100 150 200 250 300 350 400
Cross section 3
50 100 150 200 250 300
DISTANCE FROM LEFT BANK, IN FEET
350 400
Figure 13. Peace River at Zolfo Springs. (A) plan sketch, (B) cross section 1, (C) cross section 2, (D) cross section 3.
49
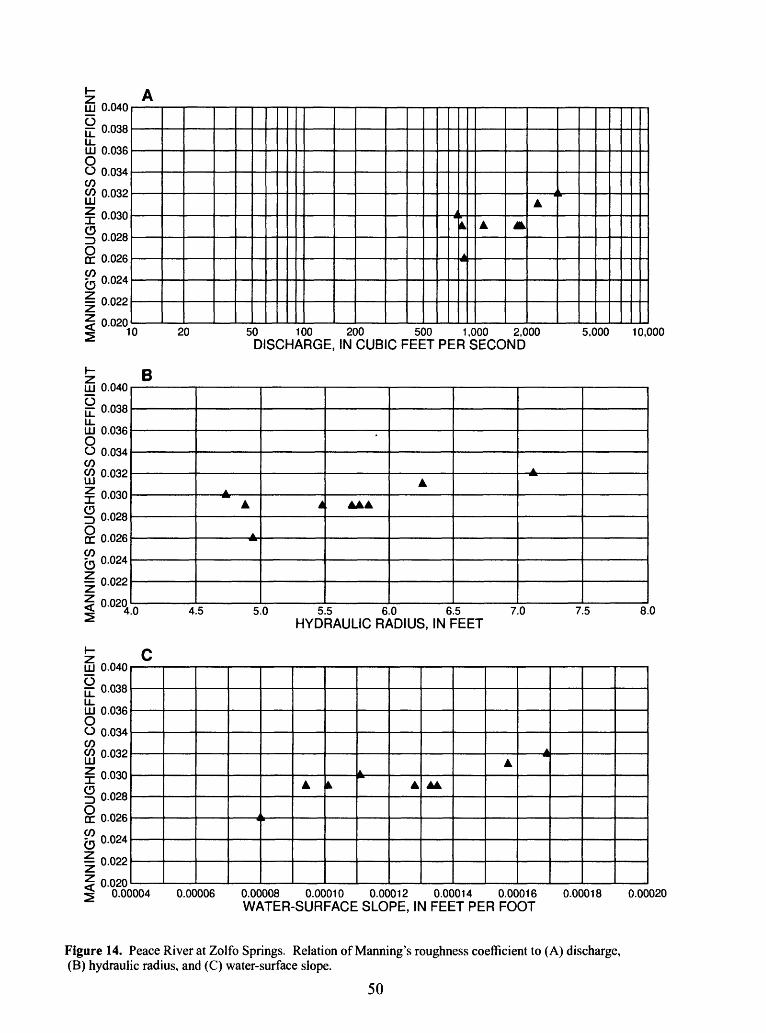
1-LU 0.040
LL LU 0.036 O O 0.034 CO CO 0.032
§= 0.030
§ 0.028
§ 0.026
§ 0.024
p 0.022
§ 0.020
1-
LU 0.040 ^^ n ron
LL LU 0.036 O O 0.034 CO CO 0.032
§= 0.030
§ 0.028
§ 0.026
g 0.024
^ 0.022
< °.0204
H
LU 0.040
Q^ 0.038LL LU 0.036 0 O 0.034 CO CO 0.032
g 0.030
§ 0.028
§ 0.026
^ 0.024
0.022 Zz nn?n
A
^r-
-4
A Jk
A
0 20 50 100 200 500 1,000 2,000 5,000 10,000 DISCHARGE, IN CUBIC FEET PER SECOND
B
A
A-
* AAA
A
0 4.5 5.0 5.5 6.0 6.5 7.0 7.5 8.0HYDRAULIC RADIUS, IN FEET
C
i
A tt
A A4
A A
0.00004 0.00006 0.00008 0.00010 0.00012 0.00014 0.00016 WATER-SURFACE SLOPE, IN FEET PER FOOT
0.00018 0.00020
Figure 14. Peace River at Zolfo Springs. Relation of Manning's roughness coefficient to (A) discharge, (B) hydraulic radius, and (C) water-surface slope.
50
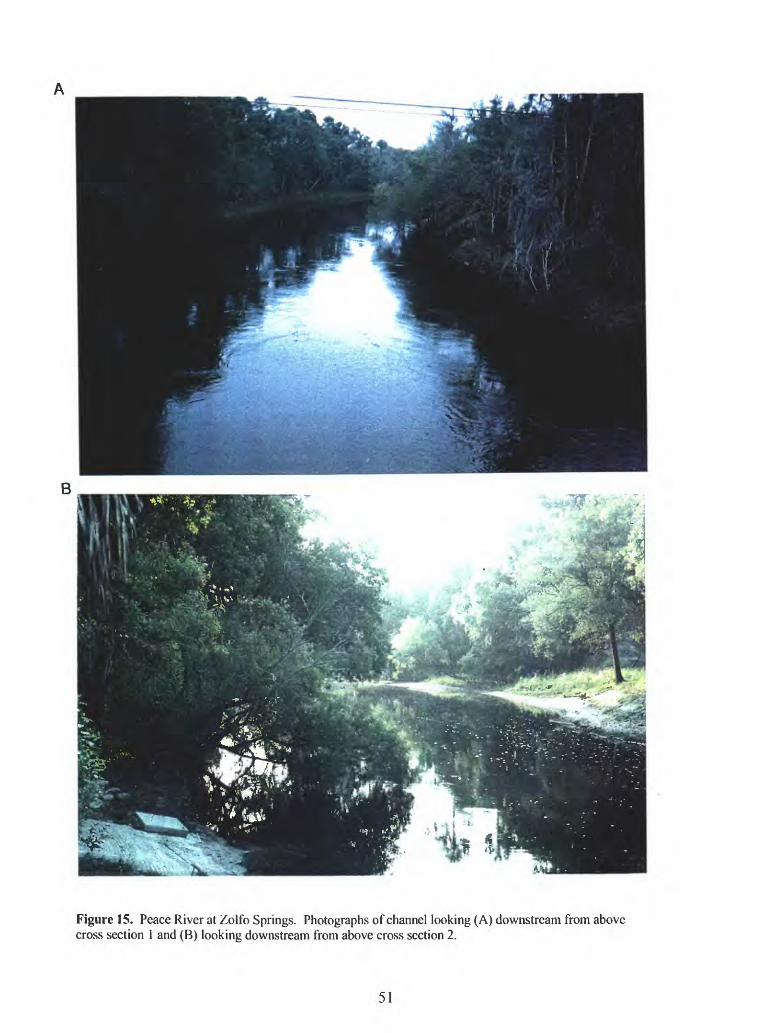
Figure 15. Peace River at Zolfo Springs. Photographs of channel looking (A) downstream from above cross section 1 and (B) looking downstream from above cross section 2.
51
Horse Creek near Mvakka Head
Location of Gage.- Lat 27°29'13", long 82°01 '25", Hardee County, near left bank on
downstream side of bridge on State Highway 64, 3.5 mi northeast of Myakka Head and 39.5 mi
upstream from mouth.
Location of study reach. A two-section, 374 ft long reach; cross section 1 is approximately
700 ft upstream from the stream-gaging station. Crest-stage gages at cross section 1 were used to
measure water-surface elevations at the upstream boundary of the reach. The stream-gaging
station was used to measure water-surface elevations at the downstream boundary of the reach.t ^
Drainage area. 42 mi .
Average discharge. 29.6 ft3/s (water years 1978-94).
Maximum discharge. --2,310 ft3/s, Sept. 6, 1988.
Bed material. Fine sands (98.5%); dj^, 0.27 mm; dw, 0.39 mm.
Channel description. The low-water channel is about 20 ft wide and well defined
throughout the reach. The channel curves to the left through cross section 1, is fairly straight for a
short stretch and then curves back to the right. The channel is straight above and below cross
section 2 (degree of meander = 1.10). There is little cross-section irregularity. Channel shape
varies from triangular in upper portion of the reach to trapezoidal in the lower portion of the reach
with a smooth transition between variations. The streambed is somewhat irregular. There is a
small gravel bar with light vegetation about half-way between cross sections 1 and 2.
Bank descriptions. Boih streambanks are vegetated with small trees, vines, and fairly
dense brush which overhangs the main channel. Both banks are high and not subject to overflow
except at extremely high stages. There are large oak trees and thick palmetto stands along the top
of the both banks.
52
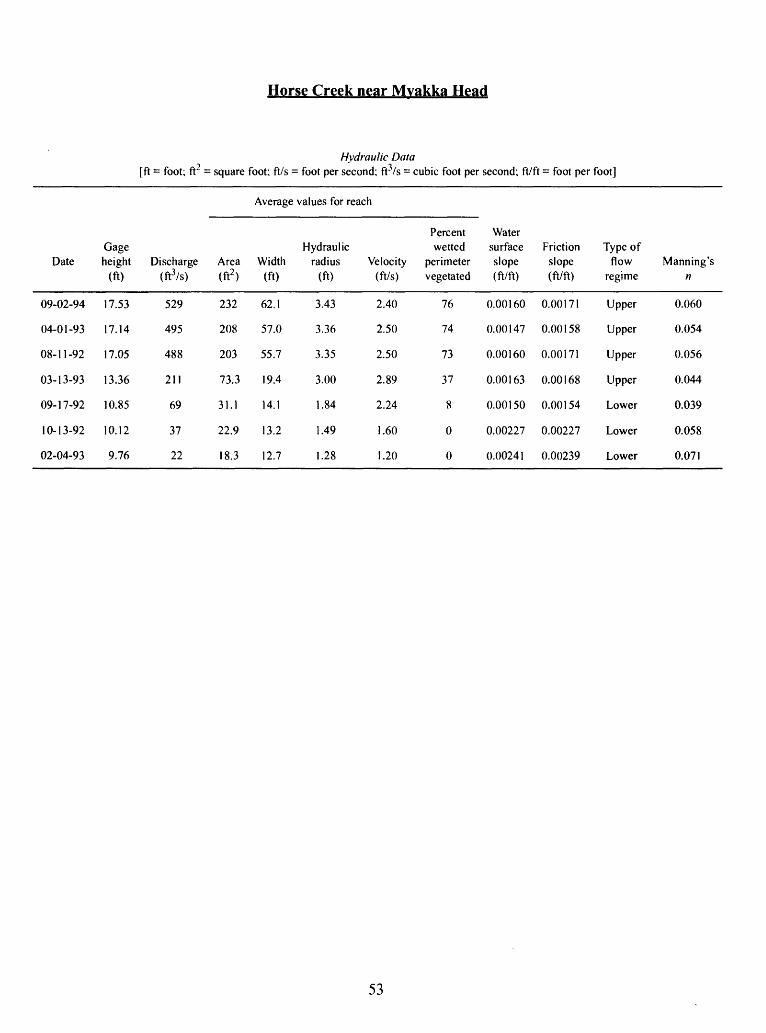
v2_
Horse Creek near Mvakka Head
Hydraulic Data[ft = foot; ft = square foot; ft/s = foot per second; ft/s = cubic foot per second; ft/ft = foot per foot]
Average values for reach
Date
09-02-94
04-01-93
08-11-92
03-13-93
09-17-92
10-13-92
02-04-93
Gage height
(ft)
17.53
17.14
17.05
13.36
10.85
10.12
9.76
Discharge (tf/s)
529
495
488
211
69
37
22
Area (ft2)
232
208
203
73.3
31.1
22.9
18.3
Width (ft)
62.1
57.0
55.7
19.4
14.1
13.2
12.7
Hydraulic radius
(ft)
3.43
3.36
3.35
3.00
1.84
1.49
1.28
Velocity (ft/s)
2.40
2.50
2.50
2.89
2.24
1.60
1.20
Percent wetted
perimeter vegetated
76
74
73
37
8
0
0
Water surface slope (ft/ft)
0.00160
0.00147
0.00160
0.00163
0.00150
0.00227
0.00241
Friction slope (ft/ft)
0.00171
0.00158
0.00171
0.00168
0.00154
0.00227
0.00239
Type of flow
regime
Upper
Upper
Upper
Upper
Lower
Lower
Lower
Manning's n
0.060
0.054
0.056
0.044
0.039
0.058
0.071
53
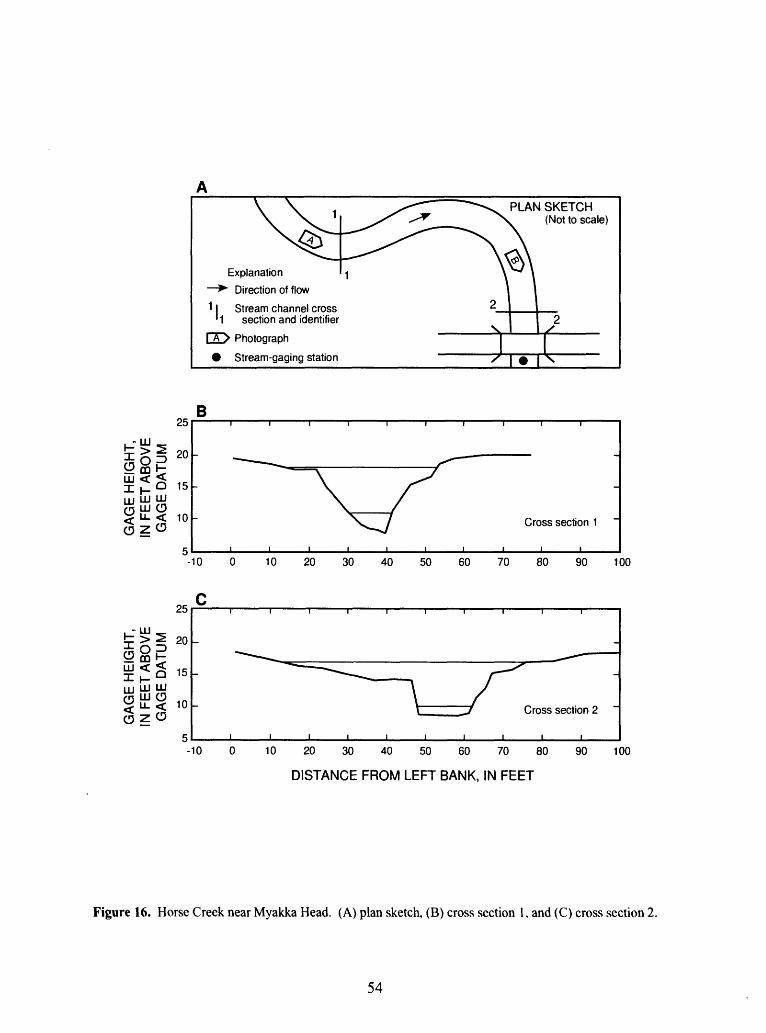
Explanation -\
^ Direction of flow
11 Stream channel cross 1 1 section and identifier
I A > Photograph
Stream-gaging station
PLAN SKETCH(Not to scale)
IIm HI HI3 LIJ o< LL < §20
25
15
10
B
-10 10
Cross section 1
20 30 40 50 60 70 80 90 100
<i3
, -LLJ _|s| 20U co h-UJ < < ..cx H 0 15m LJJ LLJ
Off g 10
ozo
i i i i i i i i i i
' ~^"^^"^ l~~^
\ /\ ____ V uross section k:
i i i i i i i i i i-10 10 20 30 40 50 60 70 80
DISTANCE FROM LEFT BANK, IN FEET
90 100
Figure 16. Horse Creek near Myakka Head. (A) plan sketch, (B) cross section 1, and (C) cross section 2.
54
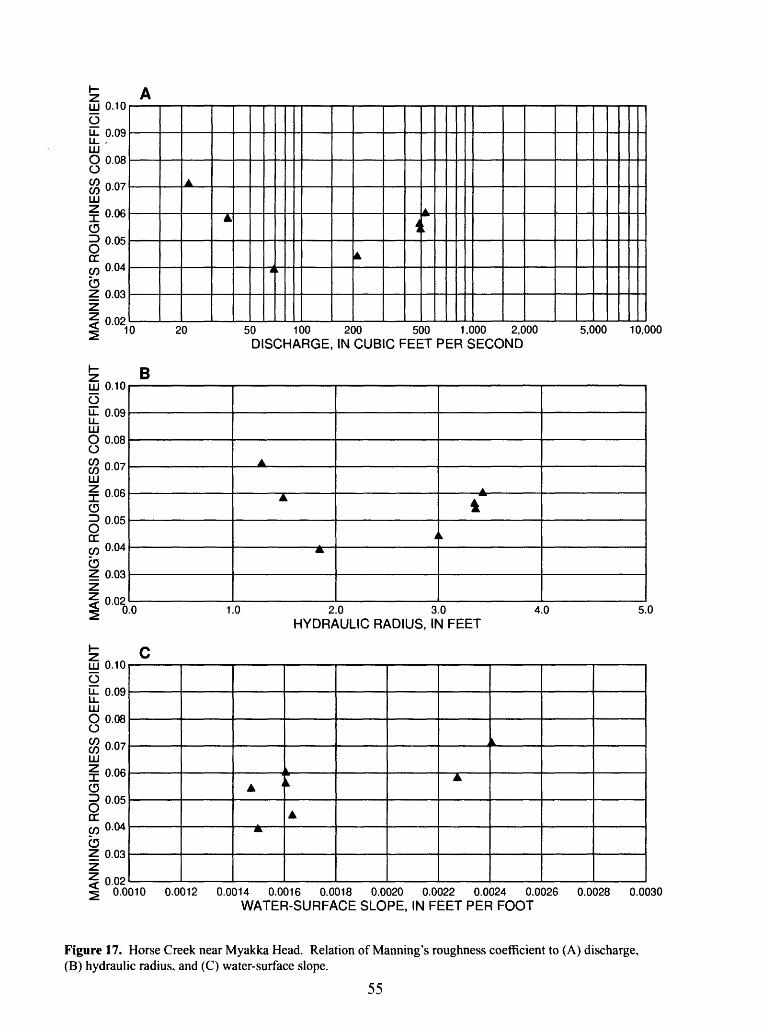
MA
NN
ING
'S R
OU
GH
NE
SS
CO
EF
FIC
IEN
T
MA
NN
ING
'S R
OU
GH
NE
SS
CO
EF
FIC
IEN
T
MA
NN
ING
'S R
OU
GH
NE
SS
CO
EF
FIC
IEN
T
n
9 -
J£
7T
C
p
5P f
fi o
oO
CO O
OQ fl> 3
O
>
O-
35'
o g*
oo
oo
oo
oo
coc
b^
0
0 p b
o o b
oI
s
31 CO
O
|i
CO I p s§
ffll m P
3D
|
O HP 0 o
ro o
b 0 ro 00 o
b
30
OO
OO
OO
-
1
>
> M >
O
oo
oo
oo
oo
cC
0
*
o
o
I
-< D
TJ >£
C°
O TJ 0 C
CO
03
^ b
T
l m
m H o en
o
3O
OO
OO
OO
-
0
CO
^^
C7
1 O
5 "N
j 00
CO
C
1
>
**l >
^
o *k
0
20
50
100
200
500
1,000
2,000
5,000
10,000
DISCHARGE, IN
CUBIC FEET
PER
SECOND
»
p-
*
-*1
^
^
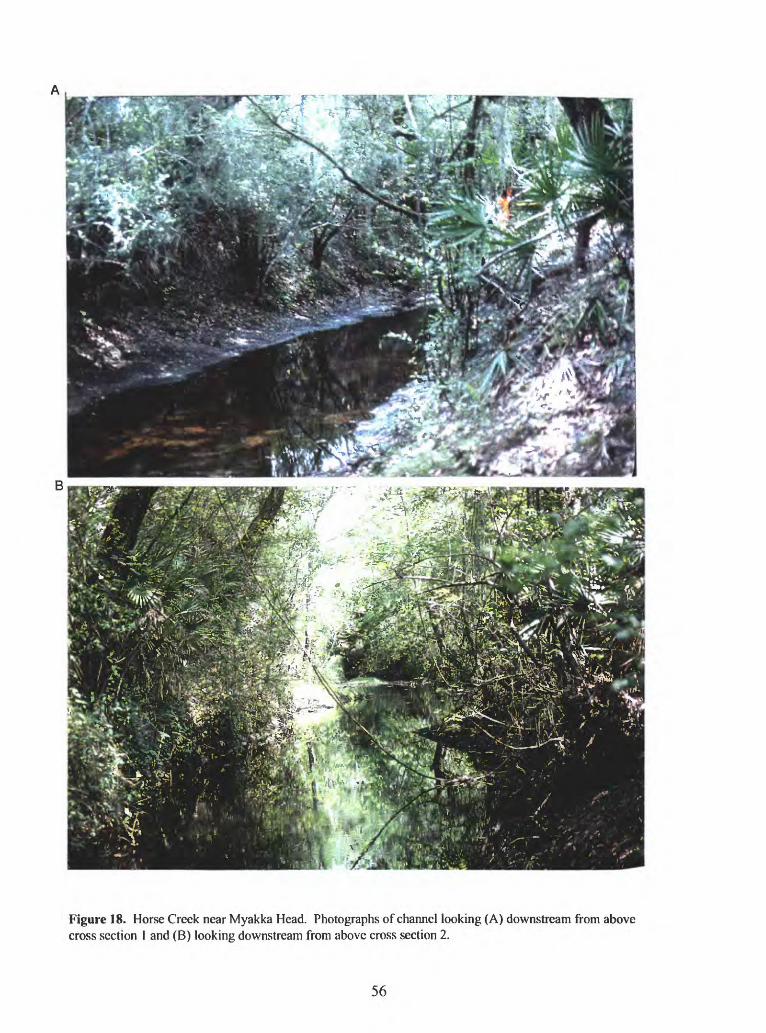
Figure 18. Horse Creek near Myakka Head. Photographs of channel looking (A) downstream from above cross section 1 and (B) looking downstream from above cross section 2.
56
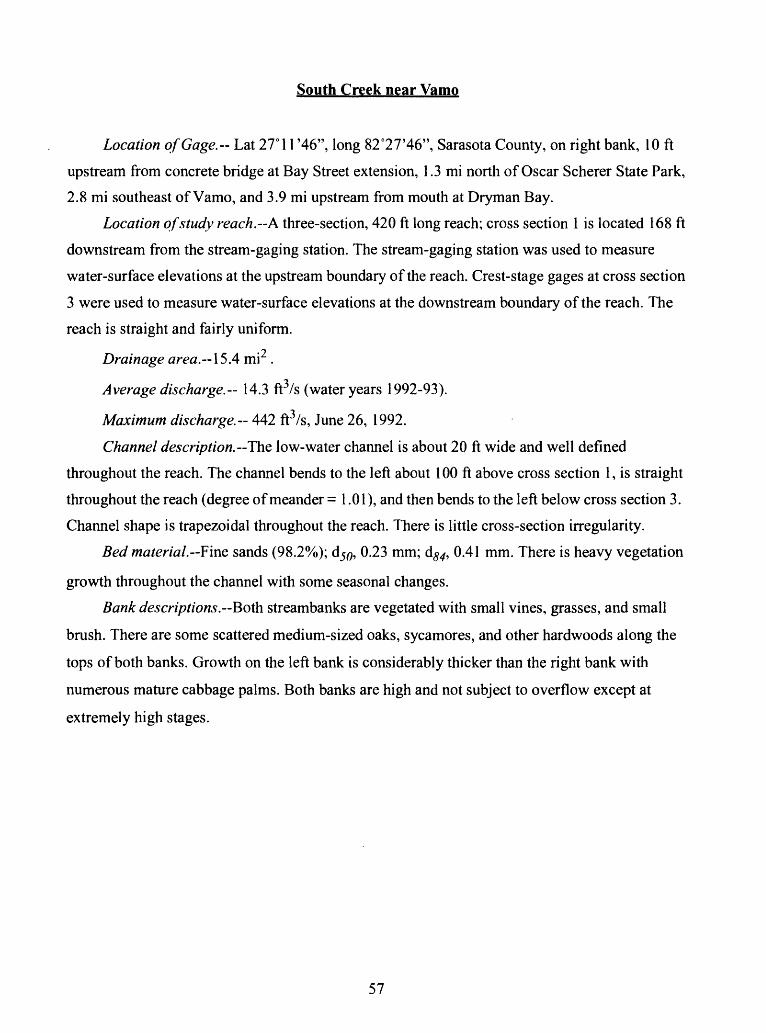
South Creek near Vamo
Location of Gage. Lat 27° 11 '46", long 82°27'46", Sarasota County, on right bank, 10 ft
upstream from concrete bridge at Bay Street extension, 1.3 mi north of Oscar Scherer State Park,
2.8 mi southeast of Vamo, and 3.9 mi upstream from mouth at Dryman Bay.
Location of study reach. A three-section, 420 ft long reach; cross section 1 is located 168 ft
downstream from the stream-gaging station. The stream-gaging station was used to measure
water-surface elevations at the upstream boundary of the reach. Crest-stage gages at cross section
3 were used to measure water-surface elevations at the downstream boundary of the reach. The
reach is straight and fairly uniform.
Drainage area. \5A mi .'j
Average discharge. 14.3 ft /s (water years 1992-93).
Maximum discharge. 442 ft3/s, June 26, 1992.
Channel description.---The low-water channel is about 20 ft wide and well defined
throughout the reach. The channel bends to the left about 100 ft above cross section 1, is straight
throughout the reach (degree of meander = 1.01), and then bends to the left below cross section 3.
Channel shape is trapezoidal throughout the reach. There is little cross-section irregularity.
Bed material.--Fine sands (98.2%); dj^, 0.23 mm; d^, 0.41 mm. There is heavy vegetation
growth throughout the channel with some seasonal changes.
Bank descriptions. Both streambanks are vegetated with small vines, grasses, and small
brush. There are some scattered medium-sized oaks, sycamores, and other hardwoods along the
tops of both banks. Growth on the left bank is considerably thicker than the right bank with
numerous mature cabbage palms. Both banks are high and not subject to overflow except at
extremely high stages.
57
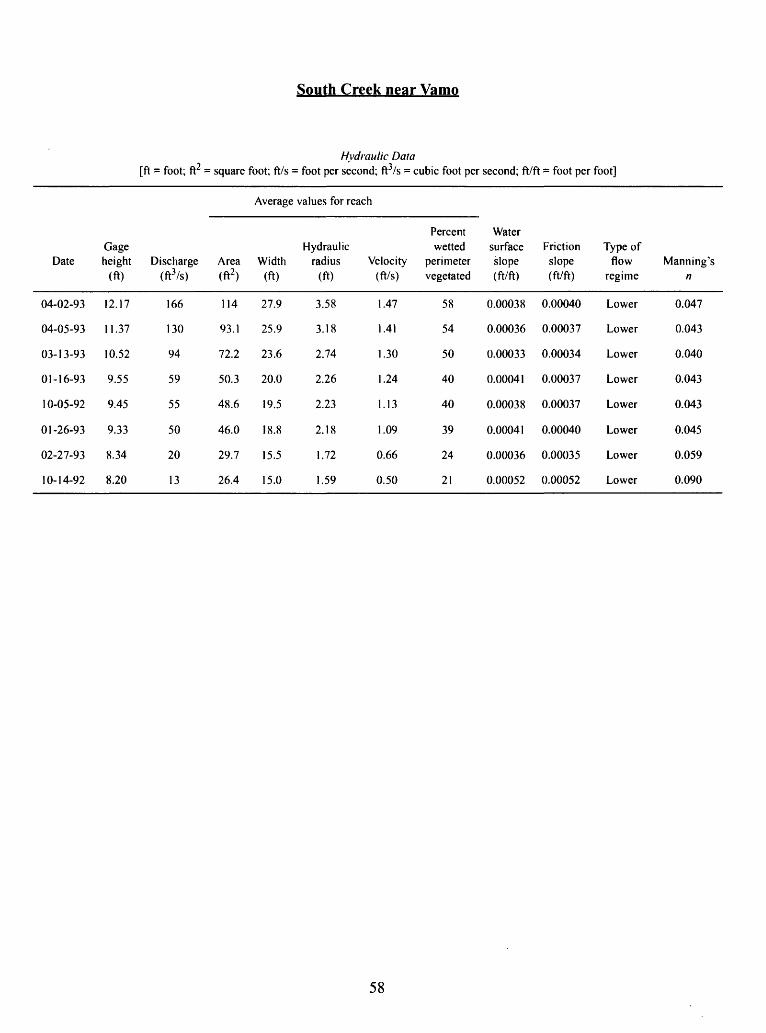
South Creek near Vamo
Hydraulic Data [ft = foot; ft2 = square foot; ft/s = foot per second; ft3/s = cubic foot per second; ft/ft = foot per foot]
Average values for reach
Date
04-02-93
04-05-93
03-13-93
01-16-93
10-05-92
01-26-93
02-27-93
10-14-92
Gageheight
(ft)
12.17
11.37
10.52
9.55
9.45
9.33
8.34
8.20
Discharge(ft3/s)
166
130
94
59
55
50
20
13
Area (ft2 )
114
93.1
72.2
50.3
48.6
46.0
29.7
26.4
Width (ft)
27.9
25.9
23.6
20.0
19.5
18.8
15.5
15.0
Hydraulicradius
(ft)
3.58
3.18
2.74
2.26
2.23
2.18
1.72
1.59
Velocity (ft/s)
1.47
1.41
1.30
1.24
1.13
1.09
0.66
0.50
Percentwetted
perimeter vegetated
58
54
50
40
40
39
24
21
Watersurfaceslope (ft/ft)
0.00038
0.00036
0.00033
0.00041
0.00038
0.00041
0.00036
0.00052
Frictionslope (ft/ft)
0.00040
0.00037
0.00034
0.00037
0.00037
0.00040
0.00035
0.00052
Type offlow
regime
Lower
Lower
Lower
Lower
Lower
Lower
Lower
Lower
Manning's n
0.047
0.043
0.040
0.043
0.043
0.045
0.059
0.090
58
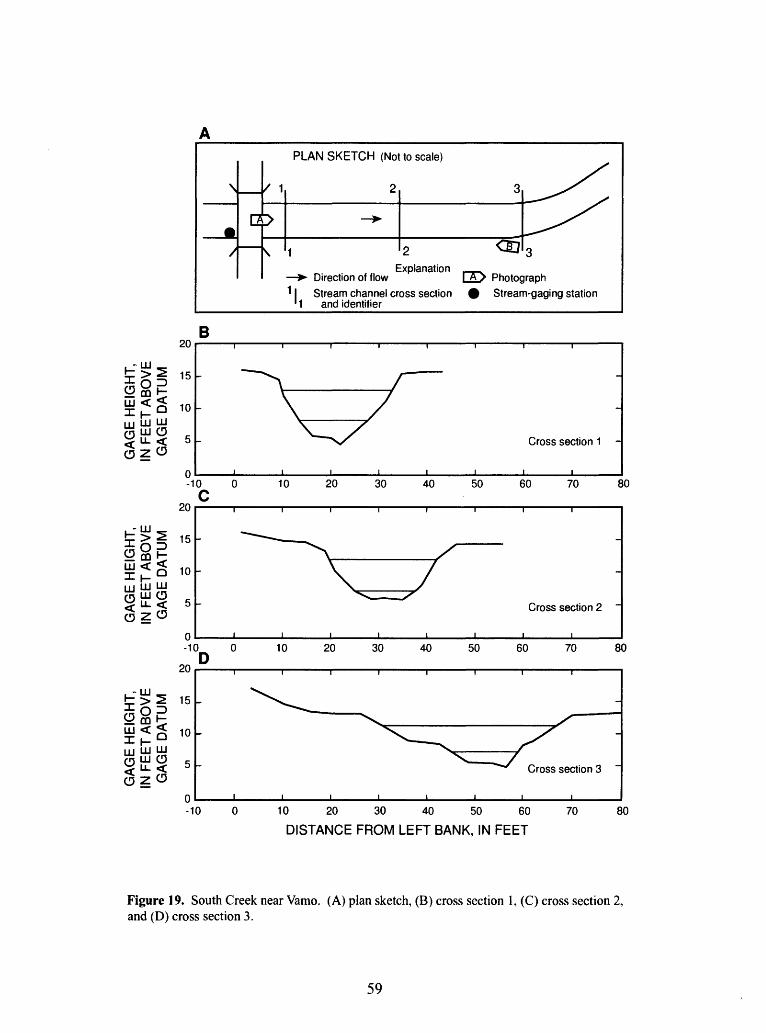
\
-^ D
/ 1
>
PLAN SKETCH (Not to scale)
2 3 ^^^^
-*
V 1 2 ^J
Explanation > Direction of flow [ A> Photo?1 I Stream channel cross section 0 Strear
' 1 and identifier
^jraph n-gaging station
B
,-LJJ _
III£<§
SfflS< IJ- <§2C3
,-LJJ _
III^ < QLJJ LJJ LJJs m ^§2^
^s
§<<LJJ LJJ LJJ
"
^u
15
10
5
ol
11111111
~~~^\ / V ~f
\ /S/ Cross section 1 -
,,,,,,,,-10 0 10 20 30 40 50 60 70 8
C20
15
10
5
0
i i i i i i i i
" -
^\ /
\ /\v S
Cross section 2 ~
,,,,,,,,-10 0 10 20 30 40 50 60 70 8(
D20 -
15
10
5
0
^^^s^^ .S
^^^ _s^ "v^ /^
Cross section 3
i i i t i i i i-10 0 10 20 30 40 50 60 70 8
DISTANCE FROM LEFT BANK, IN FEET
Figure 19. South Creek near Vamo. (A) plan sketch, (B) cross section 1, (C) cross section 2, and (D) cross section 3.
59
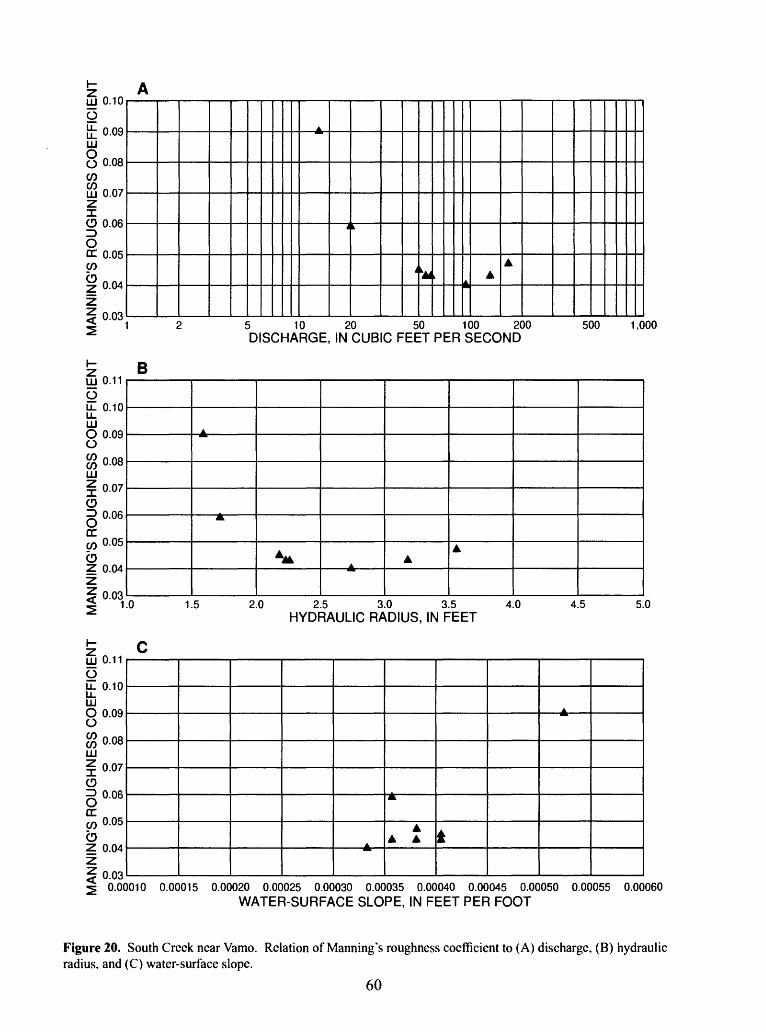
St w
"
y 3
S S
o.
§,* s
MA
NN
ING
'S R
OU
GH
NE
SS
CO
EF
FIC
IEN
T
MA
NN
ING
'S R
OU
GH
NE
SS
CO
EF
FIC
IEN
T
MA
NN
ING
'S R
OU
GH
NE
SS
CO
EF
FIC
IEN
T
ON
O
o
a?
"O
3 on of anning's
roughness coe ffi o (A)
discharge,
(B)
hydrau
0.00010
0.00015
0.00020
0.00025
0.00030
0.00035
0.00040
0.00045
0.00050
0.00055
0.00060
WATER-SURFACE
SLOPE,
IN
FEET
PER
FOOT
30
0O
OO
OO
Ou
bb
bb
bb
I»> ^1
1K
O
oo
oo
oo
oo
c
_»0
0 en ro
o
I OM
33
en
> C O
0°
C
C/D 2 m
01
m
0 en
en 0
30
00
00
0-'--
1
f > *
1>
12
5
10
20
50
100
200
500
1,000
DISCHARGE, IN
CUBIC
FEET
PER
SECOND
sp
pp
oo
oc
3000000^
J*.C
J1O
5^IO
OC
DC
IT > ^*
»
1»>
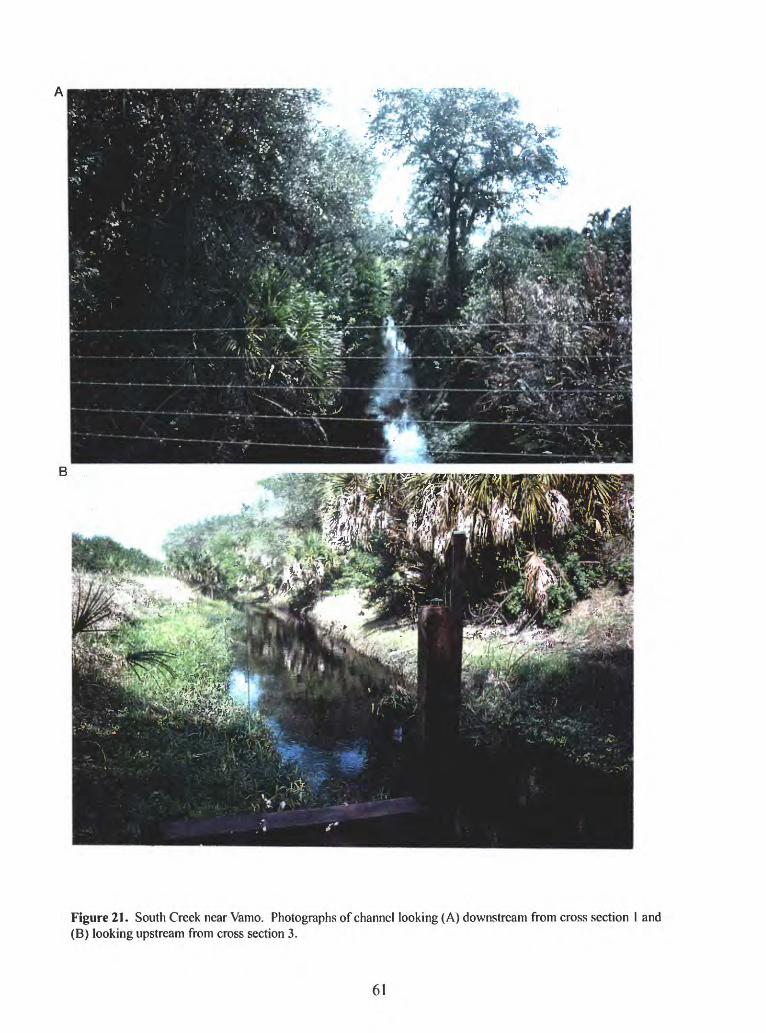
Figure 21. South Creek near Vamo. Photographs of channel looking (A) downstream from cross section 1 and (B) looking upstream from cross section 3.
61
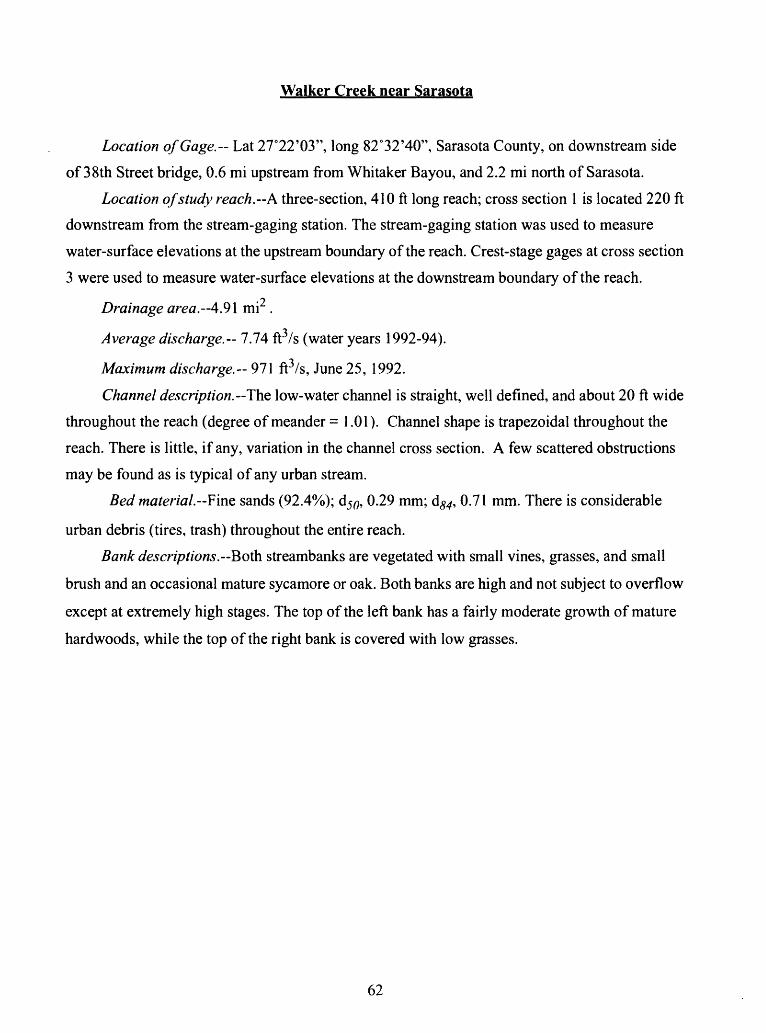
Walker Creek near Sarasota
Location of Gage.- Lat 27°22'03", long 82°32'40", Sarasota County, on downstream side
of 38th Street bridge, 0.6 mi upstream from Whitaker Bayou, and 2.2 mi north of Sarasota.
Location of study reach, A three-section, 410 ft long reach; cross section 1 is located 220 ft
downstream from the stream-gaging station. The stream-gaging station was used to measure
water-surface elevations at the upstream boundary of the reach. Crest-stage gages at cross section
3 were used to measure water-surface elevations at the downstream boundary of the reach.
Drainage area. 4.91 mi2 .'j
Average discharge. 7.74 ft /s (water years 1992-94).
Maximum discharge.-- 971 ft /s, June 25, 1992.
Channel description. The low-water channel is straight, well defined, and about 20 ft wide
throughout the reach (degree of meander = 1.01). Channel shape is trapezoidal throughout the
reach. There is little, if any, variation in the channel cross section. A few scattered obstructions
may be found as is typical of any urban stream.
Bed material Fine sands (92.4%); dj^, 0.29 mm; d^, 0.71 mm. There is considerable
urban debris (tires, trash) throughout the entire reach.
Bank descriptions. Both streambanks are vegetated with small vines, grasses, and small
brush and an occasional mature sycamore or oak. Both banks are high and not subject to overflow
except at extremely high stages. The top of the left bank has a fairly moderate growth of mature
hardwoods, while the top of the right bank is covered with low grasses.
62
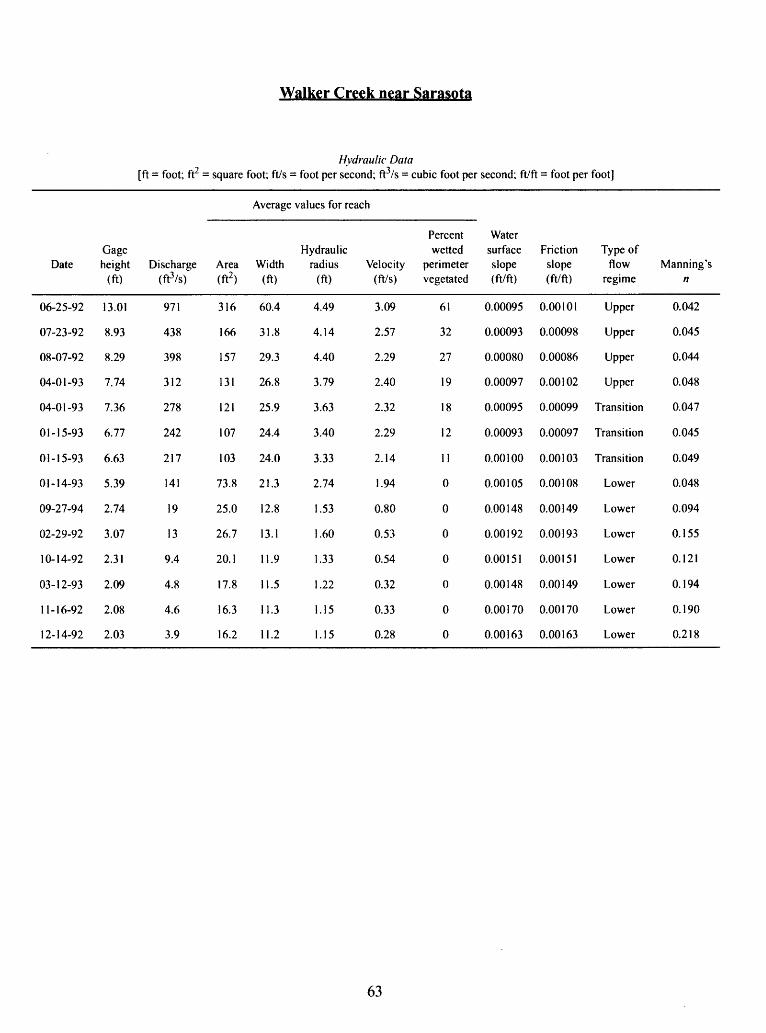
Walker Creek near Sarasota
Hydraulic Data [ft = foot; ft7 = square foot; ft/s = foot per second; fVVs = cubic foot per second; ft/ft = foot per foot]v2_
Average values for reach
Date
06-25-92
07-23-92
08-07-92
04-01-93
04-01-93
01-15-93
01-15-93
01-14-93
09-27-94
02-29-92
10-14-92
03-12-93
11-16-92
12-14-92
Gage height
(ft)
13.01
8.93
8.29
7.74
7.36
6.77
6.63
5.39
2.74
3.07
2.31
2.09
2.08
2.03
Discharge (ft3/s)
971
438
398
312
278
242
217
141
19
13
9.4
4.8
4.6
3.9
Area (ft2 )
316
166
157
131
121
107
103
73.8
25.0
26.7
20.1
17.8
16.3
16.2
Width (ft)
60.4
31.8
29.3
26.8
25.9
24.4
24.0
21.3
12.8
13.1
11.9
11.5
11.3
11.2
Hydraulic radius
(ft)
4.49
4.14
4.40
3.79
3.63
3.40
3.33
2.74
1.53
1.60
1.33
1.22
1.15
1.15
Velocity (ft/s)
3.09
2.57
2.29
2.40
2.32
2.29
2.14
1.94
0.80
0.53
0.54
0.32
0.33
0.28
Percentwetted
perimeter vegetated
61
32
27
19
18
12
11
0
0
0
0
0
0
0
Watersurface slope (ft/ft)
0.00095
0.00093
0.00080
0.00097
0.00095
0.00093
0.00100
0.00105
0.00148
0.00192
0.00151
0.00148
0.00170
0.00163
Friction slope (ft/ft)
0.00101
0.00098
0.00086
0.00102
0.00099
0.00097
0.00103
0.00108
0.00149
0.00193
0.00151
0.00149
0.00170
0.00163
Type of flow
regime
Upper
Upper
Upper
Upper
Transition
Transition
Transition
Lower
Lower
Lower
Lower
Lower
Lower
Lower
Manning's n
0.042
0.045
0.044
0.048
0.047
0.045
0.049
0.048
0.094
0.155
0.121
0.194
0.190
0.218
63
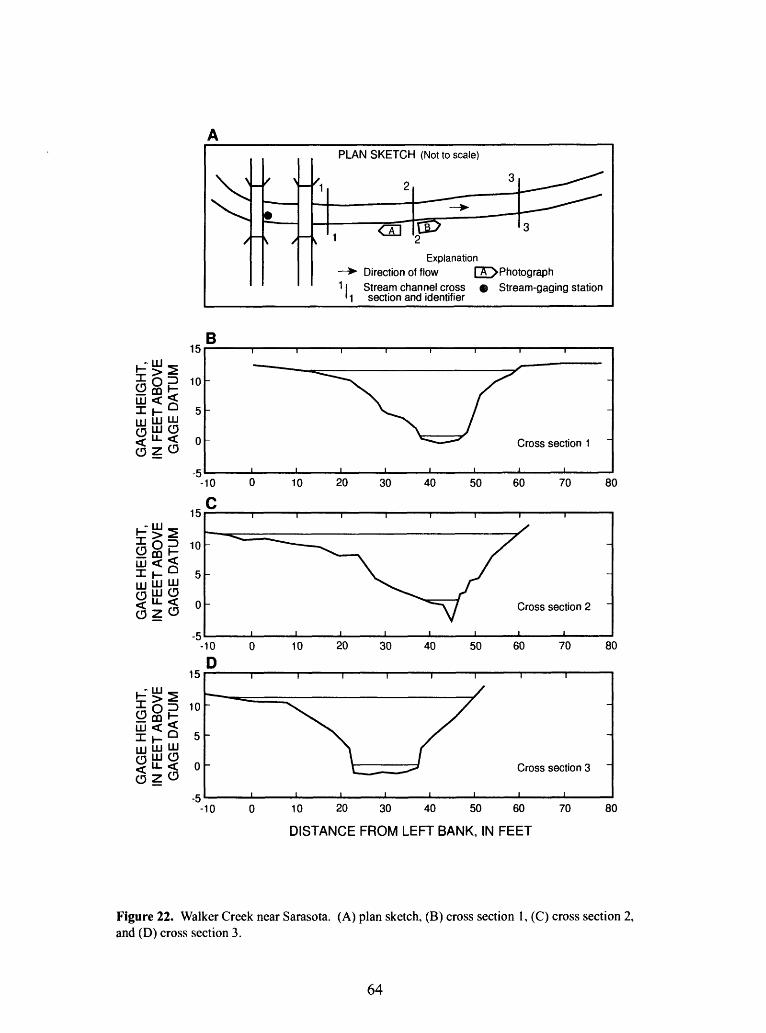
PLAN SKETCH (Not to scale)
Explanation -> Direction of flow nOPhotograph11 Stream channel cross Stream-gaging station
' 1 section and identifier
illB
-5
H
II!£<2gffio< U- < §ZO
15
10
5
0
-5
15
10
5
0
-10
C
-10
D
-5
10
10
i r
20 30 40 50
20 30 40 50
Cross section 1
60 70 80
Cross section 2
60 70 80
Cross section 3
____i____I-10 0 10 20 30 40 50 60 70 80
DISTANCE FROM LEFT BANK, IN FEET
Figure 22. Walker Creek near Sarasota. (A) plan sketch, (B) cross section 1, (C) cross section 2, and (D) cross section 3.
64
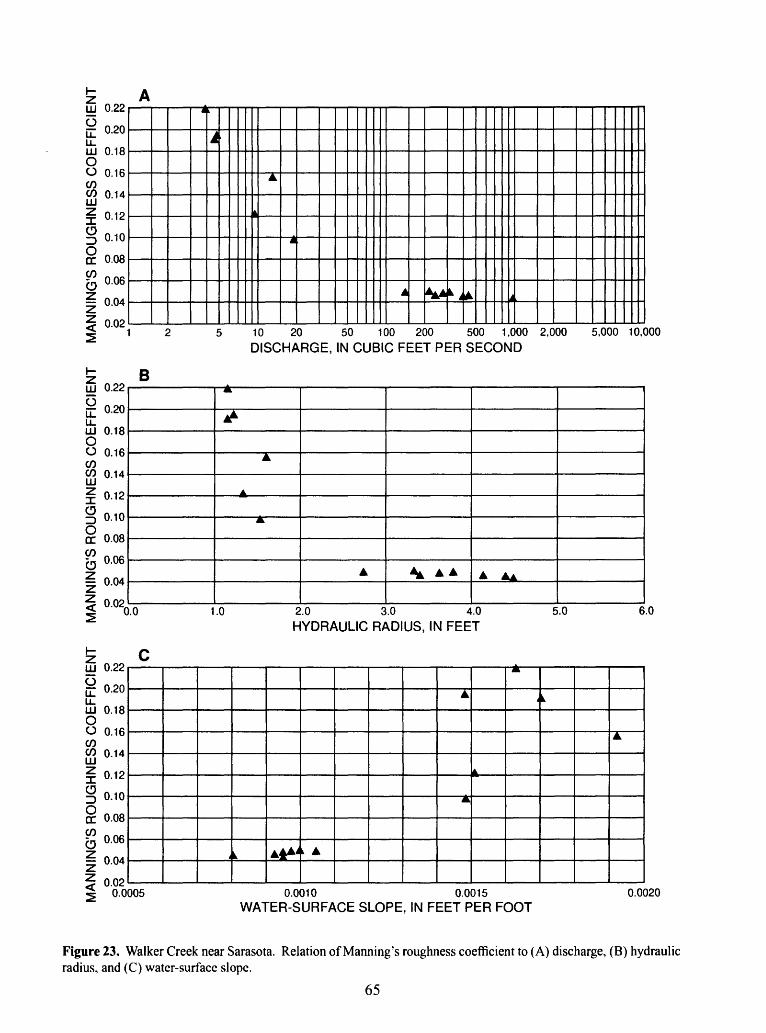
3 2
ON
PS o
MA
NN
ING
'S R
OU
GH
NE
SS
CO
EF
FIC
IEN
T
MA
NN
ING
'S R
OU
GH
NE
SS
CO
EF
FIC
IEN
T
MA
NN
ING
'S R
OU
GH
NE
SS
CO
EF
FIC
IEN
T
3
Sn>
3'
1 O. £T o'
o s D5
OQ << D
.
CO
Cb
/o
tn
> m 7o
0)0
c2
33 <
=>T
l> O m C/
)
O -D m z Tl m
m H o
TJ
Sm
ii33
w
Tl
O
0
o
b
3
C3
C
0
t
3
C
2 i
> i3
C
g
§
3
C
^
C I
3
C
3 r3
C
0
4
*
3
C
». a *
3
C
15 0
3
C
0
C »> -+ 3
C
0
N
3 N 1
o
C
0*
o b
I
ro-<
b
D
33
> C i O D °
C Z Tl m
m A
H b 01 o 0
5O
3
C
3 53
C
1 §
> ^ * > * '
3 C
§ §3
C.
i c 3
C
3 r 13
C
0 J
>
3 C
». 0 -
3 C
D 03
C
: £ V
3
C
§
R 1
1
2
5
10
20
50
100
200
500
1,000
2,000
5,000
10,000
DISCHARGE, IN
CUBIC
FEET
PER
SECOND
». t *~ t
p
*
fe. 1
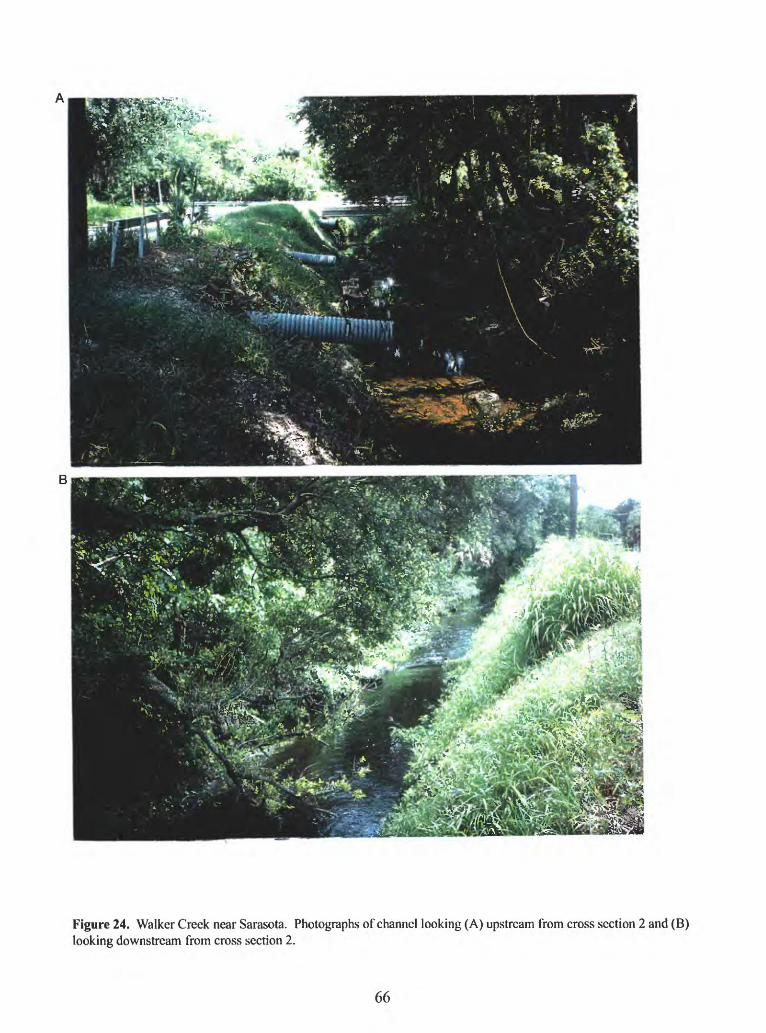
Figure 24. Walker Creek near Sarasota. Photographs of channel looking (A) upstream from cross section 2 and (B) looking downstream from cross section 2.
66
Bullfrog Creek near Wimauma
Location of Gage.- Lat 27°47'30", long 82°21'08", Hillsborough County, near center of
span on downstream side of bridge on State Highway 672-S, 0.6 mi downstream from Little
Bullfrog Creek, 6.0 mi northwest of Wimauma, and 8.7 mi upstream from mouth.
Location of study reach. A. five-section, 1,035 ft long reach; cross section 1 is located
530 ft downstream from the stream-gaging station. Crest-stage gages located at cross sections 1,
3, and 5 were used to measure water-surface elevations. The reach meanders through a park and
the low-water channel is fairly uniform.^Drainage area. 29\ mi .
Average discharge.-40. 6 ft3/s (water years 1957-94).
Maximum discharge. -5,200 ft3/s, Sept. 11, 1960.
Channel description.--The low-water channel is smooth and well defined, trapezoidal in
shape, and with little cross-section irregularity. The low-water channel is about 30 ft wide
throughout the reach with a slight variation near cross section 4 where it is about 50 ft wide. It
does meander through a wooded area (degree of meander = 1.38). There are a few obstructions
between cross sections 1 and 2, otherwise the channel is clear.
Bed material. Fine sands (100%); dj^, 0.29 mm; d^, 0.42 mm.
Bank descriptions. Both streambanks are vegetated with small vines, grasses, and small
brush. The top of both banks are covered with dense palmetto stands and large oaks and other
hardwoods. The right bank is lower than the left bank and will overflow at high stages. The left
bank is subject to overflow only at very high stages.
67
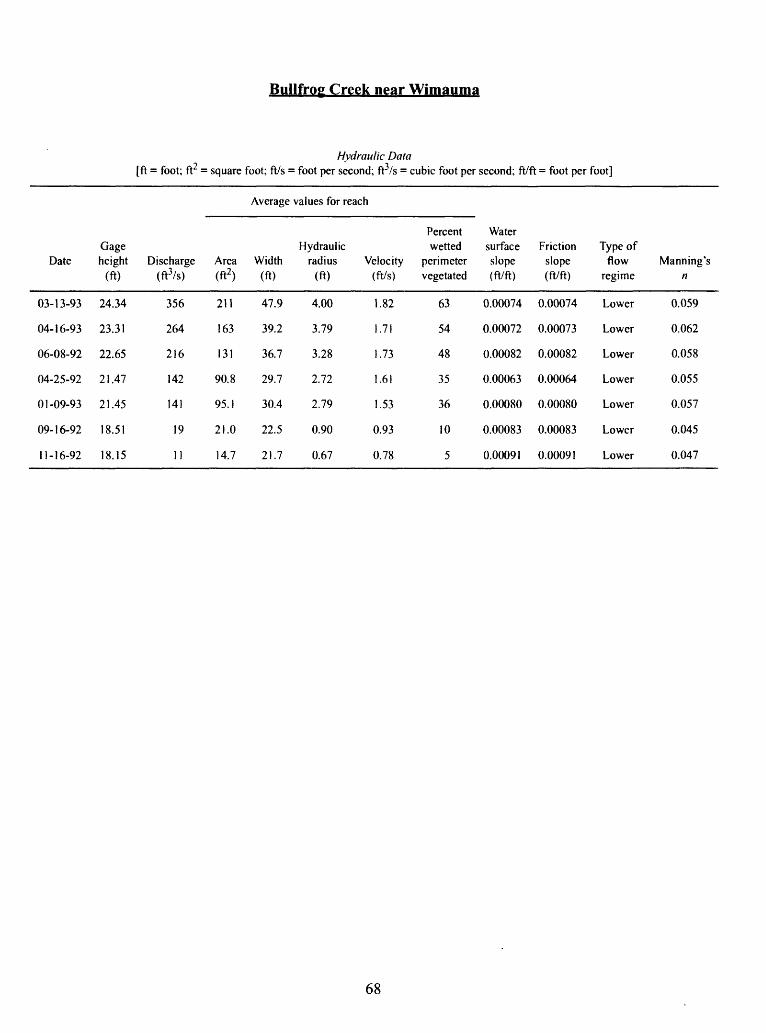
Bullfrog Creek near Wimauma
Hydraulic Data [ft = foot; ft2 = square foot; ft/s = foot per second; ft3/s = cubic foot per second; ft/ft = foot per foot]
Average values for reach
Date
03-13-93
04-16-93
06-08-92
04-25-92
01-09-93
09-16-92
11-16-92
Gage height
(ft)
24.34
23.31
22.65
21.47
21.45
18.51
18.15
Discharge(ft3/s)
356
264
216
142
141
19
11
Area (ft2 )
211
163
131
90.8
95.1
21.0
14.7
Width (ft)
47.9
39.2
36.7
29.7
30.4
22.5
21.7
Hydraulic radius
(ft)
4.00
3.79
3.28
2.72
2.79
0.90
0.67
Velocity(ft/s)
1.82
1.71
1.73
1.61
1.53
0.93
0.78
Percent wetted
perimeter vegetated
63
54
48
35
36
10
5
Water surface slope (ft/ft)
0.00074
0.00072
0.00082
0.00063
0.00080
0.00083
0.00091
Friction slope (ft/ft)
0.00074
0.00073
0.00082
0.00064
0.00080
0.00083
0.00091
Type of flow
regime
Lower
Lower
Lower
Lower
Lower
Lower
Lower
Manning's n
0.059
0.062
0.058
0.055
0.057
0.045
0.047
68
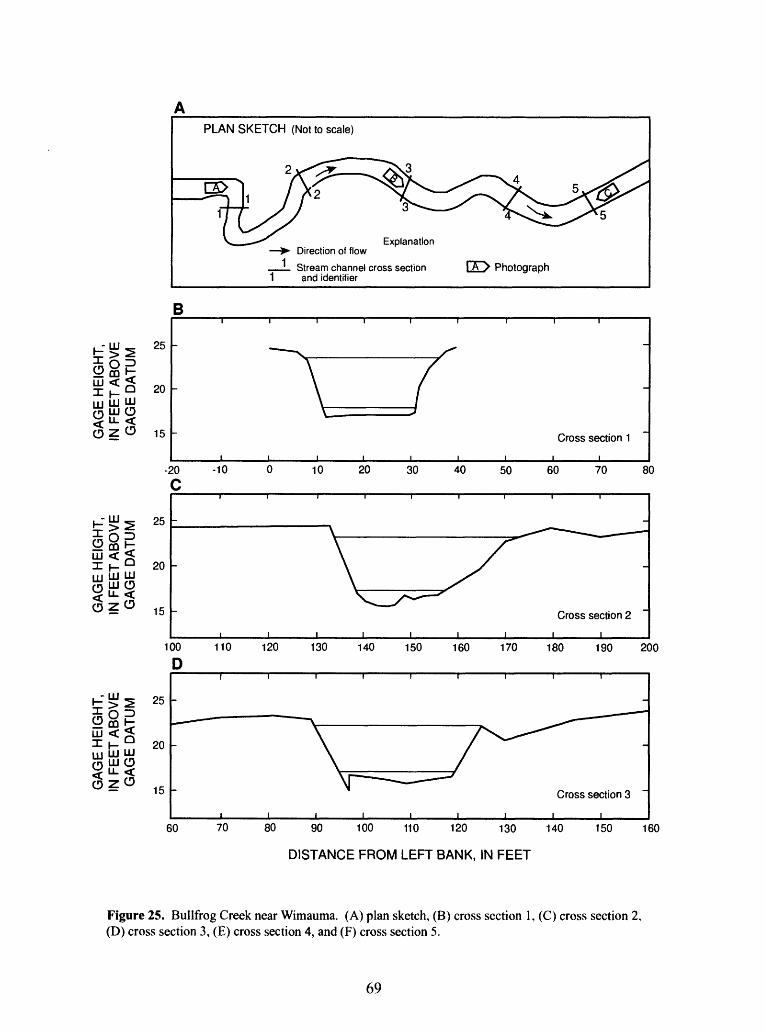
PLAN SKETCH (Not to scale)
Stream channel cross section 1 and identifier
B
IllUJ UJUJ O u- <
25
20
15
-20
C
25
20
15
100
D
ilLU UJ LU
25
20
15
-10 10 20 30 40 50
Cross section 1
60 70 80
Cross section 2
110 120 130 140 150 160 170 180 190 200
Cross section 3
60 70 80 90 100 110 120 130 140
DISTANCE FROM LEFT BANK, IN FEET
150 160
Figure 25. Bullfrog Creek near Wimauma. (A) plan sketch, (B) cross section 1, (C) cross section 2, (D) cross section 3, (E) cross section 4, and (F) cross section 5.
69
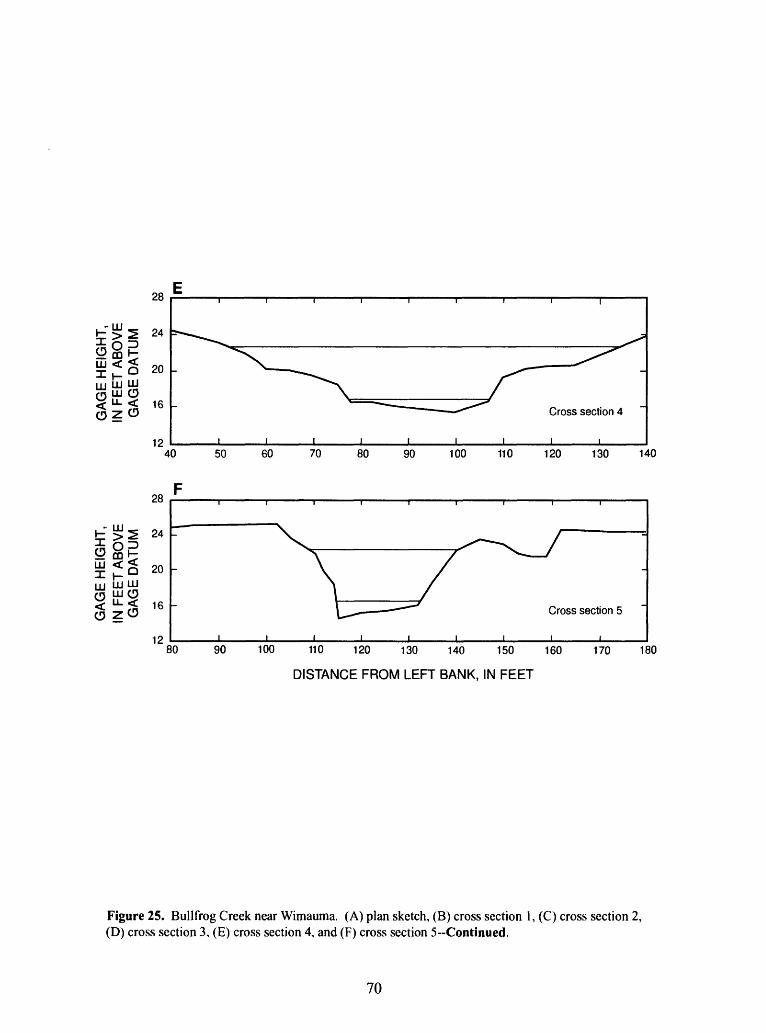
GAGE HEIGHT, IN FEET ABOVE GAGE DATUM
28
24 =
20 -
16 -
1240
Cross section 4
50 60 70 80 90 100 110 120 130 140
28
GAGE HEIGHT, IN FEET ABOVE GAGE DATUM
24 r
20 -
16
12
Cross section 5
80 90 100 110 120 130 140 150 160
DISTANCE FROM LEFT BANK, IN FEET
170 180
Figure 25. Bullfrog Creek near Wimauma. (A) plan sketch, (B) cross section 1, (C) cross section 2, (D) cross section 3, (E) cross section 4, and (F) cross section 5--Continued.
70
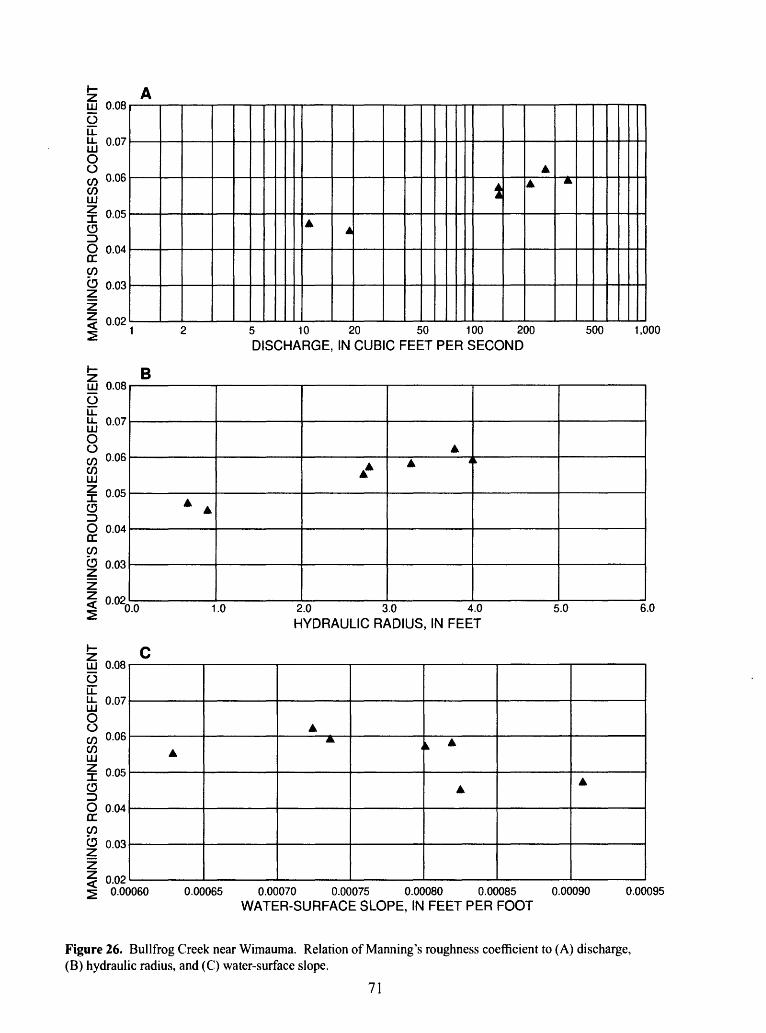
MA
NN
ING
'S R
OU
GH
NE
SS
CO
EF
FIC
IEN
T
MA
NN
ING
'S R
OU
GH
NE
SS
CO
EF
FIC
IEN
T
MA
NN
ING
'S R
OU
GH
NE
SS
CO
EF
FIC
IEN
T
o'
003
S.&
^
c 3
y3 e
ra n
3?
^
<9^
Stfl
-t
7 ^
C/2
3 if S I
t/5
05 3 B"
era o
era o >
_0
0
O
O
O
O
C
3.00060
0.00065
0.00070
WATER-J
C
33 O§
m§
5*
mo
zS
nS
m
o
m o
33 b
~n S os o o
o o o
o
3
O
O
O
O
O
C3
GO
^
01
o>
-vj
a
*
-
* ^
*
O
o
o
o
o
o
o
co
o
o
o
o
o
c
^ro
GO
-tk
01
o>
-s
j a
o o
I
ro-<
bO 33 > C | O 33 O
<=>
C CO z ~n
m m .*
>.H
b 01 o
>
^
^. ^
*
c ^
0UI
CO o I > _
33 o
0
m 5
MO
°C
CD O T
l m
m a
H °
-o m 33 cos
m o
o
0 z O
ro o en 8 . o
3 C
5
g
3 C
5 S3
C
I I
*
^>
3
C
S S
^»> ^ l>3
C
g S
>
3
C
3 S
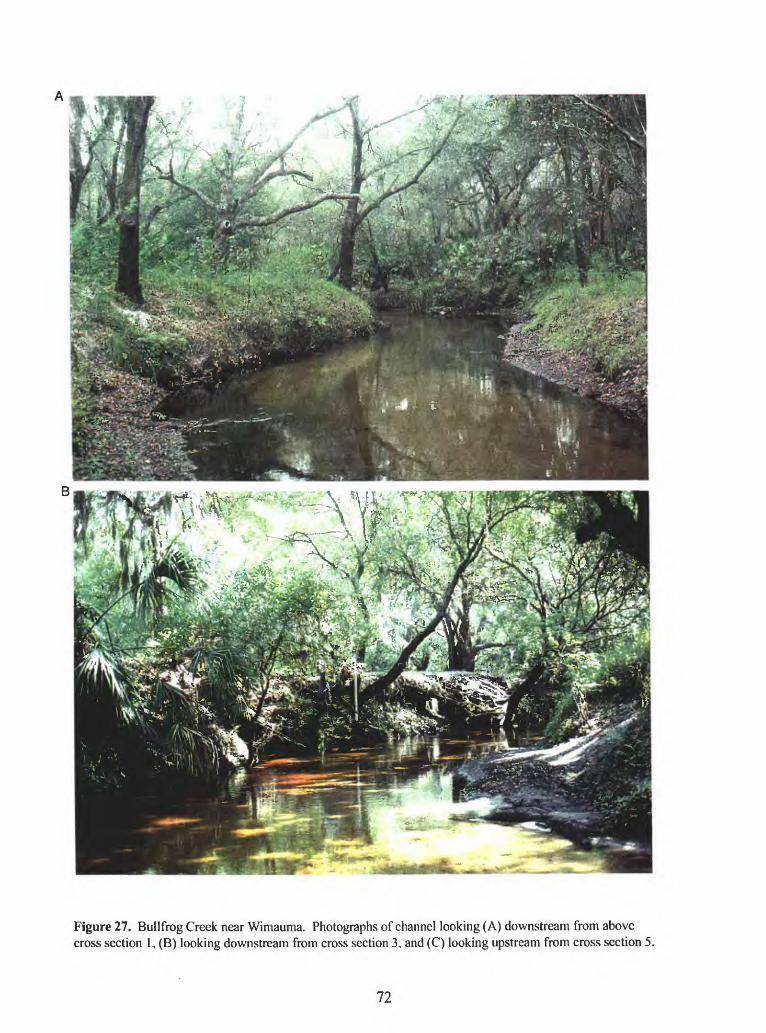
Figure 27. Bullfrog Creek near Wimauma. Photographs of channel looking (A) downstream from above cross section 1, (B) looking downstream from cross section 3. and (C) looking upstream from cross section 5.
72
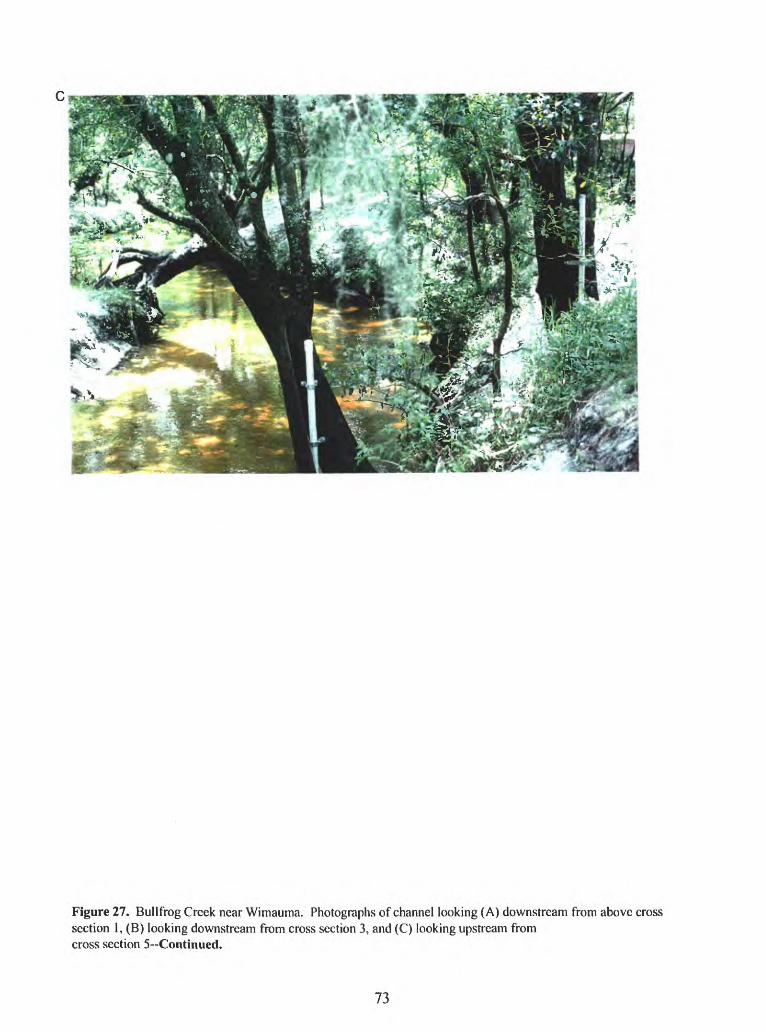
Figure 27. Bullfrog Creek near Wimauma. Photographs of channel looking (A) downstream from above cross section 1, (B) looking downstream from cross section 3, and (C) looking upstream from cross section 5 Continued.
73
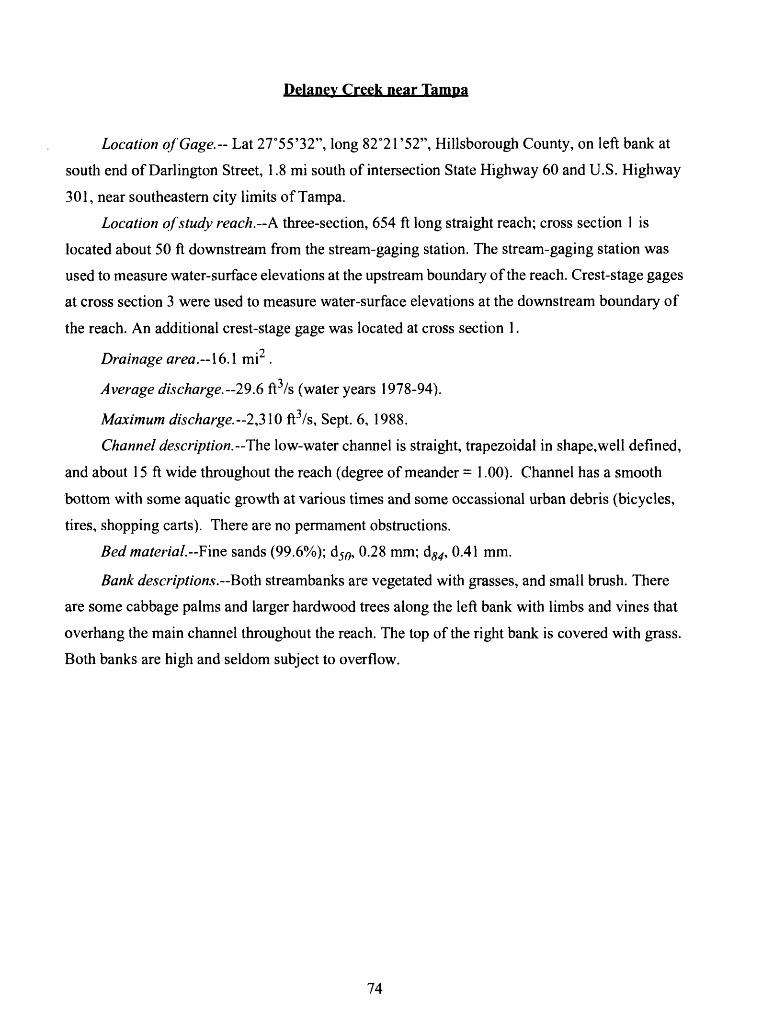
Delaney Creek near Tampa
Location of Gage.- Lat 27°55'32", long 82°21'52", Hillsborough County, on left bank at
south end of Darlington Street, 1.8 mi south of intersection State Highway 60 and U.S. Highway
301, near southeastern city limits of Tampa.
Location of study reach.--A three-section, 654 ft long straight reach; cross section 1 is
located about 50 ft downstream from the stream-gaging station. The stream-gaging station was
used to measure water-surface elevations at the upstream boundary of the reach. Crest-stage gages
at cross section 3 were used to measure water-surface elevations at the downstream boundary of
the reach. An additional crest-stage gage was located at cross section 1.^ ^
Drainage area. \ 6.1 mi .
Average discharge.-29.6 ft /s (water years 1978-94).
Maximum discharge.~2,3\Q ft3/s, Sept. 6, 1988.
Channel description.---The low-water channel is straight, trapezoidal in shape,well defined,
and about 15 ft wide throughout the reach (degree of meander = 1.00). Channel has a smooth
bottom with some aquatic growth at various times and some occassional urban debris (bicycles,
tires, shopping carts). There are no permament obstructions.
Bed material. Pine sands (99.6%); dj^, 0.28 mm; d^, 0.41 mm.
Bank descriptions. Both streambanks are vegetated with grasses, and small brush. There
are some cabbage palms and larger hardwood trees along the left bank with limbs and vines that
overhang the main channel throughout the reach. The top of the right bank is covered with grass.
Both banks are high and seldom subject to overflow.
74
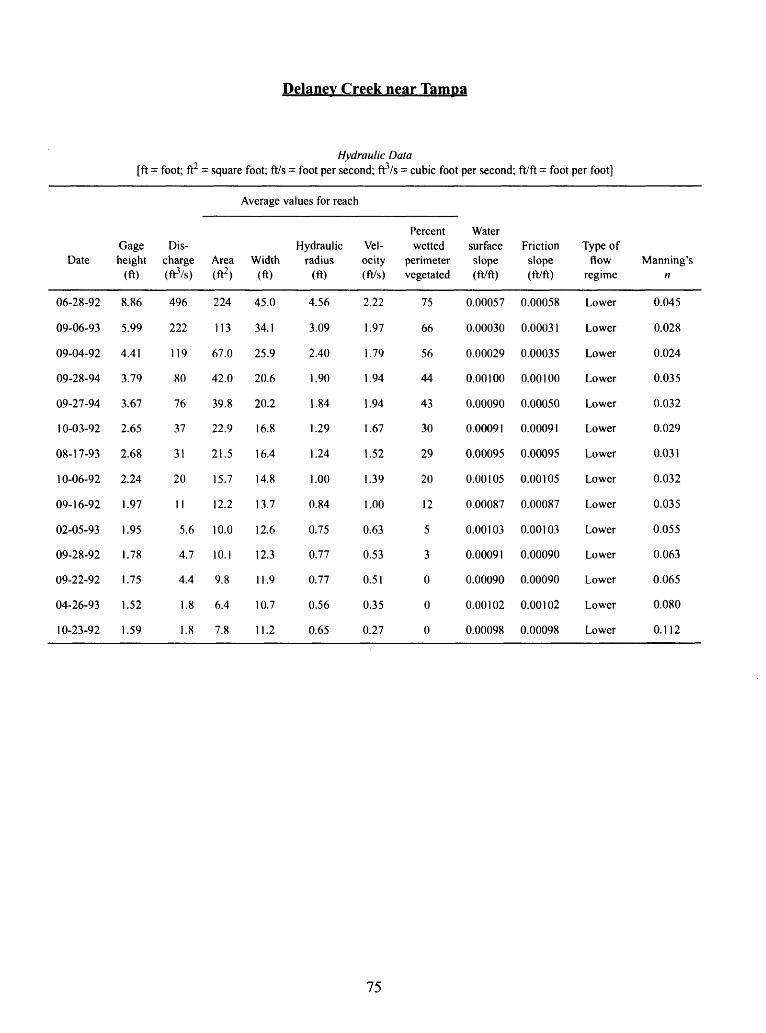
Delanev Creek near Tamoa
Hydraulic Data [ft = foot; ft2 = square foot; ft/s = foot per second; ft3/s = cubic foot per second; ft/ft = foot per foot]
Average values for reach
Date
06-28-92
09-06-93
09-04-92
09-28-94
09-27-94
10-03-92
08-17-93
10-06-92
09-16-92
02-05-93
09-28-92
09-22-92
04-26-93
10-23-92
Gageheight
(ft)
8.86
5.99
4.41
3.79
3.67
2.65
2.68
2.24
1.97
1.95
1.78
1.75
1.52
1.59
Discharge(ft3/*)
496
222
119
80
76
37
31
20
11
5.6
4.7
4.4
1.8
1.8
Area (ft2 )
224
113
67.0
42.0
39.8
22.9
21.5
15.7
12.2
10.0
10.1
9.8
6.4
7.8
Width (ft)
45.0
34.1
25.9
20.6
20.2
16.8
16.4
14.8
13.7
12.6
12.3
11.9
10.7
11.2
Hydraulicradius
(ft)
4.56
3.09
2.40
1.90
1.84
1.29
1.24
1.00
0.84
0.75
0.77
0.77
0.56
0.65
Velocity (ft/s)
2.22
1.97
1.79
1.94
1.94
1.67
1.52
1.39
1.00
0.63
0.53
0.51
0.35
0.27
Percentwetted
perimeter vegetated
75
66
56
44
43
30
29
20
12
5
3
0
0
0
Watersurfaceslope (ft/ft)
0.00057
0.00030
0.00029
0.00100
0.00090
0.00091
0.00095
0.00105
0.00087
0.00103
0.00091
0.00090
0.00102
0.00098
Frictionslope (ft/ft)
0.00058
0.00031
0.00035
0.00100
0.00050
0.00091
0.00095
0.00105
0.00087
0.00103
0.00090
0.00090
0.00102
0.00098
Type offlow
regime
Lower
Lower
Lower
Lower
Lower
Lower
Lower
Lower
Lower
Lower
Lower
Lower
Lower
Lower
Manning's n
0.045
0.028
0.024
0.035
0.032
0.029
0.031
0.032
0.035
0.055
0.063
0.065
0.080
0.112
75
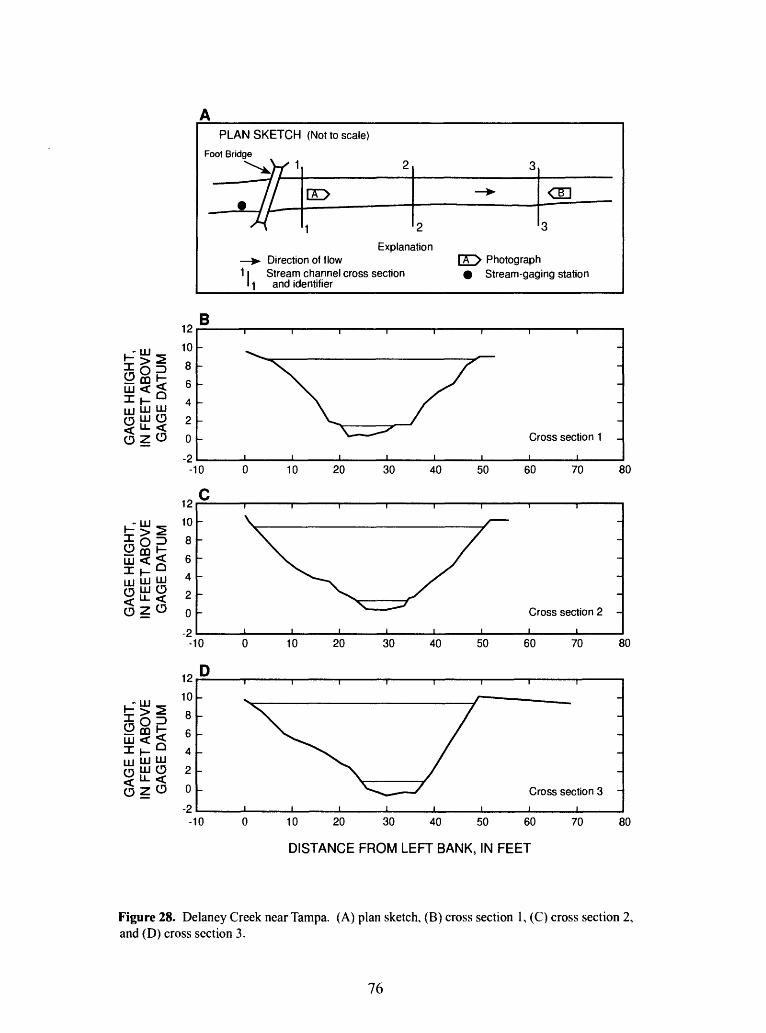
^">2
5°?UJ < <3!l- QUJ UJ UJS UJ O < u_ <ozo
,-LLJ _T > 5
i8|UJ < <X h- QUJ UJ UJS UJ O < u- <§zo
_ 1 1 1
*F> 55§gUJ < <x K QQJ UJ UJ
<3£g << ^ <5zo
PLAN SKETCH (Not to scale)
Foot Bridge
^±)Y 1 2""/v ^^ 1
3
-^ <H
2 3
Explanation >- Direction of flow1 1 Stream channel cross section
1 1 and identifier
B12
10
8
6
4
2
0
-2
F7r> Photograph Stream-gaging station
/v ^^
i i i i-10 0 10 20 30
12r 10
8
6
4
2
0
-2
V
.>^ -^
1 1 1 1-10 0 10 20 30
n12
10
8
6
4
2
0
-9
^
X^
.x^yT
-
Cross section 1 _
i i i i40 50 60 70 8
i i i i
^r ~
/
sCross section 2 -
i i i i40 50 60 70 8
; ~V / ;^^^- '
1 1 1 1
-10 0 10 20 30
' Cross section 3 -i i i i
40 50 60 70 8
DISTANCE FROM LEFT BANK, IN FEET
Figure 28. Delaney Creek near Tampa. (A) plan sketch, (B) cross section 1, (C) cross section 2, and (D) cross section 3.
76
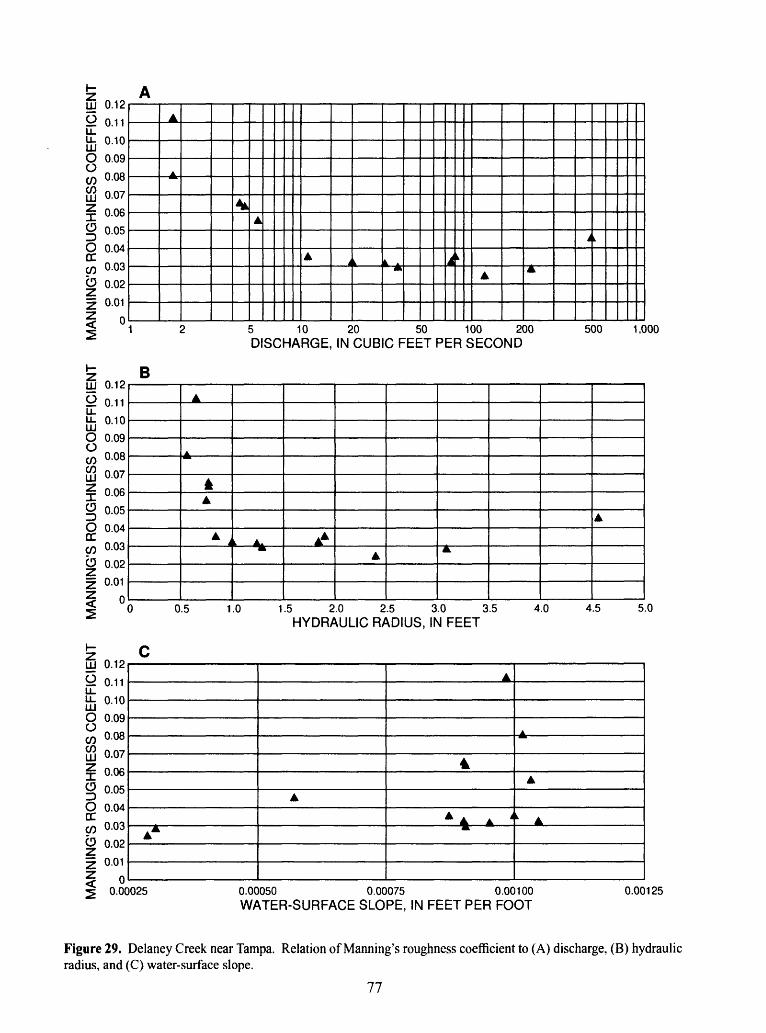
MA
NN
ING
'S R
OU
GH
NE
SS
CO
EF
FIC
IEN
T
MA
NN
ING
'S R
OU
GH
NE
SS
CO
EF
FIC
IEN
T
MA
NN
ING
'S R
OU
GH
NE
SS
CO
EF
FIC
IEN
T»5
ts
>3
\Q
O
Q.
be
If <2
W3
V. -
c 3*8-
0
j-j
0
0
IS
5
^'
3 >
o"g
H
g
mo
w
33s*
-T
" 0
CO§
c0'
33a
TI
o >
5
o
2 m
03
,-
a
CO
5
i-p
5 O
g^
TJ
o
3 ~_
CTQ
^a-
TI m
8 m
0
TJ
i 3
o
"
x
O§
~n O
^ O a- ^ CO 3-
b^
0
3
w»
<J1
c3
-3 C
3 C
» r>3
C3
C
O O
^
1
3 C
3 C
0
4
^ ^ *
3 C
3 C
*.
C
^.
3 C
3 C
n a
>
3 C
3 C
D -
3 C
3 C
-J
0 13 C
3 C
0
U
3 C
3 -
3 C
3 C
^
3 -
3 C
^
__
^
^
3 x 3 C
O
O 01 0 _».
01T:
-< D
33 >
?o
C°
| 0 D^
1C
CO z o
Tl m m H
CO 01 _^ 0 _^ 01 01 0
c3
-3 C
3 C
3 C
I I 1
»
^
3 C
I S * » "V
3 C
3 C
>. C
^~
3 C
I I
3 C
? S
3 C
3 § 13
C3
C0
O
>
3 C
I C
3 C
^ _
3 -3
C^
_*
^
3 t 3 C
a>
D w
CO 0 > ^
330
O m ZM
O°
C
CD 0 Tl m m g
I T
J m 33 cos
m o
o O z O
ro o 01 o _^ S
c3
-3 C
3 C
* IV3
C3
C
J C 1
^
*
3 C
3 5 * |k ^
3 C
3 C
»
C
3 C
S §
fe.
3 C
* ^
^
3 C
3 § I3
C3
C
3 U
>
3 C
1 c3
CA
_
3 -
3 C
^ ^
IN
.
»>
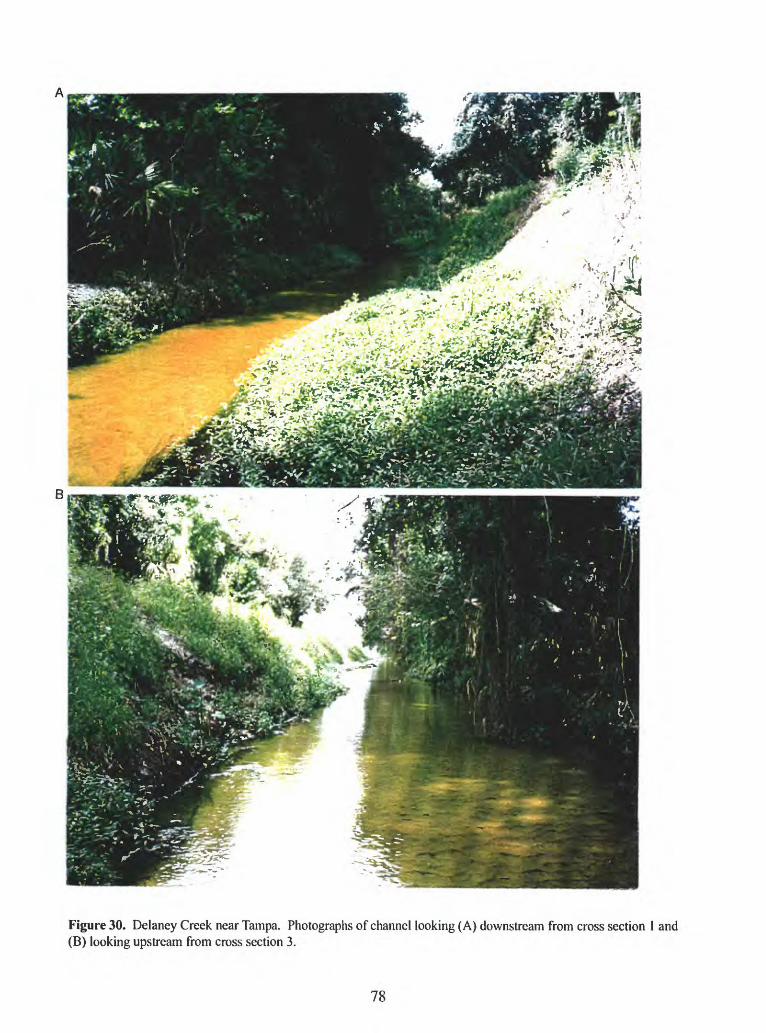
Figure 30. Delaney Creek near Tampa. Photographs of channel looking (A) downstream from cross section 1 and (B) looking upstream from cross section 3.
78
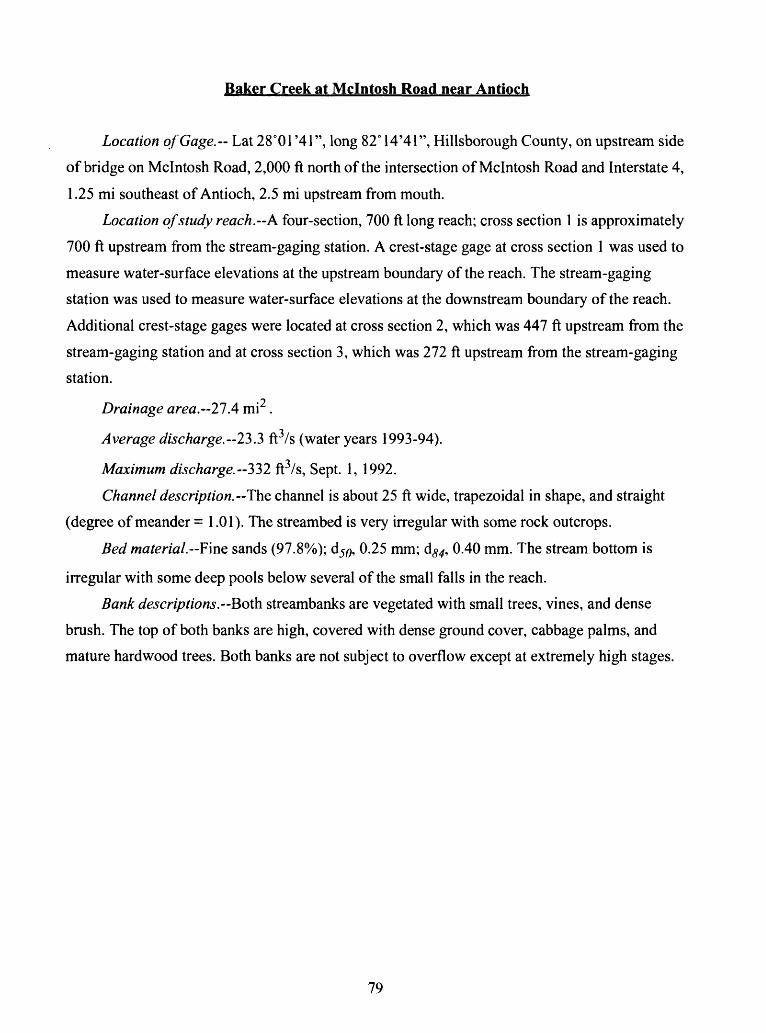
Baker Creek at Mclntosh Road near Antioch
Location of Gage.-- Lat 28°01 '41", long 82°14'41", Hillsborough County, on upstream side
of bridge on Mclntosh Road, 2,000 ft north of the intersection of Mclntosh Road and Interstate 4,
1.25 mi southeast of Antioch, 2.5 mi upstream from mouth.
Location of study reach.~A four-section, 700 ft long reach; cross section 1 is approximately
700 ft upstream from the stream-gaging station. A crest-stage gage at cross section 1 was used to
measure water-surface elevations at the upstream boundary of the reach. The stream-gaging
station was used to measure water-surface elevations at the downstream boundary of the reach.
Additional crest-stage gages were located at cross section 2, which was 447 ft upstream from the
stream-gaging station and at cross section 3, which was 272 ft upstream from the stream-gaging
station.
Drainage area. 21A mi2 .
Average discharge.---23 .3 ft3/s (water years 1993-94).
Maximum discharge. 332 ft3/s, Sept. 1, 1992.
Channel description. The channel is about 25 ft wide, trapezoidal in shape, and straight
(degree of meander = 1.01). The streambed is very irregular with some rock outcrops.
Bed material. Fine sands (97.8%); dj^, 0.25 mm; d^, 0.40 mm. The stream bottom is
irregular with some deep pools below several of the small falls in the reach.
Bank descriptions. Both streambanks are vegetated with small trees, vines, and dense
brush. The top of both banks are high, covered with dense ground cover, cabbage palms, and
mature hardwood trees. Both banks are not subject to overflow except at extremely high stages.
79
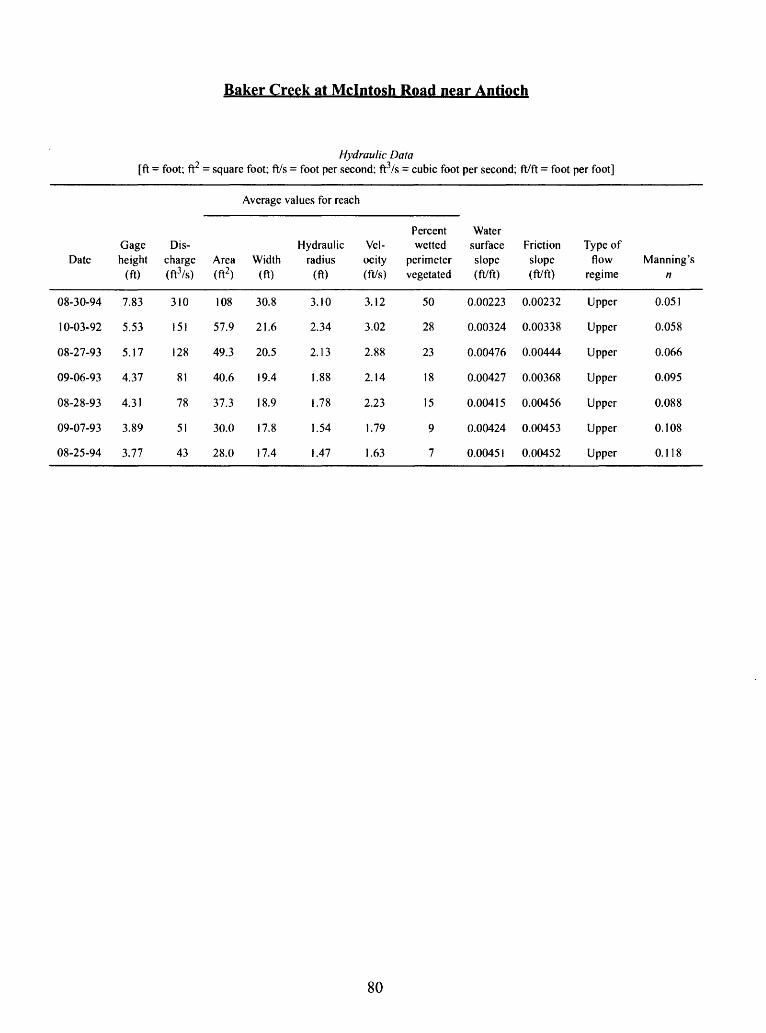
Baker Creek at Mclntosh Road near Antioch
Hydraulic Data [ft = foot; ft2 = square foot; ft/s = foot per second; ft3/s = cubic foot per second; ft/ft = foot per foot]
Average values for reach
Date
08-30-94
10-03-92
08-27-93
09-06-93
08-28-93
09-07-93
08-25-94
Gage height
(ft)
7.83
5.53
5.17
4.37
4.31
3.89
3.77
Dis charge (ft3/s)
310
151
128
81
78
51
43
Area (ft2)
108
57.9
49.3
40.6
37.3
30.0
28.0
Width (ft)
30.8
21.6
20.5
19.4
18.9
17.8
17.4
Hydraulic radius
(ft)
3.10
2.34
2.13
1.88
1.78
1.54
1.47
Vel ocity (ft/s)
3.12
3.02
2.88
2.14
2.23
1.79
1.63
Percentwetted
perimeter vegetated
50
28
23
18
15
9
7
Watersurface slope (ft/ft)
0.00223
0.00324
0.00476
0.00427
0.00415
0.00424
0.00451
Friction slope (ft/ft)
0.00232
0.00338
0.00444
0.00368
0.00456
0.00453
0.00452
Type of flow
regime
Upper
Upper
Upper
Upper
Upper
Upper
Upper
Manning's n
0.051
0.058
0.066
0.095
0.088
0.108
0.118
80
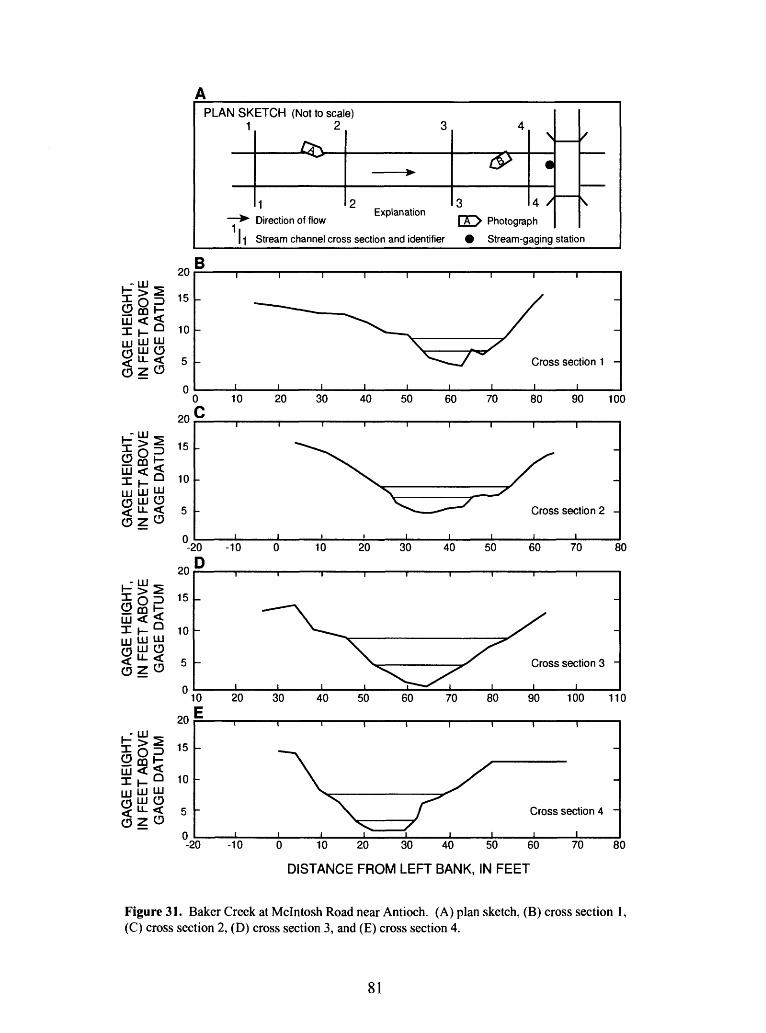
PLAN SK 1
\
ETCH (Not to seal 2
^^ *»o
1Direction of flow
Stream channel cros
e) 3
>
2Explanation
s section and identifier
4
&>
3
1 A > Photograf
Stream-g
\
4 /
3h
aging statio
/
\
n
B
GHT, GAGE HEIGHT, GAGE HEIGHT, GAGE HEIGHT, JOVE IN FEET ABOVE IN FEET ABOVE IN FEET ABOVE OIM GAGE DATUM GAGE DATUM GAGE DATUM
££SUJ UJ HIJnLiJ CD< LL <OZCD
£U
15
10
5
0 (
20
15
10
5
°-2
20
15
10
5
°i
20
15
10
5
0 -2
- ~ -^_ / ;^^\ X
^-^^/ Cross section 1 -
i i i i i i i i i3 10 20 30 40 50 60 70 80 90 10C
C
~"\ x :N ^ --' Cross section 2 -
ii i i i i i i i0 -10 0 10 20 30 40 50 60 70 8
D
: -v x :0 20 30 40 50 60 70 80 90 100 11(
ii i i i i i i i
A x -Ny ] Cross section 4 -
t i i i i i i i i0 -10 0 10 20 30 40 50 60 70 8C
DISTANCE FROM LEFT BANK, IN FEET
Figure 31. Baker Creek at Mclntosh Road near Antioch. (A) plan sketch, (B) cross section 1, (C) cross section 2, (D) cross section 3, and (E) cross section 4.
81
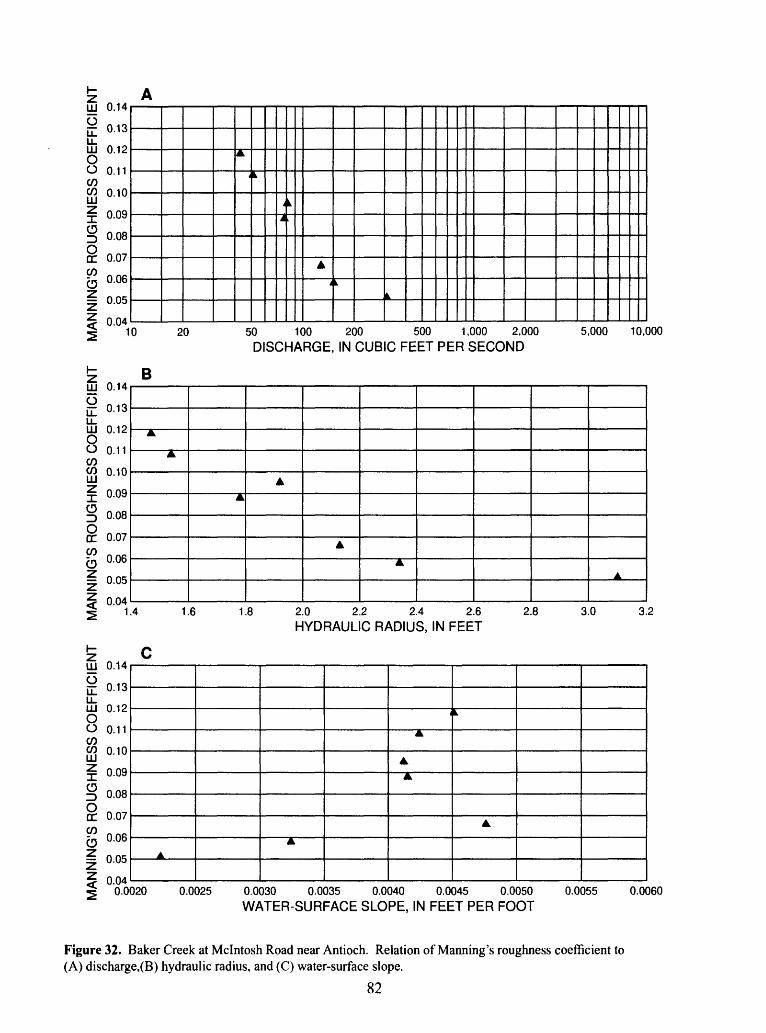
> 2
MA
NN
ING
'S R
OU
GH
NE
SS
CO
EF
FIC
IEN
T
MA
NN
ING
'S R
OU
GH
NE
SS
CO
EF
FIC
IEN
T
MA
NN
ING
'S R
OU
GH
NE
SS
CO
EF
FIC
IEN
T
3 fp-
o'
*" 3
Ss.
a2'
Sy
o! !
o g
& 5'
o °
oo
S ^
K>
a. j
o i
«fD
03 o
'
o i 00 O)
OC
b-»
0 b en
> 1
m°
33 GO C o
33
b
>$
m GO m o
z Sg
m 33 Tl
oO
b0
£H
o o
b en
en 0 g
3
C*.
C3
Cn
c
>
g s ^3
§g
§ »D
C
>
3
- ^
r J
C0
*
O
c
-t>.
05
CO
O
33 C r~
ro0
M33 O d
ro
05 ^
T| m
m [
^H
05 ro CO
CO o CO ro
2 £g
§ ^ -
3
C15
*"
D
C
J 0
3 C
0
Cl0
C >3
- ,* r *j
&0
£>O
OO
OO
-'.-'-'.-*
enco-goocoo-'roco
o ro 0 en0
°
GO O I >o
33 o
O m Z
ro
08
00 0 ~n ffls
H o
-a m 33 _
GO o
mg
o §s
o
o en 0 o 8
*
r
^>
»
~^- >
>
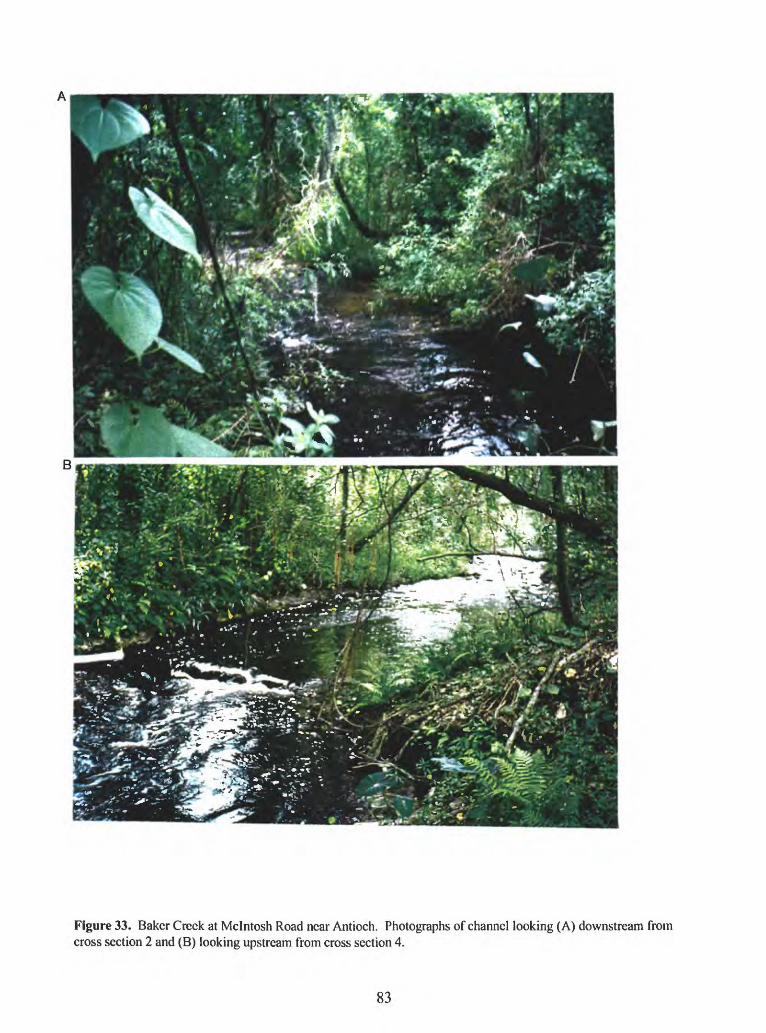
Figure 33. Baker Creek at Mclntosh Road near Antioch. Photographs of channel looking (A) downstream from cross section 2 and (B) looking upstream from cross section 4.
83
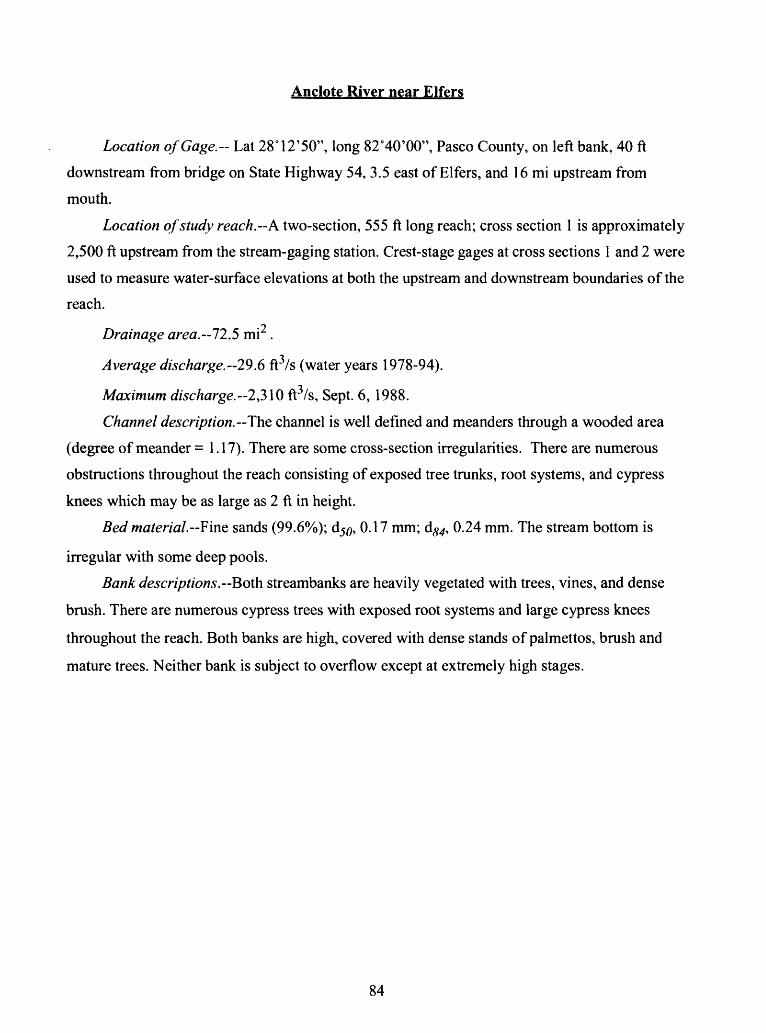
Anclote River near Elfers
Location of Gage.- Lat 28°12'50", long 82°40'00", Pasco County, on left bank, 40 ft
downstream from bridge on State Highway 54, 3.5 east of Elfers, and 16 mi upstream from
mouth.
Location of study reach.--A. two-section, 555 ft long reach; cross section 1 is approximately
2,500 ft upstream from the stream-gaging station. Crest-stage gages at cross sections 1 and 2 were
used to measure water-surface elevations at both the upstream and downstream boundaries of the
reach.t *y
Drainage area.--72.5 mi .
Average discharge. 29.6 ft3/s (water years 1978-94).
Maximum discharge.~2,3\Q ft3/s, Sept. 6, 1988.
Channel description. The channel is well defined and meanders through a wooded area
(degree of meander = 1.17). There are some cross-section irregularities. There are numerous
obstructions throughout the reach consisting of exposed tree trunks, root systems, and cypress
knees which may be as large as 2 ft in height.
Bed material. Fine sands (99.6%); d5f), 0.17 mm; dS4, 0.24 mm. The stream bottom is
irregular with some deep pools.
Bank descriptions. Both streambanks are heavily vegetated with trees, vines, and dense
brush. There are numerous cypress trees with exposed root systems and large cypress knees
throughout the reach. Both banks are high, covered with dense stands of palmettos, brush and
mature trees. Neither bank is subject to overflow except at extremely high stages.
84
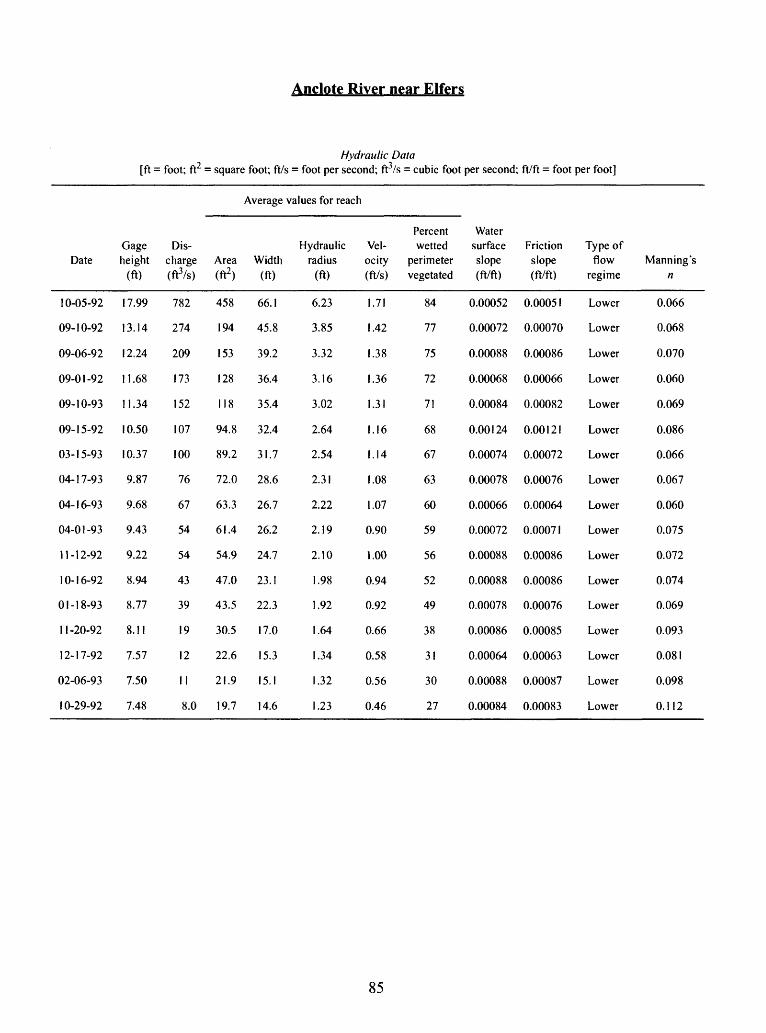
Anclote River near Elfers
Hydraulic Data [ft = foot; ft2 = square foot; ft/s = foot per second; ft3/s = cubic foot per second; ft/ft = foot per foot]
Average values for reach
Date
10-05-92
09-10-92
09-06-92
09-01-92
09-10-93
09-15-92
03-15-93
04-17-93
04-16-93
04-01-93
11-12-92
10-16-92
01-18-93
11-20-92
12-17-92
02-06-93
1 0-29-92
Gage height
(ft)
17.99
13.14
12.24
11.68
11.34
10.50
10.37
9.87
9.68
9.43
9.22
8.94
8.77
8.11
7.57
7.50
7.48
Dis charge (ft3/s)
782
274
209
173
152
107
100
76
67
54
54
43
39
19
12
11
8.0
Area (ft2)
458
194
153
128
118
94.8
89.2
72.0
63.3
61.4
54.9
47.0
43.5
30.5
22.6
21.9
19.7
Width (ft)
66.1
45.8
39.2
36.4
35.4
32.4
31.7
28.6
26.7
26.2
24.7
23.1
22.3
17.0
15.3
15.1
14.6
Hydraulic radius
(ft)
6.23
3.85
3.32
3.16
3.02
2.64
2.54
2.31
2.22
2.19
2.10
1.98
1.92
1.64
1.34
1.32
1.23
Vel ocity (ft/s)
1.71
1.42
1.38
1.36
1.31
1.16
1.14
1.08
1.07
0.90
1.00
0.94
0.92
0.66
0.58
0.56
0.46
Percent wetted
perimeter vegetated
84
77
75
72
71
68
67
63
60
59
56
52
49
38
31
30
27
Water surface slope (ft/ft)
0.00052
0.00072
0.00088
0.00068
0.00084
0.00124
0.00074
0.00078
0.00066
0.00072
0.00088
0.00088
0.00078
0.00086
0.00064
0.00088
0.00084
Friction slope (ft/ft)
0.00051
0.00070
0.00086
0.00066
0.00082
0.00121
0.00072
0.00076
0.00064
0.00071
0.00086
0.00086
0.00076
0.00085
0.00063
0.00087
0.00083
Type of flow
regime
Lower
Lower
Lower
Lower
Lower
Lower
Lower
Lower
Lower
Lower
Lower
Lower
Lower
Lower
Lower
Lower
Lower
Manning's n
0.066
0.068
0.070
0.060
0.069
0.086
0.066
0.067
0.060
0.075
0.072
0.074
0.069
0.093
0.081
0.098
0.112
85
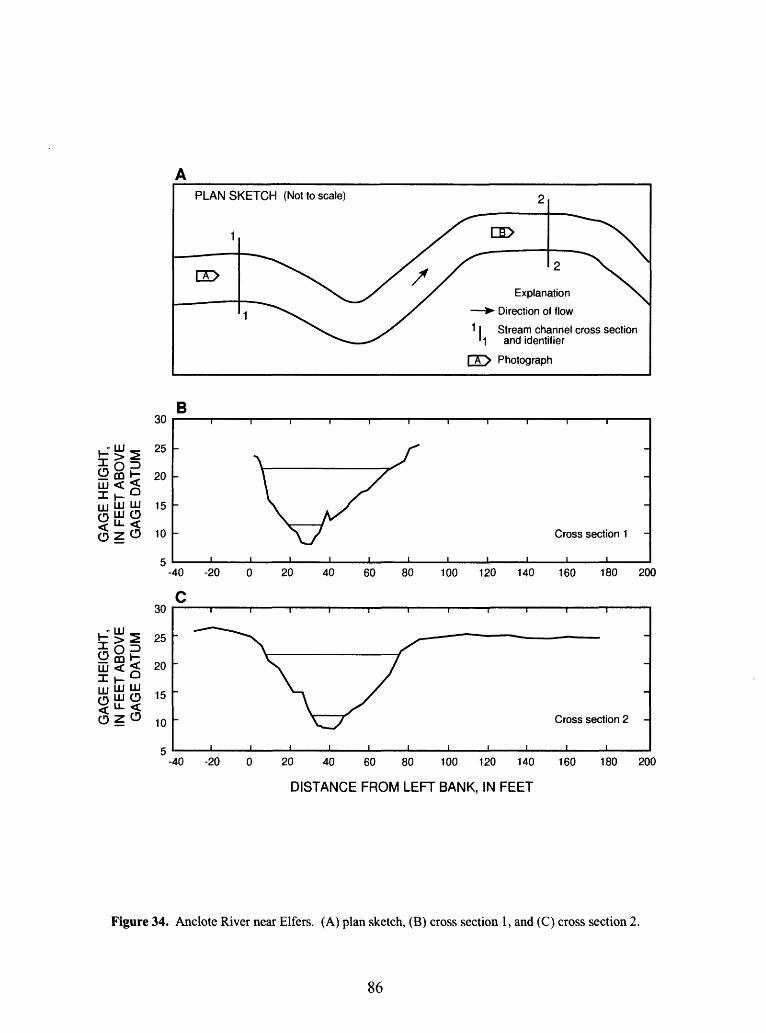
PLAN SKETCH (Not to scale)
Explanation
Direction of flow
Stream channel cross section
30
25
B
<3§H 20
o z o 10
5
30
££S 25
og?Hi < < 20
5
-40 -20
C
-40 -20
Cross section 1
20 40 60 80 100 120 140 160 180 200
Cross section 2
20 40 60 80 100 120 140
DISTANCE FROM LEFT BANK, IN FEET
160 180 200
Figure 34. Anclote River near Elfers. (A) plan sketch, (B) cross section 1, and (C) cross section 2.
86
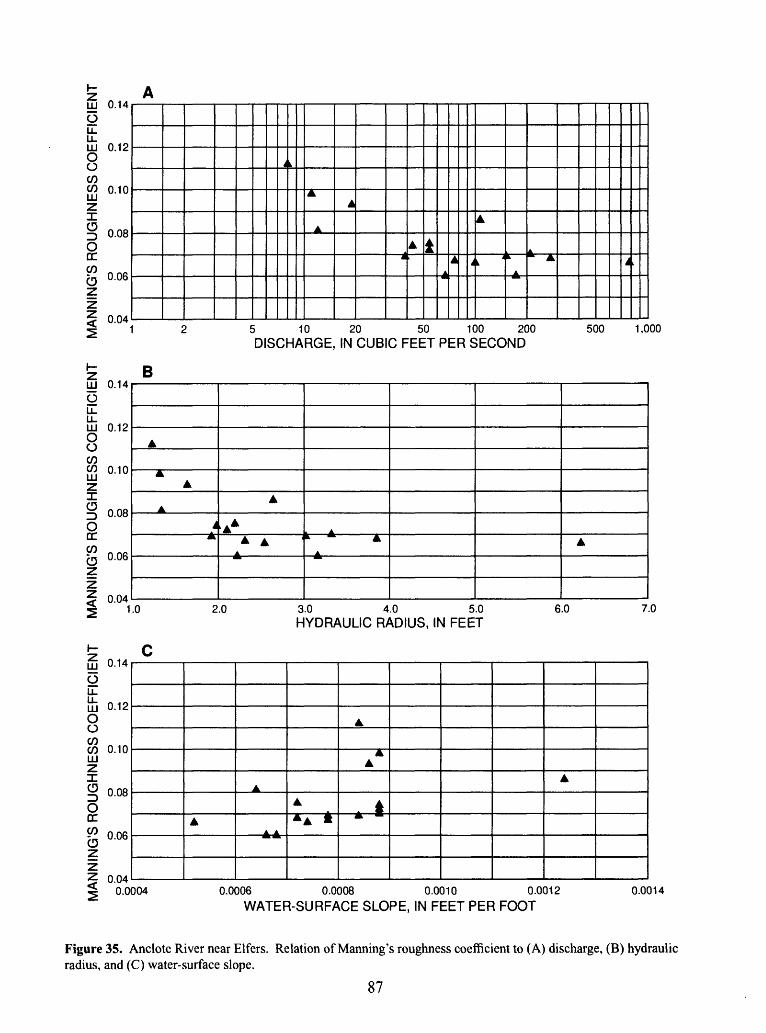
Figure 35.
Anclot
e River
near Elfe
radiu
s, and
(C) water-surfa
ce slop
e.
Re on of
Ma
MA
NN
ING
'S R
OU
GH
NE
SS
CO
EF
FIC
IEN
T
MA
NN
ING
'S R
OU
GH
NE
SS
CO
EF
FIC
IEN
T
MA
NN
ING
'S R
OU
GH
NE
SS
CO
EF
FIC
IEN
T
oo
-Jng oug coeff
i > &55'
o cr S n 3 s ' f & C
0.0004
0.0006
0.0008
0.0010
0.0012
0.0(
WATER-SURFACE
SLOPE, IN
FEET
PER
FOOT
3
O
O
O
O
C
30
0^^'-
». CD
co
o
ro
*
I I
>
> >
* m 1 11*
> "
^-
O
0
0
0
0
O
C
0 o
IE c
o -<
b
D
33 C |
0 33
. z* C
03 z Tl m
m 0
1
O)
0 -g 0
3
O
O
-*
-*
- i.
CD
co
o
ro
^>
1 1
1
» I
»
1 ^ >
K
,.
^
»
"
^01
12
5
10
20
50
100
200
500
1,000
DISCHARGE, IN
CUBIC
FEET
PER
SECOND
3 O
O
O
O
C
3 O
O
'-+
'-*
^k
o)
co
o
ro
*
I I 1
>t>
~^-
1
K
1 *
-K
+ *+ >
*
^
^
^>
*
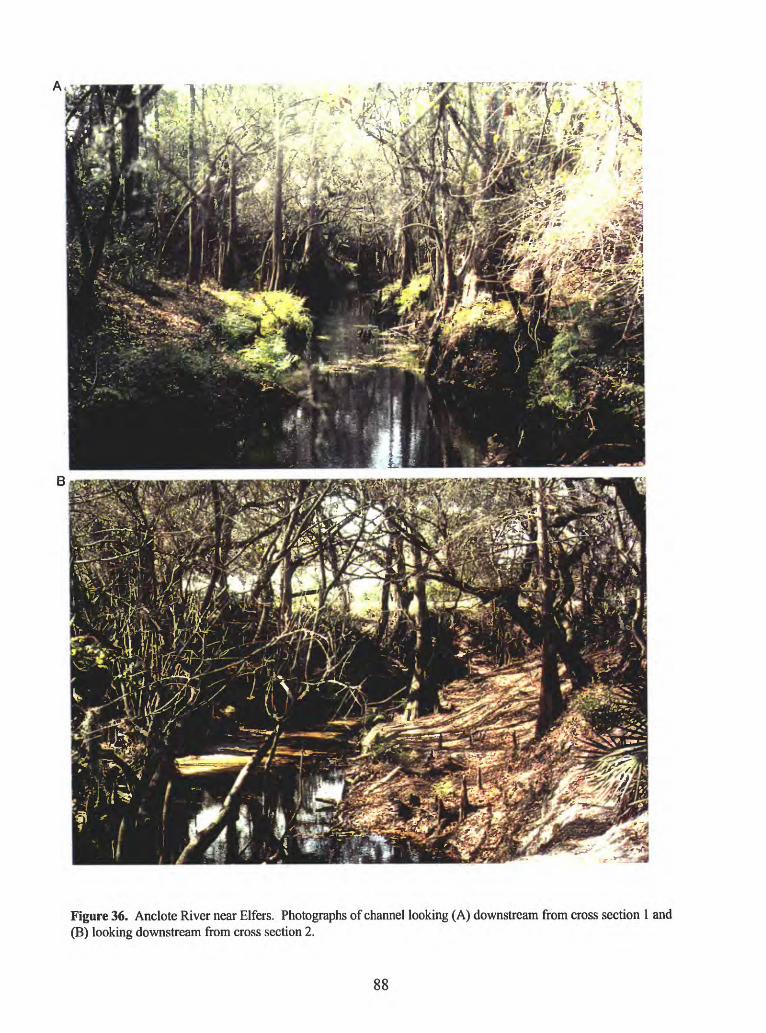
Figure 36. Anclote River near Elfers. Photographs of channel looking (A) downstream from cross section 1 and (B) looking downstream from cross section 2.
88
Withlacoochee River at Wysong Dam at Carlson
Location of Gage.- Lat 28°49'23", long 82° 11 '00", Sumter County, at downstream end of
left wall of lock of Wysong Dam, at Carlson, 1.8 mi downstream from Outlet River, 2.7 mi
southeast of Rutland, and 55 mi upstream from mouth.
Location of study reach. A. two-section, 2,100 ft long reach; cross section 1 is
approximately 2,200 ft upstream from the stream-gaging station. Crest-stage gages at cross
section 1 were used to measure water-surface elevations at the upstream boundary of the reach.
The stream-gaging station was used to determine water-surface elevations at the downstream
boundary of the reach. ^
Drainage area. 1,520 mi .
Average discharge. 615 ft3/s (water years 1966-94).
Maximum stage.-4\.\Q ft, Oct. 11, 1979.
Channel description. The channel bottom has some bottom irregularity with heavy
vegetation throughout. The channel varies from 675 ft at cross section 1 to 550 ft at cross section
2 with some variation in the channel cross section.
Bed material Fine sands (95.1%); dj^, 0.19 mm; d84, 0.31 mm. The stream bottom is
overgrown with dense hydrilla and other aquatic growth. The water management district conducts
herbicide sprayings periodically to control the aquatic growth which results in highly variable
roughness effects.
Bank descriptions. Both streambanks are low and covered with mature trees, some palms,
and moderate brush. The left bank is covered with a large stand of mature bald cypress trees with
dense underbrush.
89
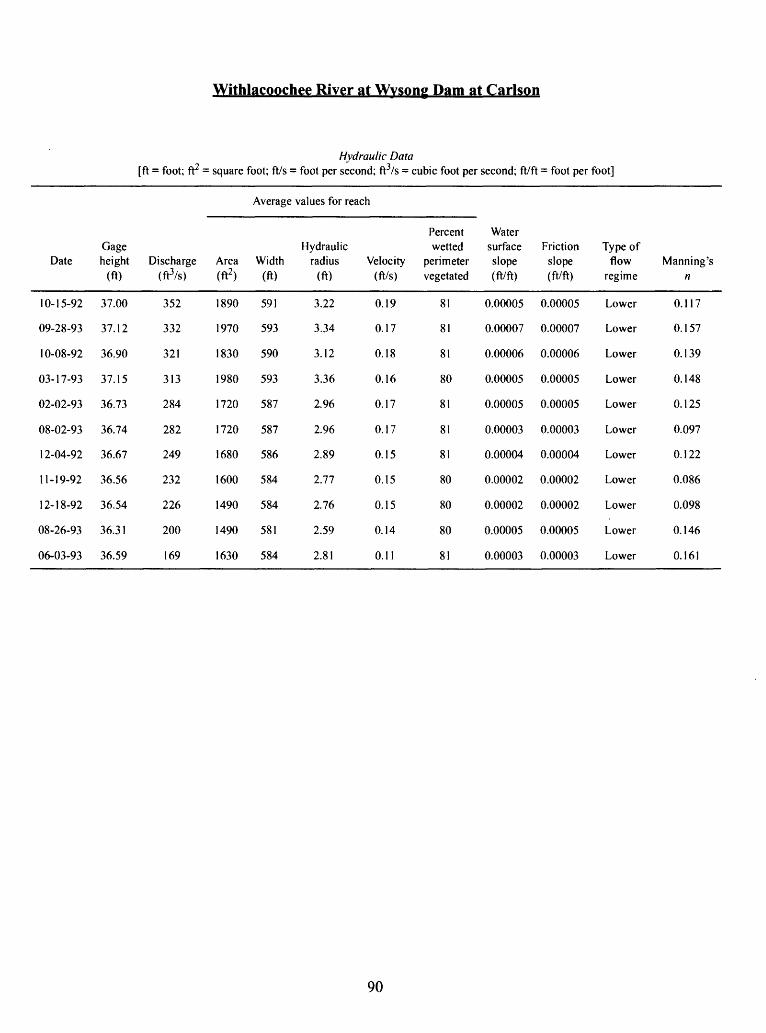
Withlacoochee River at Wvsong Dam at Carlson
Hydraulic Data [ft = foot; ft2 = square foot; ft/s = foot per second; ft3/s = cubic foot per second; ft/ft = foot per foot]
Average values for reach
Date
10-15-92
09-28-93
10-08-92
03-17-93
02-02-93
08-02-93
12-04-92
11-19-92
12-18-92
08-26-93
06-03-93
Gage height
(ft)
37.00
37.12
36.90
37.15
36.73
36.74
36.67
36.56
36.54
36.31
36.59
Discharge (ft3/s)
352
332
321
313
284
282
249
232
226
200
169
Area (ft2 )
1890
1970
1830
1980
1720
1720
1680
1600
1490
1490
1630
Width (ft)
591
593
590
593
587
587
586
584
584
581
584
Hydraulic radius
(ft)
3.22
3.34
3.12
3.36
2.96
2.96
2.89
2.77
2.76
2.59
2.81
Velocity(ft/s)
0.19
0.17
0.18
0.16
0.17
0.17
0.15
0.15
0.15
0.14
0.11
Percentwetted
perimeter vegetated
81
81
81
80
81
81
81
80
80
80
81
Watersurface slope (ft/ft)
0.00005
0.00007
0.00006
0.00005
0.00005
0.00003
0.00004
0.00002
0.00002
0.00005
0.00003
Friction slope (ft/ft)
0.00005
0.00007
0.00006
0.00005
0.00005
0.00003
0.00004
0.00002
0.00002
0.00005
0.00003
Type of flow
regime
Lower
Lower
Lower
Lower
Lower
Lower
Lower
Lower
Lower
Lower
Lower
Manning's n
0.117
0.157
0.139
0.148
0.125
0.097
0.122
0.086
0.098
0.146
0.161
90
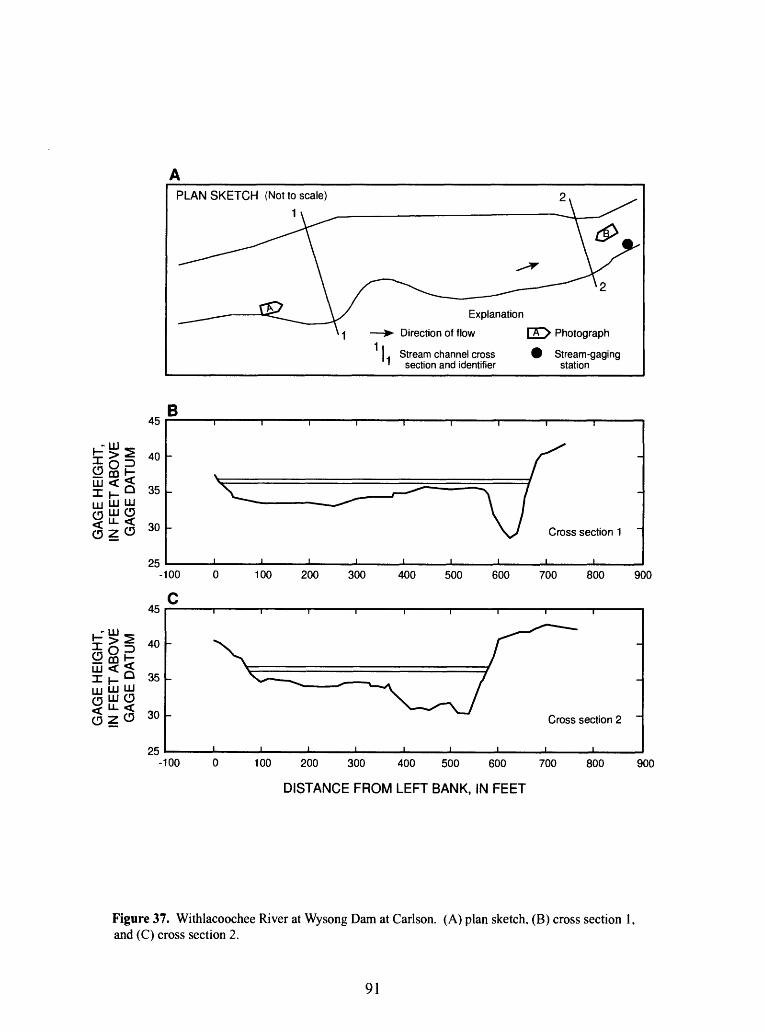
PLAN SKETCH (Not to scale)
1
Explanation
Direction of flow I A > Photograph
Stream channel cross section and identifier
Stream-gaging station
IIIUJ
iu
45
40
35
30
B
25
ilQJ UJ UJ
$ UJ O^LL <§20
45
40
35
30
-100
c
25-100
Cross section 1
100 200 300 400 500 600 700 800 900
Cross section 2
100 200 300 400 500 600 700
DISTANCE FROM LEFT BANK, IN FEET
800 900
Figure 37. Withlacoochee River at Wysong Dam at Carlson. (A) plan sketch, (B) cross section 1, and (C) cross section 2.
91
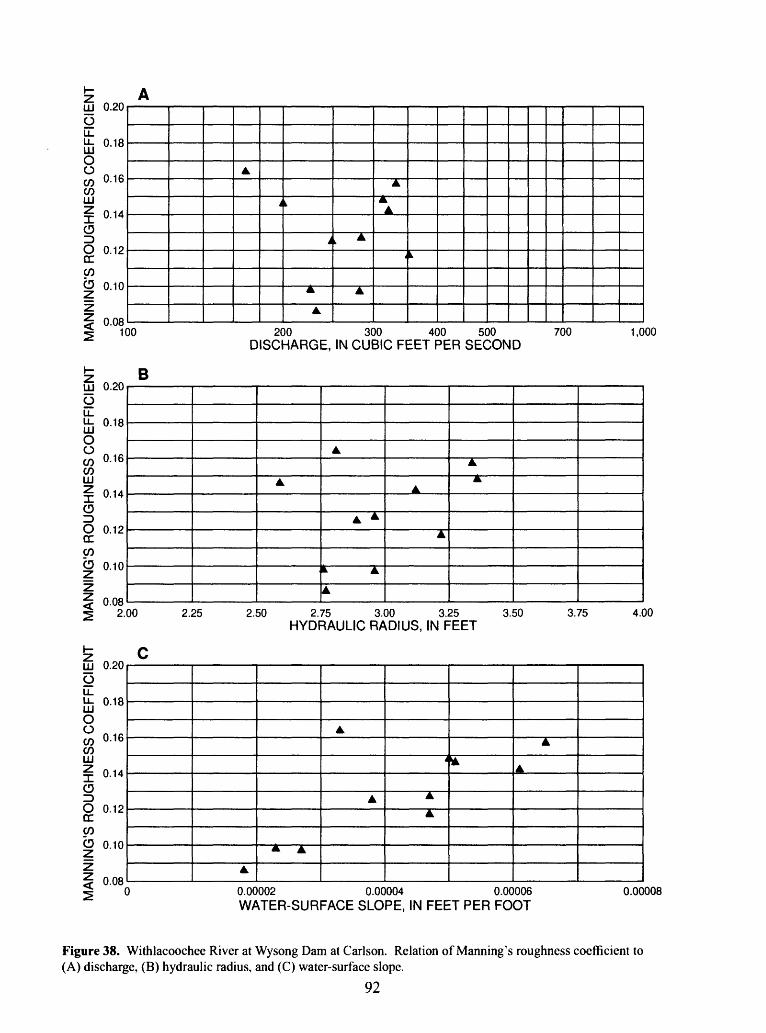
9:5
C«
CDg-
S
MA
NN
ING
'S R
OU
GH
NE
SS
CO
EF
FIC
IEN
T
MA
NN
ING
'S R
OU
GH
NE
SS
CO
EF
FIC
IEN
T
MA
NN
ING
'S R
OU
GH
NE
SS
CO
EF
FIC
IEN
T
oe
o§
^^
(TO
^§
CD
3
c«
CO
S,
Ott
1 CO
n
a.
O
C/3
s-i CO
3 (TO O
(TO 3
CD
p
op
io
p O5
p 00
p
o
§m 33 CO C
33 O m r^
p §
m g
z TI m
m TJ
m 33 TI p
O
P IV3
p
oo
O
b
DO
C
CO m tn
m
CD
100
200
300
400
500
700
1,0
DISCHARGE, IN
CUBIC
FEET
PER
SECOND
D
O
O
O
O
O
C
o o
ro
*»
os
oo
c
>* >
~>
-+- >
-> >*
>
>
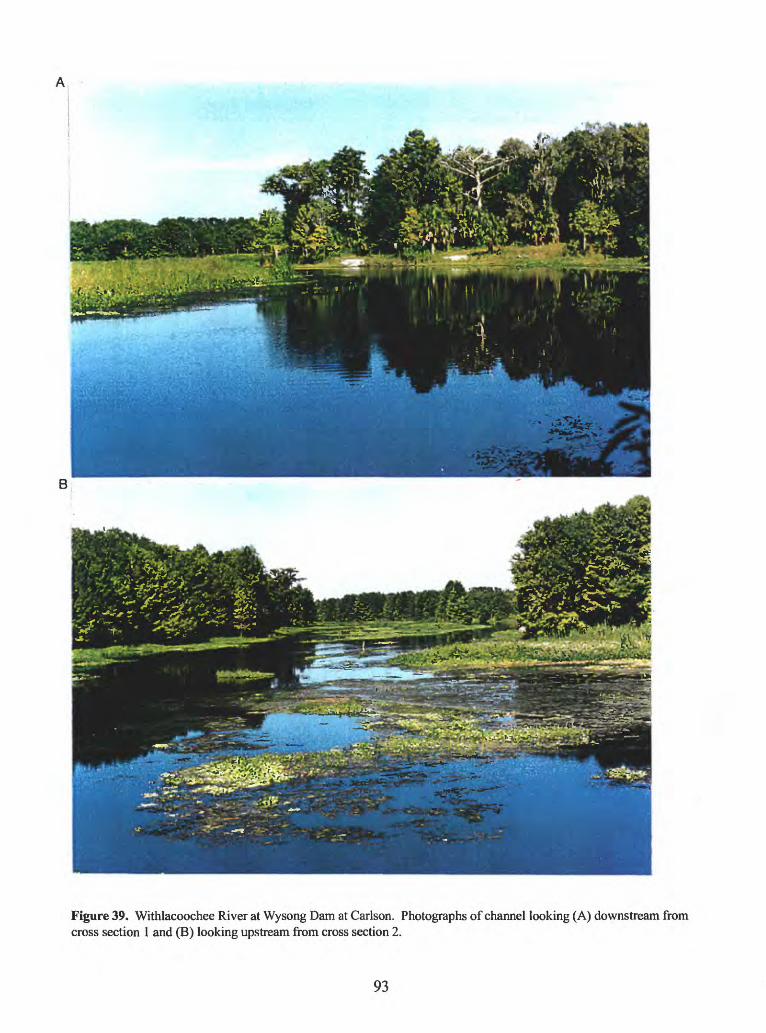
Figure 39. Withlacoochee River at Wysong Dam at Carlson. Photographs of channel looking (A) downstream from cross section 1 and (B) looking upstream from cross section 2.
93