Embed Size (px)
Citation preview
169
Determination of the Positional Distribution of Fatty Acids in Butterfat Triacylglycerols S. Kermasha a,*, S. Kubow b, M. Safari a and A. Reid a aDepartment of Food Science and Agricultural Chemistry, McGill University, Macdonald Campus and bSchool of Dietetics and Human Nutrition, McGill University, Macdonald Campus, Ste Anne de Bellevue, Quebec, Canada Hgx 3V9
Triacylglycerol (TAG) standards were separated by analyti- cal high-performance liquid chromatography (HPLC) with laser fight-scattering detection (LLSD). A high sensitivi- ty for TAGs was observed with LLSD whereas poor sen- sitivlty was observed with ultraviolet detection. The HPLC-LLSD analytical separation of butterfat TAGs showed that the TAGs were eluted according to increas- ing carbon number. Preparative HPLC-LLSD was used to characterize butterfat TAGs that contained hypercholeste~ olemic fatty acids (laurate, myristate, palmitate) with car- bon chainlengths of 12 or greater. These TAG fractions ac- counted for 29.2% of the total butterfat TAGs. Analysis of the positional distribution of fatty acids of selected but- terfat TAGs containing hypercholesterolemic fatty acids showed the presence of positional isomers in each of these fractions. These butterfat TAGs also showed the predomi- nant presence of hypercholesterolemic fatty acids at the sn-2 position. The characterization of the positional dis- tribution of hypercholesterolemic fatty acids in butterfat TAGs is the first step for the determination of the metab- ofic role of the positional distribution in the hypercholeste~ olemic effects of butter.
terfat TAGs, but no peaks were identified. Christie (3) re- ported a preliminary HPLC profile of bovine milk TAGs obtained from mass detection. No attempt was made to identify any of the detected peaks, although Christie (3} suggested that mass spectroscopy coupled to HPLC would be needed for proper peak identification. In addition, a limited number of TAG and diacylglycerol components of bovine and goat milkfat have been identified by HPLC~mass spectrometry {MS) (13,14).
The objective of the present study was to separate TAGs from butterfat and to determine the positional distribution of selected TAGs. The present paper describes a method for the separation of butterfat TAGs by HPLC-LLSD. Prepara- tive HPLC separation of butter TAG fractions was carried out as a first step in the identification of individual TAGs. The analysis of the positional distribution of fatty acids in individual butter TAGs took place v/a enzymatic hydrolysis of the isolated HPLC TAG fractions, coupled with gas li- quid chromatographic (GC) analysis. As far as the authors are aware, no previous studies have reported HPLC prepara- tive analysis of butter TAGs followed by analysis of the posi- tional distribution of fatty acids.
KEY WORDS: Butter, fatty acids, HPLC, laser detection, light- scattering, positional distribution, triacylglycerols.
Analysis of the positional distribution of fatty acids in tri- acylglycerols {TAGs} of fats and oils has become increasingly important to lipid biochemists due to their possible role in cholesterol metabolism {1,2}. The separation of the molecular species of TAGs has generally been performed by high-per- formance liquid chromatography (HPLC) in the reversed- phase mode TAGs are eluted in an ascending order of chain- length, although a double bond in the chain reduces the retention time by approximately 2 carbon atoms (3}. The development of gradient elution systems has facilitated the separation of complex TAG mixtures, such as those en- countered in butter (4-7). Detection and identification of TAGs, however, still remains a problem (8).
Robinson and Macrae (9) indicated that a commercially available light-scattering detector (LSD) connected with a mass detector was a sensitive HPLC method for the detec- tion of TAGs. The available literature on LSD 00) and on the laser light-scattering detector tLLSD) {4,5} has suggested that, in addition to instrumental factors, optimization of such factors as temperature and gas flow is also important for sensitivity.
Butterfat, which contains a large number of different fatty acids, has presented a particular challenge to analysts in terms of identification and separation of TAGs, due to the complex variety of moleo~ar species of TAGs {4,8,9,11,12). Stolyhwo et aL (4) obtained an HPLOLLSD profile of but-
*To whom correspondence should be addressed at Department of Food Science and Agricultural Chemistry, McGill University, Macdonald Campus, 21,111 Lakeshore, Ste Anne de Bellevue, Quebec, Canada H9X 3V9.
MATERIALS AND METHODS
Separation of individual TAGs of butterfat. The complex mixture of butterfat TAGs was separated by gradient elu- tion in a nonaqueous reversed-phase HPLC system (Beck- man Model 126, Beckman Instruments, Ina, San Ramon, CA) with LLSD (Varex Corporation, Burtonsville, MD) and computerized integration and data handling. A Beck- man analog interface Model 406 was used to transfer data from the mass detector to the HPLC system. Mass detec- tion was performed at 72°C in the presence of an inert gas (N2) with a flow rate of 30 mL/min. The dehydrated butterfat (100 mg) was solubilized in 10 mL chloroform. Manual injection was carried out from a Rheodyne valve 7125 with a 20-t~L loop (200 ~g of dehydrated butterfat} onto two Spherisorb-ODS-2 columns (150 X 4.6 mm i.d., pore size 5 mm) (Altech Associates, Inc., Deerfield, IL). The HPLC columns were kept at 25 °C by means of a col- umn heater Model 7960 {Jones Chromatography Ltd., Hingoed, Wales, United Kingdom}. Elution was perform- ed with chloroform/acetonitrile at a linear gradient rang- ing from 20 to 50% chloroform (omnisolv grads BDH Inc., Poole, United Kingdom} at a flow rate of 1.0 mL/min for 45 min. The weight of fractionated TAGs ranged from 20 to 40 t~g.
For semi-preparative HPLC, a Spherisorb-ODS-2 col- umn (300 X 10 mm i.d., pore size 5 mm) (Altech Associ- ates, Inc.) was used at room temperature The dehydrated butterfat (100 mg} was solubilized in 1 mL chloroform. The loop size for manual injections was 100 I~L (10 mg of dehydrated butterfat}. Elution was performed isocrati- cally with chloroform and acetonitrile (30:70, vol/vol) at a flow rate of 3.0 mL/min for 60 min. The weight of frac- tionated TAGs ranged from 225 to 475 t~g. Two to three preparative runs of scale fractionations were performed
Copyright © 1993 by the American Oil Chemists' Society JAOCS, Vol. 70, no. 2 (February 1993)
170
S. KERMASHA ET AL.
to obtain a sufficient quantity of a fractionated TAG for positional distribution studies.
Positional distribution of fatty acids. The positional dis- tribution of fat ty acids in butterfat TAGs was deter- mined according to the procedure described by Kuksis (15) for the analysis of phospholipids. The procedure in- volves pancreatic lipase action on TAGs to yield sn-2 monoacylglycerols, from which the fatty acid composi- tion of the sn-2 position can be determined by GC analysis. Pancreatic lipase-mediated breakdown of the TAG substrate also gives essentially random mixtures of sn-l,2- and sn-2,3-diacylglycerols. In the present work, additional stereospecific analysis of the sn-2,3-diacylglycerols with stereospecific lipases was carried out to determine the complete positional distribution of fatty acids of the TAG molecules studied. The sn-2,3-diacylglycerols were con- verted to phosphatidylcholines (16) by the action of Grignard reagent. This was performed (17) by the solu- bilization of 5 mg butterfat TAGs into 0.4 mL diethyl ether mixed with 0.1 mL of 1 M ethyl magnesium bro- mide The mixture was vortexed for 25 s. The mixture was acidified, and the aqueous phase was removed. The organic phase was washed once with 2% NaHCOa and two times with water. The rac-l,2- and 1,3-diacylgly- cerols were extracted and purified before subsequent analysis. The derived phosphatidylcholines were then acted upon sequentially by phospholipase A2 and phospholipase C to yield sn-l-monoacylglycerophospha- tidylcholine and sn-l,2-diacylglycerol, respectively. Fol- lowing analysis of the fatty acid composition of the total TAG molecule and the monoacylglycerol and di- acylglycerol products generated from enzymatic reactions described above, the composition of fatty acids in the sn-1, sn-2 and sn-3 positions of the TAG molecules was calculated.
Preparation of fatty acid methyl esters. Preparation of fat ty acid methyl esters from TAG fatty acids was per- formed according to Badings and De Jong (18). TAGs (100 mg) were dehydrated with sodium sulfate and solubilized in 6.0 mL pentane. This was followed by treatment with 0.06 mL sodium methoxide (2M). After centrifugation (1,000 X g, 5 min), the supernatant was taken for GC analysis.
Free fatty acid methylation was also performed accord- ing to Badings and De Jong (18) by using a mixture of methanol and 20% hydrochloric acid (80:20, w/w) as the methylating reagent. The methylation was carried out in a shaking water bath at 85°C for 15 min. The mixture was centrifuged (1,000 X g, 5 min), and the supernatant was analyzed by GC for fatty acid content.
Fatty acid analysis by GC Gas-liquid chromatographic analysis of fat ty acid methyl esters was performed in a Varian Model 3400 gas chromatograph (Varian Associates, Sunnyvale, CA). The system was equipped with an on- column injector and a flame-ionization detector (FID) with a capillary column (30 m × 0.32 mm i.d. coated with poly- ethylene glycol, Supelco Canada Ltd., Oakville, Ontario). The flow rates for carrier gas {helium), hydrogen and air were, respectively, 1.8, 30.0 and 300.0 mL/min. The detec- tor temperature was 230°C and the injector tempera- ture was 220°C. Injection was performed at 35°C, and, af- ter an isothermal period of 5 min, the column tempera- ture was raised at a rate of 8 o C/min to a final temperature of 200°C.
RESULTS A N D D I S C U S S I O N
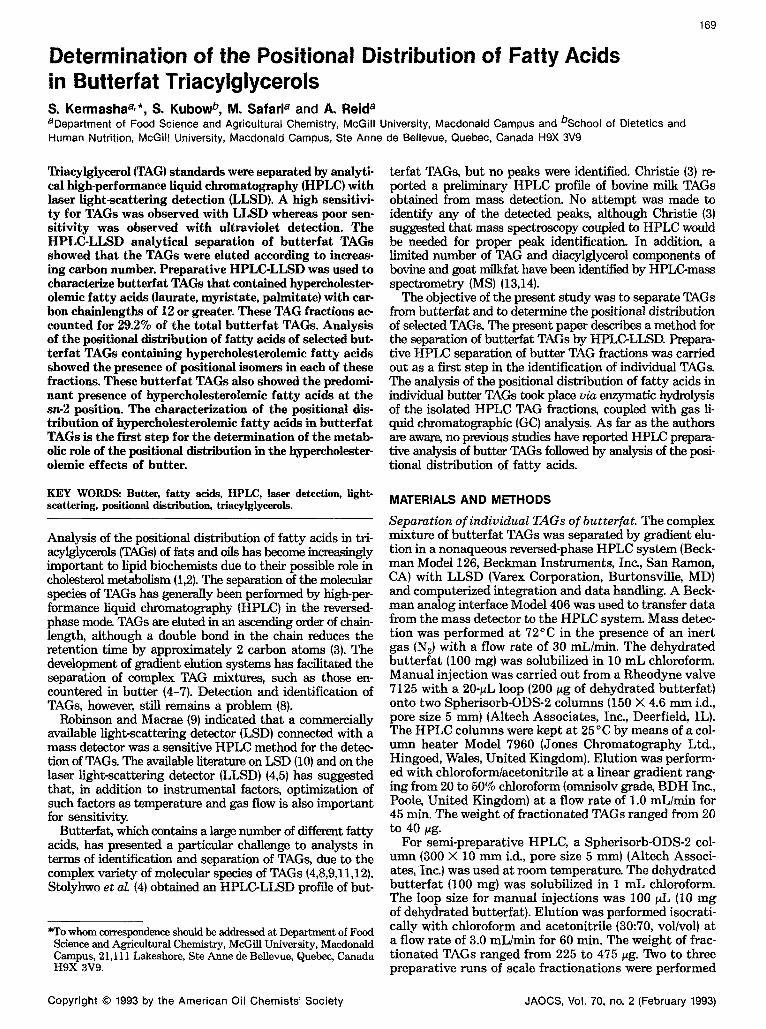
Figure 1 shows the HPLC profiles for the separation of a mixture of TAG standards obtained by LLSD detec- tion.Gradient elution was required to separate the large range of molecular weights of the TAGs found in butter- fat. The results clearly demonstrate the sensitivity of LLSD (Fig. 1). The present findings also show separation by LLSD of the more volatile TAGs such as tributyrin. Other workers have demonstrated that the mass detec- tor is sensitive to TAG separations with no baseline drift, even for lengthy gradient elutions (9,12,19-21).
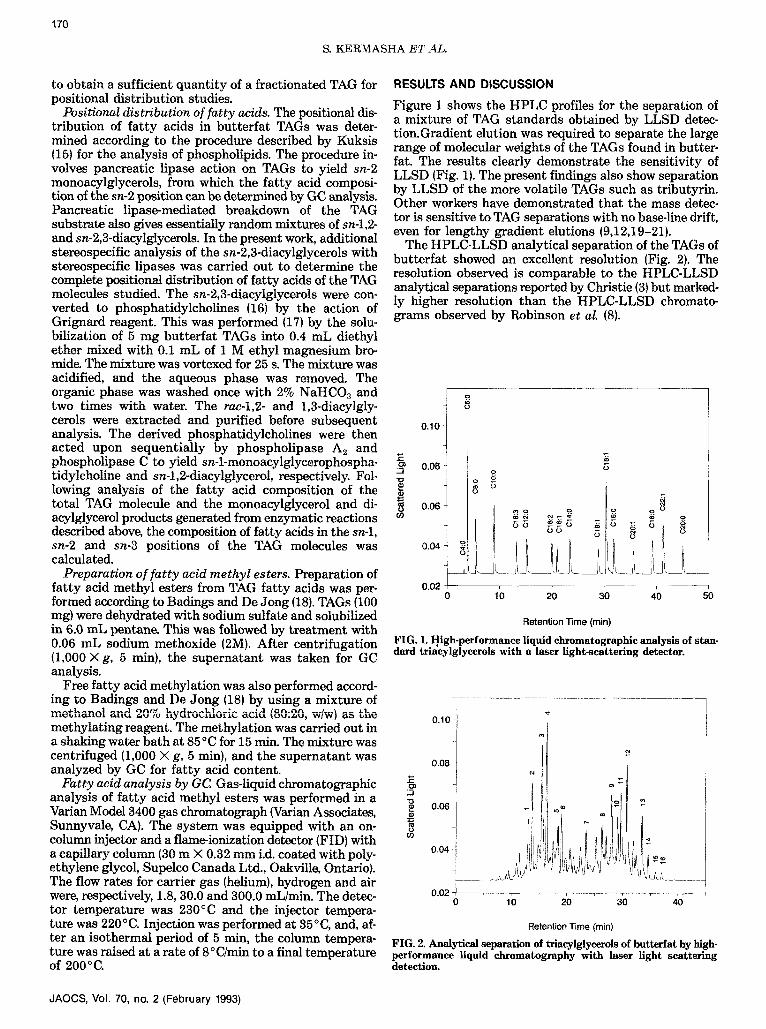
The HPLC-LLSD analytical separation of the TAGs of butterfat showed an excellent resolution (Fig. 2). The resolution observed is comparable to the HPLC-LLSD analytical separations reported by Christie (3) but marked- ly higher resolution than the HPLC-LLSD chromato- grams observed by Robinson et al. (8).
0.10
J ~
~, 008 "1o
0.06 i f )
0.04
0.02
/6
5 o
~ o .o o o 0 ~ 6 6 i oa ,¢ ¢~ ~6
o o 5 ~ o
o 2b 3o 4o 50
Retention Time (min)
FIG. L High-performance liquid chromatographic analysis of stan- dard triacylglycerols with a laser light~cattering detector.
J ~
8 0 9
0 . 1 0 !
0.08 1
0.06
0.04-
0.02
_ .,o ~
,¢
lO r . . . . . . . . ~ . . . . . . . . r . . . . . . . ~ . . . . . . . .
20 so 40
Retention Time (min)
FIG. 2. Analytical separation of triacylglycerols of butterfat by high- performance liquid chromatography with laser light scattering detection.
JAOCS, Vol. 70, no. 2 (February 1993)
POSITIONAL DISTRIBUTION OF FATTY ACIDS IN BUTTER TRIACYLGLYCEROLS
TABLE 1
Fatty Acid Composition of Butter Triacylglycerol Fractions Containing Fatty Acids with a Chalnlength of 12C or Greater
171
Triacylglycerol Fatty acid composition (%)a fraction b C4:0 C6:0 C8:0 C10:0 C12:0 C14:0 C14:1 C16:0 C16:1 C18:0 C18:1 C18:2 C18:3 C20:0
8 c _ 0.6 14.5 15.4 22.4 0.5 28.1 0.9 8.2 8.1 1.1 0.2 -- 9 -- 0.5 0.6 3.1 7.1 26.4 2.1 27.0 3.8 5.3 21.6 1.4 1.1 --
10 -- -- -- 3.9 9.5 25.9 -- 34.3 0.1 10.3 15.4 0.6 -- -- 11 . . . . 0.4 5.0 -- 33.3 0.9 5.7 54.0 0.7 -- -- 12 . . . . 0.4 20.4 -- 47.1 0.9 6.4 24.5 0.3 -- -- 13 . . . . . 1.8 -- 35.9 0.2 32.3 29.8 -- -- -- 1 4 . . . . . 1 2 . 4 1 . 5 5 3 . 6 - - 2 9 . 2 3 . 3 - - - - - -
1 5 . . . . . 2 . 8 - - 1 3 . 4 - - 5 7 . 8 2 6 . 3 - - - - - -
16 . . . . 0.3 4.2 0.2 -- 35.0 52.3 6.7 -- -- 1.3
apercent of each fatty acid relative to the total fatty acids content in the triacylglycerol fraction. bTriacylglycerol fractions of butterfat as obtained by preparative high-performance liquid chromatography analysis. c(_) Not detected.
A n examina t ion of the f a t t y acid compos i t ion of the isolated ana ly t ica l H P L C frac t ions of b u t t e r f a t TAGs showed t h a t t hey were eluted according to increas ing car- bon n u m b e r (Fig. 1, Table 1). The charac te r iza t ion of b u t t e r f a t TAGs con ta in ing f a t t y acids wi th ca rbon chainlengths of 12 or greater is of great metabol ic interest because these TAGs contain the hypercholesterolemic (i.e., 8 laurat~ myr is ta te and palmitate} and hypocholesterelemic 9 (Le., oleate) f a t t y acids. The TAG f rac t ions t h a t con- 10 ra ined the g rea tes t p ropor t ion of these f a t t y acids of in- 11
12 teres t were found by GC analysis to co r respond to peaks 13 8 to 16 of the analy t ica l H P L C separa t ion of the but ter- 14 fat TAGs (Fig. 2, Table 2). A l t h o u g h pre l iminary GC 15 analyses (data no t shown) d e m o n s t r a t e d t h a t peaks 1 to 16 7 also con ta ined C12 and C14 f a t t y acids, longer-chain Total s a tu r a t ed (Le., pa lmi ta t e and stearate) and u n s a t u r a t e d (i.a, oleate) f a t t y acids were no t present . Because peaks 1 to 7 were also of lesser quan t i t a t ive impor t ance relative to peaks 8 to 16, fu r the r analysis was focussed upon a selected subsample of these la t ter peaks.
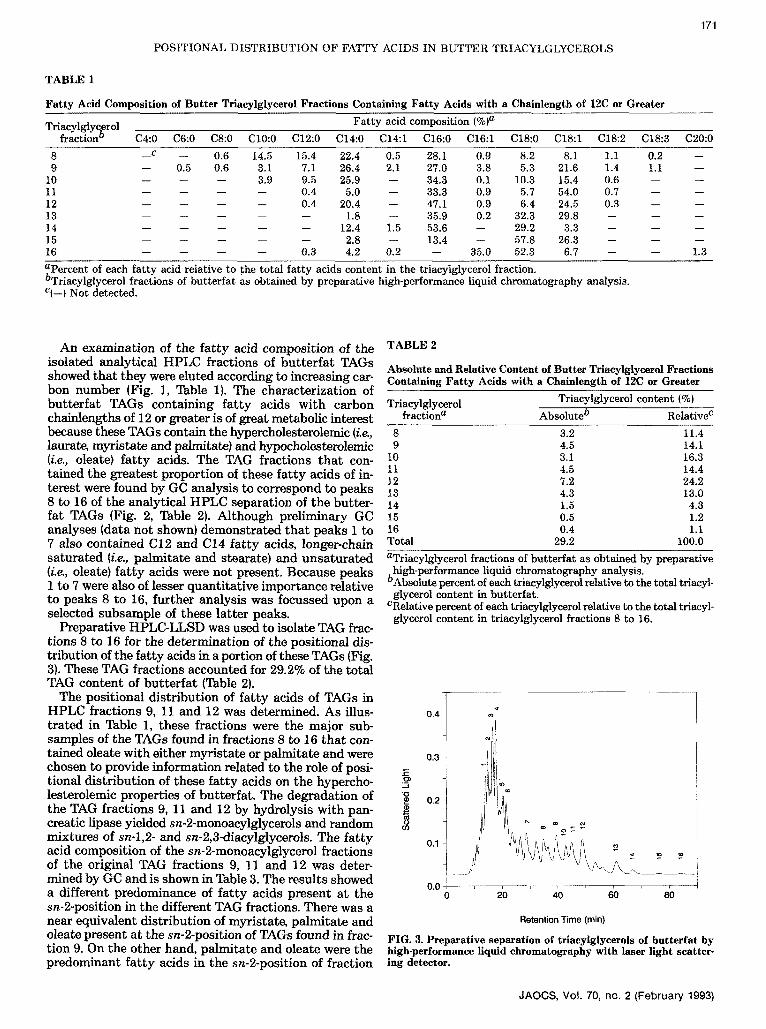
Preparat ive H P L C - L L S D was used to isolate TAG frac- t ions 8 to 16 for the de te rmina t ion of the posi t ional dis- t r ibut ion of the f a t ty acids in a por t ion of these TAGs (Fig. 3). These TAG fract ions accoun ted for 29.2% of the to ta l TAG con ten t of b u t t e r f a t (Table 2).
The posi t ional d i s t r ibu t ion of f a t t y acids of TAGs in H P L C frac t ions 9, 11 and 12 was determined. As illus- t r a t ed in Table 1, these f rac t ions were the ma jo r sub- samples of the TAGs found in f ract ions 8 to 16 t h a t con- ta ined oleate wi th ei ther myr i s t a te or pa lmi ta t e and were chosen to provide in fo rmat ion related to the role of posi- z t ional d i s t r ibu t ion of these f a t t y acids on the hypercho- lesterolemic proper t ies of bu t te r fa t . The deg rada t ion of the TAG frac t ions 9, 11 and 12 by hydrolysis wi th pan- creatic lipase yielded sn-2-monoacylglycerols and r andom mixtures of sn-l,2- and sn-2,3-diacylglycerols. The f a t t y acid compos i t ion of the sn-2-monoacylglycerol f ract ions of the or iginal TAG frac t ions 9, 11 and 12 was deter- mined by GC and is shown in Table 3. The resul t s showed a different p redominance of f a t t y acids presen t a t the sn-2-posit ion in the different TAG fractions. There was a near equivalent d i s t r ibu t ion of myris ta te , pa lmi t a t e and oleate present a t the sn-2-posit ion of TAGs found in frac- t ion 9. On the o ther hand, pa lmi ta te and oleate were the p r edominan t f a t t y acids in the sn-2-posit ion of f rac t ion
TABLE 2
Absolute and Relative Content of Butter Triacylglycerol Fractions Containing Fatty Acids with a Chainlength of 12C or Greater
Triacylglycerol Triacylglycerol content (%) fraction a Absolute b Relative c
3.2 11.4 4.5 14.1 3.1 16.3 4.5 14.4 7.2 24.2 4.3 13.0 1.5 4.3 0.5 1.2 0.4 1.1
29.2 100.0
aTriacylglycerol fractions of butterfat as obtained by preparative high-performance liquid chromatography analysis.
bAbsolute percent of each triacylglycerol relative to the total triacyl- glycerol content in butterfat.
CRelative percent of each triacylglycerol relative to the total triacyl- glycerol content in triacylglycerol fractions 8 to 16.
0.4
0.3
0.2
0.1
0.0 ! • . . . . . . o 2o .~
Retention Time (min)
FIG. 3. Preparative separation of triacylglycerols of butterfat by high-performance liquid chromatography with laser light scatter- ing detector.
JAOCS, VoL 70, no. 2 (Feb rua ry 1993)
172
S. KERMASHA ET AL.
TABLE 3 TABLE 4
Fatty Acid Composition of 2-sn-Monoacylglycerols Obtained from the Hydrolysis of Butter Triacylglycerol Fractions 9, 11 and 12
2-sn-Monoacylglycerol fraction a
9 11
Fat ty acid Percent composition b
12
C4:0 c _ _ C6:0 -- -- -- C8:0 0.4 0.4 0.9 C10:0 -- -- 1.0 C12:0 1.3 0.1 1.4 C14:0 37.0 3.7 10.3 C14:1 1.5 0.5 0.5 C16:0 24.2 47.2 71.1 C16:1 1.0 0.8 1.0 C18:0 -- -- 1.2 C18:1 32.9 46.1 11.2 C18:2 1.7 1.2 1.2 C18:3 -- -- -- C20:0 -- -- 0.2
a2-sn-Monoacylglycerol fractions obtained by the specific hydrolysis of selected butter triacylglycerol fractions.
bpercent of each fatty acid relative to the total fatty acids content in the individual diacylglycerol fraction.
c(-)Not detected.
Fatty Acid Composition of 2,3-sn-Diacylglycerols Obtained from the Hydrolysis of Butter Triacylglycerol Fractions 9, 11 and 12
2,3-sn-Diacylglycerol fraction a
9 11
Fat ty acid Percent composition b
12
C4:0 _ c _ _ C6:0 -- -- -- C8:0 -- -- -- C10:0 -- 0.2 -- C12:0 -- 4.9 9.3 C14:0 70.3 2.6 7.7 C14:1 -- 0.7 8.1 C16:0 14.5 36.5 46.3 C16:1 -- 4.6 6.7 C18:0 -- 13.0 8.2 C18:1 15.2 35.0 8.7 C18:2 -- 1.4 1.0 C18:3 -- 0.8 -- C20:0 -- 0.3 --
a2,3-sn-Diacylglycerol fractions obtained by the specific hydrolysis of selected butter triacylglycerol fractions.
bpercent of each fatty acid relative to the total fatty acids content in the individual diacylglycerol fraction.
c(-}Not detected.
TABLE 5
11, and p a l m i t a t e was t h e p r e d o m i n a n t f a t t y ac id p r e se n t in t h e sn-2-pos i t ion of f r ac t i on 12.
The pancrea t i c l ipase a lso re leases sn-2,3-diacylglycerols as i n t e r m e d i a t e s in t he e n z y m e hydro lys i s . A n ana lys i s of these mo ie t i e s of t he T A G s in f r ac t ions 9, 11 a n d 12 was p e r f o r m e d e n z y m a t i c a l l y w i t h s te reospec i f i c l i pa ses to o b t a i n a s te reospec i f i c p o s i t i o n a l a n a l y s i s of t h e s e d i acy lg lyce ro l s {Table 4). T h e r e s u l t s of t h e f a t t y ac id 9a ana lys i s of t he 2 ,3-sn-d iacy lg lycero ls d e m o n s t r a t e d a p r e p o n d e r a n c e of m y r i s t a t e in f r ac t ion 9, p a l m i t a t e a n d oleate in f rac t ion 11 and p a l m i t a t e in f rac t ion 12 {Table 4). 9b
Fo l lowing a n a l y s i s of t h e f a t t y ac id c o m p o s i t i o n in t h e d iacy lg lycero l , m o n o a c y l g l y c e r o l a n d TAG f rac t ions , t h e pos i t i ona l d i s t r i b u t i o n of f a t t y ac ids in TAGs in t he dif- 9c ferent f rac t ions was de te rmined . Pos i t iona l ana lys i s of t he TAGs in f rac t ions 9, 11 a n d 12 d e m o n s t r a t e d the presence of p o s i t i o n a l i somers in each of t he se f r ac t ions {Table 5). 9d In f rac t ion 9, t he sn - l -pos i t ion is es te r i f i ed w i t h p a l m i t a t e a n d o iea te in equa l p r o p o r t i o n s , while sn-2- and sn-3- pos i t i ons are occupied b y myr i s t a t e , p a l m i t a t e and oleate, l l a Olea te occupies t he sn- l -pos i t ion , whereas p a l m i t a t e is in- t e r c h a n g e d w i t h o lea te a t t h e sn-2- and sn -3 -pos i t ions in t h e two p o s i t i o n a l i somer s in f r ac t ion 11. O lea te is pre- l l b s en t a t t he sn- l -pos i t ion , a n d p a l m i t a t e is es te r i f i ed a t t he sn-2- a n d sn -3 -pos i t ions in t h e p r e d o m i n a n t TAG in frac- t ion 12. The m i n o r TAG in f r ac t ion 12 is a p o s i t i o n a l 12a i s o m e r of t he m a j o r T A G w i t h p a l m i t a t e i n t e r c h a n g e d w i t h o lea te a t t he sn-1 pos i t ion .
The c h a r a c t e r i z a t i o n of t h e p o s i t i o n a l d i s t r i b u t i o n of 12b hypercho les te ro lemic f a t t y ac ids in b u t t e r f a t TAGs is t h e f i r s t s t ep for t h e d e t e r m i n a t i o n of t he m e t a b o l i c role of t h e pos i t i ona l d i s t r i b u t i o n in t he hype rcho les t e ro lemic ef- fects of bu t t e r f a t . A n u m b e r of h u m a n (22-24) and an ima l (25,26) s t u d i e s have s u g g e s t e d t h a t t he c a p a b i l i t y of d i e t a r y s a t u r a t e d f a t s to i nc rease s e r u m choles te ro l is d e p e n d e n t on t h e p re sence of a s a t u r a t e d f a t t y ac ids a t t h e sn-2 p o s i t i o n of t h e TAG. F o r example , d e s p i t e t h e
Positional Distribution of Fatty Acids of Triacylglycerol Isomers Obtained from High-Performance Liquid Chromatography Preparative Separation of Butter Triacylglycerol Fractions 9, 11 and 12
Triacylglycerol
Fraction Isomer Percent a
aC16:0 /3¢14:0 20 a'C18:l aC18:l /~¢14:0 20 a'C16:0
aC18:l ~¢16:0 25 a'C14:0
aC16:0 /3¢18:1 35 a'C14:0
aC18:1 f~¢16:0 50 a'C18:l
aC18:l /~¢18:1 50 a'16:0
aC18:1 /~¢16:0 a'C16:0
aC16:0 /3¢18:1 a'C16:0
85
15
apercent of each triacylglycerol isomer relative to the total isomers in the triacylglycerol fraction.
p r e d o m i n a n t p re sence of s a t u r a t e d f a t t y ac ids in cocoa but ter , the h igh oleate con ten t of t he sn-2 pos i t ion of cocoa TAGs is t h o u g h t to be p a r t l y r e s p o n s i b l e for t he n e u t r a l ef fec ts of t h i s d i e t a r y f a t on s e r u m choles te ro l (26}.
JAOCS, VOl. 70, no. 2 (February 1993)
POSITIONAL DISTRIBUTION OF FATTY ACIDS IN BUTTER TRIACYLGLYCEROLS
173
Moreover, recent findings have indicated tha t the substi- tu t ion of sa tura ted f a t t y acids for oleate in the sn-2 posi- tion of dietary model TAGs slows the metabolic clearance of chylomicrons (1). The present s tudy indicates the pre- dominant presence of hypercholesterolemic f a t ty acids (myris ta te and palmitate) in the sn-2 posit ion of a major fract ion of bu t t e r fa t TAGs (i.e., 65%, 50%, 85% of TAGs in fract ions 9, 11 and 12, respectively). I t is possible t ha t the hypercholesterolemic propert ies of bu t t e r fa t arise in pa r t f rom the proponderance of pa lmi ta te and myr i s ta te at the sn-2 position. Nutri t ional and metabolic studies will be needed to determine the functional significance of the posit ional distr ibution of these TAGs in t e rms of the hypercholesterolemic propert ies of but terfa t .
The present s tudy has demons t ra ted the ut i l i ty of H P L C - L L S D to provide excellent separa t ion and resolu- t ion of the complex mix ture of TAGs found in but ter fa t . Moreover, the results have demonstra ted tha t preparat ive H P L C in combinat ion with enzymat ic degradat ion of the TAG fractions can be used to determine the posit ional distr ibution of f a t ty acids in selective TAG fractions. The character izat ion of the posit ional dis t r ibut ion of hyper- cholesterolemic f a t ty acids in but te r fa t TAGs obtained in the present s tudy can be used to determine the metabolic significance of these posit ional dis t r ibut ions in te rms of the hypercholesterolemic propert ies of but terfa t .
ACKNOWLEDGMENT This research was supported by a grant-in-aid award from the Dairy Bureau of Canada.
REFERENCES 1. Redgrave, T.G., D.R. Kodali and D.M. Small, J. BioL Chem.
263:5118 (1988).
2. Mortimer, B-C., W.J. Simmonds, C.A. Joll, R.V. Stick and T.G. Redgrave, J. Lipid Res. 29:713 (1988).
3. Christie, WT~., inHPLCandLipids:A Practical Guide, Pergamon Press, New York, 1987, p. 169.
4. Stolyhwo, A., H. Colin, M. Martin and G. Guiochon, J. Chromatogr. 288:253 (1984).
5. Stolyhwo, A., H. Colin and G. Guiochon, Ibid. 265:1 (1983). 6. Christie, WiW., and J.L. Clapperton, J. Soc. Dairy Technol. 35:22
(1982). 7. Shehata, A.A.A., J.M. De Mann and J.C. Alexander, J. Can. Inst.
Food Sci. Technol. 4:61 (1971). 8. Robinson, J.L, M. Tsimidou and R. Macrae, J. Chromatogn 324:35
(1985). 9. Robinson, J.L., and R. Macrae, Ibid. 303:386 (1984).
10. Charlesworth, J.M., Anal. Chem. 50:1414 (1978). 11. Deffence, E., Rev. Franc. Corps Gras 31:123 (1984). 12. Stolyhwo, A., H. Colin and G. Guiochon, Anal. Chem. 265:1342
(1985). 13. Kuksis, A., L. Marai and J.J. Myher, J. Chromatogn 273:43 (1983). 14. Kuksis, A., L. Marai, J.J. Myher, J. Cerbulis and H.M. Farrell,
Jr., Lipids 21:183 (1986). 15. Kuksis, A., in Lipid Research Methodology, Alan R. Liss, Inc.,
New York, 1984, p. 77. 16. Myher, J.J., and A. Kuksis, Can. J. Biochem. 57.'117 (1979). 17. Brockerhoff, H., J. Lipid Res. 8:167 (1967). 18. Bad(rigs, H.T., and C. De Jong, J. Chromatogr. 279:493 (1983). 19. Herslof, B., and G. Kindmark, Lipids 20:783 (1985). 20. Tsimidou, M., and R. Macrae, J. Chromatogr. 285:178 (1984). 21. Tsimidou, M., and R. Macrae, J. Chromatogr. Sci. 23:155 (1985). 22. Filer, L.J., EH. Mattson and S.J. Fomon, J. Nutr. 99:293 (1969). 23. McGandy; R.B., D.M. Hegsted and M.L. Myers, Am. J. Clin. Nutr.
23:1288 (1970). 24. Myher, J.J., A. Kuksis, W.C Breckenbridge, V. McGuire and J.A.
Little, Lipids 20:90 (1985). 25. Mattson, EH., G.A. Nolen and M.R. Webb, J. Nutr. 109:1682
(1979). 26. Apgar, J.L,, C.A. Shively and S.M. Tarka, Ibi& 117:660 (1987).
[Received May 6, 1992; accepted November 23, 1992]
JAOCS, Vol. 70, no. 2 (February 1993)