Embed Size (px)
Citation preview
ARTICLE IN PRESS
0736-5845/$ - se
doi:10.1016/j.rc
�Correspondfax: +1519 661
E-mail addr
Robotics and Computer-Integrated Manufacturing 21 (2005) 338–345
www.elsevier.com/locate/rcim
Determining gouge-free ball-end mills for 3D surface machining frompoint cloud data
Daoshan OuYang, Benjamin A. Van Nest, Hsi-Yung Feng�
Department of Mechanical and Materials Engineering, The University of Western Ontario, London, Ont., Canada N6A 5B9
Received 28 September 2004; accepted 28 October 2004
Abstract
This paper presents an algorithm to automatically determine the optimal size of the ball-end milling tool used for the three-axis
finish machining of free-form surfaces directly from discrete coordinate data points. The tool is considered optimal if it is of the
largest possible diameter that can access every data point without causing an overcut situation or gouging the other data points.
Two well-developed techniques in computational geometry, Voronoi diagram and Delaunay triangulation, are used to establish the
geometric relationship among data points from which the information required to determine the optimal tool size is extracted. The
result of Delaunay triangulation is a set of tetrahedrons, with the data points as vertices, which define a corresponding set of empty
circum-spheres. Each data point is a vertex of several tetrahedrons and the largest of the corresponding circum-spheres represents a
valid estimation of the optimal tool size at the point. Since the data points are only a sample of the original 3D surface, accuracy of
the estimated tool size can be improved by using the approximated normal vector at the data point. The estimated tool size is
evaluated by comparing it to its theoretical value. Extensive simulation tests show that a robust and accurate method of determining
the optimal ball-end mill size has been developed.
r 2005 Elsevier Ltd. All rights reserved.
Keywords: Tool selection; Ball-end mill; Gouging; Sculptured surface; Point cloud data
1. Introduction
Complex compound surfaces are being used in today’smodern designs to fulfill both the functional andaesthetic requirements, particularly in the automotiveand aerospace industries. Determining the largestdiameter and thus most efficient cutting tool that isable to machine the desired geometry without gouging iscompulsory during the rough and finish machiningstages. Some researchers developed methods to auto-matically select roughing and finishing cutting tools forprismatic pocket machining [1–3]. Research dealing withcutting tool selection for sculptured surface machininghas also been proposed based on the surface curvature
e front matter r 2005 Elsevier Ltd. All rights reserved.
im.2004.10.003
ing author. Tel.: +1519 661 2111x88289;
3020.
ess: [email protected] (H.-Y. Feng).
[4]. It should be noted that curvature is a local geometricproperty and cannot be used to avoid global gougingaround the cutting tool tip. Also, in these researchstudies, the required geometric information was readilyavailable from the continuous mathematical representa-tions of the geometric features when determining thegouge-free cutter or cutters.In recent years, the importance of reverse engineering
and component duplication has been recognized.Physical models or prototypes that have been createdby hand or for which there are no CAD softwarerepresentations require sophisticated reverse engineeringtechniques to be recreated with sufficient accuracy.There are currently three major steps involved in theduplication of an existing component: (1) acquisition ofdiscretized surface coordinate data; (2) CAD modelconstruction from the data points; and (3) automaticcutting tool selection and NC tool path generation. In
ARTICLE IN PRESSD. OuYang et al. / Robotics and Computer-Integrated Manufacturing 21 (2005) 338–345 339
the first step, discrete data points are acquired from non-contact digitizing devices such as 3D laser scanners orfrom contact devices such as coordinate measuringmachines. Both can generate clouds of measured datapoints in 3D space. The process of converting thediscrete data points into usable CAD models ofcontinuous geometry is known to be an area ofchallenging research. This has been the preferredpractice because robust methods are already in placeto generate NC machining commands for continuoussurface representations.Recently, the question of whether or not a CAD
model representation is truly a necessary step has beenraised and investigated. Is it possible to automaticallyselect an optimal cutting tool and generate NCmachining tool paths directly from the discretized data?It is particularly an important question to ask whenconsidering the difficulties inherent in developing CADmodel representations for complex surfaces.To develop means of dealing with discrete data
points, several papers have been presented which aimto generate machining tool paths directly from pointcloud data. The first and main assumption of all theproposed methods is that the discrete data pointsobtained from the scanning devices contain negligiblemeasuring errors. Lin and Liu [5] reported a method ofdetermining the roughing and finishing tool paths usingthe Z-map method. Chuang et al. [6] proposed a methodof generating machining tool paths using Z-maps aswell, but a triangular mesh was used as opposed to thelinear interpolation used in Ref. [5]. Also based on Z-map interpolation, Park and Chung [7] generated NCtool paths in the form of point sequence curves. A recentmethod proposed by Feng and Teng [8] generated toolpaths without Z-map or triangular mesh approximation.A cutter location net (CL-net) was created for iso-planarpiece-wise linear NC tool path generation according tothe intended machining error and surface finish require-ments. All of these research studies, however, onlyfocused on tool path generation for a given tool and theselection of the optimal tool size directly from pointcloud data has not been examined.This paper proposes a method that can select an
optimally sized cutting tool from a set of 3D data pointsrepresenting any given surface geometry. This optimaltool size will be as large as possible while still being ableto machine the entire point-represented surface withoutgouging any measured or sampled data point. Toachieve this, the well-developed algorithm of Delaunaytriangulation, the geometric dual of Voronoi diagram, isused [9]. Section 2 of the paper introduces the relevantgeometric computing procedures to approximate themedial axis sphere and to identify the Delaunay polesphere for every data point. Evaluation of the Delaunaypole sphere as the optimal tool size for point cloud datais presented in Section 3. Section 4 covers the possible
accuracy improvement for the estimated optimal toolsize. Concluding remarks are reserved for the lastsection of the paper.
2. Relevant geometric computing procedures
Concepts of medial axis sphere and Delaunay polesphere are presented in this section. Medial axis sphereat a specific data point represents the theoreticalsolution of the optimal tool size at the point on theoriginal continuous surface. Delaunay pole sphere at aspecific data point represents the largest cutting tool sizewithout gouging any other discrete data point.
2.1. Medial axis sphere approximation
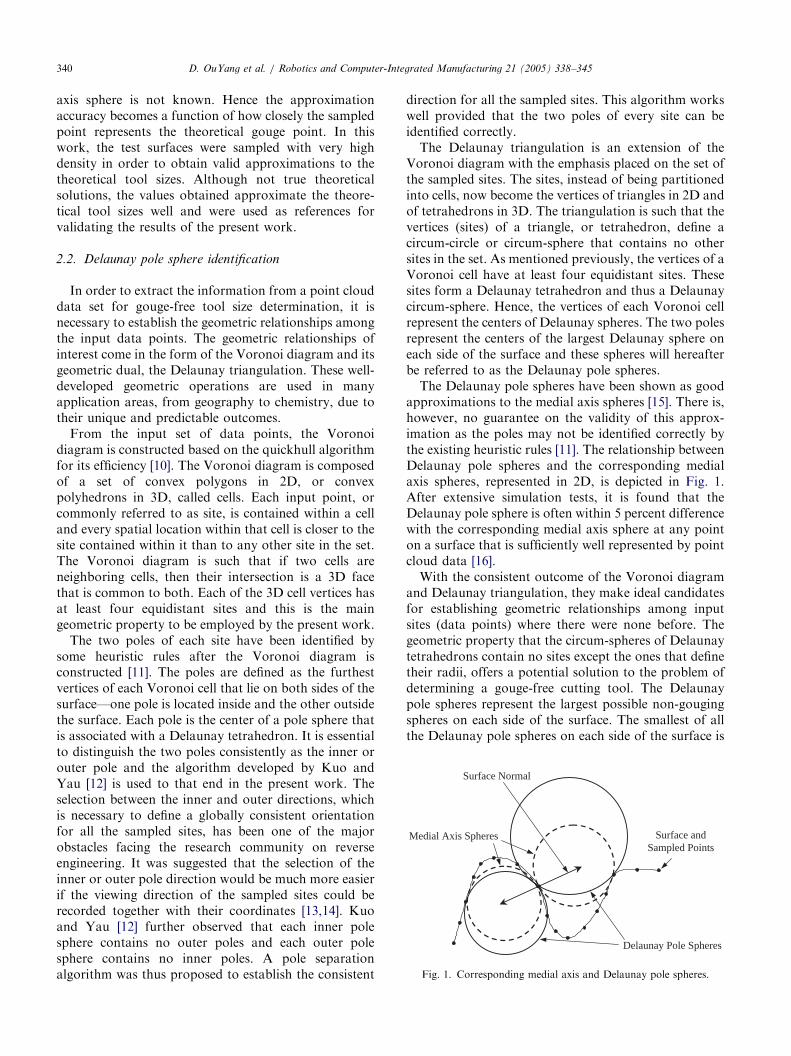
The medial axis of a 3D surface is defined as thecenter locus of the maximum empty sphere at everypoint on the surface. An empty sphere is one which doesnot contain any part of the surface within its interior.The center of such a sphere is along the normal directionat the corresponding point on the surface and touches atleast one of the other point on the surface. The medialaxis in the 2D space is represented by a curve and in the3D space a surface. In other words, a medial axis sphereat a specific point on a surface represents the largestsphere that touches at least one other point on thesurface and without having any other part of the surfacecontained within it. The medial axis sphere is thusconsidered as the theoretical solution for the optimizedtool size. Nevertheless, it is in general difficult toconstruct the theoretical medial axis in the 3D space.There are no robust algorithms currently in place thatcan generate the exact medial axis of all geometricshapes and thus the corresponding sphere sizes aredifficult to obtain.For the simulation tests to be presented in the
subsequent sections, continuous surfaces with well-defined mathematical representations were used tocreate simulated point cloud data sets in which thesurface normal vectors were readily available at everypoint. To approximate the medial axis spheres, an initialsphere was created at each point by positioning thesphere’s center along the point’s normal vector accord-ing to an arbitrarily large and exaggerated radius. Thecenter of the initial sphere was then updated along thenormal vector using any point found closer to the initialsphere center then the point being examined. Thisiterative process continued until the sphere was emptyand constrained only by one other point (gouge point).It should be noted that although exact surface normal
vectors were used, the derived medial axis spheres werestill approximations to the true medial axis spheres. Thisis due to the fact that the theoretical gouge point on thecontinuous surface which limits the size of the medial
ARTICLE IN PRESS
Surface Normal
Surface andSampled Points
Delaunay Pole Spheres
Medial Axis Spheres
Fig. 1. Corresponding medial axis and Delaunay pole spheres.
D. OuYang et al. / Robotics and Computer-Integrated Manufacturing 21 (2005) 338–345340
axis sphere is not known. Hence the approximationaccuracy becomes a function of how closely the sampledpoint represents the theoretical gouge point. In thiswork, the test surfaces were sampled with very highdensity in order to obtain valid approximations to thetheoretical tool sizes. Although not true theoreticalsolutions, the values obtained approximate the theore-tical tool sizes well and were used as references forvalidating the results of the present work.
2.2. Delaunay pole sphere identification
In order to extract the information from a point clouddata set for gouge-free tool size determination, it isnecessary to establish the geometric relationships amongthe input data points. The geometric relationships ofinterest come in the form of the Voronoi diagram and itsgeometric dual, the Delaunay triangulation. These well-developed geometric operations are used in manyapplication areas, from geography to chemistry, due totheir unique and predictable outcomes.From the input set of data points, the Voronoi
diagram is constructed based on the quickhull algorithmfor its efficiency [10]. The Voronoi diagram is composedof a set of convex polygons in 2D, or convexpolyhedrons in 3D, called cells. Each input point, orcommonly referred to as site, is contained within a celland every spatial location within that cell is closer to thesite contained within it than to any other site in the set.The Voronoi diagram is such that if two cells areneighboring cells, then their intersection is a 3D facethat is common to both. Each of the 3D cell vertices hasat least four equidistant sites and this is the maingeometric property to be employed by the present work.The two poles of each site have been identified by
some heuristic rules after the Voronoi diagram isconstructed [11]. The poles are defined as the furthestvertices of each Voronoi cell that lie on both sides of thesurface—one pole is located inside and the other outsidethe surface. Each pole is the center of a pole sphere thatis associated with a Delaunay tetrahedron. It is essentialto distinguish the two poles consistently as the inner orouter pole and the algorithm developed by Kuo andYau [12] is used to that end in the present work. Theselection between the inner and outer directions, whichis necessary to define a globally consistent orientationfor all the sampled sites, has been one of the majorobstacles facing the research community on reverseengineering. It was suggested that the selection of theinner or outer pole direction would be much more easierif the viewing direction of the sampled sites could berecorded together with their coordinates [13,14]. Kuoand Yau [12] further observed that each inner polesphere contains no outer poles and each outer polesphere contains no inner poles. A pole separationalgorithm was thus proposed to establish the consistent
direction for all the sampled sites. This algorithm workswell provided that the two poles of every site can beidentified correctly.The Delaunay triangulation is an extension of the
Voronoi diagram with the emphasis placed on the set ofthe sampled sites. The sites, instead of being partitionedinto cells, now become the vertices of triangles in 2D andof tetrahedrons in 3D. The triangulation is such that thevertices (sites) of a triangle, or tetrahedron, define acircum-circle or circum-sphere that contains no othersites in the set. As mentioned previously, the vertices of aVoronoi cell have at least four equidistant sites. Thesesites form a Delaunay tetrahedron and thus a Delaunaycircum-sphere. Hence, the vertices of each Voronoi cellrepresent the centers of Delaunay spheres. The two polesrepresent the centers of the largest Delaunay sphere oneach side of the surface and these spheres will hereafterbe referred to as the Delaunay pole spheres.The Delaunay pole spheres have been shown as good
approximations to the medial axis spheres [15]. There is,however, no guarantee on the validity of this approx-imation as the poles may not be identified correctly bythe existing heuristic rules [11]. The relationship betweenDelaunay pole spheres and the corresponding medialaxis spheres, represented in 2D, is depicted in Fig. 1.After extensive simulation tests, it is found that theDelaunay pole sphere is often within 5 percent differencewith the corresponding medial axis sphere at any pointon a surface that is sufficiently well represented by pointcloud data [16].With the consistent outcome of the Voronoi diagram
and Delaunay triangulation, they make ideal candidatesfor establishing geometric relationships among inputsites (data points) where there were none before. Thegeometric property that the circum-spheres of Delaunaytetrahedrons contain no sites except the ones that definetheir radii, offers a potential solution to the problem ofdetermining a gouge-free cutting tool. The Delaunaypole spheres represent the largest possible non-gougingspheres on each side of the surface. The smallest of allthe Delaunay pole spheres on each side of the surface is
ARTICLE IN PRESSD. OuYang et al. / Robotics and Computer-Integrated Manufacturing 21 (2005) 338–345 341
then an approximation to the optimal, non-gougingcutting tool size.
3. Tool determination based on Delaunay pole spheres
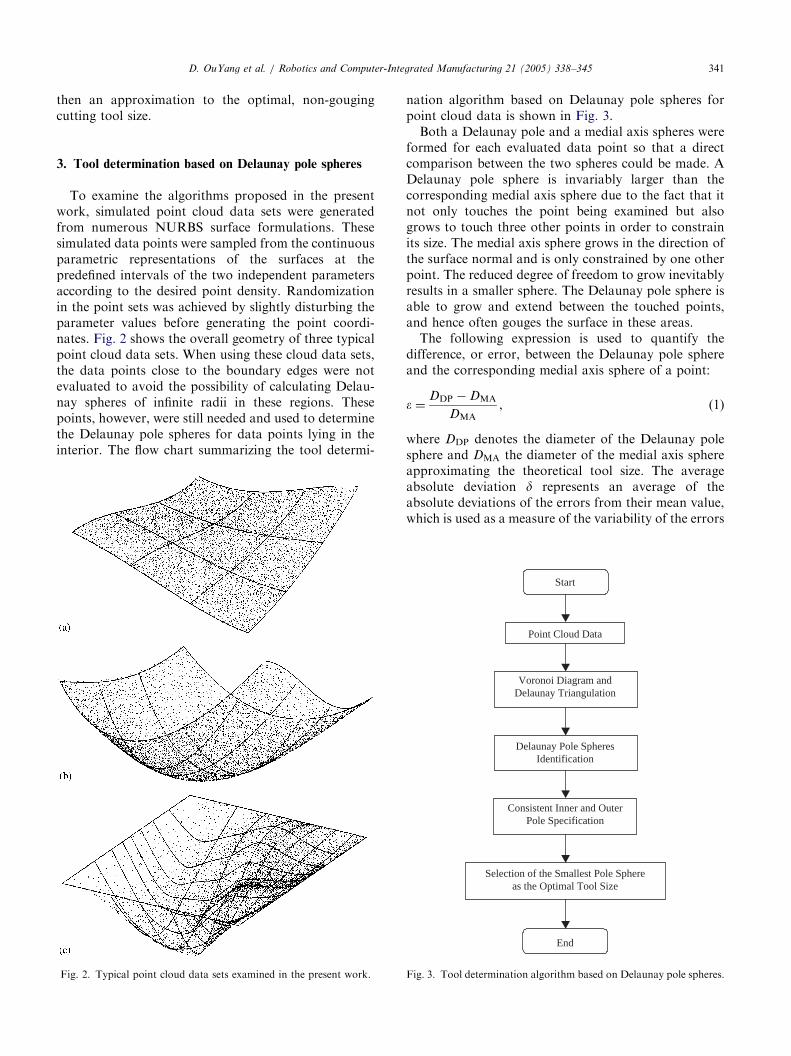
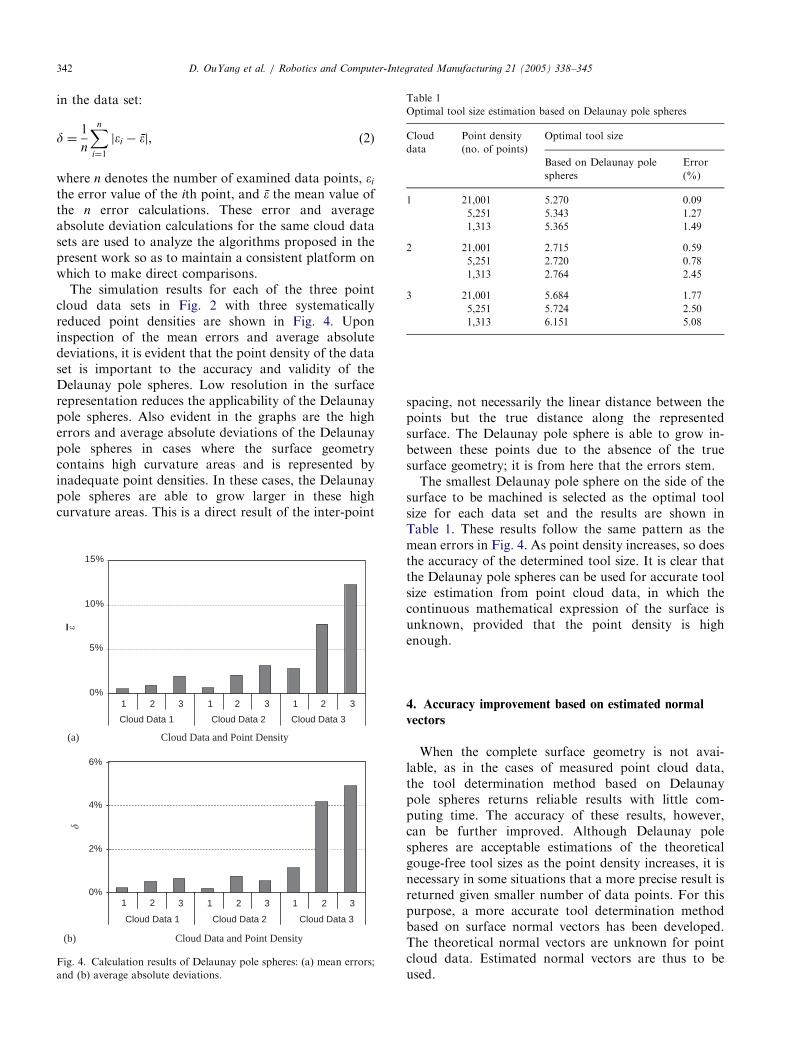
To examine the algorithms proposed in the presentwork, simulated point cloud data sets were generatedfrom numerous NURBS surface formulations. Thesesimulated data points were sampled from the continuousparametric representations of the surfaces at thepredefined intervals of the two independent parametersaccording to the desired point density. Randomizationin the point sets was achieved by slightly disturbing theparameter values before generating the point coordi-nates. Fig. 2 shows the overall geometry of three typicalpoint cloud data sets. When using these cloud data sets,the data points close to the boundary edges were notevaluated to avoid the possibility of calculating Delau-nay spheres of infinite radii in these regions. Thesepoints, however, were still needed and used to determinethe Delaunay pole spheres for data points lying in theinterior. The flow chart summarizing the tool determi-
Fig. 2. Typical point cloud data sets examined in the present work.
nation algorithm based on Delaunay pole spheres forpoint cloud data is shown in Fig. 3.Both a Delaunay pole and a medial axis spheres were
formed for each evaluated data point so that a directcomparison between the two spheres could be made. ADelaunay pole sphere is invariably larger than thecorresponding medial axis sphere due to the fact that itnot only touches the point being examined but alsogrows to touch three other points in order to constrainits size. The medial axis sphere grows in the direction ofthe surface normal and is only constrained by one otherpoint. The reduced degree of freedom to grow inevitablyresults in a smaller sphere. The Delaunay pole sphere isable to grow and extend between the touched points,and hence often gouges the surface in these areas.The following expression is used to quantify the
difference, or error, between the Delaunay pole sphereand the corresponding medial axis sphere of a point:
� ¼DDP � DMA
DMA, (1)
where DDP denotes the diameter of the Delaunay polesphere and DMA the diameter of the medial axis sphereapproximating the theoretical tool size. The averageabsolute deviation d represents an average of theabsolute deviations of the errors from their mean value,which is used as a measure of the variability of the errors
Point Cloud Data
Start
Voronoi Diagram andDelaunay Triangulation
Delaunay Pole SpheresIdentification
Consistent Inner and OuterPole Specification
Selection of the Smallest Pole Sphere as the Optimal Tool Size
End
Fig. 3. Tool determination algorithm based on Delaunay pole spheres.
ARTICLE IN PRESS
Table 1
Optimal tool size estimation based on Delaunay pole spheres
Cloud
data
Point density
(no. of points)
Optimal tool size
Based on Delaunay pole
spheres
Error
(%)
1 21,001 5.270 0.09
5,251 5.343 1.27
1,313 5.365 1.49
2 21,001 2.715 0.59
5,251 2.720 0.78
1,313 2.764 2.45
3 21,001 5.684 1.77
5,251 5.724 2.50
1,313 6.151 5.08
D. OuYang et al. / Robotics and Computer-Integrated Manufacturing 21 (2005) 338–345342
in the data set:
d ¼1
n
Xn
i¼1
j�i � �̄j, (2)
where n denotes the number of examined data points, �i
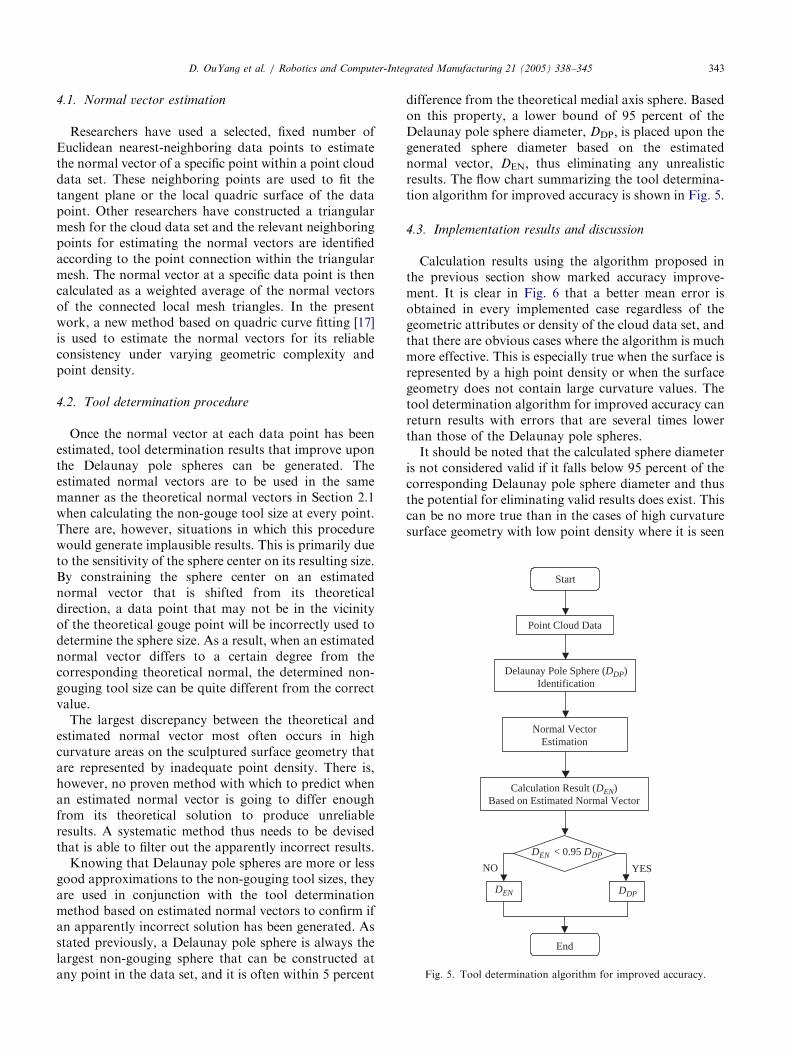
the error value of the ith point, and �̄ the mean value ofthe n error calculations. These error and averageabsolute deviation calculations for the same cloud datasets are used to analyze the algorithms proposed in thepresent work so as to maintain a consistent platform onwhich to make direct comparisons.The simulation results for each of the three point
cloud data sets in Fig. 2 with three systematicallyreduced point densities are shown in Fig. 4. Uponinspection of the mean errors and average absolutedeviations, it is evident that the point density of the dataset is important to the accuracy and validity of theDelaunay pole spheres. Low resolution in the surfacerepresentation reduces the applicability of the Delaunaypole spheres. Also evident in the graphs are the higherrors and average absolute deviations of the Delaunaypole spheres in cases where the surface geometrycontains high curvature areas and is represented byinadequate point densities. In these cases, the Delaunaypole spheres are able to grow larger in these highcurvature areas. This is a direct result of the inter-point
0%
5%
10%
15%
(a)
1 2 3 1 2 3 1 2 3
Cloud Data 1 Cloud Data 2 Cloud Data 3
Cloud Data and Point Density
0%
2%
4%
6%
1 2 3 1 2 3 1 2 3
Cloud Data 1 Cloud Data 2 Cloud Data 3
Cloud Data and Point Density(b)
��
Fig. 4. Calculation results of Delaunay pole spheres: (a) mean errors;
and (b) average absolute deviations.
spacing, not necessarily the linear distance between thepoints but the true distance along the representedsurface. The Delaunay pole sphere is able to grow in-between these points due to the absence of the truesurface geometry; it is from here that the errors stem.The smallest Delaunay pole sphere on the side of the
surface to be machined is selected as the optimal toolsize for each data set and the results are shown inTable 1. These results follow the same pattern as themean errors in Fig. 4. As point density increases, so doesthe accuracy of the determined tool size. It is clear thatthe Delaunay pole spheres can be used for accurate toolsize estimation from point cloud data, in which thecontinuous mathematical expression of the surface isunknown, provided that the point density is highenough.
4. Accuracy improvement based on estimated normal
vectors
When the complete surface geometry is not avai-lable, as in the cases of measured point cloud data,the tool determination method based on Delaunaypole spheres returns reliable results with little com-puting time. The accuracy of these results, however,can be further improved. Although Delaunay polespheres are acceptable estimations of the theoreticalgouge-free tool sizes as the point density increases, it isnecessary in some situations that a more precise result isreturned given smaller number of data points. For thispurpose, a more accurate tool determination methodbased on surface normal vectors has been developed.The theoretical normal vectors are unknown for pointcloud data. Estimated normal vectors are thus to beused.
ARTICLE IN PRESS
Point Cloud Data
Calculation Result (DEN)Based on Estimated Normal Vector
NO YES
Start
Delaunay Pole Sphere (DDP)Identification
Normal Vector Estimation
DEN < 0.95 DDP
DDPDEN
End
Fig. 5. Tool determination algorithm for improved accuracy.
D. OuYang et al. / Robotics and Computer-Integrated Manufacturing 21 (2005) 338–345 343
4.1. Normal vector estimation
Researchers have used a selected, fixed number ofEuclidean nearest-neighboring data points to estimatethe normal vector of a specific point within a point clouddata set. These neighboring points are used to fit thetangent plane or the local quadric surface of the datapoint. Other researchers have constructed a triangularmesh for the cloud data set and the relevant neighboringpoints for estimating the normal vectors are identifiedaccording to the point connection within the triangularmesh. The normal vector at a specific data point is thencalculated as a weighted average of the normal vectorsof the connected local mesh triangles. In the presentwork, a new method based on quadric curve fitting [17]is used to estimate the normal vectors for its reliableconsistency under varying geometric complexity andpoint density.
4.2. Tool determination procedure
Once the normal vector at each data point has beenestimated, tool determination results that improve uponthe Delaunay pole spheres can be generated. Theestimated normal vectors are to be used in the samemanner as the theoretical normal vectors in Section 2.1when calculating the non-gouge tool size at every point.There are, however, situations in which this procedurewould generate implausible results. This is primarily dueto the sensitivity of the sphere center on its resulting size.By constraining the sphere center on an estimatednormal vector that is shifted from its theoreticaldirection, a data point that may not be in the vicinityof the theoretical gouge point will be incorrectly used todetermine the sphere size. As a result, when an estimatednormal vector differs to a certain degree from thecorresponding theoretical normal, the determined non-gouging tool size can be quite different from the correctvalue.The largest discrepancy between the theoretical and
estimated normal vector most often occurs in highcurvature areas on the sculptured surface geometry thatare represented by inadequate point density. There is,however, no proven method with which to predict whenan estimated normal vector is going to differ enoughfrom its theoretical solution to produce unreliableresults. A systematic method thus needs to be devisedthat is able to filter out the apparently incorrect results.Knowing that Delaunay pole spheres are more or less
good approximations to the non-gouging tool sizes, theyare used in conjunction with the tool determinationmethod based on estimated normal vectors to confirm ifan apparently incorrect solution has been generated. Asstated previously, a Delaunay pole sphere is always thelargest non-gouging sphere that can be constructed atany point in the data set, and it is often within 5 percent
difference from the theoretical medial axis sphere. Basedon this property, a lower bound of 95 percent of theDelaunay pole sphere diameter, DDP; is placed upon thegenerated sphere diameter based on the estimatednormal vector, DEN; thus eliminating any unrealisticresults. The flow chart summarizing the tool determina-tion algorithm for improved accuracy is shown in Fig. 5.
4.3. Implementation results and discussion
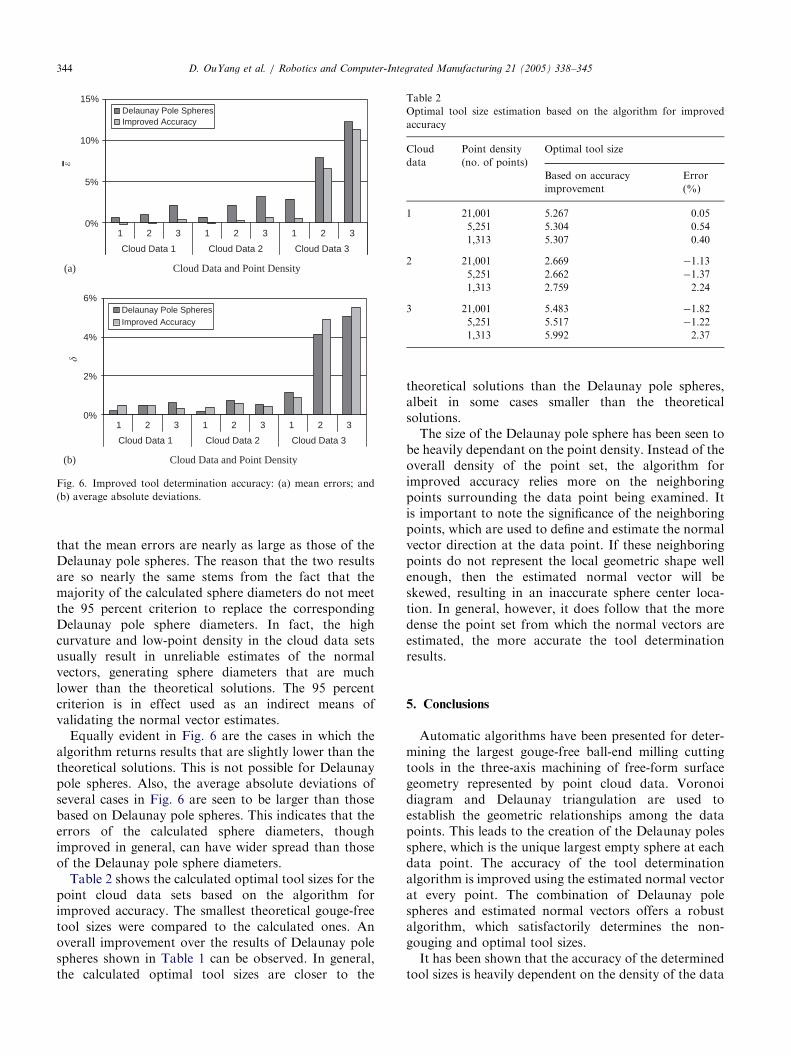
Calculation results using the algorithm proposed inthe previous section show marked accuracy improve-ment. It is clear in Fig. 6 that a better mean error isobtained in every implemented case regardless of thegeometric attributes or density of the cloud data set, andthat there are obvious cases where the algorithm is muchmore effective. This is especially true when the surface isrepresented by a high point density or when the surfacegeometry does not contain large curvature values. Thetool determination algorithm for improved accuracy canreturn results with errors that are several times lowerthan those of the Delaunay pole spheres.It should be noted that the calculated sphere diameter
is not considered valid if it falls below 95 percent of thecorresponding Delaunay pole sphere diameter and thusthe potential for eliminating valid results does exist. Thiscan be no more true than in the cases of high curvaturesurface geometry with low point density where it is seen
ARTICLE IN PRESS
(a)
1 2 3 1 2 3 1 2 3
Cloud Data 1 Cloud Data 2 Cloud Data 3
0%
2%
4%
6%
(b)
Cloud Data and Point Density
1 2 3 1 2 3 1 2 3
Cloud Data 1 Cloud Data 2 Cloud Data 3
Cloud Data and Point Density
Delaunay Pole SpheresImproved Accuracy
Delaunay Pole SpheresImproved Accuracy
0%
5%
10%
15%
��
Fig. 6. Improved tool determination accuracy: (a) mean errors; and
(b) average absolute deviations.
Table 2
Optimal tool size estimation based on the algorithm for improved
accuracy
Cloud
data
Point density
(no. of points)
Optimal tool size
Based on accuracy
improvement
Error
(%)
1 21,001 5.267 0.05
5,251 5.304 0.54
1,313 5.307 0.40
2 21,001 2.669 �1.13
5,251 2.662 �1.37
1,313 2.759 2.24
3 21,001 5.483 �1.82
5,251 5.517 �1.22
1,313 5.992 2.37
D. OuYang et al. / Robotics and Computer-Integrated Manufacturing 21 (2005) 338–345344
that the mean errors are nearly as large as those of theDelaunay pole spheres. The reason that the two resultsare so nearly the same stems from the fact that themajority of the calculated sphere diameters do not meetthe 95 percent criterion to replace the correspondingDelaunay pole sphere diameters. In fact, the highcurvature and low-point density in the cloud data setsusually result in unreliable estimates of the normalvectors, generating sphere diameters that are muchlower than the theoretical solutions. The 95 percentcriterion is in effect used as an indirect means ofvalidating the normal vector estimates.Equally evident in Fig. 6 are the cases in which the
algorithm returns results that are slightly lower than thetheoretical solutions. This is not possible for Delaunaypole spheres. Also, the average absolute deviations ofseveral cases in Fig. 6 are seen to be larger than thosebased on Delaunay pole spheres. This indicates that theerrors of the calculated sphere diameters, thoughimproved in general, can have wider spread than thoseof the Delaunay pole sphere diameters.Table 2 shows the calculated optimal tool sizes for the
point cloud data sets based on the algorithm forimproved accuracy. The smallest theoretical gouge-freetool sizes were compared to the calculated ones. Anoverall improvement over the results of Delaunay polespheres shown in Table 1 can be observed. In general,the calculated optimal tool sizes are closer to the
theoretical solutions than the Delaunay pole spheres,albeit in some cases smaller than the theoreticalsolutions.The size of the Delaunay pole sphere has been seen to
be heavily dependant on the point density. Instead of theoverall density of the point set, the algorithm forimproved accuracy relies more on the neighboringpoints surrounding the data point being examined. Itis important to note the significance of the neighboringpoints, which are used to define and estimate the normalvector direction at the data point. If these neighboringpoints do not represent the local geometric shape wellenough, then the estimated normal vector will beskewed, resulting in an inaccurate sphere center loca-tion. In general, however, it does follow that the moredense the point set from which the normal vectors areestimated, the more accurate the tool determinationresults.
5. Conclusions
Automatic algorithms have been presented for deter-mining the largest gouge-free ball-end milling cuttingtools in the three-axis machining of free-form surfacegeometry represented by point cloud data. Voronoidiagram and Delaunay triangulation are used toestablish the geometric relationships among the datapoints. This leads to the creation of the Delaunay polessphere, which is the unique largest empty sphere at eachdata point. The accuracy of the tool determinationalgorithm is improved using the estimated normal vectorat every point. The combination of Delaunay polespheres and estimated normal vectors offers a robustalgorithm, which satisfactorily determines the non-gouging and optimal tool sizes.It has been shown that the accuracy of the determined
tool sizes is heavily dependent on the density of the data
ARTICLE IN PRESSD. OuYang et al. / Robotics and Computer-Integrated Manufacturing 21 (2005) 338–345 345
points. Better accuracy would thus be obtained at theprice of increased point density and added computingtime. Further work is being carried out at the UWOCAD/CAM/CAI Research Laboratory to develop andimplement an algorithm to achieve both improvedaccuracy and computational efficiency.
Acknowledgement
This work was supported in part by the NaturalSciences and Engineering Research Council of Canada.
References
[1] Veeramani D, Gau YS. Selection of an optimal set of cutting-tool
sizes for 2 1/2 D pocket machining. Comput Aided Des
1997;29(12):869–77.
[2] Lim T, Corney J, Clark DER. Exact tool sizing for feature
accessibility. Int J Adv Manuf Technol 2000;16(11):791–802.
[3] Yao Z, Gupta SK, Nau DS. Algorithms for selecting cutters in
multi-part milling problems. Comput Aided Des 2003;35(9):
825–39.
[4] Lee YS, Choi BK, Chang TC. Cut distribution and cutter
selection for sculptured surface cavity machining. Int J Prod Res
1992;30(6):1447–70.
[5] Lin AC, Liu HT. Automatic generation of NC cutter path from
massive data points. Comput Aided Des 1998;30(1):77–90.
[6] Chuang CM, Chen CY, Yau HT. A reverse engineering approach
to generating interference-free tool paths in three-axis machining
from scanned data of physical models. Int J Adv Manuf Technol
2002;19(1):23–31.
[7] Park SC, Chung YC. Tool-path generation from measured data.
Comput Aided Des 2003;35(5):467–75.
[8] Feng HY, Teng Z. Iso-planar piecewise linear NC tool path
generation from discrete measured data points. Comput Aided
Des 2005;37(1):55–64.
[9] O’Rourke J. Computational geometry in C. New York: Cam-
bridge University Press; 1998.
[10] Barber CB, Dobkin DP, Huhdanpaa H. The quickhull algorithm
for convex hulls. ACM Trans Math Software 1996;22(4):469–83.
[11] Amenta N, Bern M. Surface reconstruction by Voronoi filtering.
Discrete Comput Geom 1999;22:481–504.
[12] Kuo CC, Yau HT. Reconstruction of virtual parts from
unorganized scanned data for automated dimensional inspection.
ASME J Comput Inform Sci Eng 2003;3:76–86.
[13] Hoppe H, DeRose T, Duchamp T, McDonald J, Stuetzle W.
Surface reconstruction from unorganized points. Proceedings of
the 19th annual conference on computer graphics and interactive
techniques, 1992. p. 71–8.
[14] Yau HT, Kuo CC, Yeh CH. Extension of surface reconstruction
algorithm to the global stitching and repairing of STL models.
Comput Aided Des 2003;35(5):477–86.
[15] Dey TK, Zhao W. Approximate medial axis as a Voronoi
subcomplex. Comput Aided Des 2004;36(2):195–202.
[16] Van Nest BA. Automatic cutter size selection for three-axis free-
form surface machining. Master’s thesis, The University of
Western Ontario, London, Ontario, Canada, 2004.
[17] OuYang D, Feng HY. On the normal vector estimation for point
cloud data from smooth surfaces. Comput Aided Des, in press.