Embed Size (px)
Citation preview
DETERMINING PERFORMANCE BENCHMARKS FOR A MEDICAID VALUE-BASED PAYMENT PROGRAM
Medicaid Innovation Accelerator Program Webinar
January 31, 2018, 2:00PM-3:30 PM ET
22
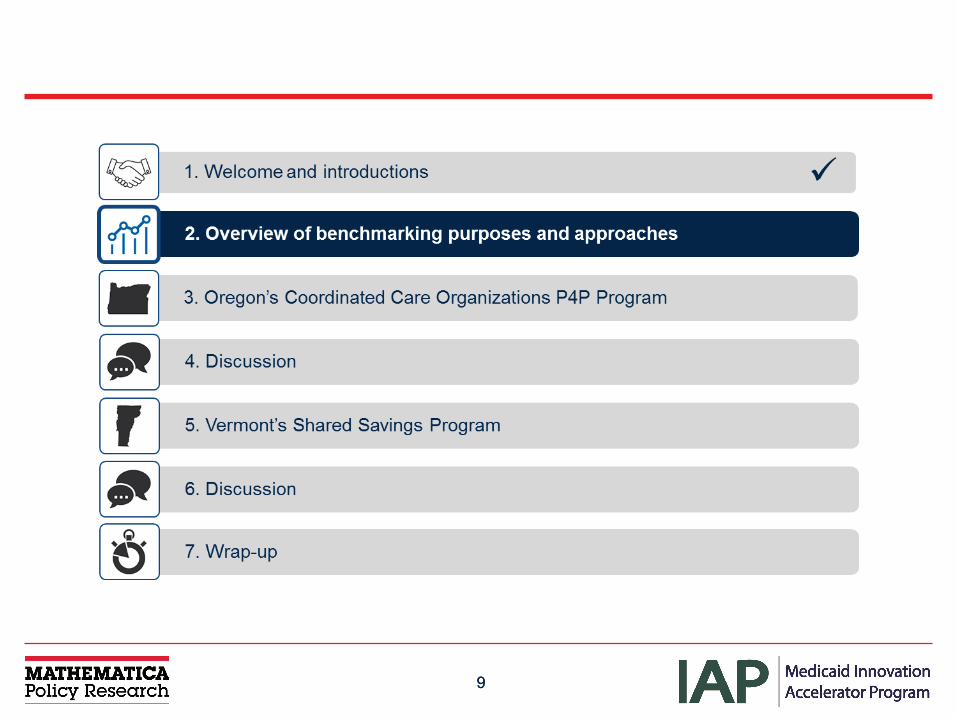
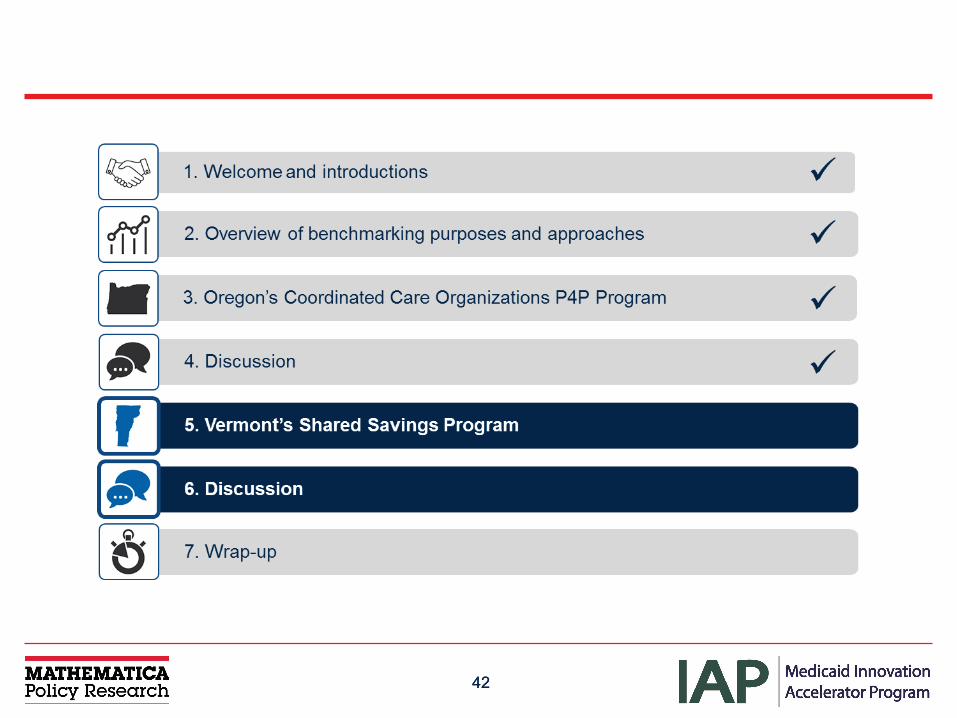
Agenda
33
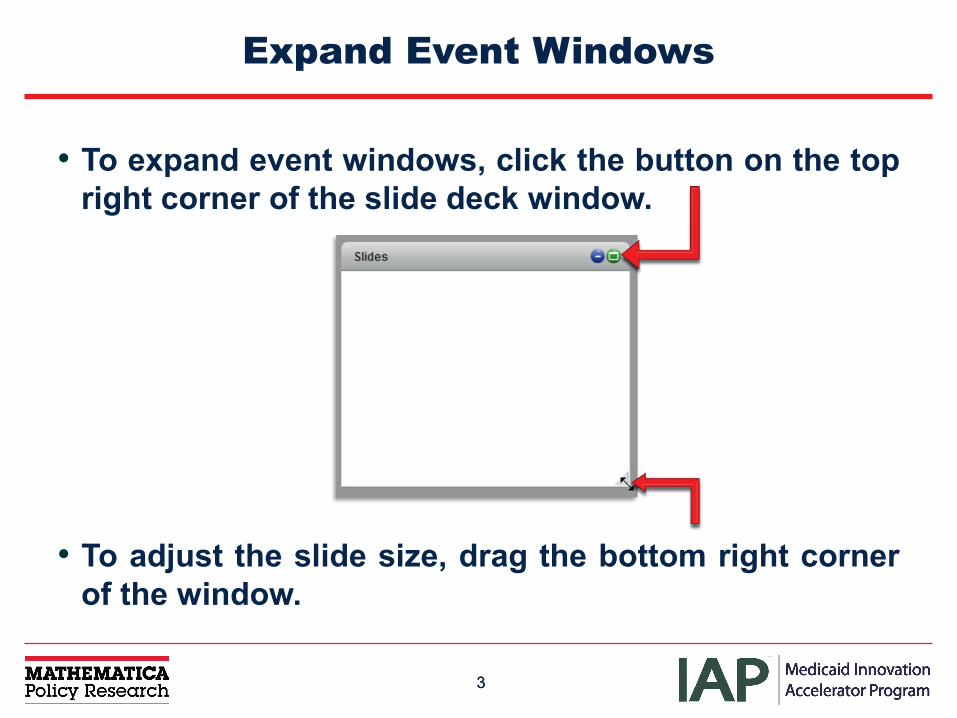
Expand Event Windows
• To expand event windows, click the button on the topright corner of the slide deck window.
• To adjust the slide size, drag the bottom right cornerof the window.
44
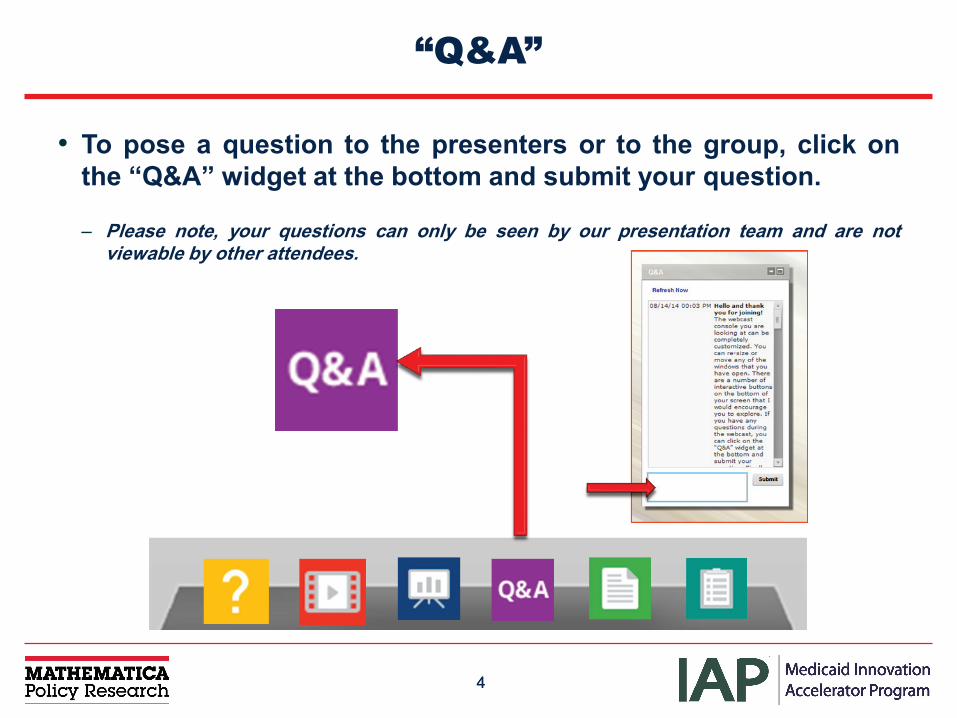
“Q&A”
• To pose a question to the presenters or to the group, click onthe “Q&A” widget at the bottom and submit your question.
– Please note, your questions can only be seen by our presentation team and are notviewable by other attendees.
55
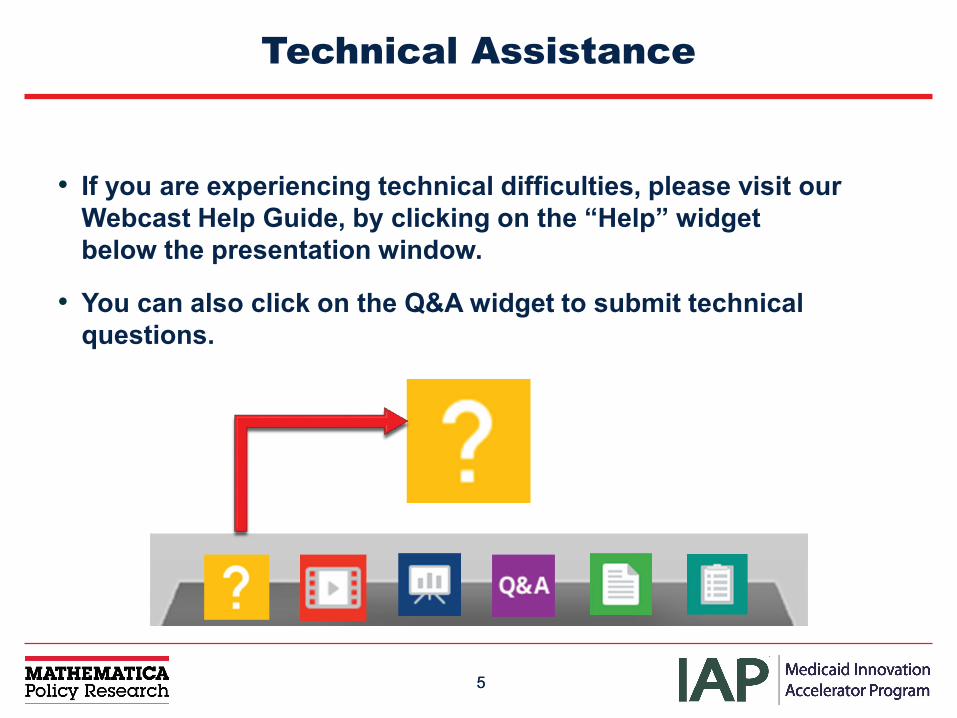
Technical Assistance
• If you are experiencing technical difficulties, please visit our Webcast Help Guide, by clicking on the “Help” widget below the presentation window.
• You can also click on the Q&A widget to submit technical questions.

66
Today’s Speakers
• So O’Neil (Mathematica)
• Ella Douglas-Durham (Mathematica)
• Jon Collins (Oregon Health Authority)
• Pat Jones (Green Mountain Care Board)
• Alicia Cooper (Department of Vermont Health Access)
77
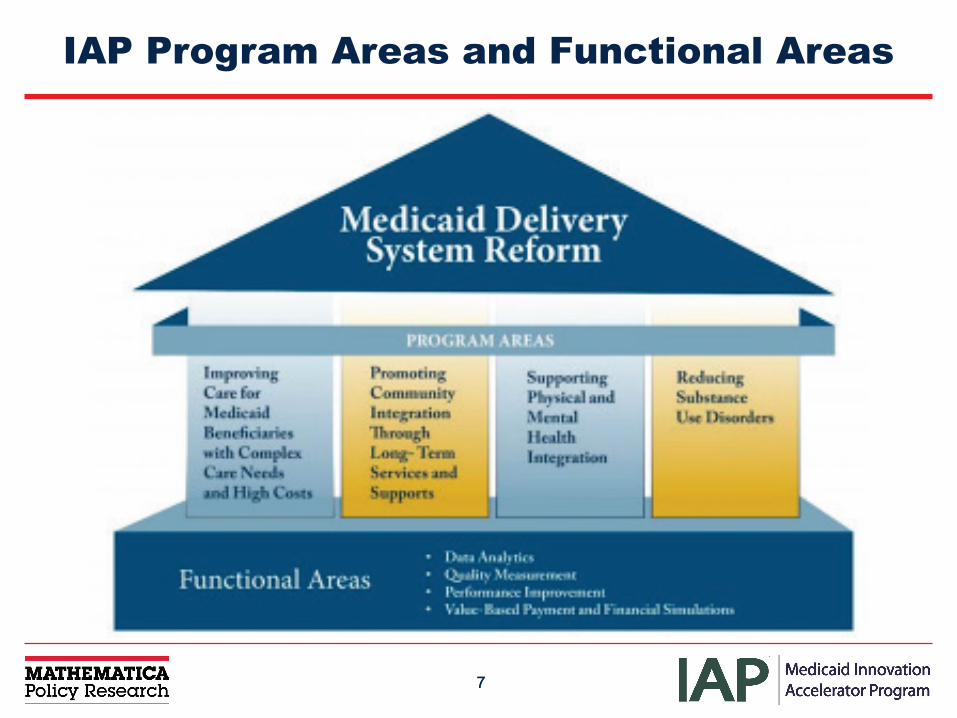
IAP Program Areas and Functional Areas
88
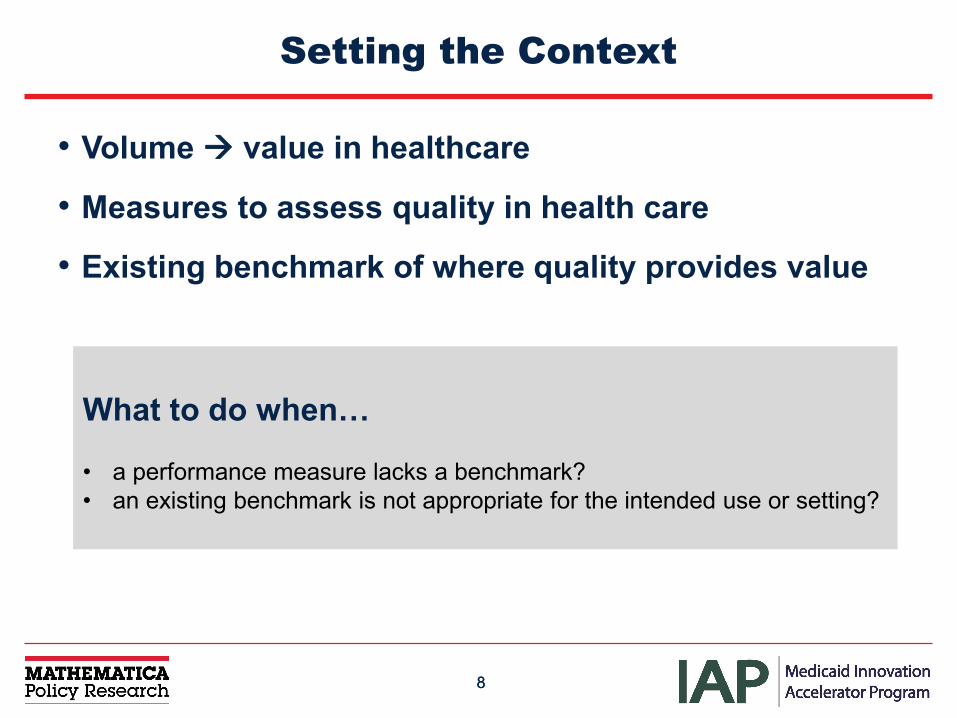
Setting the Context
• Volume value in healthcare
• Measures to assess quality in health care
• Existing benchmark of where quality provides value
What to do when…
• a performance measure lacks a benchmark? • an existing benchmark is not appropriate for the intended use or setting?
99
1010
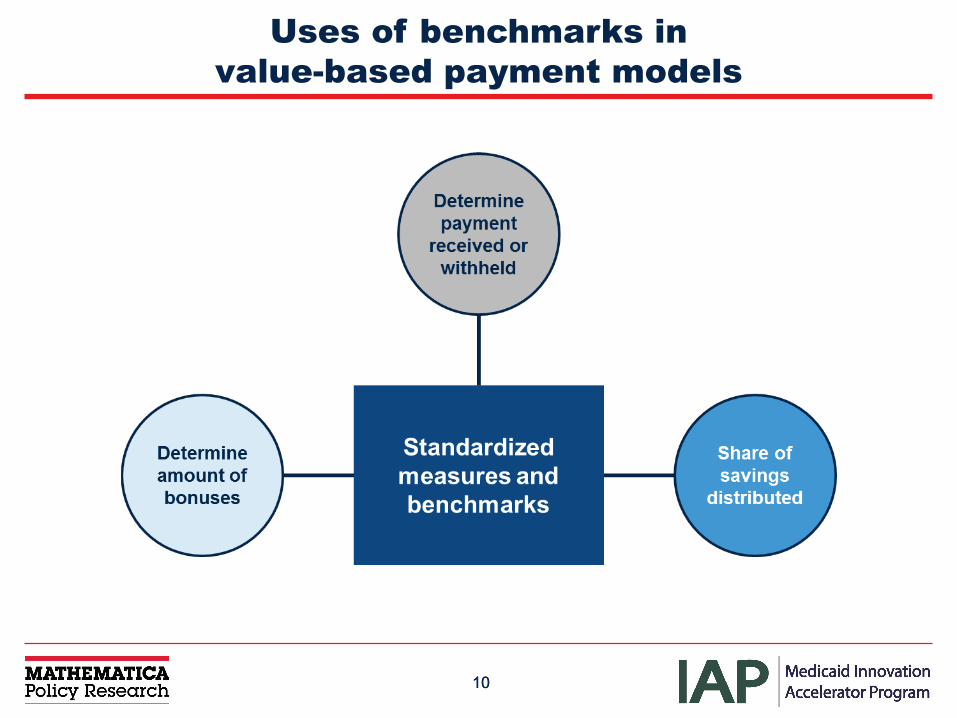
Uses of benchmarks in value-based payment models
1111
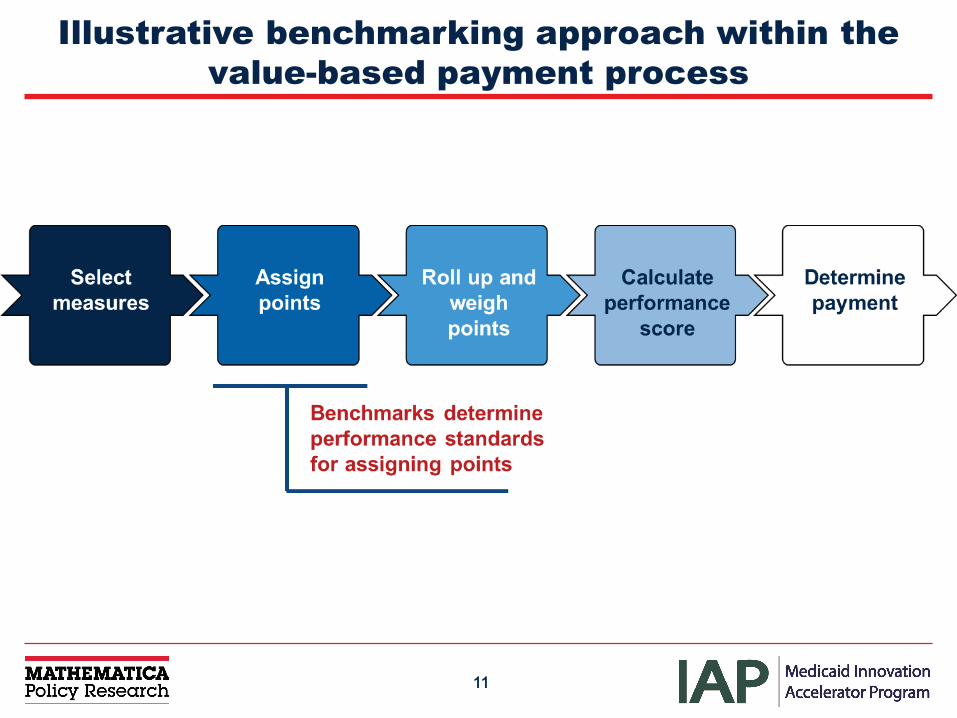
Illustrative benchmarking approach within the value-based payment process
1212
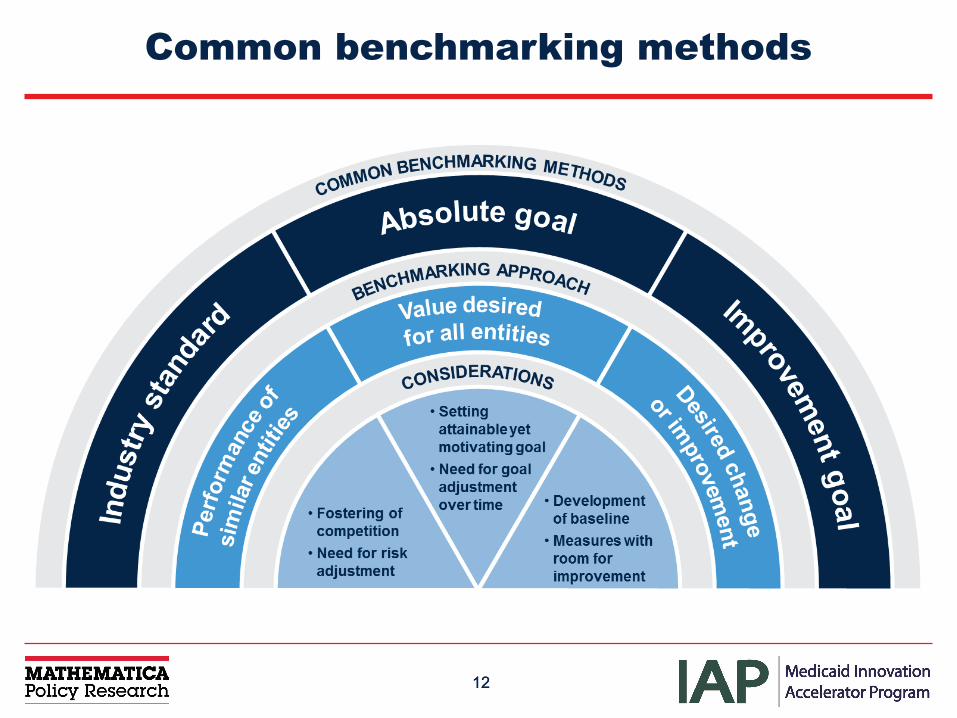
Common benchmarking methods
13
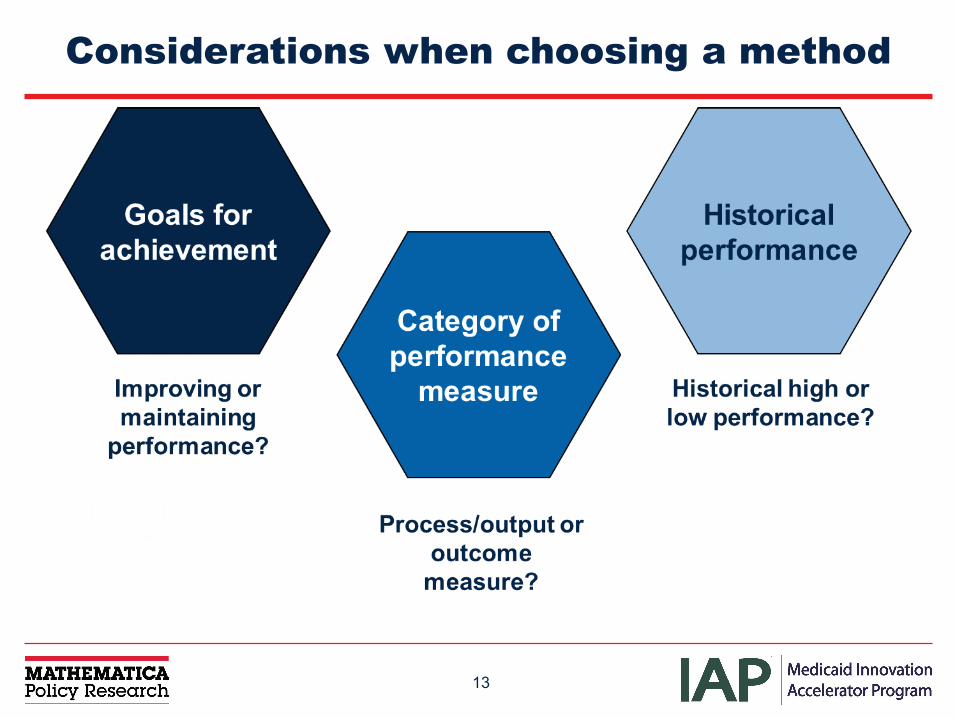
Considerations when choosing a method
1414
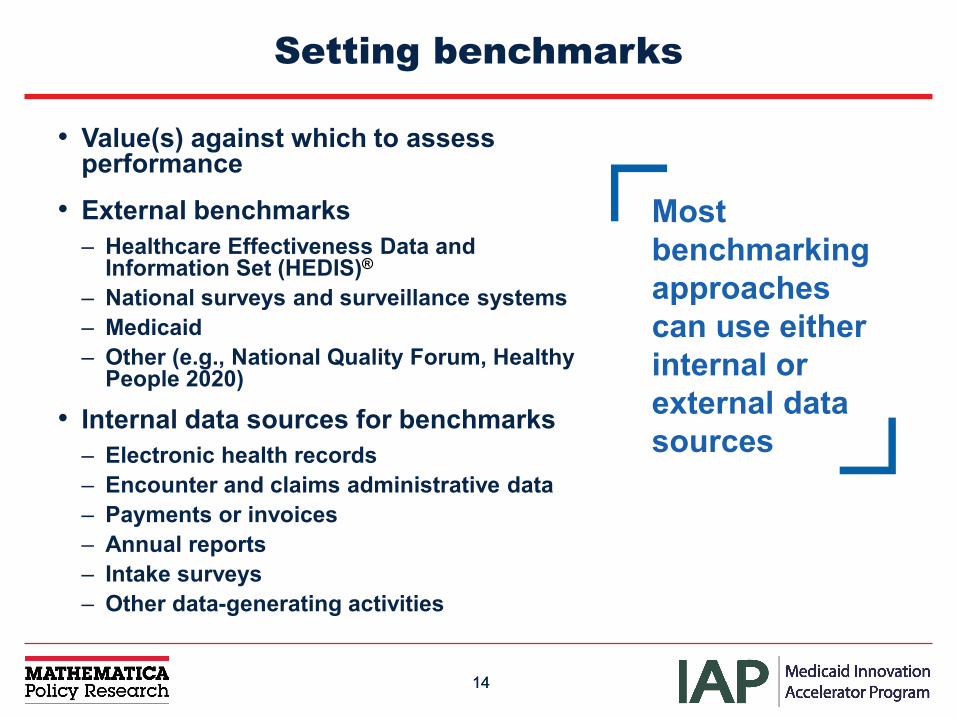
Setting benchmarks
• Value(s) against which to assess performance
• External benchmarks– Healthcare Effectiveness Data and
Information Set (HEDIS)®
– National surveys and surveillance systems– Medicaid– Other (e.g., National Quality Forum, Healthy
People 2020)
• Internal data sources for benchmarks– Electronic health records– Encounter and claims administrative data– Payments or invoices– Annual reports– Intake surveys– Other data-generating activities
Most benchmarking approaches can use either internal or external data sources
1515
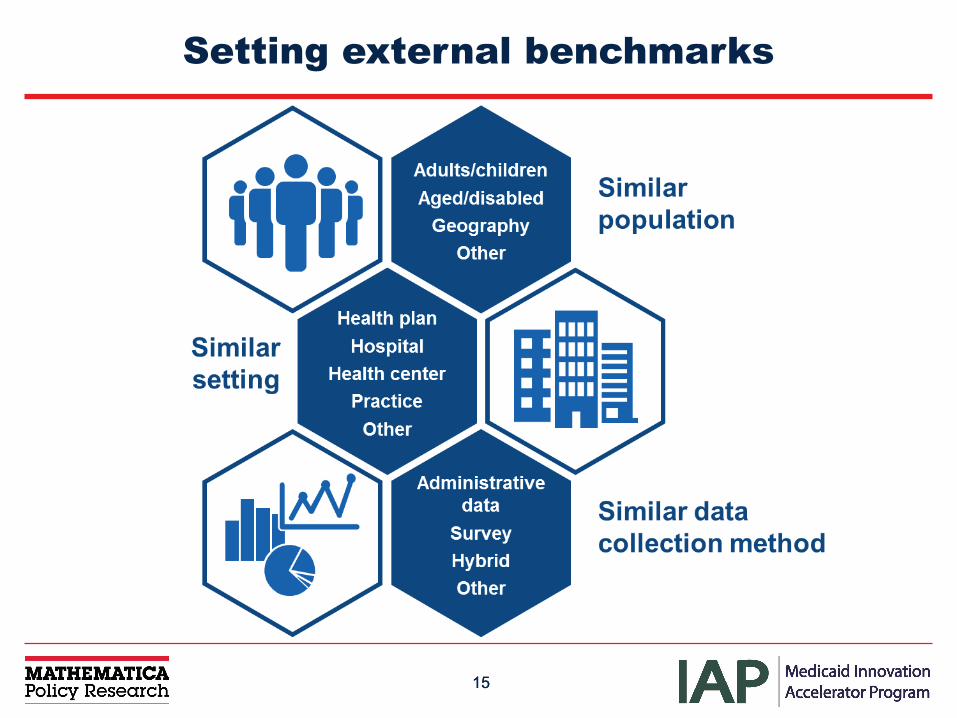
Setting external benchmarks
1616
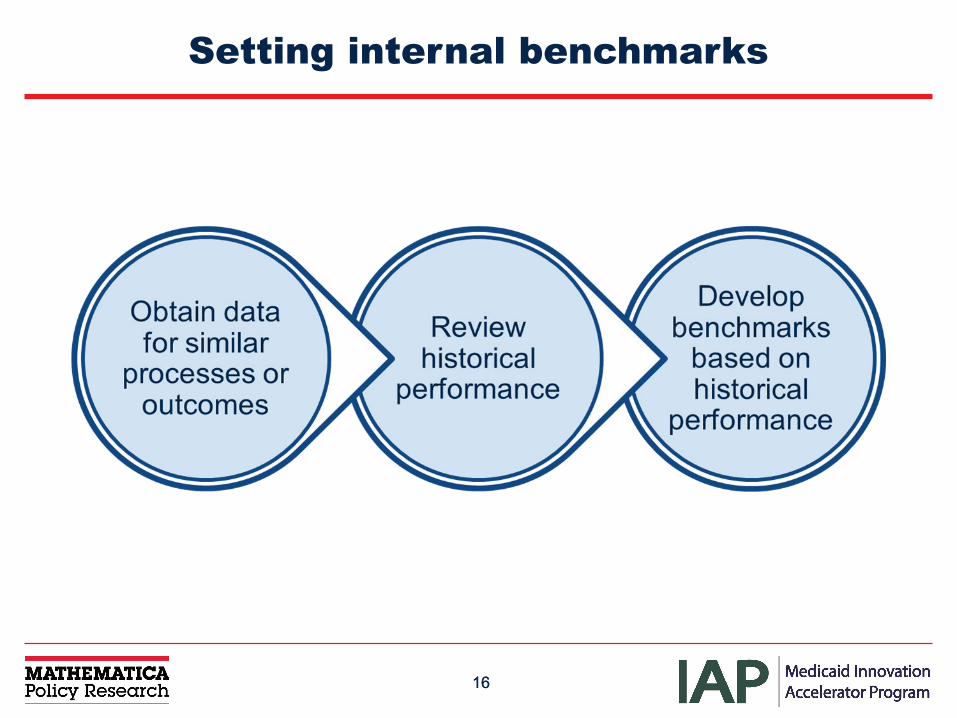
Setting internal benchmarks
1717
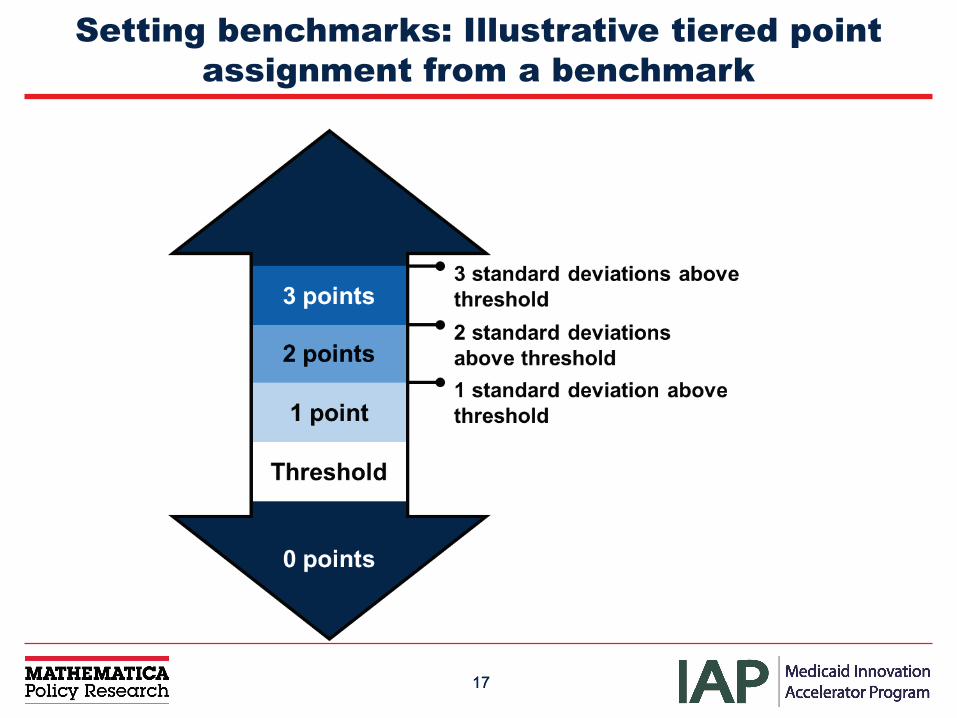
Setting benchmarks: Illustrative tiered point assignment from a benchmark
1818
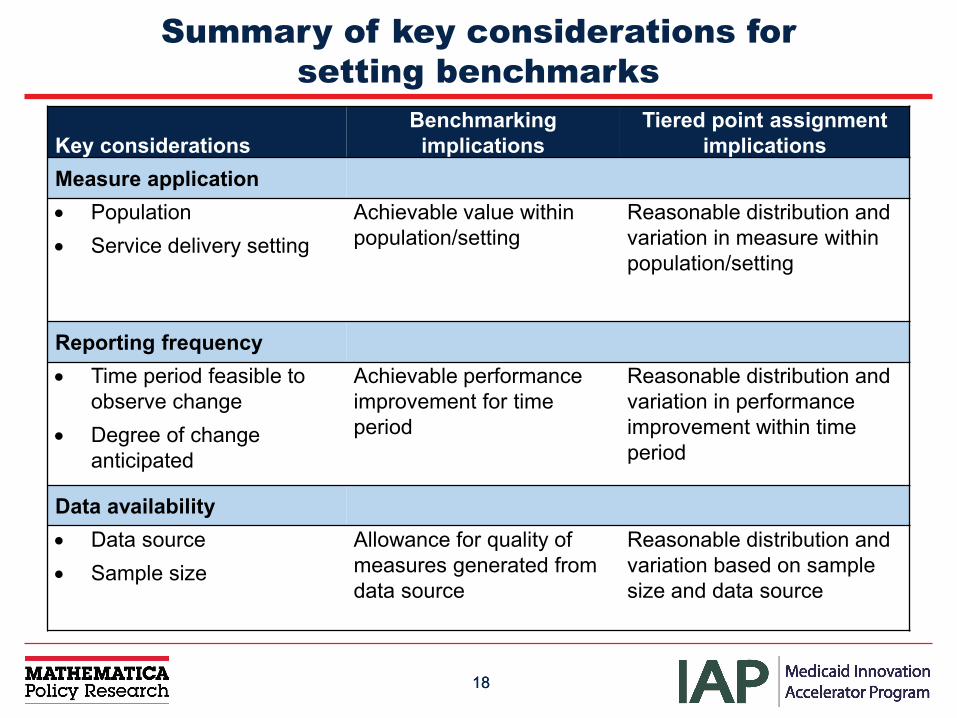
Summary of key considerations for setting benchmarks
Key considerationsBenchmarking implications
Tiered point assignment implications
Measure application• Population• Service delivery setting
Achievable value within population/setting
Reasonable distribution and variation in measure within population/setting
Reporting frequency• Time period feasible to
observe change• Degree of change
anticipated
Achievable performance improvement for time period
Reasonable distribution and variation in performance improvement within time period
Data availability• Data source• Sample size
Allowance for quality ofmeasures generated from data source
Reasonable distribution and variation based on sample size and data source
1919
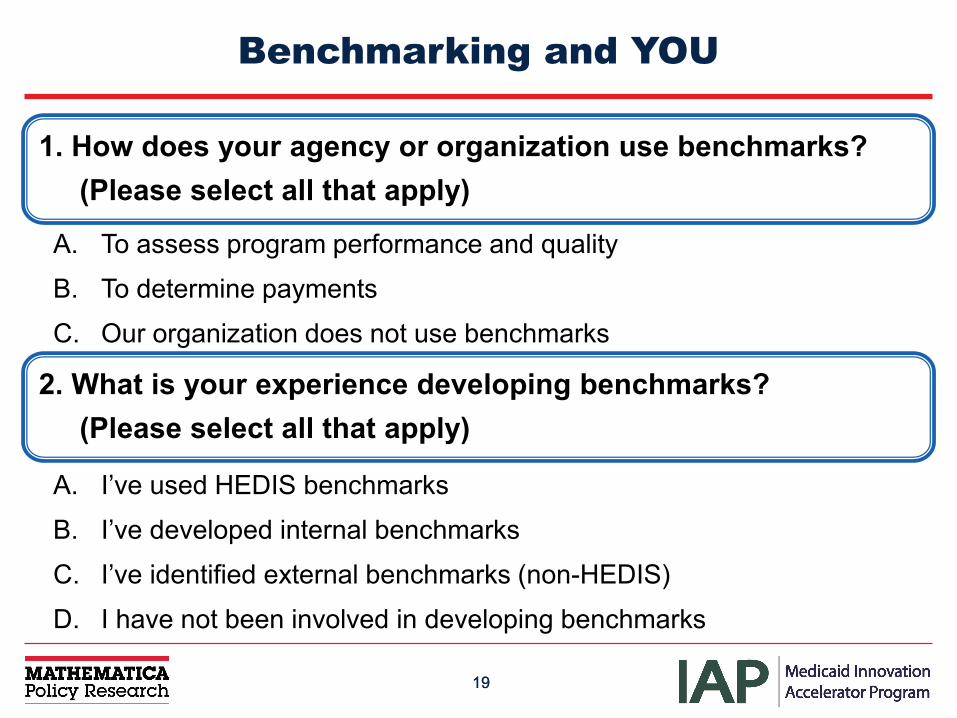
Benchmarking and YOU
1. How does your agency or organization use benchmarks?(Please select all that apply)
A. To assess program performance and quality
B. To determine payments
C. Our organization does not use benchmarks
2. What is your experience developing benchmarks? (Please select all that apply)
A. I’ve used HEDIS benchmarks
B. I’ve developed internal benchmarks
C. I’ve identified external benchmarks (non-HEDIS)
D. I have not been involved in developing benchmarks
2020
Coordinated Care Organization Metrics 101
Jon C. Collins, PhDDirector of Health Analytics
OFFICE OF HEALTH ANALYTICSHealth Policy & Analytics
OFFICE OF HEALTH ANALYICSHealth Policy and Analytics
22
Health System Transformation: Achieving the Triple Aim
Oregon’s Medicaid Program Commitments to CMS• Reduce the annual increase in the cost of care (the cost curve)
by 2 percentage points.
• Ensure that quality of care improves.
• Ensure that population health improves.
• Establish a 1 percent withhold for timely and accurate reporting of data.
• Establish a quality pool.
23
OFFICE OF HEALTH ANALYICSHealth Policy and Analytics
Measurement Strategy
24
OFFICE OF HEALTH ANALYICSHealth Policy and Analytics
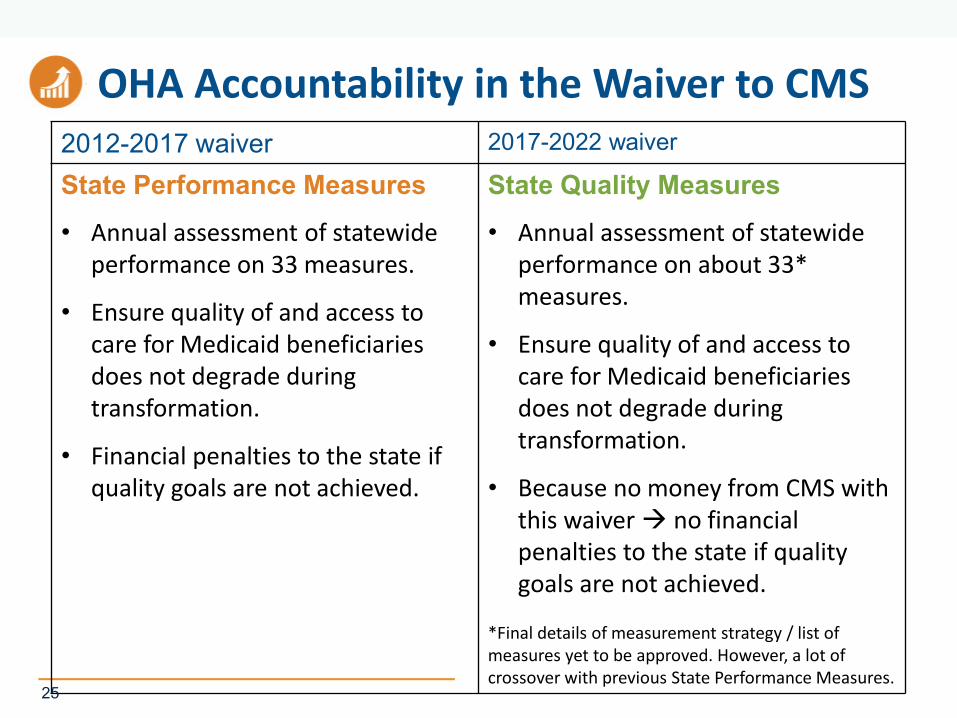
OHA Accountability in the Waiver to CMS2012-2017 waiver 2017-2022 waiver
State Performance Measures
• Annual assessment of statewide performance on 33 measures.
• Ensure quality of and access to care for Medicaid beneficiaries does not degrade during transformation.
• Financial penalties to the state if quality goals are not achieved.
State Quality Measures
• Annual assessment of statewide performance on about 33* measures.
• Ensure quality of and access to care for Medicaid beneficiaries does not degrade during transformation.
• Because no money from CMS with this waiver no financialpenalties to the state if quality goals are not achieved.
*Final details of measurement strategy / list of measures yet to be approved. However, a lot of crossover with previous State Performance Measures.
25
Coordinated Care Organization Accountability to OHA
Coordinated Care Organization (CCO) Incentive Measures
• Annual assessment of CCO performance on selected measures.
• Measures selected by public Metrics & Scoring Committee.
• CCO performance tied to bonus $
• Compare annual performance against prior year (baseline), to see if CCOmet benchmark or demonstrated certain amount of improvement
Measure specifications and guidance documents online at: http://www.oregon.gov/oha/analytics/Pages/CCO-Baseline-Data.aspx
•26
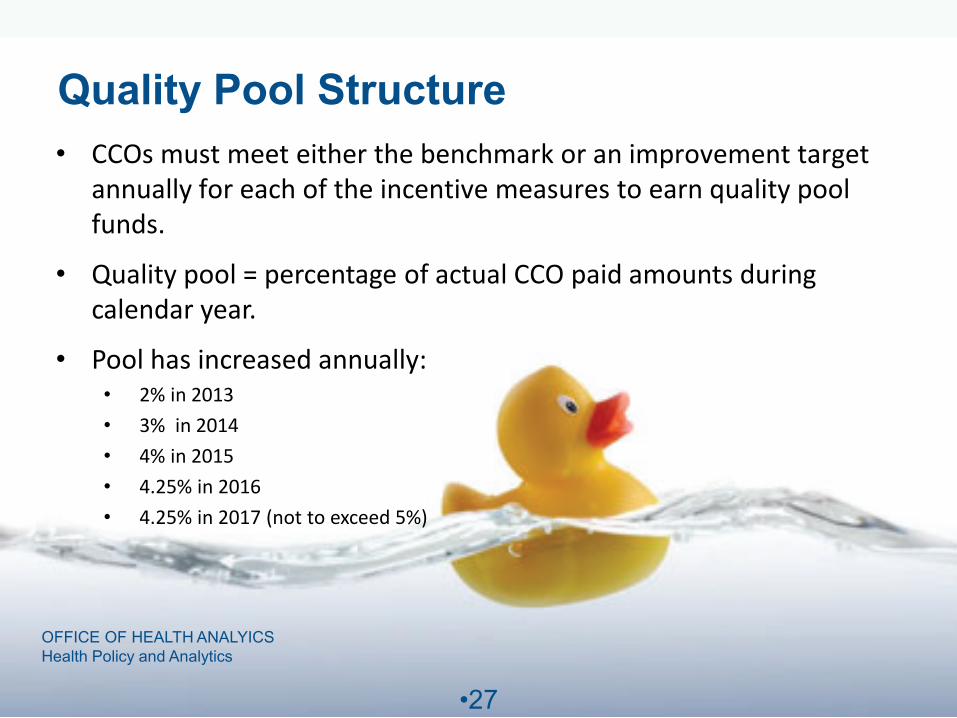
Quality Pool Structure • CCOs must meet either the benchmark or an improvement target
annually for each of the incentive measures to earn quality pool funds.
• Quality pool = percentage of actual CCO paid amounts during calendar year.
• Pool has increased annually:• 2% in 2013• 3% in 2014• 4% in 2015• 4.25% in 2016• 4.25% in 2017 (not to exceed 5%)
OFFICE OF HEALTH ANALYICSHealth Policy and Analytics
•27
Quality Pool Distribution
To earn their full quality pool payment in 2016, CCOs had to:
Meet the benchmark or improvement target on at least 13 of the 18 measures; and
Have at least 60 percent of their members enrolled in a patient-centered primary care home (PCPCH).
Money left over from the quality pool goes to a challenge pool. To earn the challenge pool payments, CCOs had to meet the benchmark or improvement target on the four challenge pool measures.
All money in the pool is distributed every year.
OFFICE OF HEALTH ANALYICSHealth Policy and Analytics
•28
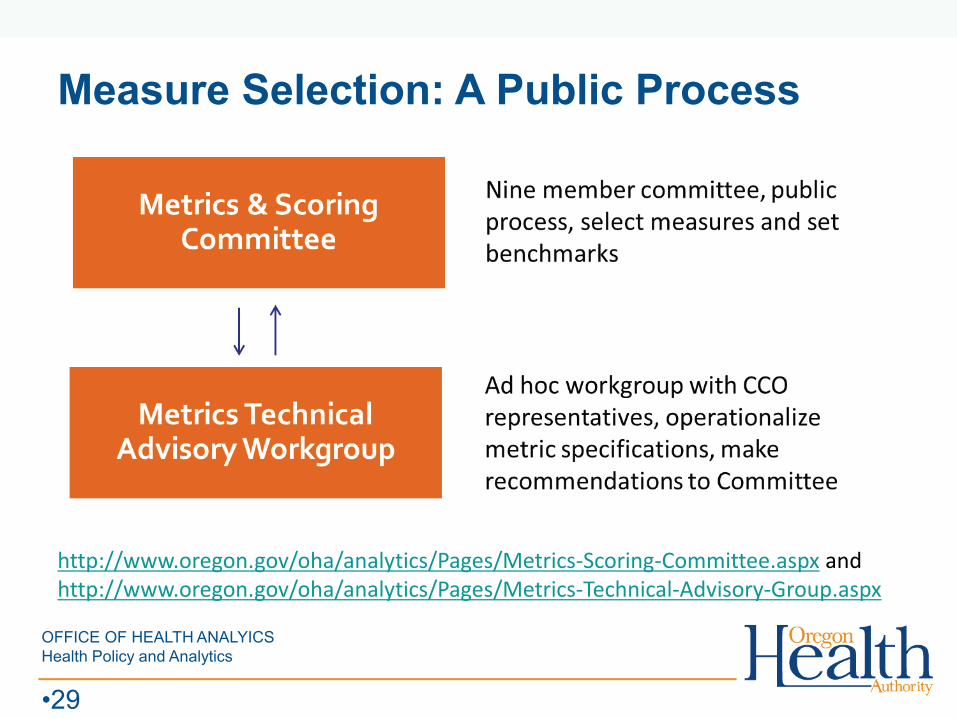
Measure Selection: A Public Process
http://www.oregon.gov/oha/analytics/Pages/Metrics-Scoring-Committee.aspx andhttp://www.oregon.gov/oha/analytics/Pages/Metrics-Technical-Advisory-Group.aspx
OFFICE OF HEALTH ANALYICSHealth Policy and Analytics
•29
Metrics & Scoring Committee
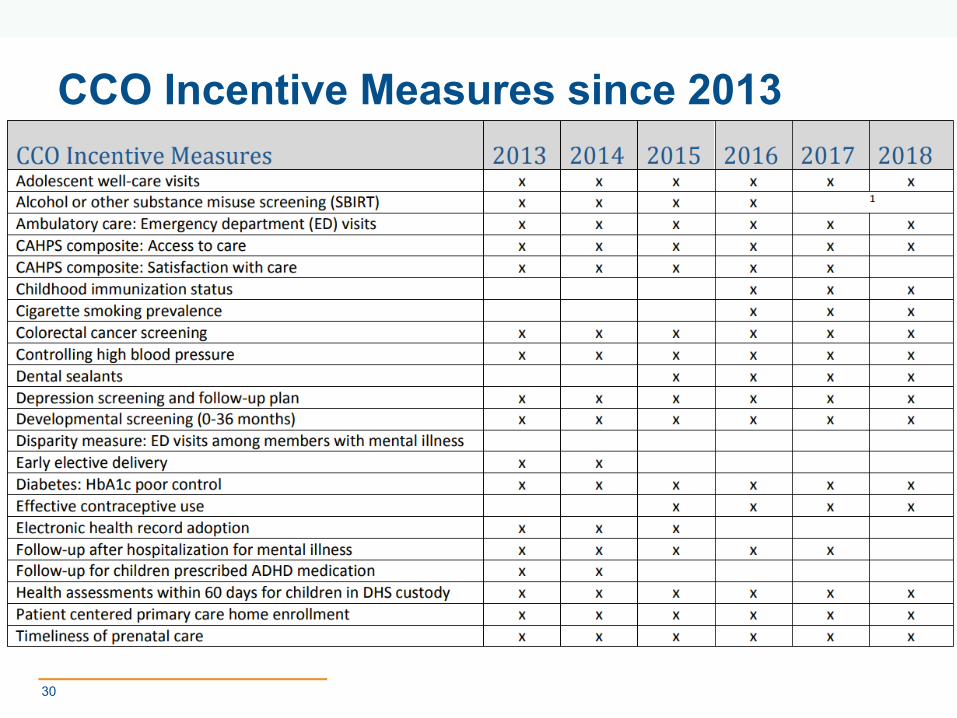
CCO Incentive Measures since 2013
30
Measure Selection in the Future:Senate Bill 440 (2015)• Establishes Health Plan Quality Metrics Committee (HPQMC)
• Requires committee to develop a menu of health outcome and quality measures for CCOs and plans offered by Public Employees' Benefit Board, Oregon Educators Benefit Board, and the Insurance Exchange.
• Any metrics used for these plans must be on the menu developed by the Committee.
• Metrics & Scoring Committee now a subcommittee of the HPQMC.
• Will affect measure selection beginning with 2019 metrics (which are selected during 2018)
31
OFFICE OF HEALTH ANALYICSHealth Policy and Analytics

(Enter) DEPARTMENT (ALL CAPS)(Enter) Division or Office (Mixed Case)
32
Benchmarks and Targets
HEALTH POLICY AND ANALYTICSOffice of Health Analytics
33
Incentive Benchmarks
Incentive measure benchmarks are selected by the Metrics and Scoring Committee
Benchmarks are meant to be aspirational goals and are intentionally selected quite high, e.g. national Medicaid 75th
or 90th percentiles.
When no national percentile is available, other sources are used, e.g. CCO top performers.
Improvement Targets
CCOs are not expected to meet the benchmark each year but rather to make improvement toward the benchmark.
To demonstrate this, CCOs can earn quality pool payment by
• achieving the benchmark or
• achieving their individual improvement target
Improvement targets require at least a 10 percent reduction in the gap between the CCO's prior year's performance ("baseline") and the benchmark to qualify for incentive payments.
HEALTH POLICY AND ANALYTICSOffice of Health Analytics
34
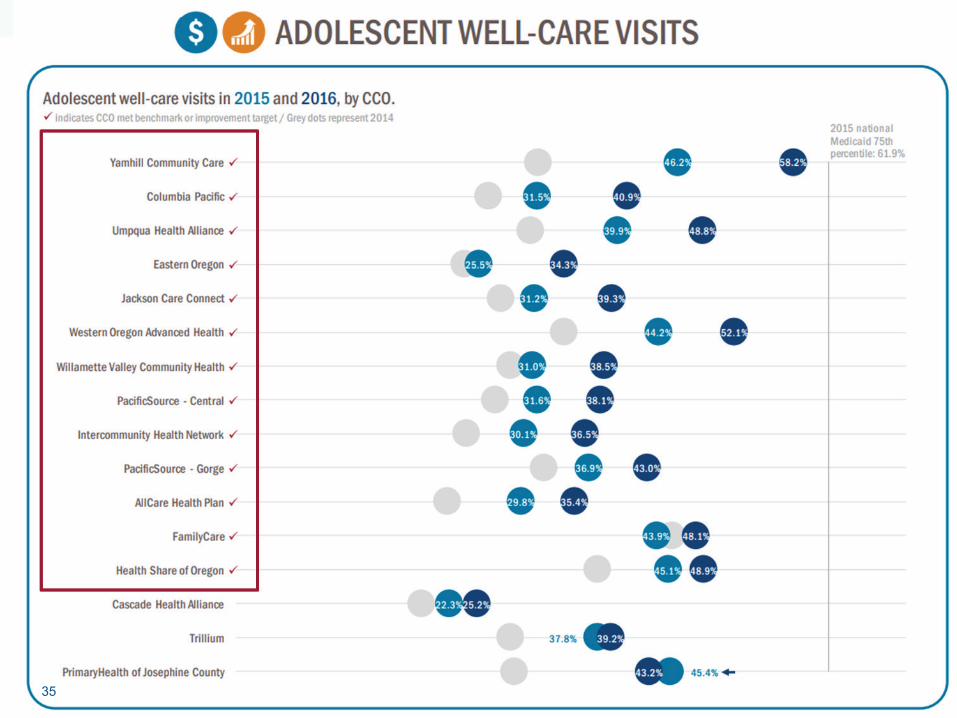
35
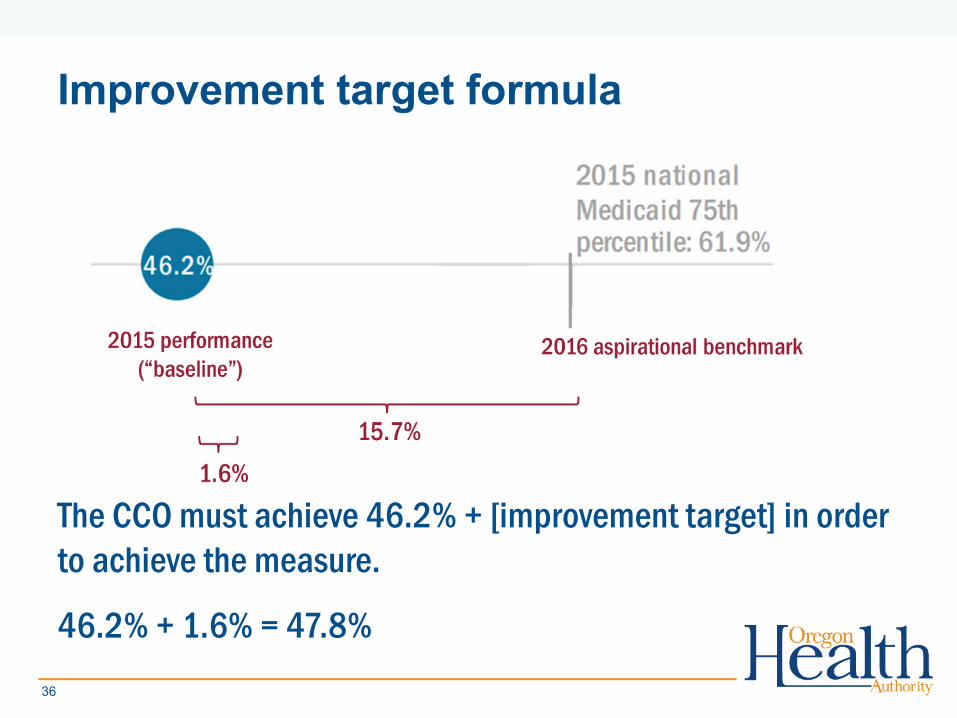
The CCO must achieve 46.2% + [improvement target] in order to achieve the measure.
46.2% + 1.6% = 47.8%
Improvement target formula
36
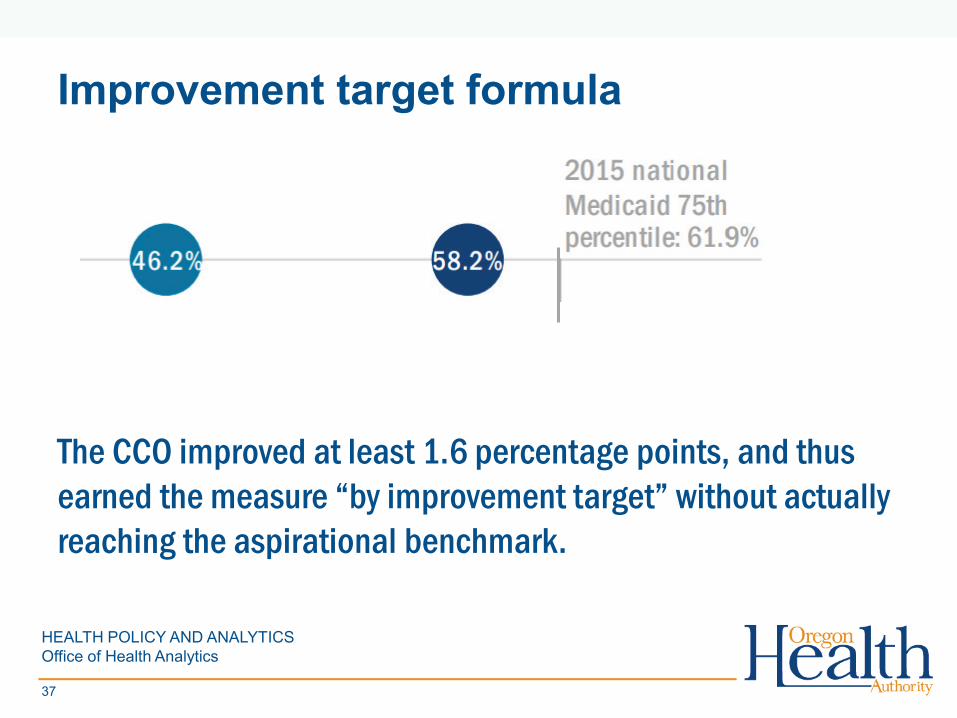
Improvement target formula
The CCO improved at least 1.6 percentage points, and thus earned the measure “by improvement target” without actually reaching the aspirational benchmark.
HEALTH POLICY AND ANALYTICSOffice of Health Analytics
37
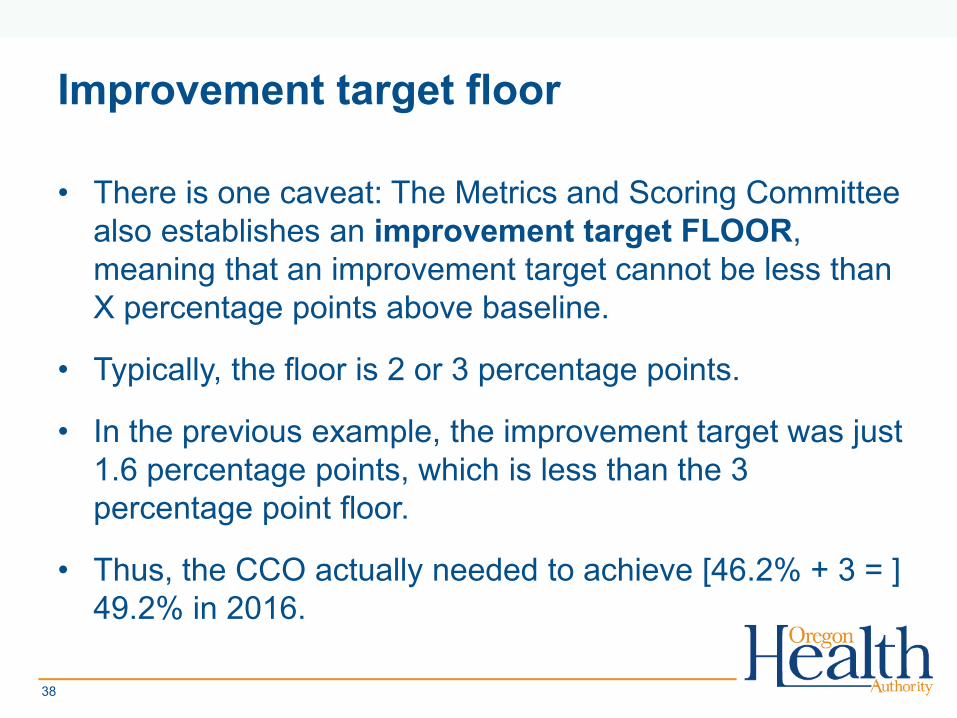
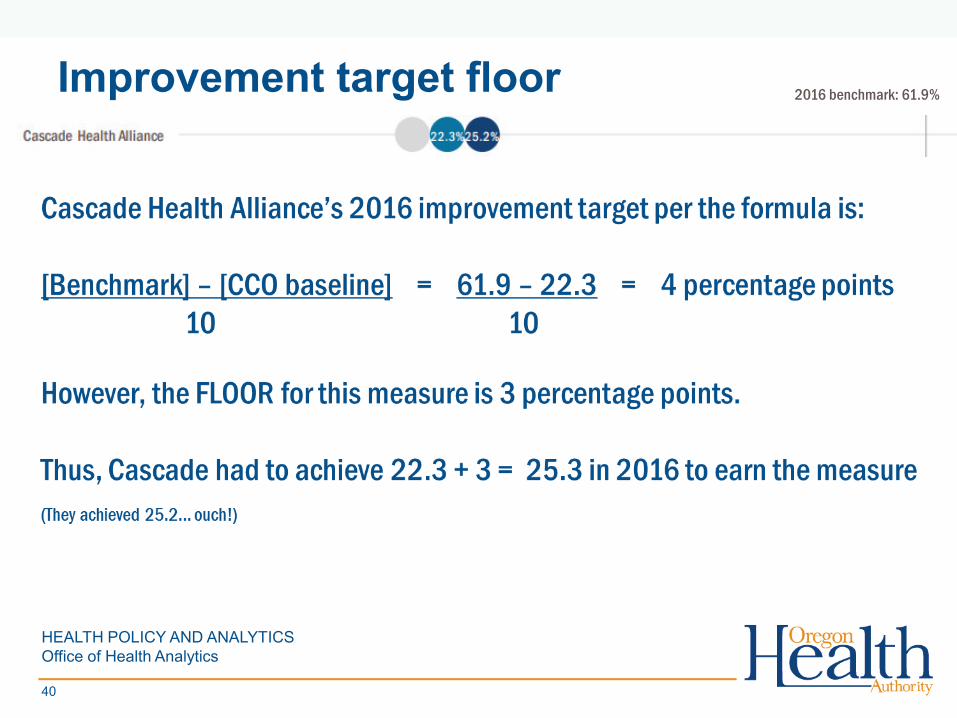
Improvement target floor
• There is one caveat: The Metrics and Scoring Committee also establishes an improvement target FLOOR, meaning that an improvement target cannot be less than X percentage points above baseline.
• Typically, the floor is 2 or 3 percentage points.
• In the previous example, the improvement target was just 1.6 percentage points, which is less than the 3 percentage point floor.
• Thus, the CCO actually needed to achieve [46.2% + 3 = ] 49.2% in 2016.
38
(Enter) DEPARTMENT (ALL CAPS)(Enter) Division or Office (Mixed Case)
39
40
Improvement target floor 2016 benchmark: 61.9%
HEALTH POLICY AND ANALYTICSOffice of Health Analytics
Questions?
Jon C. Collins, PhDDirector of Health [email protected]
41
OFFICE OF HEALTH ANALYICSHealth Policy and Analytics
4242
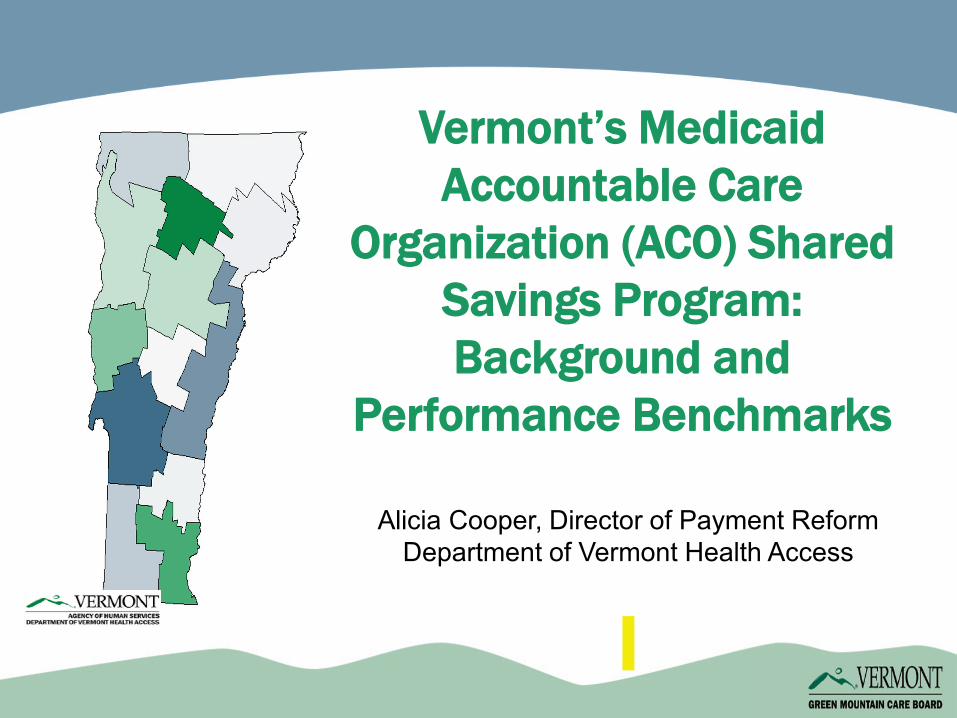
Vermont’s Medicaid Accountable Care
Organization (ACO) Shared Savings Program: Background and
Performance Benchmarks
Alicia Cooper, Director of Payment Reform Department of Vermont Health Access
Vermont ACO Shared Savings Program Background
44
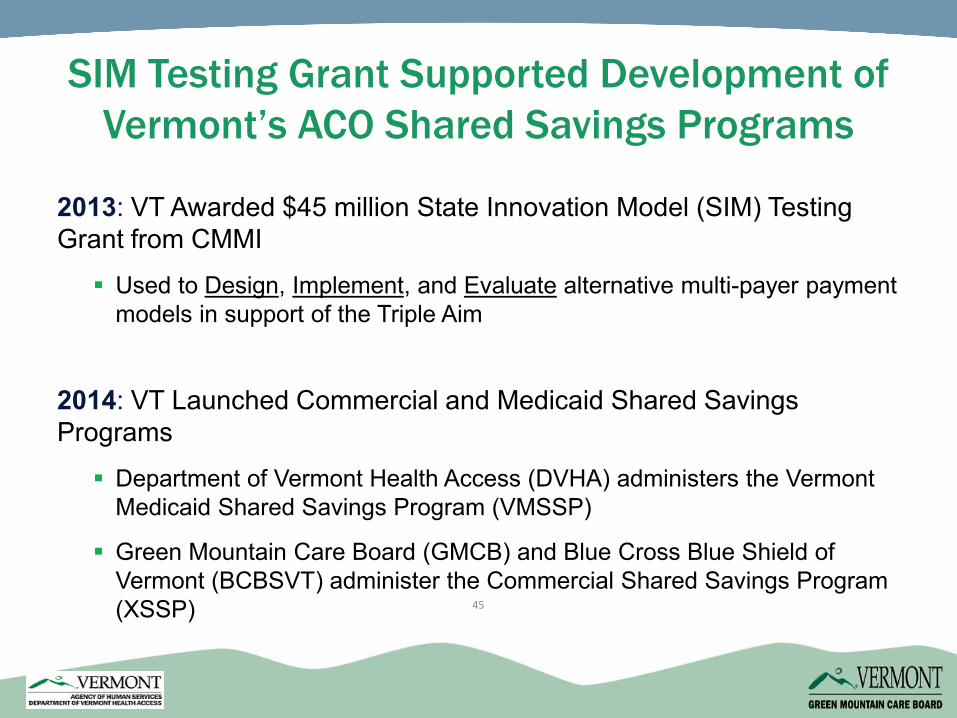
SIM Testing Grant Supported Development of Vermont’s ACO Shared Savings Programs
2013: VT Awarded $45 million State Innovation Model (SIM) Testing Grant from CMMI
Used to Design, Implement, and Evaluate alternative multi-payer payment models in support of the Triple Aim
2014: VT Launched Commercial and Medicaid Shared Savings Programs
Department of Vermont Health Access (DVHA) administers the Vermont Medicaid Shared Savings Program (VMSSP)
Green Mountain Care Board (GMCB) and Blue Cross Blue Shield of Vermont (BCBSVT) administer the Commercial Shared Savings Program (XSSP) 45
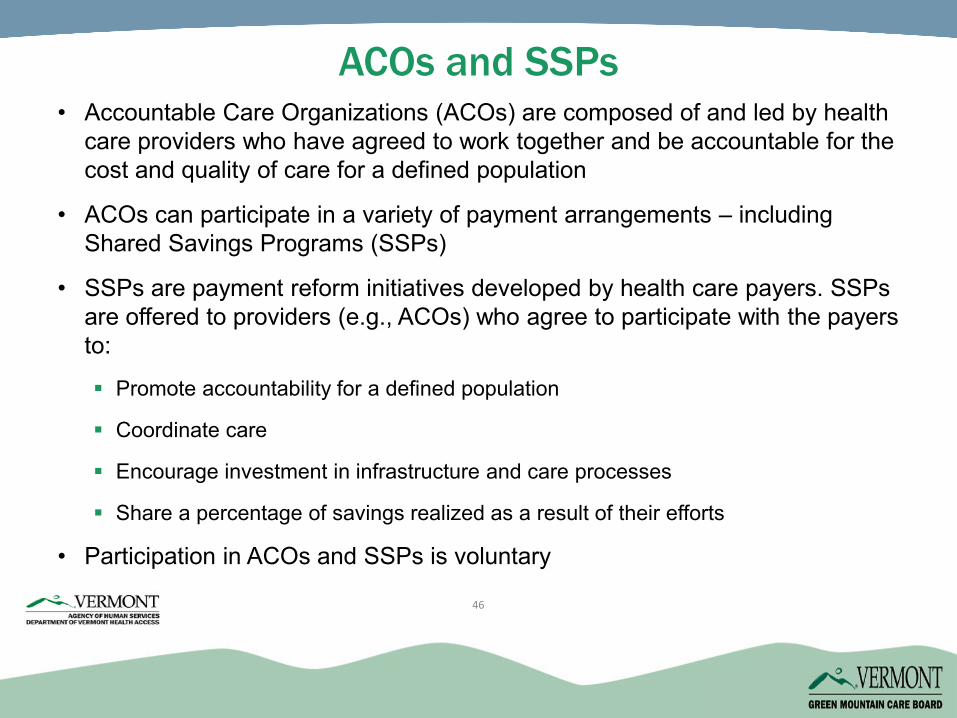
ACOs and SSPs• Accountable Care Organizations (ACOs) are composed of and led by health
care providers who have agreed to work together and be accountable for the cost and quality of care for a defined population
• ACOs can participate in a variety of payment arrangements – including Shared Savings Programs (SSPs)
• SSPs are payment reform initiatives developed by health care payers. SSPs are offered to providers (e.g., ACOs) who agree to participate with the payers to:
Promote accountability for a defined population
Coordinate care
Encourage investment in infrastructure and care processes
Share a percentage of savings realized as a result of their efforts
• Participation in ACOs and SSPs is voluntary
46
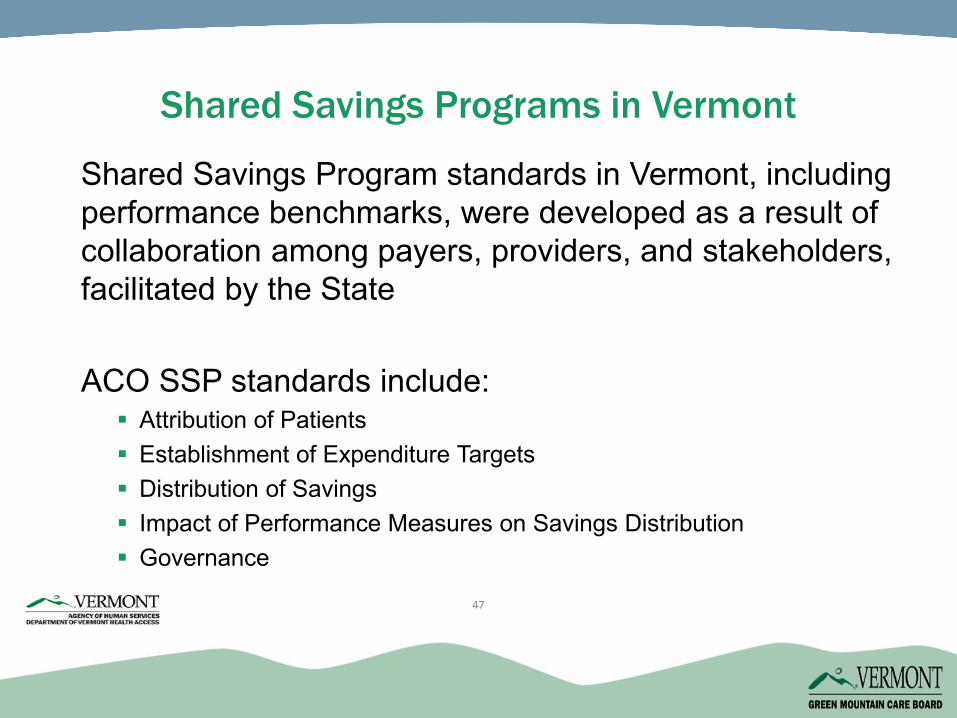
Shared Savings Programs in Vermont
Shared Savings Program standards in Vermont, including performance benchmarks, were developed as a result of collaboration among payers, providers, and stakeholders, facilitated by the State
ACO SSP standards include: Attribution of Patients Establishment of Expenditure Targets Distribution of Savings Impact of Performance Measures on Savings Distribution Governance
47
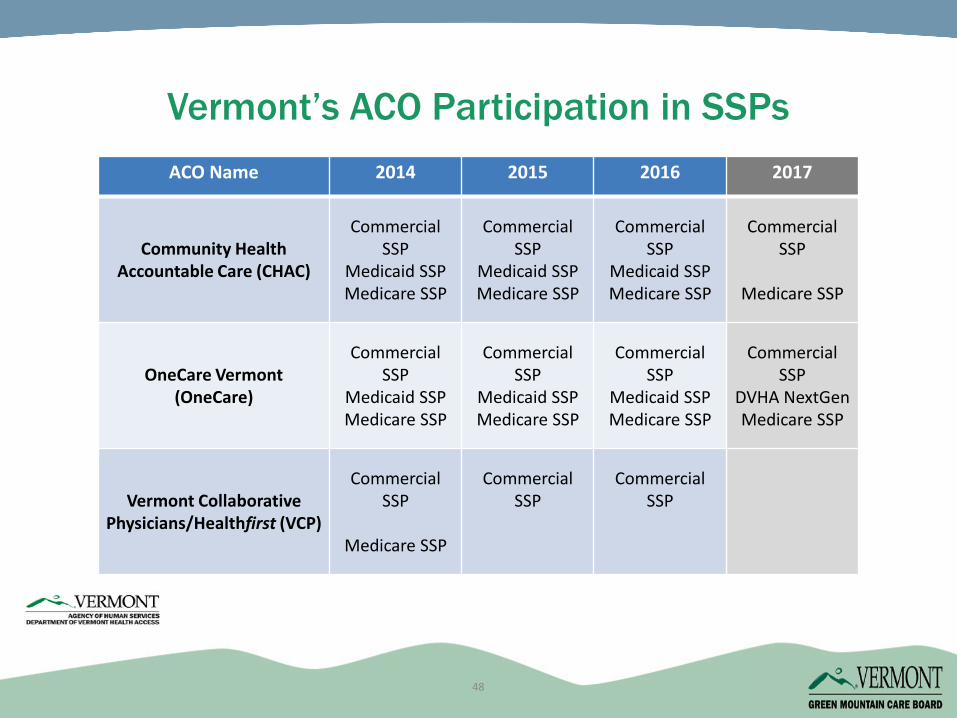
Vermont’s ACO Participation in SSPsACO Name 2014 2015 2016 2017
Community Health Accountable Care (CHAC)
Commercial SSP
Medicaid SSPMedicare SSP
Commercial SSP
Medicaid SSPMedicare SSP
Commercial SSP
Medicaid SSPMedicare SSP
Commercial SSP
Medicare SSP
OneCare Vermont(OneCare)
Commercial SSP
Medicaid SSPMedicare SSP
Commercial SSP
Medicaid SSPMedicare SSP
Commercial SSP
Medicaid SSPMedicare SSP
Commercial SSP
DVHA NextGenMedicare SSP
Vermont Collaborative Physicians/Healthfirst (VCP)
Commercial SSP
Medicare SSP
Commercial SSP
Commercial SSP
48
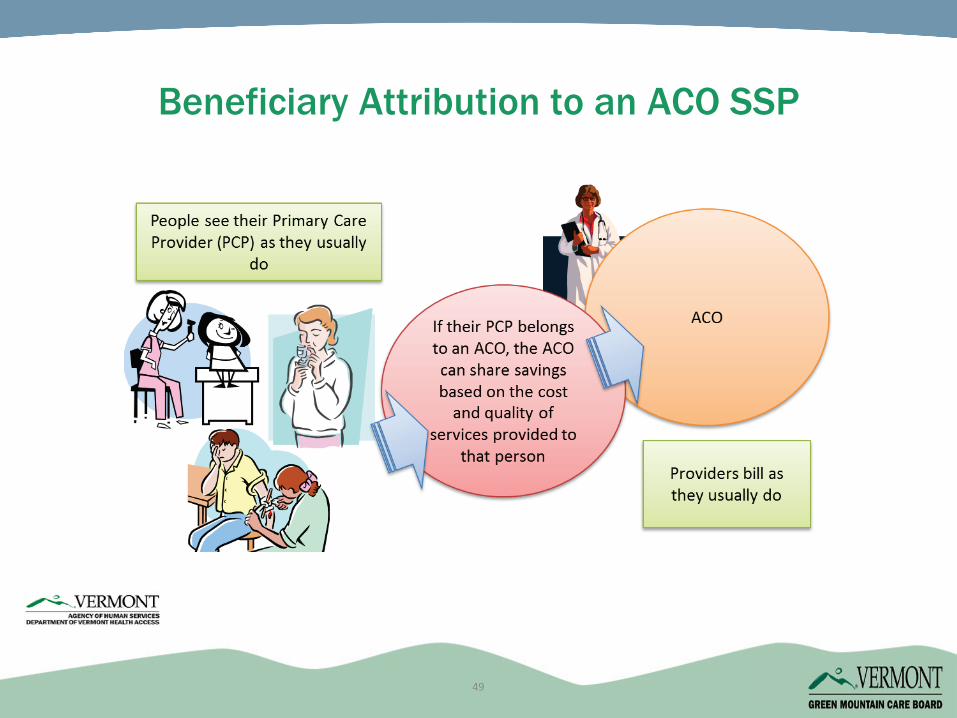
Beneficiary Attribution to an ACO SSP
49
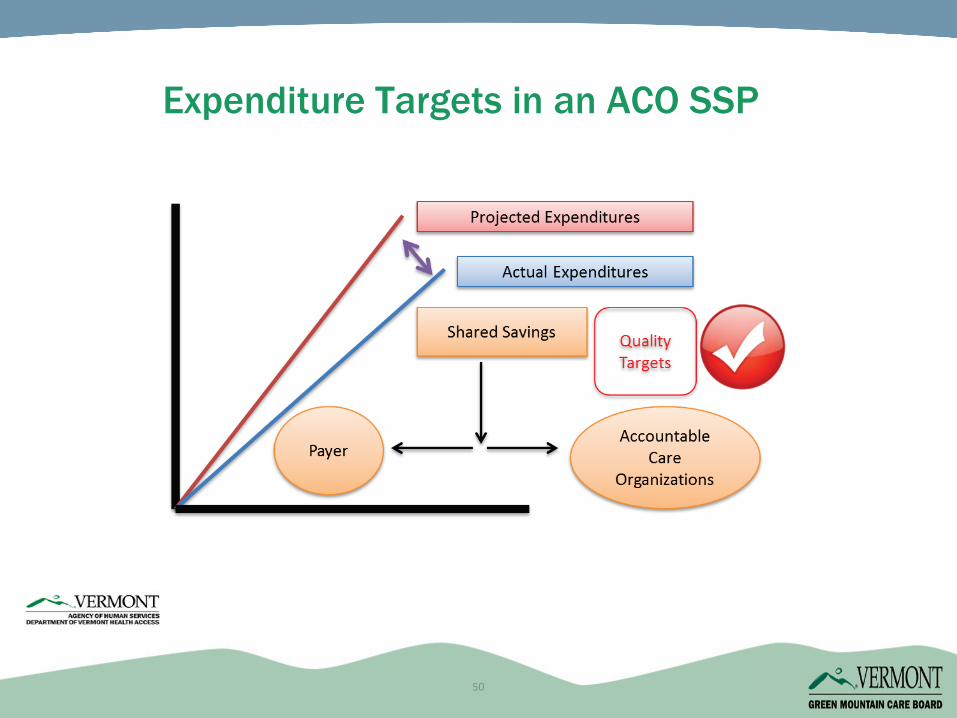
Expenditure Targets in an ACO SSP
50
Multi-Stakeholder Process to Establish Quality Measures and Benchmarks
51
Nearly 30 members from a wide variety of organizations, plus many additional participants, including representatives from:
Vermont’s three ACOs
State agencies and programs
Provider organizations
Commercial insurers
Consumer organizations
Other organizations (e.g., Vermont Information Technology Leaders, Vermont Program for Quality in Health Care)
52
Convening Stakeholders:Quality Measures Work Group Members
52
To identify standardized measures that could be used to:Evaluate the performance of Vermont’s ACOsrelative to state objectives
Qualify and modify shared savings payments
Guide improvements in health care delivery
Work Group Objectives
53
Over the course of nine months (January 2013-October 2013), the ACO Measures Work Group met about every two weeks.
Two sub-groups also held several meetings: Patient Experience of Care Survey Sub-group
End-of-Life Care Measures Sub-group
Created “crosswalk” of more than 200 measures from numerous national, state (including Vermont), health plan and other measure sets
Measure Selection Process for Year 1 (2014)
54
Using an intensive process, Work Group participants:Identified their priority measures for considerationDeveloped consensus criteria for measure evaluationEliminated measures through application of criteria and extensive discussion Expressed support for and concerns about measures Focused on measures of various types, in various domains, with national specifications, with benchmarks, and with opportunities for improvementCompromised!Identified 31 measures for Commercial SSP and 32 measures for Medicaid SSP; further identified as Payment or ReportingExpressed widespread support, but not unanimity
55
Measure Selection Process for Year 1 (cont’d)
55
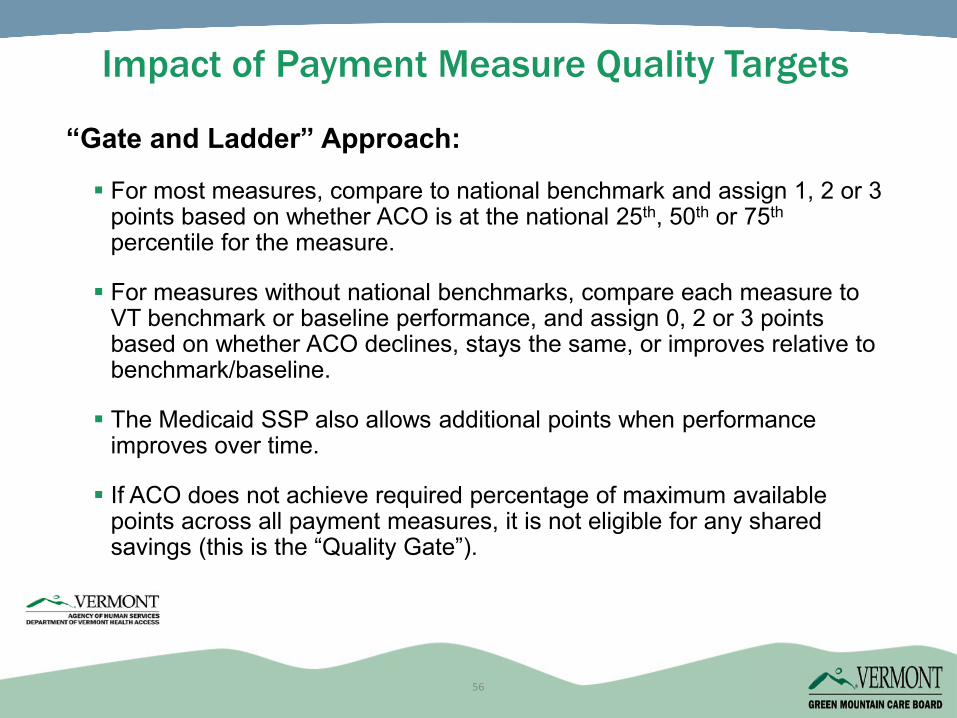
“Gate and Ladder” Approach:
For most measures, compare to national benchmark and assign 1, 2 or 3 points based on whether ACO is at the national 25th, 50th or 75th
percentile for the measure.
For measures without national benchmarks, compare each measure to VT benchmark or baseline performance, and assign 0, 2 or 3 points based on whether ACO declines, stays the same, or improves relative to benchmark/baseline.
The Medicaid SSP also allows additional points when performance improves over time.
If ACO does not achieve required percentage of maximum available points across all payment measures, it is not eligible for any shared savings (this is the “Quality Gate”).
Impact of Payment Measure Quality Targets
56
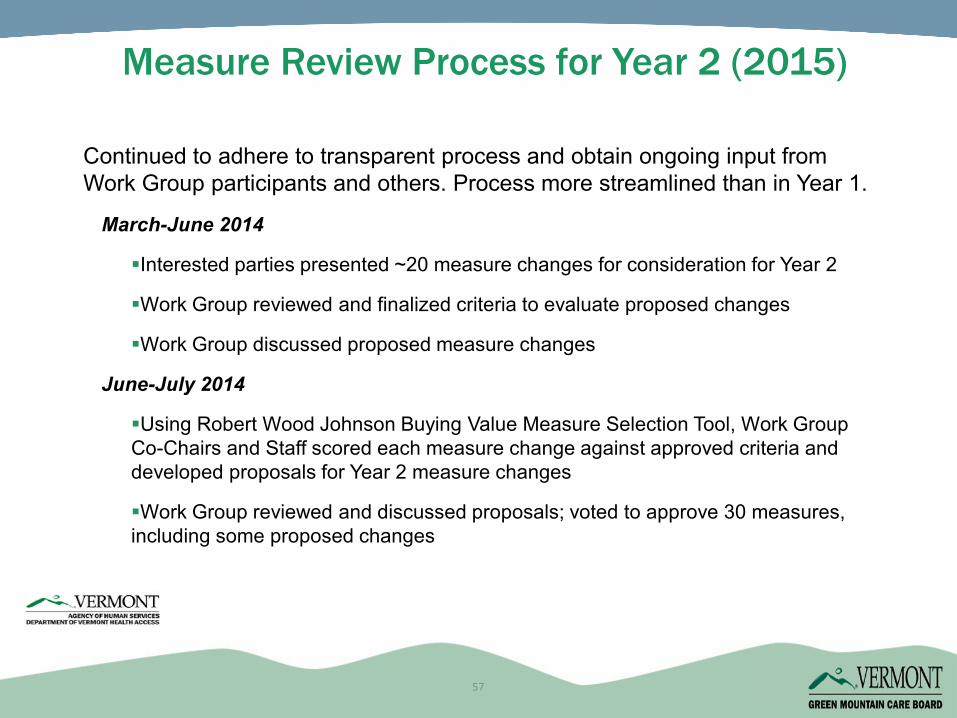
Continued to adhere to transparent process and obtain ongoing input from Work Group participants and others. Process more streamlined than in Year 1.
March-June 2014
Interested parties presented ~20 measure changes for consideration for Year 2
Work Group reviewed and finalized criteria to evaluate proposed changes
Work Group discussed proposed measure changes
June-July 2014
Using Robert Wood Johnson Buying Value Measure Selection Tool, Work Group Co-Chairs and Staff scored each measure change against approved criteria and developed proposals for Year 2 measure changes
Work Group reviewed and discussed proposals; voted to approve 30 measures, including some proposed changes
Measure Review Process for Year 2 (2015)
57
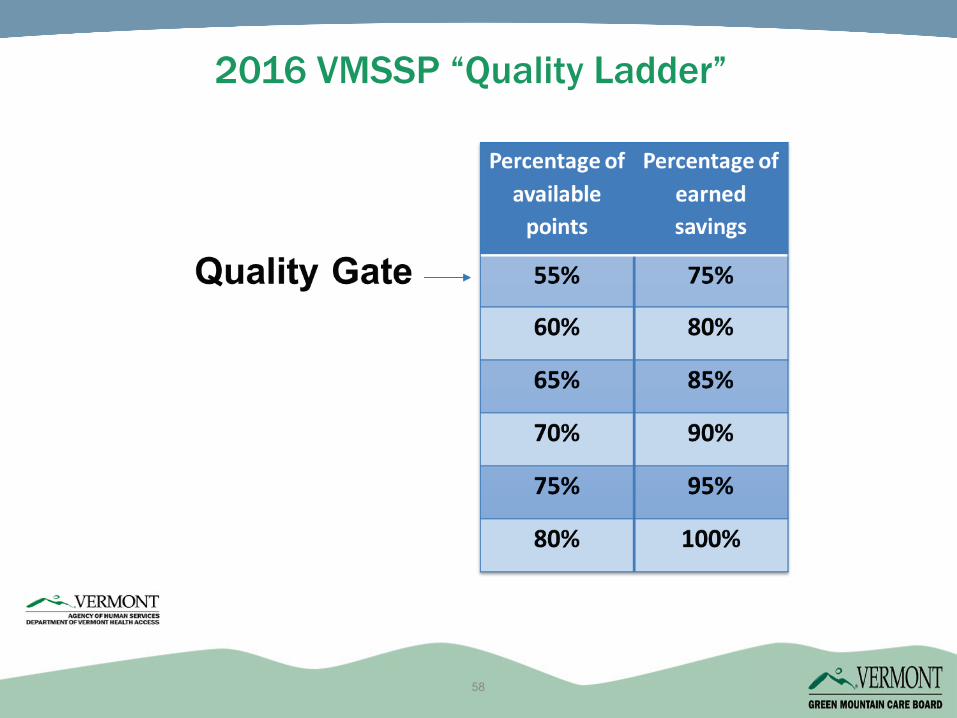
2016 VMSSP “Quality Ladder”
58
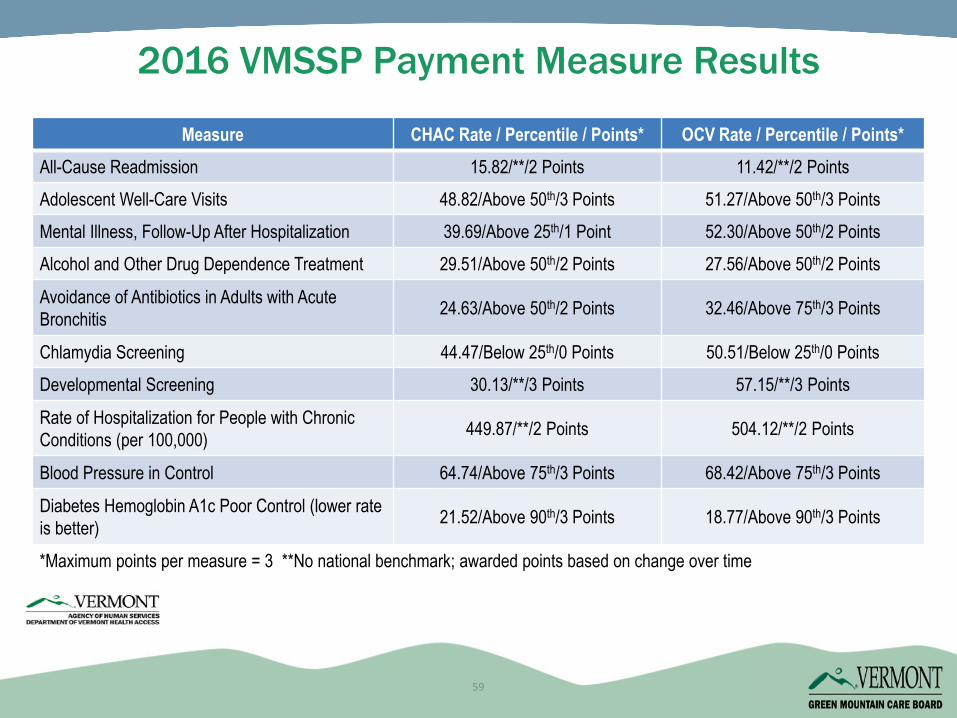
2016 VMSSP Payment Measure Results
*Maximum points per measure = 3 **No national benchmark; awarded points based on change over time
Measure CHAC Rate / Percentile / Points* OCV Rate / Percentile / Points*All-Cause Readmission 15.82/**/2 Points 11.42/**/2 PointsAdolescent Well-Care Visits 48.82/Above 50th/3 Points 51.27/Above 50th/3 PointsMental Illness, Follow-Up After Hospitalization 39.69/Above 25th/1 Point 52.30/Above 50th/2 PointsAlcohol and Other Drug Dependence Treatment 29.51/Above 50th/2 Points 27.56/Above 50th/2 Points
Avoidance of Antibiotics in Adults with Acute Bronchitis 24.63/Above 50th/2 Points 32.46/Above 75th/3 Points
Chlamydia Screening 44.47/Below 25th/0 Points 50.51/Below 25th/0 PointsDevelopmental Screening 30.13/**/3 Points 57.15/**/3 Points
Rate of Hospitalization for People with Chronic Conditions (per 100,000) 449.87/**/2 Points 504.12/**/2 Points
Blood Pressure in Control 64.74/Above 75th/3 Points 68.42/Above 75th/3 Points
Diabetes Hemoglobin A1c Poor Control (lower rate is better) 21.52/Above 90th/3 Points 18.77/Above 90th/3 Points
59
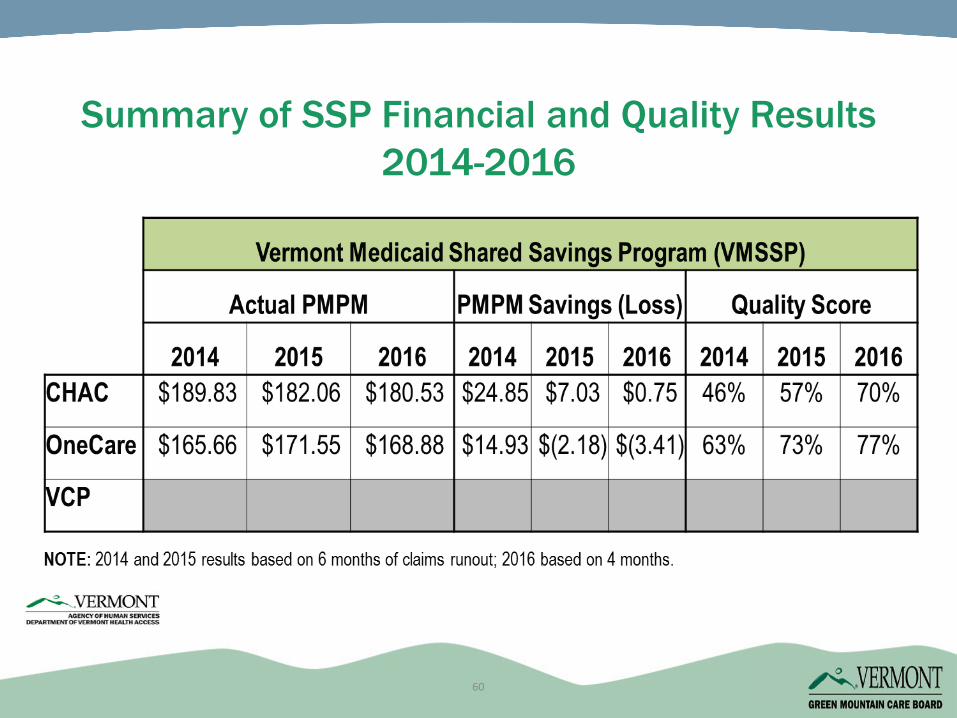
Summary of SSP Financial and Quality Results 2014-2016
60
Additional monitoring measures related to utilization and cost can help identify unintended consequences
Review of trends over time and among ACOs can highlight variation (e.g., “Data Summit” for ACOs, payers and QI leaders)
Annual measure review ensures that specifications are current and evidence changes are addressed (e.g., LDL screening, mammography)
Ongoing stakeholder feedback (e.g., from providers) can identify issues that arise at the working surface
Ongoing Assessment of Measure Impact
61
Pat JonesHealth Care Project DirectorGreen Mountain Care Board
Alicia CooperDirector of Payment Reform
Department of Vermont Health [email protected]
Thank You
62
6363
6464
Key Takeaways
• Carefully consider stakeholders for inclusion in developing and setting benchmarks
• Choose the method for benchmarking that suits the context and goals for measurement
• Set benchmarks to motivate, not demoralize
• Allow opportunities for adjustment to benchmarks over time
6565
Additional Resources
• Webinar Slides and accompanying issue brief
https://www.medicaid.gov/state-resource-center/innovation-accelerator-program/iap-functional-areas/index.html


![arXiv:2005.12873v3 [cs.DC] 7 Jun 2020processing benchmarks [12]. They studied about distributed and parallel benchmarks for graph analyzers, graph database benchmarks, benchmarks for](https://img.pdfslide.net/doc/110x75/60c4e778df2cd14e603091d9/arxiv200512873v3-csdc-7-jun-2020-processing-benchmarks-12-they-studied-about.jpg)


![Benchmarks - June, 2013 | Benchmarks Onlineit.unt.edu/sites/default/files/benchmarks-06-2013.pdf · Benchmarks - June, 2013 | Benchmarks Online 4/26/16, 8:52:25 AM] Skip to content](https://img.pdfslide.net/doc/110x75/5f9d6dd4a6e586755376b37d/benchmarks-june-2013-benchmarks-benchmarks-june-2013-benchmarks-online.jpg)