Embed Size (px)
Citation preview
Technische Universität München
Department für Biowissenschaftliche Grundlagen
Development and application of trace analysis foremerging organic pollutants in surface water
Dominik Deyerling
Vollständiger Abdruck der von der Fakultät Wissenschaftszentrum Weihenstephan für Ernährung,
Landnutzung und Umwelt der Technischen Universität München zur Erlangung des akademischen
Grades eines
Doktors der Naturwissenschaften
genehmigten Dissertation.
Vorsitzender: Univ.-Prof. Dr.-Ing. Heiko Briesen
Prüfer der Dissertation: 1. apl. Prof. Dr. rer. nat. Dr. agr. habil. Karl-Werner Schramm
2. Univ.-Prof. Dr. rer. nat. habil. Thomas Letzel
Die Dissertation wurde am 17.06.2015 bei der Technischen Universität München eingereicht
und durch die Fakultät Wissenschaftszentrum Weihenstephan für Ernährung, Landnutzung und
Umwelt am 24.10.2015 angenommen.
Preface
The doctoral thesis which is presented here is the result of work conducted from February
2012 until April 2015 within the research group Molecular EXposomics (MEX) of the German
Research Center for Environmental Health and was funded as part of the Yangtze Project by the
German Federal Ministry for Education and Research.
Primarily, I like to thank Prof. Dr. Karl-Werner Schramm for giving me the opportunity to pre-
pare this thesis under his supervision. His support for an independent working atmosphere
offered me the possibility to conduct individual experimental work which helped to solve issues
during instrumental method development. Moreover, I appreciated the participation in numer-
ous national and international scientific congresses and meetings for deepening my knowledge
as well as for gaining experience in the presentation of scientific results. Finally, his experience
in the field of environmental analysis was always beneficial to judge and interpret own scientific
findings.
Furthermore, I particularly appreciated the support from Dr. Gerd Pfister during the orientation
time at the measurement instrument. Especially the assistance regarding technical issues was
welcome throughout this work.
Additionally, I want to offer my sincere thanks to Dr. Jingxian Wang for the fruitful discus-
sions of scientific results and her support during the environmental sampling campaign at the
Three Gorges Dam in China in 2012. Particularly, I like to thank our Chinese cooperation part-
ners within the Yangtze Project Dr. Yonghong Bi and Dr. Chengrong Peng from the Institute of
Hydrobiology of the Chinese Academy of Sciences for the extended support during the environ-
mental sampling campaign in the Three Gorges Reservoir in 2012 and 2013. Without the help
of our Chinese cooperation partners, both sampling campaigns would not have been possible.
Furthermore, I want to acknowledge the contribution of our German cooperation partners within
the Yangtze Project. Thanks to Wei Hu for his support in topographic mapping and his con-
tribution to the modeling of discharges of the Yangtze River. I also appreciated the help
of Prof. Dr. Bernhard Westrich concerning the description of the Yangtze discharge model.
Moreover, my thanks go to Anja Wolf, Katrin Bieger, Tilman Floehr, Andreas Holbach, Felix
Stumpf, Ye Yuan, Dr. Björn Scholz-Starke, Irene Kranzioch and all other participants of the
Yangtze Project for the productive meetings and the interesting thoughts about the impound-
ment of the Yangtze River.
Besides, I want to highlight the contribution of my working colleagues within the research group
MEX. My thanks go to Felix Antritter for the support during several sampling campaigns and
during laboratory work. Silke Bernhöft helped particularly during orientation and throughout

the laboratory work of this thesis. Theresa Maria Rock contributed samples and standard solu-
tions for the analysis of catecholamines. Norbert Fischer introduced me to one of our sampling
sites in the Alps. Moreover, I like to thank Joachim Nagler for the positive working atmosphere
and the proofreading of this thesis. Thanks also to Bernhard Henkelmann for the management
of orders, laboratory supply and proofreading of several manuscripts. Additionally, I appreci-
ated the scientific advice and productive talks with Dr. Marchela Pandelova, Dr. Walkiria Levy,
Dr. Meri De Angelis and Cedrique Temoka. Moreover, I enjoyed the exchange with our visiting
scientists and doctoral fellows Dr. Zhenlan Xu, Dr. John Mumbo, Jacques Ehret, Dr. Rajesh
Rathore, Dr. Burak Karacık, Atilla Yilmaz, Valentina Zingarelli and Nali Xu.
Alongside scientific exchange, I particularly enjoyed professional and private discussions with
all members of the working group, including those I could not mention here. Specifically, I
want to send my thanks to Josie Kunze, Dr. Daniela Rascher and Dr. Martin Rieger and Claudia
Corsten for providing me many times new motivation during daily routine.
My thanks are also directed to Beate Gruber, George Dragan, Sebastian Wohlfahrt, Michael
Fischer, Janos Varga, Markus Oster, Matthias Fuchs, Benedikt Weggler, Vesta Kohlmeier, Geza
Kocsis and all other members of the research group Comprehensive Molecular Analytics for
the great working atmosphere and the social activities.
Thanks to my good friends Christian Franik and Christian Wichmann for the extensive proof-
reading. Without your suggestions, this thesis would not exist in the current version.
Finally, I like to thank my brother Johannes Deyerling for providing high-quality photography
and my whole family for the continuous support throughout my studies and during this doc-
toral thesis. My warmest thanks go to my girlfriend Claudia for providing me essential mental
support during the critical phases of this work.
IV
List of Publications
At the time of completion of this thesis, parts of this work have already been published in pro-
fessional journals or are in preparation for submission:
D. Deyerling, J. Wang, W. Hu, B. Westrich, C. Peng, Y. Bi, B. Henkelmann, K.-W. Schramm,
PAH distribution and mass fluxes in the Three Gorges Reservoir after impoundment of the Three
Gorges Dam, Science of the Total Environment, 491-492 (2014) 123-130
DOI: 10.1016/j.scitotenv.2014.03.076.
D. Deyerling, J. Wang, Y. Bi, C. Peng, G. Pfister, B. Henkelmann, K.-W. Schramm, Depth
profile of persistent and emerging organic pollutants upstream of the Three Gorges Dam gath-
ered in 2012/13, Environmental Science and Pollution Research, in press
DOI: 10.1007/s11356-015-5805-8
D. Deyerling, K.-W. Schramm, Integrated targeted and semantic non-targeted analysis of water
sample extracts with micro-scale LC-MS, MethodsX, 2 (2015) 399-408
DOI: 10.1016/j.mex.2015.10.002
V
Kurzfassung
Wasserlösliche organische Rückstände wie Pharmazeutika, polare Pestizide und Perfluoralkyl-
säuren (PFAAs) sind von zunehmendem Belang für die Umwelt. Unmetabolisierte pharma-
zeutische Rückstände aus dem menschlichen Gebrauch und der Behandlung von Viehbestand
werden durch die klassische Abwasserbehandlung nur teilweise beseitigt und gelangen folg-
lich in erheblichen Mengen in Oberflächengewässer. Die Beeinträchtigung einer empfindlichen
Fischspezies konnte bereits auf die Spurenkonzentration von Pharmazeutika im Wasser zurück-
geführt werden. PFAAs sind Chemikalien die wegen ihrer einzigartigen Eigenschaften weit-
verbreitet sind. Üblicherweise werden sie als schmutzabweisende Agenzien in Textilien und
Teppichen, in der Behandlung von Lebensmittelverpackungen und in der Herstellung von Po-
lymeren verwendet. Nach ihrer Freisetzung in die Umwelt sind diese persistent und können
sich in der Nahrungskette anreichern. In Oberflächengewässern finden sich organische Rück-
stände wie Pharmazeutika und PFAAs wegen der hohen Verdünnungsfaktoren üblicherweise
nur in niedrigen Konzentrationen. Die vorliegende Arbeit berichtet über die Entwicklung einer
analytischen Methode für die Bestimmung von Spurenkonzentrationen aufkommender organi-
scher Schadstoffe in Oberflächenwasser und deren Anwendung bei der Umweltprobenahme des
Flusses Jangtse in China.
Eine Isotopenverdünnungsanalyse wurde mittels Ultrahochleistungsflüssigchromatographie und
Quadrupol-Flugzeit-Massenspektrometrie realisiert. Dafür wurde die Eignung unterschiedli-
cher Flusskonfigurationen des chromatographischen Systems im Nano- und Mikro-Maßstab
für die Analyse von mittelpolaren bis polaren Substanzen untersucht. Außerdem wurden op-
timierte Betriebsparameter für die Elektospray-Ionenquelle im Nano- und Standard-Maßstab
bestimmt. Dabei konnten die besten Ergebnisse mit einem Betrieb im Mikro-Maßstab und der
Standard-Elektrospray Ionenquelle erzielt werden. Trotzdem ermöglichten verbesserte Betrieb-
sparameter der Nano-Electrospray Ionenquelle deren stabilen Betrieb über längere Zeiträume
hinweg. Der Vergleich von spezialisierten Betriebsarten des Massenspektrometers führte zur
Entwicklung einer hybriden Betriebsmethode, welche alle generierten Ionen gleichzeitig frag-
mentiert, wodurch die Vorteile der Flugzeitdetektion mit denen der kollisionsinduzierten Dis-
soziation verbunden werden konnten. Somit konnte die Empfindlichkeit des Instruments bei
gleichzeitigem Erhalt eines hohen Grades an Rauschunterdrückung maximiert werden. Unter
Berücksichtigung der ermittelten Leistungsfähigkeit des Messgerätes wurden mehrere Pharma-
zeutika, polare Pestizide und PFAAs für die Analyse ausgewählt. Messgerätkalibrierungen für
die Quantifizierung konnten mit einer angemessenen Linearität, Empfindlichkeit und Reprodu-
zierbarkeit im Nano- und Mikro-Maßstab erstellt werden. Trotzdem zeigten die Ergebnisse für
VI
quantitative Aufgaben einen reproduzierbareren und geeigneteren Betrieb mit der Flusskonfi-
guration im Mikro-Maßstab.
Außer der Entwicklung einer instrumentellen Messmethode wurde ein aktives Wasserprobe-
nahmesystem entworfen, das die Anreicherung von großen Wasservolumina erlaubte, um Spu-
renkonzentrationen organischer Rückstände in Oberflächenwasser detektieren zu können. Dazu
wurden selbstgepackte Glaskartuschen mit Polymerharz verwendet um bis zu 300 L Wasser
vor Ort mit Hilfe einer batteriebetriebenen Schlauchpumpe anzureichern. Das Probenahmesys-
tem wurde für eine Umweltprobenahmekampagne des Flusses Jangtse im Jahr 2013 verwendet.
Der Probenahmestandort war etwas stromaufwärts der Drei-Schluchten-Talsperre gelegen. Da-
bei wurden Wasserproben in 11, 31 und 50 m Wassertiefe genommen. Für die Analyse der
Proben wurde eine geeignete laborative Extraktions- und Aufreinigungsmethode, basierend auf
Festphasenextraktion (SPE), entwickelt. Die Leistung der Extraktions- und Aufreinigungsme-
thode wurde anhand von Laborversuchen mit anschließender Analyse durch die entwickelte
instrumentelle Methode bewertet. Die Untersuchung zeigte erhebliche Signalunterdrückung in
Labor- und Umweltproben durch analytischen Hintergrund welcher nicht ausreichend durch die
SPE überwunden werden konnte. Weiterhin war die Retentionsfähigkeit der Probenahmekartu-
schen für polare Analyten begrenzt. Dennoch erlaubten die Umweltproben des Flusses Jangtse
die weitere Charakterisierung der Fähigkeiten des Probenahmesystems und die qualitative Dis-
kussion der Verteilung der Analyten mit der Wassertiefe.
Schließlich wurde ein Arbeitsablauf für die Non-Target-Analyse eingeführt und auf die hoch-
aufgelösten Massenspektrometriedaten angewendet, die während der Analyse von Umweltpro-
ben gesammelt worden sind. Einige Treffer konnten in den Probenextrakten identifiziert sowie
deren Detektionwahrscheinlichkeit diskutiert werden. Durch die Unabhängigkeit des entwickel-
ten Arbeitsablaufes vom Probenursprung kann dieser als Werkzeug für die Entdeckung von
Stoffen durch die Nachbearbeitung bereits aufgezeichneter Massenspektrometriedaten dienen.
VII
Abstract
Water soluble organic residues like active pharmaceutical ingredients, polar pesticides and per-
fluorinated alkyl acids (PFAAs) are of growing environmental concern. Unmetabolized phar-
maceutical residues from human consumption and the treatment of livestock are only partly
removed in classic wastewater treatment and thus enter surface water in considerable amounts.
Adverse effects on a sensitive fish species could already be attributed to trace amounts of phar-
maceuticals in water. PFAAs are chemicals which are widely used due to their unique prop-
erties. Typically, they are used as stain repellents in textiles and carpets, the treatment of food
packagings and for polymer production. Once released into the environment they are persistent
and can bioaccumulate in the food chain. In surface water, organic residues like pharmaceu-
ticals and PFAAs are usually found at low concentrations due to high dilution factors. The
work presented reports on the development of an analytical method for the determination of
trace amounts of selected emerging organic pollutants in surface water and its application in
environmental sampling of the Yangtze River in China.
An isotope dilution analysis was realized with ultra high-performance liquid chromatography
coupled to a quadrupole time-of-flight hybrid mass spectrometer. Therefore, the applicability
of different fluidic configurations of the chromatographic system in nano- and micro-scale were
evaluated for the analysis of medium to polar residues. Besides, optimized operation conditions
for nano-scale and standard-scale electrospray ion sources were determined. Thereby, the best
results for targeted analysis could be achieved with micro-scale separation and the application
of a standard-scale ion source. Nevertheless, improved operational parameters for nano-scale
electrospray allowed its stable operation during prolonged time windows. The comparison of
different specialized mass spectrometric experiments lead to the development of a hybrid op-
eration mode for the fragmentation of all ions at the same time with which the benefits of
time-of-flight detection and collision induced dissociation could be combined. Thus, instru-
ment sensitivity could be maximized while maintaining a high degree of background reduction.
After consideration of the determined instrument capabilities, several pharmaceuticals, polar
pesticides and PFAAs were chosen for analysis. Instrumental calibrations for quantitative mea-
surements were established with reasonable linearity, sensitivity and reproducibility for both
nano-scale and micro-scale chromatography setups. Nevertheless, the results indicated a more
reproducible and convenient operation with the micro-fluidic configuration for quantitative an-
alytical tasks.
Besides instrumental method development, an active water sampling technique was designed
which allowed the enrichment of high volumes of water in order to detect trace amounts of
VIII
organic residues in surface water. Self-packed glass cartridges with polymeric resin were used
to enrich volumes of up to 300 L on-site with the help of a battery-driven peristaltic pump.
The sampling system was used for an environmental sampling campaign of the Yangtze River
in 2013. The sampling site was located slightly upstream of the Three Gorges Dam and water
samples were taken in 11, 31 and 50 m water depth. For sample analysis, a suitable labora-
tory extraction and cleanup method based on solid-phase extraction (SPE) was developed. The
extraction and cleanup performance was assessed in a laboratory recovery study with the es-
tablished instrumental method. The investigation indicated considerable signal suppression in
laboratory and environmental samples by analytical background which could not be sufficiently
resolved by the SPE cleanup. Furthermore, the retention capabilities of the sampling cartridges
for the polar analytes was limited. Nevertheless, environmental samples from the Yangtze River
allowed further characterization of the capabilities of the sampling system and qualitative dis-
cussion of analyte distribution with water depth.
Finally, a workflow for non-target screening was introduced and applied on the high resolution
mass spectrometric data gathered during environmental sample analysis. Several suspects in
the sample extracts could be identified and their detection plausibility was discussed. With the
developed workflow being independent from the sample origin, it can be used as tool for the
discovery of compounds by post-processing of already recorded mass spectrometric data.
IX
Contents
1. Introduction 1
1.1. The impoundment of the Yangzte River . . . . . . . . . . . . . . . . . . . . . 1
1.2. Persistent and emerging organic pollutants . . . . . . . . . . . . . . . . . . . . 4
1.2.1. Perfluorinated compounds . . . . . . . . . . . . . . . . . . . . . . . . 5
1.2.2. Pharmaceutical residues . . . . . . . . . . . . . . . . . . . . . . . . . 8
1.3. Regulations of organic pollutants in the European Union . . . . . . . . . . . . 11
2. Theoretical background 12
2.1. Liquid chromatography . . . . . . . . . . . . . . . . . . . . . . . . . . . . . . 12
2.1.1. Reversed-phase chromatography . . . . . . . . . . . . . . . . . . . . . 16
2.1.2. Retention Time Index . . . . . . . . . . . . . . . . . . . . . . . . . . . 18
2.2. Quadrupol time-of-flight mass spectrometry . . . . . . . . . . . . . . . . . . . 19
2.3. Electrospray ionization . . . . . . . . . . . . . . . . . . . . . . . . . . . . . . 24
2.4. Solid-phase extraction . . . . . . . . . . . . . . . . . . . . . . . . . . . . . . 26
2.5. Analysis of catecholamines with LC-MS . . . . . . . . . . . . . . . . . . . . . 28
2.6. Applications of LC-MS in the analysis of emerging organic pollutants in water 29
3. Scope of work 31
4. Experimental part 33
4.1. Reagents and chemicals . . . . . . . . . . . . . . . . . . . . . . . . . . . . . . 33
4.2. Preparation of standard stock solutions . . . . . . . . . . . . . . . . . . . . . . 34
4.3. Analytical instrumentation . . . . . . . . . . . . . . . . . . . . . . . . . . . . 36
4.3.1. Liquid chromatography system . . . . . . . . . . . . . . . . . . . . . . 36
4.3.2. Mass spectrometric detection system . . . . . . . . . . . . . . . . . . . 38
4.4. Experimental parameters for instrumental measurement . . . . . . . . . . . . . 40
4.5. Instrument calibration . . . . . . . . . . . . . . . . . . . . . . . . . . . . . . . 41
4.5.1. Calibration standards for perfluorinated compounds . . . . . . . . . . . 42
4.5.2. Calibration standards for pharmaceuticals and polar pesticides . . . . . 43
4.6. Derivatization of catecholamines . . . . . . . . . . . . . . . . . . . . . . . . . 44
4.7. Evaluation of solid-phase extraction cartridges . . . . . . . . . . . . . . . . . . 44
4.8. Evaluation of syringe filters . . . . . . . . . . . . . . . . . . . . . . . . . . . . 46
4.9. Active water sampling system . . . . . . . . . . . . . . . . . . . . . . . . . . 46
4.10. Laboratory performance evaluation of large volume water sampling . . . . . . 48
4.11. Environmental sampling and analysis of the Yangtze River . . . . . . . . . . . 50
X
4.12. Workflow for directed non-target screening . . . . . . . . . . . . . . . . . . . 52
5. Results and Discussion 54
5.1. Chromatographic method development . . . . . . . . . . . . . . . . . . . . . . 54
5.1.1. Nano-scale chromatography with trap column . . . . . . . . . . . . . . 54
5.1.1.1. Evaluation of trapping parameters . . . . . . . . . . . . . . . 54
5.1.1.2. Trapping and gradient elution with pharmaceuticals and polar
pesticides . . . . . . . . . . . . . . . . . . . . . . . . . . . 56
5.1.1.3. Trapping and gradient elution with perfluorinated compounds 59
5.1.2. Nano-scale chromatography with direct injection . . . . . . . . . . . . 60
5.1.2.1. Gradient elution with pharmaceuticals and polar pesticides . 60
5.1.2.2. Gradient elution with perfluorinated compounds . . . . . . . 63
5.1.3. Micro-scale chromatography with direct injection . . . . . . . . . . . . 65
5.1.4. Applicability of the fluidic configurations for calibration and quantifi-
cation . . . . . . . . . . . . . . . . . . . . . . . . . . . . . . . . . . . 67
5.2. Mass spectrometric method development . . . . . . . . . . . . . . . . . . . . . 69
5.2.1. Operation of the nano-electrospray interface . . . . . . . . . . . . . . . 69
5.2.2. Operation of the standard electrospray interface . . . . . . . . . . . . . 72
5.2.3. Operation of the Q-TOF mass spectrometer . . . . . . . . . . . . . . . 74
5.3. Instrumental calibration and linearity . . . . . . . . . . . . . . . . . . . . . . . 80
5.3.1. Nano-scale chromatography with direct injection . . . . . . . . . . . . 80
5.3.2. Micro-scale chromatography with direct injection . . . . . . . . . . . . 83
5.3.3. Applicability of the instrumental calibrations for quantification . . . . . 85
5.4. Laboratory recovery experiments . . . . . . . . . . . . . . . . . . . . . . . . . 86
5.4.1. Selection of a solid-phase extraction chemistry . . . . . . . . . . . . . 86
5.4.2. Syringe filter evaluation . . . . . . . . . . . . . . . . . . . . . . . . . 89
5.4.3. Performance evaluation of large volume water sampling . . . . . . . . 91
5.5. Evaluation of large volume sampling with samples from the Yangtze River . . . 97
5.6. Inclusion of non-target analysis into the presented method . . . . . . . . . . . 101
6. Conclusion and Outlook 107
7. Appendix 110
List of figures . . . . . . . . . . . . . . . . . . . . . . . . . . . . . . . . . . . . . . 110
List of tables . . . . . . . . . . . . . . . . . . . . . . . . . . . . . . . . . . . . . . . 115
Bibliography 116
XI
List of Abbreviations
m/z . . . . . . . . . . . . . . mass-to-charge ratio
AC . . . . . . . . . . . . . . alternating current
ADC . . . . . . . . . . . . analog-to-digital converter
AIF . . . . . . . . . . . . . . all ion fragmentation
API . . . . . . . . . . . . . . atmospheric pressure ionization
AQC . . . . . . . . . . . . . 6-aminoquinolyl-N-hydroxysuccinimidyl carbamate
ASM . . . . . . . . . . . . auxiliary solvent manager
BSM . . . . . . . . . . . . binary solvent manager
CID . . . . . . . . . . . . . collision induced dissociation
CRM . . . . . . . . . . . . charged residue model
DC . . . . . . . . . . . . . . direct current
DDT . . . . . . . . . . . . . dichlorodiphenyltrichloroethane
DEET . . . . . . . . . . . N,N-diethyl-m-toluamide
DI . . . . . . . . . . . . . . . direct injection
DPT . . . . . . . . . . . . . dual-pump trapping
ECF . . . . . . . . . . . . . electrochemical fluorination
EQS . . . . . . . . . . . . . environmental quality standards
ESI . . . . . . . . . . . . . . electrospray ionization
EU . . . . . . . . . . . . . . European Union
FTOH . . . . . . . . . . . fluorotelomer alcohol
GHP . . . . . . . . . . . . . GH Polypro membrane
HETP . . . . . . . . . . . . height equivalent of a theoretical plate
HPLC . . . . . . . . . . . high-performance liquid chromatography
XII
HRMS . . . . . . . . . . . high resolution mass spectrometry
i. d. . . . . . . . . . . . . . . inner diameter
IDL . . . . . . . . . . . . . instrumental detection limit
IEM . . . . . . . . . . . . . ion evaporation model
LC . . . . . . . . . . . . . . liquid chromatography
LLE . . . . . . . . . . . . . liquid-liquid extraction
LOQ . . . . . . . . . . . . . limit of quantification
MALDI . . . . . . . . . . matrix-assisted laser desorption/ionization
MCP . . . . . . . . . . . . microchannel plate
MDL . . . . . . . . . . . . method detection limit
MRM . . . . . . . . . . . . multiple reaction monitoring
MS . . . . . . . . . . . . . . mass spectrometry / mass spectrometer
NOEC . . . . . . . . . . . no-oberserved adverse effect concentration
NSAID . . . . . . . . . . nonsteroidal anti-inflammatory drug
OCP . . . . . . . . . . . . . organochlorine pesticide
ODS . . . . . . . . . . . . . octadecylsilane
PAH . . . . . . . . . . . . . polycyclic aromatic hydrocarbon
PCB . . . . . . . . . . . . . polychlorinated biphenyl
PCCD . . . . . . . . . . . polychlorinated dibenzo-p-dioxin
PCDF . . . . . . . . . . . . polychlorinated dibenzofuran
PFAA . . . . . . . . . . . . perfluorinated alkyl acid
PFAS . . . . . . . . . . . . perfluoroalkylsulfonate
PFC . . . . . . . . . . . . . perfluorinated compound
PFCA . . . . . . . . . . . . perfluoroalkylcarboxylic acid
XIII
PFOS . . . . . . . . . . . . perfluorooctane sulfonic acid / perfluorooctanesulfonate
POP . . . . . . . . . . . . . persistent organic pollutant
POSF . . . . . . . . . . . . perfluorooctane sulfonyl fluoride
PS-DVB . . . . . . . . . polystyrene divinylbenzene
PTFE . . . . . . . . . . . . polytetrafluoroethylene
Q-TOF . . . . . . . . . . . quadrupole time-of-flight
r.f. . . . . . . . . . . . . . . . radio frequency
RC . . . . . . . . . . . . . . regenerated cellulose
RPC . . . . . . . . . . . . . reversed-phase chromatography
RSD . . . . . . . . . . . . . relative standard deviation
RTI . . . . . . . . . . . . . . retention time index
SM . . . . . . . . . . . . . . sample manager
SPE . . . . . . . . . . . . . solid-phase extraction
SPMD . . . . . . . . . . . semi-permeable membrane device
TDC . . . . . . . . . . . . . time-to-digital converter
TGD . . . . . . . . . . . . . Three Gorges Dam
TGP . . . . . . . . . . . . . Three Gorges Project
TGR . . . . . . . . . . . . . Three Gorges Reservoir
TIC . . . . . . . . . . . . . . total ion current
TOF-MS . . . . . . . . . time-of-flight mass spectrometer
UHPLC . . . . . . . . . . ultra high-performance liquid chromatography
VO . . . . . . . . . . . . . . virtual organism
WHO . . . . . . . . . . . . World Health Organization
1
1. Introduction
Substances referred to as pollutants are compounds or mixtures that may have negative effects
on ecosystems, live animals or material goods [1]. This wide definition, however, classifies
a large number of chemicals as possible pollutants. In contrast, environmental pollutants are
defined as substances that may harm live animals and humans [1]. The input of these kind of
chemicals from anthropogenic sources should be kept as low as possible as one goal of en-
vironmental protection. Therefore, the monitoring of substances in the environment becomes
mandatory to gain information on the origin, fate, distribution and behavior of chemical com-
pounds in the environment. This environmental monitoring may become a demanding task as
the investigation of various compound classes in different matrices like air, water, soil and sed-
iment requires specially adapted analytical methods. Environmental pollutants may be grouped
into chemicals of inorganic and organic nature. Both groups of chemicals are dispersed among
the various matrices. Organic pollutants may enter the aquatic environment directly by disposal
of industrial effluents or domestic sewage. Besides, organics from agriculture may be washed
out into surface waters by rain or floods. Finally, wet deposition of organic compounds adsorbed
to aerosol particles may be a source for organic pollutants into surface waters.
1.1. The impoundment of the Yangzte River
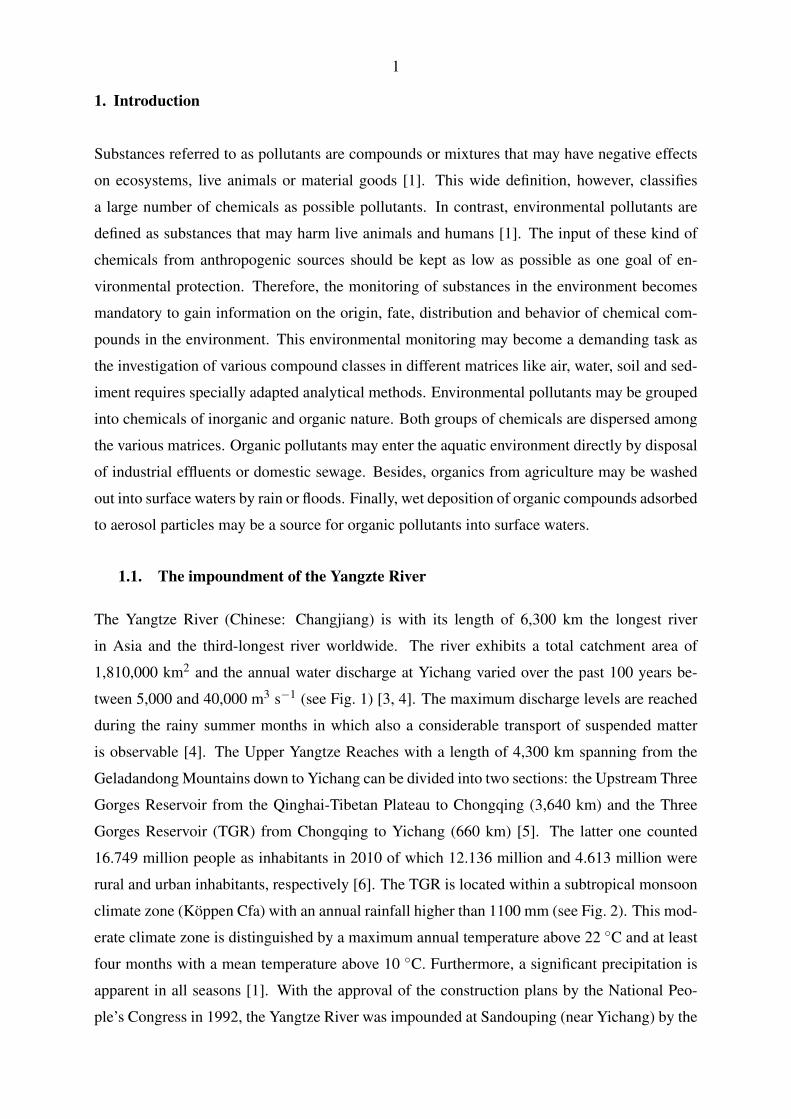
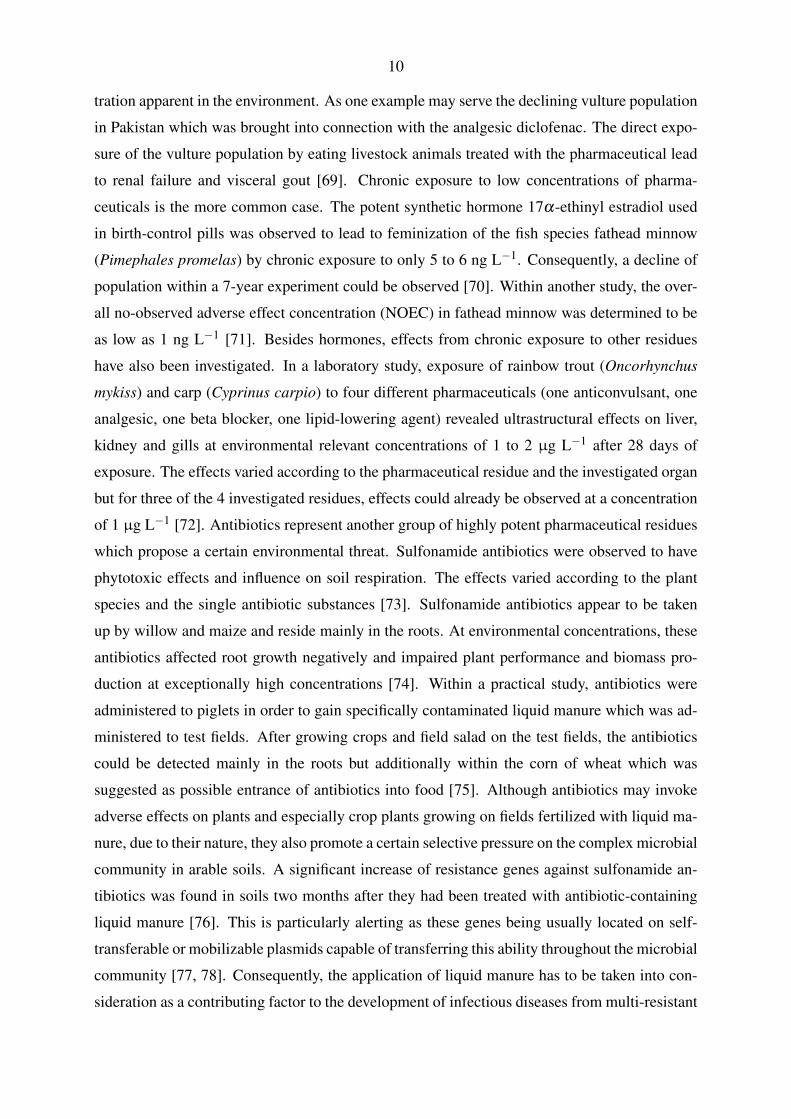
The Yangtze River (Chinese: Changjiang) is with its length of 6,300 km the longest river
in Asia and the third-longest river worldwide. The river exhibits a total catchment area of
1,810,000 km2 and the annual water discharge at Yichang varied over the past 100 years be-
tween 5,000 and 40,000 m3 s−1 (see Fig. 1) [3, 4]. The maximum discharge levels are reached
during the rainy summer months in which also a considerable transport of suspended matter
is observable [4]. The Upper Yangtze Reaches with a length of 4,300 km spanning from the
Geladandong Mountains down to Yichang can be divided into two sections: the Upstream Three
Gorges Reservoir from the Qinghai-Tibetan Plateau to Chongqing (3,640 km) and the Three
Gorges Reservoir (TGR) from Chongqing to Yichang (660 km) [5]. The latter one counted
16.749 million people as inhabitants in 2010 of which 12.136 million and 4.613 million were
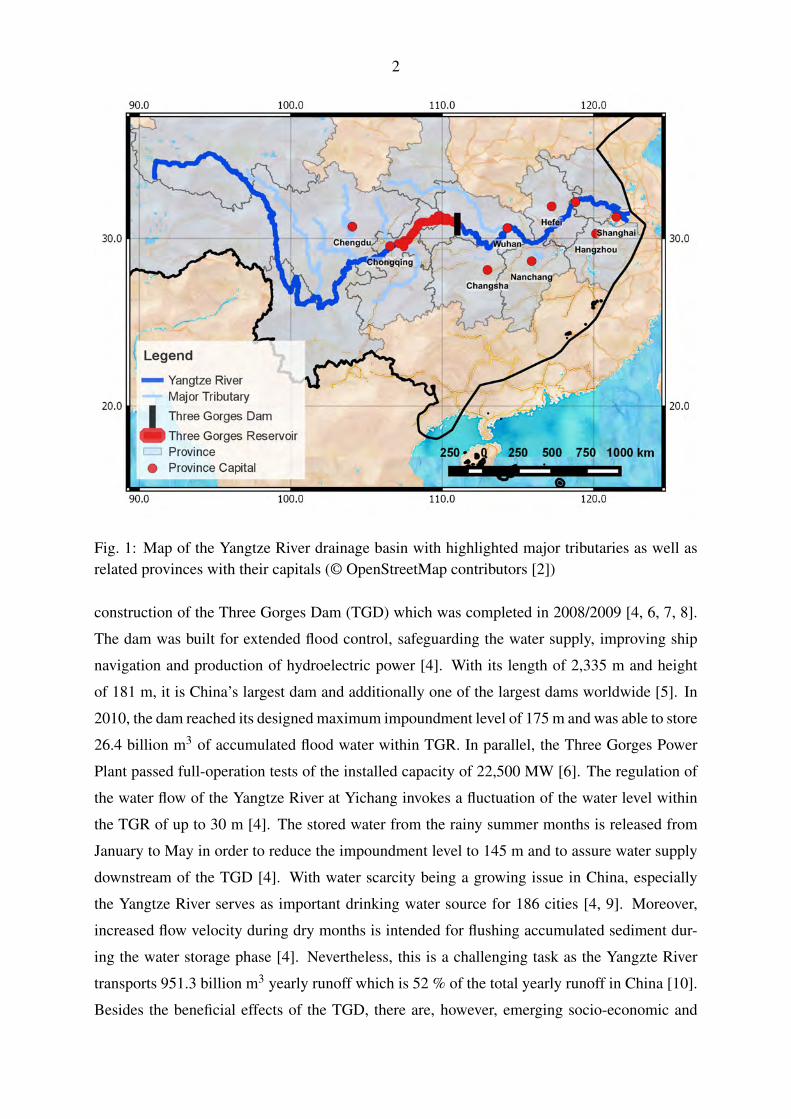
rural and urban inhabitants, respectively [6]. The TGR is located within a subtropical monsoon
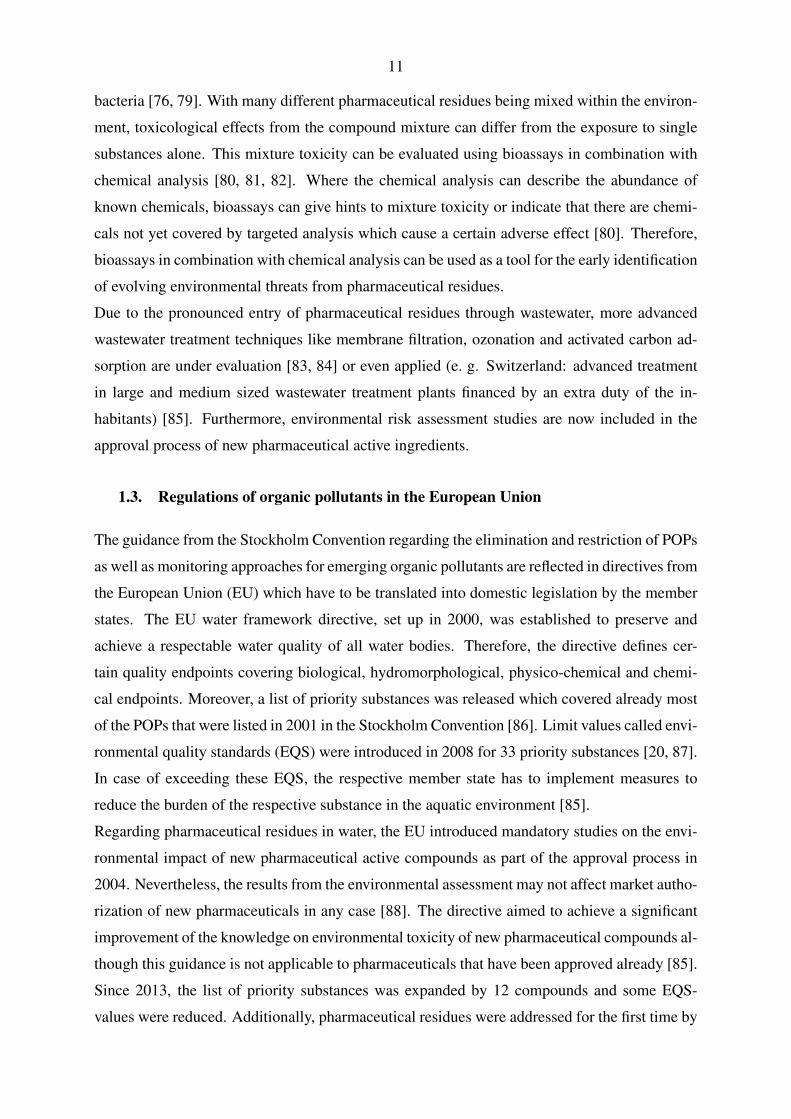
climate zone (Köppen Cfa) with an annual rainfall higher than 1100 mm (see Fig. 2). This mod-
erate climate zone is distinguished by a maximum annual temperature above 22 ◦C and at least
four months with a mean temperature above 10 ◦C. Furthermore, a significant precipitation is
apparent in all seasons [1]. With the approval of the construction plans by the National Peo-
ple’s Congress in 1992, the Yangtze River was impounded at Sandouping (near Yichang) by the
2
Fig. 1: Map of the Yangtze River drainage basin with highlighted major tributaries as well asrelated provinces with their capitals (© OpenStreetMap contributors [2])
construction of the Three Gorges Dam (TGD) which was completed in 2008/2009 [4, 6, 7, 8].
The dam was built for extended flood control, safeguarding the water supply, improving ship
navigation and production of hydroelectric power [4]. With its length of 2,335 m and height
of 181 m, it is China’s largest dam and additionally one of the largest dams worldwide [5]. In
2010, the dam reached its designed maximum impoundment level of 175 m and was able to store
26.4 billion m3 of accumulated flood water within TGR. In parallel, the Three Gorges Power
Plant passed full-operation tests of the installed capacity of 22,500 MW [6]. The regulation of
the water flow of the Yangtze River at Yichang invokes a fluctuation of the water level within
the TGR of up to 30 m [4]. The stored water from the rainy summer months is released from
January to May in order to reduce the impoundment level to 145 m and to assure water supply
downstream of the TGD [4]. With water scarcity being a growing issue in China, especially
the Yangtze River serves as important drinking water source for 186 cities [4, 9]. Moreover,
increased flow velocity during dry months is intended for flushing accumulated sediment dur-
ing the water storage phase [4]. Nevertheless, this is a challenging task as the Yangzte River
transports 951.3 billion m3 yearly runoff which is 52 % of the total yearly runoff in China [10].
Besides the beneficial effects of the TGD, there are, however, emerging socio-economic and
3
1 2 3 4 5 6 7 8 9 1 0 1 1 1 20
1 0
2 0
3 0 T e m p e r a t u r e
Temp
eratur
e [°C
]
M o n t h
0
5 0
1 0 0
1 5 0
2 0 0
2 5 0
3 0 0 P r e c i p i t a t i o n
Precip
itation
[mm]
Fig. 2: Climate diagram of the city Yichang located in proximity to the Three Gorges Dam inHubei Province, China (data obtained from [11])
environmental consequences which have to be faced [5, 12, 13, 14]. The considerable socio-
economic impact of the TGD construction can be mainly attributed to the necessary resettle-
ment of over 1.3 million people due to the flooding of huge areas of land in the reservoir area.
Moreover, resettlement for the Three Gorges Project (TGP) has been typically involuntary at
an inadequate compensation [15]. Besides, the flooding causes a severe loss of farmlands
and infrastructure which in turn negatively affects the communities living within the reser-
voir zone [12, 15]. Impacts on the environment may arise from the dissolution of minerals
and agrochemicals from the flooded farmlands. The decreased flow velocity within the reser-
voir and the increased residence time and water depth created a new hub for transformational
changes of emitted pollutants [16]. Furthermore, the impoundment results in indirect conse-
quences from pollution sources which have already been identified in a river regarded as one of
the most polluted ones worldwide [16, 17]. Within the TGR, increased navigation and trans-
portation attributes to the emission of considerable amounts of oil containing wastewater from
ships (481,300 t in 2010) [6]. Moreover, the reservoir has to deal with the introduction of high
volumes of urban sewage (615 million t in 2010) and the introduction of untreated wastewater
can still be observed (25 million t in 2010) [6]. Urban sewage adds up with industrial effluent
from mainly the metropolitan centers Chongqing, Changshou, Fuling and Wangzhou (220 mil-
lion t in 2010) which may impose severe environmental threats if no specialized treatment is
conducted [6].
4
Promoted by the humid climate, pollutants within the TGR become highly diluted within the
large waterbody leading in fact to low abundances of these substances in surface water [5, 14,
18]. When taking the whole water body into account, however, these low concentrations of
the single substances correspond to high total mass fluxes within the river and the reservoir [5,
14, 16, 18, 19]. Therefore, specialized analytical tools are needed allowing the detection and
quantification of substances with concentrations in the ng L−1 and pg L−1-scale in order to
identify environmental threats despite the high analyte dilution.
1.2. Persistent and emerging organic pollutants
An example for organic environmental pollutants which are typically monitored in different
matrices is the group of persistent organic pollutants (POPs). Once released into the environ-
ment, these compounds show resistance to biodegradation and tend to bioaccumulate in the food
chain. Exposure to these chemicals may induce acute toxic effects on live animals and humans
as well as chronic toxic effects due to long-time exposure [20]. Besides, some POPs are known
to be carcinogenic or at least known to act as possible human carcinogens. Due to their extended
lifetime in the environment, these compounds can undergo long-range transports and reach re-
mote areas like the Antarctic [20, 21]. Guidelines for the limitation of production, intentional
and unintentional release of POPs into the environment have been declared by the Stockholm
Convention of the United Nations Environment Programme (UNEP) [20] since 2004. The Con-
vention agreed on the elimination of production for most of the regulated substances. Among
them are organochlorine pesticides (OCPs) and polychlorinated biphenyls (PCBs). The produc-
tion and use of other compounds like the insecticide dichlorodiphenyltrichloroethane (DDT)
and the surfactant perfluorooctane sulfonic acid (PFOS) have been restricted to certain appli-
cations [20]. Unintentionally produced POPs like polychlorinated dibenzo-p-dioxins (PCCDs)
and polychlorinated dibenzofurans (PCDFs), which are among the most cancer-causing chem-
icals known, can be formed during combustion processes like waste incineration and are also
addressed by the Stockholm Convention supporting measures for the reduction of their release
into the environment [20].
Nevertheless, there are other organic trace compounds which are commonly not referred to as
POPs but still exhibit POP-like properties, posing possible threats to environmental and hu-
man health. Polycyclic aromatic hydrocarbons (PAHs) are naturally found in the environment
but may also originate from anthropogenic sources [22]. Most of the atmospheric PAHs are
formed and released from incomplete combustion processes like the burning of fossil and non-
fossil fuels from car and truck engines, fuel burning energy power plants, domestic heating and
incineration [22]. Volcanic activities and forest fires may serve as natural PAH proxies [23].
5
Some isomers are known for possible carcinogenic and mutagenic activity by the formation
of DNA adducts [24]. Moreover, animal models indicated carcinogenicity, genotoxicity, im-
munotoxicity and teratogenicity of PAHs [25]. Due to their aromatic ring structure, PAHs can
readily adsorb onto the surface of carbonaceous particles and thus be widely spread in the en-
vironment [23]. Besides, the affinity of PAHs towards particles was directly related with the
carcinogenic potency of diesel soot [26].
1.2.1. Perfluorinated compounds
Organic chemicals in which all hydrogen atoms have been replaced by fluorine are commonly
referred to as perfluorinated compounds (PFCs). Although substances containing one or mul-
tiple fluorine atoms are naturally produced by higher plants and certain microorganisms like
fungi, PFCs (except trifluoroacetic acid) can be attributed to anthropogenic origin only [27, 28].
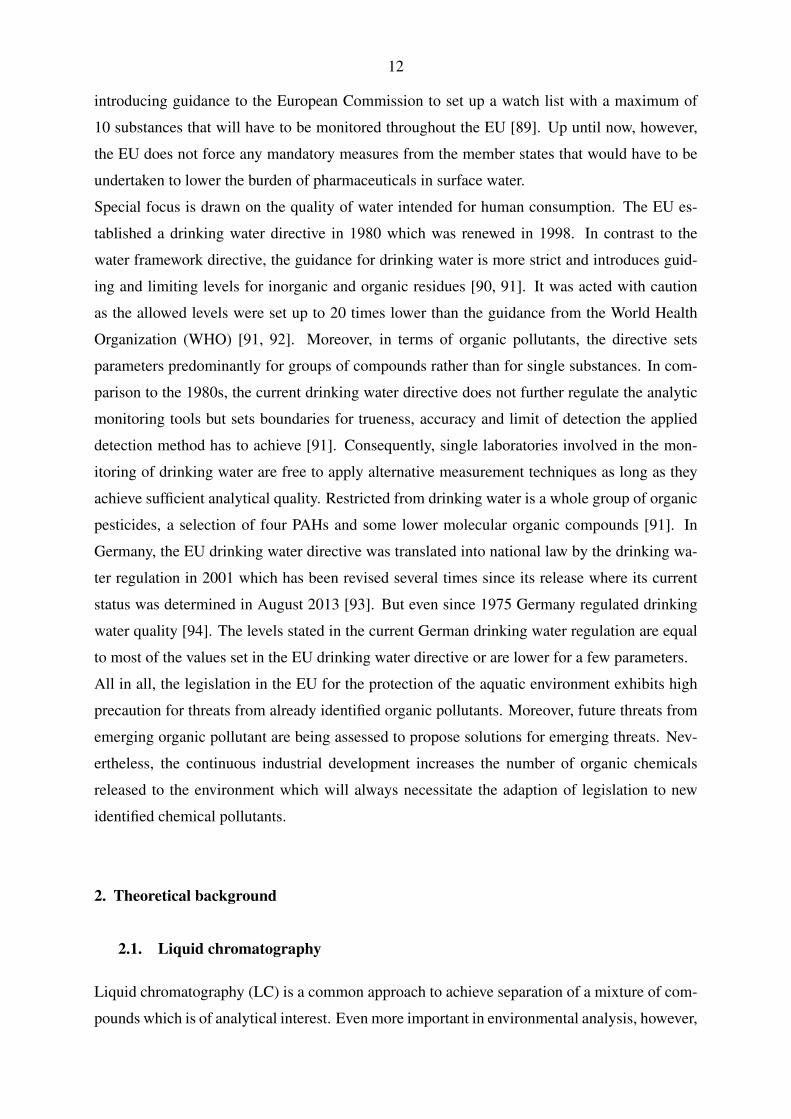
Key compounds for investigation of this substance class are the linear perfluorinated alkyl acids
(PFAAs), perfluorooctanoic acid (PFOA) and perfluorooctane sulfonic acid (PFOS) and their
corresponding salts perfluorooctanoate and perfluorooctanesulfonate (see Fig. 3). The large
scale production of PFCs has its origin in the discovery of the process for the electrochemical
fluorination (ECF) of organic molecules. The process was discovered by Joseph H. Simons at
the State College of Pennsylvania (USA) sponsored by the 3M corporation in the 1930s and
published after World War II in 1949 in the Journal of the Electrochemical Society [29, 30].
Nevertheless, for the production of promising PFCs in an efficient yield for industrial appli-
ances, further research was needed in the 3M research laboratories [31]. At this early stage,
the introduction of functional groups into perfluorinated alkyl chains proposed major problems.
Furthermore, analytical techniques were limited and the identification of reaction products was
a challenging task [31]. According to Simons, ECF is carried out by dissolving a substrate for
fluorination in anhydrous hydrogen fluoride within an electrolysis cell with iron cathode and
nickel anode. The reaction is started by applying voltages between 5 and 6 V to the cell. Criti-
cal for the reaction is the solubility of the fluorination substrate in hydrogen fluoride. However,
partly soluble substrates can still be accessed by stirring a suspension [32]. Early reactions at
the 3M laboratories with butyric acid lead to excess production of oxygen difluoride and low
recoveries of C3F8. However, this issue could be solved by using butyric anhydride as fluori-
nation substrate. The reaction then produced perfluorobutyramide in recoverable yields which
could finally be transformed to the corresponding perfluorocarboxyl acid by synthetic chem-
istry [31]. In general, ECF of linear compounds yields linear and branched isomers as well as
some impurities [33].
PFCs are also accessible via telomerization yielding mostly linear products with an even number
6
OH
O
F F F F F F
F FF FF FF
FF
FS
OH
O O
FF
F F
FF
F F
FF
F F
FF
FF
F FF FF FF F
F F F F F FFF
FOH
F FF FF F
FF F F F F
OHF
PFOApKa = 0.50
6:2 FTOHlogP 4.54
8:2 FTOHlogP 5.58
OH
O
F F F F F F F F
F FF FF FF
FF
SOH
O O
FF
F F
FF
F F
FF
F F
FF
FF
FF
FFF
PFOSpKa = -3.27
PFNApKa = 0.52
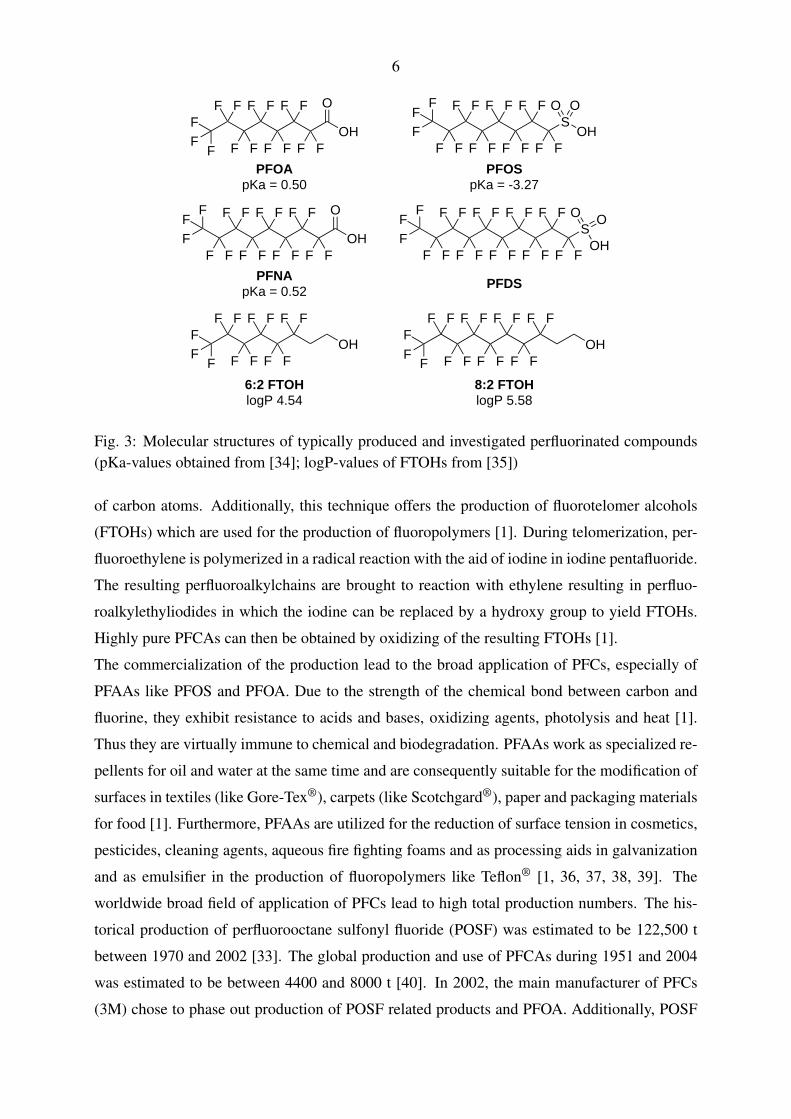
PFDS
Fig. 3: Molecular structures of typically produced and investigated perfluorinated compounds(pKa-values obtained from [34]; logP-values of FTOHs from [35])
of carbon atoms. Additionally, this technique offers the production of fluorotelomer alcohols
(FTOHs) which are used for the production of fluoropolymers [1]. During telomerization, per-
fluoroethylene is polymerized in a radical reaction with the aid of iodine in iodine pentafluoride.
The resulting perfluoroalkylchains are brought to reaction with ethylene resulting in perfluo-
roalkylethyliodides in which the iodine can be replaced by a hydroxy group to yield FTOHs.
Highly pure PFCAs can then be obtained by oxidizing of the resulting FTOHs [1].
The commercialization of the production lead to the broad application of PFCs, especially of
PFAAs like PFOS and PFOA. Due to the strength of the chemical bond between carbon and
fluorine, they exhibit resistance to acids and bases, oxidizing agents, photolysis and heat [1].
Thus they are virtually immune to chemical and biodegradation. PFAAs work as specialized re-
pellents for oil and water at the same time and are consequently suitable for the modification of
surfaces in textiles (like Gore-Tex®), carpets (like Scotchgard®), paper and packaging materials
for food [1]. Furthermore, PFAAs are utilized for the reduction of surface tension in cosmetics,
pesticides, cleaning agents, aqueous fire fighting foams and as processing aids in galvanization
and as emulsifier in the production of fluoropolymers like Teflon® [1, 36, 37, 38, 39]. The
worldwide broad field of application of PFCs lead to high total production numbers. The his-
torical production of perfluorooctane sulfonyl fluoride (POSF) was estimated to be 122,500 t
between 1970 and 2002 [33]. The global production and use of PFCAs during 1951 and 2004
was estimated to be between 4400 and 8000 t [40]. In 2002, the main manufacturer of PFCs
(3M) chose to phase out production of POSF related products and PFOA. Additionally, POSF
7
and PFOS became restricted in use by the Stockholm Convention in 2009 [20] (see also sec-
tion 1.3.).
Due to their chemical properties, the highly stable PFCs behave persistent in the environment
meaning once released, they do not degrade and thus may tend to bioaccumulate in plants or
in the food chain which may impose environmental threats or even danger to humans. With-
out proper means to remove these persistent compounds from environmental matrices, it is
mandatory to limit emission as far as possible. PFCs have already been detected widespread
in the environment. They appear to be ubiquitous residing in air, soil, sediment and wa-
ter [27, 28, 39, 40, 41, 42]. Volatile PFCs like FTOHs can undergo long-range transport and
even reach remote areas like the Antartic which are far away from any possible anthropogenic
source [43, 44, 45]. FTOHs are typically detected in house dust samples and thus invoke a cer-
tain exposure source especially for humans [46, 47]. Maybe most alerting is the fact that PFCs,
due to their ubiquitous appearance, can routinely be detected in human blood serum [48, 49].
Input of PFCs into the environment can be attributed to direct and indirect sources. Typically,
PFC manufacturing plants can be regarded as point sources. As an example for direct emis-
sion, the production of PFCs at the company 3M requires over 600 intermediate manufacturing
steps which include venting and washing steps leading to PFC contaminated air, water and solid
residues. With technically demanding and expensive after-treatment systems, it was possible to
reduce PFC-emissions to air and water by up to 50 % which means that still a considerable
PFC amount is released into the environment during manufacture [33]. Aqueous fire fighting
foams may serve as example for historic direct PFC input into the environment. Being used by
the military and at airports worldwide, PFC-containing formulations have been used routinely
in fire fighting exercises causing direct PFC contamination of soil and water [50]. The emis-
sion of PFCA from this source was estimated to be between 5 and 10 t yearly from 1965 to
1974 [40]. PFC losses of products like PFC-containing textiles, carpets, paper and packaging
are suspected to contribute up to 85 % of the total indirect PFC emissions [33]. In general, PFCs
are also emitted through wastewater treatment plants in which the oxidative milieu can increase
the burden of PFCAs by oxidizing FTOHs [42, 51, 52]. Moreover, association of PFCs with
particles may lead to an accumulation in sewage sludge [42, 51, 53]. In Arnsberg (Germany),
illegal deposition of PFC-containing waste contaminated the sewage sludge of the associated
wastewater treatment plant. Local farmers administered the sewage sludge routinely as special
fertilizer to their fields. In that way, the nearby river Möhne, serving as drinking water reservoir
for the small city Arnsberg, was contaminated by large amounts of PFCAs washed out from
the fields into the reservoir. Finally, this lead to elevated PFC levels in the local drinking water
supply and to an increased exposure of the local inhabitants to PFOA and PFOS which resulted
8
in elevated levels of these chemicals in their blood sera [53, 54].
Within the human body, PFOA seems to exhibit an exceptional long half-life of more than 4
years which was estimated from levels determined in blood serum from workers in the PFC
industry and from the incident in Arnsberg [53]. Investigations of PFOA residence in rats,
dogs and monkeys, however, showed clearance within only a few days [55]. Consequently,
results from the animal model might not be applicable for humans directly [53]. Meanwhile
adverse effects on human health are still under investigation and it is tried to estimate the risk
potential for humans from animal models as well as from epidemiological studies [55]. In a
study from 2009, however, results indicated adverse effects of PFOA and PFOS on the fertility
of women [53, 56].
1.2.2. Pharmaceutical residues
The abundance of pharmaceuticals in the aquatic environment which can also be seen as part
of emerging organic pollutants drew more and more attention during recent years although first
investigations in Germany had already been conducted in the 1970s [57]. However, only in
recent years, the progress in liquid chromatography and mass spectrometry allowed the rou-
tine monitoring of various organic residues in water samples at low environmental concentra-
tions [58, 59]. The increasing application and high prescription numbers of pharmaceuticals
for human health and livestock lead to an increasing burden of these substances in rivers, lakes
and reservoirs in developed [60, 61] as well as in developing countries like China [62, 63]. In
Germany, the consumption of pharmaceuticals with environmental relevance according to the
Federal Environment Agency grew by 20 % within ten years from 6,200 t to 8,120 t in 2012.
Thereby, more than half of this amount can be attributed to only 16 active pharmaceutical in-
gredients. The most prescribed pharmaceuticals intended for human use are nonsteroidal anti-
inflammatory drugs, antiasthmatics and psychopharmaceuticals [64]. Furthermore, intensive
livestock farming requires the broad application of pharmaceuticals. Thus, livestock farming
used 1600 t of antibiotic pharmaceuticals in Germany in 2011 [65]. Additionally, for the treat-
ment of livestock, hormones and anti-inflammatory pharmaceuticals for local application are
needed [66].
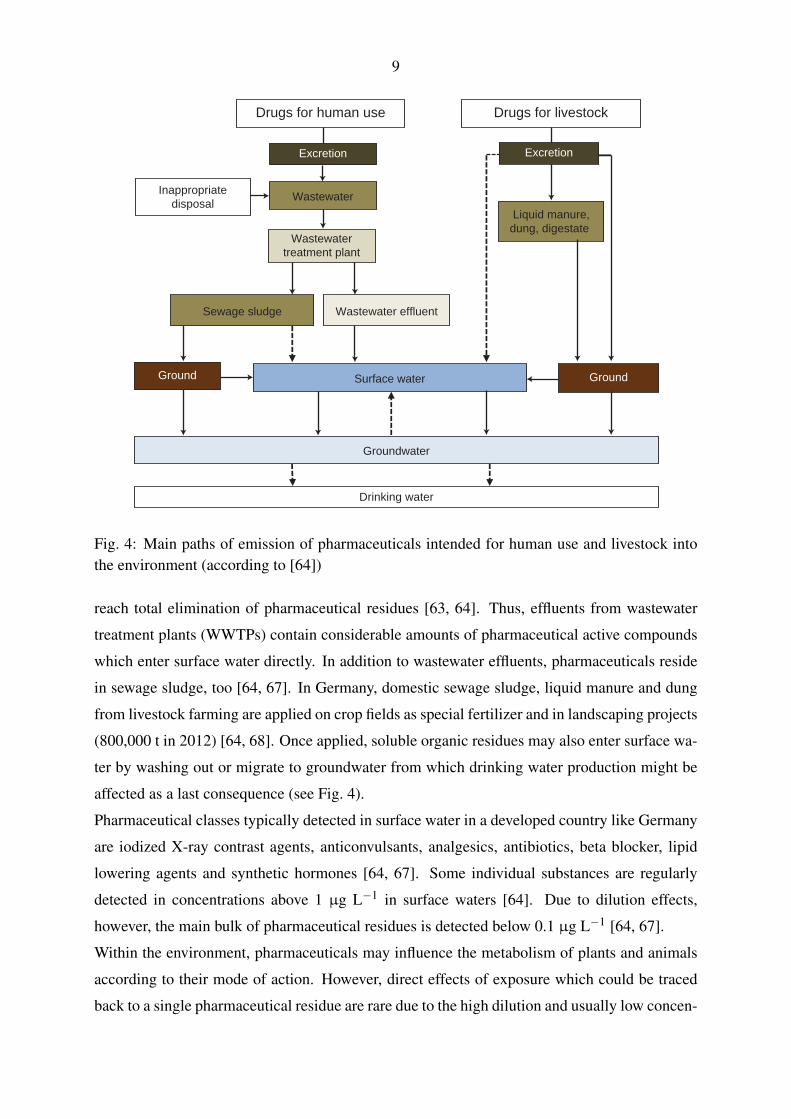
Fig. 4 illustrates the input paths of pharmaceutical residues into the environment. Typically,
pharmaceuticals are brought into the environment by human consumption and the treatment
of livestock as large fractions of the pharmaceutical active ingredients are excreted unmetabo-
lized [57]. Besides, inappropriate disposal of pharmaceuticals may also contribute to the burden
of these substances in wastewater. The classic wastewater treatment conducted with domes-
tic sewage including flocculation, sedimentation and active sludge treatment is not capable to
9
Inappropriatedisposal
Drugs for human use
Wastewater
Wastewatertreatment plant
Surface water
Groundwater
Drinking water
Wastewater effluentSewage sludge
Drugs for livestock
Liquid manure,dung, digestate
Excretion
GroundGround
Excretion
Fig. 4: Main paths of emission of pharmaceuticals intended for human use and livestock intothe environment (according to [64])
reach total elimination of pharmaceutical residues [63, 64]. Thus, effluents from wastewater
treatment plants (WWTPs) contain considerable amounts of pharmaceutical active compounds
which enter surface water directly. In addition to wastewater effluents, pharmaceuticals reside
in sewage sludge, too [64, 67]. In Germany, domestic sewage sludge, liquid manure and dung
from livestock farming are applied on crop fields as special fertilizer and in landscaping projects
(800,000 t in 2012) [64, 68]. Once applied, soluble organic residues may also enter surface wa-
ter by washing out or migrate to groundwater from which drinking water production might be
affected as a last consequence (see Fig. 4).
Pharmaceutical classes typically detected in surface water in a developed country like Germany
are iodized X-ray contrast agents, anticonvulsants, analgesics, antibiotics, beta blocker, lipid
lowering agents and synthetic hormones [64, 67]. Some individual substances are regularly
detected in concentrations above 1 µg L−1 in surface waters [64]. Due to dilution effects,
however, the main bulk of pharmaceutical residues is detected below 0.1 µg L−1 [64, 67].
Within the environment, pharmaceuticals may influence the metabolism of plants and animals
according to their mode of action. However, direct effects of exposure which could be traced
back to a single pharmaceutical residue are rare due to the high dilution and usually low concen-
10
tration apparent in the environment. As one example may serve the declining vulture population
in Pakistan which was brought into connection with the analgesic diclofenac. The direct expo-
sure of the vulture population by eating livestock animals treated with the pharmaceutical lead
to renal failure and visceral gout [69]. Chronic exposure to low concentrations of pharma-
ceuticals is the more common case. The potent synthetic hormone 17α-ethinyl estradiol used
in birth-control pills was observed to lead to feminization of the fish species fathead minnow
(Pimephales promelas) by chronic exposure to only 5 to 6 ng L−1. Consequently, a decline of
population within a 7-year experiment could be observed [70]. Within another study, the over-
all no-observed adverse effect concentration (NOEC) in fathead minnow was determined to be
as low as 1 ng L−1 [71]. Besides hormones, effects from chronic exposure to other residues
have also been investigated. In a laboratory study, exposure of rainbow trout (Oncorhynchus
mykiss) and carp (Cyprinus carpio) to four different pharmaceuticals (one anticonvulsant, one
analgesic, one beta blocker, one lipid-lowering agent) revealed ultrastructural effects on liver,
kidney and gills at environmental relevant concentrations of 1 to 2 µg L−1 after 28 days of
exposure. The effects varied according to the pharmaceutical residue and the investigated organ
but for three of the 4 investigated residues, effects could already be observed at a concentration
of 1 µg L−1 [72]. Antibiotics represent another group of highly potent pharmaceutical residues
which propose a certain environmental threat. Sulfonamide antibiotics were observed to have
phytotoxic effects and influence on soil respiration. The effects varied according to the plant
species and the single antibiotic substances [73]. Sulfonamide antibiotics appear to be taken
up by willow and maize and reside mainly in the roots. At environmental concentrations, these
antibiotics affected root growth negatively and impaired plant performance and biomass pro-
duction at exceptionally high concentrations [74]. Within a practical study, antibiotics were
administered to piglets in order to gain specifically contaminated liquid manure which was ad-
ministered to test fields. After growing crops and field salad on the test fields, the antibiotics
could be detected mainly in the roots but additionally within the corn of wheat which was
suggested as possible entrance of antibiotics into food [75]. Although antibiotics may invoke
adverse effects on plants and especially crop plants growing on fields fertilized with liquid ma-
nure, due to their nature, they also promote a certain selective pressure on the complex microbial
community in arable soils. A significant increase of resistance genes against sulfonamide an-
tibiotics was found in soils two months after they had been treated with antibiotic-containing
liquid manure [76]. This is particularly alerting as these genes being usually located on self-
transferable or mobilizable plasmids capable of transferring this ability throughout the microbial
community [77, 78]. Consequently, the application of liquid manure has to be taken into con-
sideration as a contributing factor to the development of infectious diseases from multi-resistant
11
bacteria [76, 79]. With many different pharmaceutical residues being mixed within the environ-
ment, toxicological effects from the compound mixture can differ from the exposure to single
substances alone. This mixture toxicity can be evaluated using bioassays in combination with
chemical analysis [80, 81, 82]. Where the chemical analysis can describe the abundance of
known chemicals, bioassays can give hints to mixture toxicity or indicate that there are chemi-
cals not yet covered by targeted analysis which cause a certain adverse effect [80]. Therefore,
bioassays in combination with chemical analysis can be used as a tool for the early identification
of evolving environmental threats from pharmaceutical residues.
Due to the pronounced entry of pharmaceutical residues through wastewater, more advanced
wastewater treatment techniques like membrane filtration, ozonation and activated carbon ad-
sorption are under evaluation [83, 84] or even applied (e. g. Switzerland: advanced treatment
in large and medium sized wastewater treatment plants financed by an extra duty of the in-
habitants) [85]. Furthermore, environmental risk assessment studies are now included in the
approval process of new pharmaceutical active ingredients.
1.3. Regulations of organic pollutants in the European Union
The guidance from the Stockholm Convention regarding the elimination and restriction of POPs
as well as monitoring approaches for emerging organic pollutants are reflected in directives from
the European Union (EU) which have to be translated into domestic legislation by the member
states. The EU water framework directive, set up in 2000, was established to preserve and
achieve a respectable water quality of all water bodies. Therefore, the directive defines cer-
tain quality endpoints covering biological, hydromorphological, physico-chemical and chemi-
cal endpoints. Moreover, a list of priority substances was released which covered already most
of the POPs that were listed in 2001 in the Stockholm Convention [86]. Limit values called envi-
ronmental quality standards (EQS) were introduced in 2008 for 33 priority substances [20, 87].
In case of exceeding these EQS, the respective member state has to implement measures to
reduce the burden of the respective substance in the aquatic environment [85].
Regarding pharmaceutical residues in water, the EU introduced mandatory studies on the envi-
ronmental impact of new pharmaceutical active compounds as part of the approval process in
2004. Nevertheless, the results from the environmental assessment may not affect market autho-
rization of new pharmaceuticals in any case [88]. The directive aimed to achieve a significant
improvement of the knowledge on environmental toxicity of new pharmaceutical compounds al-
though this guidance is not applicable to pharmaceuticals that have been approved already [85].
Since 2013, the list of priority substances was expanded by 12 compounds and some EQS-
values were reduced. Additionally, pharmaceutical residues were addressed for the first time by
12
introducing guidance to the European Commission to set up a watch list with a maximum of
10 substances that will have to be monitored throughout the EU [89]. Up until now, however,
the EU does not force any mandatory measures from the member states that would have to be
undertaken to lower the burden of pharmaceuticals in surface water.
Special focus is drawn on the quality of water intended for human consumption. The EU es-
tablished a drinking water directive in 1980 which was renewed in 1998. In contrast to the
water framework directive, the guidance for drinking water is more strict and introduces guid-
ing and limiting levels for inorganic and organic residues [90, 91]. It was acted with caution
as the allowed levels were set up to 20 times lower than the guidance from the World Health
Organization (WHO) [91, 92]. Moreover, in terms of organic pollutants, the directive sets
parameters predominantly for groups of compounds rather than for single substances. In com-
parison to the 1980s, the current drinking water directive does not further regulate the analytic
monitoring tools but sets boundaries for trueness, accuracy and limit of detection the applied
detection method has to achieve [91]. Consequently, single laboratories involved in the mon-
itoring of drinking water are free to apply alternative measurement techniques as long as they
achieve sufficient analytical quality. Restricted from drinking water is a whole group of organic
pesticides, a selection of four PAHs and some lower molecular organic compounds [91]. In
Germany, the EU drinking water directive was translated into national law by the drinking wa-
ter regulation in 2001 which has been revised several times since its release where its current
status was determined in August 2013 [93]. But even since 1975 Germany regulated drinking
water quality [94]. The levels stated in the current German drinking water regulation are equal
to most of the values set in the EU drinking water directive or are lower for a few parameters.
All in all, the legislation in the EU for the protection of the aquatic environment exhibits high
precaution for threats from already identified organic pollutants. Moreover, future threats from
emerging organic pollutant are being assessed to propose solutions for emerging threats. Nev-
ertheless, the continuous industrial development increases the number of organic chemicals
released to the environment which will always necessitate the adaption of legislation to new
identified chemical pollutants.
2. Theoretical background
2.1. Liquid chromatography
Liquid chromatography (LC) is a common approach to achieve separation of a mixture of com-
pounds which is of analytical interest. Even more important in environmental analysis, however,
13
is the separation of the analytes from matrix compounds which may already be partly realized
with a suitable laboratory cleanup. The importance of matrix separation depends on the an-
alytical detection technique which is coupled with the chromatography. Nevertheless, most
available detection techniques are not able to detect a mixture of compounds at the same time.
The working principle of LC is based on the different separation of compounds between two
distinct phases. Thus, chromatography can be seen as infinitely repeated separation experiments
between a stationary and a mobile phase resulting in a continuously operated separation. In liq-
uid chromatography, the stationary phase is usually a column with immobilized surface-active
material in small-particle form or less common a porous monolith [95]. The mobile phase in
case of reversed-phase chromatography usually is a mixture of organic solvent and pure water.
For chromatography, a compound mixture is administered in a small volume on the top of the
column and forced through the column by the liquid flow of the mobile phase. During the pas-
sage through the column, each analyte interacts with the mobile and the stationary phase which
is characteristic for each compound according to its distribution coefficient KX :
KX =cstat
cmob(2.1)
where cstat and cmob are the concentrations of the compound X in the stationary and the mobile
phase, respectively. Due to the different values of K and the continuously operated partition
between the two phases, the compound mixture becomes separated. Compounds with higher
affinity to the stationary phase and corresponding higher K-value elute later from the column
than compounds with lower affinity and smaller K-value. In this context, the longer a compound
needs for elution the higher its retention on the chromatographic column is. The diffusion
processes during liquid chromatography are well described by the van Deemter equation:
H = A+Bu+C ·u (2.2)
where H is the height equivalent of a theoretical plate (HETP), u is the flow velocity of the
mobile phase and A, B and C are diffusional terms that cause band broadening and the typical
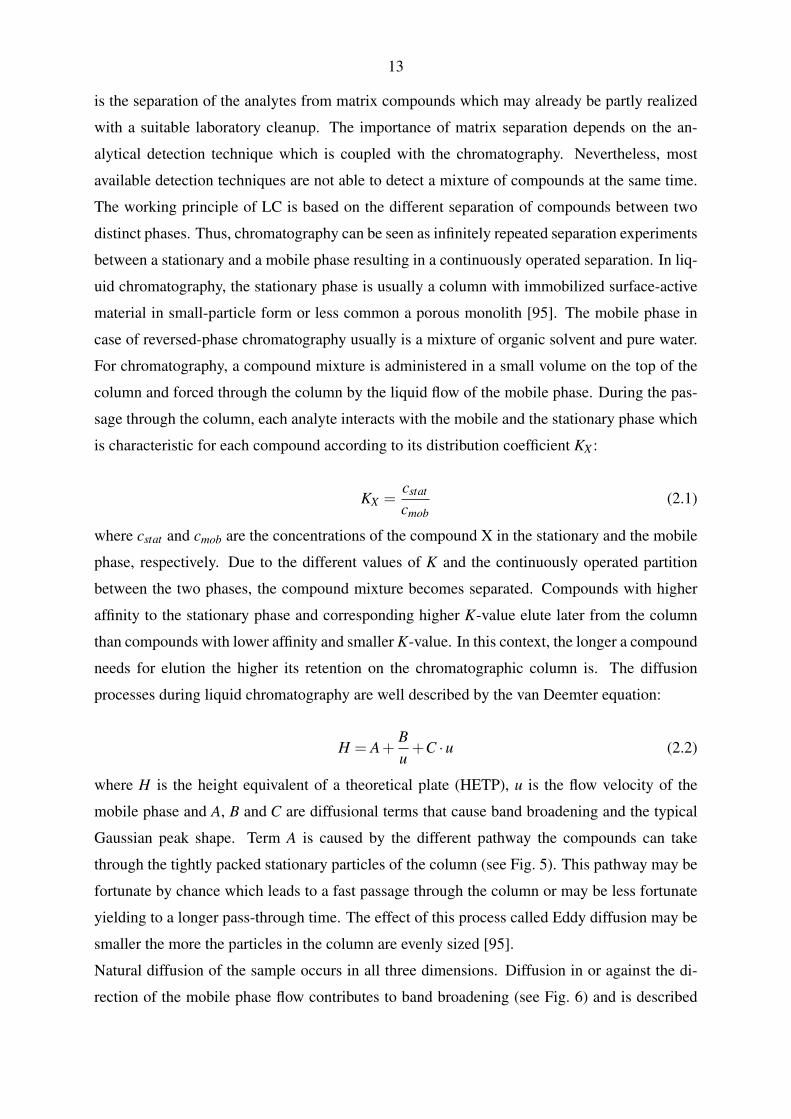
Gaussian peak shape. Term A is caused by the different pathway the compounds can take
through the tightly packed stationary particles of the column (see Fig. 5). This pathway may be
fortunate by chance which leads to a fast passage through the column or may be less fortunate
yielding to a longer pass-through time. The effect of this process called Eddy diffusion may be
smaller the more the particles in the column are evenly sized [95].
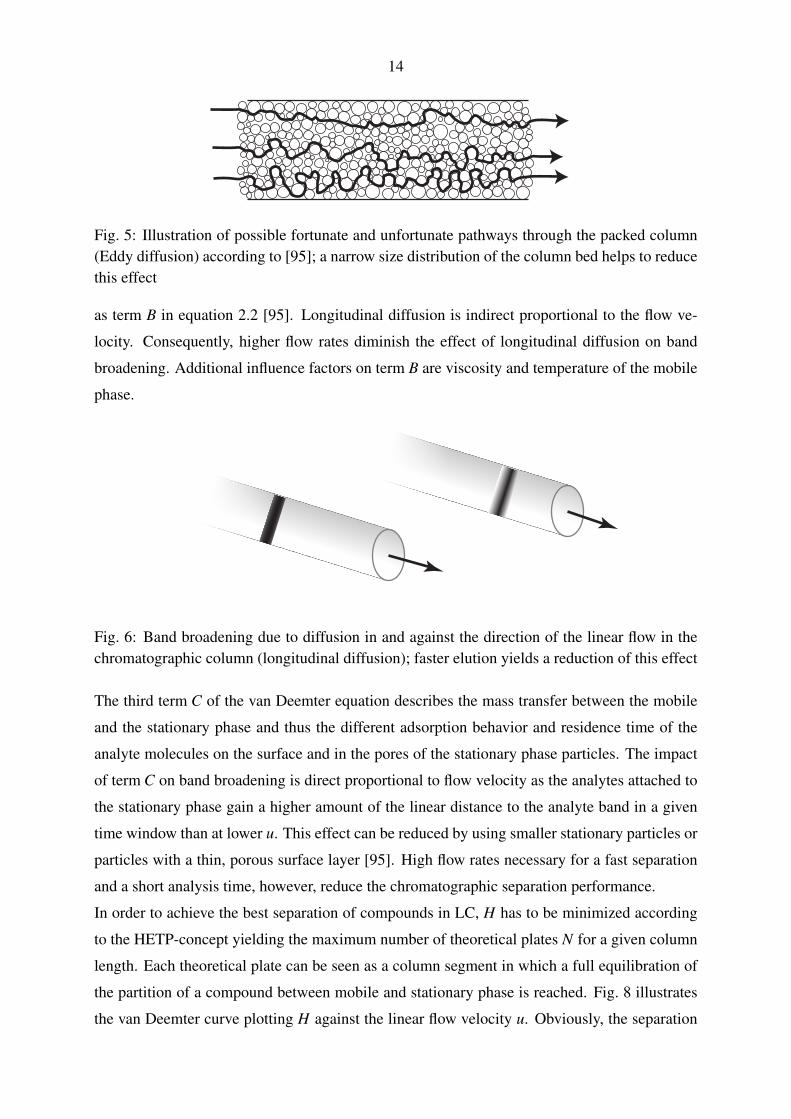
Natural diffusion of the sample occurs in all three dimensions. Diffusion in or against the di-
rection of the mobile phase flow contributes to band broadening (see Fig. 6) and is described
14
Fig. 5: Illustration of possible fortunate and unfortunate pathways through the packed column(Eddy diffusion) according to [95]; a narrow size distribution of the column bed helps to reducethis effect
as term B in equation 2.2 [95]. Longitudinal diffusion is indirect proportional to the flow ve-
locity. Consequently, higher flow rates diminish the effect of longitudinal diffusion on band
broadening. Additional influence factors on term B are viscosity and temperature of the mobile
phase.
Fig. 6: Band broadening due to diffusion in and against the direction of the linear flow in thechromatographic column (longitudinal diffusion); faster elution yields a reduction of this effect
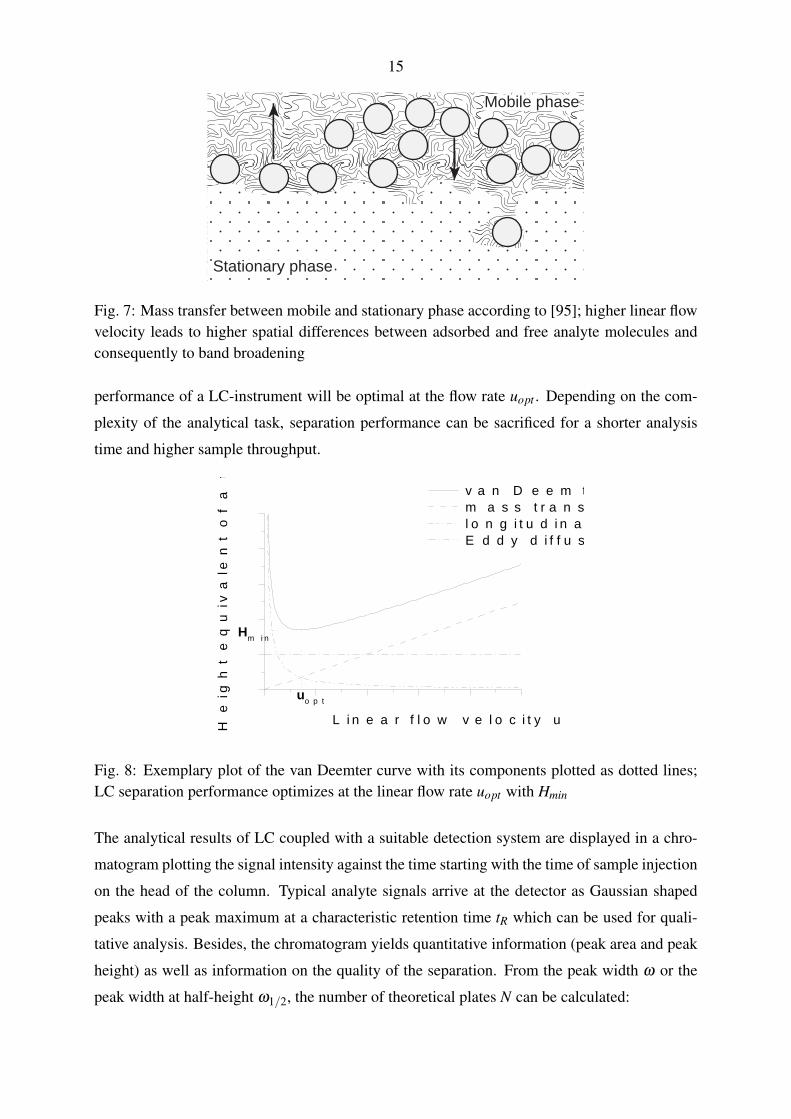
The third term C of the van Deemter equation describes the mass transfer between the mobile
and the stationary phase and thus the different adsorption behavior and residence time of the
analyte molecules on the surface and in the pores of the stationary phase particles. The impact
of term C on band broadening is direct proportional to flow velocity as the analytes attached to
the stationary phase gain a higher amount of the linear distance to the analyte band in a given
time window than at lower u. This effect can be reduced by using smaller stationary particles or
particles with a thin, porous surface layer [95]. High flow rates necessary for a fast separation
and a short analysis time, however, reduce the chromatographic separation performance.
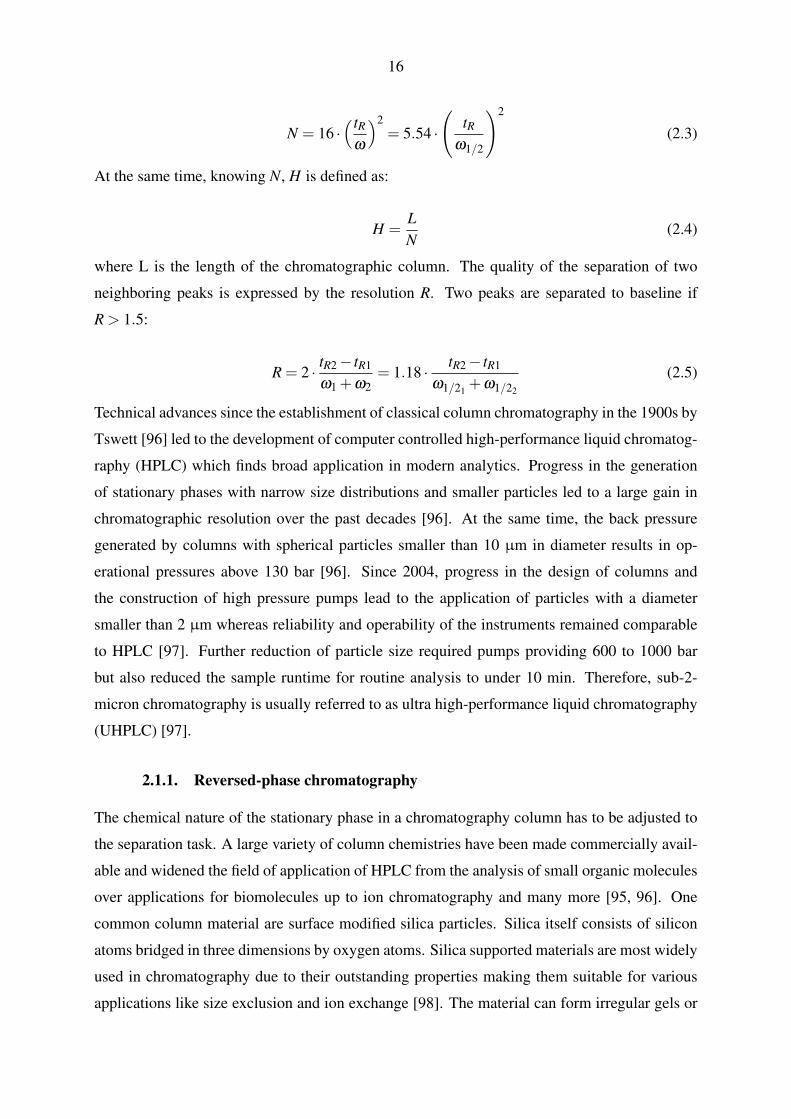
In order to achieve the best separation of compounds in LC, H has to be minimized according
to the HETP-concept yielding the maximum number of theoretical plates N for a given column
length. Each theoretical plate can be seen as a column segment in which a full equilibration of
the partition of a compound between mobile and stationary phase is reached. Fig. 8 illustrates
the van Deemter curve plotting H against the linear flow velocity u. Obviously, the separation
15
Mobile phase
Stationary phase
Fig. 7: Mass transfer between mobile and stationary phase according to [95]; higher linear flowvelocity leads to higher spatial differences between adsorbed and free analyte molecules andconsequently to band broadening
performance of a LC-instrument will be optimal at the flow rate uopt . Depending on the com-
plexity of the analytical task, separation performance can be sacrificed for a shorter analysis
time and higher sample throughput.
u o p t
Heigh
t equ
ivalen
t of a
theo
retica
l plate
H
L i n e a r f l o w v e l o c i t y u
v a n D e e m t e r c u r v e m a s s t r a n s f e r l o n g i t u d i n a l d i f f u s i o n E d d y d i f f u s i o n
H m i n
Fig. 8: Exemplary plot of the van Deemter curve with its components plotted as dotted lines;LC separation performance optimizes at the linear flow rate uopt with Hmin
The analytical results of LC coupled with a suitable detection system are displayed in a chro-
matogram plotting the signal intensity against the time starting with the time of sample injection
on the head of the column. Typical analyte signals arrive at the detector as Gaussian shaped
peaks with a peak maximum at a characteristic retention time tR which can be used for quali-
tative analysis. Besides, the chromatogram yields quantitative information (peak area and peak
height) as well as information on the quality of the separation. From the peak width ω or the
peak width at half-height ω1/2, the number of theoretical plates N can be calculated:
16
N = 16 ·(tR
ω
)2= 5.54 ·
(tR
ω1/2
)2
(2.3)
At the same time, knowing N, H is defined as:
H =LN
(2.4)
where L is the length of the chromatographic column. The quality of the separation of two
neighboring peaks is expressed by the resolution R. Two peaks are separated to baseline if
R > 1.5:
R = 2 · tR2 − tR1
ω1 +ω2= 1.18 · tR2 − tR1
ω1/21 +ω1/22
(2.5)
Technical advances since the establishment of classical column chromatography in the 1900s by
Tswett [96] led to the development of computer controlled high-performance liquid chromatog-
raphy (HPLC) which finds broad application in modern analytics. Progress in the generation
of stationary phases with narrow size distributions and smaller particles led to a large gain in
chromatographic resolution over the past decades [96]. At the same time, the back pressure
generated by columns with spherical particles smaller than 10 µm in diameter results in op-
erational pressures above 130 bar [96]. Since 2004, progress in the design of columns and
the construction of high pressure pumps lead to the application of particles with a diameter
smaller than 2 µm whereas reliability and operability of the instruments remained comparable
to HPLC [97]. Further reduction of particle size required pumps providing 600 to 1000 bar
but also reduced the sample runtime for routine analysis to under 10 min. Therefore, sub-2-
micron chromatography is usually referred to as ultra high-performance liquid chromatography
(UHPLC) [97].
2.1.1. Reversed-phase chromatography
The chemical nature of the stationary phase in a chromatography column has to be adjusted to
the separation task. A large variety of column chemistries have been made commercially avail-
able and widened the field of application of HPLC from the analysis of small organic molecules
over applications for biomolecules up to ion chromatography and many more [95, 96]. One
common column material are surface modified silica particles. Silica itself consists of silicon
atoms bridged in three dimensions by oxygen atoms. Silica supported materials are most widely
used in chromatography due to their outstanding properties making them suitable for various
applications like size exclusion and ion exchange [98]. The material can form irregular gels or
17
spherical particles in dependence on the production process such as the hydrolysis of sodium
silicate or the polycondensation of polyethoxysiloxane with subsequent dehydration [95]. The
reactive hydroxy-groups at the surface of the material allow chemical bonding to modify the
surface permanently and thus enable numerous stationary phases [95, 98]. For the analysis of
aqueous solutions with small organic molecules, biomolecules, pharmaceutical active ingredi-
ents or food extracts, silica modified with octadecylsilane (ODS), named C-18 chemistry, found
wide distribution [99]. Therefore, the reactive hydroxy groups of porous silica react with the
highly hydrophobic chloro(dimethyl)octadecylsilane. This results in an hydrophobized silica
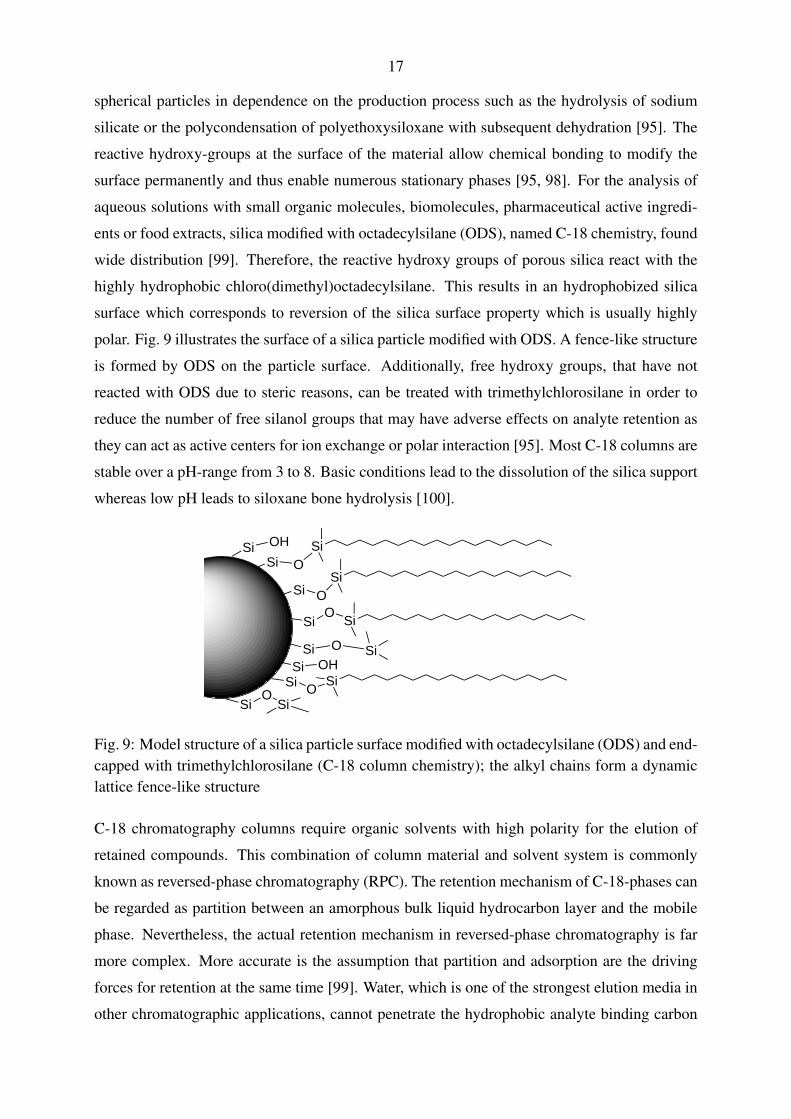
surface which corresponds to reversion of the silica surface property which is usually highly
polar. Fig. 9 illustrates the surface of a silica particle modified with ODS. A fence-like structure
is formed by ODS on the particle surface. Additionally, free hydroxy groups, that have not
reacted with ODS due to steric reasons, can be treated with trimethylchlorosilane in order to
reduce the number of free silanol groups that may have adverse effects on analyte retention as
they can act as active centers for ion exchange or polar interaction [95]. Most C-18 columns are
stable over a pH-range from 3 to 8. Basic conditions lead to the dissolution of the silica support
whereas low pH leads to siloxane bone hydrolysis [100].
SiSi O
SiSi O
SiSiO
Si O Si
SiO
Si
SiSi O
Si OH
Si OH
Fig. 9: Model structure of a silica particle surface modified with octadecylsilane (ODS) and end-capped with trimethylchlorosilane (C-18 column chemistry); the alkyl chains form a dynamiclattice fence-like structure
C-18 chromatography columns require organic solvents with high polarity for the elution of
retained compounds. This combination of column material and solvent system is commonly
known as reversed-phase chromatography (RPC). The retention mechanism of C-18-phases can
be regarded as partition between an amorphous bulk liquid hydrocarbon layer and the mobile
phase. Nevertheless, the actual retention mechanism in reversed-phase chromatography is far
more complex. More accurate is the assumption that partition and adsorption are the driving
forces for retention at the same time [99]. Water, which is one of the strongest elution media in
other chromatographic applications, cannot penetrate the hydrophobic analyte binding carbon
18
layer and thus is the weakest eluting solvent in RPC [95]. Consequently, highly polar water
miscible organic solvents like methanol or acetonitrile are used for elution as they can penetrate
the hydrophobic layer. The retention on C-18 columns increases with the hydrophobicity of the
analytes, bonding density of alkyl chains and the degree of end-capping [95]. Highly retentive
C-18 columns are needed for the separation of polar compounds that have only weak interaction
with the stationary phase. Retention of polar compounds in RPC can be further increased by
distinct silanol activity leading to hydrogen bond acceptor or cation exchange activity in acidic
or basic environment, respectively [101].
Typically, elution in RPC is carried out with a linear gradient between an aqueous mobile phase
(solvent A) and an organic mobile phase (solvent B) rather than with a fixed solvent mixture
(isocratic elution). Binary gradient pump equipment allows the adjustment of solvent composi-
tion at the start and the end of the separation as well as the gradient steepness. The continuous
increase of organic solvent during separation reduces chromatographic issues like peak tailing
and reduces the peak width. At the same time, RPC methods with gradient elution can be used
for various analytes without gradient optimization in many cases [102].
2.1.2. Retention Time Index
As already mentioned in section 2.1., the retention time tR reveals qualitative information which
can be used for the identification of unknown substances or the validation of already known
substances. The retention time, however, strongly depends on the conditions of the chromato-
graphic system including dead volume, column chemistry, separation temperature and solvents.
Therefore, the normalization of retention time is necessary in order to apply it as a charac-
teristic parameter in databases which can be used in turn for compound identification. In gas
chromatography, the Kováts retention index was introduced in the 1950s and normalized the
retention time to n-alkanes eluting before and after the corresponding substance [103]. In RPC,
however, due to the rather complex influence factors on analyte retention (see section 2.1.1.),
various approaches and models exist for the normalization of retention time in order to make it
available as characteristic criterion [104, 105, 106]. Additionally, the introduction of LC cou-
pled mass spectrometry as detector for liquid chromatography gave access to the exact mass
of eluting analytes which is enough information for doubtless compound information for many
applications. Consequently, the efforts for establishing a universally applicable parameter for
the complex retention in RPC lost importance.
Nevertheless, for upcoming approaches with non-target analysis any further qualitative infor-
mation on unknown signals is welcome. For non-ionic analytes, the retention-time index (RTI)
reveals a possibility to predict the retention time on a chromatography system based on the
19
octanol-water partition coefficient (KOW or P-value) [107, 108]. If quantitative analysis is car-
ried out at the same time for multiple compounds, the application of RTI does not require any
further calibration data as the retention information of the calibration standards is sufficient. The
RTI is basically a normalization of the logP-values of the investigated analytes on a linear scale
from 50 to 150. Therefore, the first and last eluting compound are assigned to an RTI-value of
50 and 150, respectively. According to the normalization, the RTI-value of a compound which
is eluting in between the first and last eluting compound can be calculated:
RT Ii = (logPi − logPi−1) ·[
150−50logPmax − logPmin
]+RT Ii−1 (2.6)
where the index i indicates the compounds in eluting order, logPmax and logPmin are the maxi-
mum and minimum values of the partition coefficient within the calibration, respectively (which
are usually the first and last eluting compounds in RPC). In RPC applications with non-ionic an-
alytes, the RTI-value is linearly correlated with retention time. The correlation quality depends
on the structural similarity of the analyzed compounds [102]. Consequently, the RTI sets up
a correlation between retention time of unknown signals and their corresponding logP-value.
In combination with high resolution mass spectrometry, the measured exact mass and logP-
value of unknown compounds are available at the same time for database related compound
identification.
2.2. Quadrupol time-of-flight mass spectrometry
Since the 1950s, mass spectrometry (MS) evolved into an essential analytical technique that
found wide application in chemistry, biochemistry, pharmaceutical science and medicine as
well as in related disciplines [109]. The performance of mass spectrometers has been increased
and today commercially available high resolution mass spectrometry (HRMS) allows for the
calculation of sum formulae of the detected ions from their measured mass deficiency. The
time-of-flight mass spectrometer (TOF-MS) is one example for a mass analyzer with HRMS
capabilities. The basic working principle of this type of instrument is the fact that ions with dif-
ferent mass-to-charge ratio (m/z) need different time to travel through a field-free drift space.
This working principle, however, dictates that TOF-measurements have to be carried out dis-
continously. Therefore, the application of TOF-MS was limited since its commercialization in
the mid 1950s [109]. In the 1980s, the development of TOF detection was forced again due to
the development of the pulsed ionization technique matrix-assisted laser desorption/ionization
(MALDI) [109]. Furthermore, the subsequent introduction of TOF-MS with orthogonal accel-
eration allowed the coupling with ionization techniques that produce constant ion beams like
20
electrospray ionization [110].
The relationship between the time-of-flight and m/z results from considering that the energy
uptake Eel of an ion with the mass mi and the charge of z elementary charges e travelling
through the potential U . Eel corresponds to the kinetic energy Ekin of the translatory motion:
Eel = e · z ·U =12·m · v2 = Ekin (2.7)
Consequently, the velocity of the ion is defined as:
v =
√2 · e · z ·U
mi(2.8)
The TOF-MS can be seen as a time measurement instrument that determines the drift time t of
an ion for the distance s:
t =sv=
s√2 · e · z ·U
mi
(2.9)
After transformation of equation 2.9, m/z can be determined with the time-of-flight and the
instrument parameters U and s:
mi
z=
2 · eUt2
s2 (2.10)
In TOF-MS instruments with orthogonal acceleration, ion packets are injected from a constant
ion beam by a pulsed electric field (pusher) with a frequency of several kilohertz (kHz). The
field-free drift space in most modern TOF analyzers is designed with either a single or dou-
ble reflection stage (ion mirror) due to different reasons. At first, the size of the instrument
compartment can be reduced due to the doubling of the drift space back and forth within one
tube. Secondly, the mass resolution improves due to the increased flight distance. The direct
dependence of the flight time t and the drift space s according to equation 2.9 leads to a longer
time window between the impact of ions with different m/z on the detector. Therefore, the
electronics can resolve ions with smaller differences in their m/z-value. The most important
advantage from at least a single ion reflection stage within a TOF-tube is the compensation
of initial energy and spatial spread of the ions at the state of extraction from the constant ion
beam by the pusher [109, 110]. Briefly, the ions pushed into the TOF tube dive into the ion
mirror with different depths according to their kinetic energy. Ions with higher kinetic energy
stay longer within the retarding field than ions with lower energy which leads to a time-of-
flight correction that tremendously increases TOF mass resolution [109]. Additionally, the ion
mirror leads to focusing of the ion beam which projects different initial ion positions onto a
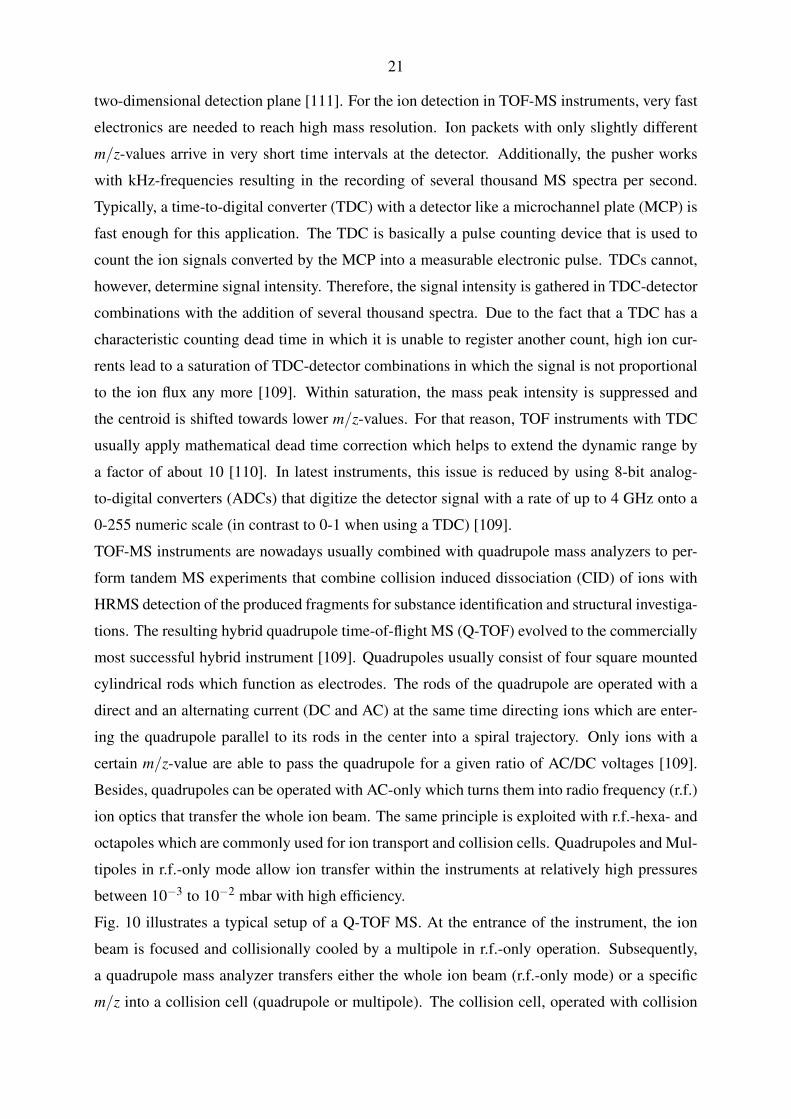
21
two-dimensional detection plane [111]. For the ion detection in TOF-MS instruments, very fast
electronics are needed to reach high mass resolution. Ion packets with only slightly different
m/z-values arrive in very short time intervals at the detector. Additionally, the pusher works
with kHz-frequencies resulting in the recording of several thousand MS spectra per second.
Typically, a time-to-digital converter (TDC) with a detector like a microchannel plate (MCP) is
fast enough for this application. The TDC is basically a pulse counting device that is used to
count the ion signals converted by the MCP into a measurable electronic pulse. TDCs cannot,
however, determine signal intensity. Therefore, the signal intensity is gathered in TDC-detector
combinations with the addition of several thousand spectra. Due to the fact that a TDC has a
characteristic counting dead time in which it is unable to register another count, high ion cur-
rents lead to a saturation of TDC-detector combinations in which the signal is not proportional
to the ion flux any more [109]. Within saturation, the mass peak intensity is suppressed and
the centroid is shifted towards lower m/z-values. For that reason, TOF instruments with TDC
usually apply mathematical dead time correction which helps to extend the dynamic range by
a factor of about 10 [110]. In latest instruments, this issue is reduced by using 8-bit analog-
to-digital converters (ADCs) that digitize the detector signal with a rate of up to 4 GHz onto a
0-255 numeric scale (in contrast to 0-1 when using a TDC) [109].
TOF-MS instruments are nowadays usually combined with quadrupole mass analyzers to per-
form tandem MS experiments that combine collision induced dissociation (CID) of ions with
HRMS detection of the produced fragments for substance identification and structural investiga-
tions. The resulting hybrid quadrupole time-of-flight MS (Q-TOF) evolved to the commercially
most successful hybrid instrument [109]. Quadrupoles usually consist of four square mounted
cylindrical rods which function as electrodes. The rods of the quadrupole are operated with a
direct and an alternating current (DC and AC) at the same time directing ions which are enter-
ing the quadrupole parallel to its rods in the center into a spiral trajectory. Only ions with a
certain m/z-value are able to pass the quadrupole for a given ratio of AC/DC voltages [109].
Besides, quadrupoles can be operated with AC-only which turns them into radio frequency (r.f.)
ion optics that transfer the whole ion beam. The same principle is exploited with r.f.-hexa- and
octapoles which are commonly used for ion transport and collision cells. Quadrupoles and Mul-
tipoles in r.f.-only mode allow ion transfer within the instruments at relatively high pressures
between 10−3 to 10−2 mbar with high efficiency.
Fig. 10 illustrates a typical setup of a Q-TOF MS. At the entrance of the instrument, the ion
beam is focused and collisionally cooled by a multipole in r.f.-only operation. Subsequently,
a quadrupole mass analyzer transfers either the whole ion beam (r.f.-only mode) or a specific
m/z into a collision cell (quadrupole or multipole). The collision cell, operated with collision
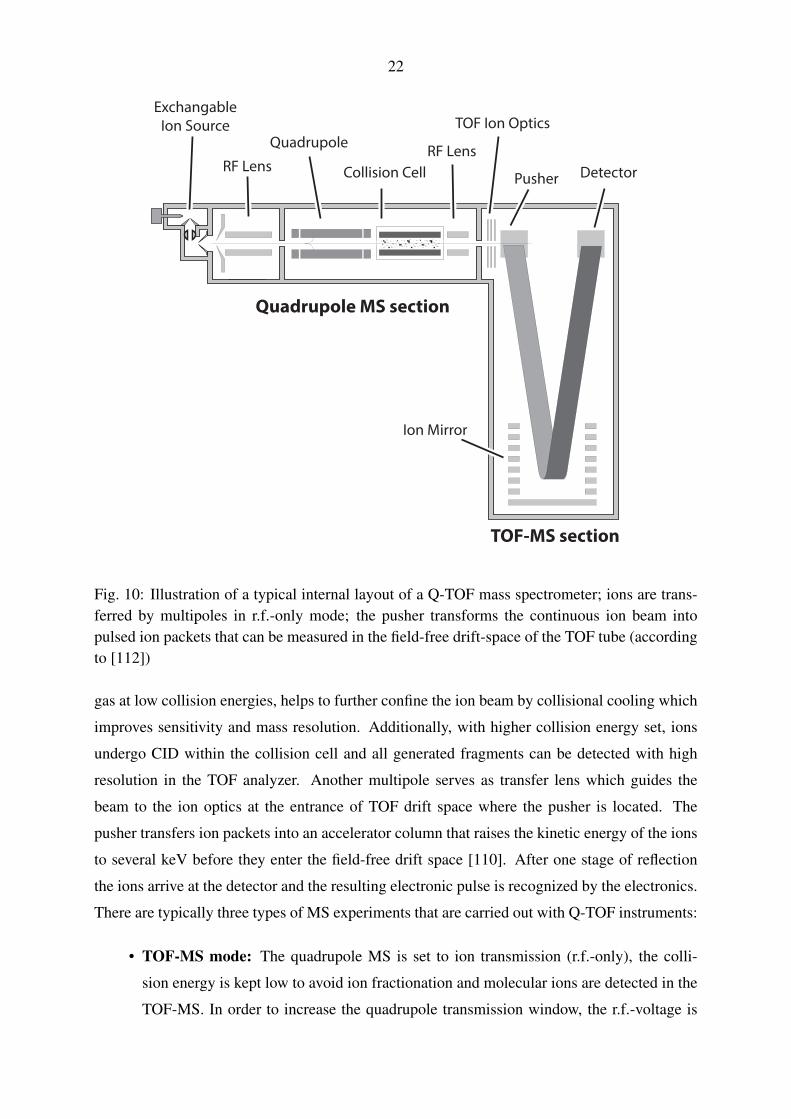
22
Quadrupole MS section
TOF-MS section
Collision CellRF LensQuadrupole
RF Lens
ExchangableIon Source
DetectorPusher
TOF Ion Optics
Ion Mirror
Fig. 10: Illustration of a typical internal layout of a Q-TOF mass spectrometer; ions are trans-ferred by multipoles in r.f.-only mode; the pusher transforms the continuous ion beam intopulsed ion packets that can be measured in the field-free drift-space of the TOF tube (accordingto [112])
gas at low collision energies, helps to further confine the ion beam by collisional cooling which
improves sensitivity and mass resolution. Additionally, with higher collision energy set, ions
undergo CID within the collision cell and all generated fragments can be detected with high
resolution in the TOF analyzer. Another multipole serves as transfer lens which guides the
beam to the ion optics at the entrance of TOF drift space where the pusher is located. The
pusher transfers ion packets into an accelerator column that raises the kinetic energy of the ions
to several keV before they enter the field-free drift space [110]. After one stage of reflection
the ions arrive at the detector and the resulting electronic pulse is recognized by the electronics.
There are typically three types of MS experiments that are carried out with Q-TOF instruments:
• TOF-MS mode: The quadrupole MS is set to ion transmission (r.f.-only), the colli-
sion energy is kept low to avoid ion fractionation and molecular ions are detected in the
TOF-MS. In order to increase the quadrupole transmission window, the r.f.-voltage is
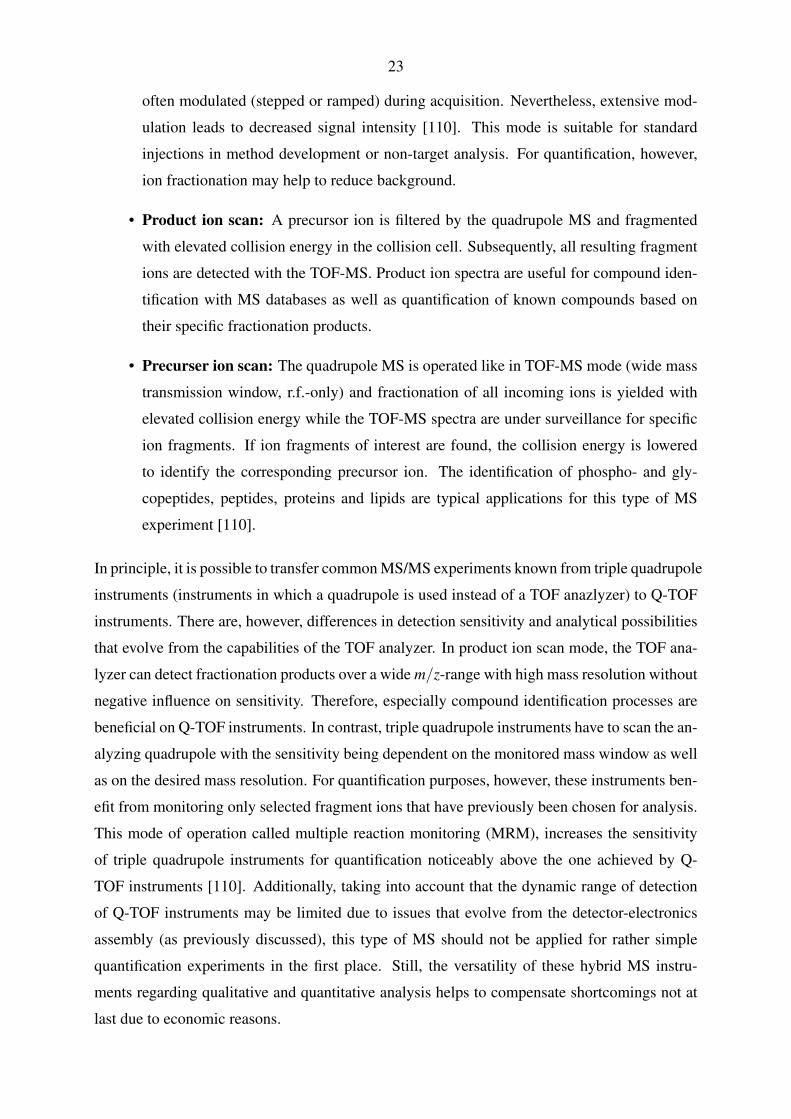
23
often modulated (stepped or ramped) during acquisition. Nevertheless, extensive mod-
ulation leads to decreased signal intensity [110]. This mode is suitable for standard
injections in method development or non-target analysis. For quantification, however,
ion fractionation may help to reduce background.
• Product ion scan: A precursor ion is filtered by the quadrupole MS and fragmented
with elevated collision energy in the collision cell. Subsequently, all resulting fragment
ions are detected with the TOF-MS. Product ion spectra are useful for compound iden-
tification with MS databases as well as quantification of known compounds based on
their specific fractionation products.
• Precurser ion scan: The quadrupole MS is operated like in TOF-MS mode (wide mass
transmission window, r.f.-only) and fractionation of all incoming ions is yielded with
elevated collision energy while the TOF-MS spectra are under surveillance for specific
ion fragments. If ion fragments of interest are found, the collision energy is lowered
to identify the corresponding precursor ion. The identification of phospho- and gly-
copeptides, peptides, proteins and lipids are typical applications for this type of MS
experiment [110].
In principle, it is possible to transfer common MS/MS experiments known from triple quadrupole
instruments (instruments in which a quadrupole is used instead of a TOF anazlyzer) to Q-TOF
instruments. There are, however, differences in detection sensitivity and analytical possibilities
that evolve from the capabilities of the TOF analyzer. In product ion scan mode, the TOF ana-
lyzer can detect fractionation products over a wide m/z-range with high mass resolution without
negative influence on sensitivity. Therefore, especially compound identification processes are
beneficial on Q-TOF instruments. In contrast, triple quadrupole instruments have to scan the an-
alyzing quadrupole with the sensitivity being dependent on the monitored mass window as well
as on the desired mass resolution. For quantification purposes, however, these instruments ben-
efit from monitoring only selected fragment ions that have previously been chosen for analysis.
This mode of operation called multiple reaction monitoring (MRM), increases the sensitivity
of triple quadrupole instruments for quantification noticeably above the one achieved by Q-
TOF instruments [110]. Additionally, taking into account that the dynamic range of detection
of Q-TOF instruments may be limited due to issues that evolve from the detector-electronics
assembly (as previously discussed), this type of MS should not be applied for rather simple
quantification experiments in the first place. Still, the versatility of these hybrid MS instru-
ments regarding qualitative and quantitative analysis helps to compensate shortcomings not at
last due to economic reasons.
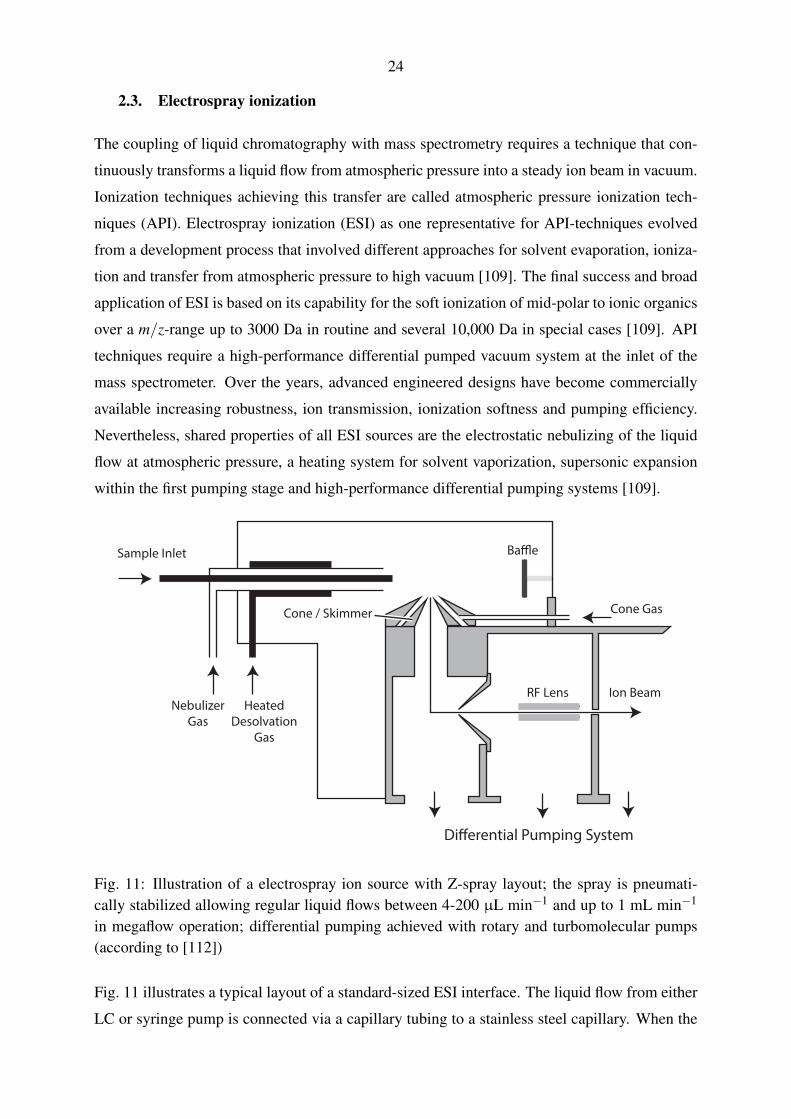
24
2.3. Electrospray ionization
The coupling of liquid chromatography with mass spectrometry requires a technique that con-
tinuously transforms a liquid flow from atmospheric pressure into a steady ion beam in vacuum.
Ionization techniques achieving this transfer are called atmospheric pressure ionization tech-
niques (API). Electrospray ionization (ESI) as one representative for API-techniques evolved
from a development process that involved different approaches for solvent evaporation, ioniza-
tion and transfer from atmospheric pressure to high vacuum [109]. The final success and broad
application of ESI is based on its capability for the soft ionization of mid-polar to ionic organics
over a m/z-range up to 3000 Da in routine and several 10,000 Da in special cases [109]. API
techniques require a high-performance differential pumped vacuum system at the inlet of the
mass spectrometer. Over the years, advanced engineered designs have become commercially
available increasing robustness, ion transmission, ionization softness and pumping efficiency.
Nevertheless, shared properties of all ESI sources are the electrostatic nebulizing of the liquid
flow at atmospheric pressure, a heating system for solvent vaporization, supersonic expansion
within the first pumping stage and high-performance differential pumping systems [109].
NebulizerGas
HeatedDesolvation
Gas
Sample Inlet
Ion BeamRF Lens
Cone / Skimmer Cone Gas
Fig. 11: Illustration of a electrospray ion source with Z-spray layout; the spray is pneumati-cally stabilized allowing regular liquid flows between 4-200 µL min−1 and up to 1 mL min−1
in megaflow operation; differential pumping achieved with rotary and turbomolecular pumps(according to [112])
Fig. 11 illustrates a typical layout of a standard-sized ESI interface. The liquid flow from either
LC or syringe pump is connected via a capillary tubing to a stainless steel capillary. When the
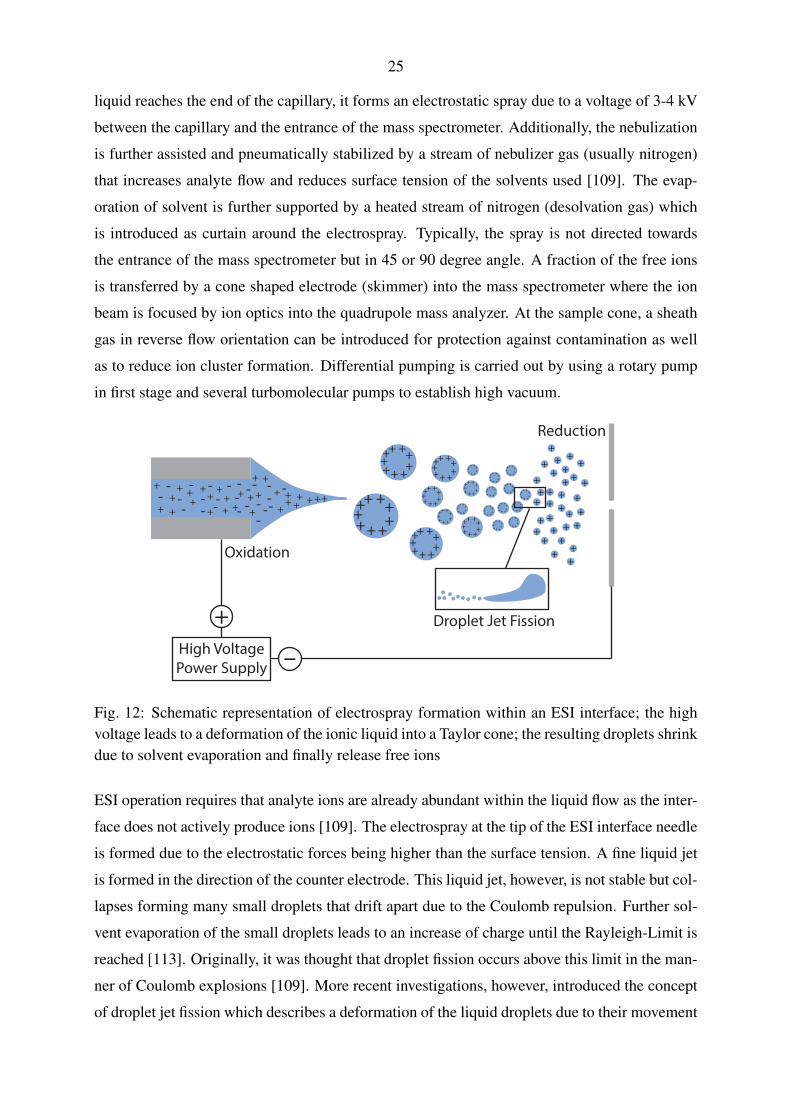
25
liquid reaches the end of the capillary, it forms an electrostatic spray due to a voltage of 3-4 kV
between the capillary and the entrance of the mass spectrometer. Additionally, the nebulization
is further assisted and pneumatically stabilized by a stream of nebulizer gas (usually nitrogen)
that increases analyte flow and reduces surface tension of the solvents used [109]. The evap-
oration of solvent is further supported by a heated stream of nitrogen (desolvation gas) which
is introduced as curtain around the electrospray. Typically, the spray is not directed towards
the entrance of the mass spectrometer but in 45 or 90 degree angle. A fraction of the free ions
is transferred by a cone shaped electrode (skimmer) into the mass spectrometer where the ion
beam is focused by ion optics into the quadrupole mass analyzer. At the sample cone, a sheath
gas in reverse flow orientation can be introduced for protection against contamination as well
as to reduce ion cluster formation. Differential pumping is carried out by using a rotary pump
in first stage and several turbomolecular pumps to establish high vacuum.
++++ +
++++
++++ +
++++
++++ +
++++
++++ +
++++
++++ +
++++
++++ +
++++
++++ +
++++
++++ +
++++
++++ +
++++
++++ +
++++
++++ +
++++
++++ +
++++
++++ +
++++
++++ +
++++
++++ +
++++
++++ +
++++
++++ +
++++
++++ +
++++
++++ +
+++++
+++ +
++++
++ +
+
++
+
+
+
+
+
+
+++
+
+
+
+++
+
+
+
+
++
+
+
++
Droplet Jet Fission
High VoltagePower Supply -
+
Oxidation
Reduction
+
+
+
+
+
+++ +
+-
++-
---
---
--
- ---
-
--
-+
+ +
++
+
-----
- ++
+ ++ +
+
+
+
++
Fig. 12: Schematic representation of electrospray formation within an ESI interface; the highvoltage leads to a deformation of the ionic liquid into a Taylor cone; the resulting droplets shrinkdue to solvent evaporation and finally release free ions
ESI operation requires that analyte ions are already abundant within the liquid flow as the inter-
face does not actively produce ions [109]. The electrospray at the tip of the ESI interface needle
is formed due to the electrostatic forces being higher than the surface tension. A fine liquid jet
is formed in the direction of the counter electrode. This liquid jet, however, is not stable but col-
lapses forming many small droplets that drift apart due to the Coulomb repulsion. Further sol-
vent evaporation of the small droplets leads to an increase of charge until the Rayleigh-Limit is
reached [113]. Originally, it was thought that droplet fission occurs above this limit in the man-
ner of Coulomb explosions [109]. More recent investigations, however, introduced the concept
of droplet jet fission which describes a deformation of the liquid droplets due to their movement
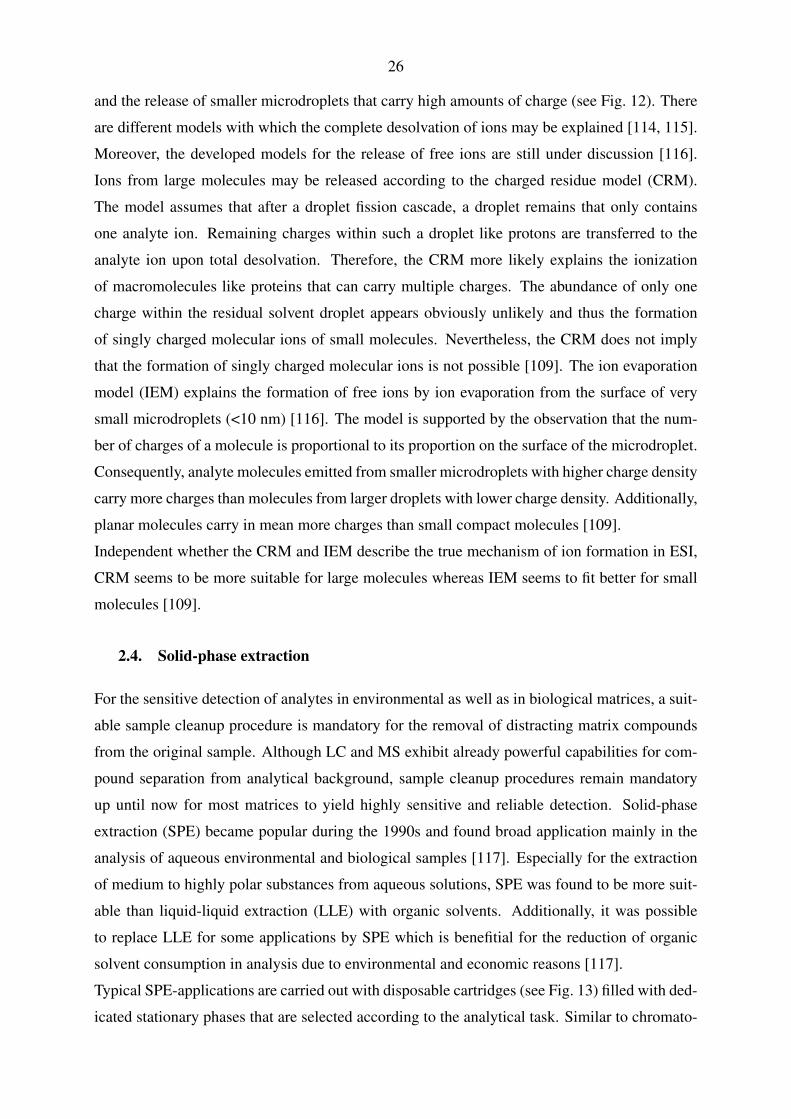
26
and the release of smaller microdroplets that carry high amounts of charge (see Fig. 12). There
are different models with which the complete desolvation of ions may be explained [114, 115].
Moreover, the developed models for the release of free ions are still under discussion [116].
Ions from large molecules may be released according to the charged residue model (CRM).
The model assumes that after a droplet fission cascade, a droplet remains that only contains
one analyte ion. Remaining charges within such a droplet like protons are transferred to the
analyte ion upon total desolvation. Therefore, the CRM more likely explains the ionization
of macromolecules like proteins that can carry multiple charges. The abundance of only one
charge within the residual solvent droplet appears obviously unlikely and thus the formation
of singly charged molecular ions of small molecules. Nevertheless, the CRM does not imply
that the formation of singly charged molecular ions is not possible [109]. The ion evaporation
model (IEM) explains the formation of free ions by ion evaporation from the surface of very
small microdroplets (<10 nm) [116]. The model is supported by the observation that the num-
ber of charges of a molecule is proportional to its proportion on the surface of the microdroplet.
Consequently, analyte molecules emitted from smaller microdroplets with higher charge density
carry more charges than molecules from larger droplets with lower charge density. Additionally,
planar molecules carry in mean more charges than small compact molecules [109].
Independent whether the CRM and IEM describe the true mechanism of ion formation in ESI,
CRM seems to be more suitable for large molecules whereas IEM seems to fit better for small
molecules [109].
2.4. Solid-phase extraction
For the sensitive detection of analytes in environmental as well as in biological matrices, a suit-
able sample cleanup procedure is mandatory for the removal of distracting matrix compounds
from the original sample. Although LC and MS exhibit already powerful capabilities for com-
pound separation from analytical background, sample cleanup procedures remain mandatory
up until now for most matrices to yield highly sensitive and reliable detection. Solid-phase
extraction (SPE) became popular during the 1990s and found broad application mainly in the
analysis of aqueous environmental and biological samples [117]. Especially for the extraction
of medium to highly polar substances from aqueous solutions, SPE was found to be more suit-
able than liquid-liquid extraction (LLE) with organic solvents. Additionally, it was possible
to replace LLE for some applications by SPE which is benefitial for the reduction of organic
solvent consumption in analysis due to environmental and economic reasons [117].
Typical SPE-applications are carried out with disposable cartridges (see Fig. 13) filled with ded-
icated stationary phases that are selected according to the analytical task. Similar to chromato-
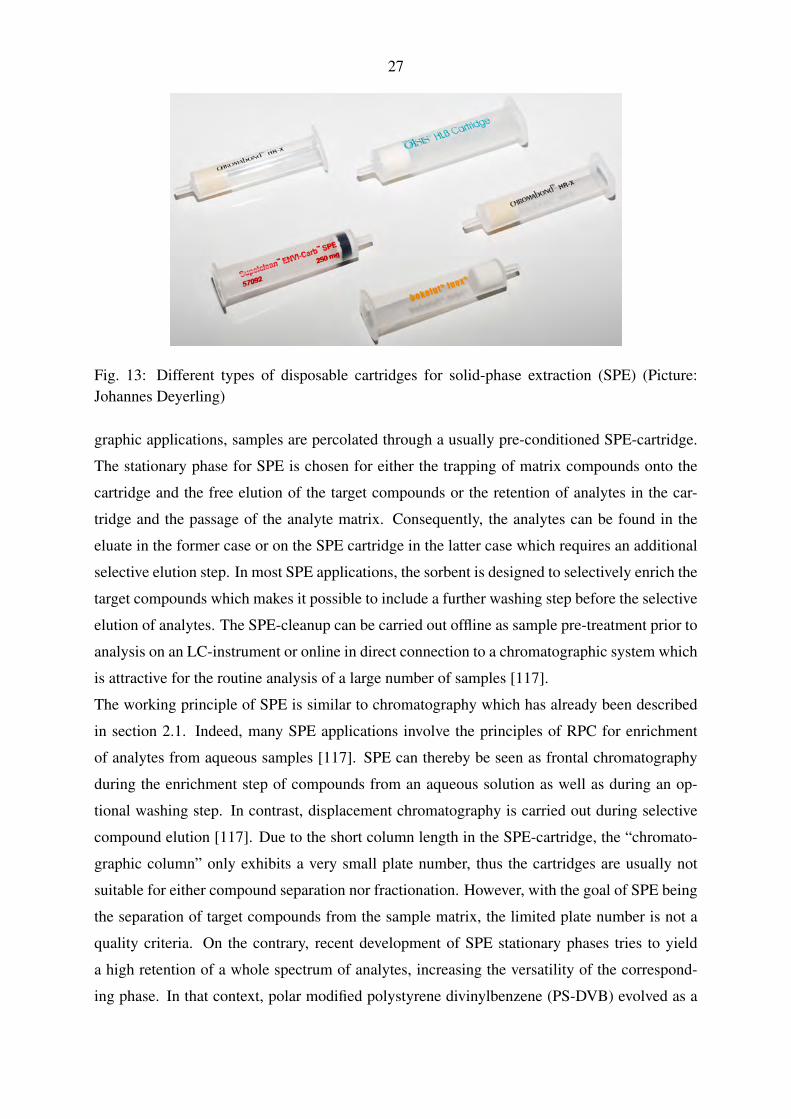
27
Fig. 13: Different types of disposable cartridges for solid-phase extraction (SPE) (Picture:Johannes Deyerling)
graphic applications, samples are percolated through a usually pre-conditioned SPE-cartridge.
The stationary phase for SPE is chosen for either the trapping of matrix compounds onto the
cartridge and the free elution of the target compounds or the retention of analytes in the car-
tridge and the passage of the analyte matrix. Consequently, the analytes can be found in the
eluate in the former case or on the SPE cartridge in the latter case which requires an additional
selective elution step. In most SPE applications, the sorbent is designed to selectively enrich the
target compounds which makes it possible to include a further washing step before the selective
elution of analytes. The SPE-cleanup can be carried out offline as sample pre-treatment prior to
analysis on an LC-instrument or online in direct connection to a chromatographic system which
is attractive for the routine analysis of a large number of samples [117].
The working principle of SPE is similar to chromatography which has already been described
in section 2.1. Indeed, many SPE applications involve the principles of RPC for enrichment
of analytes from aqueous samples [117]. SPE can thereby be seen as frontal chromatography
during the enrichment step of compounds from an aqueous solution as well as during an op-
tional washing step. In contrast, displacement chromatography is carried out during selective
compound elution [117]. Due to the short column length in the SPE-cartridge, the “chromato-
graphic column” only exhibits a very small plate number, thus the cartridges are usually not
suitable for either compound separation nor fractionation. However, with the goal of SPE being
the separation of target compounds from the sample matrix, the limited plate number is not a
quality criteria. On the contrary, recent development of SPE stationary phases tries to yield
a high retention of a whole spectrum of analytes, increasing the versatility of the correspond-
ing phase. In that context, polar modified polystyrene divinylbenzene (PS-DVB) evolved as a
28
promising SPE sorbent for the reliable retention of medium to polar analytes that can be either
neutral or ionic. Sorbent beds like PS-DVB may not reach the requirements for application in
chromatography columns but SPE can benefit from their special selectivities [117].
The most important characteristics for the application of SPE in environmental analysis is the
breakthrough volume of analytes. This parameter determines the maximum possible aqueous
sample size that can be used and consequently the maximum achievable enrichment factor.
Therefore, the sorbent selectivity as well as the size of the SPE cartridge have to be adjusted
to reach the requirements of the analytical task. Method development to determine a suitable
SPE protocol, however, has to be carried out in many cases by a time consuming empirical
process. Nevertheless, information on the chemical and physical properties like polarity of the
target compounds assists with the preselection of promising SPE chemistries as well as with
the identification of starting points for the development of an elution protocol. Within certain
boundaries, the retention on hydrophobic SPE cartridges may be estimated from the logP-value
similar like described in section 2.1.2. Still, the retention estimation can only yield rough hints
and cannot replace empirical method optimization completely [117].
2.5. Analysis of catecholamines with LC-MS
NH2HO
HO
DopaminelogP -0.98
HO
NH
OHHO
EpinephrinelogP -1.20
HOOH
NH2
HO
NorepinephrinelogP -1.24
HO
HO
CatechollogP 0.88
Fig. 14: Molecular structures of catechol and the catecholamines dopamine, epinephrine andnorepinephrine (logP-values from PHYSPROP database [118])
Catecholamines are essential neurotransmitters and hormones in mammals. Chemically, they
are classified as monoamines and share the catechol as a structural motive. Their most important
representatives are dopamine, epinephrine and norepinephrine (see Fig. 14). They act as neuro-
modulators in the central nervous system and are involved in the stress response from psycho-
logical and environmental stressors. Catecholamines prepare for physical activity like the fight-
or-flight response increasing heart rate, blood pressure and blood glucose levels [1]. Therefore,
they act as important biomarkers for neuroendocrine and cardiovascular disorder, have been
linked to schizophrenia and Parkinson’s disease and are found in larger amounts in patients
with catecholamine-synthesizing tumours with life-threatening consequences. [119, 120, 121].
The analysis of catecholamines in biological matrices is predominantely carried out using RPC
29
in combination with an electrochemical detector [119, 122, 123]. Some methods also involve
fluorescence detection [119, 124]. Nevertheless, the application of MS detection for the deter-
mination of catecholamines is less common. In order to achieve a reasonable retention of these
highly polar analytes on C-18 column chemistries, ion pair reagents are routinely employed.
Many ionpair reagents, however, form involatile residues and thus are not available for ion-
ization in ESI [123]. In recent years, the application of suitable volatile ion pair reagents or
the employment of special column chemistries which achieve good retention of catecholamines
made MS detection available for this group of analytes [125, 126, 127, 128].
2.6. Applications of LC-MS in the analysis of emerging organic pollutants in water
The analysis of water soluble organic residues today is usually carried out with LC coupled with
an ESI interface to a MS for detection. With the universal detection capabilities of mass spec-
trometry, modern LC-MS analysis methods are able to cover the detection of a wide range or-
ganic residues covering besides PFCs and pharmaceutical residues also residues from personal
care products and polar pesticides [58, 59, 61, 129, 130, 131, 132, 133, 134, 135]. Therefore,
the targets of these water analysis methods are sometimes also referred to as organic micro-
contaminants or micro-pollutants [58, 61].
Analyte enrichment in water samples is usually carried out by SPE with a suitable chemistry ad-
justed to the target compounds [129, 130]. Depending on the sample origin, some methods also
include the filtration of the water sample prior enrichment [130]. The SPE itself can be carried
out manually in the laboratory or as online-SPE directly coupled to the LC-MS system. In the
latter case, sample analysis nearly becomes fully automatized with optional sample filtration
and the addition of internal standards being the only manual step within the whole analytical
process [61].
Analytical methods for the detection of organic micro-pollutants in water typically reach a limit
of quantification (LOQ) in the µg L−1 or higher ng L−1-range. Wode et al. presented a LC-
MS method for the detection of 72 micropollutants in water involving online-SPE with 1 mL
sample size and reached a LOQ between 10 and 380 ng L−1 in drinking water, surface water
and wastewater effluent [61]. Nödler et al. reached LOQs between 1.2 and 160 ng L−1 by
enriching 500 mL of water sample (river water or seawater) by manual offline SPE prior in-
strumental LC-MS analysis [58]. Vanderford et al. developed a method for the quantification
of pharmaceutical residues in treated wastewater and surface water and yielded LOQs between
0.25 and 1 ng L−1 by SPE enrichment of 500 mL in an automated offline SPE system [59]. For
the determination of PFCs in seawater, Theobald et al. established a particular sensitive method
involving the enrichment of 9 L water sample on a SPE cartridge with a custom designed auto-
30
matic sampling system. In combination with LC-MS detection, LOQs between 3 and 41 pg L−1
were achieved [136, 137].
The numerous developed detection and quantification methods differ essentially in the opti-
mization for certain water matrices and the selection of micro-pollutants [58, 59, 61, 137].
According to the analytical task, the selection of analytes and their matrix vary. There is no uni-
versal method as the total number of known micro-contaminants and their chemical properties
would be too manifold for detection in a single analytical run. Besides analyte selection, qual-
ity assurance limits the total number of investigated analytes within one single method. Most
LC-MS methods employ isotopically labelled standard substances which are added to the water
sample prior extraction and analysis as internal standads (IS). These standard substances are
used to correct the analytical result for extraction recovery and matrix effects. The artificially
labeled compounds behave chemically equal to the native substances but can be discriminated
by MS. Multi-residue analytical techniques require the purchase of many isotopically labeled
equivalents which raises the costs of a single analysis. Alternatively, several native compounds
can also be corrected with the signal of one single isotopically labeled substance with similar
retention time depending on whether a certain analytical error is acceptable [61].
Although water as medium for analysis appears to exhibit a less complex matrix in compari-
son to soil and biological samples, the analysis of organic residues in water has to face issues
due to matrix effects. With modern LC-MS instruments allowing nearly the total separation
of analyte signals from background, matrix effects appear to be less present in analytic results
at a first glance. Signal suppression and signal enhancement, however, routinely occur during
LC-MS analysis of environmental samples caused by coeluting substances which disturb the
ionization processes in the ESI interfaces but are usually not visible within the acquired mass
spectra [138]. There are typically two methods for the assessment of matrix effects in LC-MS.
The first is the comparison of a standard signal of a spiked extracted sample with the signal
of the standards in a pure solution. Alternatively, a solution of a known compound is infused
after the chromatographic column generating a constant signal which varies according to signal
enhancement or suppression during an analytical injection [138]. In analytical method devel-
opment, matrix effects are usually considered by the signal correction with internal standards
or standard addition. Stüber and Reemtsma compared the results achieved with standard addi-
tion in environmental analysis of naphthalene sulfonates with external calibration and external
calibration in environmental matrix. Yielding a deviation below 25 % with external calibration
in environmental matrix, they suggested that for some analytical approaches, external calibra-
tion might be applicable but advised periodical reference measurements by means of standard
addition in order to account for a varying matrix [139]. Another alternative for the reduction of
31
matrix effects in LC-MS is the reduction of flow rate and the downscaling of the LC and the ESI
source. With standard-sized equipment, Kloepfer et al. achieved a reduction of matrix effects
by 45 to 60 % by post-column flow splittig, corresponding to a reduction of the analytical flow
from 200-500 µL min−1 down to 20-100 -µL min−1 [140].
A further reduction of chromatography scale leads to micro and nano-chromatography which
requires special chromatographic equipment and ESI sources. Nano-LC-MS is commonly ap-
plied in the analysis of complex protein mixtures and biological samples in proteomics ap-
proaches [141, 142, 143]. In general, highest sensitivity, peak capacity and low sample con-
sumption are the result of the instrumental downscaling process. However, these achievements
are at the expense of injection runtime (up to several hours per injection) and instrument ro-
bustness [142, 144]. Therefore, applications of nano-LC-MS in environmental analysis are
rare [145, 146]. Nevertheless, also environmental analysis could benefit from a reduction of
matrix effects during analysis. Schmidt et al. showed that matrix effects are practically absent at
flow rates below 20 nL min−1. However, commercially available nano-LC systems are usually
operated at 200 to 500 nL min−1 at which still a certain matrix effect has to be expected [147].
3. Scope of work
The main part of the presented work incorporated the development of a novel analytical method
for the enrichment and determination of polar organic residues in surface water. The method
development encompassed the design of a water sampling system and its application in the field,
the development of a suitable laboratory cleanup as well as the establishment of a quantifica-
tion method on an existing nano-UHPLC-MS instrument. Furthermore, the established method
should be involved in environmental sampling of the Yangtze River near the Three Gorges Dam
(China).
At first, the measurement and detection capabilities of the UHPLC-MS instrument had to be
evaluated against reliability of analyte detection and quantification. Typical strengths and short-
comings of the analytical instrument had to be identified and consequences on the possibilities
for the application of the instrument in the analytical method had to be evaluated. Therefore,
instrumental method development for derivatized catecholamines should serve as model ap-
plication for the evaluation of instrumental capabilities. Based on these findings, a chromato-
graphic and mass spectrometric method for a selected group of polar residues partly recognized
as emerging organic pollutants should be developed. The analytes should be proposed based on
the identified capabilities of the UHPLC-MS instrument.
32
Besides targeted analysis, a combined approach including a limited non-target analysis should
be developed to post-process the datasets acquired during the measurement of field data. There-
fore, a workflow should be developed based on passive samplers which have been previously
deployed at the small river Selke in Meisdorf (Germany) which in turn was suitable to serve as
universal tool for the analysis of previously acquired samples.
In parallel, a water sampling technique had to be developed allowing the enrichment of high
volumes of surface water directly at the sampling location. The generated water samples should
serve for method verification as well as for environmental monitoring at the same time. High
enrichment factors were found to be necessary to reduce the method detection limit in a con-
centration range in which residues of emerging organic pollutants are expected in water bodies
like the Yangtze River with high dilution and low charge. Therefore, solid-phase extraction in
a large scale was thought to meet the requirements for the analytical task. Due to commercial
solid-phase extraction being only available for small sample volumes at high costs, an economic
and effective alternative with self-packed sampling cartridges had to be found.
Finally, another topic of this work was the optimization of extraction and cleanup parameters
for the generated samples in order to yield a sample quality that was sufficient to allow reliable
analyte detection and quantification. This task entailed the determination of a suitable extrac-
tion solvent and the adjustment of SPE parameters to yield maximum analyte recovery and to
minimize matrix effects.
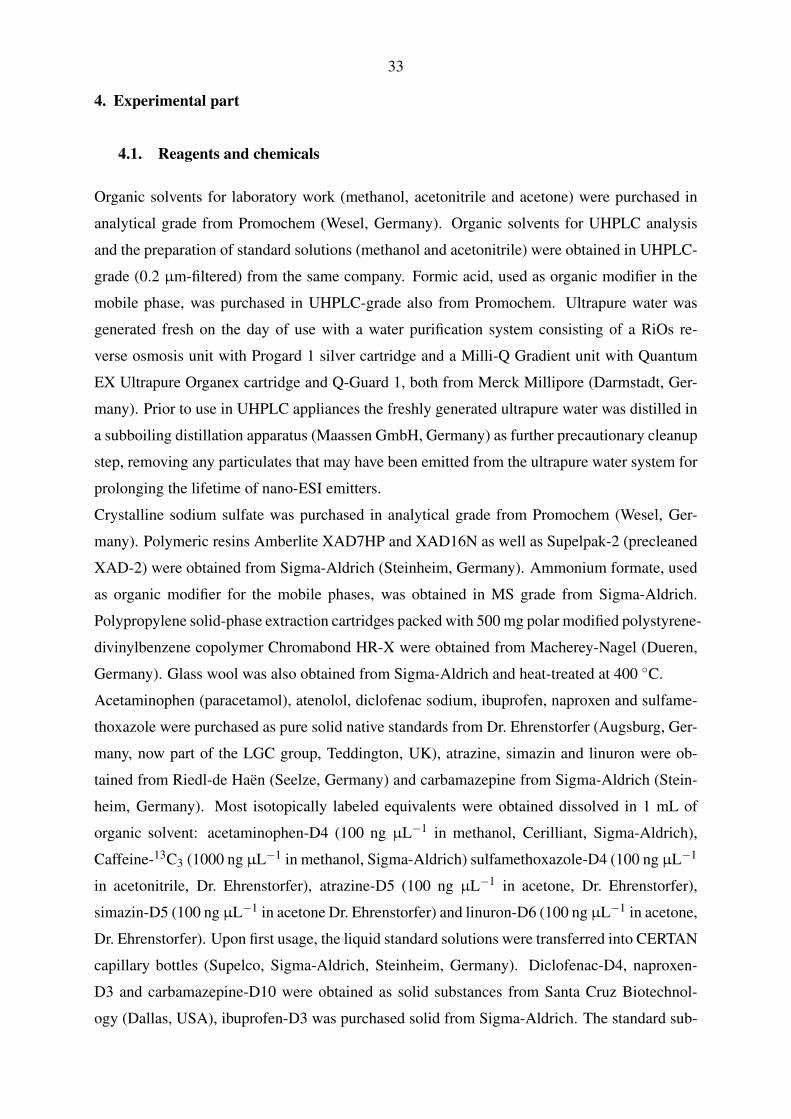
33
4. Experimental part
4.1. Reagents and chemicals
Organic solvents for laboratory work (methanol, acetonitrile and acetone) were purchased in
analytical grade from Promochem (Wesel, Germany). Organic solvents for UHPLC analysis
and the preparation of standard solutions (methanol and acetonitrile) were obtained in UHPLC-
grade (0.2 µm-filtered) from the same company. Formic acid, used as organic modifier in the
mobile phase, was purchased in UHPLC-grade also from Promochem. Ultrapure water was
generated fresh on the day of use with a water purification system consisting of a RiOs re-
verse osmosis unit with Progard 1 silver cartridge and a Milli-Q Gradient unit with Quantum
EX Ultrapure Organex cartridge and Q-Guard 1, both from Merck Millipore (Darmstadt, Ger-
many). Prior to use in UHPLC appliances the freshly generated ultrapure water was distilled in
a subboiling distillation apparatus (Maassen GmbH, Germany) as further precautionary cleanup
step, removing any particulates that may have been emitted from the ultrapure water system for
prolonging the lifetime of nano-ESI emitters.
Crystalline sodium sulfate was purchased in analytical grade from Promochem (Wesel, Ger-
many). Polymeric resins Amberlite XAD7HP and XAD16N as well as Supelpak-2 (precleaned
XAD-2) were obtained from Sigma-Aldrich (Steinheim, Germany). Ammonium formate, used
as organic modifier for the mobile phases, was obtained in MS grade from Sigma-Aldrich.
Polypropylene solid-phase extraction cartridges packed with 500 mg polar modified polystyrene-
divinylbenzene copolymer Chromabond HR-X were obtained from Macherey-Nagel (Dueren,
Germany). Glass wool was also obtained from Sigma-Aldrich and heat-treated at 400 ◦C.
Acetaminophen (paracetamol), atenolol, diclofenac sodium, ibuprofen, naproxen and sulfame-
thoxazole were purchased as pure solid native standards from Dr. Ehrenstorfer (Augsburg, Ger-
many, now part of the LGC group, Teddington, UK), atrazine, simazin and linuron were ob-
tained from Riedl-de Haën (Seelze, Germany) and carbamazepine from Sigma-Aldrich (Stein-
heim, Germany). Most isotopically labeled equivalents were obtained dissolved in 1 mL of
organic solvent: acetaminophen-D4 (100 ng µL−1 in methanol, Cerilliant, Sigma-Aldrich),
Caffeine-13C3 (1000 ng µL−1 in methanol, Sigma-Aldrich) sulfamethoxazole-D4 (100 ng µL−1
in acetonitrile, Dr. Ehrenstorfer), atrazine-D5 (100 ng µL−1 in acetone, Dr. Ehrenstorfer),
simazin-D5 (100 ng µL−1 in acetone Dr. Ehrenstorfer) and linuron-D6 (100 ng µL−1 in acetone,
Dr. Ehrenstorfer). Upon first usage, the liquid standard solutions were transferred into CERTAN
capillary bottles (Supelco, Sigma-Aldrich, Steinheim, Germany). Diclofenac-D4, naproxen-
D3 and carbamazepine-D10 were obtained as solid substances from Santa Cruz Biotechnol-
ogy (Dallas, USA), ibuprofen-D3 was purchased solid from Sigma-Aldrich. The standard sub-
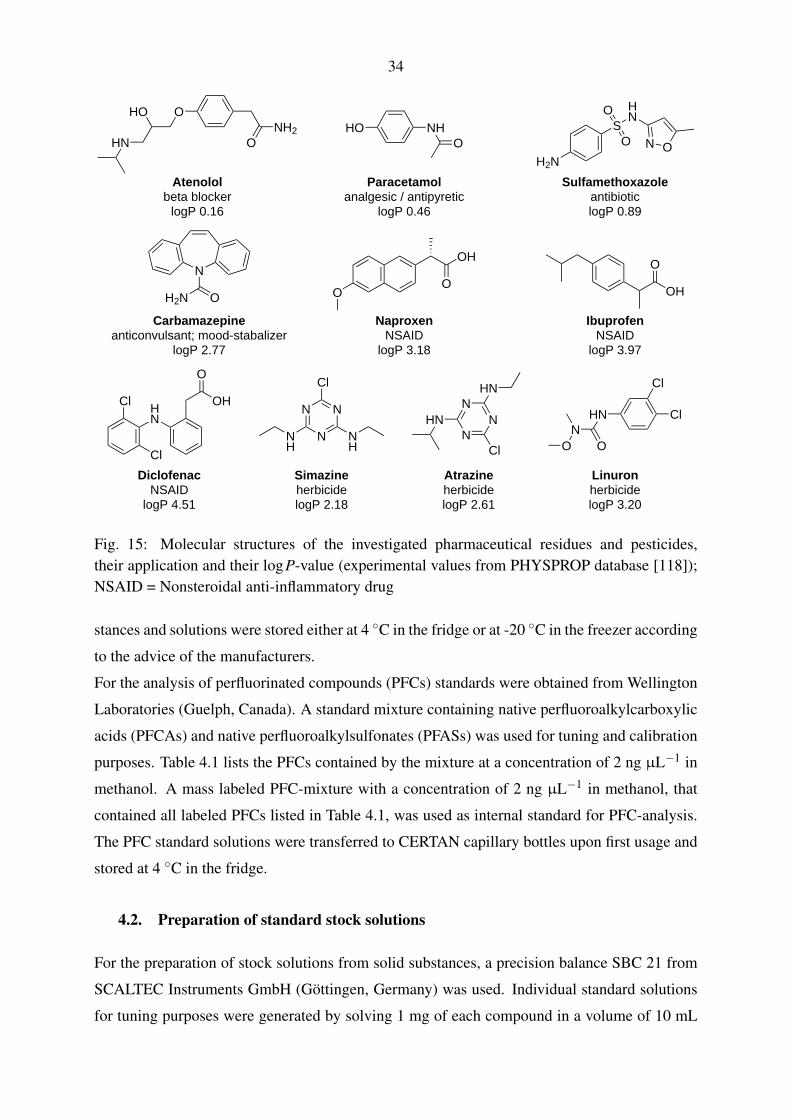
34
OHO
HNNH2
O
Atenololbeta blocker
logP 0.16
AtrazineherbicidelogP 2.61
HNN
N
HN
N
Cl
HO NHO
Paracetamolanalgesic / antipyretic
logP 0.46
H2N
O
OS
HN
N O
SulfamethoxazoleantibioticlogP 0.89
N
H2N O
Carbamazepineanticonvulsant; mood-stabalizer
logP 2.77
O
OH
O
NaproxenNSAID
logP 3.18
O
OH
IbuprofenNSAID
logP 3.97
HN
Cl
Cl
O
OH
DiclofenacNSAID
logP 4.51
NN
NNH
NH
Cl
SimazineherbicidelogP 2.18
HNN
OO
Cl
Cl
LinuronherbicidelogP 3.20
Fig. 15: Molecular structures of the investigated pharmaceutical residues and pesticides,their application and their logP-value (experimental values from PHYSPROP database [118]);NSAID = Nonsteroidal anti-inflammatory drug
stances and solutions were stored either at 4 ◦C in the fridge or at -20 ◦C in the freezer according
to the advice of the manufacturers.
For the analysis of perfluorinated compounds (PFCs) standards were obtained from Wellington
Laboratories (Guelph, Canada). A standard mixture containing native perfluoroalkylcarboxylic
acids (PFCAs) and native perfluoroalkylsulfonates (PFASs) was used for tuning and calibration
purposes. Table 4.1 lists the PFCs contained by the mixture at a concentration of 2 ng µL−1 in
methanol. A mass labeled PFC-mixture with a concentration of 2 ng µL−1 in methanol, that
contained all labeled PFCs listed in Table 4.1, was used as internal standard for PFC-analysis.
The PFC standard solutions were transferred to CERTAN capillary bottles upon first usage and
stored at 4 ◦C in the fridge.
4.2. Preparation of standard stock solutions
For the preparation of stock solutions from solid substances, a precision balance SBC 21 from
SCALTEC Instruments GmbH (Göttingen, Germany) was used. Individual standard solutions
for tuning purposes were generated by solving 1 mg of each compound in a volume of 10 mL
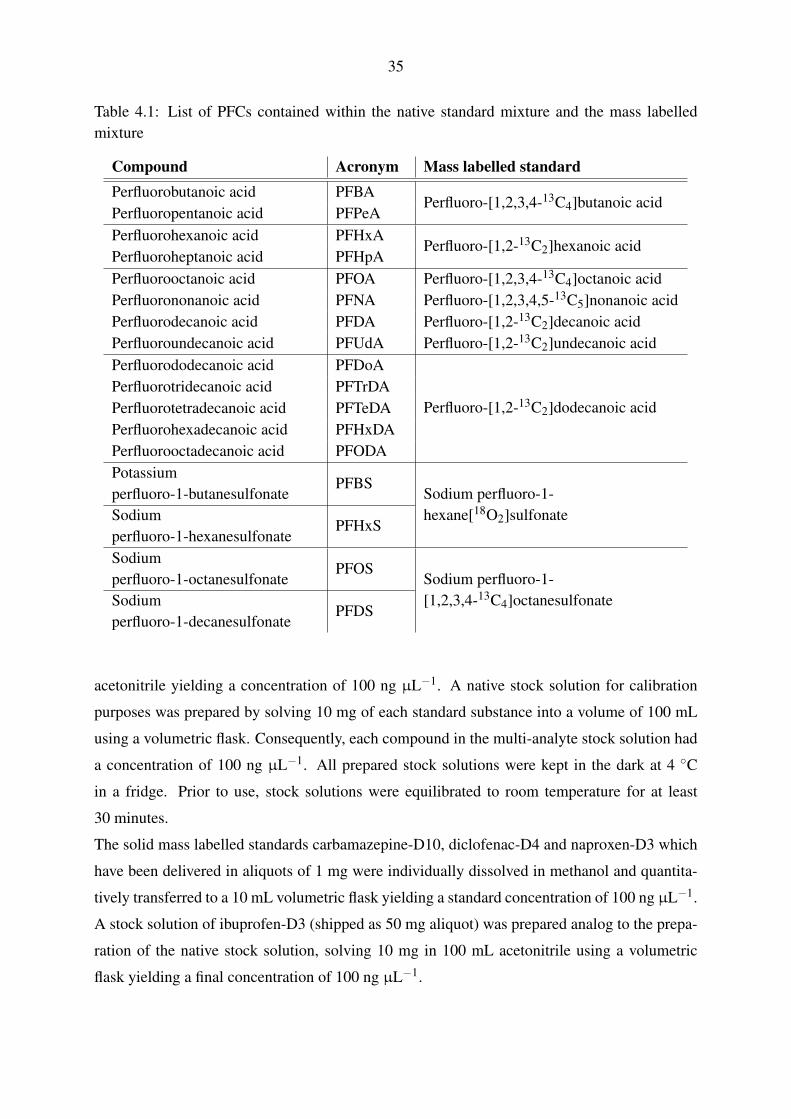
35
Table 4.1: List of PFCs contained within the native standard mixture and the mass labelledmixture
Compound Acronym Mass labelled standardPerfluorobutanoic acid PFBA
Perfluoro-[1,2,3,4-13C4]butanoic acidPerfluoropentanoic acid PFPeAPerfluorohexanoic acid PFHxA
Perfluoro-[1,2-13C2]hexanoic acidPerfluoroheptanoic acid PFHpAPerfluorooctanoic acid PFOA Perfluoro-[1,2,3,4-13C4]octanoic acidPerfluorononanoic acid PFNA Perfluoro-[1,2,3,4,5-13C5]nonanoic acidPerfluorodecanoic acid PFDA Perfluoro-[1,2-13C2]decanoic acidPerfluoroundecanoic acid PFUdA Perfluoro-[1,2-13C2]undecanoic acidPerfluorododecanoic acid PFDoA
Perfluoro-[1,2-13C2]dodecanoic acidPerfluorotridecanoic acid PFTrDAPerfluorotetradecanoic acid PFTeDAPerfluorohexadecanoic acid PFHxDAPerfluorooctadecanoic acid PFODAPotassiumperfluoro-1-butanesulfonate
PFBSSodium perfluoro-1-hexane[18O2]sulfonateSodium
perfluoro-1-hexanesulfonatePFHxS
Sodiumperfluoro-1-octanesulfonate
PFOSSodium perfluoro-1-[1,2,3,4-13C4]octanesulfonateSodium
perfluoro-1-decanesulfonatePFDS
acetonitrile yielding a concentration of 100 ng µL−1. A native stock solution for calibration
purposes was prepared by solving 10 mg of each standard substance into a volume of 100 mL
using a volumetric flask. Consequently, each compound in the multi-analyte stock solution had
a concentration of 100 ng µL−1. All prepared stock solutions were kept in the dark at 4 ◦C
in a fridge. Prior to use, stock solutions were equilibrated to room temperature for at least
30 minutes.
The solid mass labelled standards carbamazepine-D10, diclofenac-D4 and naproxen-D3 which
have been delivered in aliquots of 1 mg were individually dissolved in methanol and quantita-
tively transferred to a 10 mL volumetric flask yielding a standard concentration of 100 ng µL−1.
A stock solution of ibuprofen-D3 (shipped as 50 mg aliquot) was prepared analog to the prepa-
ration of the native stock solution, solving 10 mg in 100 mL acetonitrile using a volumetric
flask yielding a final concentration of 100 ng µL−1.
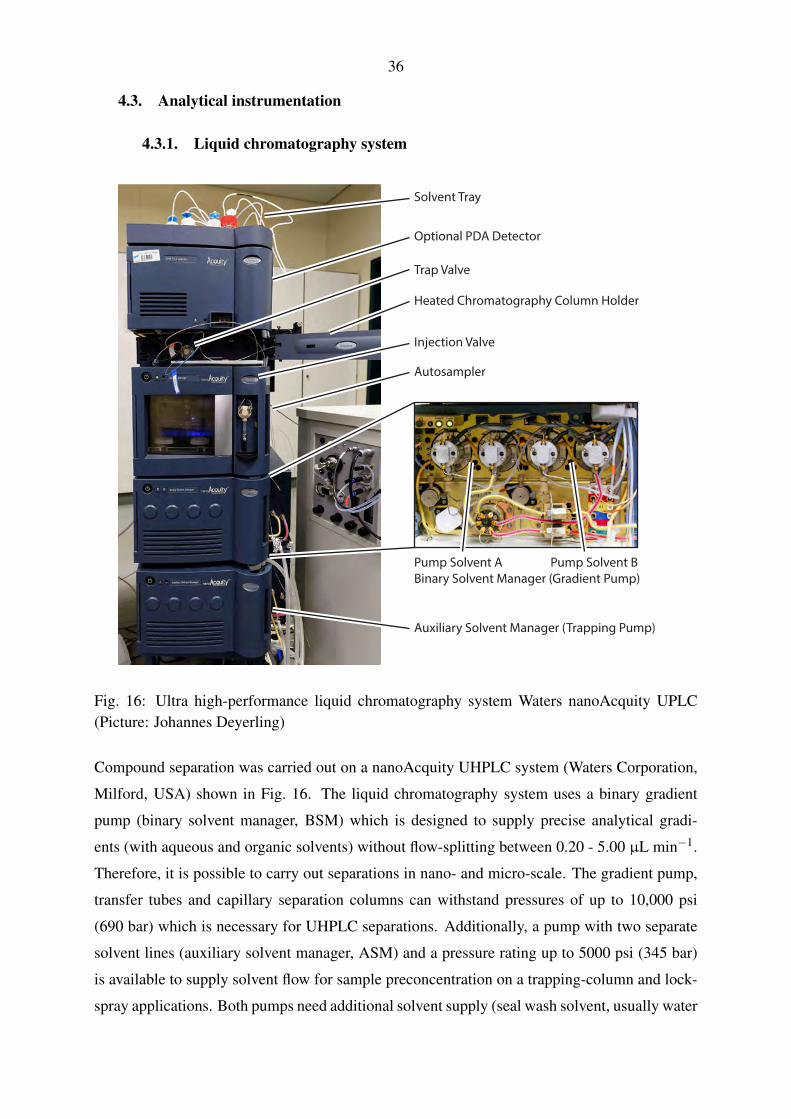
36
4.3. Analytical instrumentation
4.3.1. Liquid chromatography system
Optional PDA Detector
Solvent Tray
Heated Chromatography Column Holder
Trap Valve
Injection Valve
Autosampler
Binary Solvent Manager (Gradient Pump)
Auxiliary Solvent Manager (Trapping Pump)
Pump Solvent A Pump Solvent B
Fig. 16: Ultra high-performance liquid chromatography system Waters nanoAcquity UPLC(Picture: Johannes Deyerling)
Compound separation was carried out on a nanoAcquity UHPLC system (Waters Corporation,
Milford, USA) shown in Fig. 16. The liquid chromatography system uses a binary gradient
pump (binary solvent manager, BSM) which is designed to supply precise analytical gradi-
ents (with aqueous and organic solvents) without flow-splitting between 0.20 - 5.00 µL min−1.
Therefore, it is possible to carry out separations in nano- and micro-scale. The gradient pump,
transfer tubes and capillary separation columns can withstand pressures of up to 10,000 psi
(690 bar) which is necessary for UHPLC separations. Additionally, a pump with two separate
solvent lines (auxiliary solvent manager, ASM) and a pressure rating up to 5000 psi (345 bar)
is available to supply solvent flow for sample preconcentration on a trapping-column and lock-
spray applications. Both pumps need additional solvent supply (seal wash solvent, usually water
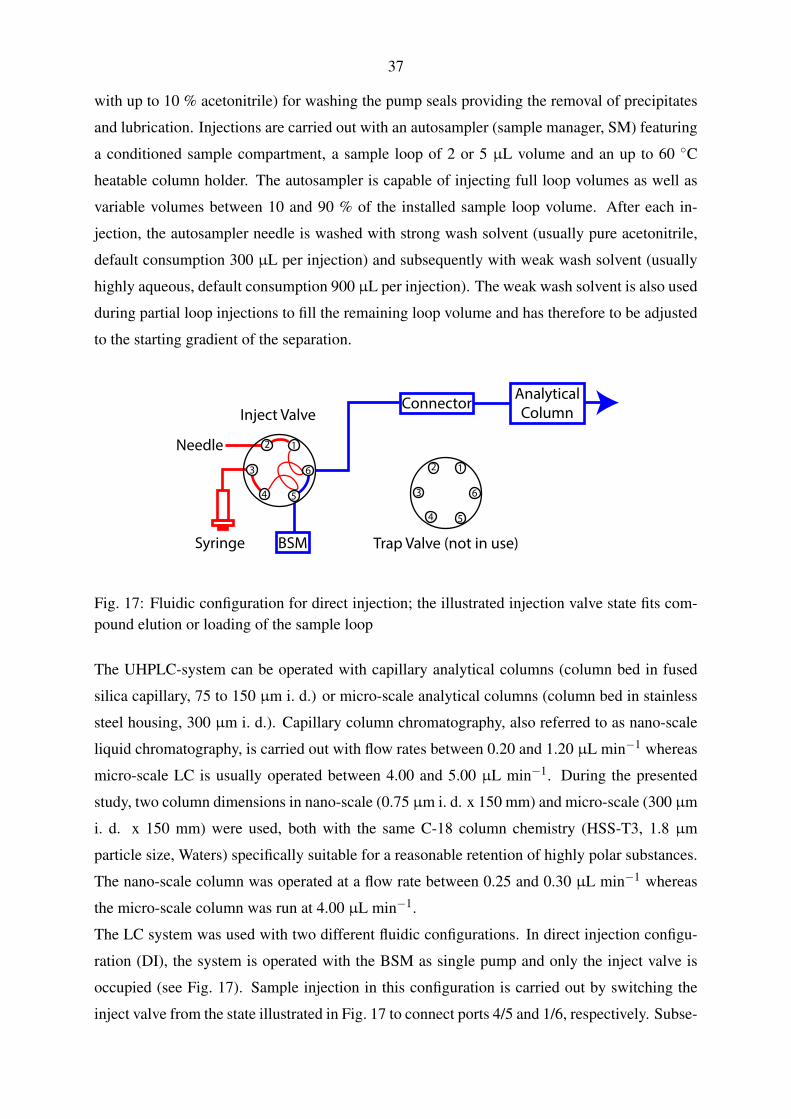
37
with up to 10 % acetonitrile) for washing the pump seals providing the removal of precipitates
and lubrication. Injections are carried out with an autosampler (sample manager, SM) featuring
a conditioned sample compartment, a sample loop of 2 or 5 µL volume and an up to 60 ◦C
heatable column holder. The autosampler is capable of injecting full loop volumes as well as
variable volumes between 10 and 90 % of the installed sample loop volume. After each in-
jection, the autosampler needle is washed with strong wash solvent (usually pure acetonitrile,
default consumption 300 µL per injection) and subsequently with weak wash solvent (usually
highly aqueous, default consumption 900 µL per injection). The weak wash solvent is also used
during partial loop injections to fill the remaining loop volume and has therefore to be adjusted
to the starting gradient of the separation.
1
6
2
3
4 5
BSM
Needle1
6
2
3
4 5
Connector AnalyticalColumn
Syringe
Inject Valve
Trap Valve (not in use)
Fig. 17: Fluidic configuration for direct injection; the illustrated injection valve state fits com-pound elution or loading of the sample loop
The UHPLC-system can be operated with capillary analytical columns (column bed in fused
silica capillary, 75 to 150 µm i. d.) or micro-scale analytical columns (column bed in stainless
steel housing, 300 µm i. d.). Capillary column chromatography, also referred to as nano-scale
liquid chromatography, is carried out with flow rates between 0.20 and 1.20 µL min−1 whereas
micro-scale LC is usually operated between 4.00 and 5.00 µL min−1. During the presented
study, two column dimensions in nano-scale (0.75 µm i. d. x 150 mm) and micro-scale (300 µm
i. d. x 150 mm) were used, both with the same C-18 column chemistry (HSS-T3, 1.8 µm
particle size, Waters) specifically suitable for a reasonable retention of highly polar substances.
The nano-scale column was operated at a flow rate between 0.25 and 0.30 µL min−1 whereas
the micro-scale column was run at 4.00 µL min−1.
The LC system was used with two different fluidic configurations. In direct injection configu-
ration (DI), the system is operated with the BSM as single pump and only the inject valve is
occupied (see Fig. 17). Sample injection in this configuration is carried out by switching the
inject valve from the state illustrated in Fig. 17 to connect ports 4/5 and 1/6, respectively. Subse-
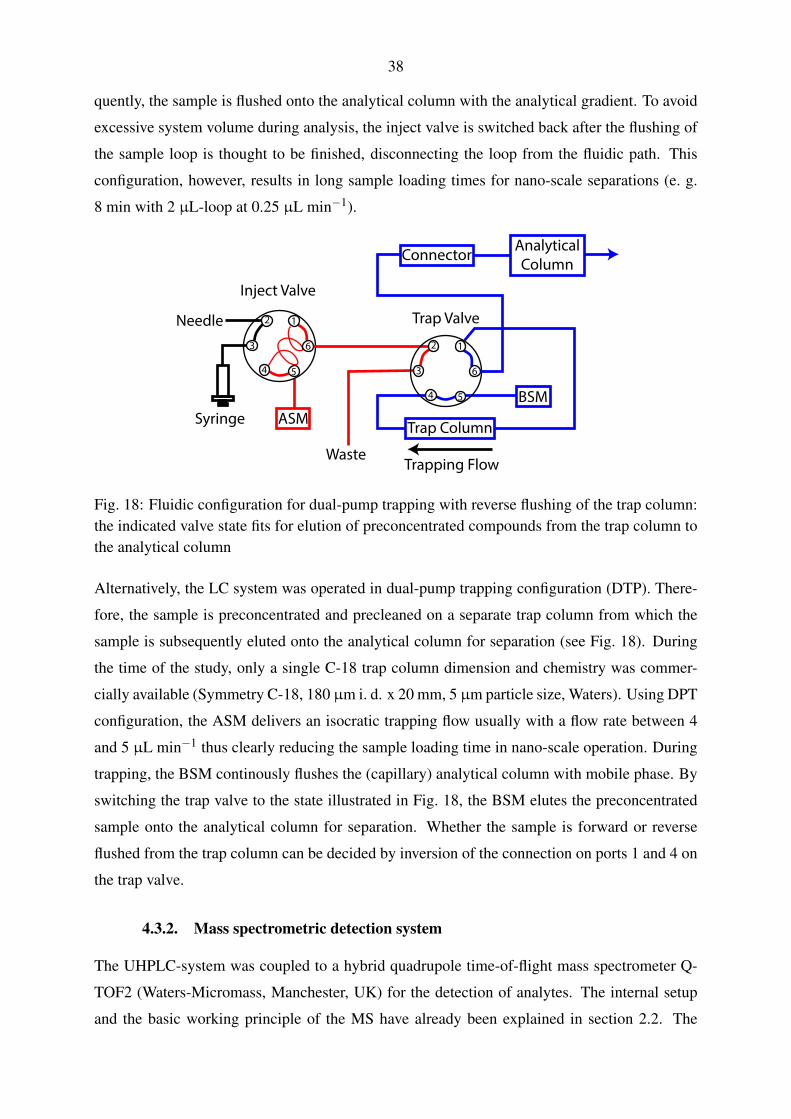
38
quently, the sample is flushed onto the analytical column with the analytical gradient. To avoid
excessive system volume during analysis, the inject valve is switched back after the flushing of
the sample loop is thought to be finished, disconnecting the loop from the fluidic path. This
configuration, however, results in long sample loading times for nano-scale separations (e. g.
8 min with 2 µL-loop at 0.25 µL min−1).
1
6
2
3
4 5
ASM
Needle1
6
2
3
4 5
Connector AnalyticalColumn
Syringe
Inject Valve
Trap Valve
Trap Column
BSM
Trapping FlowWaste
Fig. 18: Fluidic configuration for dual-pump trapping with reverse flushing of the trap column:the indicated valve state fits for elution of preconcentrated compounds from the trap column tothe analytical column
Alternatively, the LC system was operated in dual-pump trapping configuration (DTP). There-
fore, the sample is preconcentrated and precleaned on a separate trap column from which the
sample is subsequently eluted onto the analytical column for separation (see Fig. 18). During
the time of the study, only a single C-18 trap column dimension and chemistry was commer-
cially available (Symmetry C-18, 180 µm i. d. x 20 mm, 5 µm particle size, Waters). Using DPT
configuration, the ASM delivers an isocratic trapping flow usually with a flow rate between 4
and 5 µL min−1 thus clearly reducing the sample loading time in nano-scale operation. During
trapping, the BSM continously flushes the (capillary) analytical column with mobile phase. By
switching the trap valve to the state illustrated in Fig. 18, the BSM elutes the preconcentrated
sample onto the analytical column for separation. Whether the sample is forward or reverse
flushed from the trap column can be decided by inversion of the connection on ports 1 and 4 on
the trap valve.
4.3.2. Mass spectrometric detection system
The UHPLC-system was coupled to a hybrid quadrupole time-of-flight mass spectrometer Q-
TOF2 (Waters-Micromass, Manchester, UK) for the detection of analytes. The internal setup
and the basic working principle of the MS have already been explained in section 2.2. The
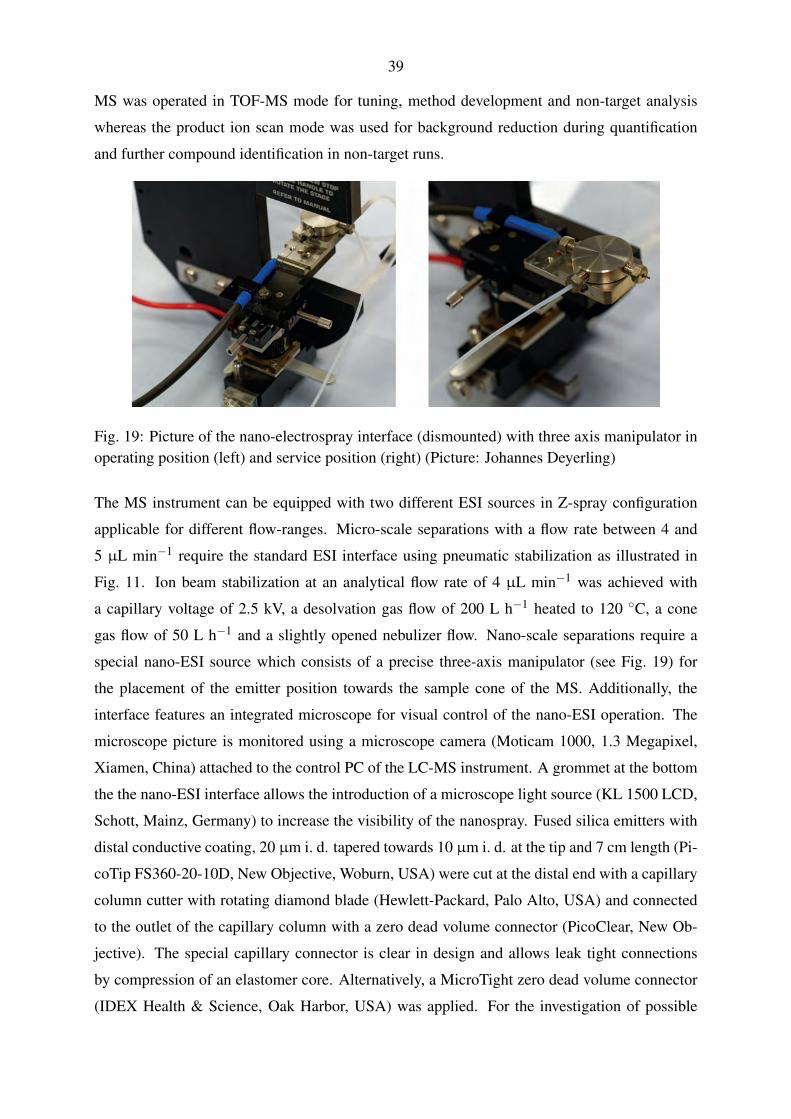
39
MS was operated in TOF-MS mode for tuning, method development and non-target analysis
whereas the product ion scan mode was used for background reduction during quantification
and further compound identification in non-target runs.
Fig. 19: Picture of the nano-electrospray interface (dismounted) with three axis manipulator inoperating position (left) and service position (right) (Picture: Johannes Deyerling)
The MS instrument can be equipped with two different ESI sources in Z-spray configuration
applicable for different flow-ranges. Micro-scale separations with a flow rate between 4 and
5 µL min−1 require the standard ESI interface using pneumatic stabilization as illustrated in
Fig. 11. Ion beam stabilization at an analytical flow rate of 4 µL min−1 was achieved with
a capillary voltage of 2.5 kV, a desolvation gas flow of 200 L h−1 heated to 120 ◦C, a cone
gas flow of 50 L h−1 and a slightly opened nebulizer flow. Nano-scale separations require a
special nano-ESI source which consists of a precise three-axis manipulator (see Fig. 19) for
the placement of the emitter position towards the sample cone of the MS. Additionally, the
interface features an integrated microscope for visual control of the nano-ESI operation. The
microscope picture is monitored using a microscope camera (Moticam 1000, 1.3 Megapixel,
Xiamen, China) attached to the control PC of the LC-MS instrument. A grommet at the bottom
the the nano-ESI interface allows the introduction of a microscope light source (KL 1500 LCD,
Schott, Mainz, Germany) to increase the visibility of the nanospray. Fused silica emitters with
distal conductive coating, 20 µm i. d. tapered towards 10 µm i. d. at the tip and 7 cm length (Pi-
coTip FS360-20-10D, New Objective, Woburn, USA) were cut at the distal end with a capillary
column cutter with rotating diamond blade (Hewlett-Packard, Palo Alto, USA) and connected
to the outlet of the capillary column with a zero dead volume connector (PicoClear, New Ob-
jective). The special capillary connector is clear in design and allows leak tight connections
by compression of an elastomer core. Alternatively, a MicroTight zero dead volume connector
(IDEX Health & Science, Oak Harbor, USA) was applied. For the investigation of possible
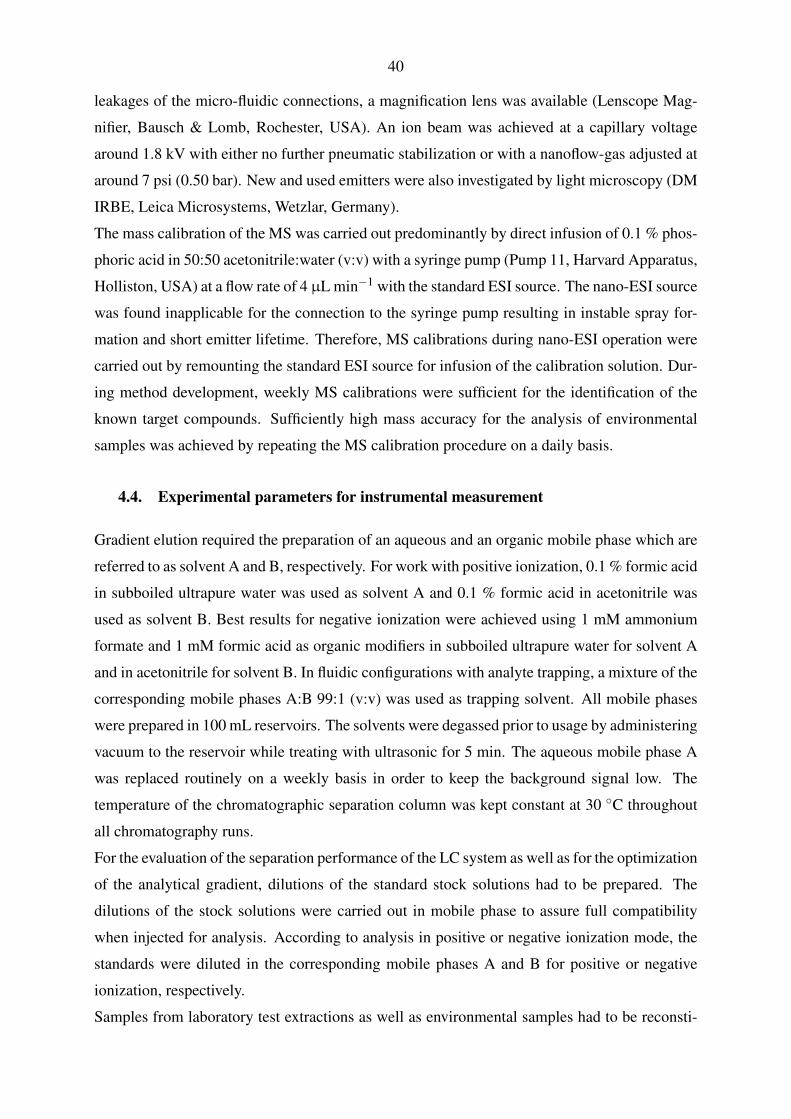
40
leakages of the micro-fluidic connections, a magnification lens was available (Lenscope Mag-
nifier, Bausch & Lomb, Rochester, USA). An ion beam was achieved at a capillary voltage
around 1.8 kV with either no further pneumatic stabilization or with a nanoflow-gas adjusted at
around 7 psi (0.50 bar). New and used emitters were also investigated by light microscopy (DM
IRBE, Leica Microsystems, Wetzlar, Germany).
The mass calibration of the MS was carried out predominantly by direct infusion of 0.1 % phos-
phoric acid in 50:50 acetonitrile:water (v:v) with a syringe pump (Pump 11, Harvard Apparatus,
Holliston, USA) at a flow rate of 4 µL min−1 with the standard ESI source. The nano-ESI source
was found inapplicable for the connection to the syringe pump resulting in instable spray for-
mation and short emitter lifetime. Therefore, MS calibrations during nano-ESI operation were
carried out by remounting the standard ESI source for infusion of the calibration solution. Dur-
ing method development, weekly MS calibrations were sufficient for the identification of the
known target compounds. Sufficiently high mass accuracy for the analysis of environmental
samples was achieved by repeating the MS calibration procedure on a daily basis.
4.4. Experimental parameters for instrumental measurement
Gradient elution required the preparation of an aqueous and an organic mobile phase which are
referred to as solvent A and B, respectively. For work with positive ionization, 0.1 % formic acid
in subboiled ultrapure water was used as solvent A and 0.1 % formic acid in acetonitrile was
used as solvent B. Best results for negative ionization were achieved using 1 mM ammonium
formate and 1 mM formic acid as organic modifiers in subboiled ultrapure water for solvent A
and in acetonitrile for solvent B. In fluidic configurations with analyte trapping, a mixture of the
corresponding mobile phases A:B 99:1 (v:v) was used as trapping solvent. All mobile phases
were prepared in 100 mL reservoirs. The solvents were degassed prior to usage by administering
vacuum to the reservoir while treating with ultrasonic for 5 min. The aqueous mobile phase A
was replaced routinely on a weekly basis in order to keep the background signal low. The
temperature of the chromatographic separation column was kept constant at 30 ◦C throughout
all chromatography runs.
For the evaluation of the separation performance of the LC system as well as for the optimization
of the analytical gradient, dilutions of the standard stock solutions had to be prepared. The
dilutions of the stock solutions were carried out in mobile phase to assure full compatibility
when injected for analysis. According to analysis in positive or negative ionization mode, the
standards were diluted in the corresponding mobile phases A and B for positive or negative
ionization, respectively.
Samples from laboratory test extractions as well as environmental samples had to be reconsti-
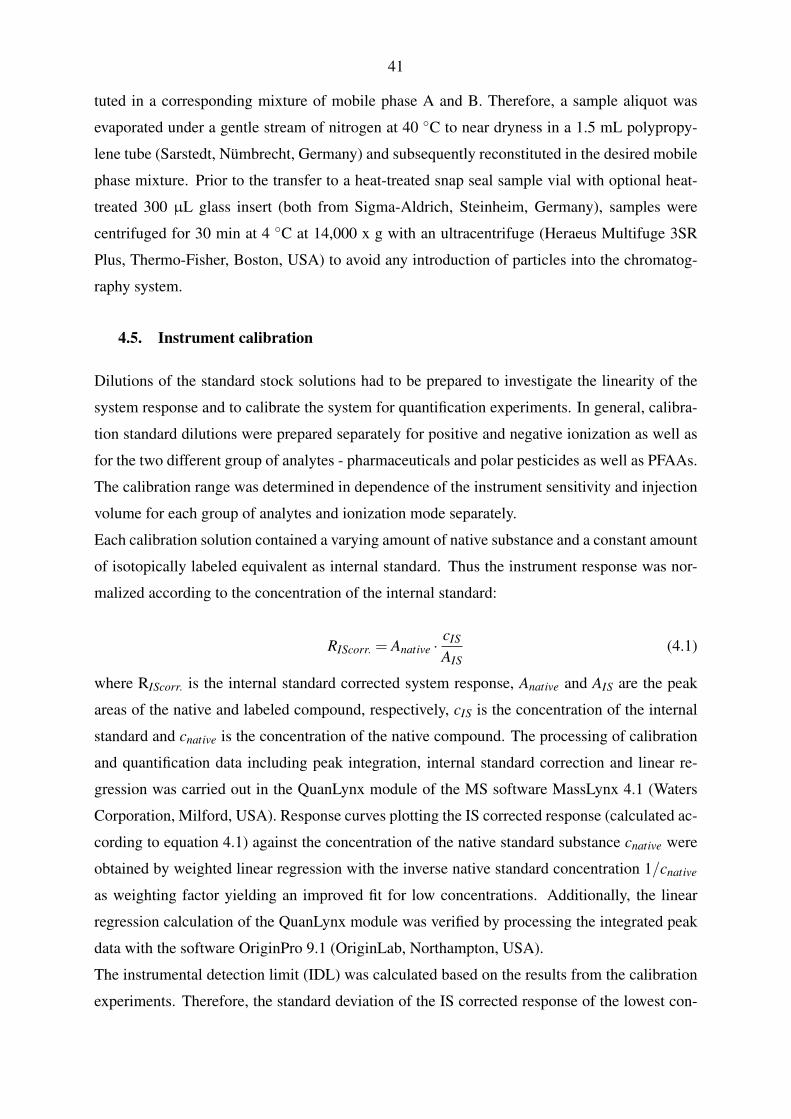
41
tuted in a corresponding mixture of mobile phase A and B. Therefore, a sample aliquot was
evaporated under a gentle stream of nitrogen at 40 ◦C to near dryness in a 1.5 mL polypropy-
lene tube (Sarstedt, Nümbrecht, Germany) and subsequently reconstituted in the desired mobile
phase mixture. Prior to the transfer to a heat-treated snap seal sample vial with optional heat-
treated 300 µL glass insert (both from Sigma-Aldrich, Steinheim, Germany), samples were
centrifuged for 30 min at 4 ◦C at 14,000 x g with an ultracentrifuge (Heraeus Multifuge 3SR
Plus, Thermo-Fisher, Boston, USA) to avoid any introduction of particles into the chromatog-
raphy system.
4.5. Instrument calibration
Dilutions of the standard stock solutions had to be prepared to investigate the linearity of the
system response and to calibrate the system for quantification experiments. In general, calibra-
tion standard dilutions were prepared separately for positive and negative ionization as well as
for the two different group of analytes - pharmaceuticals and polar pesticides as well as PFAAs.
The calibration range was determined in dependence of the instrument sensitivity and injection
volume for each group of analytes and ionization mode separately.
Each calibration solution contained a varying amount of native substance and a constant amount
of isotopically labeled equivalent as internal standard. Thus the instrument response was nor-
malized according to the concentration of the internal standard:
RIScorr. = Anative ·cIS
AIS(4.1)
where RIScorr. is the internal standard corrected system response, Anative and AIS are the peak
areas of the native and labeled compound, respectively, cIS is the concentration of the internal
standard and cnative is the concentration of the native compound. The processing of calibration
and quantification data including peak integration, internal standard correction and linear re-
gression was carried out in the QuanLynx module of the MS software MassLynx 4.1 (Waters
Corporation, Milford, USA). Response curves plotting the IS corrected response (calculated ac-
cording to equation 4.1) against the concentration of the native standard substance cnative were
obtained by weighted linear regression with the inverse native standard concentration 1/cnative
as weighting factor yielding an improved fit for low concentrations. Additionally, the linear
regression calculation of the QuanLynx module was verified by processing the integrated peak
data with the software OriginPro 9.1 (OriginLab, Northampton, USA).
The instrumental detection limit (IDL) was calculated based on the results from the calibration
experiments. Therefore, the standard deviation of the IS corrected response of the lowest con-
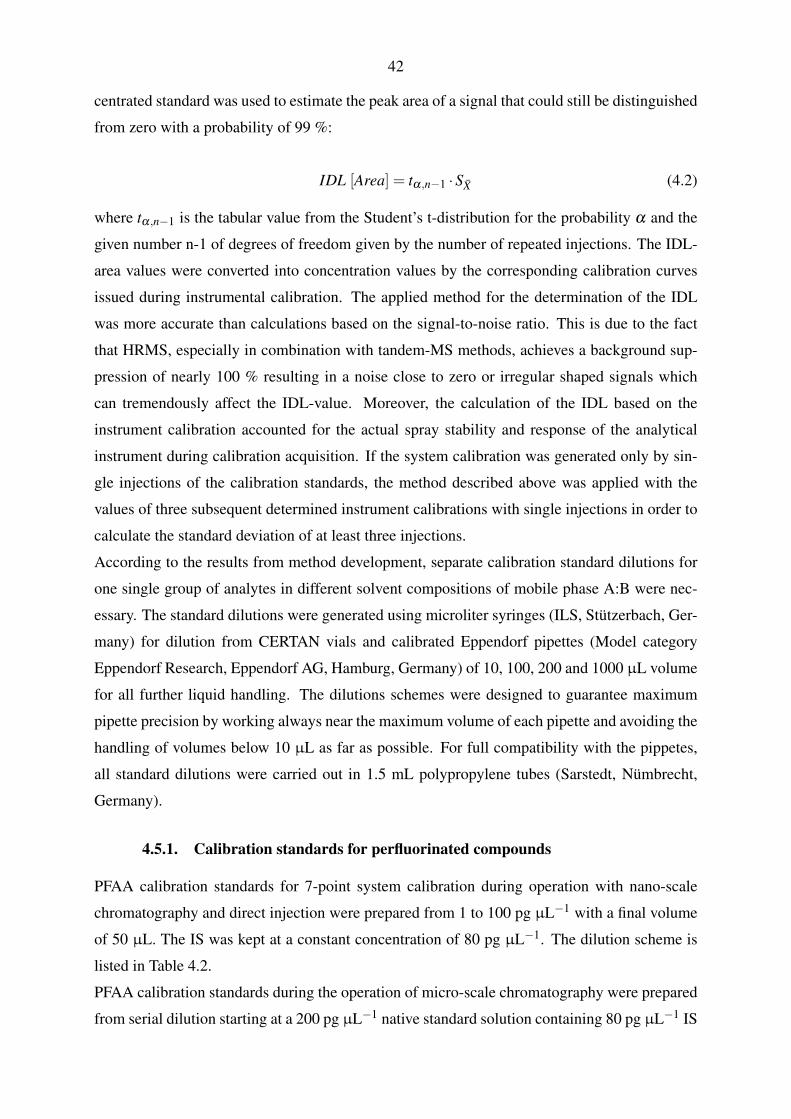
42
centrated standard was used to estimate the peak area of a signal that could still be distinguished
from zero with a probability of 99 %:
IDL [Area] = tα,n−1 ·SX̄ (4.2)
where tα,n−1 is the tabular value from the Student’s t-distribution for the probability α and the
given number n-1 of degrees of freedom given by the number of repeated injections. The IDL-
area values were converted into concentration values by the corresponding calibration curves
issued during instrumental calibration. The applied method for the determination of the IDL
was more accurate than calculations based on the signal-to-noise ratio. This is due to the fact
that HRMS, especially in combination with tandem-MS methods, achieves a background sup-
pression of nearly 100 % resulting in a noise close to zero or irregular shaped signals which
can tremendously affect the IDL-value. Moreover, the calculation of the IDL based on the
instrument calibration accounted for the actual spray stability and response of the analytical
instrument during calibration acquisition. If the system calibration was generated only by sin-
gle injections of the calibration standards, the method described above was applied with the
values of three subsequent determined instrument calibrations with single injections in order to
calculate the standard deviation of at least three injections.
According to the results from method development, separate calibration standard dilutions for
one single group of analytes in different solvent compositions of mobile phase A:B were nec-
essary. The standard dilutions were generated using microliter syringes (ILS, Stützerbach, Ger-
many) for dilution from CERTAN vials and calibrated Eppendorf pipettes (Model category
Eppendorf Research, Eppendorf AG, Hamburg, Germany) of 10, 100, 200 and 1000 µL volume
for all further liquid handling. The dilutions schemes were designed to guarantee maximum
pipette precision by working always near the maximum volume of each pipette and avoiding the
handling of volumes below 10 µL as far as possible. For full compatibility with the pippetes,
all standard dilutions were carried out in 1.5 mL polypropylene tubes (Sarstedt, Nümbrecht,
Germany).
4.5.1. Calibration standards for perfluorinated compounds
PFAA calibration standards for 7-point system calibration during operation with nano-scale
chromatography and direct injection were prepared from 1 to 100 pg µL−1 with a final volume
of 50 µL. The IS was kept at a constant concentration of 80 pg µL−1. The dilution scheme is
listed in Table 4.2.
PFAA calibration standards during the operation of micro-scale chromatography were prepared
from serial dilution starting at a 200 pg µL−1 native standard solution containing 80 pg µL−1 IS
43
Table 4.2: Dilution scheme for the preparation of PFAA standards used for calibration of theinstrument in nano-scale configuration with direct injection
StandardConc.
Amount ofnative
Standard
Conc. ofnative
Standard
Amount ofIS
Conc. of ISAmount of
Solvent
[pg µL−1] [µL] [pg µL−1] [µL] [pg µL−1] [µL]
1 5 10 10 400 3510 5 100 10 400 3520 10 100 10 400 3040 20 100 10 400 2060 30 100 10 400 1080 40 100 10 400 0
100 10 500 10 400 30
in a total volume of 40 µL. For serial dilution, five vials with 80 pg µL−1 IS in a volume of 20 µL
were prepared. Starting from the 200 pg µL−1 standard, aliquots of 20 µL were transferred from
one vial to another resulting in 1:2 diluted standards with native concentrations of 100, 50, 25,
12.5 and 0 pg µL−1 (stopping the serial dilution at 12.5 pg µL−1). This optimized dilution
scheme for a six-point calibration helped to reduce the total volume of PFAA standards needed
to establish system calibration.
4.5.2. Calibration standards for pharmaceuticals and polar pesticides
With the multi-analyte stock solutions being available in higher amounts and higher concen-
tration for pharmaceuticals and polar pesticides, larger volumes for the preparation of native
standard solutions in mobile phase were used that could be kept in the fridge for calibration
purposes for up to one month. In order to establish a 10-point calibration, native standard di-
lutions in mobile phase were prepared at concentrations from 0 to 900 pg µL−1 in equidistant
concentration steps of 100 pg µL−1. The dilutions were carried out with an intermediate di-
lution of the native multi-analyte stock solution with a concentration of 1 ng µL−1. The final
volume of each native standard solution was 1 mL.
For the preparation of the final calibration standards, 50 µL from each native standard were
diluted with 50 µL IS standard solution with a concentration of 800 pg µL−1 directly in a
sample vial. Consequently, the final 10-point calibration consisted of standards with native
concentrations from 0 to 450 pg µL−1 in steps of 50 pg µL−1 with a constant IS concentration
of 400 pg µL−1. Standard preparation for positive and negative ionization did not require a
change within the dilution scheme. However, the calibration standards had to be diluted in
44
specific mobile phase for positive and negative ionization, respectively.
4.6. Derivatization of catecholamines
The catecholamines dopamine, epinephrine and norepinephrine were analyzed at an early stage
of instrumental method development as testing compounds. In order to make catecholamines
available for measurement on the employed LC-MS instrument, a derivatization of samples and
standards was carried out with a commercially available kit (AccQ-Tag Ultra, Waters, Milford,
USA) originally designed for amino acid analysis. Within the derivatization kit, the active ingre-
dient 6-aminoquinolyl-N-hydroxysuccinimidyl carbamate (AQC) reacts with the amine group
of the corresponding catecholamine. The reaction is shown in Fig. 20 exemplary for dopamine.
The resulting derivatized catecholamine was detected with an m/z-increase of 170.056.
N
HN O
ON
O
O
NH2HO
HO
+
N
HN
O
OHOH
HN
HON
O
O+
Dopamine AQC
Derivatized Dopamine
N-Hydroxysuccinimid
Fig. 20: Derivatization of dopamine with 6-aminoquinolyl-N-hydroxysuccinimidyl carbamate(AQC)
Upon first usage of a new derivatization kit, the reagent powder had to be dissolved in its vial
using 1 mL acetonitrile supplied with the kit by mixing with a vortex mixer for 10 seconds.
A sample was derivatized by delivering 70 µL borate buffer supplied with the kit and 10 µL
aqueous sample into a sample vial. Subsequently, 20 µL of reconstituted AQC was added and
the solution was mixed using a vortex mixer for another 5 seconds. Afterwards, the sample
was stored at room temperature for 1 minute and subsequently 10 minutes in a pre-conditioned
heating block at 55 ◦C. After that the sample was ready for measurement.
4.7. Evaluation of solid-phase extraction cartridges
The applicability of solid-phase extraction cartridges from different manufacturers for the cleanup
of pharmaceuticals and polar pesticides was assessed. Therefore, sample aliquots of 1 mL in ul-
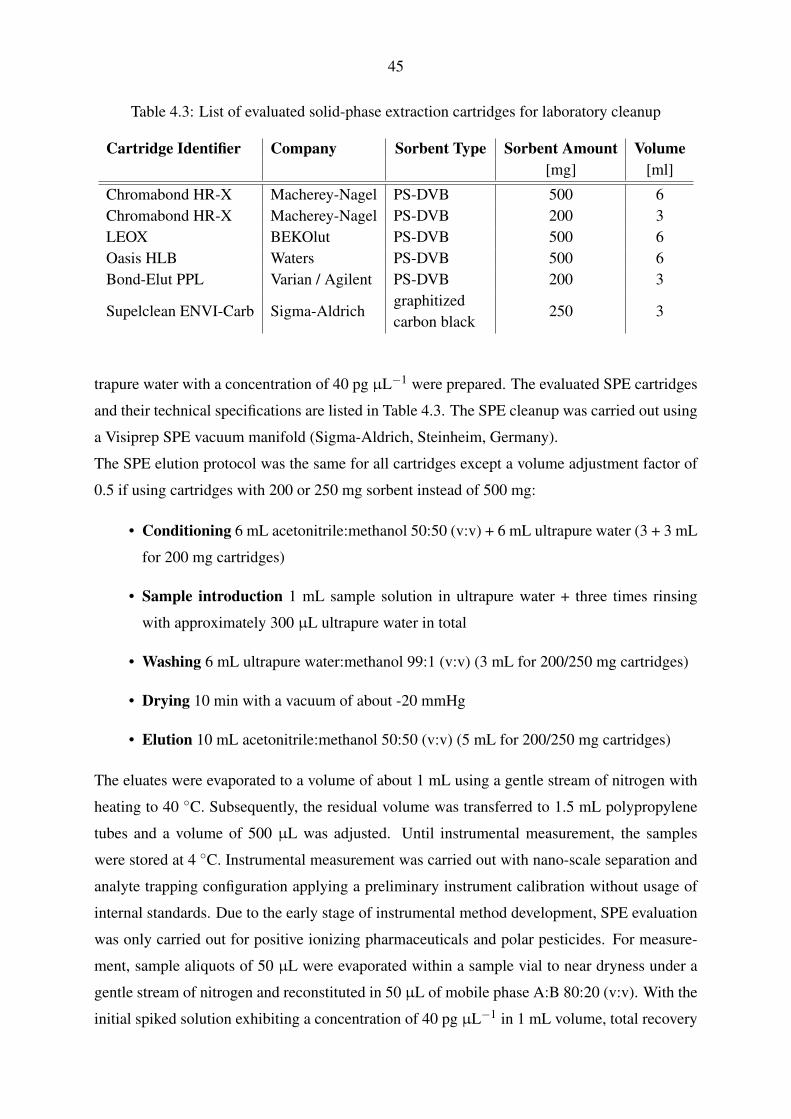
45
Table 4.3: List of evaluated solid-phase extraction cartridges for laboratory cleanup
Cartridge Identifier Company Sorbent Type Sorbent Amount Volume[mg] [ml]
Chromabond HR-X Macherey-Nagel PS-DVB 500 6Chromabond HR-X Macherey-Nagel PS-DVB 200 3LEOX BEKOlut PS-DVB 500 6Oasis HLB Waters PS-DVB 500 6Bond-Elut PPL Varian / Agilent PS-DVB 200 3
Supelclean ENVI-Carb Sigma-Aldrichgraphitizedcarbon black
250 3
trapure water with a concentration of 40 pg µL−1 were prepared. The evaluated SPE cartridges
and their technical specifications are listed in Table 4.3. The SPE cleanup was carried out using
a Visiprep SPE vacuum manifold (Sigma-Aldrich, Steinheim, Germany).
The SPE elution protocol was the same for all cartridges except a volume adjustment factor of
0.5 if using cartridges with 200 or 250 mg sorbent instead of 500 mg:
• Conditioning 6 mL acetonitrile:methanol 50:50 (v:v) + 6 mL ultrapure water (3 + 3 mL
for 200 mg cartridges)
• Sample introduction 1 mL sample solution in ultrapure water + three times rinsing
with approximately 300 µL ultrapure water in total
• Washing 6 mL ultrapure water:methanol 99:1 (v:v) (3 mL for 200/250 mg cartridges)
• Drying 10 min with a vacuum of about -20 mmHg
• Elution 10 mL acetonitrile:methanol 50:50 (v:v) (5 mL for 200/250 mg cartridges)
The eluates were evaporated to a volume of about 1 mL using a gentle stream of nitrogen with
heating to 40 ◦C. Subsequently, the residual volume was transferred to 1.5 mL polypropylene
tubes and a volume of 500 µL was adjusted. Until instrumental measurement, the samples
were stored at 4 ◦C. Instrumental measurement was carried out with nano-scale separation and
analyte trapping configuration applying a preliminary instrument calibration without usage of
internal standards. Due to the early stage of instrumental method development, SPE evaluation
was only carried out for positive ionizing pharmaceuticals and polar pesticides. For measure-
ment, sample aliquots of 50 µL were evaporated within a sample vial to near dryness under a
gentle stream of nitrogen and reconstituted in 50 µL of mobile phase A:B 80:20 (v:v). With the
initial spiked solution exhibiting a concentration of 40 pg µL−1 in 1 mL volume, total recovery
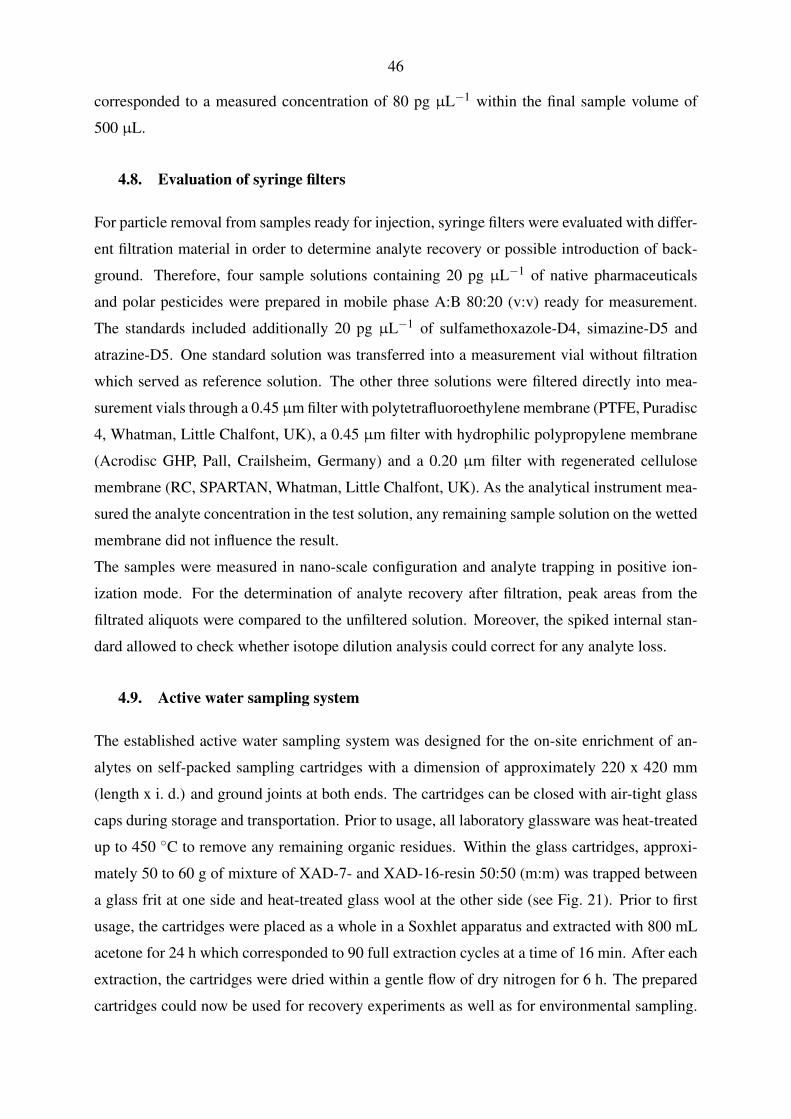
46
corresponded to a measured concentration of 80 pg µL−1 within the final sample volume of
500 µL.
4.8. Evaluation of syringe filters
For particle removal from samples ready for injection, syringe filters were evaluated with differ-
ent filtration material in order to determine analyte recovery or possible introduction of back-
ground. Therefore, four sample solutions containing 20 pg µL−1 of native pharmaceuticals
and polar pesticides were prepared in mobile phase A:B 80:20 (v:v) ready for measurement.
The standards included additionally 20 pg µL−1 of sulfamethoxazole-D4, simazine-D5 and
atrazine-D5. One standard solution was transferred into a measurement vial without filtration
which served as reference solution. The other three solutions were filtered directly into mea-
surement vials through a 0.45 µm filter with polytetrafluoroethylene membrane (PTFE, Puradisc
4, Whatman, Little Chalfont, UK), a 0.45 µm filter with hydrophilic polypropylene membrane
(Acrodisc GHP, Pall, Crailsheim, Germany) and a 0.20 µm filter with regenerated cellulose
membrane (RC, SPARTAN, Whatman, Little Chalfont, UK). As the analytical instrument mea-
sured the analyte concentration in the test solution, any remaining sample solution on the wetted
membrane did not influence the result.
The samples were measured in nano-scale configuration and analyte trapping in positive ion-
ization mode. For the determination of analyte recovery after filtration, peak areas from the
filtrated aliquots were compared to the unfiltered solution. Moreover, the spiked internal stan-
dard allowed to check whether isotope dilution analysis could correct for any analyte loss.
4.9. Active water sampling system
The established active water sampling system was designed for the on-site enrichment of an-
alytes on self-packed sampling cartridges with a dimension of approximately 220 x 420 mm
(length x i. d.) and ground joints at both ends. The cartridges can be closed with air-tight glass
caps during storage and transportation. Prior to usage, all laboratory glassware was heat-treated
up to 450 ◦C to remove any remaining organic residues. Within the glass cartridges, approxi-
mately 50 to 60 g of mixture of XAD-7- and XAD-16-resin 50:50 (m:m) was trapped between
a glass frit at one side and heat-treated glass wool at the other side (see Fig. 21). Prior to first
usage, the cartridges were placed as a whole in a Soxhlet apparatus and extracted with 800 mL
acetone for 24 h which corresponded to 90 full extraction cycles at a time of 16 min. After each
extraction, the cartridges were dried within a gentle flow of dry nitrogen for 6 h. The prepared
cartridges could now be used for recovery experiments as well as for environmental sampling.
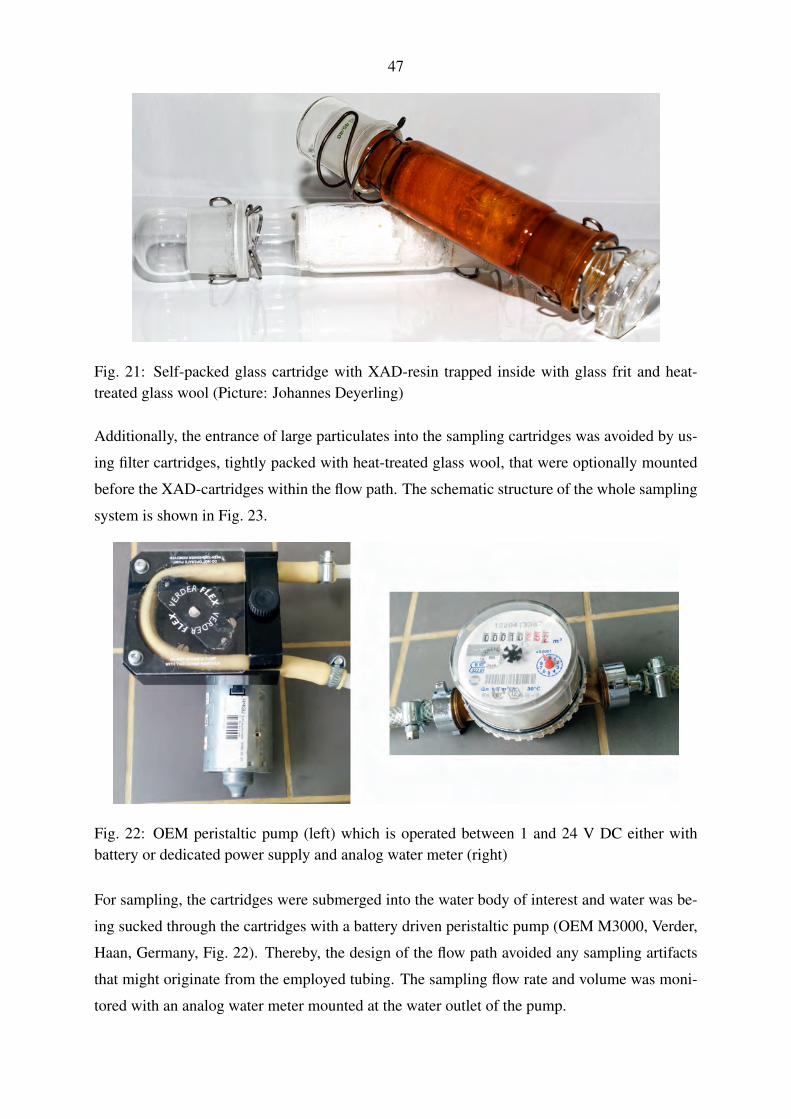
47
Fig. 21: Self-packed glass cartridge with XAD-resin trapped inside with glass frit and heat-treated glass wool (Picture: Johannes Deyerling)
Additionally, the entrance of large particulates into the sampling cartridges was avoided by us-
ing filter cartridges, tightly packed with heat-treated glass wool, that were optionally mounted
before the XAD-cartridges within the flow path. The schematic structure of the whole sampling
system is shown in Fig. 23.
Fig. 22: OEM peristaltic pump (left) which is operated between 1 and 24 V DC either withbattery or dedicated power supply and analog water meter (right)
For sampling, the cartridges were submerged into the water body of interest and water was be-
ing sucked through the cartridges with a battery driven peristaltic pump (OEM M3000, Verder,
Haan, Germany, Fig. 22). Thereby, the design of the flow path avoided any sampling artifacts
that might originate from the employed tubing. The sampling flow rate and volume was moni-
tored with an analog water meter mounted at the water outlet of the pump.
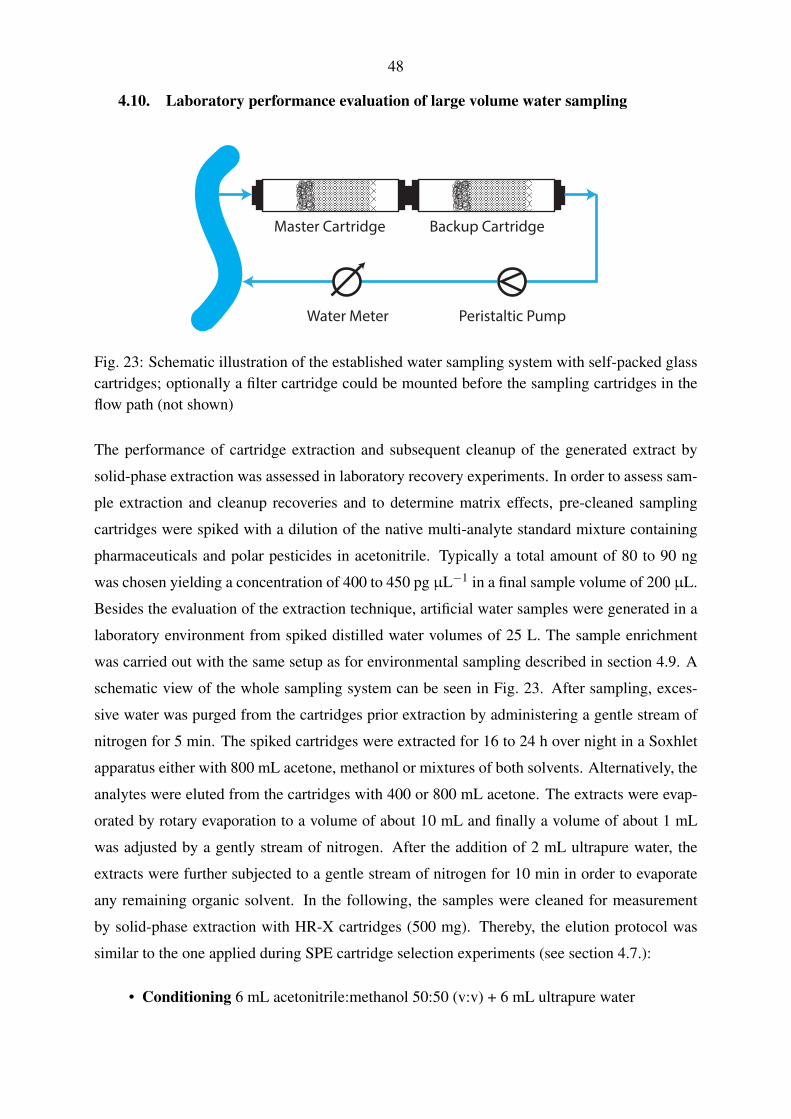
48
4.10. Laboratory performance evaluation of large volume water sampling
Peristaltic PumpWater Meter
Master Cartridge Backup Cartridge
Fig. 23: Schematic illustration of the established water sampling system with self-packed glasscartridges; optionally a filter cartridge could be mounted before the sampling cartridges in theflow path (not shown)
The performance of cartridge extraction and subsequent cleanup of the generated extract by
solid-phase extraction was assessed in laboratory recovery experiments. In order to assess sam-
ple extraction and cleanup recoveries and to determine matrix effects, pre-cleaned sampling
cartridges were spiked with a dilution of the native multi-analyte standard mixture containing
pharmaceuticals and polar pesticides in acetonitrile. Typically a total amount of 80 to 90 ng
was chosen yielding a concentration of 400 to 450 pg µL−1 in a final sample volume of 200 µL.
Besides the evaluation of the extraction technique, artificial water samples were generated in a
laboratory environment from spiked distilled water volumes of 25 L. The sample enrichment
was carried out with the same setup as for environmental sampling described in section 4.9. A
schematic view of the whole sampling system can be seen in Fig. 23. After sampling, exces-
sive water was purged from the cartridges prior extraction by administering a gentle stream of
nitrogen for 5 min. The spiked cartridges were extracted for 16 to 24 h over night in a Soxhlet
apparatus either with 800 mL acetone, methanol or mixtures of both solvents. Alternatively, the
analytes were eluted from the cartridges with 400 or 800 mL acetone. The extracts were evap-
orated by rotary evaporation to a volume of about 10 mL and finally a volume of about 1 mL
was adjusted by a gently stream of nitrogen. After the addition of 2 mL ultrapure water, the
extracts were further subjected to a gentle stream of nitrogen for 10 min in order to evaporate
any remaining organic solvent. In the following, the samples were cleaned for measurement
by solid-phase extraction with HR-X cartridges (500 mg). Thereby, the elution protocol was
similar to the one applied during SPE cartridge selection experiments (see section 4.7.):
• Conditioning 6 mL acetonitrile:methanol 50:50 (v:v) + 6 mL ultrapure water
49
• Sample introduction 2 mL sample solution in ultrapure water + three times rinsing
with approximately 300 µL ultrapure water in total
• Washing 5 mL ultrapure water
• Drying 40 min with a vacuum of about -20 mmHg
• Elution 2 x 5 mL acetonitrile:methanol 50:50 (v:v)
The eluates were collected in pear-shaped flasks and reduced to a volume of approximately
500 µL by rotary evaporation. Finally, the cleaned extracts were transferred to 1.5 mL polypropy-
lene tubes by three times rinsing with a small volume of acetonitrile:methanol (50:50) (v:v) and
a volume of 200 µL was adjusted by evaporation in a gentle stream of nitrogen at 40 ◦C. Until
measurement, the samples were stored at 4 ◦C in the dark.
For measurement, an aliquot of 40 µL of a sample was transferred to a 1.5 mL polypropylene
tube and evaporated to near dryness by a gentle stream of nitrogen at 40 ◦C. Subsequently, the
sample was reconstituted in 40 µL of a specific mobile phase mixture (corresponding to the
intended measurement) containing 400 pg µL−1 of isotopically labeled pharmaceuticals and
polar pesticides. After rigorous mixing using a vortex mixer, the extracts were centrifuged for
30 min at 4 ◦C and 14,000 x g to remove any remaining particles from the samples. Finally, the
supernatant was transferred into measurement vials.
Besides the on-site enrichment of large water volumes, the laboratory enrichment of bottled wa-
ter samples in the scale of 100 to 500 mL directly on 500 mg Chromabond HR-X SPE cartridges
was investigated. Therefore, 100, 250 and 500 mL of ultrapure and tap water were spiked to a
concentration of 180 ng L−1 with the multi-analyte standard containing native pharmaceuticals
and polar pesticides. Consequently, within a final sample size of 200 µL a concentration of 90,
225 and 450 pg µL−1 could be expected for 100 % recovery, respectively. Direct solid-phase
extraction was carried out according to the following elution protocol:
• Conditioning 6 mL acetonitrile:methanol (50:50) (v:v) + 6 mL ultrapure water
• Sample introduction Admission of the spiked sample through a reservoir attached to
the SPE cartridge at a flow rate of about 4 mL min−1
• Drying 40 min with a vacuum of about -20 mmHg
• Elution 2 x 5 mL acetonitrile:methanol (50:50) (v:v)
The preparation of the eluates for measurement could be carried out the same way as described
above.
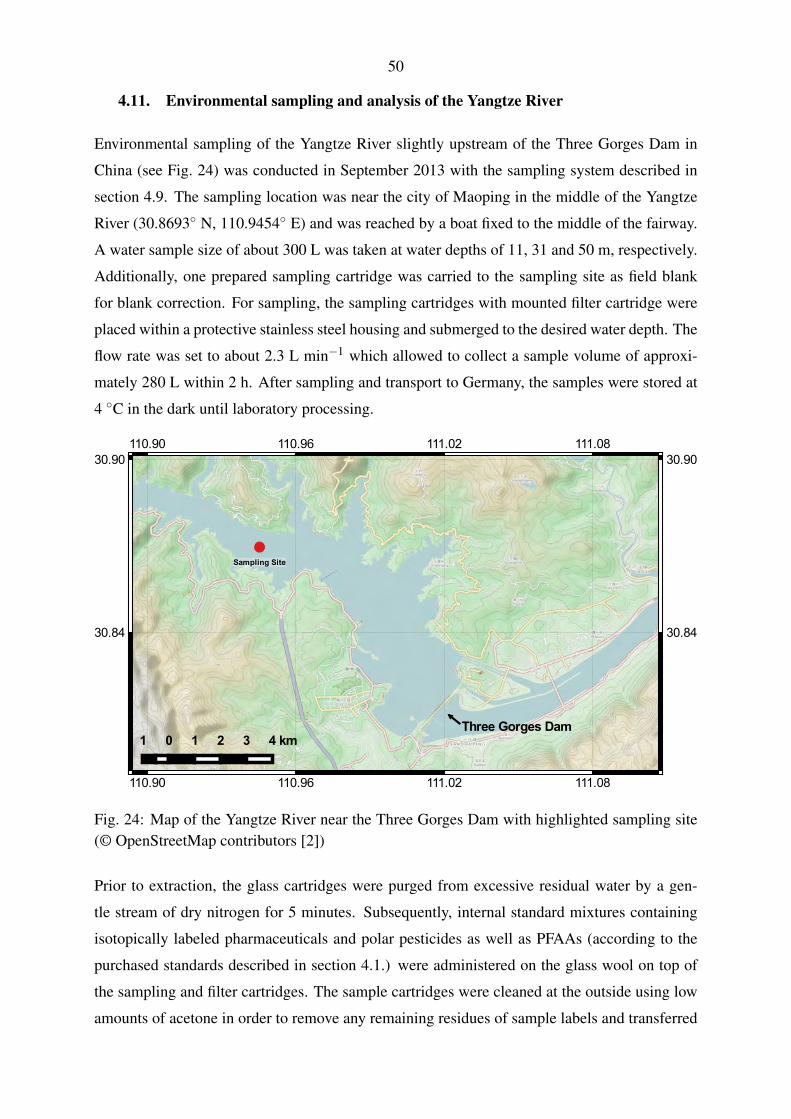
50
4.11. Environmental sampling and analysis of the Yangtze River
Environmental sampling of the Yangtze River slightly upstream of the Three Gorges Dam in
China (see Fig. 24) was conducted in September 2013 with the sampling system described in
section 4.9. The sampling location was near the city of Maoping in the middle of the Yangtze
River (30.8693◦ N, 110.9454◦ E) and was reached by a boat fixed to the middle of the fairway.
A water sample size of about 300 L was taken at water depths of 11, 31 and 50 m, respectively.
Additionally, one prepared sampling cartridge was carried to the sampling site as field blank
for blank correction. For sampling, the sampling cartridges with mounted filter cartridge were
placed within a protective stainless steel housing and submerged to the desired water depth. The
flow rate was set to about 2.3 L min−1 which allowed to collect a sample volume of approxi-
mately 280 L within 2 h. After sampling and transport to Germany, the samples were stored at
4 ◦C in the dark until laboratory processing.
30.90 30.90
30.84 30.84
110.90
110.90
110.96
110.96
111.02
111.02
111.08
111.08
1 0 1 2 3 4 kmThree Gorges Dam
Fig. 24: Map of the Yangtze River near the Three Gorges Dam with highlighted sampling site(© OpenStreetMap contributors [2])
Prior to extraction, the glass cartridges were purged from excessive residual water by a gen-
tle stream of dry nitrogen for 5 minutes. Subsequently, internal standard mixtures containing
isotopically labeled pharmaceuticals and polar pesticides as well as PFAAs (according to the
purchased standards described in section 4.1.) were administered on the glass wool on top of
the sampling and filter cartridges. The sample cartridges were cleaned at the outside using low
amounts of acetone in order to remove any remaining residues of sample labels and transferred
51
to a Soxhlet apparatus. The extraction was carried out with 800 mL of acetone for at least
16 hours corresponding to about 60 extraction cycles over night. After extraction, the samples
were evaporated using a rotary evaporator to a residual volume of about 200 mL. Remaining
water was removed by directing the extracts through glass filters filled with dry sodium sulfate.
The extracts were ready for the following solid-phase extraction cleanup after evaporation to a
volume of about 2 mL.
The SPE with Chromabond HR-X cartridges was carried out on a vacuum manifold applying
the elution protocol described in section 4.10. The eluate was evaporated by rotary evapora-
tion to a volume of about 200 µL and transferred to a 1.5 mL polypropylene tube (Sarstedt,
Nümbrecht, Germany) by three times rinsing with acetonitrile:methanol 50:50 (v:v). Finally, a
sample volume of typically 200 µL was adjusted by evaporating excess solvent under a gentle
stream of nitrogen and heating to 40 ◦C.
With the recorded sample volume, environmental water concentrations could be calculated. At
first, an enrichment factor FEN was determined according to the following equation:
FEN [] =Vsampled [L]
Vextract [µL] ·10−6 (4.3)
where Vsampled and Vextract are the volumes of the water sample and the final extract after
cleanup, respectively. Consequently, the concentration of a dissolved organic compound i in
water ci,w was calculated by multiplication of the determined extract concentration ci,extract and
the enrichment factor FEN :
ci,w [pg L−1] = ci,extract [pg µL−1] ·FEN ·10−6 (4.4)
Analyte values determined in the blank cartridge were referred to the corresponding sample vol-
ume with equation 4.4 and the resulting blank concentrations were subtracted from the reported
values:
ci,w,blankcorr [pg L−1] = ci,w [pg L−1]− ci,blank [pg L−1] (4.5)
where ci,w,blankcorr is the blank corrected water concentration of a compound i and ci,blank is the
theoretical blank concentration referred to the water sample volume. The limit of quantification
(LOQ) could also be calculated based on the blank values:
LOQ [pg L−1] = 3 ·0.25 · ci,blank [pg L−1] (4.6)
In case of the LOQ-value exceeding the detected concentrations, the compound was regarded
as not detected (n. d.).
52
4.12. Workflow for directed non-target screening
With the recorded HRMS data from environmental samples, the existing targeted analysis and
quantification could be enhanced by a non-target screening approach. The screening required
only one additional sample injection with low collision energy set enabling the detection of
possible targets as positively charged molecular ions. These non-target injections were accom-
panied by blank mobile phase injections in order to correct the data gathered during non-target
runs for irrelevant background noise. Due to the improved sensitivity of the MS and the better
ESI stability in positive ion mode, negative ionization mode was neglected for non-target anal-
ysis. Sample runs already acquired for targeted analysis with elevated collision energy could
be used to gather information about the fractionation behavior of possible analytical targets.
Signals from the isotopically labeled internal standards gathered during instrumental calibra-
tion were used to calibrate the retention time scale of the chromatographic system with the
retention time index (see section 2.1.2.). The RTI-calibration, calculated according to equa-
tion 2.6, allowed the estimation of logP-values of unknown substances which could be included
in database research of possible suspects. The developed non-target workflow consisted of the
following steps:
1. Subtraction of background collected during blank injection
2. Conversion of blank corrected MS data to NetCDF exchange format for further data
processing in MZmime 2.11
3. Cropping of parts of the chromatogram that were not necessary for analysis (early elu-
tion, column equilibration)
4. (optional) Mathematical background reduction
5. Peak list generation with a suitable algorithm extracting mass traces forming well-
shaped peaks above a certain intensity threshold
6. Deconvolution of extracted ion chromatograms containing more than a single peak into
separate chromatograms
7. Removal of duplicates with an isotopic pattern and a mass filter
8. Visible evaluation of suspects and removal of chromatograms that appear to be noise
9. Peak list alignment if multiple samples have been analyzed
10. Estimation of the logP-values of the possible targets from their individual retention time
53
11. Suspect identification with the databases STOFF-IDENT, DAIOS and MassBank
The developed workflow was applied first in the analysis of virtual organisms (VOs) which are
passive samplers similar to semi-permeable membrane devices (SPMDs). The VOs consist of
25 mm wide and 65 µm thick lay-flat polyethylene tubing (VWR, Ismaning, Germany) cut to
a length of 29 cm and filled with 700 µL triolein (Sigma-Aldrich, Steinheim, Germany). Heat
seals at both ends of the tubing trapped the triolein inside the sampler. The samplers investigated
with the non-target approach in this study were exposed to water in the small river Selke which
is a tributary of the river Bode in Saxony-Anhalt (Germany). In total, two exposed samples
and one field blank were investigated. The extraction of a VO for analysis was carried out in
a Erlenmeyer flask with 100 mL acetonitrile:methanol 50:50 (v:v) by gentle shaking for 16 h
overnight. The VO was removed and the extract was evaporated using a rotary evaporator to
a residual volume of 2 mL. Subsequently, a cleanup on HR-X SPE cartridges was conducted
according to the elution protocol described in section 4.10. The eluate was evaporated to a
volume of about 500 µL, transferred to 1.5 mL polypropylene tubes and a final volume of
200 µL was adjusted. The non-target data analysis developed and tested with VO-extracts was
also applied to the XAD cartridge samples collected in the Yangtze River in 2013.
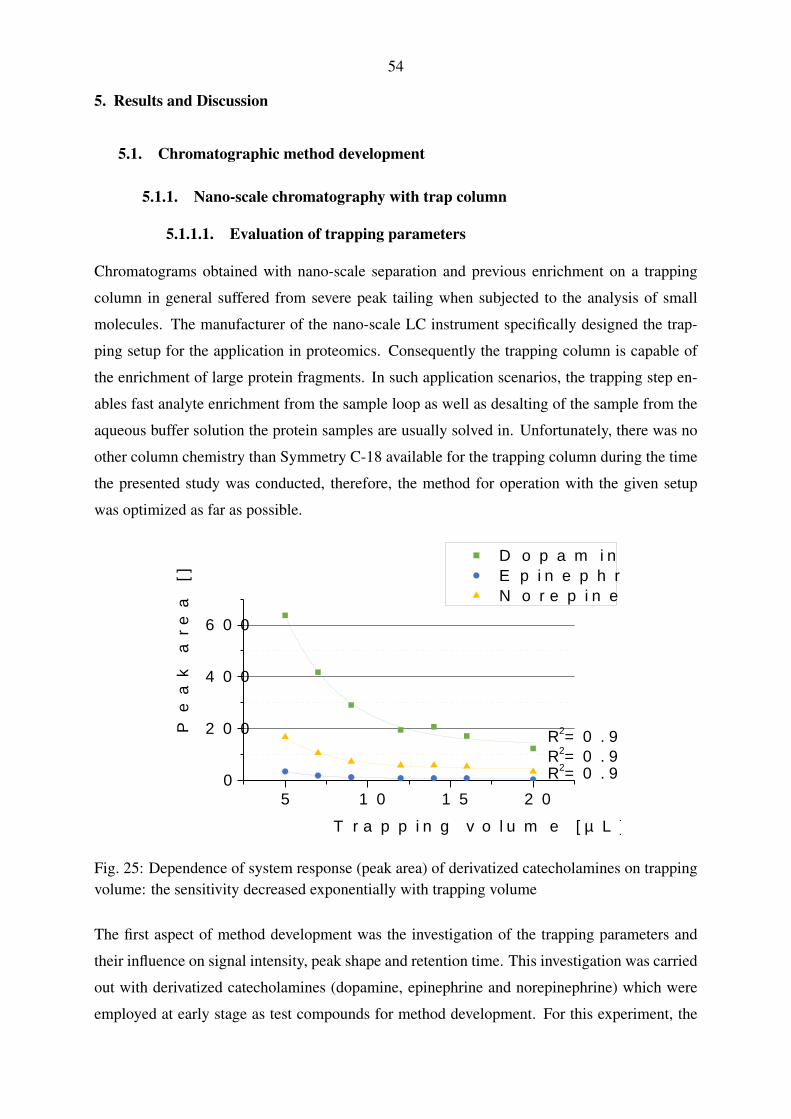
54
5. Results and Discussion
5.1. Chromatographic method development
5.1.1. Nano-scale chromatography with trap column
5.1.1.1. Evaluation of trapping parameters
Chromatograms obtained with nano-scale separation and previous enrichment on a trapping
column in general suffered from severe peak tailing when subjected to the analysis of small
molecules. The manufacturer of the nano-scale LC instrument specifically designed the trap-
ping setup for the application in proteomics. Consequently the trapping column is capable of
the enrichment of large protein fragments. In such application scenarios, the trapping step en-
ables fast analyte enrichment from the sample loop as well as desalting of the sample from the
aqueous buffer solution the protein samples are usually solved in. Unfortunately, there was no
other column chemistry than Symmetry C-18 available for the trapping column during the time
the presented study was conducted, therefore, the method for operation with the given setup
was optimized as far as possible.
5 1 0 1 5 2 00
2 0 0
4 0 0
6 0 0
R 2 = 0 . 9 6 9R 2 = 0 . 9 7 1
D o p a m i n e E p i n e p h r i n e N o r e p i n e p h r i n e
Peak
area [
]
T r a p p i n g v o l u m e [ µ L ]
R 2 = 0 . 9 8 7
Fig. 25: Dependence of system response (peak area) of derivatized catecholamines on trappingvolume: the sensitivity decreased exponentially with trapping volume
The first aspect of method development was the investigation of the trapping parameters and
their influence on signal intensity, peak shape and retention time. This investigation was carried
out with derivatized catecholamines (dopamine, epinephrine and norepinephrine) which were
employed at early stage as test compounds for method development. For this experiment, the
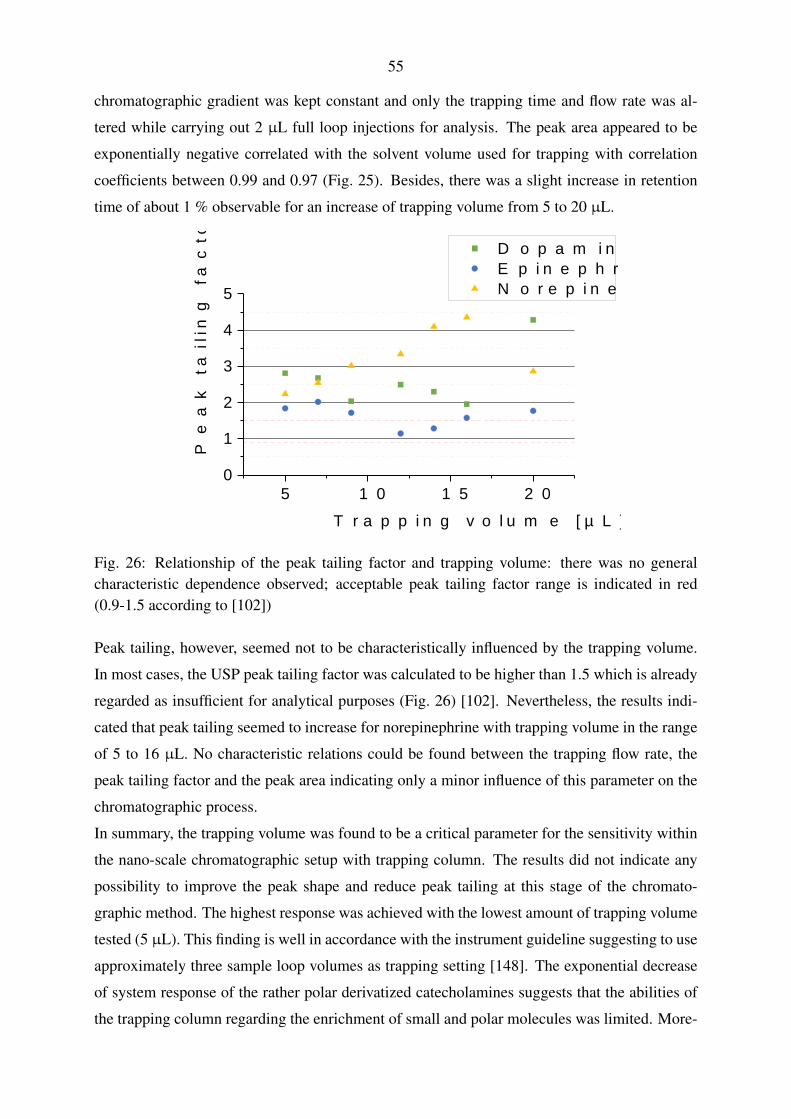
55
chromatographic gradient was kept constant and only the trapping time and flow rate was al-
tered while carrying out 2 µL full loop injections for analysis. The peak area appeared to be
exponentially negative correlated with the solvent volume used for trapping with correlation
coefficients between 0.99 and 0.97 (Fig. 25). Besides, there was a slight increase in retention
time of about 1 % observable for an increase of trapping volume from 5 to 20 µL.
5 1 0 1 5 2 0012345
D o p a m i n e E p i n e p h r i n e N o r e p i n e p h r i n e
Peak
tailing
facto
r []
T r a p p i n g v o l u m e [ µ L ]
Fig. 26: Relationship of the peak tailing factor and trapping volume: there was no generalcharacteristic dependence observed; acceptable peak tailing factor range is indicated in red(0.9-1.5 according to [102])
Peak tailing, however, seemed not to be characteristically influenced by the trapping volume.
In most cases, the USP peak tailing factor was calculated to be higher than 1.5 which is already
regarded as insufficient for analytical purposes (Fig. 26) [102]. Nevertheless, the results indi-
cated that peak tailing seemed to increase for norepinephrine with trapping volume in the range
of 5 to 16 µL. No characteristic relations could be found between the trapping flow rate, the
peak tailing factor and the peak area indicating only a minor influence of this parameter on the
chromatographic process.
In summary, the trapping volume was found to be a critical parameter for the sensitivity within
the nano-scale chromatographic setup with trapping column. The results did not indicate any
possibility to improve the peak shape and reduce peak tailing at this stage of the chromato-
graphic method. The highest response was achieved with the lowest amount of trapping volume
tested (5 µL). This finding is well in accordance with the instrument guideline suggesting to use
approximately three sample loop volumes as trapping setting [148]. The exponential decrease
of system response of the rather polar derivatized catecholamines suggests that the abilities of
the trapping column regarding the enrichment of small and polar molecules was limited. More-
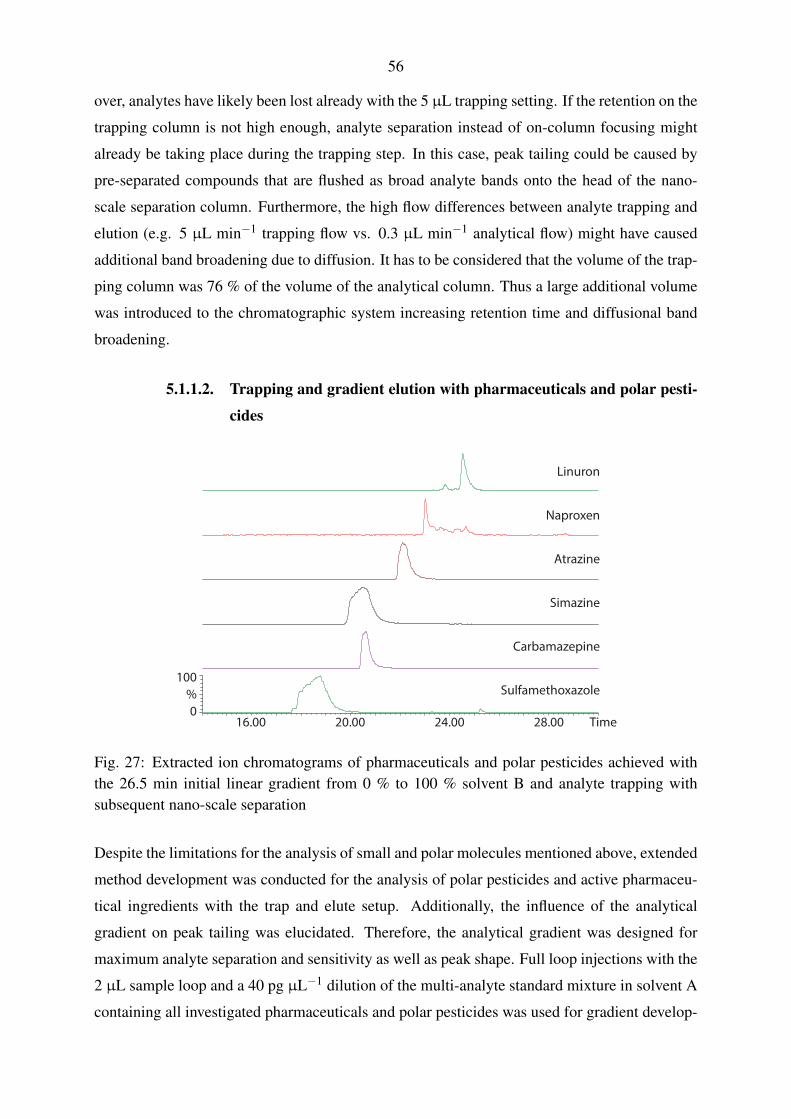
56
over, analytes have likely been lost already with the 5 µL trapping setting. If the retention on the
trapping column is not high enough, analyte separation instead of on-column focusing might
already be taking place during the trapping step. In this case, peak tailing could be caused by
pre-separated compounds that are flushed as broad analyte bands onto the head of the nano-
scale separation column. Furthermore, the high flow differences between analyte trapping and
elution (e.g. 5 µL min−1 trapping flow vs. 0.3 µL min−1 analytical flow) might have caused
additional band broadening due to diffusion. It has to be considered that the volume of the trap-
ping column was 76 % of the volume of the analytical column. Thus a large additional volume
was introduced to the chromatographic system increasing retention time and diffusional band
broadening.
5.1.1.2. Trapping and gradient elution with pharmaceuticals and polar pesti-
cides
Sulfamethoxazole
Simazine
Atrazine
Linuron
Naproxen
Carbamazepine
16.00 20.00 24.00 28.000
100%
Time
Fig. 27: Extracted ion chromatograms of pharmaceuticals and polar pesticides achieved withthe 26.5 min initial linear gradient from 0 % to 100 % solvent B and analyte trapping withsubsequent nano-scale separation
Despite the limitations for the analysis of small and polar molecules mentioned above, extended
method development was conducted for the analysis of polar pesticides and active pharmaceu-
tical ingredients with the trap and elute setup. Additionally, the influence of the analytical
gradient on peak tailing was elucidated. Therefore, the analytical gradient was designed for
maximum analyte separation and sensitivity as well as peak shape. Full loop injections with the
2 µL sample loop and a 40 pg µL−1 dilution of the multi-analyte standard mixture in solvent A
containing all investigated pharmaceuticals and polar pesticides was used for gradient develop-
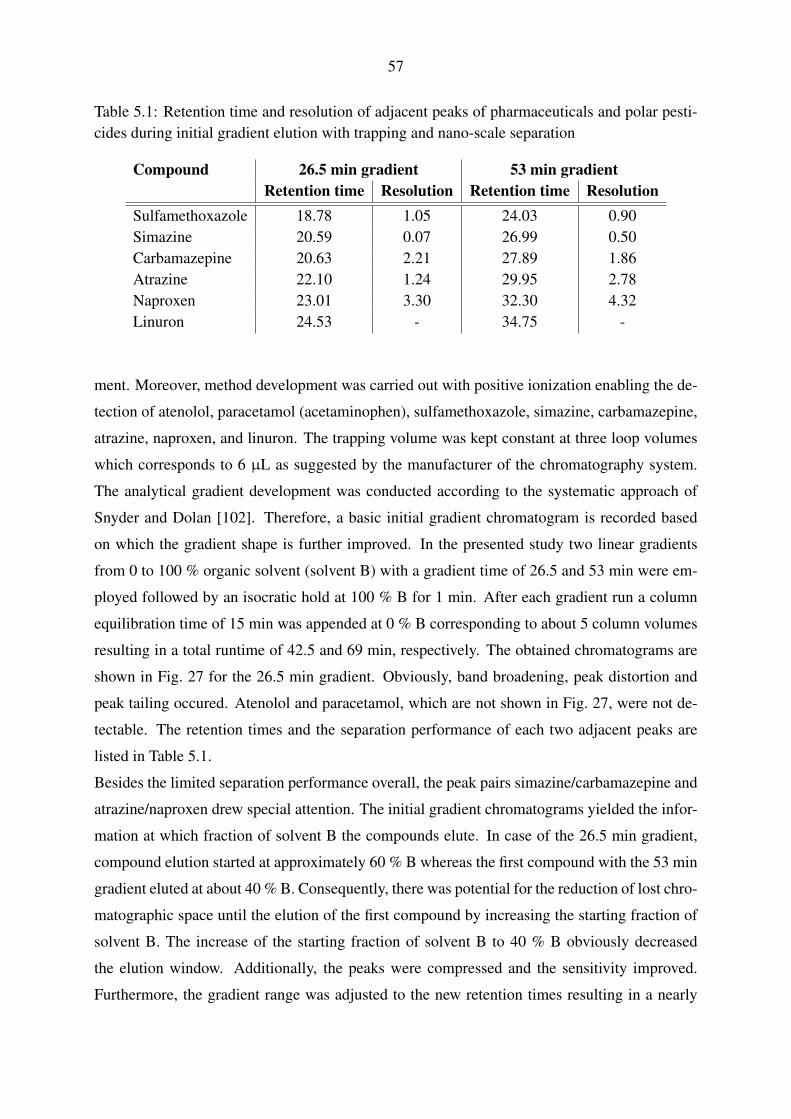
57
Table 5.1: Retention time and resolution of adjacent peaks of pharmaceuticals and polar pesti-cides during initial gradient elution with trapping and nano-scale separation
Compound 26.5 min gradient 53 min gradientRetention time Resolution Retention time Resolution
Sulfamethoxazole 18.78 1.05 24.03 0.90Simazine 20.59 0.07 26.99 0.50Carbamazepine 20.63 2.21 27.89 1.86Atrazine 22.10 1.24 29.95 2.78Naproxen 23.01 3.30 32.30 4.32Linuron 24.53 - 34.75 -
ment. Moreover, method development was carried out with positive ionization enabling the de-
tection of atenolol, paracetamol (acetaminophen), sulfamethoxazole, simazine, carbamazepine,
atrazine, naproxen, and linuron. The trapping volume was kept constant at three loop volumes
which corresponds to 6 µL as suggested by the manufacturer of the chromatography system.
The analytical gradient development was conducted according to the systematic approach of
Snyder and Dolan [102]. Therefore, a basic initial gradient chromatogram is recorded based
on which the gradient shape is further improved. In the presented study two linear gradients
from 0 to 100 % organic solvent (solvent B) with a gradient time of 26.5 and 53 min were em-
ployed followed by an isocratic hold at 100 % B for 1 min. After each gradient run a column
equilibration time of 15 min was appended at 0 % B corresponding to about 5 column volumes
resulting in a total runtime of 42.5 and 69 min, respectively. The obtained chromatograms are
shown in Fig. 27 for the 26.5 min gradient. Obviously, band broadening, peak distortion and
peak tailing occured. Atenolol and paracetamol, which are not shown in Fig. 27, were not de-
tectable. The retention times and the separation performance of each two adjacent peaks are
listed in Table 5.1.
Besides the limited separation performance overall, the peak pairs simazine/carbamazepine and
atrazine/naproxen drew special attention. The initial gradient chromatograms yielded the infor-
mation at which fraction of solvent B the compounds elute. In case of the 26.5 min gradient,
compound elution started at approximately 60 % B whereas the first compound with the 53 min
gradient eluted at about 40 % B. Consequently, there was potential for the reduction of lost chro-
matographic space until the elution of the first compound by increasing the starting fraction of
solvent B. The increase of the starting fraction of solvent B to 40 % B obviously decreased
the elution window. Additionally, the peaks were compressed and the sensitivity improved.
Furthermore, the gradient range was adjusted to the new retention times resulting in a nearly
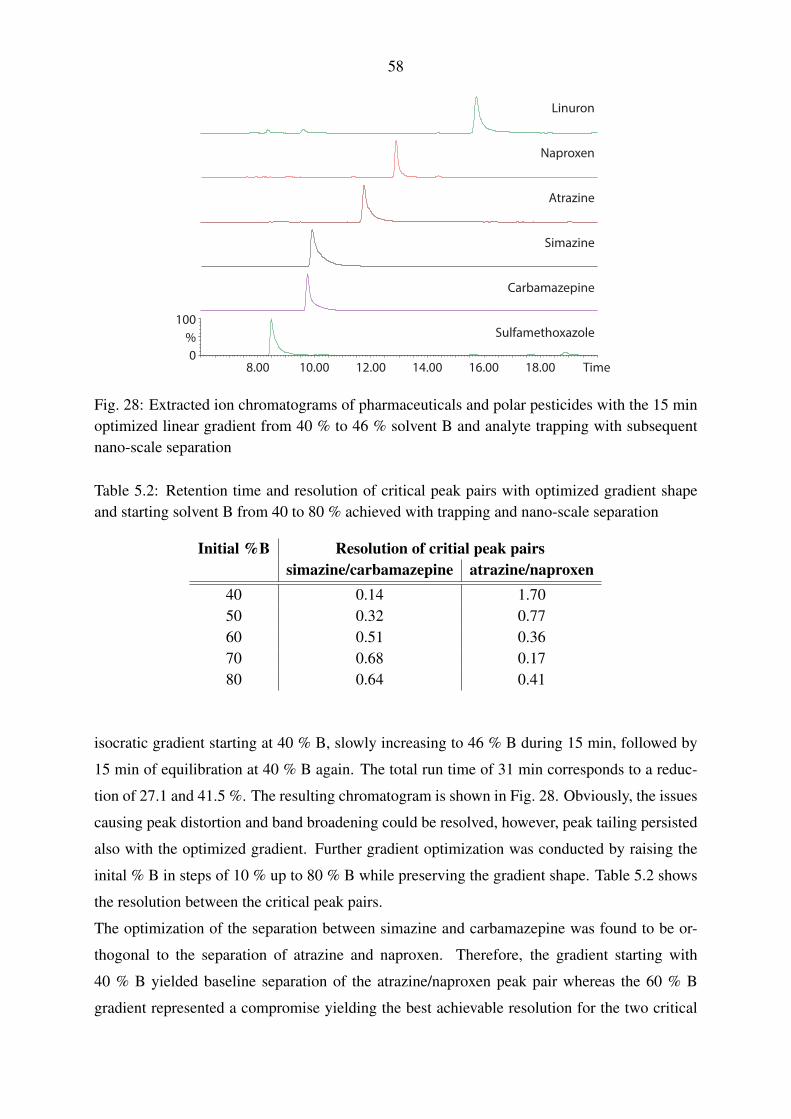
58
Sulfamethoxazole
Simazine
Carbamazepine
Atrazine
Naproxen
Linuron
8.00 10.00 12.00 14.00 16.00 18.00 Time0
100%
Fig. 28: Extracted ion chromatograms of pharmaceuticals and polar pesticides with the 15 minoptimized linear gradient from 40 % to 46 % solvent B and analyte trapping with subsequentnano-scale separation
Table 5.2: Retention time and resolution of critical peak pairs with optimized gradient shapeand starting solvent B from 40 to 80 % achieved with trapping and nano-scale separation
Initial %B Resolution of critial peak pairssimazine/carbamazepine atrazine/naproxen
40 0.14 1.7050 0.32 0.7760 0.51 0.3670 0.68 0.1780 0.64 0.41
isocratic gradient starting at 40 % B, slowly increasing to 46 % B during 15 min, followed by
15 min of equilibration at 40 % B again. The total run time of 31 min corresponds to a reduc-
tion of 27.1 and 41.5 %. The resulting chromatogram is shown in Fig. 28. Obviously, the issues
causing peak distortion and band broadening could be resolved, however, peak tailing persisted
also with the optimized gradient. Further gradient optimization was conducted by raising the
inital % B in steps of 10 % up to 80 % B while preserving the gradient shape. Table 5.2 shows
the resolution between the critical peak pairs.
The optimization of the separation between simazine and carbamazepine was found to be or-
thogonal to the separation of atrazine and naproxen. Therefore, the gradient starting with
40 % B yielded baseline separation of the atrazine/naproxen peak pair whereas the 60 % B
gradient represented a compromise yielding the best achievable resolution for the two critical
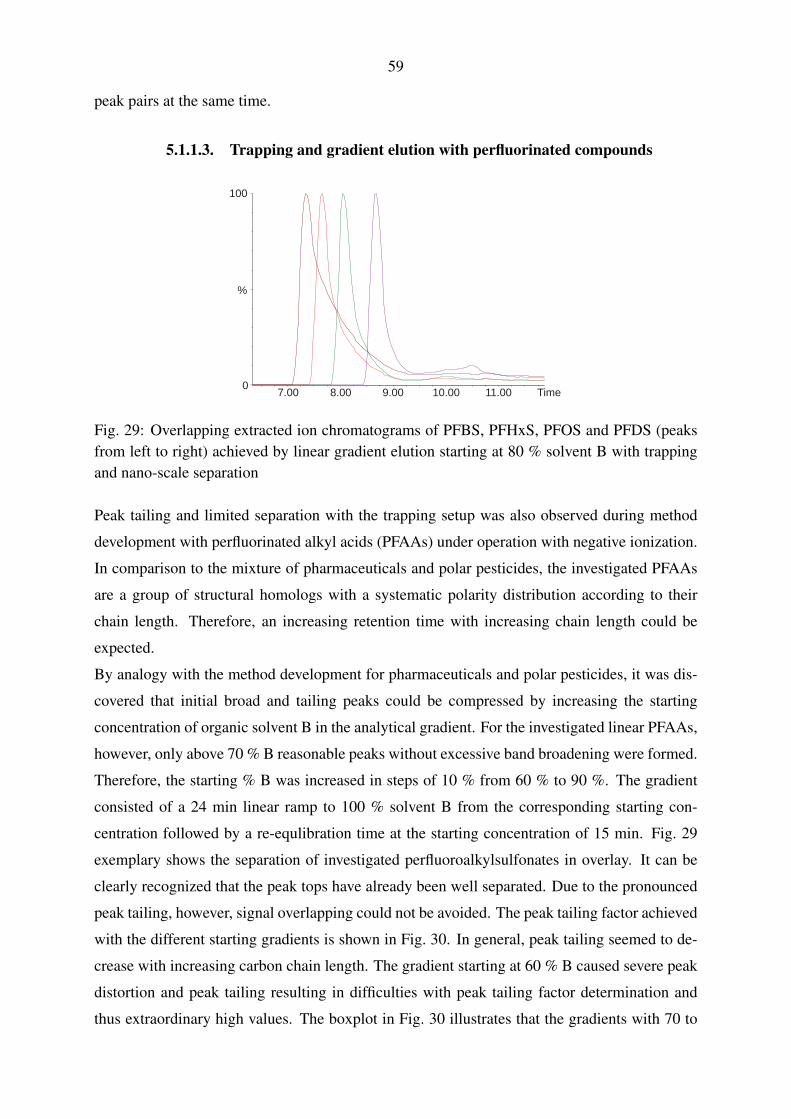
59
peak pairs at the same time.
5.1.1.3. Trapping and gradient elution with perfluorinated compounds
7.00 8.00 9.00 10.00 11.00
100
0
%
Time
Fig. 29: Overlapping extracted ion chromatograms of PFBS, PFHxS, PFOS and PFDS (peaksfrom left to right) achieved by linear gradient elution starting at 80 % solvent B with trappingand nano-scale separation
Peak tailing and limited separation with the trapping setup was also observed during method
development with perfluorinated alkyl acids (PFAAs) under operation with negative ionization.
In comparison to the mixture of pharmaceuticals and polar pesticides, the investigated PFAAs
are a group of structural homologs with a systematic polarity distribution according to their
chain length. Therefore, an increasing retention time with increasing chain length could be
expected.
By analogy with the method development for pharmaceuticals and polar pesticides, it was dis-
covered that initial broad and tailing peaks could be compressed by increasing the starting
concentration of organic solvent B in the analytical gradient. For the investigated linear PFAAs,
however, only above 70 % B reasonable peaks without excessive band broadening were formed.
Therefore, the starting % B was increased in steps of 10 % from 60 % to 90 %. The gradient
consisted of a 24 min linear ramp to 100 % solvent B from the corresponding starting con-
centration followed by a re-equlibration time at the starting concentration of 15 min. Fig. 29
exemplary shows the separation of investigated perfluoroalkylsulfonates in overlay. It can be
clearly recognized that the peak tops have already been well separated. Due to the pronounced
peak tailing, however, signal overlapping could not be avoided. The peak tailing factor achieved
with the different starting gradients is shown in Fig. 30. In general, peak tailing seemed to de-
crease with increasing carbon chain length. The gradient starting at 60 % B caused severe peak
distortion and peak tailing resulting in difficulties with peak tailing factor determination and
thus extraordinary high values. The boxplot in Fig. 30 illustrates that the gradients with 70 to
60
5 1 0 1 5 2 00
2 0
4 0
6 0
8 0
1 0 0 4 0 / 6 0 3 0 / 7 0 2 0 / 8 0 1 0 / 9 0
Peak
tailing
facto
r
C h a i n l e n g t h / N u m b e r o f c a r b o n a t o m s4 0 / 6 0 3 0 / 7 0 2 0 / 8 0 1 0 / 9 0
0
2 0
4 0
6 0
8 0
1 0 0
Peak
tailing
facto
rG r a d i e n t s t a r t i n g s o l v e n t A / B
Fig. 30: Left: USP peak tailing factors of PFAAs against their chain length determined withgradients starting at different solvent A/B ratios; right: boxplot for the illustration of the USPpeak tailing factor spreading achieved with the different starting solvent A/B ratios
90 % solvent B as starting solvent composition yielded comparable results in terms of peak
tailing. All developed elution methods for PFAAs with analyte trapping, however, could not
reduce the peak tailing factor to values below 1.5, consequently, the peak shape could not be
regarded as acceptable. Besides, the pronounced peak tailing rendered the determination of
chromatographic resolution impossible.
5.1.2. Nano-scale chromatography with direct injection
5.1.2.1. Gradient elution with pharmaceuticals and polar pesticides
The removal of the trapping column and change of the fluidic configuration to direct injection
(DI, see also Fig. 17) required the addition of gradient time needed for the flushing of the sam-
ple loop at the low analytical flow rates between 0.25 and 0.3 µL min−1. This was achieved
by introducing an isocratic hold with 0 % B at the beginning of the analytical gradient adjusted
to the loop volume installed (the 2 µL sample loop was predominantely used for nano-scale
separations with DI). The inserted isocratic hold at the beginning of the gradient leads to a
concentration of the sample at the top of the column, at least for the compounds showing rea-
sonable retention on the employed C-18 column chemistry. This process is also referred to as
on-column focusing. Compounds with insufficient retention on the stationary phase, however,
arrive as severely broad and tailing signals with low intensity at the detector rendering their
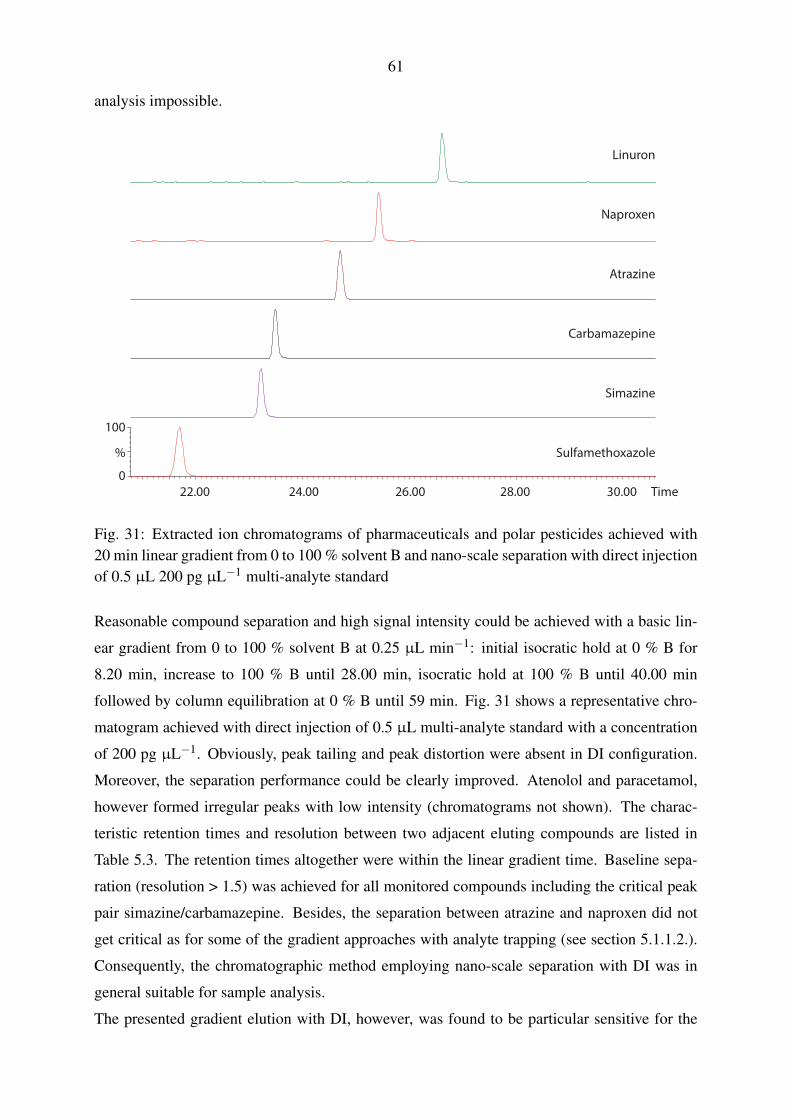
61
analysis impossible.
22.00 24.00 26.00 28.00 30.00 Time
Sulfamethoxazole
Simazine
Carbamazepine
Atrazine
Naproxen
Linuron
100
%
0
Fig. 31: Extracted ion chromatograms of pharmaceuticals and polar pesticides achieved with20 min linear gradient from 0 to 100 % solvent B and nano-scale separation with direct injectionof 0.5 µL 200 pg µL−1 multi-analyte standard
Reasonable compound separation and high signal intensity could be achieved with a basic lin-
ear gradient from 0 to 100 % solvent B at 0.25 µL min−1: initial isocratic hold at 0 % B for
8.20 min, increase to 100 % B until 28.00 min, isocratic hold at 100 % B until 40.00 min
followed by column equilibration at 0 % B until 59 min. Fig. 31 shows a representative chro-
matogram achieved with direct injection of 0.5 µL multi-analyte standard with a concentration
of 200 pg µL−1. Obviously, peak tailing and peak distortion were absent in DI configuration.
Moreover, the separation performance could be clearly improved. Atenolol and paracetamol,
however formed irregular peaks with low intensity (chromatograms not shown). The charac-
teristic retention times and resolution between two adjacent eluting compounds are listed in
Table 5.3. The retention times altogether were within the linear gradient time. Baseline sepa-
ration (resolution > 1.5) was achieved for all monitored compounds including the critical peak
pair simazine/carbamazepine. Besides, the separation between atrazine and naproxen did not
get critical as for some of the gradient approaches with analyte trapping (see section 5.1.1.2.).
Consequently, the chromatographic method employing nano-scale separation with DI was in
general suitable for sample analysis.
The presented gradient elution with DI, however, was found to be particular sensitive for the
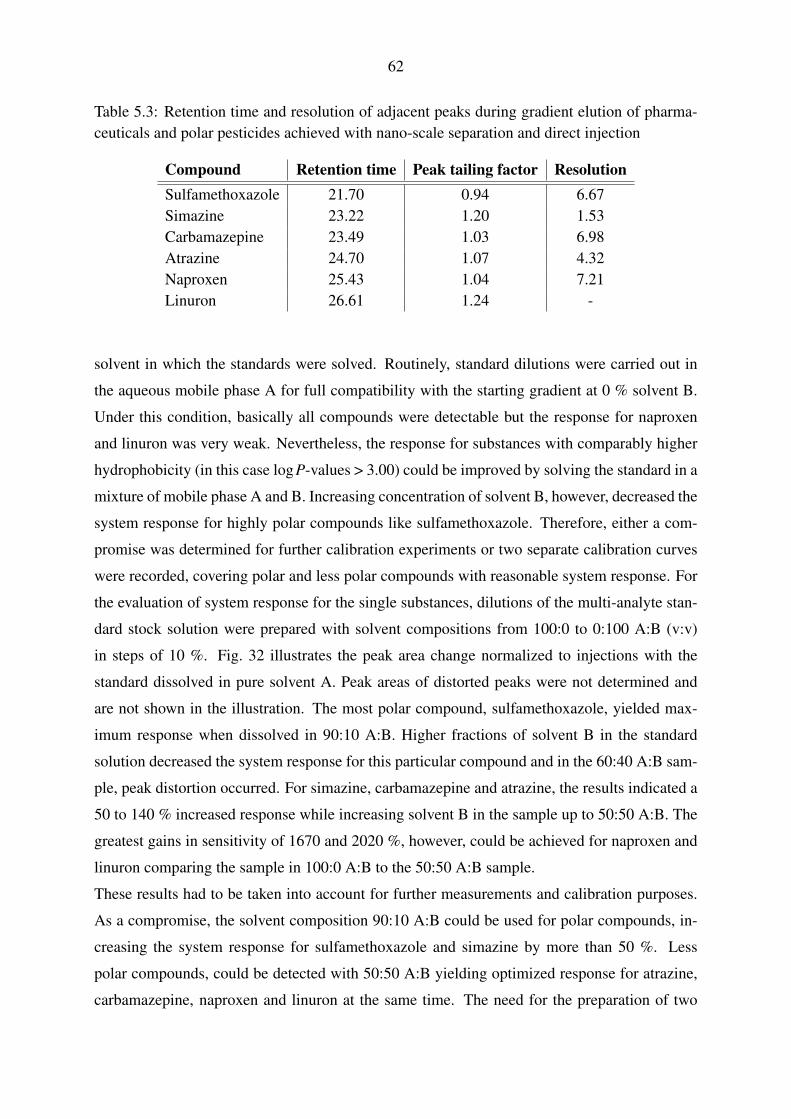
62
Table 5.3: Retention time and resolution of adjacent peaks during gradient elution of pharma-ceuticals and polar pesticides achieved with nano-scale separation and direct injection
Compound Retention time Peak tailing factor ResolutionSulfamethoxazole 21.70 0.94 6.67Simazine 23.22 1.20 1.53Carbamazepine 23.49 1.03 6.98Atrazine 24.70 1.07 4.32Naproxen 25.43 1.04 7.21Linuron 26.61 1.24 -
solvent in which the standards were solved. Routinely, standard dilutions were carried out in
the aqueous mobile phase A for full compatibility with the starting gradient at 0 % solvent B.
Under this condition, basically all compounds were detectable but the response for naproxen
and linuron was very weak. Nevertheless, the response for substances with comparably higher
hydrophobicity (in this case logP-values > 3.00) could be improved by solving the standard in a
mixture of mobile phase A and B. Increasing concentration of solvent B, however, decreased the
system response for highly polar compounds like sulfamethoxazole. Therefore, either a com-
promise was determined for further calibration experiments or two separate calibration curves
were recorded, covering polar and less polar compounds with reasonable system response. For
the evaluation of system response for the single substances, dilutions of the multi-analyte stan-
dard stock solution were prepared with solvent compositions from 100:0 to 0:100 A:B (v:v)
in steps of 10 %. Fig. 32 illustrates the peak area change normalized to injections with the
standard dissolved in pure solvent A. Peak areas of distorted peaks were not determined and
are not shown in the illustration. The most polar compound, sulfamethoxazole, yielded max-
imum response when dissolved in 90:10 A:B. Higher fractions of solvent B in the standard
solution decreased the system response for this particular compound and in the 60:40 A:B sam-
ple, peak distortion occurred. For simazine, carbamazepine and atrazine, the results indicated a
50 to 140 % increased response while increasing solvent B in the sample up to 50:50 A:B. The
greatest gains in sensitivity of 1670 and 2020 %, however, could be achieved for naproxen and
linuron comparing the sample in 100:0 A:B to the 50:50 A:B sample.
These results had to be taken into account for further measurements and calibration purposes.
As a compromise, the solvent composition 90:10 A:B could be used for polar compounds, in-
creasing the system response for sulfamethoxazole and simazine by more than 50 %. Less
polar compounds, could be detected with 50:50 A:B yielding optimized response for atrazine,
carbamazepine, naproxen and linuron at the same time. The need for the preparation of two
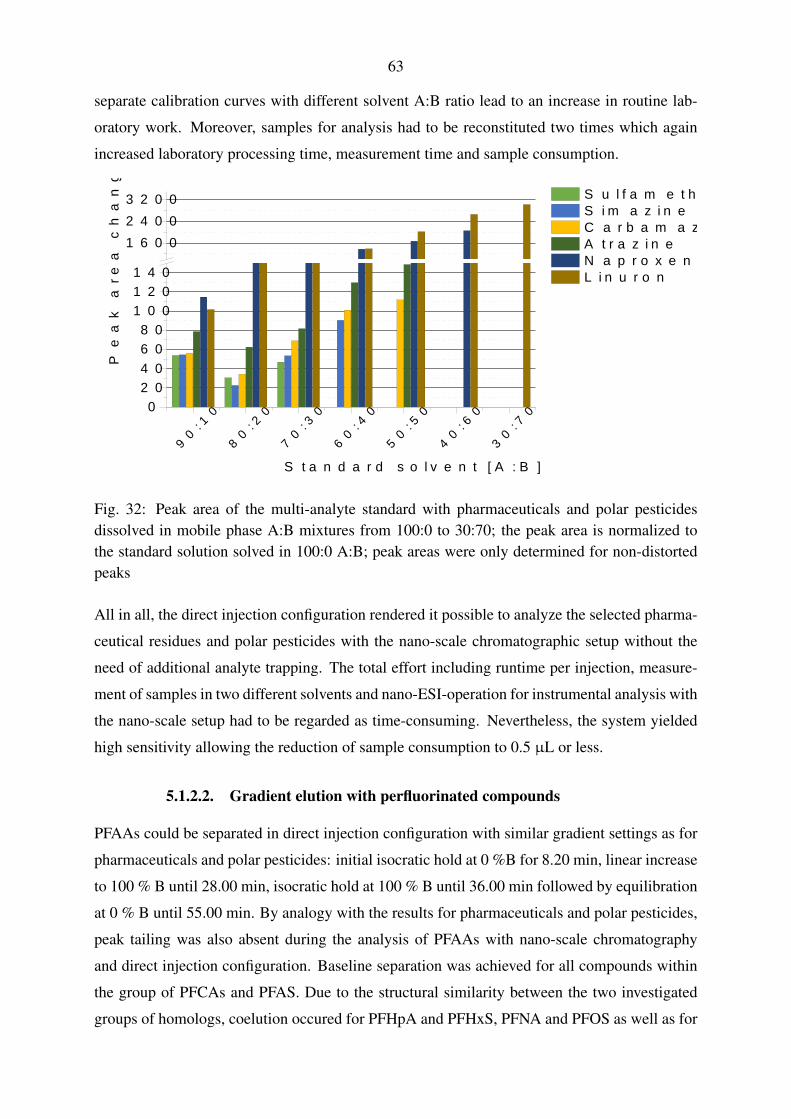
63
separate calibration curves with different solvent A:B ratio lead to an increase in routine lab-
oratory work. Moreover, samples for analysis had to be reconstituted two times which again
increased laboratory processing time, measurement time and sample consumption.
9 0 : 10
8 0 : 20
7 0 : 30
6 0 : 40
5 0 : 50
4 0 : 60
3 0 : 70
02 04 06 08 0
1 0 01 2 01 4 0
1 6 0 02 4 0 03 2 0 0
Peak
area c
hang
e [%]
S t a n d a r d s o l v e n t [ A : B ]
S u l f a m e t h o x a z o l e S i m a z i n e C a r b a m a z e p i n e A t r a z i n e N a p r o x e n L i n u r o n
Fig. 32: Peak area of the multi-analyte standard with pharmaceuticals and polar pesticidesdissolved in mobile phase A:B mixtures from 100:0 to 30:70; the peak area is normalized tothe standard solution solved in 100:0 A:B; peak areas were only determined for non-distortedpeaks
All in all, the direct injection configuration rendered it possible to analyze the selected pharma-
ceutical residues and polar pesticides with the nano-scale chromatographic setup without the
need of additional analyte trapping. The total effort including runtime per injection, measure-
ment of samples in two different solvents and nano-ESI-operation for instrumental analysis with
the nano-scale setup had to be regarded as time-consuming. Nevertheless, the system yielded
high sensitivity allowing the reduction of sample consumption to 0.5 µL or less.
5.1.2.2. Gradient elution with perfluorinated compounds
PFAAs could be separated in direct injection configuration with similar gradient settings as for
pharmaceuticals and polar pesticides: initial isocratic hold at 0 %B for 8.20 min, linear increase
to 100 % B until 28.00 min, isocratic hold at 100 % B until 36.00 min followed by equilibration
at 0 % B until 55.00 min. By analogy with the results for pharmaceuticals and polar pesticides,
peak tailing was also absent during the analysis of PFAAs with nano-scale chromatography
and direct injection configuration. Baseline separation was achieved for all compounds within
the group of PFCAs and PFAS. Due to the structural similarity between the two investigated
groups of homologs, coelution occured for PFHpA and PFHxS, PFNA and PFOS as well as for
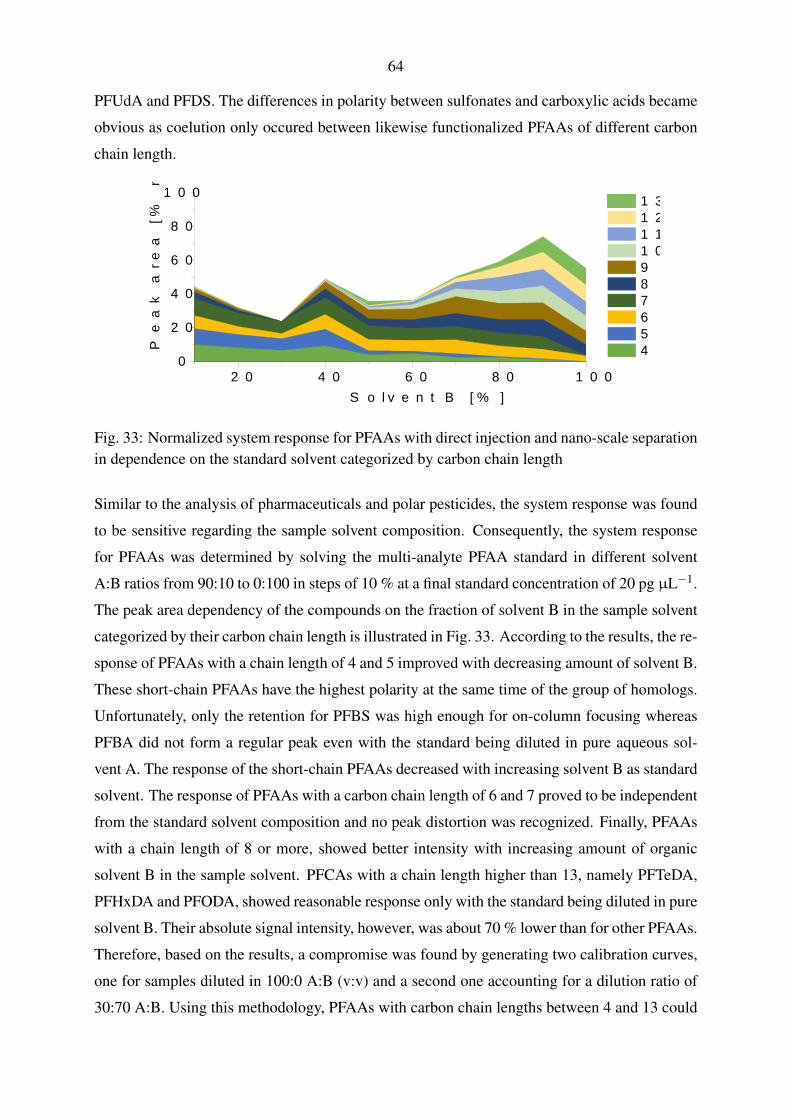
64
PFUdA and PFDS. The differences in polarity between sulfonates and carboxylic acids became
obvious as coelution only occured between likewise functionalized PFAAs of different carbon
chain length.
2 0 4 0 6 0 8 0 1 0 00
2 04 06 08 0
1 0 0
Peak
area [
% ma
ximum
]
S o l v e n t B [ % ]
1 3 1 2 1 1 1 0 9 8 7 6 5 4
Fig. 33: Normalized system response for PFAAs with direct injection and nano-scale separationin dependence on the standard solvent categorized by carbon chain length
Similar to the analysis of pharmaceuticals and polar pesticides, the system response was found
to be sensitive regarding the sample solvent composition. Consequently, the system response
for PFAAs was determined by solving the multi-analyte PFAA standard in different solvent
A:B ratios from 90:10 to 0:100 in steps of 10 % at a final standard concentration of 20 pg µL−1.
The peak area dependency of the compounds on the fraction of solvent B in the sample solvent
categorized by their carbon chain length is illustrated in Fig. 33. According to the results, the re-
sponse of PFAAs with a chain length of 4 and 5 improved with decreasing amount of solvent B.
These short-chain PFAAs have the highest polarity at the same time of the group of homologs.
Unfortunately, only the retention for PFBS was high enough for on-column focusing whereas
PFBA did not form a regular peak even with the standard being diluted in pure aqueous sol-
vent A. The response of the short-chain PFAAs decreased with increasing solvent B as standard
solvent. The response of PFAAs with a carbon chain length of 6 and 7 proved to be independent
from the standard solvent composition and no peak distortion was recognized. Finally, PFAAs
with a chain length of 8 or more, showed better intensity with increasing amount of organic
solvent B in the sample solvent. PFCAs with a chain length higher than 13, namely PFTeDA,
PFHxDA and PFODA, showed reasonable response only with the standard being diluted in pure
solvent B. Their absolute signal intensity, however, was about 70 % lower than for other PFAAs.
Therefore, based on the results, a compromise was found by generating two calibration curves,
one for samples diluted in 100:0 A:B (v:v) and a second one accounting for a dilution ratio of
30:70 A:B. Using this methodology, PFAAs with carbon chain lengths between 4 and 13 could
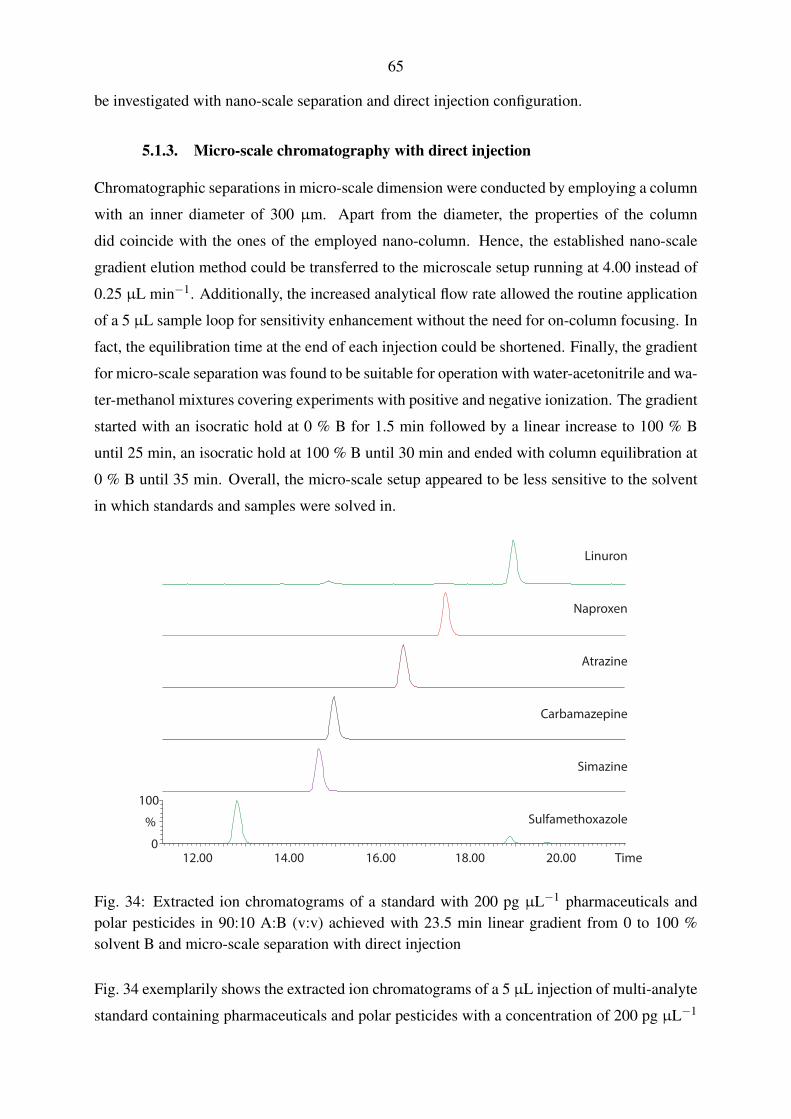
65
be investigated with nano-scale separation and direct injection configuration.
5.1.3. Micro-scale chromatography with direct injection
Chromatographic separations in micro-scale dimension were conducted by employing a column
with an inner diameter of 300 µm. Apart from the diameter, the properties of the column
did coincide with the ones of the employed nano-column. Hence, the established nano-scale
gradient elution method could be transferred to the microscale setup running at 4.00 instead of
0.25 µL min−1. Additionally, the increased analytical flow rate allowed the routine application
of a 5 µL sample loop for sensitivity enhancement without the need for on-column focusing. In
fact, the equilibration time at the end of each injection could be shortened. Finally, the gradient
for micro-scale separation was found to be suitable for operation with water-acetonitrile and wa-
ter-methanol mixtures covering experiments with positive and negative ionization. The gradient
started with an isocratic hold at 0 % B for 1.5 min followed by a linear increase to 100 % B
until 25 min, an isocratic hold at 100 % B until 30 min and ended with column equilibration at
0 % B until 35 min. Overall, the micro-scale setup appeared to be less sensitive to the solvent
in which standards and samples were solved in.
12.00 14.00 16.00 18.00 20.00
100
0
%
Time
Sulfamethoxazole
Simazine
Carbamazepine
Atrazine
Naproxen
Linuron
Fig. 34: Extracted ion chromatograms of a standard with 200 pg µL−1 pharmaceuticals andpolar pesticides in 90:10 A:B (v:v) achieved with 23.5 min linear gradient from 0 to 100 %solvent B and micro-scale separation with direct injection
Fig. 34 exemplarily shows the extracted ion chromatograms of a 5 µL injection of multi-analyte
standard containing pharmaceuticals and polar pesticides with a concentration of 200 pg µL−1
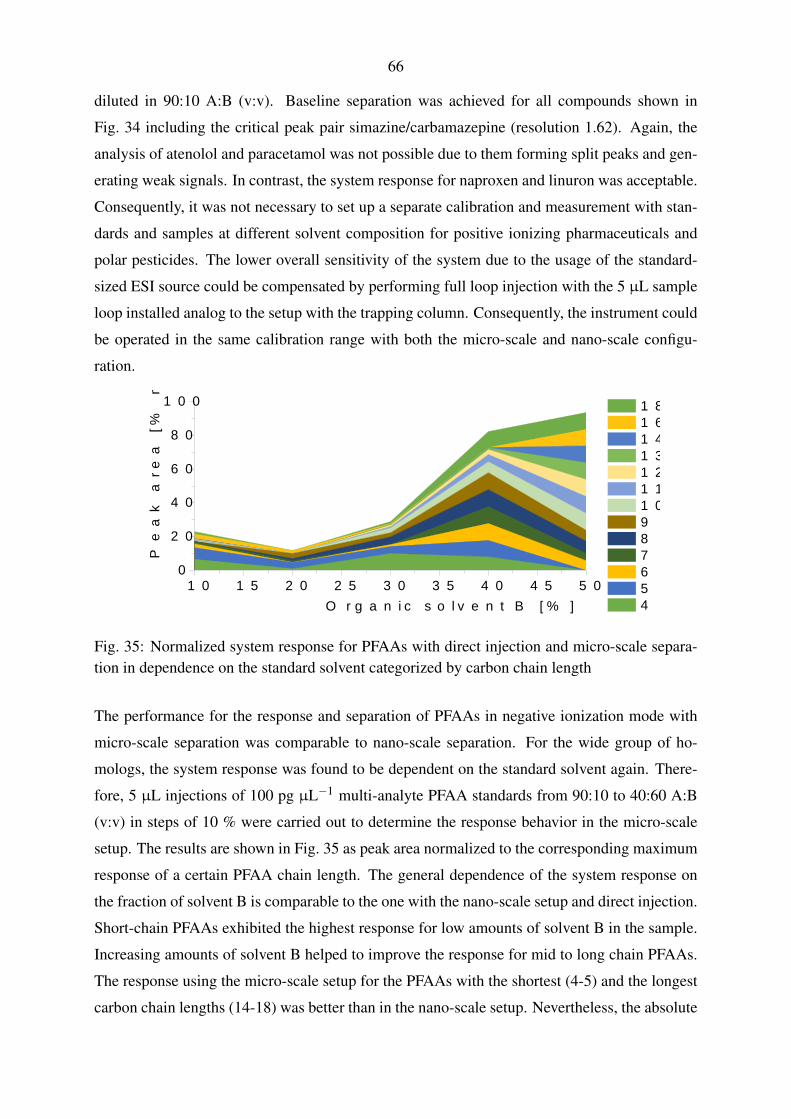
66
diluted in 90:10 A:B (v:v). Baseline separation was achieved for all compounds shown in
Fig. 34 including the critical peak pair simazine/carbamazepine (resolution 1.62). Again, the
analysis of atenolol and paracetamol was not possible due to them forming split peaks and gen-
erating weak signals. In contrast, the system response for naproxen and linuron was acceptable.
Consequently, it was not necessary to set up a separate calibration and measurement with stan-
dards and samples at different solvent composition for positive ionizing pharmaceuticals and
polar pesticides. The lower overall sensitivity of the system due to the usage of the standard-
sized ESI source could be compensated by performing full loop injection with the 5 µL sample
loop installed analog to the setup with the trapping column. Consequently, the instrument could
be operated in the same calibration range with both the micro-scale and nano-scale configu-
ration.
1 0 1 5 2 0 2 5 3 0 3 5 4 0 4 5 5 00
2 04 06 08 0
1 0 0
Peak
area [
% ma
ximum
]
O r g a n i c s o l v e n t B [ % ]
1 8 1 6 1 4 1 3 1 2 1 1 1 0 9 8 7 6 5 4
Fig. 35: Normalized system response for PFAAs with direct injection and micro-scale separa-tion in dependence on the standard solvent categorized by carbon chain length
The performance for the response and separation of PFAAs in negative ionization mode with
micro-scale separation was comparable to nano-scale separation. For the wide group of ho-
mologs, the system response was found to be dependent on the standard solvent again. There-
fore, 5 µL injections of 100 pg µL−1 multi-analyte PFAA standards from 90:10 to 40:60 A:B
(v:v) in steps of 10 % were carried out to determine the response behavior in the micro-scale
setup. The results are shown in Fig. 35 as peak area normalized to the corresponding maximum
response of a certain PFAA chain length. The general dependence of the system response on
the fraction of solvent B is comparable to the one with the nano-scale setup and direct injection.
Short-chain PFAAs exhibited the highest response for low amounts of solvent B in the sample.
Increasing amounts of solvent B helped to improve the response for mid to long chain PFAAs.
The response using the micro-scale setup for the PFAAs with the shortest (4-5) and the longest
carbon chain lengths (14-18) was better than in the nano-scale setup. Nevertheless, the absolute
67
intensity and signal stability for PFBA, PFTeDA, PFHxDA and PFODA was still insufficient for
reliable calibration and quantification. In comparison to the nano-scale setup, lower amounts
of solvent B were enough to cover the maximum response for PFAAs with more than 8 carbon
atoms. Based on the results, further PFAA measurements with micro-scale separation were car-
ried out either in pure solvent A for optimized response of short-chain PFAAs or in 40:60 A:B
(v:v) for good response of mid- and long-chain PFAAs.
5.1.4. Applicability of the fluidic configurations for calibration and quantification
Three different fluidic setups were evaluated regarding their applicability for the analysis of a
selection of pharmaceutical active ingredients, polar pesticides and PFAAs. Taking the results
achieved with nano-scale chromatography and analyte trapping into account, it has to be con-
cluded that this fluidic configuration is not suitable for the analysis of small (<1000 Da) and
polar molecules. The trapping column could be identified as the main reason for low sensitivity
and peak tailing in this setup. The analyte loss during the trapping step was found to be expo-
nential negatively correlated with the trapping volume. The observed peak tailing was absent in
two other tested setups without analyte trapping. Consequently, the analyte trapping step could
be identified as cause for the peak tailing issues which could not be resolved by the adjustment
of the analytical gradient. It was suggested that polar analytes might already get partly sep-
arated during the trapping step which causes broad analyte bands which are flushed onto the
analytical column for separation. Unfortunately, due to the limited commercial availability and
compatibility of pre-columns with the employed chromatography system, it was not possible to
evaluate the performance of the system with other trapping columns.
With both possible DI configurations in nano- and micro-scale, peak tailing was absent and
the separation performance clearly improved. Baseline separation could be achieved for most
substances by employing a simplified linear gradient that needed only minor optimizations.
In general, both configurations were suitable for calibration and quantification experiments.
The DI configuration harnessed the extended capabilities of the analytical column regarding
the retention of highly polar substances. Thereby, the sample is concentrated at the top of
the column (on-column focusing) instead of preconcentration on a separate trapping column.
Consequently, analytes which showed only limited retention on the employed column chemistry
eluted as broad bands or were not detectable at all. Both setups lead to a systematic overload of
the analytical columns as the injected sample volume is large compared to the column volume.
In that sense, DI with nano-scale separation demonstrated the highest degree of column over-
loading. The column dimensions of 75 µm i. d. and 150 mm length correspond to a capillary
column volume of 0.66 µL. The injection volume in the autosampler, however, could only be
68
reduced to a minimum of 0.2 µL independently from the sample loop volume. This injection
volume already corresponds to 30 % of the total column volume. Moreover, the complete flush-
ing of the 2 and 5 µL sample loop in each analytical run required 3.02 and 7.55 column volumes,
respectively. The micro-scale setup demonstrated the effect of a larger column volume on the
separation while leaving the injection loop volumes constant. With 10.60 µL, the 300 µm i. d.
column had a 16 times higher column volume than the nano-column. The 2 and 5 µL sample
loop volumes now corresponded to only 0.19 and 0.47 column volumes. Judging from the re-
sults, the micro-scale column enabled the decrease of the run-time of a single injection while
maintaining separation performance. The operation at higher flow rate with larger column vol-
ume, however, automatically leads to higher sample dilution and lower total system sensitivity.
This drawback could be compensated by increasing the sample injection volume. This relation-
ship between sample consumption and system response was important for defining the goals of
the method development: comparing the system sensitivity with nano- and micro-scale setup,
the response was higher with the nano-configuration due to less sample dilution and higher ef-
ficiency factor of the nano-ESI. While the sensitivity was increased, the injection volume had
to be decreased at the same time to avoid the exceeding of the column capacity. Consequently,
sample analysis could only benefit from the increased sensitivity of the nano-scale setup when
decreasing the sample volume. If sample volume is not a limiting factor, the micro-scale setup
can yield a comparable system response just by increasing the sample volume by a factor of
10 from 0.5 to 5 µL. It has to be remarked that the total sample consumption per injection was
10 µL (with a loop overfill factor of 2).
Although the preparation of standard solutions for calibration purposes was established with
pipettes that allowed precise liquid handling in the range between 100 and 1000 µL, it was
challenging to guarantee high precision and accuracy of calibration standards below a volume
of 100 µL which were necessary to profit from the nano-system sensitivity. Furthermore, the
technical needle placement precision of the autosampler was found to reach its limits for the
reliable and reproducible injection of sample volumes below 20 µL. Although sample vial in-
serts were employed to increase the sample needle immersion distance for small volumes, the
response deviation between standard injections was found to be higher for standards injected
from small volumes than from standards in higher volumes (50 to 100 µL). For one main goal
of the work presented, the development of a reliable method for quantification, reproducibility
between injections for system calibration and sample measurement was critical. Qualitative
measurements, like application in proteomics, for which reproducibility and precision is of mi-
nor interest but sample amount is limited, the full advantages of nano-scale chromatography
could be capitalized.
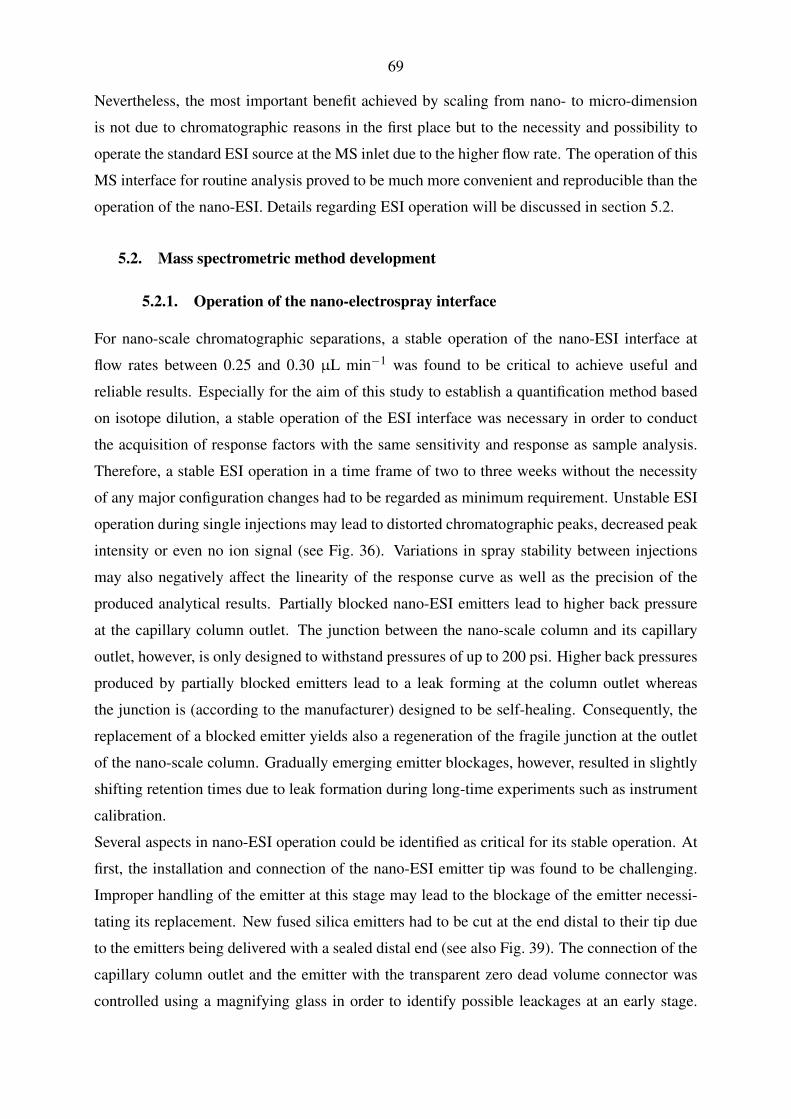
69
Nevertheless, the most important benefit achieved by scaling from nano- to micro-dimension
is not due to chromatographic reasons in the first place but to the necessity and possibility to
operate the standard ESI source at the MS inlet due to the higher flow rate. The operation of this
MS interface for routine analysis proved to be much more convenient and reproducible than the
operation of the nano-ESI. Details regarding ESI operation will be discussed in section 5.2.
5.2. Mass spectrometric method development
5.2.1. Operation of the nano-electrospray interface
For nano-scale chromatographic separations, a stable operation of the nano-ESI interface at
flow rates between 0.25 and 0.30 µL min−1 was found to be critical to achieve useful and
reliable results. Especially for the aim of this study to establish a quantification method based
on isotope dilution, a stable operation of the ESI interface was necessary in order to conduct
the acquisition of response factors with the same sensitivity and response as sample analysis.
Therefore, a stable ESI operation in a time frame of two to three weeks without the necessity
of any major configuration changes had to be regarded as minimum requirement. Unstable ESI
operation during single injections may lead to distorted chromatographic peaks, decreased peak
intensity or even no ion signal (see Fig. 36). Variations in spray stability between injections
may also negatively affect the linearity of the response curve as well as the precision of the
produced analytical results. Partially blocked nano-ESI emitters lead to higher back pressure
at the capillary column outlet. The junction between the nano-scale column and its capillary
outlet, however, is only designed to withstand pressures of up to 200 psi. Higher back pressures
produced by partially blocked emitters lead to a leak forming at the column outlet whereas
the junction is (according to the manufacturer) designed to be self-healing. Consequently, the
replacement of a blocked emitter yields also a regeneration of the fragile junction at the outlet
of the nano-scale column. Gradually emerging emitter blockages, however, resulted in slightly
shifting retention times due to leak formation during long-time experiments such as instrument
calibration.
Several aspects in nano-ESI operation could be identified as critical for its stable operation. At
first, the installation and connection of the nano-ESI emitter tip was found to be challenging.
Improper handling of the emitter at this stage may lead to the blockage of the emitter necessi-
tating its replacement. New fused silica emitters had to be cut at the end distal to their tip due
to the emitters being delivered with a sealed distal end (see also Fig. 39). The connection of the
capillary column outlet and the emitter with the transparent zero dead volume connector was
controlled using a magnifying glass in order to identify possible leackages at an early stage.
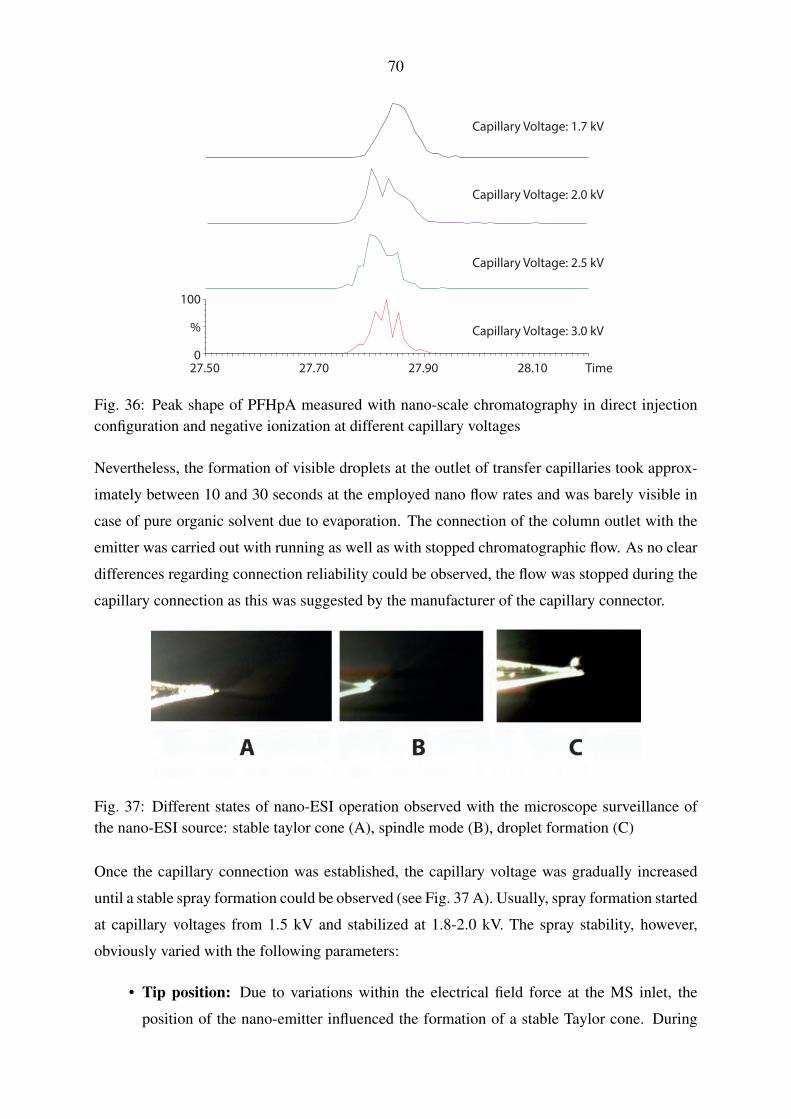
70
Capillary Voltage: 1.7 kV
Capillary Voltage: 2.0 kV
Capillary Voltage: 2.5 kV
Capillary Voltage: 3.0 kV
27.50 27.70 27.90 28.10 Time
100
0
%
Fig. 36: Peak shape of PFHpA measured with nano-scale chromatography in direct injectionconfiguration and negative ionization at different capillary voltages
Nevertheless, the formation of visible droplets at the outlet of transfer capillaries took approx-
imately between 10 and 30 seconds at the employed nano flow rates and was barely visible in
case of pure organic solvent due to evaporation. The connection of the column outlet with the
emitter was carried out with running as well as with stopped chromatographic flow. As no clear
differences regarding connection reliability could be observed, the flow was stopped during the
capillary connection as this was suggested by the manufacturer of the capillary connector.
Fig. 37: Different states of nano-ESI operation observed with the microscope surveillance ofthe nano-ESI source: stable taylor cone (A), spindle mode (B), droplet formation (C)
Once the capillary connection was established, the capillary voltage was gradually increased
until a stable spray formation could be observed (see Fig. 37 A). Usually, spray formation started
at capillary voltages from 1.5 kV and stabilized at 1.8-2.0 kV. The spray stability, however,
obviously varied with the following parameters:
• Tip position: Due to variations within the electrical field force at the MS inlet, the
position of the nano-emitter influenced the formation of a stable Taylor cone. During
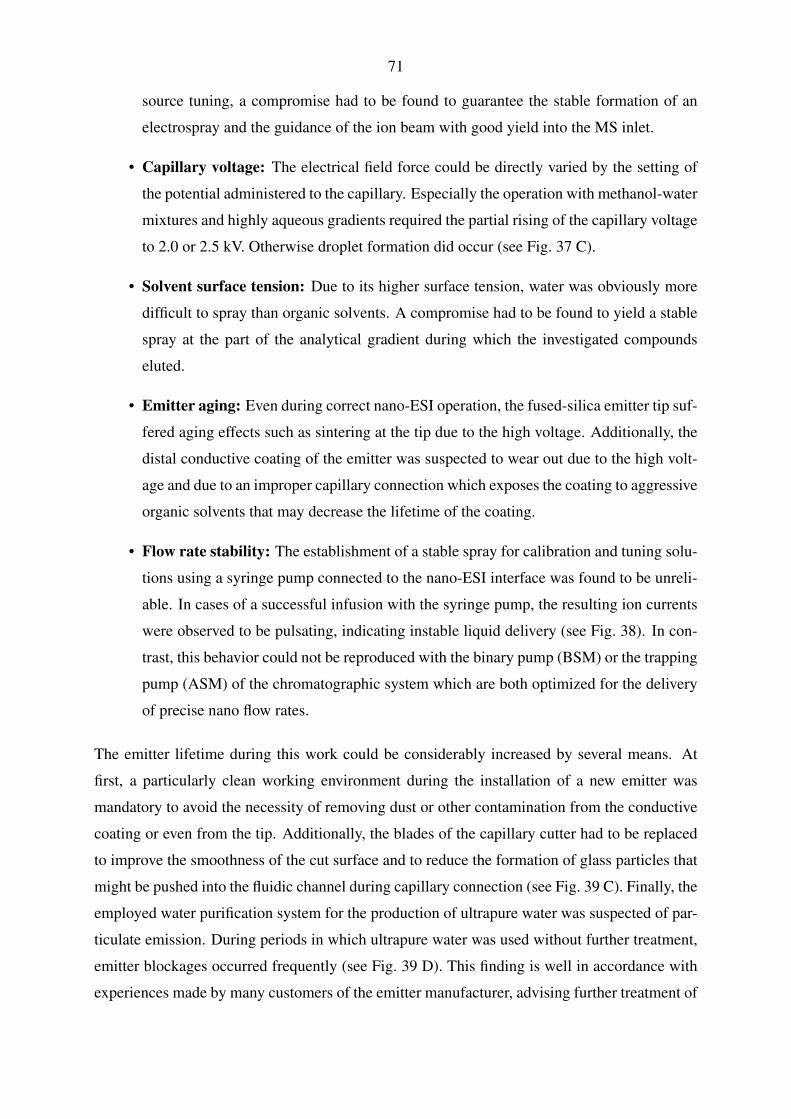
71
source tuning, a compromise had to be found to guarantee the stable formation of an
electrospray and the guidance of the ion beam with good yield into the MS inlet.
• Capillary voltage: The electrical field force could be directly varied by the setting of
the potential administered to the capillary. Especially the operation with methanol-water
mixtures and highly aqueous gradients required the partial rising of the capillary voltage
to 2.0 or 2.5 kV. Otherwise droplet formation did occur (see Fig. 37 C).
• Solvent surface tension: Due to its higher surface tension, water was obviously more
difficult to spray than organic solvents. A compromise had to be found to yield a stable
spray at the part of the analytical gradient during which the investigated compounds
eluted.
• Emitter aging: Even during correct nano-ESI operation, the fused-silica emitter tip suf-
fered aging effects such as sintering at the tip due to the high voltage. Additionally, the
distal conductive coating of the emitter was suspected to wear out due to the high volt-
age and due to an improper capillary connection which exposes the coating to aggressive
organic solvents that may decrease the lifetime of the coating.
• Flow rate stability: The establishment of a stable spray for calibration and tuning solu-
tions using a syringe pump connected to the nano-ESI interface was found to be unreli-
able. In cases of a successful infusion with the syringe pump, the resulting ion currents
were observed to be pulsating, indicating instable liquid delivery (see Fig. 38). In con-
trast, this behavior could not be reproduced with the binary pump (BSM) or the trapping
pump (ASM) of the chromatographic system which are both optimized for the delivery
of precise nano flow rates.
The emitter lifetime during this work could be considerably increased by several means. At
first, a particularly clean working environment during the installation of a new emitter was
mandatory to avoid the necessity of removing dust or other contamination from the conductive
coating or even from the tip. Additionally, the blades of the capillary cutter had to be replaced
to improve the smoothness of the cut surface and to reduce the formation of glass particles that
might be pushed into the fluidic channel during capillary connection (see Fig. 39 C). Finally, the
employed water purification system for the production of ultrapure water was suspected of par-
ticulate emission. During periods in which ultrapure water was used without further treatment,
emitter blockages occurred frequently (see Fig. 39 D). This finding is well in accordance with
experiences made by many customers of the emitter manufacturer, advising further treatment of
72
ASM Pump B
Syringe Pump
4.00 5.00 6.00 7.00 8.00
4.00 5.00 6.00 7.00 8.00
100
%
0
100
%
0 Time
Time
Fig. 38: Total ion current (TIC) of direct infusion of 0.1 % phosphoric acid in 50:50 acetoni-trile:water (v:v) at a flow rate of 0.30 µL min−1 with the nano-ESI interface: the ion signalobtained with the syringe pump is pulsating compared to the signal obtained with pump B ofthe ASM
ultrapure water produced with water purification systems. Thus, an additional water purifica-
tion step for the aqueous mobile phase employing subboiling distillation was introduced which
noticeably reduced emitter blocking.
All measures discussed above allowed the continuous operation of a single emitter tip up to two
months enabling extended calibration and quantification experiments with comparable sensitiv-
ity. The setup of the nano-ESI interface for negative ionization and water-methanol mixtures,
however, remained unreproducible.
5.2.2. Operation of the standard electrospray interface
The operation of the standard-sized electrospray interface was only necessary and possible with
micro-scale chromatography and flow rates of at least 4 µL min −1. In contrast to the nano-ESI,
the spray formation is routinely pneumatically supported by the introduction of heated desolva-
tion gas and nebulizer gas which both help to stabilize the obtained spray and the resulting ion
beam. The stainless steel capillary appeared to act as robust emitter which was virtually immune
to blockages and nonsensitive to aging. Routine replacement of the stainless steel capillary on
a yearly basis was sufficient for reliable and reproducible measurements.
With the manufacturer only supplying basic values for the pneumatic parameters and the tip
position, the ESI source was tuned while infusing a tuning solution of leucine-enkephalin ob-
tained from the manufacturer at a flow rate of 4 µL min−1 solved in acetonitrile:water 50:50
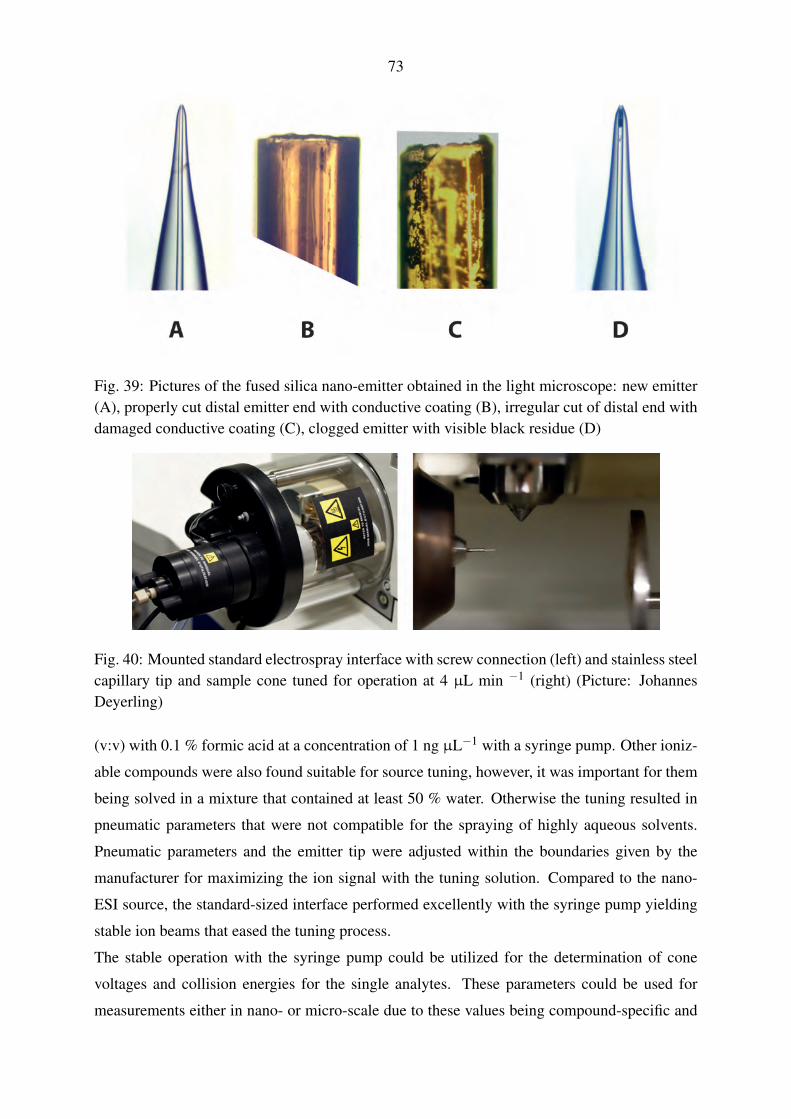
73
Fig. 39: Pictures of the fused silica nano-emitter obtained in the light microscope: new emitter(A), properly cut distal emitter end with conductive coating (B), irregular cut of distal end withdamaged conductive coating (C), clogged emitter with visible black residue (D)
Fig. 40: Mounted standard electrospray interface with screw connection (left) and stainless steelcapillary tip and sample cone tuned for operation at 4 µL min −1 (right) (Picture: JohannesDeyerling)
(v:v) with 0.1 % formic acid at a concentration of 1 ng µL−1 with a syringe pump. Other ioniz-
able compounds were also found suitable for source tuning, however, it was important for them
being solved in a mixture that contained at least 50 % water. Otherwise the tuning resulted in
pneumatic parameters that were not compatible for the spraying of highly aqueous solvents.
Pneumatic parameters and the emitter tip were adjusted within the boundaries given by the
manufacturer for maximizing the ion signal with the tuning solution. Compared to the nano-
ESI source, the standard-sized interface performed excellently with the syringe pump yielding
stable ion beams that eased the tuning process.
The stable operation with the syringe pump could be utilized for the determination of cone
voltages and collision energies for the single analytes. These parameters could be used for
measurements either in nano- or micro-scale due to these values being compound-specific and
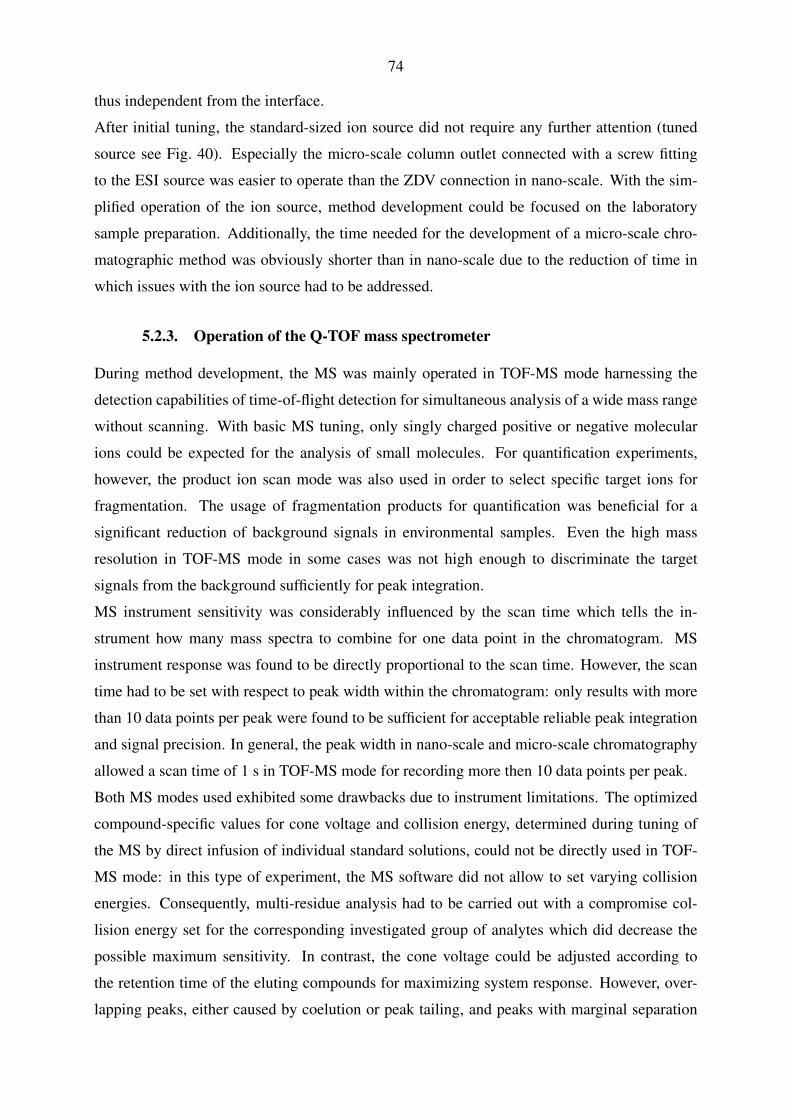
74
thus independent from the interface.
After initial tuning, the standard-sized ion source did not require any further attention (tuned
source see Fig. 40). Especially the micro-scale column outlet connected with a screw fitting
to the ESI source was easier to operate than the ZDV connection in nano-scale. With the sim-
plified operation of the ion source, method development could be focused on the laboratory
sample preparation. Additionally, the time needed for the development of a micro-scale chro-
matographic method was obviously shorter than in nano-scale due to the reduction of time in
which issues with the ion source had to be addressed.
5.2.3. Operation of the Q-TOF mass spectrometer
During method development, the MS was mainly operated in TOF-MS mode harnessing the
detection capabilities of time-of-flight detection for simultaneous analysis of a wide mass range
without scanning. With basic MS tuning, only singly charged positive or negative molecular
ions could be expected for the analysis of small molecules. For quantification experiments,
however, the product ion scan mode was also used in order to select specific target ions for
fragmentation. The usage of fragmentation products for quantification was beneficial for a
significant reduction of background signals in environmental samples. Even the high mass
resolution in TOF-MS mode in some cases was not high enough to discriminate the target
signals from the background sufficiently for peak integration.
MS instrument sensitivity was considerably influenced by the scan time which tells the in-
strument how many mass spectra to combine for one data point in the chromatogram. MS
instrument response was found to be directly proportional to the scan time. However, the scan
time had to be set with respect to peak width within the chromatogram: only results with more
than 10 data points per peak were found to be sufficient for acceptable reliable peak integration
and signal precision. In general, the peak width in nano-scale and micro-scale chromatography
allowed a scan time of 1 s in TOF-MS mode for recording more then 10 data points per peak.
Both MS modes used exhibited some drawbacks due to instrument limitations. The optimized
compound-specific values for cone voltage and collision energy, determined during tuning of
the MS by direct infusion of individual standard solutions, could not be directly used in TOF-
MS mode: in this type of experiment, the MS software did not allow to set varying collision
energies. Consequently, multi-residue analysis had to be carried out with a compromise col-
lision energy set for the corresponding investigated group of analytes which did decrease the
possible maximum sensitivity. In contrast, the cone voltage could be adjusted according to
the retention time of the eluting compounds for maximizing system response. However, over-
lapping peaks, either caused by coelution or peak tailing, and peaks with marginal separation
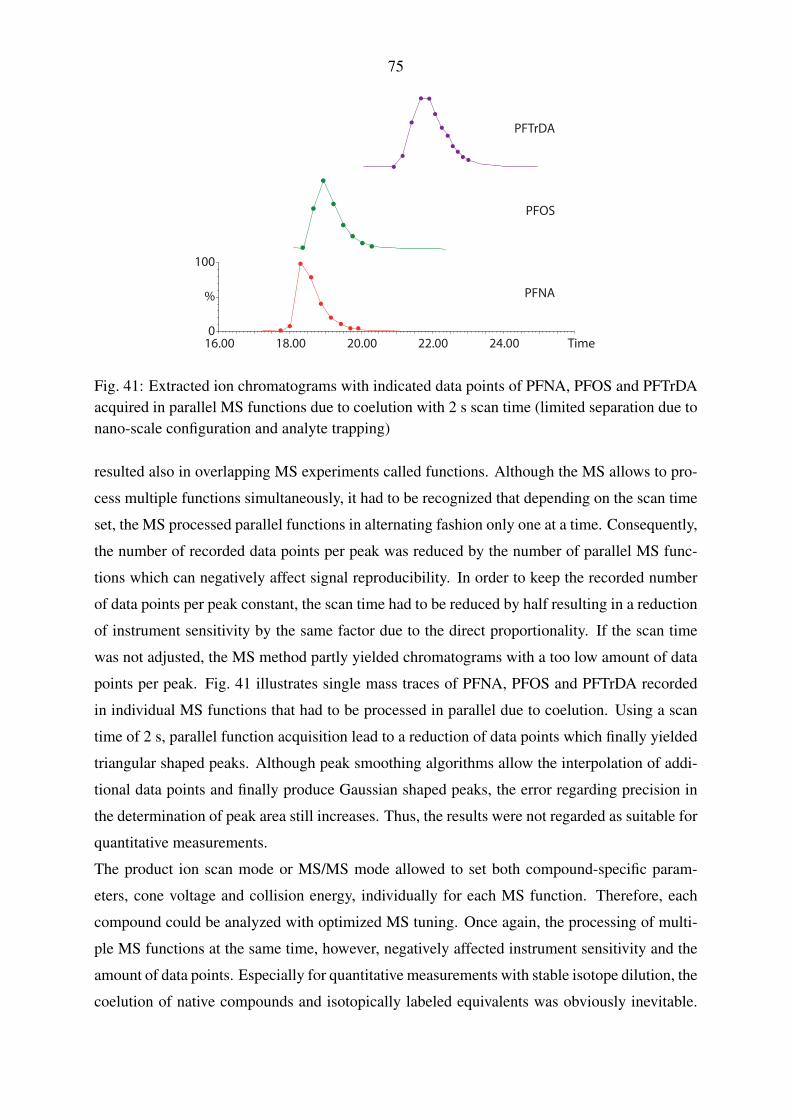
75
16.00 18.00 20.00 22.00 24.00 Time
100
%
0
PFNA
PFOS
PFTrDA
Fig. 41: Extracted ion chromatograms with indicated data points of PFNA, PFOS and PFTrDAacquired in parallel MS functions due to coelution with 2 s scan time (limited separation due tonano-scale configuration and analyte trapping)
resulted also in overlapping MS experiments called functions. Although the MS allows to pro-
cess multiple functions simultaneously, it had to be recognized that depending on the scan time
set, the MS processed parallel functions in alternating fashion only one at a time. Consequently,
the number of recorded data points per peak was reduced by the number of parallel MS func-
tions which can negatively affect signal reproducibility. In order to keep the recorded number
of data points per peak constant, the scan time had to be reduced by half resulting in a reduction
of instrument sensitivity by the same factor due to the direct proportionality. If the scan time
was not adjusted, the MS method partly yielded chromatograms with a too low amount of data
points per peak. Fig. 41 illustrates single mass traces of PFNA, PFOS and PFTrDA recorded
in individual MS functions that had to be processed in parallel due to coelution. Using a scan
time of 2 s, parallel function acquisition lead to a reduction of data points which finally yielded
triangular shaped peaks. Although peak smoothing algorithms allow the interpolation of addi-
tional data points and finally produce Gaussian shaped peaks, the error regarding precision in
the determination of peak area still increases. Thus, the results were not regarded as suitable for
quantitative measurements.
The product ion scan mode or MS/MS mode allowed to set both compound-specific param-
eters, cone voltage and collision energy, individually for each MS function. Therefore, each
compound could be analyzed with optimized MS tuning. Once again, the processing of multi-
ple MS functions at the same time, however, negatively affected instrument sensitivity and the
amount of data points. Especially for quantitative measurements with stable isotope dilution, the
coelution of native compounds and isotopically labeled equivalents was obviously inevitable.
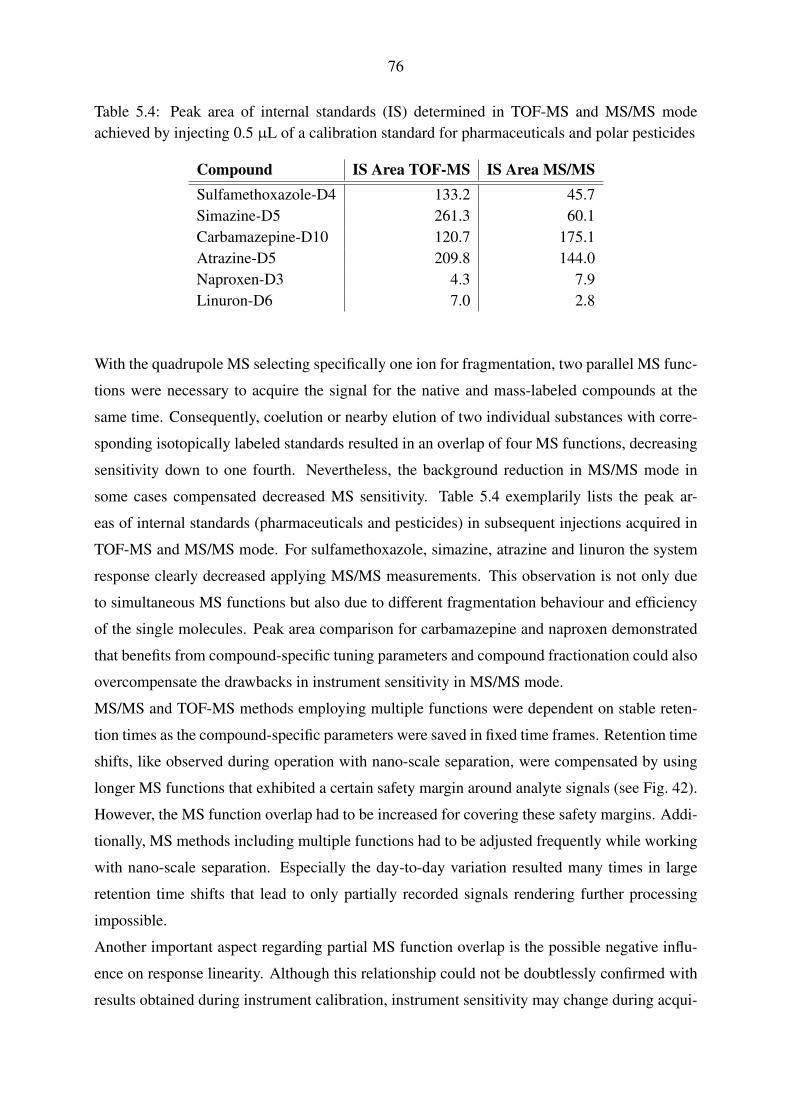
76
Table 5.4: Peak area of internal standards (IS) determined in TOF-MS and MS/MS modeachieved by injecting 0.5 µL of a calibration standard for pharmaceuticals and polar pesticides
Compound IS Area TOF-MS IS Area MS/MSSulfamethoxazole-D4 133.2 45.7Simazine-D5 261.3 60.1Carbamazepine-D10 120.7 175.1Atrazine-D5 209.8 144.0Naproxen-D3 4.3 7.9Linuron-D6 7.0 2.8
With the quadrupole MS selecting specifically one ion for fragmentation, two parallel MS func-
tions were necessary to acquire the signal for the native and mass-labeled compounds at the
same time. Consequently, coelution or nearby elution of two individual substances with corre-
sponding isotopically labeled standards resulted in an overlap of four MS functions, decreasing
sensitivity down to one fourth. Nevertheless, the background reduction in MS/MS mode in
some cases compensated decreased MS sensitivity. Table 5.4 exemplarily lists the peak ar-
eas of internal standards (pharmaceuticals and pesticides) in subsequent injections acquired in
TOF-MS and MS/MS mode. For sulfamethoxazole, simazine, atrazine and linuron the system
response clearly decreased applying MS/MS measurements. This observation is not only due
to simultaneous MS functions but also due to different fragmentation behaviour and efficiency
of the single molecules. Peak area comparison for carbamazepine and naproxen demonstrated
that benefits from compound-specific tuning parameters and compound fractionation could also
overcompensate the drawbacks in instrument sensitivity in MS/MS mode.
MS/MS and TOF-MS methods employing multiple functions were dependent on stable reten-
tion times as the compound-specific parameters were saved in fixed time frames. Retention time
shifts, like observed during operation with nano-scale separation, were compensated by using
longer MS functions that exhibited a certain safety margin around analyte signals (see Fig. 42).
However, the MS function overlap had to be increased for covering these safety margins. Addi-
tionally, MS methods including multiple functions had to be adjusted frequently while working
with nano-scale separation. Especially the day-to-day variation resulted many times in large
retention time shifts that lead to only partially recorded signals rendering further processing
impossible.
Another important aspect regarding partial MS function overlap is the possible negative influ-
ence on response linearity. Although this relationship could not be doubtlessly confirmed with
results obtained during instrument calibration, instrument sensitivity may change during acqui-
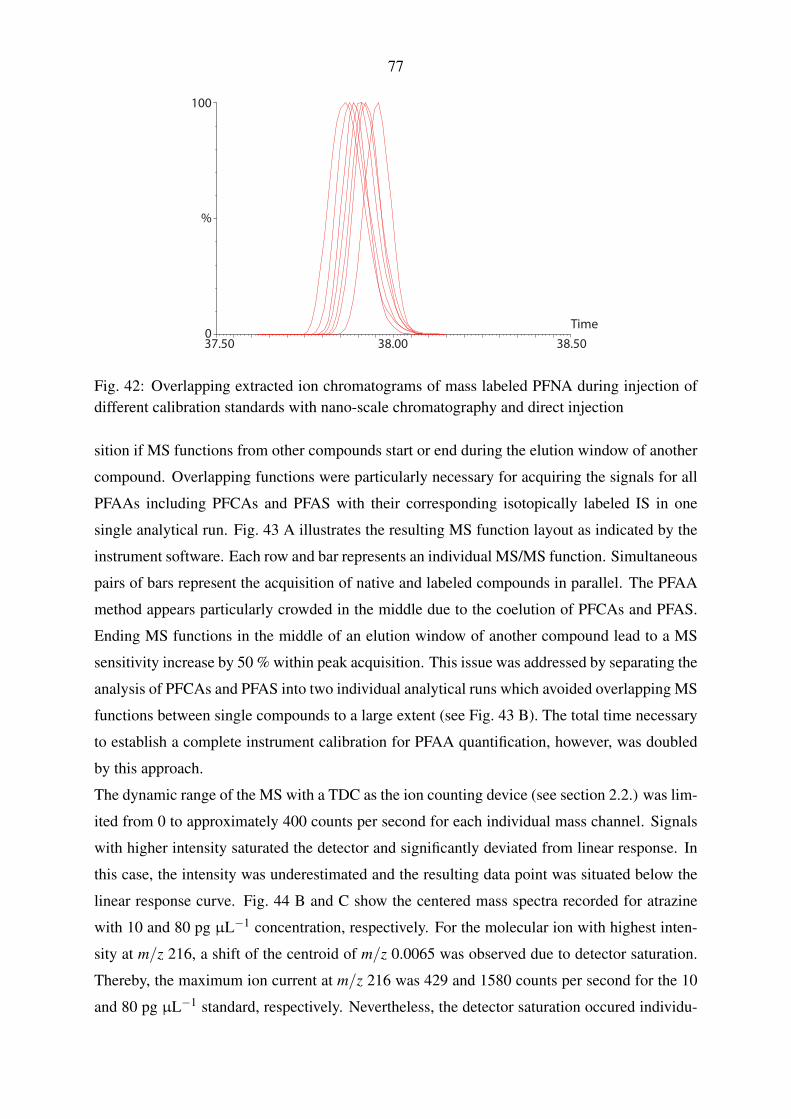
77
37.50 38.00 38.50Time
100
%
0
Fig. 42: Overlapping extracted ion chromatograms of mass labeled PFNA during injection ofdifferent calibration standards with nano-scale chromatography and direct injection
sition if MS functions from other compounds start or end during the elution window of another
compound. Overlapping functions were particularly necessary for acquiring the signals for all
PFAAs including PFCAs and PFAS with their corresponding isotopically labeled IS in one
single analytical run. Fig. 43 A illustrates the resulting MS function layout as indicated by the
instrument software. Each row and bar represents an individual MS/MS function. Simultaneous
pairs of bars represent the acquisition of native and labeled compounds in parallel. The PFAA
method appears particularly crowded in the middle due to the coelution of PFCAs and PFAS.
Ending MS functions in the middle of an elution window of another compound lead to a MS
sensitivity increase by 50 % within peak acquisition. This issue was addressed by separating the
analysis of PFCAs and PFAS into two individual analytical runs which avoided overlapping MS
functions between single compounds to a large extent (see Fig. 43 B). The total time necessary
to establish a complete instrument calibration for PFAA quantification, however, was doubled
by this approach.
The dynamic range of the MS with a TDC as the ion counting device (see section 2.2.) was lim-
ited from 0 to approximately 400 counts per second for each individual mass channel. Signals
with higher intensity saturated the detector and significantly deviated from linear response. In
this case, the intensity was underestimated and the resulting data point was situated below the
linear response curve. Fig. 44 B and C show the centered mass spectra recorded for atrazine
with 10 and 80 pg µL−1 concentration, respectively. For the molecular ion with highest inten-
sity at m/z 216, a shift of the centroid of m/z 0.0065 was observed due to detector saturation.
Thereby, the maximum ion current at m/z 216 was 429 and 1580 counts per second for the 10
and 80 pg µL−1 standard, respectively. Nevertheless, the detector saturation occured individu-
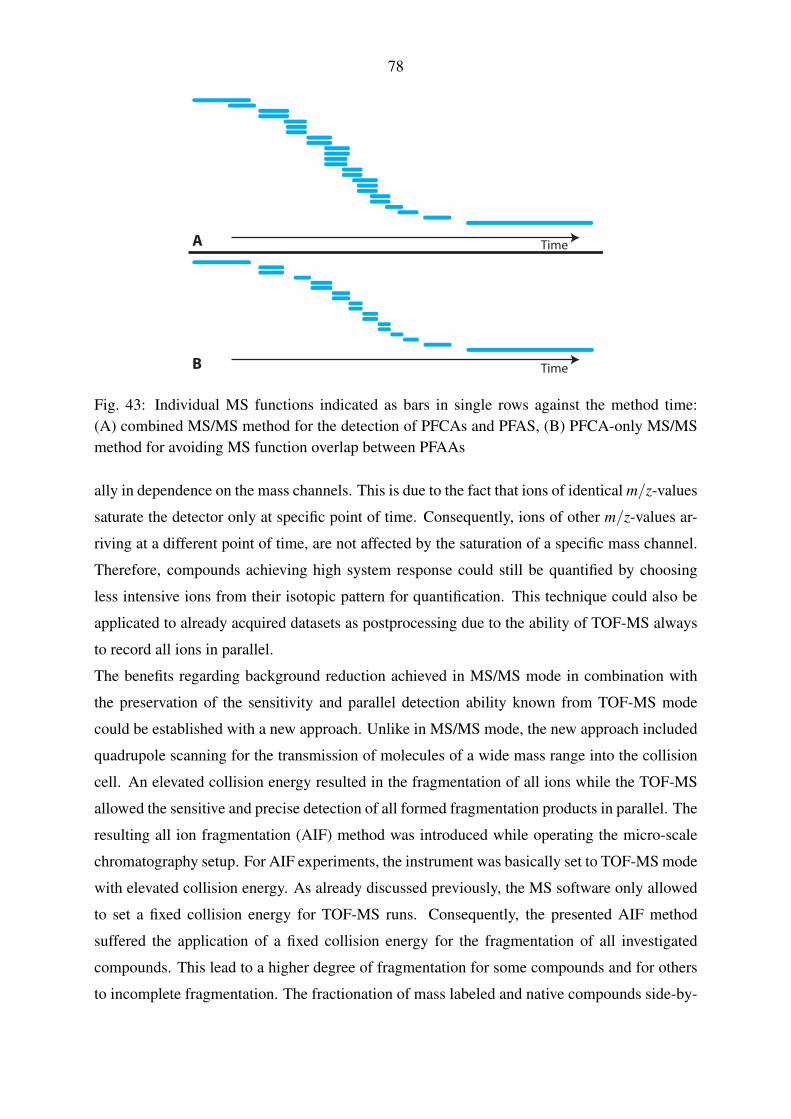
78
A
B
Time
Time
Fig. 43: Individual MS functions indicated as bars in single rows against the method time:(A) combined MS/MS method for the detection of PFCAs and PFAS, (B) PFCA-only MS/MSmethod for avoiding MS function overlap between PFAAs
ally in dependence on the mass channels. This is due to the fact that ions of identical m/z-values
saturate the detector only at specific point of time. Consequently, ions of other m/z-values ar-
riving at a different point of time, are not affected by the saturation of a specific mass channel.
Therefore, compounds achieving high system response could still be quantified by choosing
less intensive ions from their isotopic pattern for quantification. This technique could also be
applicated to already acquired datasets as postprocessing due to the ability of TOF-MS always
to record all ions in parallel.
The benefits regarding background reduction achieved in MS/MS mode in combination with
the preservation of the sensitivity and parallel detection ability known from TOF-MS mode
could be established with a new approach. Unlike in MS/MS mode, the new approach included
quadrupole scanning for the transmission of molecules of a wide mass range into the collision
cell. An elevated collision energy resulted in the fragmentation of all ions while the TOF-MS
allowed the sensitive and precise detection of all formed fragmentation products in parallel. The
resulting all ion fragmentation (AIF) method was introduced while operating the micro-scale
chromatography setup. For AIF experiments, the instrument was basically set to TOF-MS mode
with elevated collision energy. As already discussed previously, the MS software only allowed
to set a fixed collision energy for TOF-MS runs. Consequently, the presented AIF method
suffered the application of a fixed collision energy for the fragmentation of all investigated
compounds. This lead to a higher degree of fragmentation for some compounds and for others
to incomplete fragmentation. The fractionation of mass labeled and native compounds side-by-
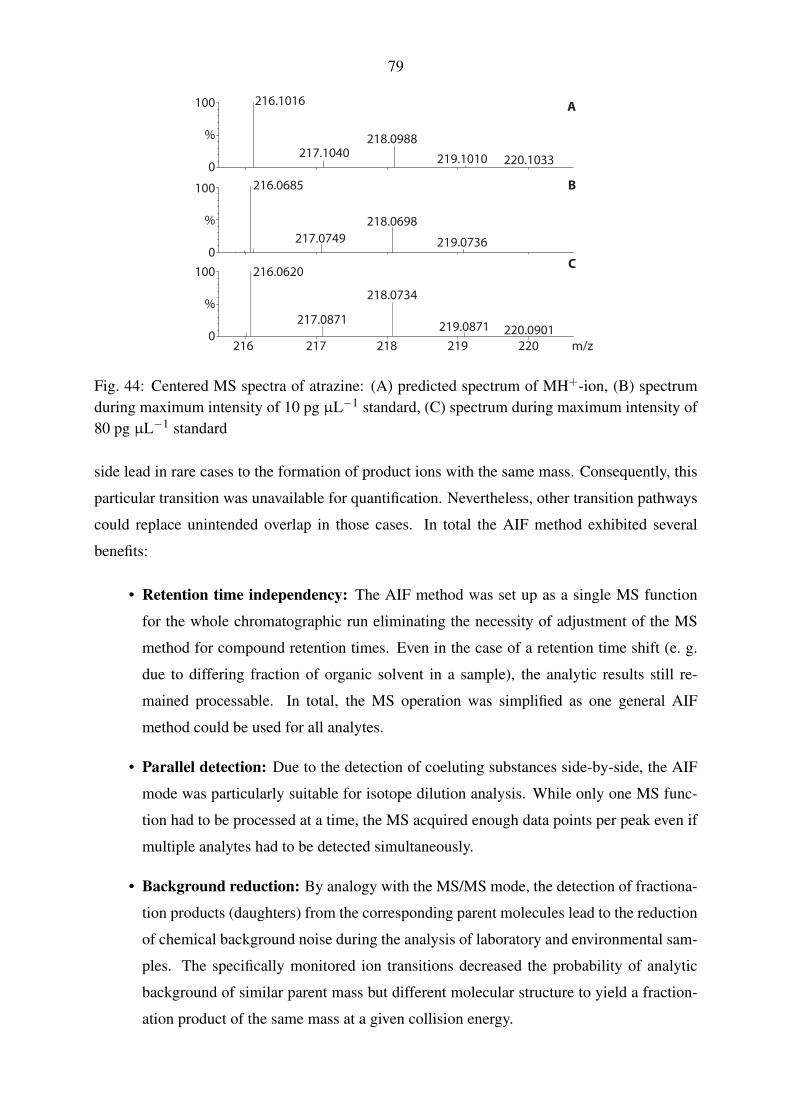
79
217 218 219 220 m/z
100
%
0
216.0685
216.0620
A
B
219.0871 220.0901216
100
%
0
100
%
0
217.0749218.0698
219.0736
216.1016
217.1040218.0988
219.1010 220.1033
217.0871
218.0734
C
Fig. 44: Centered MS spectra of atrazine: (A) predicted spectrum of MH+-ion, (B) spectrumduring maximum intensity of 10 pg µL−1 standard, (C) spectrum during maximum intensity of80 pg µL−1 standard
side lead in rare cases to the formation of product ions with the same mass. Consequently, this
particular transition was unavailable for quantification. Nevertheless, other transition pathways
could replace unintended overlap in those cases. In total the AIF method exhibited several
benefits:
• Retention time independency: The AIF method was set up as a single MS function
for the whole chromatographic run eliminating the necessity of adjustment of the MS
method for compound retention times. Even in the case of a retention time shift (e. g.
due to differing fraction of organic solvent in a sample), the analytic results still re-
mained processable. In total, the MS operation was simplified as one general AIF
method could be used for all analytes.
• Parallel detection: Due to the detection of coeluting substances side-by-side, the AIF
mode was particularly suitable for isotope dilution analysis. While only one MS func-
tion had to be processed at a time, the MS acquired enough data points per peak even if
multiple analytes had to be detected simultaneously.
• Background reduction: By analogy with the MS/MS mode, the detection of fractiona-
tion products (daughters) from the corresponding parent molecules lead to the reduction
of chemical background noise during the analysis of laboratory and environmental sam-
ples. The specifically monitored ion transitions decreased the probability of analytic
background of similar parent mass but different molecular structure to yield a fraction-
ation product of the same mass at a given collision energy.
80
• Improved sensitivity: The operation of the quadrupole mass analyzer in scanning mode
resulted in higher ion transmission yields than using the quadrupole as mass analyzer
in MS/MS mode for the selection of a precurser ion for fragmentation. Additionally,
all fragmentation products could be detected in parallel with only a single TOF-MS
function avoiding the sensitivity-decreasing simultaneous function processing.
• Fractionation of unknowns: The AIF method allowed the fractionation of unknown
compounds in cases of non-target analysis. Therefore, TOF-MS data acquired at low
collision energy in a separate run accompanied with AIF data could be used for the
identification of unknown compounds with fractionation databases in non-target analy-
sis.
In summary, two MS modes were found to be particularly suitable for application in a method
for quantification. The TOF-MS mode with low collision energy was applicable for instrument
calibration, tuning and chromatographic method development. Furthermore, this MS method
was used for gathering data of non-fractionated, singly charged molecules for non-target analy-
sis. Besides, the mode could also be used for quantification purposes in cases where analytical
background did not negatively affect the peak shape in extracted ion chromatograms. The TOF-
MS mode with higher collision energy (in this work called AIF mode) was developed as a
compromise for the application in environmental sample analysis achieving background reduc-
tion while preserving comparably high sensitivity. Moreover, fractionation data of unknown
compounds was gathered within the same analytical run used for the quantification of known
targets.
5.3. Instrumental calibration and linearity
5.3.1. Nano-scale chromatography with direct injection
The establishment of a system calibration while operating the instrument with nano-scale chro-
matography was found to be a challenging task due to the instability of the ion beam. Nev-
ertheless, progress in nano-ESI operation (see section 5.2.1.) allowed the stable operation for
prolonged time periods enabling the determination of response factors. Reasonable results were
only obtained in nano-scale chromatography with direct injection. The limited separation and
severe peak tailing apparent with analyte trapping configuration rendered calibration purposes
with this fluidic configuration difficult.
For pharmaceuticals and polar pesticides, a 10-point calibration from 0 to 450 pg µL−1 resulted
in an acceptable system response with an injection volume of 0.5 µL. Within the standards in
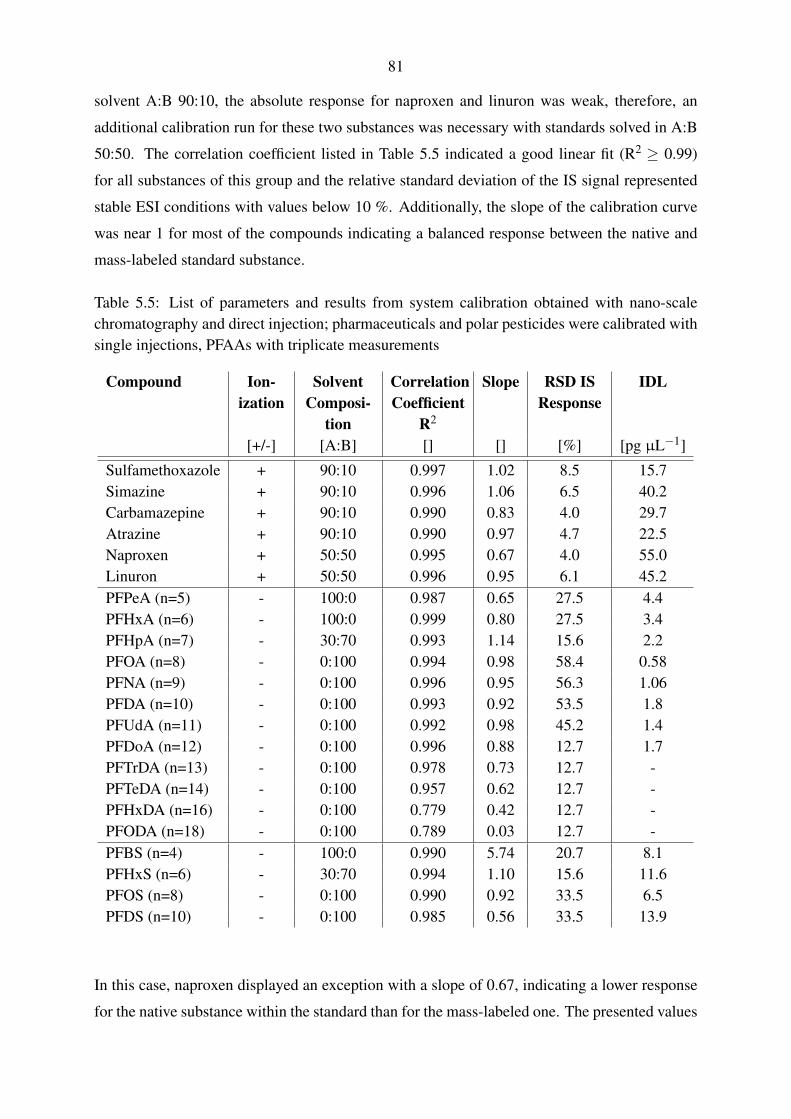
81
solvent A:B 90:10, the absolute response for naproxen and linuron was weak, therefore, an
additional calibration run for these two substances was necessary with standards solved in A:B
50:50. The correlation coefficient listed in Table 5.5 indicated a good linear fit (R2 ≥ 0.99)
for all substances of this group and the relative standard deviation of the IS signal represented
stable ESI conditions with values below 10 %. Additionally, the slope of the calibration curve
was near 1 for most of the compounds indicating a balanced response between the native and
mass-labeled standard substance.
Table 5.5: List of parameters and results from system calibration obtained with nano-scalechromatography and direct injection; pharmaceuticals and polar pesticides were calibrated withsingle injections, PFAAs with triplicate measurements
Compound Ion-ization
SolventComposi-
tion
CorrelationCoefficient
R2
Slope RSD ISResponse
IDL
[+/-] [A:B] [] [] [%] [pg µL−1]
Sulfamethoxazole + 90:10 0.997 1.02 8.5 15.7Simazine + 90:10 0.996 1.06 6.5 40.2Carbamazepine + 90:10 0.990 0.83 4.0 29.7Atrazine + 90:10 0.990 0.97 4.7 22.5Naproxen + 50:50 0.995 0.67 4.0 55.0Linuron + 50:50 0.996 0.95 6.1 45.2PFPeA (n=5) - 100:0 0.987 0.65 27.5 4.4PFHxA (n=6) - 100:0 0.999 0.80 27.5 3.4PFHpA (n=7) - 30:70 0.993 1.14 15.6 2.2PFOA (n=8) - 0:100 0.994 0.98 58.4 0.58PFNA (n=9) - 0:100 0.996 0.95 56.3 1.06PFDA (n=10) - 0:100 0.993 0.92 53.5 1.8PFUdA (n=11) - 0:100 0.992 0.98 45.2 1.4PFDoA (n=12) - 0:100 0.996 0.88 12.7 1.7PFTrDA (n=13) - 0:100 0.978 0.73 12.7 -PFTeDA (n=14) - 0:100 0.957 0.62 12.7 -PFHxDA (n=16) - 0:100 0.779 0.42 12.7 -PFODA (n=18) - 0:100 0.789 0.03 12.7 -PFBS (n=4) - 100:0 0.990 5.74 20.7 8.1PFHxS (n=6) - 30:70 0.994 1.10 15.6 11.6PFOS (n=8) - 0:100 0.990 0.92 33.5 6.5PFDS (n=10) - 0:100 0.985 0.56 33.5 13.9
In this case, naproxen displayed an exception with a slope of 0.67, indicating a lower response
for the native substance within the standard than for the mass-labeled one. The presented values
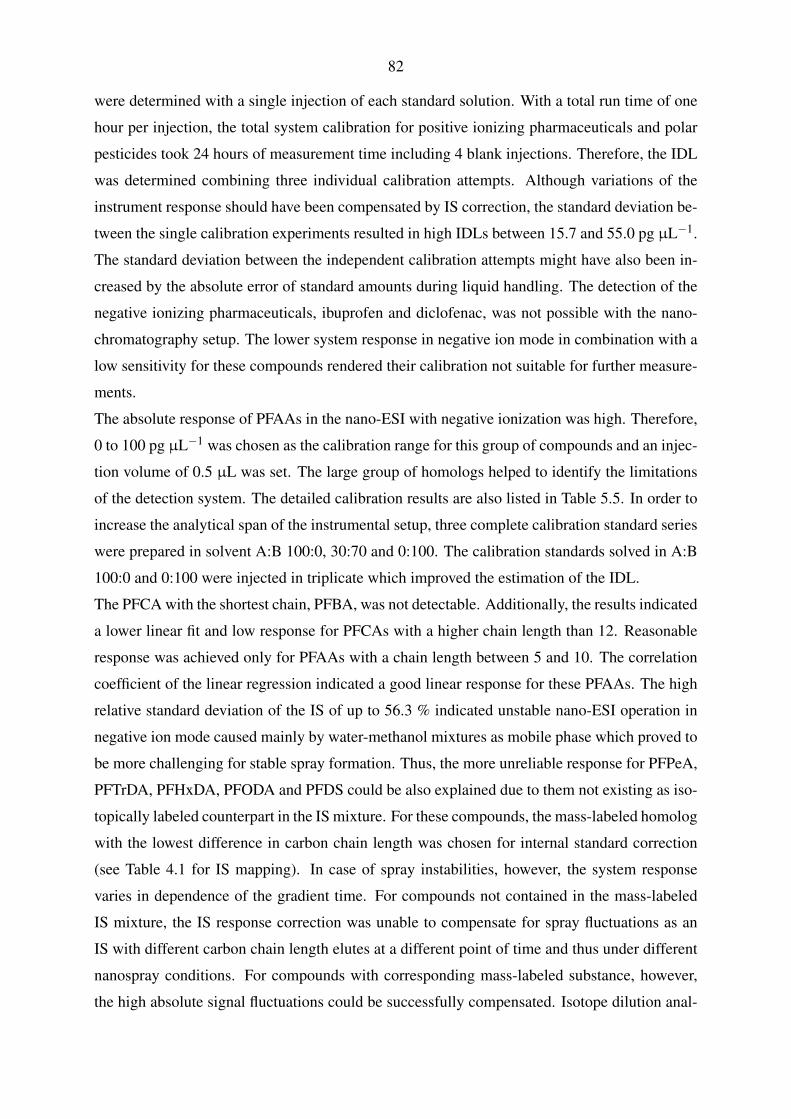
82
were determined with a single injection of each standard solution. With a total run time of one
hour per injection, the total system calibration for positive ionizing pharmaceuticals and polar
pesticides took 24 hours of measurement time including 4 blank injections. Therefore, the IDL
was determined combining three individual calibration attempts. Although variations of the
instrument response should have been compensated by IS correction, the standard deviation be-
tween the single calibration experiments resulted in high IDLs between 15.7 and 55.0 pg µL−1.
The standard deviation between the independent calibration attempts might have also been in-
creased by the absolute error of standard amounts during liquid handling. The detection of the
negative ionizing pharmaceuticals, ibuprofen and diclofenac, was not possible with the nano-
chromatography setup. The lower system response in negative ion mode in combination with a
low sensitivity for these compounds rendered their calibration not suitable for further measure-
ments.
The absolute response of PFAAs in the nano-ESI with negative ionization was high. Therefore,
0 to 100 pg µL−1 was chosen as the calibration range for this group of compounds and an injec-
tion volume of 0.5 µL was set. The large group of homologs helped to identify the limitations
of the detection system. The detailed calibration results are also listed in Table 5.5. In order to
increase the analytical span of the instrumental setup, three complete calibration standard series
were prepared in solvent A:B 100:0, 30:70 and 0:100. The calibration standards solved in A:B
100:0 and 0:100 were injected in triplicate which improved the estimation of the IDL.
The PFCA with the shortest chain, PFBA, was not detectable. Additionally, the results indicated
a lower linear fit and low response for PFCAs with a higher chain length than 12. Reasonable
response was achieved only for PFAAs with a chain length between 5 and 10. The correlation
coefficient of the linear regression indicated a good linear response for these PFAAs. The high
relative standard deviation of the IS of up to 56.3 % indicated unstable nano-ESI operation in
negative ion mode caused mainly by water-methanol mixtures as mobile phase which proved to
be more challenging for stable spray formation. Thus, the more unreliable response for PFPeA,
PFTrDA, PFHxDA, PFODA and PFDS could be also explained due to them not existing as iso-
topically labeled counterpart in the IS mixture. For these compounds, the mass-labeled homolog
with the lowest difference in carbon chain length was chosen for internal standard correction
(see Table 4.1 for IS mapping). In case of spray instabilities, however, the system response
varies in dependence of the gradient time. For compounds not contained in the mass-labeled
IS mixture, the IS response correction was unable to compensate for spray fluctuations as an
IS with different carbon chain length elutes at a different point of time and thus under different
nanospray conditions. For compounds with corresponding mass-labeled substance, however,
the high absolute signal fluctuations could be successfully compensated. Isotope dilution anal-
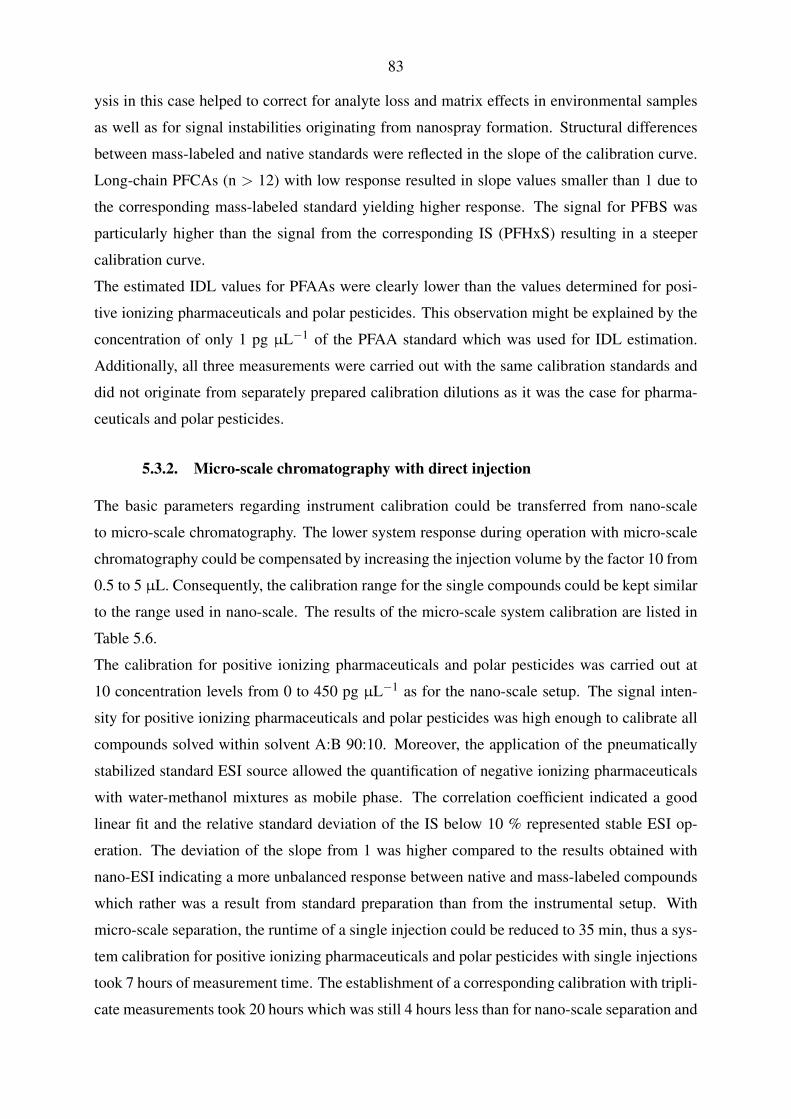
83
ysis in this case helped to correct for analyte loss and matrix effects in environmental samples
as well as for signal instabilities originating from nanospray formation. Structural differences
between mass-labeled and native standards were reflected in the slope of the calibration curve.
Long-chain PFCAs (n > 12) with low response resulted in slope values smaller than 1 due to
the corresponding mass-labeled standard yielding higher response. The signal for PFBS was
particularly higher than the signal from the corresponding IS (PFHxS) resulting in a steeper
calibration curve.
The estimated IDL values for PFAAs were clearly lower than the values determined for posi-
tive ionizing pharmaceuticals and polar pesticides. This observation might be explained by the
concentration of only 1 pg µL−1 of the PFAA standard which was used for IDL estimation.
Additionally, all three measurements were carried out with the same calibration standards and
did not originate from separately prepared calibration dilutions as it was the case for pharma-
ceuticals and polar pesticides.
5.3.2. Micro-scale chromatography with direct injection
The basic parameters regarding instrument calibration could be transferred from nano-scale
to micro-scale chromatography. The lower system response during operation with micro-scale
chromatography could be compensated by increasing the injection volume by the factor 10 from
0.5 to 5 µL. Consequently, the calibration range for the single compounds could be kept similar
to the range used in nano-scale. The results of the micro-scale system calibration are listed in
Table 5.6.
The calibration for positive ionizing pharmaceuticals and polar pesticides was carried out at
10 concentration levels from 0 to 450 pg µL−1 as for the nano-scale setup. The signal inten-
sity for positive ionizing pharmaceuticals and polar pesticides was high enough to calibrate all
compounds solved within solvent A:B 90:10. Moreover, the application of the pneumatically
stabilized standard ESI source allowed the quantification of negative ionizing pharmaceuticals
with water-methanol mixtures as mobile phase. The correlation coefficient indicated a good
linear fit and the relative standard deviation of the IS below 10 % represented stable ESI op-
eration. The deviation of the slope from 1 was higher compared to the results obtained with
nano-ESI indicating a more unbalanced response between native and mass-labeled compounds
which rather was a result from standard preparation than from the instrumental setup. With
micro-scale separation, the runtime of a single injection could be reduced to 35 min, thus a sys-
tem calibration for positive ionizing pharmaceuticals and polar pesticides with single injections
took 7 hours of measurement time. The establishment of a corresponding calibration with tripli-
cate measurements took 20 hours which was still 4 hours less than for nano-scale separation and
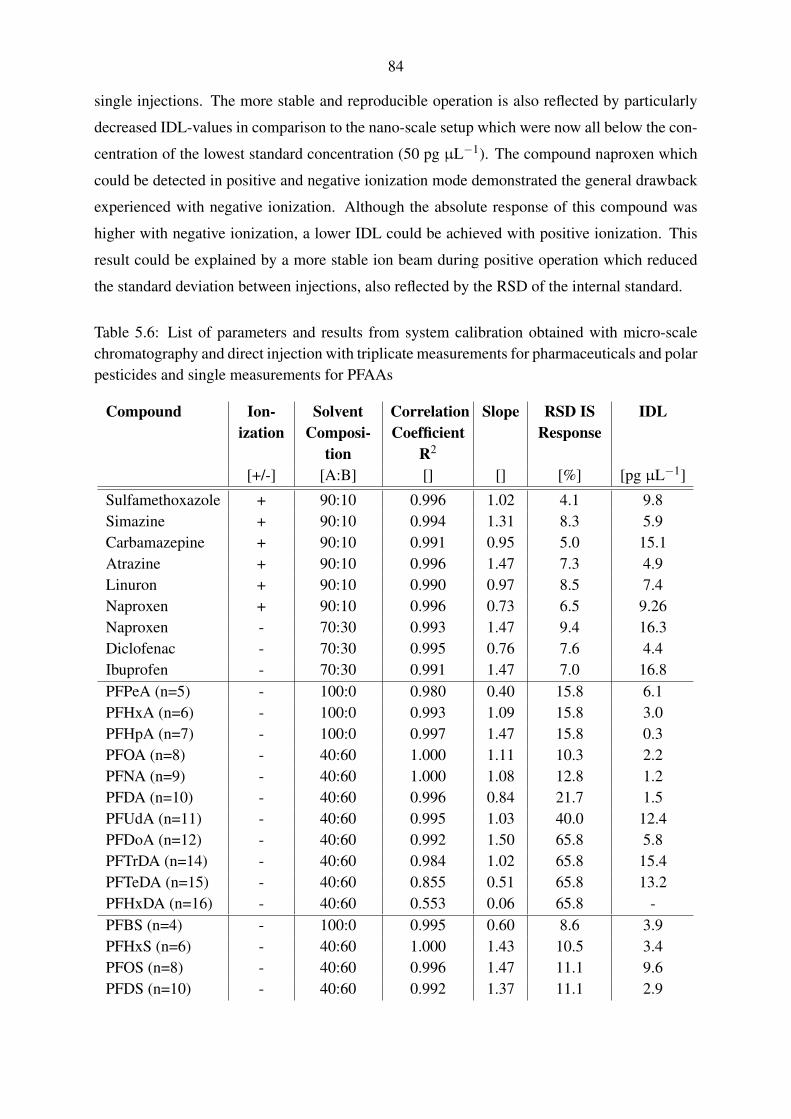
84
single injections. The more stable and reproducible operation is also reflected by particularly
decreased IDL-values in comparison to the nano-scale setup which were now all below the con-
centration of the lowest standard concentration (50 pg µL−1). The compound naproxen which
could be detected in positive and negative ionization mode demonstrated the general drawback
experienced with negative ionization. Although the absolute response of this compound was
higher with negative ionization, a lower IDL could be achieved with positive ionization. This
result could be explained by a more stable ion beam during positive operation which reduced
the standard deviation between injections, also reflected by the RSD of the internal standard.
Table 5.6: List of parameters and results from system calibration obtained with micro-scalechromatography and direct injection with triplicate measurements for pharmaceuticals and polarpesticides and single measurements for PFAAs
Compound Ion-ization
SolventComposi-
tion
CorrelationCoefficient
R2
Slope RSD ISResponse
IDL
[+/-] [A:B] [] [] [%] [pg µL−1]
Sulfamethoxazole + 90:10 0.996 1.02 4.1 9.8Simazine + 90:10 0.994 1.31 8.3 5.9Carbamazepine + 90:10 0.991 0.95 5.0 15.1Atrazine + 90:10 0.996 1.47 7.3 4.9Linuron + 90:10 0.990 0.97 8.5 7.4Naproxen + 90:10 0.996 0.73 6.5 9.26Naproxen - 70:30 0.993 1.47 9.4 16.3Diclofenac - 70:30 0.995 0.76 7.6 4.4Ibuprofen - 70:30 0.991 1.47 7.0 16.8PFPeA (n=5) - 100:0 0.980 0.40 15.8 6.1PFHxA (n=6) - 100:0 0.993 1.09 15.8 3.0PFHpA (n=7) - 100:0 0.997 1.47 15.8 0.3PFOA (n=8) - 40:60 1.000 1.11 10.3 2.2PFNA (n=9) - 40:60 1.000 1.08 12.8 1.2PFDA (n=10) - 40:60 0.996 0.84 21.7 1.5PFUdA (n=11) - 40:60 0.995 1.03 40.0 12.4PFDoA (n=12) - 40:60 0.992 1.50 65.8 5.8PFTrDA (n=14) - 40:60 0.984 1.02 65.8 15.4PFTeDA (n=15) - 40:60 0.855 0.51 65.8 13.2PFHxDA (n=16) - 40:60 0.553 0.06 65.8 -PFBS (n=4) - 100:0 0.995 0.60 8.6 3.9PFHxS (n=6) - 40:60 1.000 1.43 10.5 3.4PFOS (n=8) - 40:60 0.996 1.47 11.1 9.6PFDS (n=10) - 40:60 0.992 1.37 11.1 2.9
85
The PFAA response with micro-scale chromatography was recorded with serial-diluted stan-
dards of the concentration 200, 100, 50, 25, 12.5 and 0 pg µL−1 and an injection volume of
5 µL. With the micro-scale setup being less dependent on solvent composition, the standards
only had to be dissolved in mobile phase A:B 100:0 and 40:60 in order to achieve a sufficient
response coverage for PFAAs reducing calibration effort and runtime. The detailed calibration
parameters recorded for PFAAs with the micro-scale setup are also listed in Table 5.6.
PFBA was again not detectable even in the standard solved in pure solvent A. The linear fit was
good for PFCAs with a carbon chain length from 6 to 12. Moreover, correlation coefficients
larger than 0.99 were achieved for all PFAS. IS signal intensities, however, varied with up to
65.8 % indicating less stable spray formation when operating in negative mode with water-
methanol mixtures. This fact also influenced the IDL for PFAAs. Especially PFCAs with
a longer carbon chain than 10 suffered higher IDLs due to the lower total system response.
Moreover, the standard concentration for IDL determination was higher at 12.5 pg µL−1 than
for nano-scale experiments due to the different dilution scheme.
5.3.3. Applicability of the instrumental calibrations for quantification
Judging the results, both instrumental setups and calibrations could be used for quantification
purposes. Considering the calibration parameters only, however, is not sufficient to account
for the applicability of the nano- and micro-scale calibration. The increased effort necessary
during nano-scale operation, especially for negative ionization, resulted in several drawbacks in
comparison to the micro-scale fluidic configuration.
The necessity for the preparation of three independent standard dilutions particularly increased
the amount of standards needed for system calibration. With running the calibration prior each
sample batch run, especially the amount of isotopically labeled PFAAs grew considerably high
although calibration standards were prepared in small aliquots of 50 µL. Besides, the sample
consumption and preparation time increased due to the reconstitution in three different mobile
phase compositions. In fact, the benefit of low sample consumption (0.5 µL instead of 5 µL) of
the nano-scale chromatography system was vanished because of the preparation of each sample
being only possible with sample amounts above 10 µL that could still be precisely handled with
pipettes in the laboratory. The total analysis time for one sample regarding all analytes with
positive and negative ionization took several days. In addition, the necessary change of mobile
phase for the switching between positive and negative ionization required frequent re-tuning
or replacement of the nanospray emitter. Furthermore, with calibration experiments prior sam-
ple injection taking more than 24 hours, nanospray stability during quantification experiments
evolved to be a critical factor. The most important drawback of the nano-scale setup, however,
86
proved to be the reproducibility of the system response. The determination of detection limits
already indicated high standard deviations between injections. Finally, the calibration results
for negative ionizing PFAAs presented in section 5.3.1. could not be reproduced at a later point
of time due to severe difficulties in tuning and stabilizing the nanospray for operation with
water-methanol mixtures. An increase of injection volume lead to band broadening and could
not be utilized to compensate lower system response.
In contrast, the micro-scale setup allowed reproducible calibration and analysis in a decreased
amount of time. Especially analysis with negative ionization and water-methanol mixtures
could be carried out more reliably. Due to the lower time per analytical run, system response
factors determined with three injections of each standard concentration could be utilized as
reference. Calibration experiments determined with single injections were used for system cal-
ibration prior sample analysis. Standard and sample consumption were reduced because of a
lower dependency of the chromatography on the sample solvent. Moreover, sample preparation
was simplified with only less solvent reconstitution steps being necessary. The sample volumes
between 20 and 50 µL already utilized with nano-scale analysis were also applicable for 5 µL
full-loop injections during micro-scale analysis. Consequently, no further adjustments from the
procedures developed during nano-scale analysis were necessary. More stable operation also
lowered the IDL for the single analytes. Especially positive ionizing compounds could be de-
tected more reproducibly and sensitively. All in all, the calibration results and the operational
aspects observed during system calibration clearly indicated the micro-scale setup being more
suitable for the application in routine analysis and quantification. It was possible to demonstrate
that a reasonable calibration with the nano-scale setup is possible, too, albeit with an uneven
higher operational effort.
5.4. Laboratory recovery experiments
5.4.1. Selection of a solid-phase extraction chemistry
Different SPE cartridges were evaluated for their applicability in cleanup of positive ionizing
pharmaceuticals and polar pesticides. This experiment was carried out at an early stage of
instrumental method development during tests with nano-scale chromatography and analyte
trapping which was not the final recommended configuration for quantification experiments
(see section 5.1. and 5.3.). Thus, the recovery evaluation also included the analytes atenolol
and paracetamol that were not quantified within the final method.
The determined cleanup recoveries are illustrated in Fig. 45. The two groups of compounds
were separated for improved visibility and the analytes were sorted within each group according
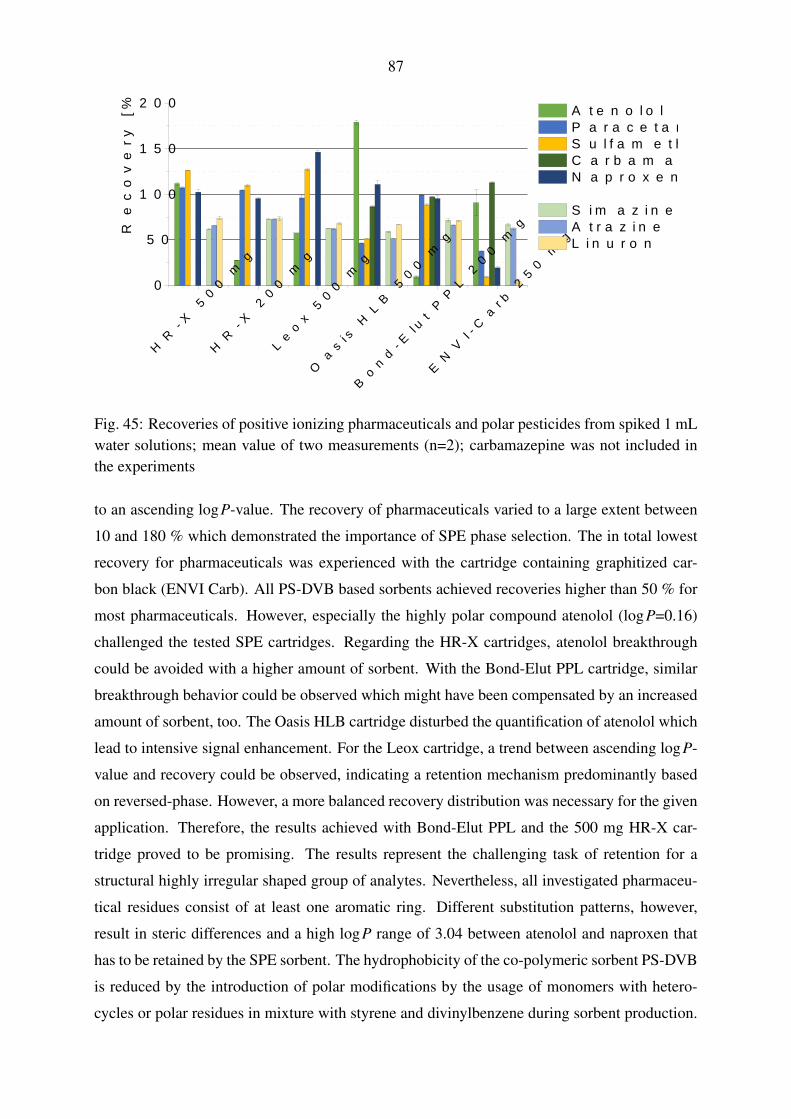
87
H R - X 5 0 0 m g
H R - X 2 0 0 m g
L e ox 5 0
0 mg
O a s i s H L B 5 0 0
m g
B o n d- E l u t P
P L 2 00 m
g
E N V I - C a r b 2 5 0
m g0
5 0
1 0 0
1 5 0
2 0 0Re
covery
[%]
A t e n o l o l P a r a c e t a m o l S u l f a m e t h o x a z o l e C a r b a m a z e p i n e N a p r o x e n S i m a z i n e A t r a z i n e L i n u r o n
Fig. 45: Recoveries of positive ionizing pharmaceuticals and polar pesticides from spiked 1 mLwater solutions; mean value of two measurements (n=2); carbamazepine was not included inthe experiments
to an ascending logP-value. The recovery of pharmaceuticals varied to a large extent between
10 and 180 % which demonstrated the importance of SPE phase selection. The in total lowest
recovery for pharmaceuticals was experienced with the cartridge containing graphitized car-
bon black (ENVI Carb). All PS-DVB based sorbents achieved recoveries higher than 50 % for
most pharmaceuticals. However, especially the highly polar compound atenolol (logP=0.16)
challenged the tested SPE cartridges. Regarding the HR-X cartridges, atenolol breakthrough
could be avoided with a higher amount of sorbent. With the Bond-Elut PPL cartridge, similar
breakthrough behavior could be observed which might have been compensated by an increased
amount of sorbent, too. The Oasis HLB cartridge disturbed the quantification of atenolol which
lead to intensive signal enhancement. For the Leox cartridge, a trend between ascending logP-
value and recovery could be observed, indicating a retention mechanism predominantly based
on reversed-phase. However, a more balanced recovery distribution was necessary for the given
application. Therefore, the results achieved with Bond-Elut PPL and the 500 mg HR-X car-
tridge proved to be promising. The results represent the challenging task of retention for a
structural highly irregular shaped group of analytes. Nevertheless, all investigated pharmaceu-
tical residues consist of at least one aromatic ring. Different substitution patterns, however,
result in steric differences and a high logP range of 3.04 between atenolol and naproxen that
has to be retained by the SPE sorbent. The hydrophobicity of the co-polymeric sorbent PS-DVB
is reduced by the introduction of polar modifications by the usage of monomers with hetero-
cycles or polar residues in mixture with styrene and divinylbenzene during sorbent production.
88
According to the degree of polar modification, the retention behaviour for the polar pharmaceu-
tical residues varied. Consequently, the results suggested a higher degree of polar modification
of the HR-X chemistry than for the other tested SPE phases.
Regarding the pesticides simazine, atrazine and linuron, recovery was more balanced between
the single PS-DVB cartridges. Although the ENVI-Carb cartridge failed to retain the most
lipophilic compound linuron, all other cartridges achieved recoveries larger than 50 %. Again
the Bond-Elut PPL as well as the HR-X cartridges were able to gain the highest recoveries of
up to 74 %. The more comparable retention of these analytes could be explained by structural
similarities. In atrazine and simazine a 1,3,5-triazine represents the core structure whereas lin-
uron consists of a substituted benzene ring. Nevertheless, both core structures are aromatic. All
three herbicides contain chloro-atoms attached to their aromatic core which invokes a reduction
of electron density within the aromatic ring. Besides, the compounds exhibit nitrogen bridged
alkyl substitutions attached to their core. In case of linuron, urea can be identified as structural
motive within this substitution. Atrazine and simazine have the highest similarity and are only
discriminated by one methyl-group at a nitrogen bridged sidechain. The strucural similarity of
these compounds is also reflected by their smaller logP-value difference of 1.02 compared to
the investigated pharmaceuticals. With their aromatic ring structure, the retention mechanism
of the pesticides on PS-DVB and carbon phases can be expected to be based on π-π-interactions
besides hydrophobic interaction. Therefore, PS-DVB cartridges were particularly suitable for
the retention of small organic molecules with aromatic ring structure. The observed differences
between the single PS-DVB sorbents might also be explained by certain structural modifications
that the manufacturers introduce into the polymers in order to influence polarity and hydropho-
bicity of the sorbents as mentioned above. With these modifications being not available to the
public and with retention predictions being challenging anyway, a suitable SPE sorbent bed
could only be judged by empirical testing.
All in all, the HR-X cartridge with 500 mg sorbent appeared to show a balanced performance
for the retention of highly polar pharmaceutical residues as well as a reasonable recovery of
the three investigated polar pesticides. Comparable performance was achieved with the Bond-
Elut PPL cartridge with only a sorbent bed of 200 mg which remarkably avoided signal en-
hancement and only lacked the retention of the highly polar atenolol. Based on the results,
HR-X cartridges with 500 mg sorbent were used as laboratory cleanup step for environmental
samples.
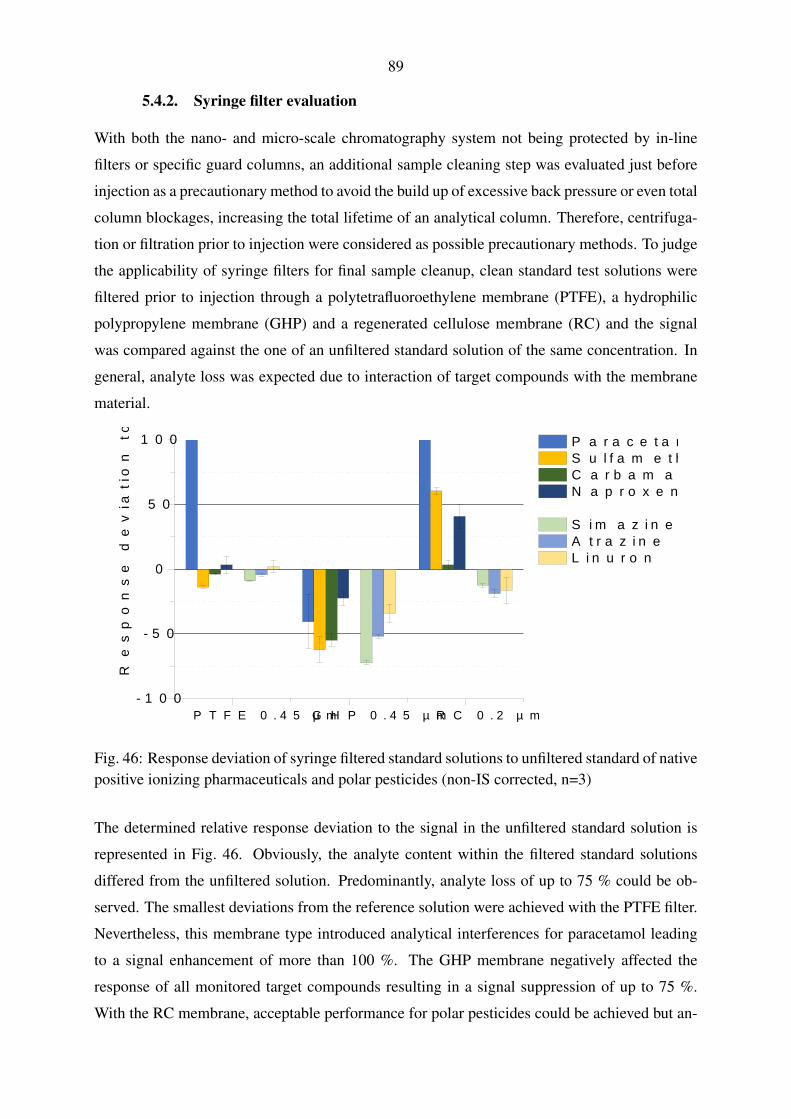
89
5.4.2. Syringe filter evaluation
With both the nano- and micro-scale chromatography system not being protected by in-line
filters or specific guard columns, an additional sample cleaning step was evaluated just before
injection as a precautionary method to avoid the build up of excessive back pressure or even total
column blockages, increasing the total lifetime of an analytical column. Therefore, centrifuga-
tion or filtration prior to injection were considered as possible precautionary methods. To judge
the applicability of syringe filters for final sample cleanup, clean standard test solutions were
filtered prior to injection through a polytetrafluoroethylene membrane (PTFE), a hydrophilic
polypropylene membrane (GHP) and a regenerated cellulose membrane (RC) and the signal
was compared against the one of an unfiltered standard solution of the same concentration. In
general, analyte loss was expected due to interaction of target compounds with the membrane
material.
P T F E 0 . 4 5 µ m G H P 0 . 4 5 µ m R C 0 . 2 µ m- 1 0 0
- 5 0
0
5 0
1 0 0
Respo
nse de
viation
to un
filtered
[%]
P a r a c e t a m o l S u l f a m e t h o x a z o l e C a r b a m a z e p i n e N a p r o x e n e S i m a z i n e A t r a z i n e L i n u r o n
Fig. 46: Response deviation of syringe filtered standard solutions to unfiltered standard of nativepositive ionizing pharmaceuticals and polar pesticides (non-IS corrected, n=3)
The determined relative response deviation to the signal in the unfiltered standard solution is
represented in Fig. 46. Obviously, the analyte content within the filtered standard solutions
differed from the unfiltered solution. Predominantly, analyte loss of up to 75 % could be ob-
served. The smallest deviations from the reference solution were achieved with the PTFE filter.
Nevertheless, this membrane type introduced analytical interferences for paracetamol leading
to a signal enhancement of more than 100 %. The GHP membrane negatively affected the
response of all monitored target compounds resulting in a signal suppression of up to 75 %.
With the RC membrane, acceptable performance for polar pesticides could be achieved but an-
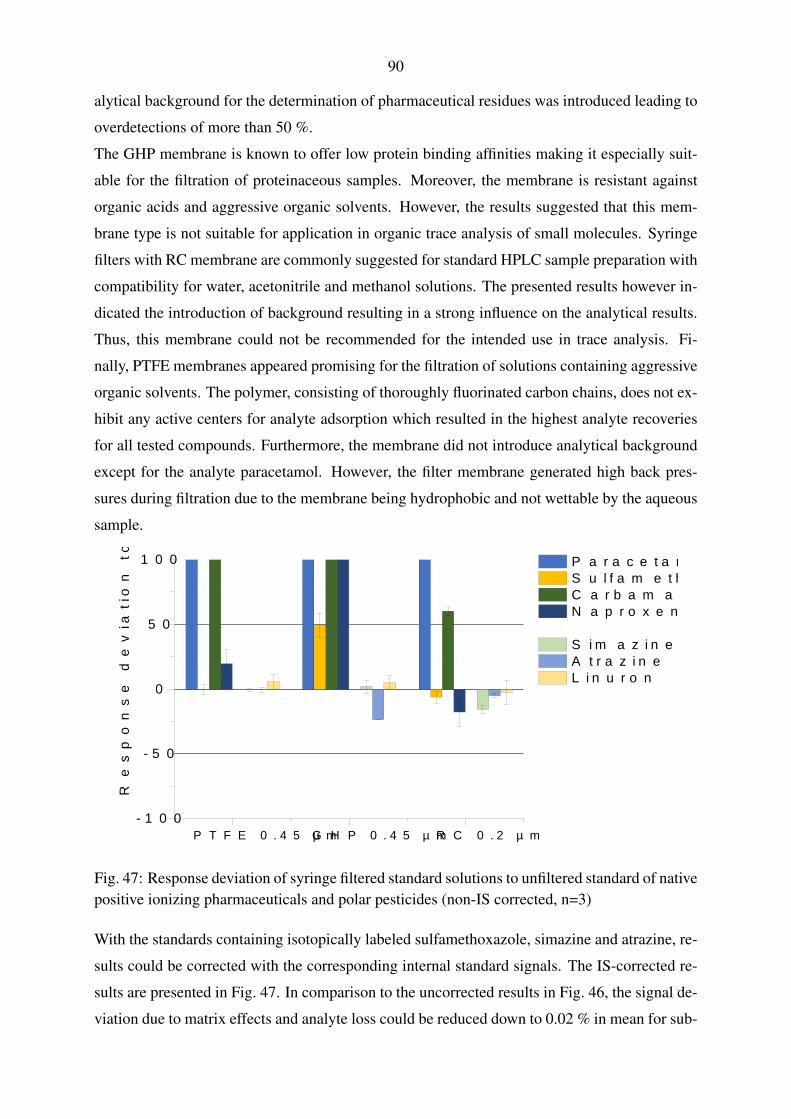
90
alytical background for the determination of pharmaceutical residues was introduced leading to
overdetections of more than 50 %.
The GHP membrane is known to offer low protein binding affinities making it especially suit-
able for the filtration of proteinaceous samples. Moreover, the membrane is resistant against
organic acids and aggressive organic solvents. However, the results suggested that this mem-
brane type is not suitable for application in organic trace analysis of small molecules. Syringe
filters with RC membrane are commonly suggested for standard HPLC sample preparation with
compatibility for water, acetonitrile and methanol solutions. The presented results however in-
dicated the introduction of background resulting in a strong influence on the analytical results.
Thus, this membrane could not be recommended for the intended use in trace analysis. Fi-
nally, PTFE membranes appeared promising for the filtration of solutions containing aggressive
organic solvents. The polymer, consisting of thoroughly fluorinated carbon chains, does not ex-
hibit any active centers for analyte adsorption which resulted in the highest analyte recoveries
for all tested compounds. Furthermore, the membrane did not introduce analytical background
except for the analyte paracetamol. However, the filter membrane generated high back pres-
sures during filtration due to the membrane being hydrophobic and not wettable by the aqueous
sample.
P T F E 0 . 4 5 µ m G H P 0 . 4 5 µ m R C 0 . 2 µ m- 1 0 0
- 5 0
0
5 0
1 0 0
Respo
nse de
viation
to un
filtered
[%]
P a r a c e t a m o l S u l f a m e t h o x a z o l e C a r b a m a z e p i n e N a p r o x e n e S i m a z i n e A t r a z i n e L i n u r o n
Fig. 47: Response deviation of syringe filtered standard solutions to unfiltered standard of nativepositive ionizing pharmaceuticals and polar pesticides (non-IS corrected, n=3)
With the standards containing isotopically labeled sulfamethoxazole, simazine and atrazine, re-
sults could be corrected with the corresponding internal standard signals. The IS-corrected re-
sults are presented in Fig. 47. In comparison to the uncorrected results in Fig. 46, the signal de-
viation due to matrix effects and analyte loss could be reduced down to 0.02 % in mean for sub-
91
stances with corresponding IS. The remaining pharmaceuticals were corrected with the signal
of mass-labeled sulfamethoxazole whereas linuron was corrected with mass-labeled atrazine.
In most cases, however, this IS assignment lead to severe overcorrection of the analyte signals.
Consequently, probable mechanisms explaining response deviations like adsorption onto the
filtration membrane or background interferences appeared to be highly compound specific and
could only be corrected with structurally identical isotopically labeled substances as IS.
The evaluation of syringe filters demonstrated that even rather simple steps within a laboratory
cleanup may have a tremendous influence on the analytical result. Due to the discovered draw-
backs of syringe filtration, ultracentrifugation was applied as a further precautionary cleanup
element to remove particles from samples prior to injection. This step avoided the introduction
of unknown background interferences and the unnecessary reduction of signal intensity due to
membrane filtration which finally helped to decrease the method detection limit. Furthermore,
the minimum sample volume for filtration of approximately 500 µL, needed to yield a sufficient
sample amount of about 100 µL (due to the dead volume caused by membrane wetting and filter
compartment), could be further reduced to below 100 µL using centrifugation.
5.4.3. Performance evaluation of large volume water sampling
The active water sampling system involving on-site enrichment of analytes on XAD-cartridges
was evaluated in laboratory tests for possible extraction and cleanup techniques. Reliable results
were only achieved during experiments where quantification with the micro-scale chromatog-
raphy setup was possible. Sensitivity deviations between single injections during operation
with the nano-scale setup rendered the judgement of deviations between experiments doubtful.
Therefore, the laboratory recovery studies presented here were determined with the micro-scale
setup unless otherwise noted.
The extraction experiment of pre-cleaned spiked sampling cartridges allowed the assessment
of extraction and cleanup recoveries as well as matrix effects. By adding isotopically labeled
internal standards only prior to injection, two methodological performance parameters could be
monitored at the same time. The response of native compounds on the one hand corresponded
to the extraction and cleanup recoveries while IS correction allowed to separate any occurring
matrix effects from this observation. On the other hand, the absolute signal intensity of the
mass-labeled IS compared to the absolute signal intensity during instrumental calibration al-
lowed the quantification of matrix effects. Therefore, that instrumental calibration was carried
out just before or right after the quantification of samples to be able to compare the absolute
response for the IS. Otherwise, changes in response due to instabilities in the ESI would have
directly affected the judgment of the matrix effect. Adding up both, analyte recovery and matrix
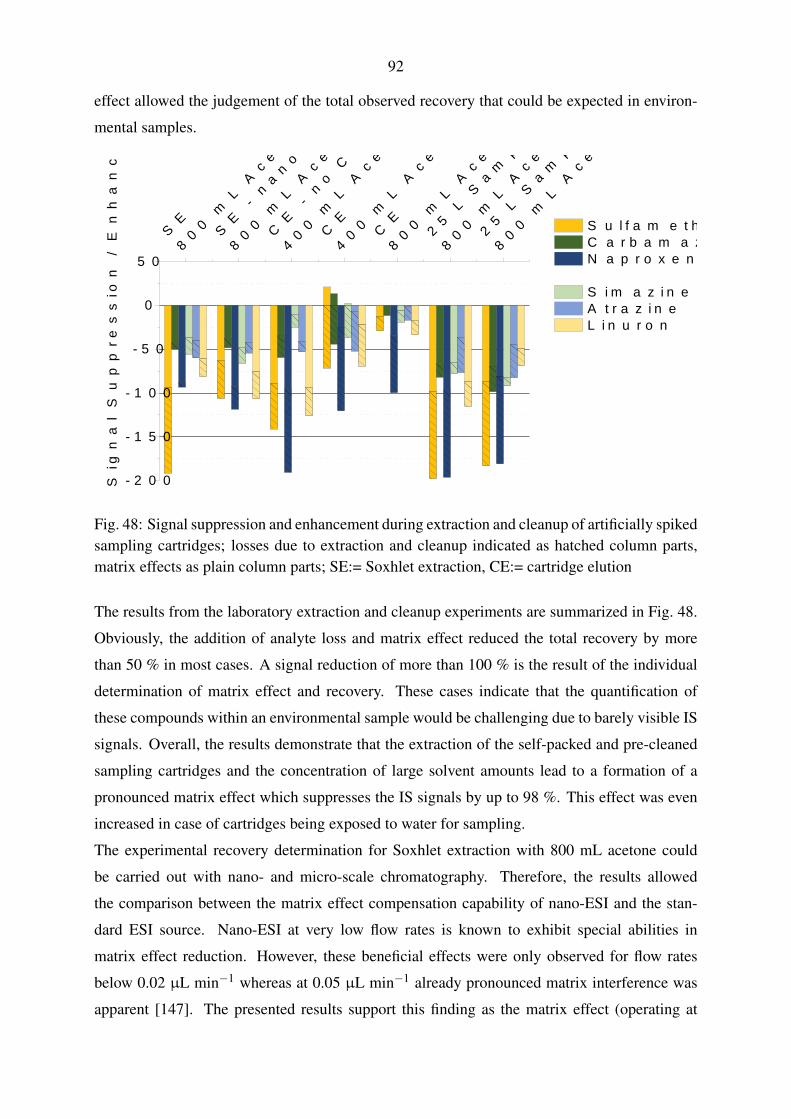
92
effect allowed the judgement of the total observed recovery that could be expected in environ-
mental samples.
S E8 0 0
m L A c e t on e
S E - n an o - s
c a l e
8 0 0 m L A c e t o
n e
C E - n o C l e a n
u p
4 0 0 m L A c e t o
n e
C E4 0 0
m L A c e t on e
C E8 0 0
m L A c e t on e
2 5 L S a m p l e
S E
8 0 0 m L A c e t o
n e
2 5 L S a m p l e
C E
8 0 0 m L A c e t o
n e
- 2 0 0
- 1 5 0
- 1 0 0
- 5 0
0
5 0
Signa
l Sup
pressi
on / E
nhan
cemen
t [%]
S u l f a m e t h o x a z o l e C a r b a m a z e p i n e N a p r o x e n e S i m a z i n e A t r a z i n e L i n u r o n
Fig. 48: Signal suppression and enhancement during extraction and cleanup of artificially spikedsampling cartridges; losses due to extraction and cleanup indicated as hatched column parts,matrix effects as plain column parts; SE:= Soxhlet extraction, CE:= cartridge elution
The results from the laboratory extraction and cleanup experiments are summarized in Fig. 48.
Obviously, the addition of analyte loss and matrix effect reduced the total recovery by more
than 50 % in most cases. A signal reduction of more than 100 % is the result of the individual
determination of matrix effect and recovery. These cases indicate that the quantification of
these compounds within an environmental sample would be challenging due to barely visible IS
signals. Overall, the results demonstrate that the extraction of the self-packed and pre-cleaned
sampling cartridges and the concentration of large solvent amounts lead to a formation of a
pronounced matrix effect which suppresses the IS signals by up to 98 %. This effect was even
increased in case of cartridges being exposed to water for sampling.
The experimental recovery determination for Soxhlet extraction with 800 mL acetone could
be carried out with nano- and micro-scale chromatography. Therefore, the results allowed
the comparison between the matrix effect compensation capability of nano-ESI and the stan-
dard ESI source. Nano-ESI at very low flow rates is known to exhibit special abilities in
matrix effect reduction. However, these beneficial effects were only observed for flow rates
below 0.02 µL min−1 whereas at 0.05 µL min−1 already pronounced matrix interference was
apparent [147]. The presented results support this finding as the matrix effect (operating at
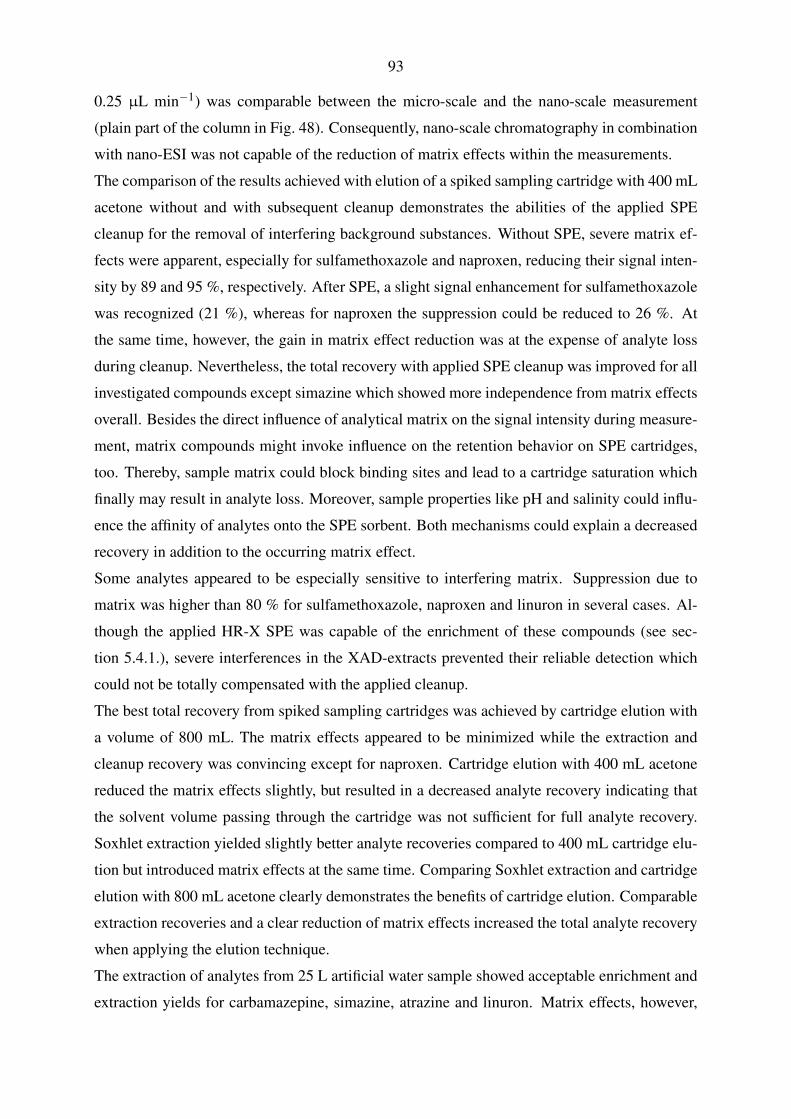
93
0.25 µL min−1) was comparable between the micro-scale and the nano-scale measurement
(plain part of the column in Fig. 48). Consequently, nano-scale chromatography in combination
with nano-ESI was not capable of the reduction of matrix effects within the measurements.
The comparison of the results achieved with elution of a spiked sampling cartridge with 400 mL
acetone without and with subsequent cleanup demonstrates the abilities of the applied SPE
cleanup for the removal of interfering background substances. Without SPE, severe matrix ef-
fects were apparent, especially for sulfamethoxazole and naproxen, reducing their signal inten-
sity by 89 and 95 %, respectively. After SPE, a slight signal enhancement for sulfamethoxazole
was recognized (21 %), whereas for naproxen the suppression could be reduced to 26 %. At
the same time, however, the gain in matrix effect reduction was at the expense of analyte loss
during cleanup. Nevertheless, the total recovery with applied SPE cleanup was improved for all
investigated compounds except simazine which showed more independence from matrix effects
overall. Besides the direct influence of analytical matrix on the signal intensity during measure-
ment, matrix compounds might invoke influence on the retention behavior on SPE cartridges,
too. Thereby, sample matrix could block binding sites and lead to a cartridge saturation which
finally may result in analyte loss. Moreover, sample properties like pH and salinity could influ-
ence the affinity of analytes onto the SPE sorbent. Both mechanisms could explain a decreased
recovery in addition to the occurring matrix effect.
Some analytes appeared to be especially sensitive to interfering matrix. Suppression due to
matrix was higher than 80 % for sulfamethoxazole, naproxen and linuron in several cases. Al-
though the applied HR-X SPE was capable of the enrichment of these compounds (see sec-
tion 5.4.1.), severe interferences in the XAD-extracts prevented their reliable detection which
could not be totally compensated with the applied cleanup.
The best total recovery from spiked sampling cartridges was achieved by cartridge elution with
a volume of 800 mL. The matrix effects appeared to be minimized while the extraction and
cleanup recovery was convincing except for naproxen. Cartridge elution with 400 mL acetone
reduced the matrix effects slightly, but resulted in a decreased analyte recovery indicating that
the solvent volume passing through the cartridge was not sufficient for full analyte recovery.
Soxhlet extraction yielded slightly better analyte recoveries compared to 400 mL cartridge elu-
tion but introduced matrix effects at the same time. Comparing Soxhlet extraction and cartridge
elution with 800 mL acetone clearly demonstrates the benefits of cartridge elution. Comparable
extraction recoveries and a clear reduction of matrix effects increased the total analyte recovery
when applying the elution technique.
The extraction of analytes from 25 L artificial water sample showed acceptable enrichment and
extraction yields for carbamazepine, simazine, atrazine and linuron. Matrix effects, however,
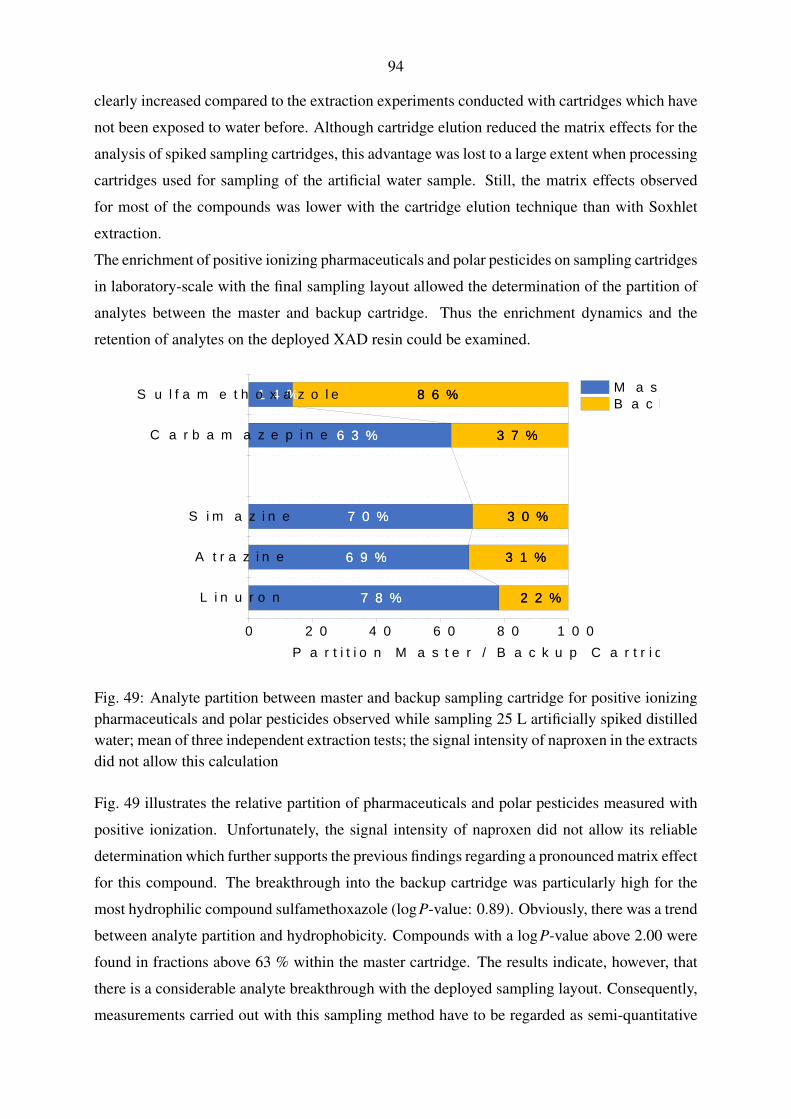
94
clearly increased compared to the extraction experiments conducted with cartridges which have
not been exposed to water before. Although cartridge elution reduced the matrix effects for the
analysis of spiked sampling cartridges, this advantage was lost to a large extent when processing
cartridges used for sampling of the artificial water sample. Still, the matrix effects observed
for most of the compounds was lower with the cartridge elution technique than with Soxhlet
extraction.
The enrichment of positive ionizing pharmaceuticals and polar pesticides on sampling cartridges
in laboratory-scale with the final sampling layout allowed the determination of the partition of
analytes between the master and backup cartridge. Thus the enrichment dynamics and the
retention of analytes on the deployed XAD resin could be examined.
7 8 %
6 9 %
7 0 %
6 3 %
1 4 %
2 2 %
3 1 %
3 0 %
3 7 %
8 6 %
7 8 %
6 9 %
7 0 %
6 3 %
1 4 %
2 2 %
3 1 %
3 0 %
3 7 %
8 6 %
L i n u r o n
A t r a z i n e
S i m a z i n e
C a r b a m a z e p i n e
S u l f a m e t h o x a z o l e
0 2 0 4 0 6 0 8 0 1 0 0P a r t i t i o n M a s t e r / B a c k u p C a r t r i d g e [ % ]
M a s t e r B a c k u p
Fig. 49: Analyte partition between master and backup sampling cartridge for positive ionizingpharmaceuticals and polar pesticides observed while sampling 25 L artificially spiked distilledwater; mean of three independent extraction tests; the signal intensity of naproxen in the extractsdid not allow this calculation
Fig. 49 illustrates the relative partition of pharmaceuticals and polar pesticides measured with
positive ionization. Unfortunately, the signal intensity of naproxen did not allow its reliable
determination which further supports the previous findings regarding a pronounced matrix effect
for this compound. The breakthrough into the backup cartridge was particularly high for the
most hydrophilic compound sulfamethoxazole (logP-value: 0.89). Obviously, there was a trend
between analyte partition and hydrophobicity. Compounds with a logP-value above 2.00 were
found in fractions above 63 % within the master cartridge. The results indicate, however, that
there is a considerable analyte breakthrough with the deployed sampling layout. Consequently,
measurements carried out with this sampling method have to be regarded as semi-quantitative
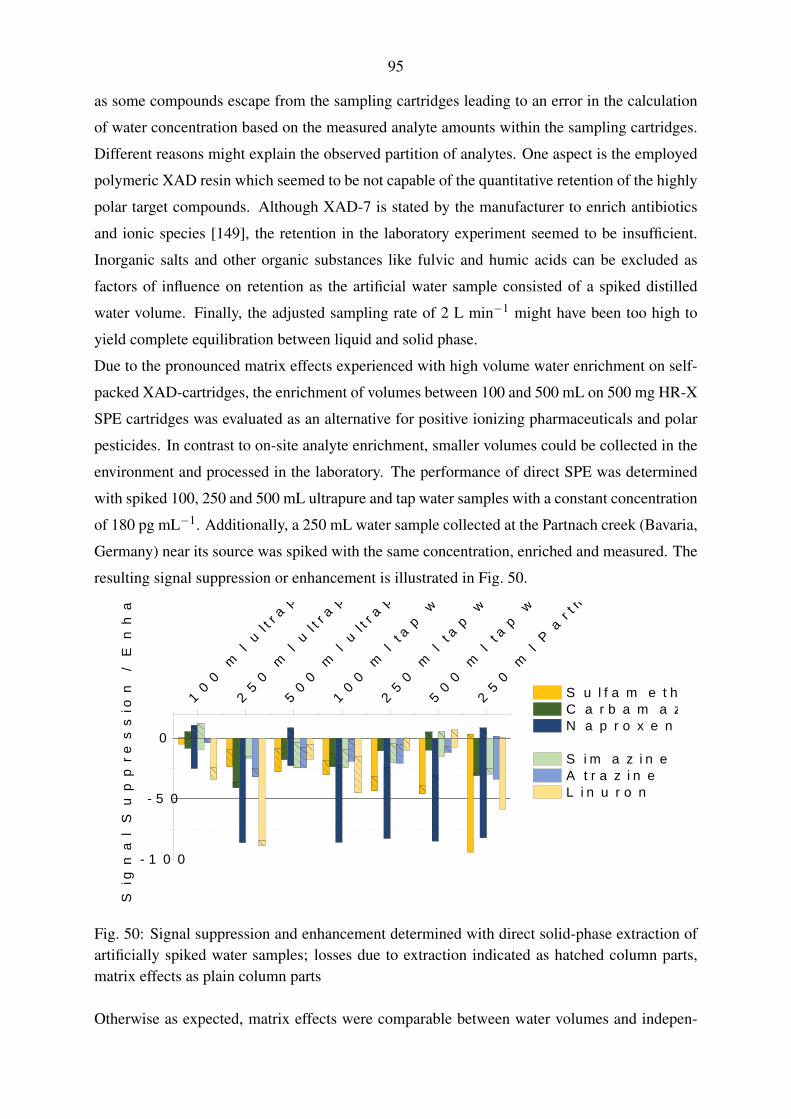
95
as some compounds escape from the sampling cartridges leading to an error in the calculation
of water concentration based on the measured analyte amounts within the sampling cartridges.
Different reasons might explain the observed partition of analytes. One aspect is the employed
polymeric XAD resin which seemed to be not capable of the quantitative retention of the highly
polar target compounds. Although XAD-7 is stated by the manufacturer to enrich antibiotics
and ionic species [149], the retention in the laboratory experiment seemed to be insufficient.
Inorganic salts and other organic substances like fulvic and humic acids can be excluded as
factors of influence on retention as the artificial water sample consisted of a spiked distilled
water volume. Finally, the adjusted sampling rate of 2 L min−1 might have been too high to
yield complete equilibration between liquid and solid phase.
Due to the pronounced matrix effects experienced with high volume water enrichment on self-
packed XAD-cartridges, the enrichment of volumes between 100 and 500 mL on 500 mg HR-X
SPE cartridges was evaluated as an alternative for positive ionizing pharmaceuticals and polar
pesticides. In contrast to on-site analyte enrichment, smaller volumes could be collected in the
environment and processed in the laboratory. The performance of direct SPE was determined
with spiked 100, 250 and 500 mL ultrapure and tap water samples with a constant concentration
of 180 pg mL−1. Additionally, a 250 mL water sample collected at the Partnach creek (Bavaria,
Germany) near its source was spiked with the same concentration, enriched and measured. The
resulting signal suppression or enhancement is illustrated in Fig. 50.
1 0 0 m l u l t r
a p ur e w
a t e r
2 5 0 m l u l t r
a p ur e w
a t e r
5 0 0 m l u l t r
a p ur e w
a t e r
1 0 0 m l t a p
w a t e r
2 5 0 m l t a p
w a t e r
5 0 0 m l t a p
w a t e r
2 5 0 m l P a r t n
a c h c r e
e k
- 1 0 0
- 5 0
0
Signa
l Sup
pressi
on / E
nhan
cemen
t [%] S u l f a m e t h o x a z o l e
C a r b a m a z e p i n e N a p r o x e n e S i m a z i n e A t r a z i n e L i n u r o n
Fig. 50: Signal suppression and enhancement determined with direct solid-phase extraction ofartificially spiked water samples; losses due to extraction indicated as hatched column parts,matrix effects as plain column parts
Otherwise as expected, matrix effects were comparable between water volumes and indepen-
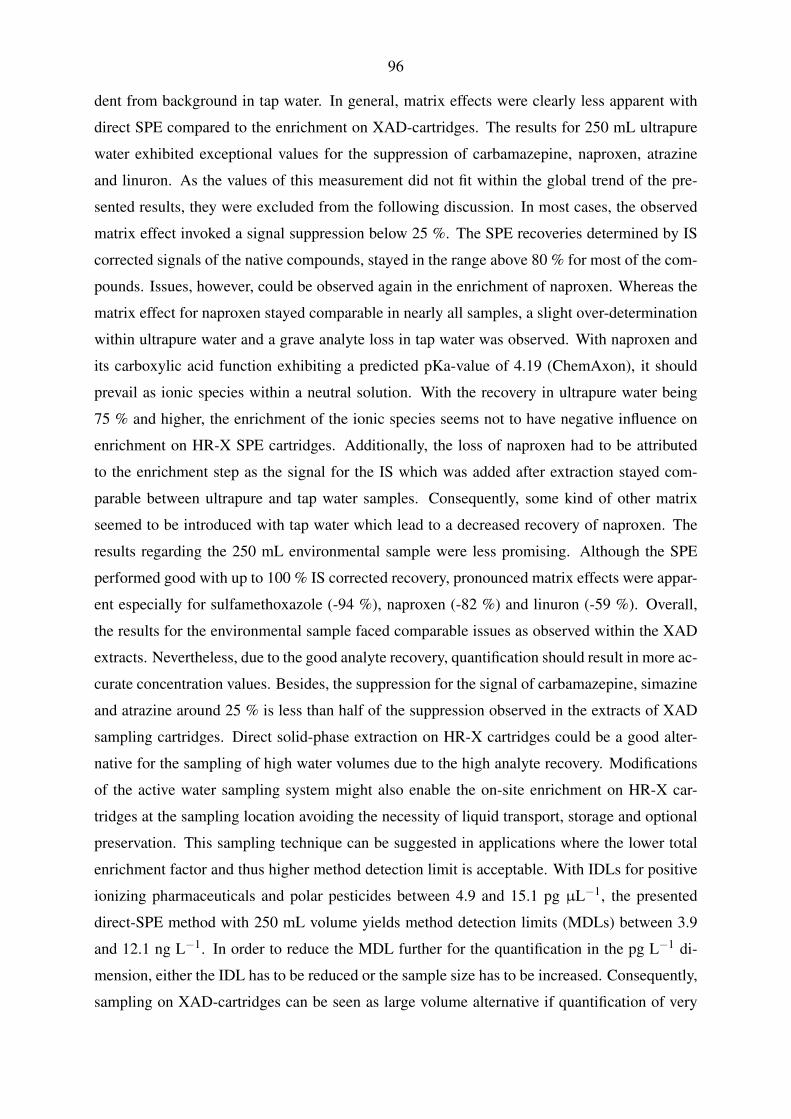
96
dent from background in tap water. In general, matrix effects were clearly less apparent with
direct SPE compared to the enrichment on XAD-cartridges. The results for 250 mL ultrapure
water exhibited exceptional values for the suppression of carbamazepine, naproxen, atrazine
and linuron. As the values of this measurement did not fit within the global trend of the pre-
sented results, they were excluded from the following discussion. In most cases, the observed
matrix effect invoked a signal suppression below 25 %. The SPE recoveries determined by IS
corrected signals of the native compounds, stayed in the range above 80 % for most of the com-
pounds. Issues, however, could be observed again in the enrichment of naproxen. Whereas the
matrix effect for naproxen stayed comparable in nearly all samples, a slight over-determination
within ultrapure water and a grave analyte loss in tap water was observed. With naproxen and
its carboxylic acid function exhibiting a predicted pKa-value of 4.19 (ChemAxon), it should
prevail as ionic species within a neutral solution. With the recovery in ultrapure water being
75 % and higher, the enrichment of the ionic species seems not to have negative influence on
enrichment on HR-X SPE cartridges. Additionally, the loss of naproxen had to be attributed
to the enrichment step as the signal for the IS which was added after extraction stayed com-
parable between ultrapure and tap water samples. Consequently, some kind of other matrix
seemed to be introduced with tap water which lead to a decreased recovery of naproxen. The
results regarding the 250 mL environmental sample were less promising. Although the SPE
performed good with up to 100 % IS corrected recovery, pronounced matrix effects were appar-
ent especially for sulfamethoxazole (-94 %), naproxen (-82 %) and linuron (-59 %). Overall,
the results for the environmental sample faced comparable issues as observed within the XAD
extracts. Nevertheless, due to the good analyte recovery, quantification should result in more ac-
curate concentration values. Besides, the suppression for the signal of carbamazepine, simazine
and atrazine around 25 % is less than half of the suppression observed in the extracts of XAD
sampling cartridges. Direct solid-phase extraction on HR-X cartridges could be a good alter-
native for the sampling of high water volumes due to the high analyte recovery. Modifications
of the active water sampling system might also enable the on-site enrichment on HR-X car-
tridges at the sampling location avoiding the necessity of liquid transport, storage and optional
preservation. This sampling technique can be suggested in applications where the lower total
enrichment factor and thus higher method detection limit is acceptable. With IDLs for positive
ionizing pharmaceuticals and polar pesticides between 4.9 and 15.1 pg µL−1, the presented
direct-SPE method with 250 mL volume yields method detection limits (MDLs) between 3.9
and 12.1 ng L−1. In order to reduce the MDL further for the quantification in the pg L−1 di-
mension, either the IDL has to be reduced or the sample size has to be increased. Consequently,
sampling on XAD-cartridges can be seen as large volume alternative if quantification of very
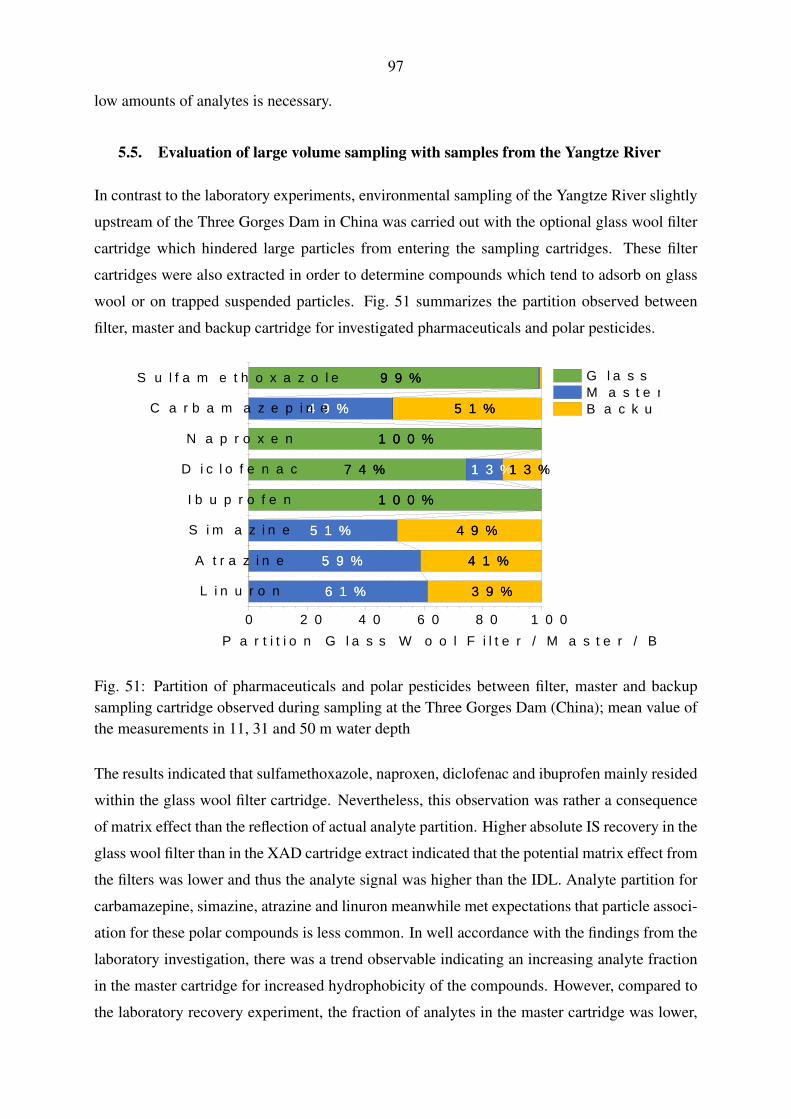
97
low amounts of analytes is necessary.
5.5. Evaluation of large volume sampling with samples from the Yangtze River
In contrast to the laboratory experiments, environmental sampling of the Yangtze River slightly
upstream of the Three Gorges Dam in China was carried out with the optional glass wool filter
cartridge which hindered large particles from entering the sampling cartridges. These filter
cartridges were also extracted in order to determine compounds which tend to adsorb on glass
wool or on trapped suspended particles. Fig. 51 summarizes the partition observed between
filter, master and backup cartridge for investigated pharmaceuticals and polar pesticides.
1 0 0 %7 4 %
1 0 0 %
9 9 %
6 1 %5 9 %
5 1 %
1 3 %
4 9 %
3 9 %4 1 %
4 9 %
1 3 %
5 1 %
1 0 0 %7 4 %
1 0 0 %
9 9 %
6 1 %5 9 %
5 1 %
1 3 %
4 9 %
3 9 %4 1 %
4 9 %
1 3 %
5 1 %
L i n u r o nA t r a z i n e
S i m a z i n eI b u p r o f e n
D i c l o f e n a cN a p r o x e n
C a r b a m a z e p i n eS u l f a m e t h o x a z o l e
0 2 0 4 0 6 0 8 0 1 0 0P a r t i t i o n G l a s s W o o l F i l t e r / M a s t e r / B a c k u p C a r t r i d g e [ % ]
G l a s s W o o l M a s t e r B a c k u p
Fig. 51: Partition of pharmaceuticals and polar pesticides between filter, master and backupsampling cartridge observed during sampling at the Three Gorges Dam (China); mean value ofthe measurements in 11, 31 and 50 m water depth
The results indicated that sulfamethoxazole, naproxen, diclofenac and ibuprofen mainly resided
within the glass wool filter cartridge. Nevertheless, this observation was rather a consequence
of matrix effect than the reflection of actual analyte partition. Higher absolute IS recovery in the
glass wool filter than in the XAD cartridge extract indicated that the potential matrix effect from
the filters was lower and thus the analyte signal was higher than the IDL. Analyte partition for
carbamazepine, simazine, atrazine and linuron meanwhile met expectations that particle associ-
ation for these polar compounds is less common. In well accordance with the findings from the
laboratory investigation, there was a trend observable indicating an increasing analyte fraction
in the master cartridge for increased hydrophobicity of the compounds. However, compared to
the laboratory recovery experiment, the fraction of analytes in the master cartridge was lower,
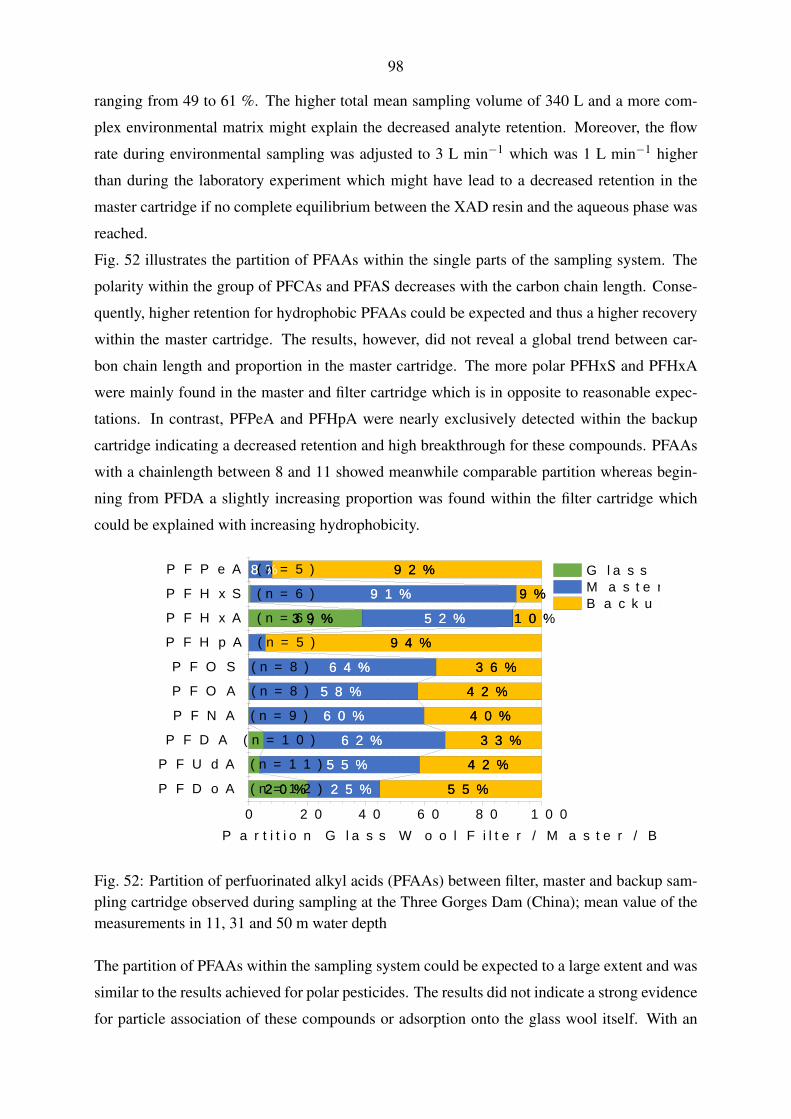
98
ranging from 49 to 61 %. The higher total mean sampling volume of 340 L and a more com-
plex environmental matrix might explain the decreased analyte retention. Moreover, the flow
rate during environmental sampling was adjusted to 3 L min−1 which was 1 L min−1 higher
than during the laboratory experiment which might have lead to a decreased retention in the
master cartridge if no complete equilibrium between the XAD resin and the aqueous phase was
reached.
Fig. 52 illustrates the partition of PFAAs within the single parts of the sampling system. The
polarity within the group of PFCAs and PFAS decreases with the carbon chain length. Conse-
quently, higher retention for hydrophobic PFAAs could be expected and thus a higher recovery
within the master cartridge. The results, however, did not reveal a global trend between car-
bon chain length and proportion in the master cartridge. The more polar PFHxS and PFHxA
were mainly found in the master and filter cartridge which is in opposite to reasonable expec-
tations. In contrast, PFPeA and PFHpA were nearly exclusively detected within the backup
cartridge indicating a decreased retention and high breakthrough for these compounds. PFAAs
with a chainlength between 8 and 11 showed meanwhile comparable partition whereas begin-
ning from PFDA a slightly increasing proportion was found within the filter cartridge which
could be explained with increasing hydrophobicity.
2 0 %
3 9 %
2 5 %5 5 %
6 2 %6 0 %5 8 %
6 4 %
5 2 %9 1 %
8 %
5 5 %4 2 %
3 3 %4 0 %4 2 %
3 6 %9 4 %
1 0 %9 %
9 2 %
2 0 %
3 9 %
2 5 %5 5 %
6 2 %6 0 %5 8 %
6 4 %
5 2 %9 1 %
8 %
5 5 %4 2 %
3 3 %4 0 %4 2 %
3 6 %9 4 %
1 0 %9 %
9 2 %
P F D o A ( n = 1 2 )P F U d A ( n = 1 1 )P F D A ( n = 1 0 )P F N A ( n = 9 )P F O A ( n = 8 )P F O S ( n = 8 )
P F H p A ( n = 5 )P F H x A ( n = 6 )P F H x S ( n = 6 )P F P e A ( n = 5 )
0 2 0 4 0 6 0 8 0 1 0 0P a r t i t i o n G l a s s W o o l F i l t e r / M a s t e r / B a c k u p C a r t r i d g e [ % ]
G l a s s W o o l M a s t e r B a c k u p
Fig. 52: Partition of perfuorinated alkyl acids (PFAAs) between filter, master and backup sam-pling cartridge observed during sampling at the Three Gorges Dam (China); mean value of themeasurements in 11, 31 and 50 m water depth
The partition of PFAAs within the sampling system could be expected to a large extent and was
similar to the results achieved for polar pesticides. The results did not indicate a strong evidence
for particle association of these compounds or adsorption onto the glass wool itself. With an
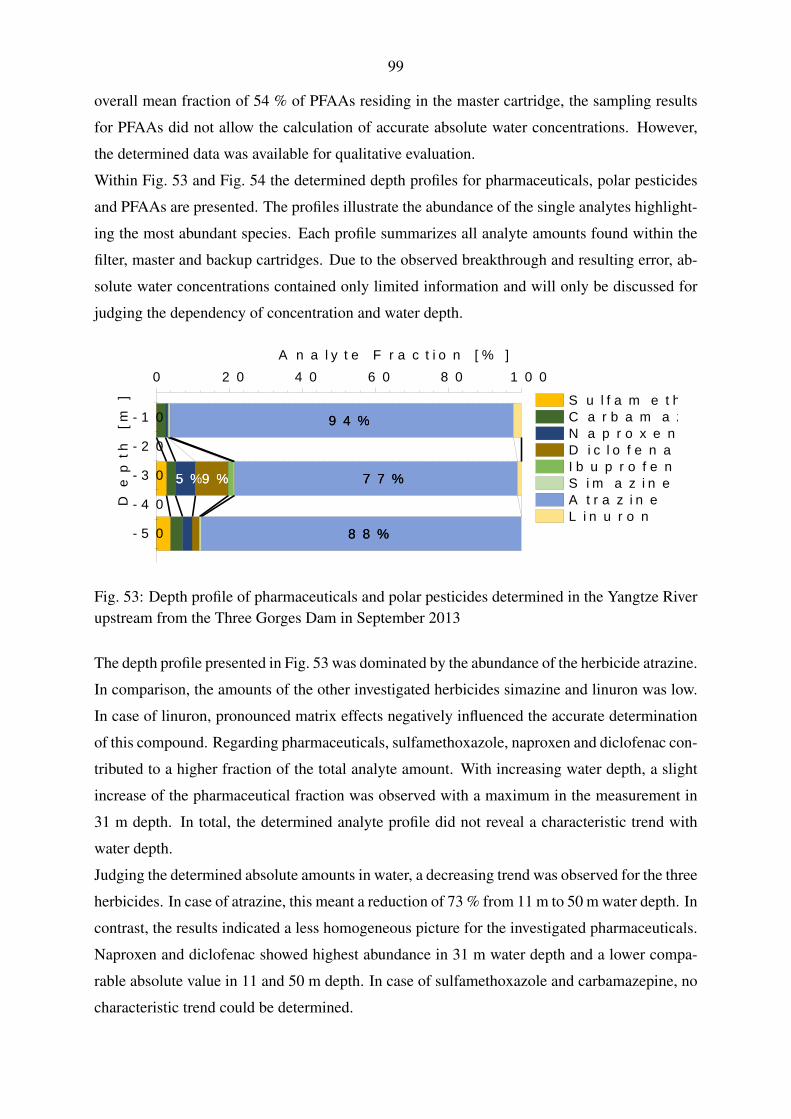
99
overall mean fraction of 54 % of PFAAs residing in the master cartridge, the sampling results
for PFAAs did not allow the calculation of accurate absolute water concentrations. However,
the determined data was available for qualitative evaluation.
Within Fig. 53 and Fig. 54 the determined depth profiles for pharmaceuticals, polar pesticides
and PFAAs are presented. The profiles illustrate the abundance of the single analytes highlight-
ing the most abundant species. Each profile summarizes all analyte amounts found within the
filter, master and backup cartridges. Due to the observed breakthrough and resulting error, ab-
solute water concentrations contained only limited information and will only be discussed for
judging the dependency of concentration and water depth.
5 % 9 %
9 4 %
7 7 %
8 8 %
5 % 9 %
9 4 %
7 7 %
8 8 %- 5 0- 4 0- 3 0- 2 0- 1 0
0 2 0 4 0 6 0 8 0 1 0 0A n a l y t e F r a c t i o n [ % ]
Depth
[m]
S u l f a m e t h o x a z o l e C a r b a m a z e p i n e N a p r o x e n D i c l o f e n a c I b u p r o f e n S i m a z i n e A t r a z i n e L i n u r o n
Fig. 53: Depth profile of pharmaceuticals and polar pesticides determined in the Yangtze Riverupstream from the Three Gorges Dam in September 2013
The depth profile presented in Fig. 53 was dominated by the abundance of the herbicide atrazine.
In comparison, the amounts of the other investigated herbicides simazine and linuron was low.
In case of linuron, pronounced matrix effects negatively influenced the accurate determination
of this compound. Regarding pharmaceuticals, sulfamethoxazole, naproxen and diclofenac con-
tributed to a higher fraction of the total analyte amount. With increasing water depth, a slight
increase of the pharmaceutical fraction was observed with a maximum in the measurement in
31 m depth. In total, the determined analyte profile did not reveal a characteristic trend with
water depth.
Judging the determined absolute amounts in water, a decreasing trend was observed for the three
herbicides. In case of atrazine, this meant a reduction of 73 % from 11 m to 50 m water depth. In
contrast, the results indicated a less homogeneous picture for the investigated pharmaceuticals.
Naproxen and diclofenac showed highest abundance in 31 m water depth and a lower compa-
rable absolute value in 11 and 50 m depth. In case of sulfamethoxazole and carbamazepine, no
characteristic trend could be determined.
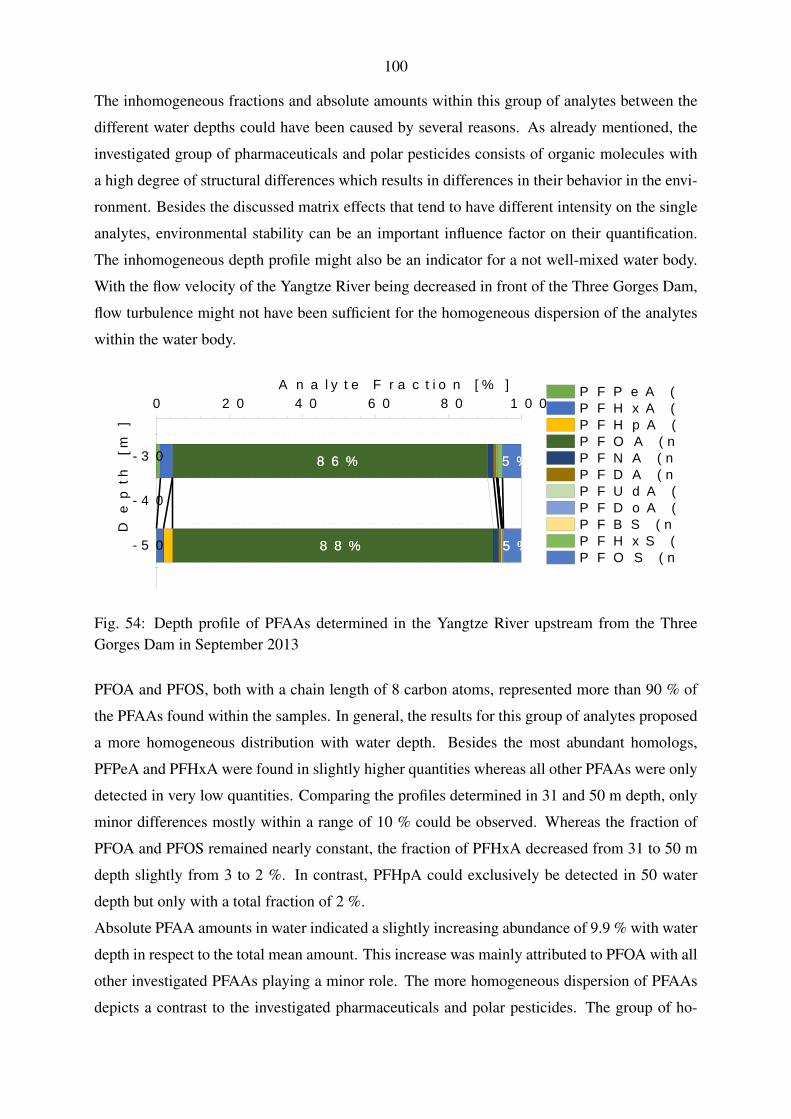
100
The inhomogeneous fractions and absolute amounts within this group of analytes between the
different water depths could have been caused by several reasons. As already mentioned, the
investigated group of pharmaceuticals and polar pesticides consists of organic molecules with
a high degree of structural differences which results in differences in their behavior in the envi-
ronment. Besides the discussed matrix effects that tend to have different intensity on the single
analytes, environmental stability can be an important influence factor on their quantification.
The inhomogeneous depth profile might also be an indicator for a not well-mixed water body.
With the flow velocity of the Yangtze River being decreased in front of the Three Gorges Dam,
flow turbulence might not have been sufficient for the homogeneous dispersion of the analytes
within the water body.
8 6 %
8 8 %
5 %
5 %
8 6 %
8 8 %
5 %
5 %- 5 0
- 4 0
- 3 0
0 2 0 4 0 6 0 8 0 1 0 0A n a l y t e F r a c t i o n [ % ]
Depth
[m]
P F P e A ( n = 5 ) P F H x A ( n = 6 ) P F H p A ( n = 7 ) P F O A ( n = 8 ) P F N A ( n = 9 ) P F D A ( n = 1 0 ) P F U d A ( n = 1 1 ) P F D o A ( n = 1 2 ) P F B S ( n = 4 ) P F H x S ( n = 6 ) P F O S ( n = 8 )
Fig. 54: Depth profile of PFAAs determined in the Yangtze River upstream from the ThreeGorges Dam in September 2013
PFOA and PFOS, both with a chain length of 8 carbon atoms, represented more than 90 % of
the PFAAs found within the samples. In general, the results for this group of analytes proposed
a more homogeneous distribution with water depth. Besides the most abundant homologs,
PFPeA and PFHxA were found in slightly higher quantities whereas all other PFAAs were only
detected in very low quantities. Comparing the profiles determined in 31 and 50 m depth, only
minor differences mostly within a range of 10 % could be observed. Whereas the fraction of
PFOA and PFOS remained nearly constant, the fraction of PFHxA decreased from 31 to 50 m
depth slightly from 3 to 2 %. In contrast, PFHpA could exclusively be detected in 50 water
depth but only with a total fraction of 2 %.
Absolute PFAA amounts in water indicated a slightly increasing abundance of 9.9 % with water
depth in respect to the total mean amount. This increase was mainly attributed to PFOA with all
other investigated PFAAs playing a minor role. The more homogeneous dispersion of PFAAs
depicts a contrast to the investigated pharmaceuticals and polar pesticides. The group of ho-
101
mologs exhibits comparable chemical properties in terms of structure and chemical behavior as
mainly the hydrophobicity of the compounds is influenced by the chain length. The results in-
dicated a homogeneous dispersion in the environment based on the similar chemical properties.
The hypothethis of a not well-mixed water body as possible explanation for an inhomogeneous
dispersion of pharmaceuticals and polar pesticides could not be supported judging the PFAA
results.
With environmental sampling at the Three Gorges Dam, it could be shown that the presented
sampling system allows the convenient on-site enrichment of large water volumes on easily
portable sampling cartridges. The analytic results were capable to reveal qualitative informa-
tion about the abundance and apportionment of analytes at the investigated sampling site. With
sampling in three different water depths, hints for the distribution of analytes with water depth
could be drawn. The sampling system applied in the environment, however, coped with com-
parable issues that could already be identified within the laboratory extraction experiments: the
large cartridge design by itself and the exposure to large water volumes lead to pronounced ma-
trix effects which hindered proper quantification. Moreover, the retention within the sampling
cartridges was not sufficient for a quantitative recovery of analytical target substances from
surface water. The large sample size, higher sampling flow rate and more complex environmen-
tal matrix could explain the even more decreased analyte recovery on the sampling cartridges
compared to the laboratory experiments. Nevertheless, alternative functional resins within the
cartridges, a slightly decreased sample size and lower sampling flow rates would be promising
parameters to increase analyte retention to a level that can be considered as quantitative.
5.6. Inclusion of non-target analysis into the presented method
The HRMS data gathered during targeted analytical runs was used to enhance the existing tar-
geted analysis of compounds with a non-target screening approach. Possible suspects were
identified by database research using not only the exact mass but also the logP-value as identi-
fier. The partition coefficient could be estimated from in-situ calibration of the retention times
with standards from the targeted analysis approach. This procedure was especially beneficial
due to the fact that the employed MS instrument was lacking a permanent mass calibration
surveillance like a lockspray ion source. Consequently, a mass accuracy of about 500 ppm was
still sufficient for compound identification in combination with the logP-value as additional
identifier. Once possible structure suggestions had been identified, the possible suspects were
checked for plausibility. This was established by taking the chemical knowledge about the
sampling, extraction, cleanup and analysis into account. The knowledge about possible short-
comings regarding enrichment capability of the applied sampling technique clearly reduced the
102
amount of possibly enriched substances. Laboratory extraction and cleanup impose a step of
choosing a certain polarity range in which possible target compounds may reside. Finally, chro-
matographic and mass spectrometric results from targeted analysis could be taken into account
as a last suspect filter to identify promising targets. Once compounds passed the plausibility
check, further verification could be achieved with entries in mass spectrometric fractionation
databases which were compared with fractionation products formed during targeted analysis
sample runs as these have been carried out at elevated collision energy in AIF-mode.
For the development of a suitable data processing workflow, samples acquired from an exposed
VO passive sampler were analyzed. Targeted analysis could not detect any investigated com-
pounds within the prepared blank and exposed sampler extracts. The concurrent non-target
analysis generated suspect lists of the two exposed VOs with 15 and 20 possible hits, respec-
tively. The most important criterion for the exclusion of background signals was the response
threshold. With both VOs being exposed at the same sampling site, the results have been aligned
which revealed only two independent signals which could be found in both exposed passive
samplers. These suspects were regarded as the most promising ones. One of these compounds
could be identified as N,N-diethyl-m-toluamide (DEET) with the database STOFF-IDENT with
a high likelihood. The substance is commonly used as insect repellent. The calculated exact
mass-to-charge ratio of the positively charged molecular ion is m/z 192.1388 whereas the ions
acquired had a m/z of 192.1343 and 192.1464, respectively, in the individually measured sam-
ples. Consequently, the acquired mass deviated between 23 and 40 ppm from the calculated
exact mass which is an acceptable value for the employed MS instrument. Nevertheless, the
mass accuracy did not allow doubtless identification of the suspect. Besides the exact mass,
the logP-value was estimated with the help of the RTI-calibration to 2.70 and 2.74 which cor-
responds to a maximum deviation of 0.24 to the predicted value of the ChemAxon algorithm
for the suspect. Moreover, the polarity of the suspect is in well accordance with the retention
capabilities of the HR-X SPE as well as the detection capabilities of the analytical instrument.
Furthermore, a certain structural similarity of the suspect with the small organic molecules
investigated in targeted analysis assured the availability of the compound for electrospray ion-
ization. Further verification of the suspect was possible with MS fragmentation data about the
compound available in the databases DAIOS and MassBank. In total, three characteristic mass
fragments of DEET (119.05, 91.06 and 72.05) were detected in measurements with higher col-
lision energy at the same retention time. Without injection of DEET as standard substance, the
analytical results gave already strong evidence that the detected substance within the exposed
VOs was indeed DEET. Finally, the injection of DEET as a dilution from a purchased analytical
standard solution further supported the results from non-target analysis. The substance gener-
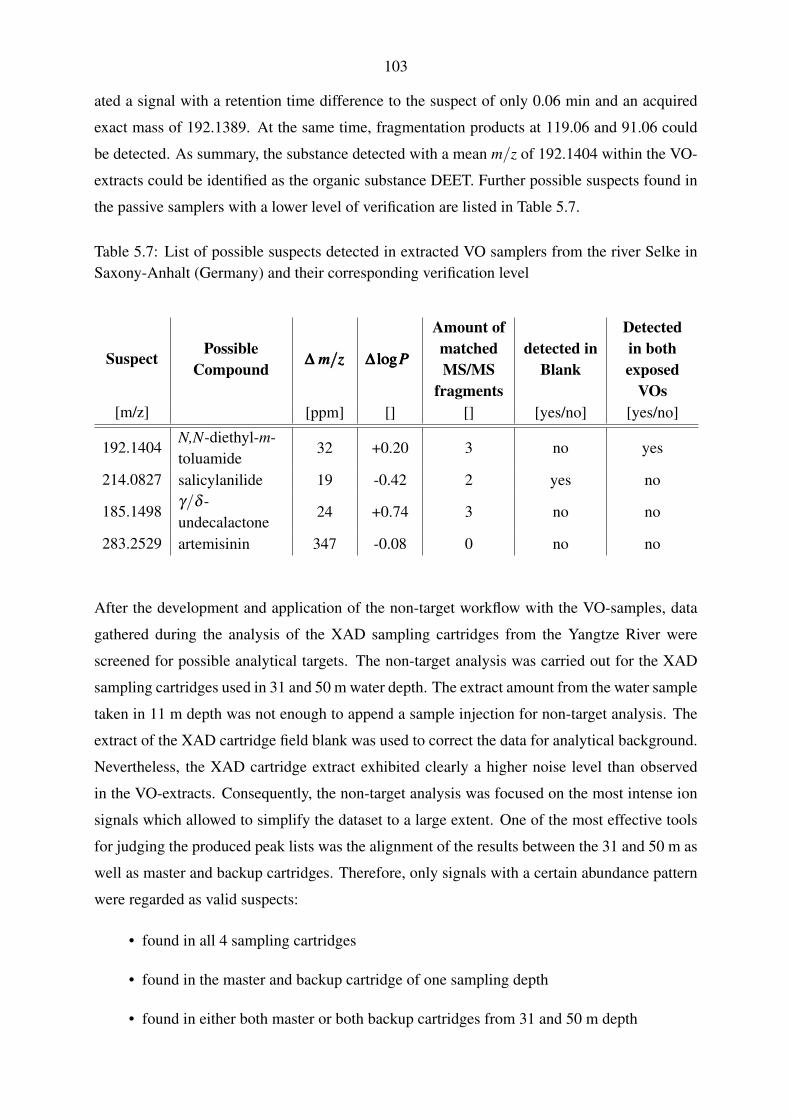
103
ated a signal with a retention time difference to the suspect of only 0.06 min and an acquired
exact mass of 192.1389. At the same time, fragmentation products at 119.06 and 91.06 could
be detected. As summary, the substance detected with a mean m/z of 192.1404 within the VO-
extracts could be identified as the organic substance DEET. Further possible suspects found in
the passive samplers with a lower level of verification are listed in Table 5.7.
Table 5.7: List of possible suspects detected in extracted VO samplers from the river Selke inSaxony-Anhalt (Germany) and their corresponding verification level
Suspect PossibleCompound
∆ m/z∆ m/z∆ m/z ∆ logP∆ logP∆ logP
Amount ofmatchedMS/MS
fragments
detected inBlank
Detectedin bothexposed
VOs[m/z] [ppm] [] [] [yes/no] [yes/no]
192.1404N,N-diethyl-m-toluamide
32 +0.20 3 no yes
214.0827 salicylanilide 19 -0.42 2 yes no
185.1498γ/δ -undecalactone
24 +0.74 3 no no
283.2529 artemisinin 347 -0.08 0 no no
After the development and application of the non-target workflow with the VO-samples, data
gathered during the analysis of the XAD sampling cartridges from the Yangtze River were
screened for possible analytical targets. The non-target analysis was carried out for the XAD
sampling cartridges used in 31 and 50 m water depth. The extract amount from the water sample
taken in 11 m depth was not enough to append a sample injection for non-target analysis. The
extract of the XAD cartridge field blank was used to correct the data for analytical background.
Nevertheless, the XAD cartridge extract exhibited clearly a higher noise level than observed
in the VO-extracts. Consequently, the non-target analysis was focused on the most intense ion
signals which allowed to simplify the dataset to a large extent. One of the most effective tools
for judging the produced peak lists was the alignment of the results between the 31 and 50 m as
well as master and backup cartridges. Therefore, only signals with a certain abundance pattern
were regarded as valid suspects:
• found in all 4 sampling cartridges
• found in the master and backup cartridge of one sampling depth
• found in either both master or both backup cartridges from 31 and 50 m depth
104
These criteria helped to reduce the suspect list from 96 to 23 entries. Obviously, there might
have been unknown substances in one cartridge and one water depth only but the probability of
this case could still be regarded as low. Substances within the polarity range of the compounds
investigated in the targeted approach should also tend to cause breakthrough from the master to
the backup cartridge and hence should have been detectable in both cartridges. Certainly, the
presented approach covers substances with high retention within the sampling cartridges with
the only prerequisite that these compounds were found in both sampling depths. The largest
error imposed by the established criteria might be the discarding of highly polar substances
only detectable in the backup cartridges. In this case, prevailing analyte loss might have lead
to a total loss of polar unknowns in one sampling depth whereas the compound would still be
detectable in the other water depth. The error caused by excluding compounds from the latter
case, however, was regarded as acceptable due to its low probability and the focus on substances
with medium polarity.
7 suspects yielded either no possible substance in database research or structures which were un-
likely to be detected due to the parameters of the analytical method or unavailability to LC-MS.
For further 8 suspects, a possible organic molecule could be proposed but no further verifica-
tion was possible as no MS fractionation data was available in the employed databases DAIOS
and MassBank. 4 structure suggestions from database research matched regarding logP-values
and acquired exact mass but could be rejected as the formed fractionation ions did not match
the datasets gathered from the fractionation databases. Finally, 4 compounds included in the
final suspect list could be verified with at least one mass fragment each abundant in the MS/MS
run, forming a well-shaped peak at the retention time of the suspect. The suspects exhibiting a
higher probability overall are presented in Table 5.8.
The substance with the highest verification level was again DEET which could be verified with
2 mass fragments, analytical availability and matching retention time and fragmentation behav-
ior with the purchased analytical standard substance. Besides, the fungicide isoprothiolane was
detected with a high probability. Although the suspect was detected with a mass deviation of
348 ppm, database research benefited from filtering results with a logP-value larger than the one
from linuron as the suspect eluted after the last eluting substance of the targeted approach. The
suspect could be verified with two matching mass fragments in the MS/MS run. Furthermore,
the structure of isoprothiolane contains two sulfur atoms which were reflected in the isotopic
pattern of the mass peak of the suspect. The fungicide is commonly used in rice cultivation and
has already been reported in the Yangtze River [150]. The suspects cyclizine and mepanipyrim
could both be verified with one MS/MS fragment only. Their acquired exact mass deviated by
316 and 238 ppm from the predicted exact mass of the suggested structures. Nevertheless, judg-
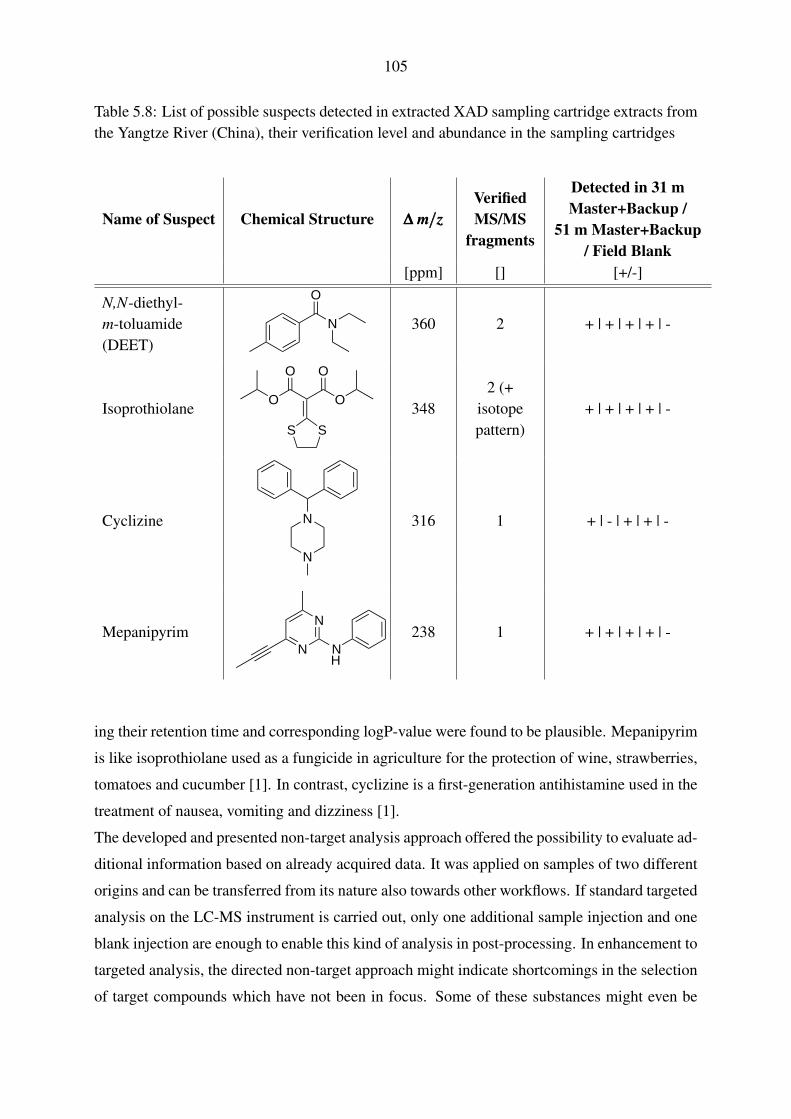
105
Table 5.8: List of possible suspects detected in extracted XAD sampling cartridge extracts fromthe Yangtze River (China), their verification level and abundance in the sampling cartridges
Name of Suspect Chemical Structure ∆ m/z∆ m/z∆ m/zVerifiedMS/MS
fragments
Detected in 31 mMaster+Backup /
51 m Master+Backup/ Field Blank
[ppm] [] [+/-]
N,N-diethyl-m-toluamide(DEET)
O
N 360 2 + | + | + | + | -
IsoprothiolaneSS
OO
OO
3482 (+
isotopepattern)
+ | + | + | + | -
Cyclizine N
N
316 1 + | - | + | + | -
MepanipyrimN
N NH
238 1 + | + | + | + | -
ing their retention time and corresponding logP-value were found to be plausible. Mepanipyrim
is like isoprothiolane used as a fungicide in agriculture for the protection of wine, strawberries,
tomatoes and cucumber [1]. In contrast, cyclizine is a first-generation antihistamine used in the
treatment of nausea, vomiting and dizziness [1].
The developed and presented non-target analysis approach offered the possibility to evaluate ad-
ditional information based on already acquired data. It was applied on samples of two different
origins and can be transferred from its nature also towards other workflows. If standard targeted
analysis on the LC-MS instrument is carried out, only one additional sample injection and one
blank injection are enough to enable this kind of analysis in post-processing. In enhancement to
targeted analysis, the directed non-target approach might indicate shortcomings in the selection
of target compounds which have not been in focus. Some of these substances might even be

106
of interest for the given analytical application. Therefore, ensuring the requirements for non-
target analysis during the acquisition of data for targeted analysis can be seen as an integrated
approach combining the possibility for quantification with screening the environment for new
possible targets. The limited mass accuracy and mass resolution of the employed LC-MS in-
strument, however, did not allow the prediction of sum formulae from the exact mass which
excludes the acquired exact mass to act as main descriptor for non-target suspects. Neverthe-
less, the employed approach including the retention time or partition coefficient as additional
parameter for identification could partly compensate the limits of the LC-MS instrument.
107
6. Conclusion and Outlook
Active pharmaceutical ingredients, polar pesticides and PFAAs can survive the ordinary mu-
nicipal wastewater treatment and are released into the environment in large quantities. Once
released, depending on their chemical properties, they can exhibit endocrine activity or tend to
bioaccumulate. Active pharmaceutical ingredients like antibiotics used for humans or livestock
can impose selection pressure on bacteria and are known to invoke the formation of multi-
resistant bacteria strains. Therefore, analytical methods are needed for the surveillance of the
abundance of these anthropogenic substances in the environment. Within surface water, how-
ever, analytical targets tend to be diluted in large water bodies like rivers and lakes, making their
detection and quantification a challenging task. Consequently, most analytical techniques for
the analysis of organic trace substances in water include a sample pre-concentration step right
before instrumental quantification.
The presented work covered the complete development of a new analytical method for the de-
termination of emerging organic pollutants in surface water. The method included a sampling
system designed for the enrichment of water volumes up to 300 L, a suitable laboratory extrac-
tion and cleanup as well as an advanced instrumental method and detection with LC-MS.
At the beginning of this study, the capabilities of the chromatographic and mass spectrometric
detection system had to be evaluated in order to conduct further testing of extraction and cleanup
performances in the laboratory with a stable operating analytical instrument. Chromatographic
method development was focused on the establishment of a suitable fluidic configuration that
allowed a reproducible, precise and sensitive detection of the targeted analytes. The available
analytical instrument allowed separations to be conducted in nano- and micro-scale. More-
over, an optional trapping column could be installed for pre-concentration and washing samples
from salts during operation in nano-scale. The investigation of the capabilities of the chro-
matographic instrument with nano-scale configuration revealed that the trapping setup was not
suitable for the analysis of small polar molecules. It could be demonstrated that a large pro-
portion of analytes was lost during trapping and pronounced peak tailing was observed as a
consequence. Moreover, this issue could not be resolved with adjusting the analytical gradi-
ent. With the removal of the trapping column from the flow path, peak tailing was absent and
the separation performance as well as sensitivity could be improved. Most of the analyzed
compounds could be baseline separated which improved the sensitivity and response linearity
during the mass spectrometric detection.
The micro-fluidic setup was more simple in operation and was found to be more versatile and
fast for the routine analysis of small organic molecules. Although the larger system scale exhib-
108
ited a system intrinsic handicap regarding detection sensitivity, the benefits in operation were
found to be convincing to apply mainly this configuration for further recovery testing and envi-
ronmental sample analysis.
The sensitivity and peak shape during gradient elution of pharmaceuticals, polar pesticides and
PFAAs was found to be strongly dependent on the solvent composition of the sample solvent
but independent of the fluidic configuration. This dependency was elucidated and optimized
parameters for environmental sample analysis could be determined.
In parallel to chromatographic method development, the abilities of the employed mass spec-
trometer were investigated. Thereby, the stable operation of standard-scale and nano-scale ESI
proved to be crucial for reproducible analysis runs. The stabilization of the nano-scale electro-
spray required several prerequisites which had to be validated in an extended empirical process.
Therefore, it was necessary to identify and optimize several operational parameters like sol-
vent purity, capillary voltage, tip position and flow rate. As a result, an uninterrupted operation
in nano-scale for more than 4 weeks could be achieved. The most challenging issues during
nano-scale operation were caused by the limited lifetime of nanospray emitters. The knowledge
gained about the mentioned operational parameters was important for reproducible analytical
results which were needed for subsequent conducted laboratory experiments.
The operation of the MS required the evaluation of different operation modes in terms of suit-
ability for quantification. Analytical background could be successfully reduced with operation
modes using collision induced dissociation. However, instrumental limitations were discov-
ered in the parallel processing of MS functions to allow isotope dilution analysis. The issue
was investigated and negative effects on response linearity, acquisition frequency and sensitiv-
ity were discovered. Taking these results into account it was possible to develop MS methods
with respect to the instrument limitations. A dedicated MS/MS method for the detection of an-
alytes side-by-side as well as a combined approach for fragmenting all ions at once have been
developed and were both suitable for application in further quantitative measurements.
With the combined progress in the chromatographic and mass spectrometric development, the
instrument could be calibrated for quantification and recovery experiments. Achieving a rea-
sonable and linear response with the nano-scale setup required several adjustments in the prepa-
ration of calibration standards. In contrast, calibration standard preparation could be simplified
during micro-scale operation.
With the known instrumental parameters, an applicable cleanup for environmental samples
based on solid-phase extraction was developed. The comparison of different PS-DVB-based
SPE cartridges revealed huge differences in the retention performance of the single sorbents.
Based on the test results a promising SPE chemistry was chosen which allowed the reasonable
109
enrichment of highly polar target compounds. Besides SPE cartridges, different syringe filters
for sample preparation were compared. It could be demonstrated that even simple laboratory
steps like filtration can invoke a huge loss of analyte and the introduction of analytical matrix.
The introduction of background substances was minimized by replacing extract filtration with
a centrifuge step.
Different extraction techniques for sampling cartridges used for large volume water sampling
were compared and the matrix effect, cleanup and extraction performance were analyzed. It
could be concluded that the work with high solvent amounts and large sampling cartridges gen-
erated a pronounced matrix effect which could only be partially compensated by the conducted
SPE cleanup. Additionally, the sampling of spiked 25 L water volumes allowed a laboratory
controlled study of the enrichment performance of the self-packed sampling cartridges. The re-
sults indicated that the retention of highly polar compounds was weak and that a certain analyte
breakthrough could be expected with the tested sampling layout. For comparison an alternative
sample pre-concentration step involving direct SPE was tested. Thereby, improved compound
recovery and less pronounced matrix effects were observed. However, the analysis of a spiked
environmental water sample indicated issues with matrix effects also with the direct SPE and a
decreased sample amount.
The processing of environmental samples from the Yangtze River was used to further charac-
terize the abilities of the developed active water sampling system. Again the issue of analyte
breakthrough was encountered rendering the analytical results semi-quantitative. Nevertheless,
depth profiling at the sampling site could be conducted with the comparison of analyte fractions
with sampling depth.
Finally, the targeted analysis method was enhanced by a comprehensive non-target approach for
the identification of interesting analytical targets which might be included in future measure-
ments. The workflow was successfully applied on samples from a passive sampler as well as
the samples collected in the Yangtze River. Both analyses yielded promising suspect lists which
were identified with high probability within the environmental samples.
The sampling of large water volumes could still be optimized in the future. The evaluation of
new sorption resins within the sampling cartridges exhibits huge potential for the improvement
of analyte retention. The experiments conducted with direct-SPE already demonstrated that
a highly specific sorption medium allows a quantitative recovery of medium polar analytes.
Besides, further attention regarding sample cartridge extraction techniques seems reasonable
for further reduction of matrix effects.
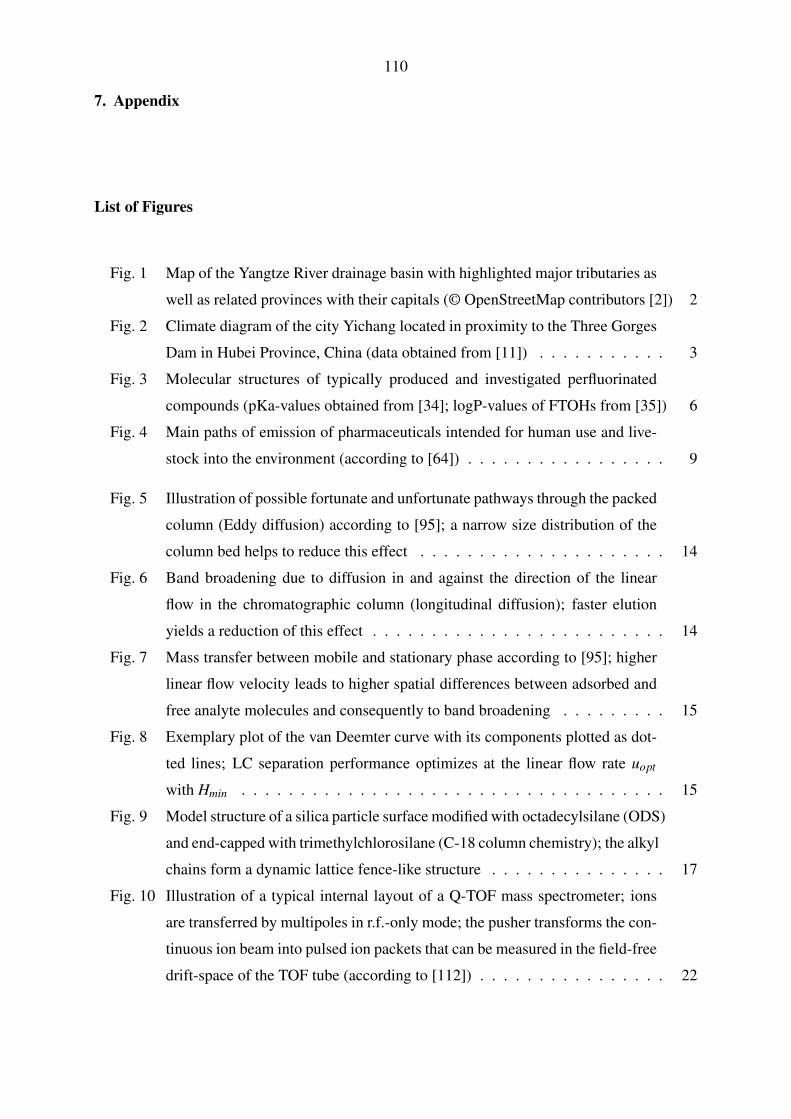
110
7. Appendix
List of Figures
Fig. 1 Map of the Yangtze River drainage basin with highlighted major tributaries as
well as related provinces with their capitals (© OpenStreetMap contributors [2]) 2
Fig. 2 Climate diagram of the city Yichang located in proximity to the Three Gorges
Dam in Hubei Province, China (data obtained from [11]) . . . . . . . . . . . 3
Fig. 3 Molecular structures of typically produced and investigated perfluorinated
compounds (pKa-values obtained from [34]; logP-values of FTOHs from [35]) 6
Fig. 4 Main paths of emission of pharmaceuticals intended for human use and live-
stock into the environment (according to [64]) . . . . . . . . . . . . . . . . . 9
Fig. 5 Illustration of possible fortunate and unfortunate pathways through the packed
column (Eddy diffusion) according to [95]; a narrow size distribution of the
column bed helps to reduce this effect . . . . . . . . . . . . . . . . . . . . . 14
Fig. 6 Band broadening due to diffusion in and against the direction of the linear
flow in the chromatographic column (longitudinal diffusion); faster elution
yields a reduction of this effect . . . . . . . . . . . . . . . . . . . . . . . . . 14
Fig. 7 Mass transfer between mobile and stationary phase according to [95]; higher
linear flow velocity leads to higher spatial differences between adsorbed and
free analyte molecules and consequently to band broadening . . . . . . . . . 15
Fig. 8 Exemplary plot of the van Deemter curve with its components plotted as dot-
ted lines; LC separation performance optimizes at the linear flow rate uopt
with Hmin . . . . . . . . . . . . . . . . . . . . . . . . . . . . . . . . . . . . 15
Fig. 9 Model structure of a silica particle surface modified with octadecylsilane (ODS)
and end-capped with trimethylchlorosilane (C-18 column chemistry); the alkyl
chains form a dynamic lattice fence-like structure . . . . . . . . . . . . . . . 17
Fig. 10 Illustration of a typical internal layout of a Q-TOF mass spectrometer; ions
are transferred by multipoles in r.f.-only mode; the pusher transforms the con-
tinuous ion beam into pulsed ion packets that can be measured in the field-free
drift-space of the TOF tube (according to [112]) . . . . . . . . . . . . . . . . 22
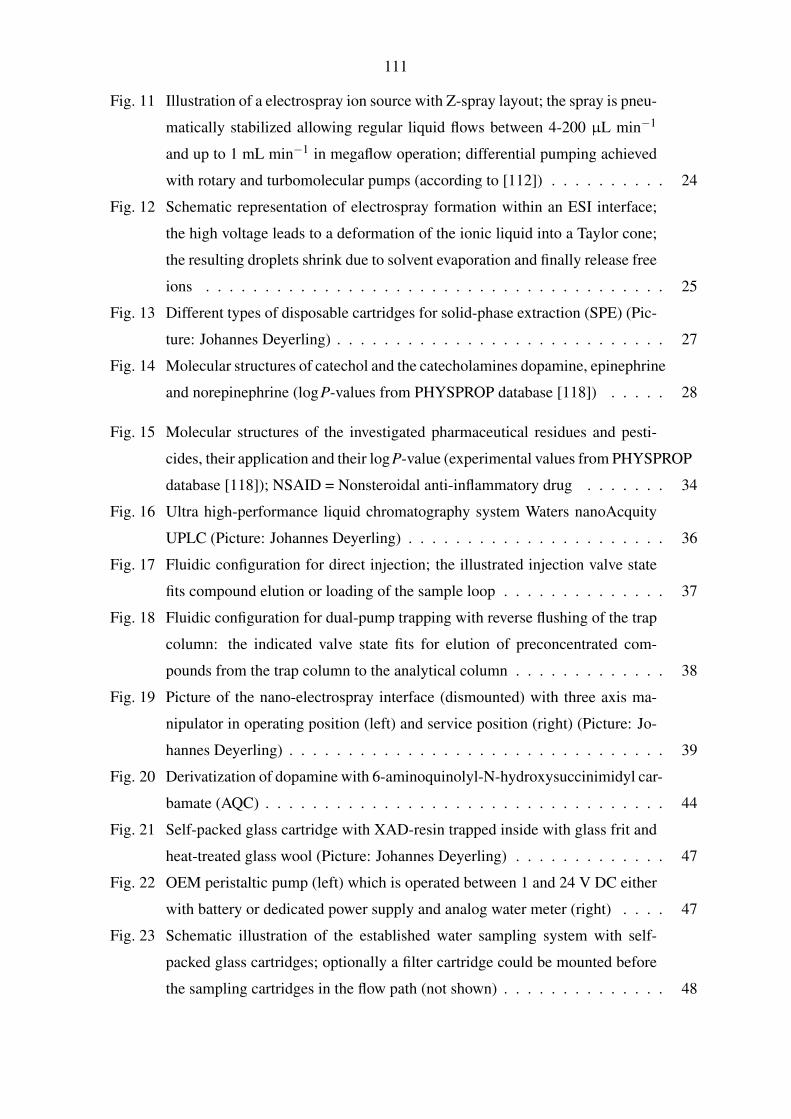
111
Fig. 11 Illustration of a electrospray ion source with Z-spray layout; the spray is pneu-
matically stabilized allowing regular liquid flows between 4-200 µL min−1
and up to 1 mL min−1 in megaflow operation; differential pumping achieved
with rotary and turbomolecular pumps (according to [112]) . . . . . . . . . . 24
Fig. 12 Schematic representation of electrospray formation within an ESI interface;
the high voltage leads to a deformation of the ionic liquid into a Taylor cone;
the resulting droplets shrink due to solvent evaporation and finally release free
ions . . . . . . . . . . . . . . . . . . . . . . . . . . . . . . . . . . . . . . . 25
Fig. 13 Different types of disposable cartridges for solid-phase extraction (SPE) (Pic-
ture: Johannes Deyerling) . . . . . . . . . . . . . . . . . . . . . . . . . . . . 27
Fig. 14 Molecular structures of catechol and the catecholamines dopamine, epinephrine
and norepinephrine (logP-values from PHYSPROP database [118]) . . . . . 28
Fig. 15 Molecular structures of the investigated pharmaceutical residues and pesti-
cides, their application and their logP-value (experimental values from PHYSPROP
database [118]); NSAID = Nonsteroidal anti-inflammatory drug . . . . . . . 34
Fig. 16 Ultra high-performance liquid chromatography system Waters nanoAcquity
UPLC (Picture: Johannes Deyerling) . . . . . . . . . . . . . . . . . . . . . . 36
Fig. 17 Fluidic configuration for direct injection; the illustrated injection valve state
fits compound elution or loading of the sample loop . . . . . . . . . . . . . . 37
Fig. 18 Fluidic configuration for dual-pump trapping with reverse flushing of the trap
column: the indicated valve state fits for elution of preconcentrated com-
pounds from the trap column to the analytical column . . . . . . . . . . . . . 38
Fig. 19 Picture of the nano-electrospray interface (dismounted) with three axis ma-
nipulator in operating position (left) and service position (right) (Picture: Jo-
hannes Deyerling) . . . . . . . . . . . . . . . . . . . . . . . . . . . . . . . . 39
Fig. 20 Derivatization of dopamine with 6-aminoquinolyl-N-hydroxysuccinimidyl car-
bamate (AQC) . . . . . . . . . . . . . . . . . . . . . . . . . . . . . . . . . . 44
Fig. 21 Self-packed glass cartridge with XAD-resin trapped inside with glass frit and
heat-treated glass wool (Picture: Johannes Deyerling) . . . . . . . . . . . . . 47
Fig. 22 OEM peristaltic pump (left) which is operated between 1 and 24 V DC either
with battery or dedicated power supply and analog water meter (right) . . . . 47
Fig. 23 Schematic illustration of the established water sampling system with self-
packed glass cartridges; optionally a filter cartridge could be mounted before
the sampling cartridges in the flow path (not shown) . . . . . . . . . . . . . . 48
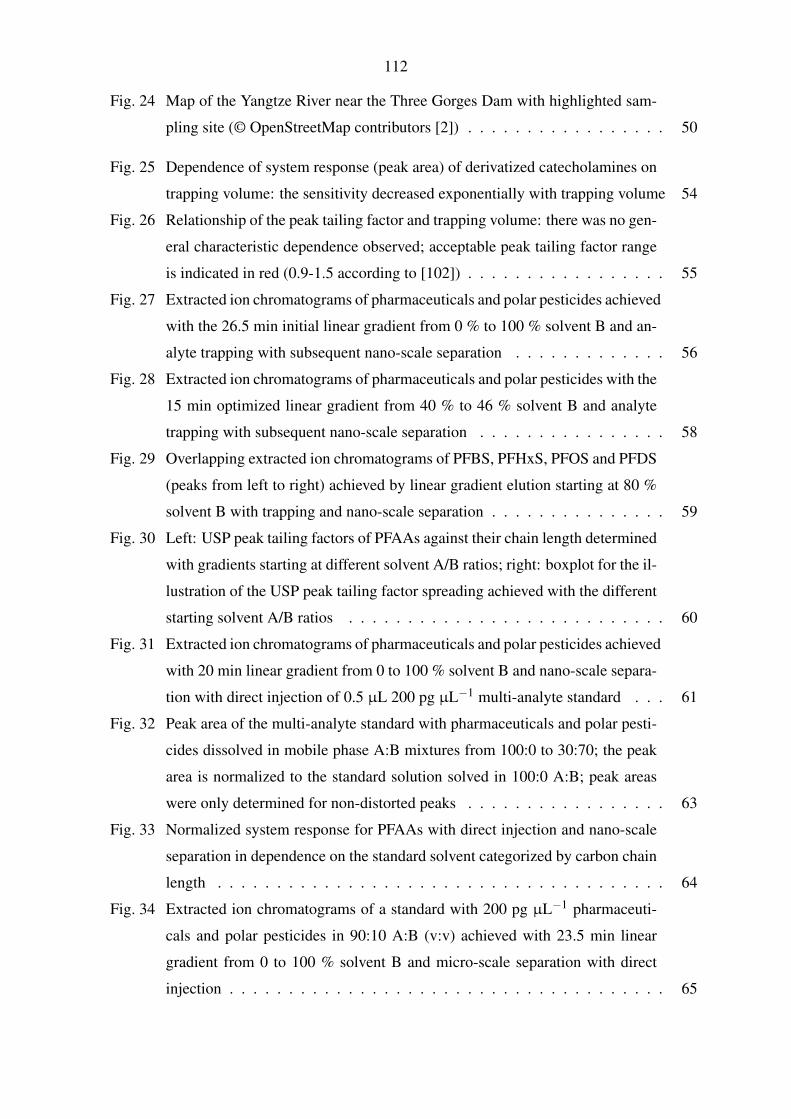
112
Fig. 24 Map of the Yangtze River near the Three Gorges Dam with highlighted sam-
pling site (© OpenStreetMap contributors [2]) . . . . . . . . . . . . . . . . . 50
Fig. 25 Dependence of system response (peak area) of derivatized catecholamines on
trapping volume: the sensitivity decreased exponentially with trapping volume 54
Fig. 26 Relationship of the peak tailing factor and trapping volume: there was no gen-
eral characteristic dependence observed; acceptable peak tailing factor range
is indicated in red (0.9-1.5 according to [102]) . . . . . . . . . . . . . . . . . 55
Fig. 27 Extracted ion chromatograms of pharmaceuticals and polar pesticides achieved
with the 26.5 min initial linear gradient from 0 % to 100 % solvent B and an-
alyte trapping with subsequent nano-scale separation . . . . . . . . . . . . . 56
Fig. 28 Extracted ion chromatograms of pharmaceuticals and polar pesticides with the
15 min optimized linear gradient from 40 % to 46 % solvent B and analyte
trapping with subsequent nano-scale separation . . . . . . . . . . . . . . . . 58
Fig. 29 Overlapping extracted ion chromatograms of PFBS, PFHxS, PFOS and PFDS
(peaks from left to right) achieved by linear gradient elution starting at 80 %
solvent B with trapping and nano-scale separation . . . . . . . . . . . . . . . 59
Fig. 30 Left: USP peak tailing factors of PFAAs against their chain length determined
with gradients starting at different solvent A/B ratios; right: boxplot for the il-
lustration of the USP peak tailing factor spreading achieved with the different
starting solvent A/B ratios . . . . . . . . . . . . . . . . . . . . . . . . . . . 60
Fig. 31 Extracted ion chromatograms of pharmaceuticals and polar pesticides achieved
with 20 min linear gradient from 0 to 100 % solvent B and nano-scale separa-
tion with direct injection of 0.5 µL 200 pg µL−1 multi-analyte standard . . . 61
Fig. 32 Peak area of the multi-analyte standard with pharmaceuticals and polar pesti-
cides dissolved in mobile phase A:B mixtures from 100:0 to 30:70; the peak
area is normalized to the standard solution solved in 100:0 A:B; peak areas
were only determined for non-distorted peaks . . . . . . . . . . . . . . . . . 63
Fig. 33 Normalized system response for PFAAs with direct injection and nano-scale
separation in dependence on the standard solvent categorized by carbon chain
length . . . . . . . . . . . . . . . . . . . . . . . . . . . . . . . . . . . . . . 64
Fig. 34 Extracted ion chromatograms of a standard with 200 pg µL−1 pharmaceuti-
cals and polar pesticides in 90:10 A:B (v:v) achieved with 23.5 min linear
gradient from 0 to 100 % solvent B and micro-scale separation with direct
injection . . . . . . . . . . . . . . . . . . . . . . . . . . . . . . . . . . . . . 65
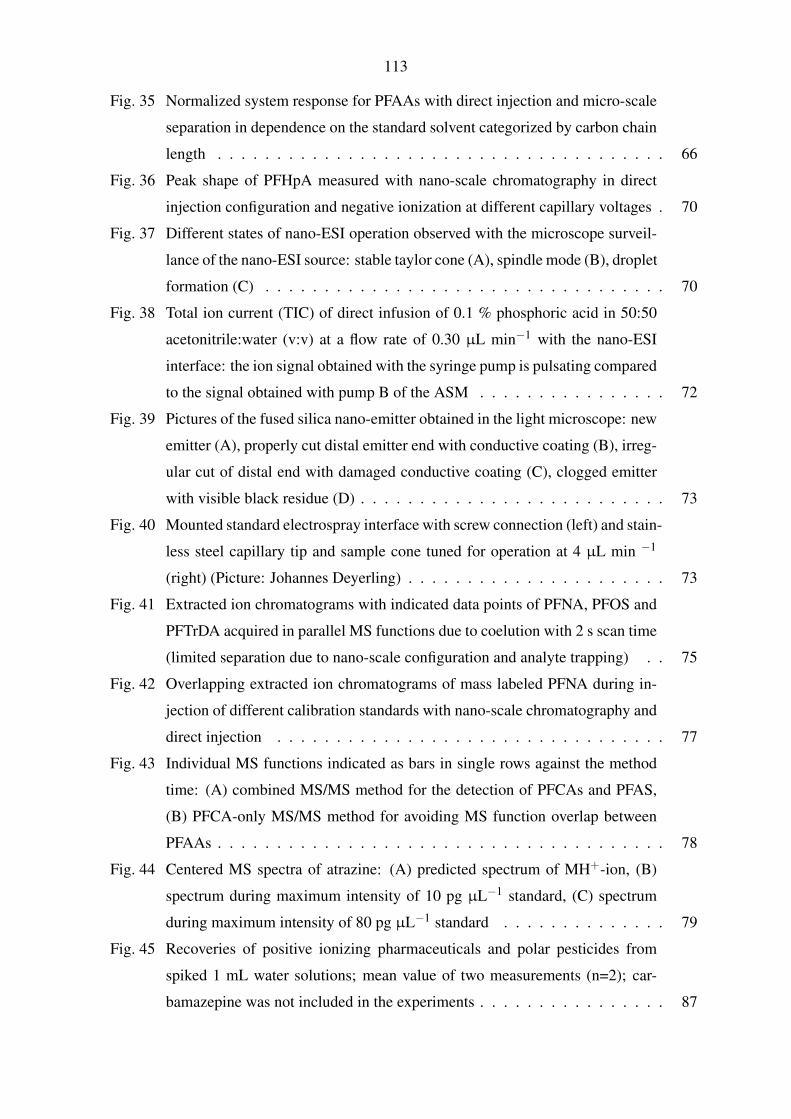
113
Fig. 35 Normalized system response for PFAAs with direct injection and micro-scale
separation in dependence on the standard solvent categorized by carbon chain
length . . . . . . . . . . . . . . . . . . . . . . . . . . . . . . . . . . . . . . 66
Fig. 36 Peak shape of PFHpA measured with nano-scale chromatography in direct
injection configuration and negative ionization at different capillary voltages . 70
Fig. 37 Different states of nano-ESI operation observed with the microscope surveil-
lance of the nano-ESI source: stable taylor cone (A), spindle mode (B), droplet
formation (C) . . . . . . . . . . . . . . . . . . . . . . . . . . . . . . . . . . 70
Fig. 38 Total ion current (TIC) of direct infusion of 0.1 % phosphoric acid in 50:50
acetonitrile:water (v:v) at a flow rate of 0.30 µL min−1 with the nano-ESI
interface: the ion signal obtained with the syringe pump is pulsating compared
to the signal obtained with pump B of the ASM . . . . . . . . . . . . . . . . 72
Fig. 39 Pictures of the fused silica nano-emitter obtained in the light microscope: new
emitter (A), properly cut distal emitter end with conductive coating (B), irreg-
ular cut of distal end with damaged conductive coating (C), clogged emitter
with visible black residue (D) . . . . . . . . . . . . . . . . . . . . . . . . . . 73
Fig. 40 Mounted standard electrospray interface with screw connection (left) and stain-
less steel capillary tip and sample cone tuned for operation at 4 µL min −1
(right) (Picture: Johannes Deyerling) . . . . . . . . . . . . . . . . . . . . . . 73
Fig. 41 Extracted ion chromatograms with indicated data points of PFNA, PFOS and
PFTrDA acquired in parallel MS functions due to coelution with 2 s scan time
(limited separation due to nano-scale configuration and analyte trapping) . . 75
Fig. 42 Overlapping extracted ion chromatograms of mass labeled PFNA during in-
jection of different calibration standards with nano-scale chromatography and
direct injection . . . . . . . . . . . . . . . . . . . . . . . . . . . . . . . . . 77
Fig. 43 Individual MS functions indicated as bars in single rows against the method
time: (A) combined MS/MS method for the detection of PFCAs and PFAS,
(B) PFCA-only MS/MS method for avoiding MS function overlap between
PFAAs . . . . . . . . . . . . . . . . . . . . . . . . . . . . . . . . . . . . . . 78
Fig. 44 Centered MS spectra of atrazine: (A) predicted spectrum of MH+-ion, (B)
spectrum during maximum intensity of 10 pg µL−1 standard, (C) spectrum
during maximum intensity of 80 pg µL−1 standard . . . . . . . . . . . . . . 79
Fig. 45 Recoveries of positive ionizing pharmaceuticals and polar pesticides from
spiked 1 mL water solutions; mean value of two measurements (n=2); car-
bamazepine was not included in the experiments . . . . . . . . . . . . . . . . 87
114
Fig. 46 Response deviation of syringe filtered standard solutions to unfiltered stan-
dard of native positive ionizing pharmaceuticals and polar pesticides (non-IS
corrected, n=3) . . . . . . . . . . . . . . . . . . . . . . . . . . . . . . . . . 89
Fig. 47 Response deviation of syringe filtered standard solutions to unfiltered stan-
dard of native positive ionizing pharmaceuticals and polar pesticides (non-IS
corrected, n=3) . . . . . . . . . . . . . . . . . . . . . . . . . . . . . . . . . 90
Fig. 48 Signal suppression and enhancement during extraction and cleanup of arti-
ficially spiked sampling cartridges; losses due to extraction and cleanup in-
dicated as hatched column parts, matrix effects as plain column parts; SE:=
Soxhlet extraction, CE:= cartridge elution . . . . . . . . . . . . . . . . . . . 92
Fig. 49 Analyte partition between master and backup sampling cartridge for positive
ionizing pharmaceuticals and polar pesticides observed while sampling 25 L
artificially spiked distilled water; mean of three independent extraction tests;
the signal intensity of naproxen in the extracts did not allow this calculation . 94
Fig. 50 Signal suppression and enhancement determined with direct solid-phase ex-
traction of artificially spiked water samples; losses due to extraction indicated
as hatched column parts, matrix effects as plain column parts . . . . . . . . . 95
Fig. 51 Partition of pharmaceuticals and polar pesticides between filter, master and
backup sampling cartridge observed during sampling at the Three Gorges
Dam (China); mean value of the measurements in 11, 31 and 50 m water
depth . . . . . . . . . . . . . . . . . . . . . . . . . . . . . . . . . . . . . . . 97
Fig. 52 Partition of perfuorinated alkyl acids (PFAAs) between filter, master and backup
sampling cartridge observed during sampling at the Three Gorges Dam (China);
mean value of the measurements in 11, 31 and 50 m water depth . . . . . . . 98
Fig. 53 Depth profile of pharmaceuticals and polar pesticides determined in the Yangtze
River upstream from the Three Gorges Dam in September 2013 . . . . . . . . 99
Fig. 54 Depth profile of PFAAs determined in the Yangtze River upstream from the
Three Gorges Dam in September 2013 . . . . . . . . . . . . . . . . . . . . . 100
115
List of Tables
4.1 List of PFCs contained within the native standard mixture and the mass labelled
mixture . . . . . . . . . . . . . . . . . . . . . . . . . . . . . . . . . . . . . . . 35
4.2 Dilution scheme for the preparation of PFAA standards used for calibration of the
instrument in nano-scale configuration with direct injection . . . . . . . . . . . . 43
4.3 List of evaluated solid-phase extraction cartridges for laboratory cleanup . . . . . 45
5.1 Retention time and resolution of adjacent peaks of pharmaceuticals and polar
pesticides during initial gradient elution with trapping and nano-scale separation . 57
5.2 Retention time and resolution of critical peak pairs with optimized gradient shape
and starting solvent B from 40 to 80 % achieved with trapping and nano-scale
separation . . . . . . . . . . . . . . . . . . . . . . . . . . . . . . . . . . . . . . 58
5.3 Retention time and resolution of adjacent peaks during gradient elution of phar-
maceuticals and polar pesticides achieved with nano-scale separation and direct
injection . . . . . . . . . . . . . . . . . . . . . . . . . . . . . . . . . . . . . . . 62
5.4 Peak area of internal standards (IS) determined in TOF-MS and MS/MS mode
achieved by injecting 0.5 µL of a calibration standard for pharmaceuticals and
polar pesticides . . . . . . . . . . . . . . . . . . . . . . . . . . . . . . . . . . . 76
5.5 List of parameters and results from system calibration obtained with nano-scale
chromatography and direct injection; pharmaceuticals and polar pesticides were
calibrated with single injections, PFAAs with triplicate measurements . . . . . . 81
5.6 List of parameters and results from system calibration obtained with micro-scale
chromatography and direct injection with triplicate measurements for pharmaceu-
ticals and polar pesticides and single measurements for PFAAs . . . . . . . . . . 84
5.7 List of possible suspects detected in extracted VO samplers from the river Selke
in Saxony-Anhalt (Germany) and their corresponding verification level . . . . . . 103
5.8 List of possible suspects detected in extracted XAD sampling cartridge extracts
from the Yangtze River (China), their verification level and abundance in the sam-
pling cartridges . . . . . . . . . . . . . . . . . . . . . . . . . . . . . . . . . . . 105
116
Bibliography
[1] Georg Thieme Verlag, RÖMPP Online-Enzyklopädie, http://www.roempp.com, ac-
cessed: 2015-05-05.
[2] OpenStreetMap, http://www.openstreetmap.org, accessed: 2015-05-01.
[3] J. Zhang, Geochemistry of trace metals from chinese river/estuary systems: An overview,
Estuarine, Coastal and Shelf Science 41 (6) (1995) 631–658. doi:10.1006/ecss.
1995.0082.
[4] A. Bergmann, Y. Bi, L. Chen, T. Floehr, B. Henkelmann, A. Holbach, H. Hollert, W. Hu,
I. Kranzioch, E. Klumpp, S. Küppers, S. Norra, R. Ottermanns, G. Pfister, M. Roß-
Nickoll, A. Schäffer, N. Schleicher, B. Schmidt, B. Scholz-Starke, K.-W. Schramm,
G. Subklew, A. Tiehm, C. Temoka, J. Wang, B. Westrich, R.-D. Wilken, A. Wolf,
X. Xiang, Y. Yuan, The Yangtze-Hydro Project: a Chinese-German environmental
program, Environmental Science and Pollution Research 19 (4) (2012) 1341–1344.
doi:10.1007/s11356-011-0645-7.
[5] T. Floehr, H. Xiao, B. Scholz-Starke, L. Wu, J. Hou, D. Yin, X. Zhang, R. Ji, X. Yuan,
R. Ottermanns, M. Roß-Nickoll, A. Schäffer, H. Hollert, Solution by dilution? - A re-
view on the pollution status of the Yangtze River, Environmental Science and Pollution
Research 20 (10) (2013) 6934–6971. doi:10.1007/s11356-013-1666-1.
[6] China National Environmental Monitoring Center, Bulletin on the Ecological and Envi-
ronmental Monitoring Results of the Three Gorges Project 2011, Tech. rep. (2011).
[7] China National Environmental Monitoring Center, Bulletin on the Ecological and Envi-
ronmental Monitoring Results of the Three Gorges Project 2009, Tech. rep. (2009).
[8] China National Environmental Monitoring Center, Bulletin on the Ecological and Envi-
ronmental Monitoring Results of the Three Gorges Project 2010, Tech. rep. (2010).
[9] Greenpeace, Swimming in Poison - An Analysis of hazardous chemicals in Yangtze
River fish, http://www.greenpeace.org/eastasia/publications/reports/
toxics/2010/swimming-in-poison-yangtze-fish/, accessed: 2015-04-30 (2010).
[10] China Internet Information Center, Wiki on Yangzte, http://wiki.china.org.cn/
wiki/index.php/Yangtze, published under the auspices of the State Council Informa-
tion Office and the China International Publishing Group, accessed: 2015-04-30.
117
[11] AmbiWeb GmbH, Climate-Data.org - Klimadaten für Städte weltweit, http://de.
climate-data.org, accessed: 2015-05-03.
[12] T. Dorcey, A. Steiner, M. Acreman, B. Orlando (Eds.), Large Dams: Learning from the
Past, Looking at the Future. Workshop Proceedings., ICUN - The World Conservation
Union and the World Bank Group, 1997.
[13] A. Wolf, A. Bergmann, R.-D. Wilken, X. Gao, Y. Bi, H. Chen, C. Schüth, Occurrence
and distribution of organic trace substances in waters from the Three Gorges Reservoir,
China, Environmental Science and Pollution Research 20 (10) (2013) 7124–7139. doi:
10.1007/s11356-013-1929-x.
[14] D. Deyerling, J. Wang, W. Hu, B. Westrich, C. Peng, Y. Bi, B. Henkelmann, K.-W.
Schramm, PAH distribution and mass fluxes in the Three Gorges Reservoir after im-
poundment of the Three Gorges Dam, Science of The Total Environment 491-492 (0)
(2014) 123–130. doi:10.1016/j.scitotenv.2014.03.076.
[15] S. Jackson, A. Sleigh, Resettlement for China’s Three Gorges Dam: socio-economic
impact and institutional tensions, Communist and Post-Communist Studies 33 (2) (2000)
223–241. doi:10.1016/S0967-067X(00)00005-2.
[16] G. Subklew, J. Ulrich, L. Fürst, A. Höltkemeier, Environmental impacts of the Yangtze
Three Gorges project: An overview of the Chinese-German research cooperation, Journal
of Earth Science 21 (6) (2010) 817–823. doi:10.1007/s12583-010-0133-x.
[17] C. Wong, C. Williams, J. Pittock, U. Collier, U. Schelle, P. Schelle, World’s top 10 rivers
at risk, Tech. rep., WWF (2007).
URL http://wwf.panda.org/?108620/Worlds-Top-10-Rivers-at-Risk
[18] B. Müller, M. Berg, Z. P. Yao, X. F. Zhang, D. Wang, A. Pfluger, How polluted is the
Yangtze river? Water quality downstream from the Three Gorges Dam, Science of The
Total Environment 402 (2-3) (2008) 232–247. doi:10.1016/j.scitotenv.2008.04.
049.
[19] F. Heeb, H. Singer, B. Pernet-Coudrier, W. Qi, H. Liu, P. Longrée, B. Müller, M. Berg,
Organic Micropollutants in Rivers Downstream of the Megacity Beijing: Sources and
Mass Fluxes in a Large-Scale Wastewater Irrigation System, Environmental Science &
Technology 46 (16) (2012) 8680–8688. doi:10.1021/es301912q.
118
[20] UNEP, Stockholm Convention at a glance, United Nationes Environment Programme,
2015.
URL http://chm.pops.int/Portals/0/download.aspx?d=
UNEP-POPS-PAWA-OVERV-AtaGlance.En.pdf
[21] J. Weber, C. J. Halsall, D. Muir, C. Teixeira, J. Small, K. Solomon, M. Hermanson,
H. Hung, T. Bidleman, Endosulfan, a global pesticide: A review of its fate in the envi-
ronment and occurrence in the Arctic, Science of The Total Environment 408 (15) (2010)
2966–2984. doi:10.1016/j.scitotenv.2009.10.077.
[22] EPA, Facts Sheet on Polycyclic Aromatic Hydrocarbons, United States Environmental
Protection Agency, 2008.
[23] A. M. Mastral, M. S. Callén, J. M. López, R. Murillo, T. Garciá, M. V. Navarro, Critical
review on atmospheric PAH. Assessment of reported data in the Mediterranean basin,
Fuel Processing Technology 80 (2) (2003) 183–193.
URL http://www.sciencedirect.com/science/article/pii/
S0378382002002497
[24] J. Topinka, L. R. Schwarz, F. Kiefer, F. J. Wiebel, O. Gajdos, P. Vidová, L. Dobiás,
M. Fried, R. J. Srám, T. Wolff, DNA adduct formation in mammalian cell cultures
by polycyclic aromatic hydrocarbons (PAH) and nitro-PAH in coke oven emission ex-
tract, Mutation Research/Genetic Toxicology and Environmental Mutagenesis 419 (1-3)
(1998) 91–105. doi:10.1016/S1383-5718(98)00127-2.
[25] WHO, Air quality guidelines for Europe, 2nd Edition, World Health Organization, 2000.
URL http://www.euro.who.int/__data/assets/pdf_file/0005/74732/
E71922.pdf?ua=1
[26] C. Dasenbrock, L. Peters, O. Creutzenberg, U. Heinrich, The carcinogenic potency of
carbon particles with and without PAH after repeated intratracheal administration in the
rat, Toxicology Letters 88 (1-3) (1996) 15–21. doi:10.1016/0378-4274(96)03712-5.
[27] B. D. Key, R. D. Howell, C. S. Criddle, Fluorinated Organics in the Biosphere, Environ-
mental Science & Technology 31 (9) (1997) 2445–2454. doi:10.1021/es961007c.
[28] J. P. Giesy, K. Kannan, Peer reviewed: Perfluorochemical surfactants in the environ-
ment, Environmental Science & Technology 36 (7) (2002) 146A–152A. doi:10.1021/
es022253t.
119
[29] J. H. Simons, W. J. Harland, Production of Fluorocarbons: III. From Hydrogen Fluoride-
Soluble Organic Substances, Journal of The Electrochemical Society 95 (2) (1949) 55–
59. doi:10.1149/1.2776735.
[30] J. Simons, Electrochemical process of making fluorine-containing carbon compounds,
US Patent 2,519,983 (1950).
[31] W. Pearlson, The simons electrochemical fluorination process (commercial develop-
ment at 3M), Journal of Fluorine Chemistry 32 (1) (1986) 29–40. doi:10.1016/
S0022-1139(00)80505-9.
[32] L. Conte, G. Gambaretto, Electrochemical fluorination: state of the art and future ten-
dences, Journal of Fluorine Chemistry 125 (2) (2004) 139 – 144. doi:10.1016/j.
jfluchem.2003.07.002.
[33] A. G. Paul, K. C. Jones, A. J. Sweetman, A First Global Production, Emission, And En-
vironmental Inventory For Perfluorooctane Sulfonate, Environmental Science & Tech-
nology 43 (2) (2009) 386–392. doi:10.1021/es802216n.
[34] American Chemical Society, Scifinder database, https://scifinder.cas.org, ac-
cessed: 2015-05-07.
[35] N. Carmosini, L. S. Lee, Partitioning of Fluorotelomer Alcohols to Octanol and Different
Sources of Dissolved Organic Carbon, Environmental Science & Technology 42 (17)
(2008) 6559–6565. doi:10.1021/es800263t.
[36] M. J. A. Dinglasan-Panlilio, S. A. Mabury, Significant Residual Fluorinated Alcohols
Present in Various Fluorinated Materials, Environmental Science & Technology 40 (5)
(2006) 1447–1453. doi:10.1021/es051619+.
[37] M. Villagrasa, M. López de Alda, D. Barceló, Environmental analysis of fluorinated
alkyl substances by liquid chromatography-(tandem) mass spectrometry: a review,
Analytical and Bioanalytical Chemistry 386 (4) (2006) 953–972. doi:10.1007/
s00216-006-0471-9.
[38] E. Sinclair, S. K. Kim, H. B. Akinleye, K. Kannan, Quantitation of Gas-Phase Perfluo-
roalkyl Surfactants and Fluorotelomer Alcohols Released from Nonstick Cookware and
Microwave Popcorn Bags, Environmental Science & Technology 41 (4) (2007) 1180–
1185. doi:10.1021/es062377w.
120
[39] A. A. Jensen, H. Leffers, Emerging endocrine disrupters: perfluoroalkylated sub-
stances, International Journal of Andrology 31 (2) (2008) 161–169. doi:10.1111/j.
1365-2605.2008.00870.x.
[40] K. Prevedouros, I. T. Cousins, R. C. Buck, S. H. Korzeniowski, Sources, Fate and Trans-
port of Perfluorocarboxylates, Environmental Science & Technology 40 (1) (2006) 32–
44. doi:10.1021/es0512475.
[41] S. Taniyasu, K. Kannan, Y. Horii, N. Hanari, N. Yamashita, A Survey of Perfluorooctane
Sulfonate and Related Perfluorinated Organic Compounds in Water, Fish, Birds, and
Humans from Japan, Environmental Science & Technology 37 (12) (2003) 2634–2639.
doi:10.1021/es0303440.
[42] C. P. Higgins, J. A. Field, C. S. Criddle, R. G. Luthy, Quantitative Determination of
Perfluorochemicals in Sediments and Domestic Sludge, Environmental Science & Tech-
nology 39 (11) (2005) 3946–3956. doi:10.1021/es048245p.
[43] M. Smithwick, S. A. Mabury, K. R. Solomon, C. Sonne, J. W. Martin, E. W. Born,
R. Dietz, A. E. Derocher, R. J. Letcher, T. J. Evans, G. W. Gabrielsen, J. Nagy, I. Stirling,
M. K. Taylor, D. C. G. Muir, Circumpolar Study of Perfluoroalkyl Contaminants in Polar
Bears (Ursus maritimus), Environmental Science & Technology 39 (15) (2005) 5517–
5523. doi:10.1021/es048309w.
[44] K. Kannan, J. C. Franson, W. W. Bowerman, K. J. Hansen, P. D. Jones, J. P. Giesy,
Perfluorooctane Sulfonate in Fish-Eating Water Birds Including Bald Eagles and Al-
batrosses, Environmental Science & Technology 35 (15) (2001) 3065–3070. doi:
10.1021/es001935i.
[45] M. Shoeib, T. Harner, P. Vlahos, Perfluorinated chemicals in the arctic atmosphere,
Environmental Science & Technology 40 (24) (2006) 7577–7583. doi:10.1021/
es0618999.
[46] S. Fiedler, Method development and determination of anthropogenic poly- and perfluo-
rinated compounds in air, water, soil, house dust, and several consumer products, Ph.D.
thesis, Technische Universität München (2010).
URL http://nbn-resolving.de/urn/resolver.pl?urn:nbn:de:bvb:
91-diss-20101213-978637-1-3
[47] Z. Xu, Fluorotelomer alcohols, perfluoroalkyl acids and semifluorinated alkanes in the
house dust, air and sediment, Ph.D. thesis, Technische Universität München (2014).
121
URL http://nbn-resolving.de/urn/resolver.pl?urn:nbn:de:bvb:
91-diss-20140214-1182676-0-9
[48] L. W. Y. Yeung, S. J. Robinson, J. Koschorreck, S. A. Mabury, Part I. A Tempo-
ral Study of PFCAs and Their Precursors in Human Plasma from Two German Cities
1982-2009, Environmental Science & Technology 47 (8) (2013) 3865–3874. doi:
10.1021/es303716k.
[49] H. Fromme, O. Midasch, D. Twardella, J. Angerer, S. Boehmer, B. Liebl, Occurrence of
perfluorinated substances in an adult german population in southern bavaria, International
Archives of Occupational and Environmental Health 80 (4) (2007) 313–319. doi:10.
1007/s00420-006-0136-1.
[50] C. A. Moody, G. N. Hebert, S. H. Strauss, J. A. Field, Occurrence and persistence of
perfluorooctanesulfonate and other perfluorinated surfactants in groundwater at a fire-
training area at Wurtsmith Air Force Base, Michigan, USA, Journal of Environmental
Monitoring 5 (2003) 341–345. doi:10.1039/B212497A.
[51] E. Sinclair, K. Kannan, Mass Loading and Fate of Perfluoroalkyl Surfactants in Wastew-
ater Treatment Plants, Environmental Science & Technology 40 (5) (2006) 1408–1414.
doi:10.1021/es051798v.
[52] H. F. Schröder, Determination of fluorinated surfactants and their metabolites in sewage
sludge samples by liquid chromatography with mass spectrometry and tandem mass
spectrometry after pressurised liquid extraction and separation on fluorine-modified
reversed-phase sorbents, Journal of Chromatography A 1020 (1) (2003) 131–151. doi:
10.1016/S0021-9673(03)00936-1.
[53] German Federal Environment Agency, Do without Per- and Polyfluorinated Chemicals
and Prevent their Discharge into the Environment, http://www.umweltbundesamt.
de/publikationen/do-without-per-polyfluorinated-chemicals-prevent,
accessed: 2015-05-04 (2009).
[54] J. Hölzer, O. Midasch, K. Rauchfuss, M. Kraft, R. Reupert, J. Angerer, P. Kleeschulte,
N. Marschall, M. Wilhelm, Biomonitoring of Perfluorinated Compounds in Children
and Adults Exposed to Perfluorooctanoate-Contaminated Drinking Water, Environmen-
tal Health Perspectives 116 (5) (2008) 651–657. doi:10.1289/ehp.11064.
[55] G. L. Kennedy, J. L. Butenhoff, G. W. Olsen, J. C. O’Connor, A. M. Seacat, R. G.
Perkins, L. B. Biegel, S. R. Murphy, D. G. Farrar, The toxicology of perfluorooctanoate,
122
Critical Reviews in Toxicology 34 (4) (2004) 351–384, pMID: 15328768. doi:10.
1080/10408440490464705.
[56] C. Fei, J. K. McLaughlin, L. Lipworth, J. Olsen, Maternal levels of perfluorinated chem-
icals and subfecundity, Human Reproduction 1 (1) (2009) 1–6. doi:10.1093/humrep/
den490.
[57] H.-J. Koch, C. v. Haaren, M. Faulstich, H. Foth, M. Jänicke, P. Michaelis, K. Ott,
Arzneimittel in der Umwelt - Stellungnahme, Tech. rep., SRU - Sachverständigenrat für
Umweltfragen (2007).
[58] K. Nödler, T. Licha, K. Bester, M. Sauter, Development of a multi-residue analytical
method, based on liquid chromatography-tandem mass spectrometry, for the simultane-
ous determination of 46 micro-contaminants in aqueous samples, Journal Of Chromatog-
raphy A 1217 (42) (2010) 6511–6521. doi:10.1016/j.chroma.2010.08.048.
[59] B. J. Vanderford, S. A. Snyder, Analysis of pharmaceuticals in water by isotope dilution
liquid chromatography/tandem mass spectrometry, Environmental Science & Technol-
ogy 40 (23) (2006) 7312–7320. doi:10.1021/es0613198.
[60] A. Müller, W. Schulz, W. K. L. Ruck, W. H. Weber, A new approach to data evaluation
in the non-target screening of organic trace substances in water analysis, Chemosphere
85 (8) (2011) 1211–1219. doi:10.1016/j.chemosphere.2011.07.009.
[61] F. Wode, C. Reilich, P. van Baar, U. Dünnbier, M. Jekel, T. Reemtsma, Multiresidue
analytical method for the simultaneous determination of 72 micropollutants in aque-
ous samples with ultra high performance liquid chromatography-high resolution mass
spectrometry, Journal of Chromatography A 1270 (2012) 118–126. doi:10.1016/j.
chroma.2012.10.054.
[62] Q. Bu, B. Wang, J. Huang, S. Deng, G. Yu, Pharmaceuticals and personal care products in
the aquatic environment in china: A review, Journal of Hazardous Materials 262 (2013)
189–211. doi:10.1016/j.jhazmat.2013.08.040.
[63] J.-L. Liu, M.-H. Wong, Pharmaceuticals and personal care products (PPCPs): A review
on environmental contamination in china, Environment International 59 (2013) 208–224.
doi:10.1016/j.envint.2013.06.012.
[64] German Federal Environment Agency, Arzneimittel in der Umwelt - vermeiden, re-
duzieren, überwachen, http://www.umweltbundesamt.de/sites/default/files/
123
medien/378/publikationen/01.08.2014_hintergrundpapier_arzneimittel_
final_.pdf, accessed: 2015-05-07 (2014).
[65] N. Banspach, Erstmals Zahlen über die Antibiotika-Abgabe in der Tiermedizin erfasst,
http://www.bvl.bund.de/DE/08_PresseInfothek/01_FuerJournalisten/01_
Presse_und_Hintergrundinformationen/05_Tierarzneimittel/2012/2012_
abgabemengenregister/2012_09_11_pi_abgabemengenregister.html?nn=
1461380, accessed: 2015-05-07 (2012).
[66] Austrian Federal Environment Agency, Veterinärantibiotika in Wirtschaftsdünger
und Boden, http://www.umweltbundesamt.at/fileadmin/site/publikationen/
BE272.pdf, accessed: 2015-05-07 (2005).
[67] A. Bergmann, R. Fohrmann, F.-A. Weber, Zusammenstellung von Monitoring-
daten zu Umweltkonzentrationen von Arzneimitteln 2011, http://www.uba.de/
uba-info-medien/4188.html, on behalf of the German Federal Environment Agency,
accessed: 2015-05-07.
[68] German Federal Statistical Office, Entsorgung und Verwertung von Klärschlämmen,
http://www.bmub.bund.de/themen/wasser-abfall-boden/abfallwirtschaft/
statistiken/klaerschlamm/, accessed: 2015-05-08 (2012).
[69] J. L. Oaks, M. Gilbert, M. Z. Virani, R. T. Watson, C. U. Meteyer, B. A. Rideout,
H. L. Shivaprasad, S. Ahmed, M. J. Iqbal Chaudhry, M. Arshad, S. Mahmood, A. Ali,
A. Ahmed Khan, Diclofenac residues as the cause of vulture population decline in Pak-
istan, Nature 427 (6975) (2004) 630–633. doi:10.1038/nature02317.
[70] K. A. Kidd, P. J. Blanchfield, K. H. Mills, V. P. Palace, R. E. Evans, J. M. Lazor-
chak, R. W. Flick, Collapse of a fish population after exposure to a synthetic estro-
gen, Proceedings of the National Academy of Sciences 104 (21) (2007) 8897–8901.
doi:10.1073/pnas.0609568104.
[71] R. Länge, T. H. Hutchinson, C. P. Croudace, F. Siegmund, H. Schweinfurth, P. Hampe,
G. H. Panter, J. P. Sumpter, Effects of the synthetic estrogen 17β -ethinylestradiol on the
life-cycle of the fathead minnow (Pimephales promelas), Environmental Toxicology and
Chemistry 20 (6) (2001) 1216–1227. doi:10.1002/etc.5620200610.
[72] R. Triebskorn, H. Casper, V. Scheil, J. Schwaiger, Ultrastructural effects of pharma-
ceuticals (carbamazepine, clofibric acid, metoprolol, diclofenac) in rainbow trout (On-
124
corhynchus mykiss) and common carp (Cyprinus carpio), Analytical and Bioanalytical
Chemistry 387 (4) (2007) 1405–1416. doi:10.1007/s00216-006-1033-x.
[73] F. Liu, G.-G. Ying, R. Tao, J.-L. Zhao, J.-F. Yang, L.-F. Zhao, Effects of six selected
antibiotics on plant growth and soil microbial and enzymatic activities, Environmental
Pollution 157 (5) (2009) 1636 – 1642. doi:10.1016/j.envpol.2008.12.021.
[74] L. Michelini, R. Reichel, W. Werner, R. Ghisi, S. Thiele-Bruhn, Sulfadiazine Uptake and
Effects on Salix fragilis L. and Zea mays L. Plants, Water, Air, & Soil Pollution 223 (8)
(2012) 5243–5257. doi:10.1007/s11270-012-1275-5.
[75] M. Grote, C. Schwake-Anduschus, H. Stevens, R. Michel, T. Betsche, M. Freitag,
Antibiotika-Aufnahme von Nutzpflanzen aus Gülle-gedüngten Böden - Ergebnisse eines
Modellversuchs, Journal für Verbraucherschutz und Lebensmittelsicherheit 1 (1) (2006)
38–50. doi:10.1007/s00003-006-0008-3.
[76] H. Heuer, Q. Solehati, U. Zimmerling, K. Kleineidam, M. Schloter, T. Müller, A. Focks,
S. Thiele-Bruhn, K. Smalla, Accumulation of Sulfonamide Resistance Genes in Arable
Soils Due to Repeated Application of Manure Containing Sulfadiazine, Applied and En-
vironmental Microbiology 77 (7) (2011) 2527 – 2530. doi:10.1128/AEM.02577-10.
[77] A. Schlüter, H. Heuer, R. Szczepanowski, L. J. Forney, C. M. Thomas, A. Pühler, E. M.
Top, The 64 508 bp IncP-1β antibiotic multiresistance plasmid pB10 isolated from a
waste-water treatment plant provides evidence for recombination between members of
different branches of the IncP-1β group, Microbiology 149 (11) (2003) 3139–3153. doi:
10.1099/mic.0.26570-0.
[78] H. Heuer, R. Szczepanowski, S. Schneiker, A. Pühler, E. M. Top, A. Schlüter, The com-
plete sequences of plasmids pB2 and pB3 provide evidence for a recent ancestor of the
IncP-1β group without any accessory genes, Microbiology 150 (11) (2004) 3591–3599.
doi:10.1099/mic.0.27304-0.
[79] K. G. Byrne-Bailey, W. H. Gaze, P. Kay, A. B. A. Boxall, P. M. Hawkey, E. M. H.
Wellington, Prevalence of Sulfonamide Resistance Genes in Bacterial Isolates from Ma-
nured Agricultural Soils and Pig Slurry in the United Kingdom, Antimicrobial Agents
and Chemotherapy 53 (2) (2009) 696–702. doi:10.1128/AAC.00652-07.
[80] J. Y. M. Tang, F. Busetti, J. W. A. Charrois, B. I. Escher, Which chemicals drive biological
effects in wastewater and recycled water?, Water Research 60 (0) (2014) 289–299. doi:
10.1016/j.watres.2014.04.043.
125
[81] J. Y. M. Tang, S. McCarty, E. Glenn, P. A. Neale, M. S. J. Warne, B. I. Escher, Mixture
effects of organic micropollutants present in water: Towards the development of effect-
based water quality trigger values for baseline toxicity, Water Research 47 (10) (2013)
3300–3314. doi:10.1016/j.watres.2013.03.011.
[82] J. Wang, S. Bernhöft, G. Pfister, K.-W. Schramm, Water exposure assessment of aryl
hydrocarbon receptor agonists in Three Gorges Reservoir, China using SPMD-based vir-
tual organisms, Science of The Total Environment 496 (2014) 26–34. doi:10.1016/j.
scitotenv.2014.07.015.
[83] M. Mehrjouei, S. Müller, D. Möller, A review on photocatalytic ozonation used for the
treatment of water and wastewater, Chemical Engineering Journal 263 (2015) 209–219.
doi:10.1016/j.cej.2014.10.112.
[84] X. Yang, R. C. Flowers, H. S. Weinberg, P. C. Singer, Occurrence and removal of phar-
maceuticals and personal care products (PPCPs) in an advanced wastewater reclamation
plant, Water Research 45 (16) (2011) 5218–5228. doi:10.1016/j.watres.2011.07.
026.
[85] T. Hillenband, F. Tettenborn, E. Menger-Krug, F. Marscheider-Weidemann, S. Fuchs,
S. Toshovski, S. Kitthaus, S. Metzger, I. Tjoeng, P. Wermter, M. Kersting, C. Abegglen,
Maßnahmen zur Verminderung des Eintrages von Mikroschadstoffen in die Gewässer,
German Federal Office for Environment (Umweltbundesamt, UBA), 2014.
URL http://www.umweltbundesamt.de/publikationen/
massnahmen-zur-verminderung-des-eintrages-von
[86] EU, Directive 2000/60/EC of the European Parliament and of the Council establishing a
framework for Community action in the field of water policy, The European Parliament
and the Council of the European Union, 2000.
URL http://eur-lex.europa.eu/legal-content/EN/TXT/PDF/?uri=CELEX:
02000L0060-20140101&rid=2
[87] EU, Directive 2008/105/EC of the European Parliament and of the Council, The
European Parliament and the Council of the European Union, 2008.
URL http://eur-lex.europa.eu/legal-content/EN/TXT/PDF/?uri=CELEX:
32008L0105&rid=2
[88] EU, Directive 2004/27/EC of the European Parliament and of the Council amending
Directive 2001/83/EC on the Community code relating to medicinal products for human
126
use, The European Parliament and the Council of the European Union, 2004.
URL http://eur-lex.europa.eu/legal-content/EN/TXT/PDF/?uri=CELEX:
32004L0027&from=EN
[89] EU, Directive 2013/39/EU of the European Parliament and of the Council, The European
Parliament and the Council of the European Union, 2013.
URL http://eur-lex.europa.eu/legal-content/EN/TXT/PDF/?uri=CELEX:
32013L0039&rid=1
[90] EU, Council Directive 80/778/EEC relating to the quality of water intended for human
consumption, The Council of the European Union, 1980.
URL http://eur-lex.europa.eu/legal-content/EN/TXT/PDF/?uri=CELEX:
31980L0778&from=EN
[91] EU, Council Directive 98/83/EC on the quality of water intended for human consump-
tion, The Council of the European Union, 1998.
URL http://eur-lex.europa.eu/legal-content/EN/TXT/PDF/?uri=CELEX:
01998L0083-20090807&rid=1
[92] WHO, Guidelines for Drinking-water Quality, 4th Edition, World Health Organization,
2011.
URL http://www.who.int/water_sanitation_health/publications/2011/
dwq_guidelines/en/
[93] BMJV, Trinkwasserverordnung - TrinkwV, Federal Ministry of Justice (Bundesminis-
terium der Justitz und Verbraucherschutz, BMJV), 2001.
URL http://www.gesetze-im-internet.de/bundesrecht/trinkwv_2001/
gesamt.pdf
[94] BMJV, Trinkwasserverordnung - TrinkwV, Federal Ministry of Justice (Bundesminis-
terium der Justitz und Verbraucherschutz, BMJV), 1975.
URL http://www.bgbl.de/banzxaver/bgbl/start.xav?startbk=
Bundesanzeiger_BGBl&jumpTo=bgbl175s0453.pdf
[95] V. R. Meyer, Practical High-Performance Liquid Chromatography, Wiley VCH, 2010.
URL http://www.myilibrary.com?ID=255055
[96] L. R. Snyder, Peer Reviewed: HPLC: Past and Present., Anal. Chem. 72 (11) (2000) 412
A–420 A. doi:10.1021/ac002846r.
127
[97] M. Rodriguez-Aller, R. Gurny, J.-L. Veuthey, D. Guillarme, Coupling ultra high-pressure
liquid chromatography with mass spectrometry: Constraints and possible applications,
Journal of Chromatography A 1292 (0) (2013) 2–18. doi:10.1016/j.chroma.2012.
09.061.
[98] J. Nawrocki, The silanol group and its role in liquid chromatography, Journal of Chro-
matography A 779 (1-2) (1997) 29–71. doi:10.1016/S0021-9673(97)00479-2.
[99] A. Vailaya, C. Horvath, Retention in reversed-phase chromatography: partition or
adsorption?, Journal of Chromatography A 829 (1-2) (1998) 1–27. doi:10.1016/
S0021-9673(98)00727-4.
[100] H. Claessens, M. van Straten, Review on the chemical and thermal stability of stationary
phases for reversed-phase liquid chromatography, Journal of Chromatography A 1060 (1-
2) (2004) 23–41. doi:10.1016/j.chroma.2004.08.098.
[101] L. Snyder, A. Maule, A. Heebsh, R. Cuellar, S. Paulson, J. Carrano, L. Wrisley, C. Chan,
N. Pearson, J. Dolan, J. Gilroy, A fast, convenient and rugged procedure for character-
izing the selectivity of alkyl-silica columns, Journal of Chromatography A 1057 (1-2)
(2004) 49–57. doi:10.1016/j.chroma.2004.09.063.
[102] L. R. Snyder, J. W. Dolan, High-Performance Gradient Elution: The Practical Ap-
plication of the Linear-Solvent-Strength Model, Wiley-VCH, 2007. doi:10.1002/
0470055529.
[103] E. Kováts, Gas-chromatographische Charakterisierung organischer Verbindungen. Teil
1: Retentionsindices aliphatischer Halogenide, Alkohole, Aldehyde und Ketone, Hel-
vetica Chimica Acta 41 (7) (1958) 1915–1932. doi:10.1002/hlca.19580410703.
[104] R. M. Smith, C. M. Burr, Retention prediction of analytes in reversed-phase high-
performance liquid chromatography based on molecular structure : II. Long term repro-
ducibility of capacity factors and retention indices, Journal of Chromatography A 475 (2)
(1989) 75–83. doi:10.1016/S0021-9673(01)89664-3.
[105] S. Yamauchi, Retention indices of phenols for internal standards in reversed-phase high-
performance liquid chromatography: Application to retention prediction and selectivities
of mobile phases and packing materials, Journal of Chromatography A 635 (1) (1993)
61–70. doi:10.1016/0021-9673(93)83114-8.
128
[106] M. Marsin Sanagi, U. K. Ahmad, K. Hassan, G. Musa, Alkylbenzenes as a retention-
index scale in reversed-phase high-performance liquid chromatography, Journal of Chro-
matography A 722 (1-2) (1996) 59–68. doi:10.1016/0021-9673(95)00453-X.
[107] BMBF, RiSKWa: Risk Management of Emerging Compounds and Pathogens in the Wa-
ter Cycle (2014).
URL http://www.bmbf.riskwa.de/en/index.php
[108] BMBF, Risk-ident: Assessment of previously unknown anthropogenic trace contami-
nants and action strategies for risk management in aquatic systems. (2014).
URL http://risk-ident.hswt.de/pages/en/home.php?lang=EN
[109] J. H. Gross, Massenspektrometrie - Ein Lehrbuch, Springer Spektrum, 2013. doi:10.
1007/978-3-8274-2981-0.
[110] I. Chernushevich, A. Loboda, B. A. Thomson, An introduction to quadrupole-time-of-
flight mass spectrometry, Journal of Mass Spectrometry 36 (8) (2001) 849–865.
URL 10.1002/jms.207
[111] M. Guilhaus, Special feature: Tutorial. Principles and instrumentation in time-of-flight
mass spectrometry. Physical and instrumental concepts, Journal of Mass Spectrometry
30 (11) (1995) 1519–1532. doi:10.1002/jms.1190301102.
[112] Waters-Micromass, Q-Tof 2 User’s Guide, 2001.
[113] L. Rayleigh, XX. On the equilibrium of liquid conducting masses charged with elec-
tricity, Philosophical Magazine Series 5 14 (87) (1882) 184–186. doi:10.1080/
14786448208628425.
[114] A. Gomez, K. Tang, Charge and fission of droplets in electrostatic sprays, Physics of
Fluids (1994-present) 6 (1) (1994) 404–414. doi:10.1063/1.868037.
[115] D. Duft, T. Achtzehn, R. Muller, B. A. Huber, T. Leisner, Coulomb fission: Rayleigh
jets from levitated microdroplets, Nature 421 (6919) (2003) 128–128. doi:10.1038/
421128a.
[116] P. Kebarle, A brief overview of the present status of the mechanisms involved in elec-
trospray mass spectrometry, Journal of Mass Spectrometry 35 (7) (2000) 804–817.
doi:10.1002/1096-9888(200007)35:7<804::AID-JMS22>3.0.CO;2-Q.
129
[117] M.-C. Hennion, Solid-phase extraction: method development, sorbents, and coupling
with liquid chromatography, Journal of Chromatography A 856 (1-2) (1999) 3–54. doi:
10.1016/S0021-9673(99)00832-8.
[118] SRC, PHYSPROP Database, http://esc.syrres.com/fatepointer/search.asp,
accessed: 2015-05-02.
[119] J. Bicker, A. Fortuna, G. Alves, A. F. ao, Liquid chromatographic methods for the quan-
tification of catecholamines and their metabolites in several biological samples - A re-
view, Analytica Chimica Acta 768 (2013) 12 – 34. doi:10.1016/j.aca.2012.12.030.
[120] J. Lotharius, P. Brundin, Pathogenesis of parkinson’s disease: dopamine, vesicles and
[alpha]-synuclein, Nature Reviews. Neuroscience 3 (12) (2002) 932–942. doi:10.
1038/nrn983.
[121] S. H. Snyder, Catecholamines in schizophrenia, Life Sciences 13 (8) (1973) cxlviii –
cxlix. doi:10.1016/0024-3205(73)90395-0.
[122] J. Nagler, Method development for determination of monoamines in mice brain and in-
vestigation of neurotransmitter networks in wildtype and knockout mice, Master’s thesis,
Technische Univeristät München (2014).
[123] M. A. Raggi, C. Sabbioni, G. Nicoletta, R. Mandrioli, G. Gerra, Analysis of plasma
catecholamines by liquid chromatography with amperometric detection using a novel
SPE ion-exchange procedure, Journal of Separation Science 26 (12-13) (2003) 1141–
1146. doi:10.1002/jssc.200301486.
[124] M. Tsunoda, C. Aoyama, H. Nomura, T. Toyoda, N. Matsuki, T. Funatsu, Simultane-
ous determination of dopamine and 3,4-dihydroxyphenylacetic acid in mouse striatum
using mixed-mode reversed-phase and cation-exchange high-performance liquid chro-
matography, Journal of Pharmaceutical and Biomedical Analysis 51 (3) (2010) 712 –
715. doi:10.1016/j.jpba.2009.09.045.
[125] M. M. Kushnir, F. M. Urry, E. L. Frank, W. L. Roberts, B. Shushan, Analysis of Cate-
cholamines in Urine by Positive-Ion Electrospray Tandem Mass Spectrometry, Clinical
Chemistry 48 (2) (2002) 323–331.
[126] W. H. de Jong, E. G. de Vries, B. H. Wolffenbuttel, I. Kema, Automated mass spectromet-
ric analysis of urinary free catecholamines using on-line solid phase extraction, Journal
130
of Chromatography B 878 (19) (2010) 1506 – 1512. doi:10.1016/j.jchromb.2010.
03.050.
[127] E. C. Y. Chan, P. C. Ho, High-performance liquid chromatography/atmospheric pres-
sure chemical ionization mass spectrometric method for the analysis of catecholamines
and metanephrines in human urine, Rapid Communications in Mass Spectrometry
14 (21) (2000) 1959–1964. doi:10.1002/1097-0231(20001115)14:21<1959::
AID-RCM117>3.0.CO;2-T.
[128] X. He, M. Kozak, Development of a liquid chromatography-tandem mass spectrome-
try method for plasma-free metanephrines with ion-pairing turbulent flow online ex-
traction, Analytical and Bioanalytical Chemistry 402 (9) (2012) 3003–3010. doi:
10.1007/s00216-012-5768-2.
[129] M. Gros, S. Rodríguez-Mozaz, D. Barceló, Fast and comprehensive multi-residue analy-
sis of a broad range of human and veterinary pharmaceuticals and some of their metabo-
lites in surface and treated waters by ultra-high-performance liquid chromatography cou-
pled to quadrupole-linear ion trap tandem mass spectrometry, Journal of Chromatography
A 1248 (0) (2012) 104–121. doi:10.1016/j.chroma.2012.05.084.
[130] C. Wang, H. Shi, C. D. Adams, S. Gamagedara, I. Stayton, T. Timmons, Y. Ma, Investi-
gation of pharmaceuticals in missouri natural and drinking water using high performance
liquid chromatography-tandem mass spectrometry, Water Research 45 (4) (2011) 1818–
1828. doi:10.1016/j.watres.2010.11.043.
[131] N. A. Al-Odaini, M. P. Zakaria, M. I. Yaziz, S. Surif, Multi-residue analytical method for
human pharmaceuticals and synthetic hormones in river water and sewage effluents by
solid-phase extraction and liquid chromatography-tandem mass spectrometry, Journal of
Chromatography A 1217 (44) (2010) 6791–6806. doi:10.1016/j.chroma.2010.08.
033.
[132] B. Kasprzyk-Hordern, R. M. Dinsdale, A. J. Guwy, Multi-residue method for the de-
termination of basic/neutral pharmaceuticals and illicit drugs in surface water by solid-
phase extraction and ultra performance liquid chromatography-positive electrospray ion-
isation tandem mass spectrometry, Journal of Chromatography A 1161 (1-2) (2007) 132–
145. doi:10.1016/j.chroma.2007.05.074.
[133] Y. Yoon, J. Ryu, J. Oh, B.-G. Choi, S. A. Snyder, Occurrence of endocrine disrupting
compounds, pharmaceuticals, and personal care products in the Han River (Seoul, South
131
Korea), Science of The Total Environment 408 (3) (2010) 636–643. doi:10.1016/j.
scitotenv.2009.10.049.
[134] G. Gervais, S. Brosillon, A. Laplanche, C. Helen, Ultra-pressure liquid chromatography-
electrospray tandem mass spectrometry for multiresidue determination of pesticides in
water, Journal of Chromatography A 1202 (2) (2008) 163–172. doi:10.1016/j.
chroma.2008.07.006.
[135] S. Ullah, T. Alsberg, U. Berger, Simultaneous determination of perfluoroalkyl phospho-
nates, carboxylates, and sulfonates in drinking water, Journal Of Chromatography A
1218 (37) (2011) 6388–6395. doi:10.1016/j.chroma.2011.07.005.
[136] N. Theobald, W. Gerwinski, C. Caliebe, M. Haarich, Entwicklung und Vali-
dierung einer Methode zur Bestimmung von polyfluorierten organischen Sub-
stanzen in Meerwasser, Sedimenten und Biota; Untersuchungen zum Vorkom-
men dieser Schadstoffe in der Nord- und Ostsee (Texte 41/2007, Forschungs-
bericht 202 22 213), http://www.umweltbundesamt.de/publikationen/
entwicklung-validierung-einer-methode-zur, German Federal Environment
Agency (2007).
[137] N. Theobald, C. Caliebe, W. Gerwinski, H. Hühnerfuss, P. Lepom, Occurrence of per-
fluorinated organic acids in the North and Baltic seas. Part 1: distribution in sea wa-
ter, Environmental Science and Pollution Research 18 (7) (2011) 1057–1069. doi:
10.1007/s11356-011-0451-2.
[138] P. J. Taylor, Matrix effects: the achilles heel of quantitative high-performance liquid
chromatography-electrospray-tandem mass spectrometry, Clinical Biochemistry 38 (4)
(2005) 328–334. doi:10.1016/j.clinbiochem.2004.11.007.
[139] M. Stüber, T. Reemtsma, Evaluation of three calibration methods to compensate matrix
effects in environmental analysis with lc-esi-ms, Analytical and Bioanalytical Chemistry
378 (4) (2004) 910–916. doi:10.1007/s00216-003-2442-8.
[140] A. Kloepfer, J. B. Quintana, T. Reemtsma, Operational options to reduce matrix effects
in liquid chromatography-electrospray ionisation-mass spectrometry analysis of aqueous
environmental samples, Journal of Chromatography A 1067 (1-2) (2005) 153–160. doi:
10.1016/j.chroma.2004.11.101.
[141] F. Xie, R. D. Smith, Y. Shen, Advanced proteomic liquid chromatography, Journal of
Chromatography A 1261 (2012) 78 – 90, high Speed and High Resolution Separations.
132
In Honour of Professor Milton Lee on the Occasion of his 65th Birthday. doi:10.1016/
j.chroma.2012.06.098.
[142] A. Murad, E. Rech, NanoUPLC-MSE proteomic data assessment of soybean seeds
using the Uniprot database, BMC Biotechnology 12 (1) (2012) 82. doi:10.1186/
1472-6750-12-82.
[143] Y. Shi, R. Xiang, C. Horváth, J. A. Wilkins, The role of liquid chromatography in
proteomics, Journal of Chromatography A 1053 (1-2) (2004) 27 – 36, bioanalytical
Chemistry: Perspectives and Recent Advances with Recognition of Barry L. Karger.
doi:10.1016/j.chroma.2004.07.044.
[144] G. T. Gibson, S. M. Mugo, R. D. Oleschuk, Nanoelectrospray emitters: Trends and
perspective, Mass Spectrom. Rev. 28 (6) (2009) 918–936. doi:10.1002/mas.20248.
[145] M. del Mar Contreras, D. Arráez-Román, A. Fernández-Gutiérrez, A. Segura-Carretero,
Nano-liquid chromatography coupled to time-of-flight mass spectrometry for phenolic
profiling: A case study in cranberry syrups, Talanta 132 (2015) 929 – 938. doi:10.
1016/j.talanta.2014.10.049.
[146] K. Buonasera, G. D’Orazio, S. Fanali, P. Dugo, L. Mondello, Separation of organophos-
phorus pesticides by using nano-liquid chromatography, Journal of Chromatography A
1216 (18) (2009) 3970–3976. doi:10.1016/j.chroma.2009.03.005.
[147] A. Schmidt, M. Karas, T. Dülcks, Effect of different solution flow rates on analyte ion
signals in nano-esi ms, or: when does ESI turn into nano-ESI?, Journal of the American
Society for Mass Spectrometry 14 (5) (2003) 492–500. doi:10.1016/S1044-0305(03)
00128-4.
[148] Waters Corporation, nanoAcquity UPLC System Operator’s Guide, 2006.
[149] Sigma-Aldrich, Product Information Sheet: Amberlite XAD polymeric resin, 1998.
[150] Y. Ye, J. Weiwei, L. Na, M. Mei, W. Donghong, W. Zijian, R. Kaifeng, Assessing of
genotoxicity of 16 centralized source-waters in China by means of the SOS/umu assay
and the micronucleus test: Initial identification of the potential genotoxicants by use of a
GC/MS method and the QSAR Toolbox 3.0, Mutation Research/Genetic Toxicology and
Environmental Mutagenesis 763 (0) (2014) 36–43. doi:10.1016/j.mrgentox.2013.
11.003.