Embed Size (px)
Citation preview
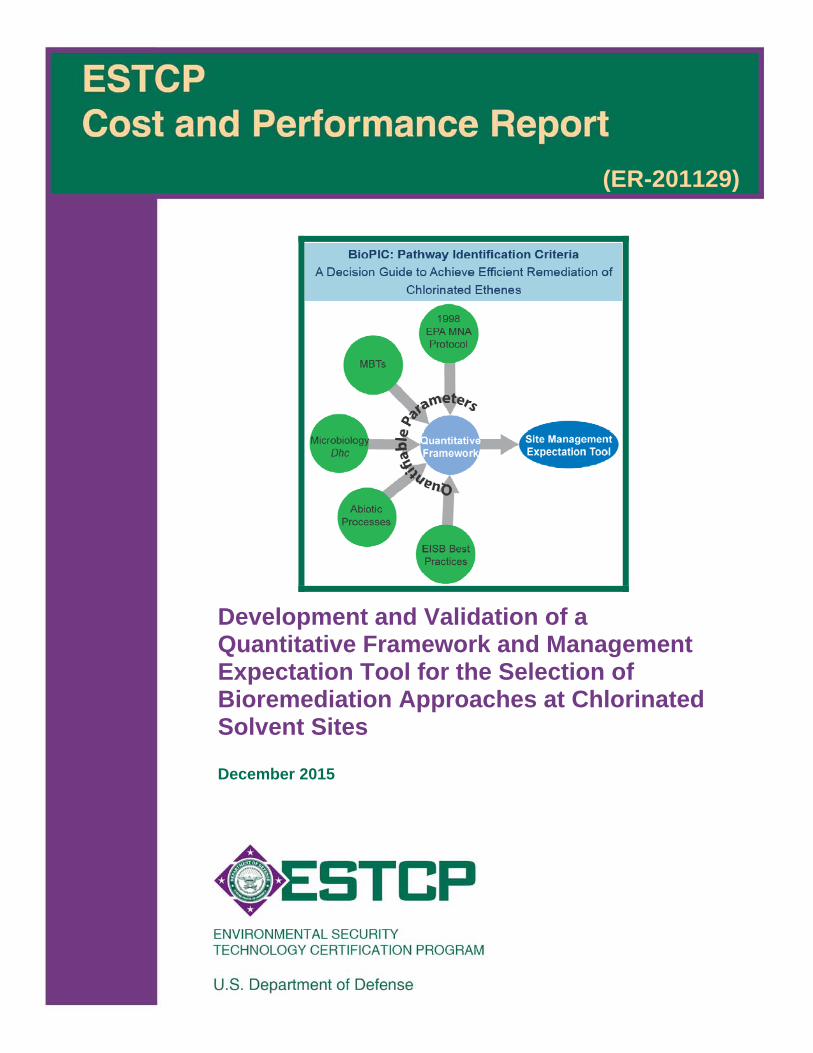
(ER-201129)
Development and Validation of a Quantitative Framework and Management Expectation Tool for the Selection of Bioremediation Approaches at Chlorinated Solvent Sites
December 2015
REPORT DOCUMENTATION PAGE Form Approved
OMB No. 0704-0188 Public reporting burden for this collection of information is estimated to average 1 hour per response, including the time for reviewing instructions, searching existing data sources, gathering and maintaining the data needed, and completing and reviewing this collection of information. Send comments regarding this burden estimate or any other aspect of this collection of information, including suggestions for reducing this burden to Department of Defense, Washington Headquarters Services, Directorate for Information Operations and Reports (0704-0188), 1215 Jefferson Davis Highway, Suite 1204, Arlington, VA 22202-4302. Respondents should be aware that notwithstanding any other provision of law, no person shall be subject to any penalty for failing to comply with a collection of information if it does not display a currently valid OMB control number. PLEASE DO NOT RETURN YOUR FORM TO THE ABOVE ADDRESS.
1. REPORT DATE (DD-MM-YYYY) 07-12-2015
2. REPORT TYPETechnical
3. DATES COVERED (From - To)March 2011 – December 2015
4. TITLE AND SUBTITLE Development and Validation of a Quantitative Framework and Management Expectation Tool for the Selection of Bioremediation Approaches (Monitored Natural Attenuation [MNA], Biostimulation and/or Bioaugmentation) at Chlorinated Solvent Sites
5a. CONTRACT NUMBER W912HQ-09-C-007, W912HQ-13-C-0021
5b. GRANT NUMBER
5c. PROGRAM ELEMENT NUMBER
6. AUTHOR(S) Lebrón, Carmen A., Wiedemeier, Todd H., Wilson, John T., Löffler, Frank E., Hinchee, Robert E., and Singletary, Michael A.
5d. PROJECT NUMBER ER-201129 5e. TASK NUMBER 5f. WORK UNIT NUMBER
7. PERFORMING ORGANIZATION NAME(S) AND ADDRESS(ES) Carmen Lebron 2055 Vista Alcedo, Camarillo, CA 93012
8. PERFORMING ORGANIZATION REPORT NUMBER
9. SPONSORING / MONITORING AGENCY NAME(S) AND ADDRESS(ES) 10. SPONSOR/MONITOR’S ACRONYM(S)SERDP/ESTCP Mark Center Drive, 4800 Mark Center Drive, Suite 17D08 Alexandria, VA 22350
ESTCP 11. SPONSOR/MONITOR’S REPORT
NUMBER(S) ER-201129
12. DISTRIBUTION / AVAILABILITY STATEMENT Approved for public release; distribution is unlimited
13. SUPPLEMENTARY NOTES
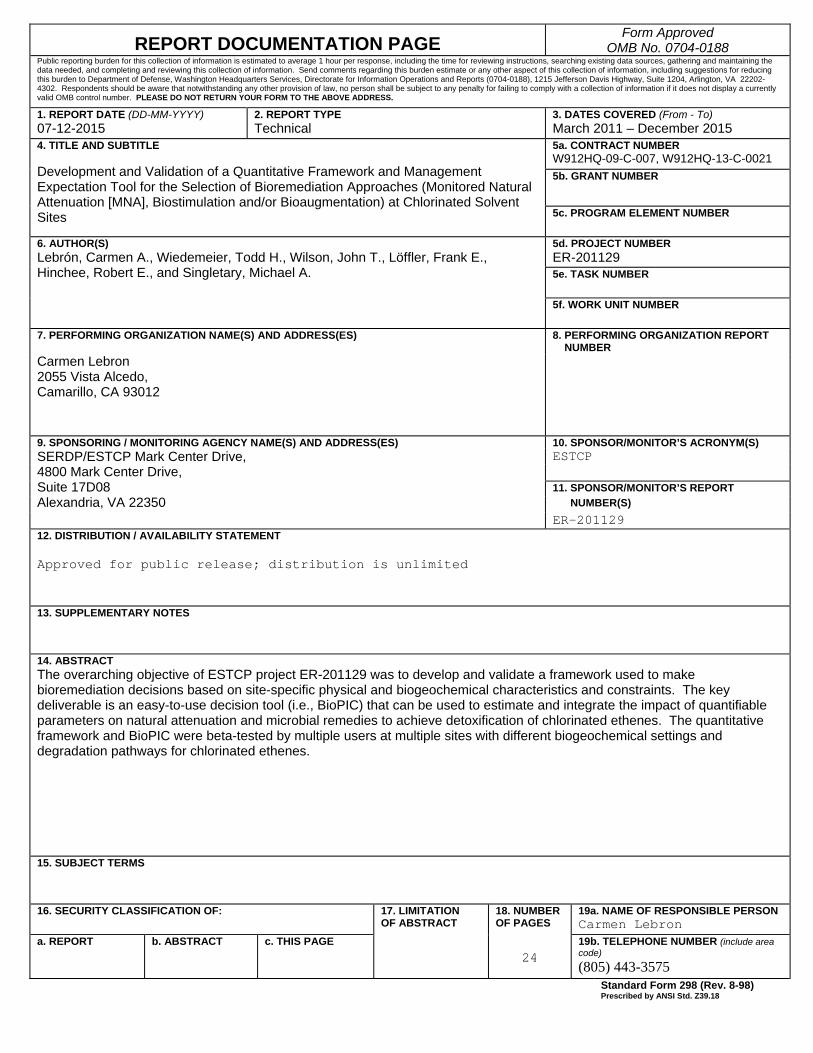
14. ABSTRACT The overarching objective of ESTCP project ER-201129 was to develop and validate a framework used to make bioremediation decisions based on site-specific physical and biogeochemical characteristics and constraints. The key deliverable is an easy-to-use decision tool (i.e., BioPIC) that can be used to estimate and integrate the impact of quantifiable parameters on natural attenuation and microbial remedies to achieve detoxification of chlorinated ethenes. The quantitative framework and BioPIC were beta-tested by multiple users at multiple sites with different biogeochemical settings and degradation pathways for chlorinated ethenes.
15. SUBJECT TERMS
16. SECURITY CLASSIFICATION OF:
17. LIMITATION OF ABSTRACT
18. NUMBER OF PAGES
19a. NAME OF RESPONSIBLE PERSONCarmen Lebron
a. REPORT
b. ABSTRACT
c. THIS PAGE
24
19b. TELEPHONE NUMBER (include area code) (805) 443-3575
Standard Form 298 (Rev. 8-98)Prescribed by ANSI Std. Z39.18
i
COST & PERFORMANCE REPORT Project: ER-201129
TABLE OF CONTENTS
Page
EXECUTIVE SUMMARY ...................................................................................................... ES-1
1.0 INTRODUCTION .............................................................................................................. 1 1.1 BACKGROUND .................................................................................................... 1 1.2 OBJECTIVE OF THE DEMONSTRATION ......................................................... 2 1.3 REGULATORY DRIVERS ................................................................................... 2
2.0 TECHNOLOGY ................................................................................................................. 3 2.1 TECHNOLOGY DESCRIPTION .......................................................................... 3 2.2 ADVANTAGES AND LIMITATIONS OF THE TECHNOLOGY ...................... 4
3.0 PERFORMANCE OBJECTIVES ...................................................................................... 7
4.0 SITE DESCRIPTION ......................................................................................................... 9
5.0 TEST DESIGN ................................................................................................................. 11 5.1 CONCEPTUAL EXPERIMENTAL DESIGN ..................................................... 11
5.1.1 Task 1 - Develop a List of Biogeochemical Screening Parameters that Likely Have a Significant Influence on Degradation Rate ................ 12
5.1.2 Task 2 – Determine the Quantitative Relationship Between the Biogeochemical Parameters Selected as Screening Parameters and Degradation Rates ..................................................................................... 13
5.1.3 Task 3 - Develop a Decision Framework ................................................. 15 5.1.4 Task 4 - Develop a User-Friendly Site Management Expectation
Tool to Facilitate User Application of the Decision Framework .............. 15 5.1.5 Task 5 - Validate Cost and Performance Data .......................................... 15
5.2 DESIGN AND LAYOUT OF TECHNOLOGY COMPONENTS ...................... 15 5.2.1 Estimating Degradation Rates Using BIOCHLOR ................................... 16 5.2.2 Using the Decision Tool ........................................................................... 16
6.0 PERFORMANCE ASSESSMENT .................................................................................. 21 6.1 QUALITATIVE PERFORMANCE OBJECTIVES............................................. 21
6.1.1 Easy to Use, Easy to Follow and Easy to Interpret ................................... 21 6.1.2 Focused Site Characterization and Sampling Regimes ............................ 21
6.2 QUANTITATIVE PERFORMANCE OBJECTIVES .......................................... 22 6.2.1 Quantify the Impact of Selected Parameters on Degradation Rates ......... 22 6.2.2 Correlate Dhc Biomarker Gene Measurements to Ethene
Formation and Detoxification ................................................................... 22
7.0 COST ASSESSMENT ...................................................................................................... 25 7.1 COST MODEL ..................................................................................................... 25 7.2 COST DRIVERS .................................................................................................. 26
7.2.1 Analytical Parameters in Addition to Those Specified in EPA (1998) ........................................................................................................ 26
TABLE OF CONTENTS (continued)
Page
ii
7.2.1.1 Dhc Density and VC reductase genes bvcA and vcrA ................ 26 7.2.1.2 CSIA .......................................................................................... 26 7.2.1.3 Magnetic Susceptibility ............................................................. 27
7.2.2 Application of the Decision Framework ................................................... 27
8.0 IMPLEMENTATION ISSUES ........................................................................................ 29
9.0 REFERENCES ................................................................................................................. 31 APPENDIX A POINTS OF CONTACT......................................................................... A-1

iii
LIST OF FIGURES
Page Figure 1 Decision Tool Framework. ................................................................................... 19

iv
LIST OF TABLES
Page Table 1A Qualitative Performance Objectives ....................................................................... 7 Table 1B Quantitative Performance Objectives ..................................................................... 8 Table 2. Cost model. ........................................................................................................... 28
ACRONYMS AND ABBREVIATIONS AFCECAir Force Civil Engineer Center cDCE cis-1,2-dichloroethene CH4 methane CSIA compound-specific isotope analysis Dhc Dehalococcoides DoD Department of Defense EISB Enhanced in situ Bioremediation EPA U.S. Environmental Protection Agency ESTCP Environmental Security Technology Certification Program Fe(II) ferrous iron FeS ferrous sulfide H2S/H5 Hydrogen sulfide/Hydrosulfide ion µg/L micrograms per liter MBT molecular biological tool MCL maximum contaminant level Mn (II) Manganese MNA monitored natural attenuation NAVFAC EXWC Naval Facilities Engineering And Expeditionary Center O&M operation and maintenance PCE tetrachloroethene qPCR quantitative real-time polymerase chain reaction RDase reductive dehalogenase RPM remedial project manager TCA trichloroethane TCE trichloroethene TOC total organic carbon tDCE trans-1,2-dichloroethene VC vinyl chloride VOC volatile organic compound
This page left blank intentionally.
Technical material contained in this report has been approved for public release. Mention of trade names or commercial products in this report is for informational purposes only;
no endorsement or recommendation is implied.
vi
ACKNOWLEDGEMENTS We gratefully acknowledge the financial and technical support provided by the Environmental Security Technology Certification Program (ESTCP), including the guidance provided by Dr. Andrea Leeson (Environmental Restoration Program Manager). We would also like to thank all individuals and organizations that provided extensive guidance and support for this project.

This page left blank intentionally.
ES-1
EXECUTIVE SUMMARY
OBJECTIVES
The overarching objective of this project was to develop and validate a framework that can be used to make bioremediation decisions based on site-specific physical and biogeochemical characteristics and constraints. This framework represents an update to the U.S. Environmental Protection Agency’s (EPA) Technical Protocol for Evaluating the Natural Attenuation of Chlorinated Solvents in Ground Water.
TECHNOLOGY DESCRIPTION
The quantitative framework developed under this program is a systematic approach that uses the relationships between specific biogeochemical parameters and degradation rates to deduce major degradation pathways and determine the best bioremediation approach at sites impacted with chlorinated ethenes. The major goal of this demonstration was to quantify the relationship(s) between selected, measurable biogeochemical screening parameters and both biotic and abiotic degradation rates. Evaluating these relationships allowed the development of the quantitative framework. In turn, the quantitative framework enabled the development of BioPIC, a software tool that guides users (e.g., remedial project managers [RPMs]) through a hierarchical set of questions to ultimately identify the optimal pathway for remediating chlorinated ethenes at a particular site. BioPIC is an easy-to-use decision tool that informs RPMs about relevant biogeochemical parameters and their impacts on degradation pathways and rates at a given site. A number of measurable parameters, such as the concentrations of volatile organic compounds (VOC); alternate electron acceptors (e.g., oxygen, sulfate); reduced products (e.g., ferrous iron {Fe[II]}, methane [CH4]); Dehalococcoides (Dhc) 16S rRNA gene and reductive dehalogenase (RDase) gene abundances; and magnetic susceptibility affect the detoxification of chlorinated ethenes. The relationships between each parameter and the degradation rates were determined and used to develop the decision matrix and BioPIC.
DEMONSTRATION RESULTS
The quantitative framework was developed by compiling available data from multiple sites with different biogeochemical backgrounds across the U.S. For those sites where sufficient hydrogeologic, geochemical, and microbial data were available, degradation rates for different chlorinated ethenes were calculated using BIOCHLOR. The calculated degradation rates for the chlorinated ethenes tetrachloroethene (PCE), trichloroethene (TCE), cis-1,2-Dichloroethene (cDCE), and vinyl chloride (VC) were plotted against multiple measurable parameters, as discussed in the Final Technical Report. This analysis revealed that the following parameters correlated well with the degradation rates of TCE, cDCE, and VC:
Dhc abundance for TCE, cDCE, and VC; Mass magnetic susceptibility as a surrogate to magnetite abundance;
ES-2
Ferrous sulfide (FeS); CH4; and Fe(II).
Correlations between the following parameters were also identified:
VcrA + bvcA gene copies per liter and Dhc copies per liter for cDCE and VC.
A ratio of Dhc to total bacterial 16S rRNA genes exceeding 0.0005 correlates with ethene formation
A ratio of vcrA + bvcA genes to total bacterial 16S rRNA genes exceeding 0.0005 correlates with ethene formation
A ratio of Dhc to vcrA+bvcA near unity correlates with ethene formation These ratios are useful normalized parameters for predicting detoxification.Validated quantitative real-time polymerase chain reaction (qPCR) assays to obtain this information are commercially available. No correlations were observed between dissolved oxygen concentrations and reductive dechlorination rates, proving that dissolved oxygen data are problematic and unreliable for determining anoxia and the potential for anaerobic degradation activity. Although dissolved oxygen is known to be inhibitory to strict anaerobes, such as those that perform reductive dechlorination, difficulties in sample collection and analysis negate the use of this parameter alone to deduce anoxic conditions and therefore conclude that anaerobic microbial reductive dechlorination is a major pathway. The measurement of Fe(II) and CH4 concentrations are more reliable parameters to determine the availability, or perhaps more importantly, the lack of dissolved oxygen to predict oxidative versus reductive degradation processes. In summary, this project identified a short list of parameters that are measurable, quantifiable, and useful for deducing degradation pathways. Further, these parameters can be used to estimate site-specific degradation rates, and thereby help users decide what treatment options will best meet the remedial action objectives.
IMPLEMENTATION ISSUES
The decision framework and the management expectation tool (BioPIC) is based on the current scientific understanding of the processes contributing to the detoxification of chlorinated ethenes. Although process understanding has significantly improved over the past decade, knowledge gaps remain. In some cases, the investigator may not want to expend the resources to fully implement the decision framework. For example, when the investigator has worked through the decision framework and will not be able to proceed without magnetic susceptibility data, the RPM may not want to expend the resources to collect soil core data, thus negating further use of the tool to deduce degradation pathways. Development of downhole technologies for obtaining magnetic susceptibility data, such as through use of a downhole sonde, would circumvent this potential

ES-3
problem with implementation of the decision framework, including BioPIC. Additionally, the decision framework does not consider the potential for aerobic degradation of TCE. One additional implementation issue is that the decision framework only considers chlorinated ethenes. Separate decision frameworks for the chlorinated ethanes and chlorinated methanes could be developed to round out the toolkit to provide similar decision frameworks.

This page left blank intentionally.
1
1.0 INTRODUCTION
1.1 BACKGROUND
Monitored natural attenuation (MNA) and enhanced bioremediation have gained popularity as remedial approaches at sites contaminated with chlorinated solvents. A number of studies have demonstrated that remedial goals can be met with significantly reduced capital investment and operation and maintenance (O&M) costs using these technologies. Until now (2015), no guidance documents were available to assist remedial project managers (RPM) in selecting the most cost-efficient, least invasive, and most effective bioremediation approach using readily available data. The overarching goal of the Environmental Security Technology Certification Program (ESTCP) Project ER-201129 was to develop a quantitative framework for selecting MNA or enhanced bioremediation approaches (biostimulation alone or combined with bioaugmentation) at sites contaminated with chlorinated ethenes. The quantitative framework provides the logic reasoning behind the BioPIC tool, which was developed to facilitate the application of the quantitative framework. BioPIC incorporates the framework in the form of an easy-to-use Excel-based interface. As such, the quantitative framework presents a decision logic that allows the user to deduce the most promising remediation approach as well as the predominant degradation mechanism(s) at a site. In 1998, Mr. Todd Wiedemeier (Wiedemeier and Associates, Inc.) and Dr. John Wilson (U.S. Environmental Protection Agency [EPA]) developed a scoring system to assess the likelihood of in situ reductive dechlorination and bioattenuation at a site (EPA, 1998). The initial biotransformation of the most commonly encountered chlorinated solvent groundwater contaminants (e.g., tetrachloroethene [PCE], trichloroethene [TCE], chloroform, and 1,1,1-trichloroethane [TCA]) in the U.S. generally involves a reductive dechlorination reaction (i.e., hydrogenolysis or dichloroelimination). The assessment framework developed by Wiedemeier and Wilson (EPA, 1998) was designed to recognize those geochemical conditions where reductive dechlorination is feasible. The essence of the ranking system relies on the fact that biodegradation causes measurable changes in groundwater geochemistry, and that the microbiology necessary to facilitate reductive dechlorination, whether by direct microbe-contaminant interactions or indirectly through microbially-mediated abiotic reactions, can only operate under certain environmental conditions. Specifically, reductive dechlorination reactions generally occur under anoxic, low redox conditions, which typically prevail in aquifers with sufficient bioavailable organic carbon. The 1998 EPA protocol did not consider microbial parameters because the knowledge of relevant microbes was limited at the time and appropriate molecular biological tools (MBT) were not available. Dedicated efforts over the past decade revealed keystone dechlorinators, such as Dehalococcoides (Dhc) strains, and technological advances generated tools to quantitatively assess genes of interest in environmental samples including groundwater. Organism- and process-specific biomarker genes for monitoring reductive dechlorination have been identified, and quantitative real-time polymerase chain reaction (qPCR) tools that enumerate Dhc 16S rRNA genes and reductive dehalogenase (RDase) genes involved in chlorinated ethene dechlorination provide information about specific dechlorination steps. For example, the vinyl chloride (VC) RDase genes bvcA and vcrA serve as biomarkers for ethene formation and detoxification. In addition, the importance of abiotic degradation reactions, particularly those
2
associated with iron-rich minerals such as magnetite, is now known, and approaches to quantify the contributions of iron-bearing minerals to contaminant detoxification are becoming commercially available. For example, magnetic susceptibility data allow the investigator to estimate the relative importance of abiotic degradation via magnetite. The information gained from the identification of new degradation pathways and these new assessment tools represents a major advance, and allows the quantitative framework presented herein to be a significant improvement over the 1998 EPA protocol.
1.2 OBJECTIVE OF THE DEMONSTRATION
The overarching objective of ESTCP project ER-201129 was to develop and validate a framework that could be used to make bioremediation decisions based on site-specific physical and biogeochemical characteristics and constraints. The key deliverable is an easy-to-use decision tool (i.e., BioPIC) that can be used to estimate and integrate the impact of quantifiable parameters on natural attenuation and bioremediation to remediate chlorinated ethenes in groundwater. The quantitative framework and BioPIC were beta-tested by multiple users at multiple sites with different biogeochemical settings and degradation pathways for chlorinated ethenes.
1.3 REGULATORY DRIVERS
As of January 2013, the maximum contaminant levels (MCL) for the chlorinated ethenes: PCE, TCE, cis-1,2-dichloroethene (cDCE), and VC are 5 micrograms per liter (µg/L), 5 µg/L, 70 µg/L, and 2 µg/L, respectively (http://water.epa.gov/drink/contaminants/index.cfm). At many sites, a risk-based assessment dictates cleanup goals, what often means that MCLs are not the regulatory driver. In any event, some type of remedial action is required at many Department of Defense (DoD) sites. The intent of BioPIC is to allow DoD RPMs to choose the most efficacious remediation approach to meet remedial objectives.
3
2.0 TECHNOLOGY
2.1 TECHNOLOGY DESCRIPTION
The quantitative framework represents a systematic approach that utilizes the relationships between specific biogeochemical parameters and degradation rates to deduce major degradation pathways and determine the best bioremediation approach at sites impacted with chlorinated ethenes. A major goal of this demonstration was to quantify the relationship(s) between selected, measurable biogeochemical screening parameters and degradation rates. The quantitative assessment of these relationships allowed the development of the quantitative framework. In turn, the quantitative framework enabled the development of BioPIC, a software tool that guides users (e.g., RPMs) through a hierarchical set of questions to ultimately identify the most efficacious pathway for achieving detoxification of chlorinated ethenes. BioPIC is an easy-to-use decision tool that informs RPMs about relevant biogeochemical parameters and their relative importance to affect degradation, either microbial or abiotic, at a given site. The quantitative framework is based, in part, on the parameters that were used to develop the scoring system introduced by Dr. John Wilson and Mr. Todd Wiedemeier to assess the likelihood of in situ reductive dechlorination and bioattenuation (EPA, 1998; Wiedemeier et al., 1999). The 1998 scoring system was based on the relative importance of measurable geochemical parameters that affect the efficacy of biological reductive dechlorination. The framework developed under the current project is an extension of the 1998 EPA protocol. Measurable geochemical, microbial, and geologic parameters are included in the quantitative framework and the relationship between each relevant parameter and the associated degradation rates have been quantified. This approach differs from the 1998 EPA protocol in that the range in a parameter’s value is tied to degradation rates instead of being just a qualitative indicator of biodegradation. A number of measurable parameters such as the concentration of volatile organic compounds (VOC), electron acceptors (e.g., oxygen, sulfate), reduced products (e.g., Fe[II], methane [CH4]), Dhc 16S rRNA gene and RDase gene abundances, and magnetic susceptibility, affect the detoxification of chlorinated ethenes. The relationship between each parameter and degradation rate was determined and used to develop the decision matrix and BioPIC. Since publication of the 1998 EPA protocol, several new technologies for enhancing detoxification of chlorinated ethenes have emerged, most notably biostimulation and bioaugmentation. The principles and practices described in the 1998 EPA protocol and those outlined in published guidelines for biostimulation to enhance anaerobic reductive dechlorination (e.g., Air Force Civil Engineer Center [AFCEC] AND Naval Facilities Engineering Expeditionary Warfare Center [NAVFAC EXWC], and ESTCP, 2004) form the basis for developing the quantitative framework approach. Importantly, the new quantitative framework considers key elements that catalyze degradation reactions including direct measurement of the presence of keystone dechlorinating bacteria (e.g., Dhc) and iron-bearing minerals (e.g., magnetite). Many of these principles and practices were developed under DoD-, ESTCP-, and SERDP-sponsorship and have been applied at chlorinated solvent-impacted sites across the U.S. and several other countries. Specifically, these efforts have demonstrated that adding electron donor stimulates biodegradation at sites where the requisite reductively dechlorinating microbial populations are present. For those sites apparently deficient of the requisite microbiology (e.g.,
4
absence of Dhc and VC RDase genes), bioaugmentation approaches (i.e., the addition of dechlorinating consortia containing Dhc), which are generally applied in combination with biostimulation, have been successfully implemented. Due to the low cost of inocula, bioaugmentation has been applied at many sites without evaluating if the native microflora has the capacity for detoxifying chlorinated ethenes. In these cases, it is not known if the inocula had any impact on bioremediation, or if enhanced contaminant degradation was caused by native dechlorinating bacteria. In addition, the understanding of abiotic reactions that contribute to chlorinated solvent degradation has been advanced, and it is now known that these reactions contribute to chlorinated solvent degradation. For example, sulfate- and ferric iron-reducing microbes produce sulfide and ferrous iron, respectively, and the reduced products can form iron sulfides including ferrous sulfide (FeS) and FeS2, which can contribute to contaminant degradation. In addition, iron minerals such as magnetite (Fe3O4) and other Fe(II)/Fe(III) mixed minerals (e.g., green rusts) can facilitate abiotic degradation of chlorinated solvents. The microbially mediated formation of reactive mineral surfaces occurs in many subsurface environments, and the quantitative framework includes the contributions of abiotic processes to contaminant detoxification. The quantitative framework was developed by compiling data from multiple sites with different biogeochemical backgrounds across the U.S. For those sites where sufficient hydrogeologic, geochemical, and microbial data were available, degradation rates for different chlorinated ethenes were calculated using BIOCHLOR. The calculated degradation rates for PCE, TCE, cDCE, and VC were plotted against different measurable parameters.
2.2 ADVANTAGES AND LIMITATIONS OF THE TECHNOLOGY
The main advantages of the quantitative framework include: The quantitative framework uses the current state-of-the-art understanding of the science and the engineering technologies to provide a systematic approach to enable the best possible site management decisions. Such an approach represents a major advance over the current practice that uses empirical information and does not incorporate quantitative, site-specific information, including microbial parameters. Proper application of the BioPIC screening tool described herein promises to significantly minimize the risk of technology failures, avoid the implementation of non-productive remedies, lessen the potential detrimental environmental impacts of bioremediation treatment options, and reduce both capital and O&M costs to the DoD. The main disadvantages of the quantitative framework include: BioPIC is based on the current scientific understanding of the processes contributing to the detoxification of chlorinated ethenes. Although process understanding has significantly improved over the past decade, knowledge gaps remain. The quantitative framework only includes parameters that are known to affect detoxification of chlorinated ethenes; however, additional parameters may come to light in the future. For obvious reasons, balance had to be struck between the ease of use, generality of application, and the level of detail BioPIC provides. To minimize uncertainty associated with the framework, only those screening parameters were included for which a quantitative relationship with degradation rates has been established.

5
The BioPIC tool allows RPMs to identify the most suitable site remedy option based on state-of-the-art science and resulting engineering applications. Thus, science-based decision-making can be implemented at many more DoD sites. BioPIC only provides recommendations. Site management decisions are ultimately made by RPMs and site owners.

This page left blank intentionally.
7
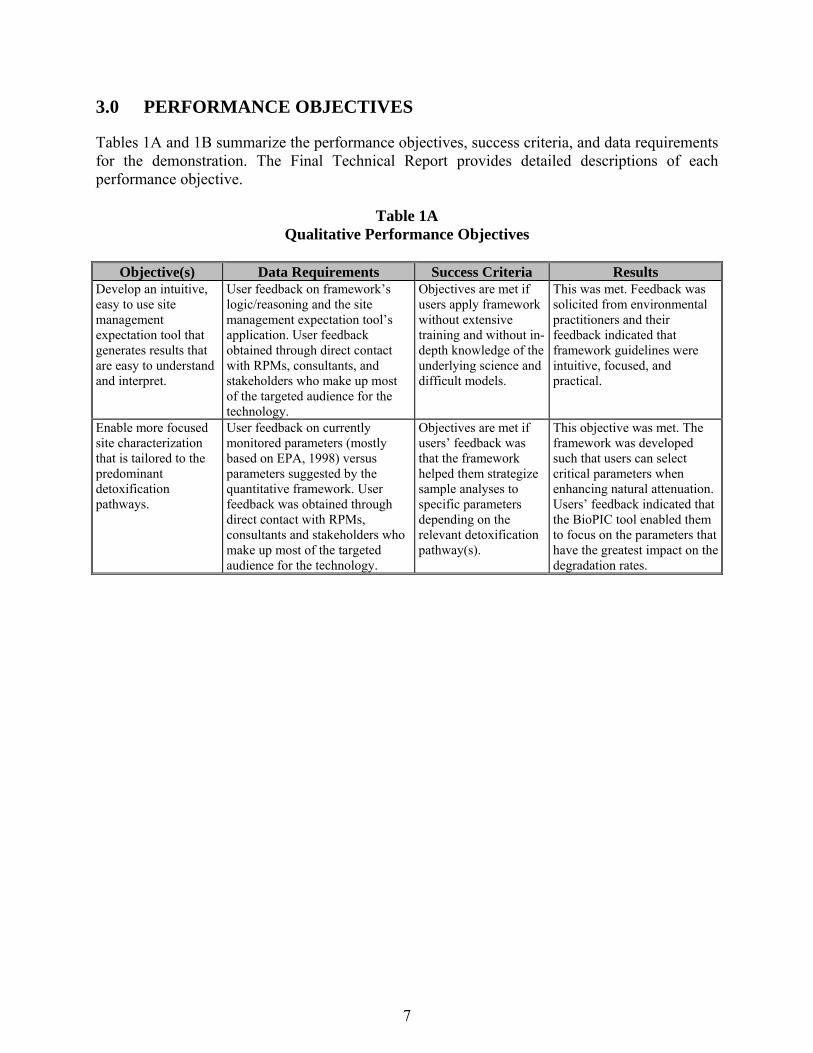
3.0 PERFORMANCE OBJECTIVES
Tables 1A and 1B summarize the performance objectives, success criteria, and data requirements for the demonstration. The Final Technical Report provides detailed descriptions of each performance objective.
Table 1A Qualitative Performance Objectives
Objective(s) Data Requirements Success Criteria Results
Develop an intuitive, easy to use site management expectation tool that generates results that are easy to understand and interpret.
User feedback on framework’s logic/reasoning and the site management expectation tool’s application. User feedback obtained through direct contact with RPMs, consultants, and stakeholders who make up most of the targeted audience for the technology.
Objectives are met if users apply framework without extensive training and without in-depth knowledge of the underlying science and difficult models.
This was met. Feedback was solicited from environmental practitioners and their feedback indicated that framework guidelines were intuitive, focused, and practical.
Enable more focused site characterization that is tailored to the predominant detoxification pathways.
User feedback on currently monitored parameters (mostly based on EPA, 1998) versus parameters suggested by the quantitative framework. User feedback was obtained through direct contact with RPMs, consultants and stakeholders who make up most of the targeted audience for the technology.
Objectives are met if users’ feedback was that the framework helped them strategize sample analyses to specific parameters depending on the relevant detoxification pathway(s).
This objective was met. The framework was developed such that users can select critical parameters when enhancing natural attenuation. Users’ feedback indicated that the BioPIC tool enabled them to focus on the parameters that have the greatest impact on the degradation rates.
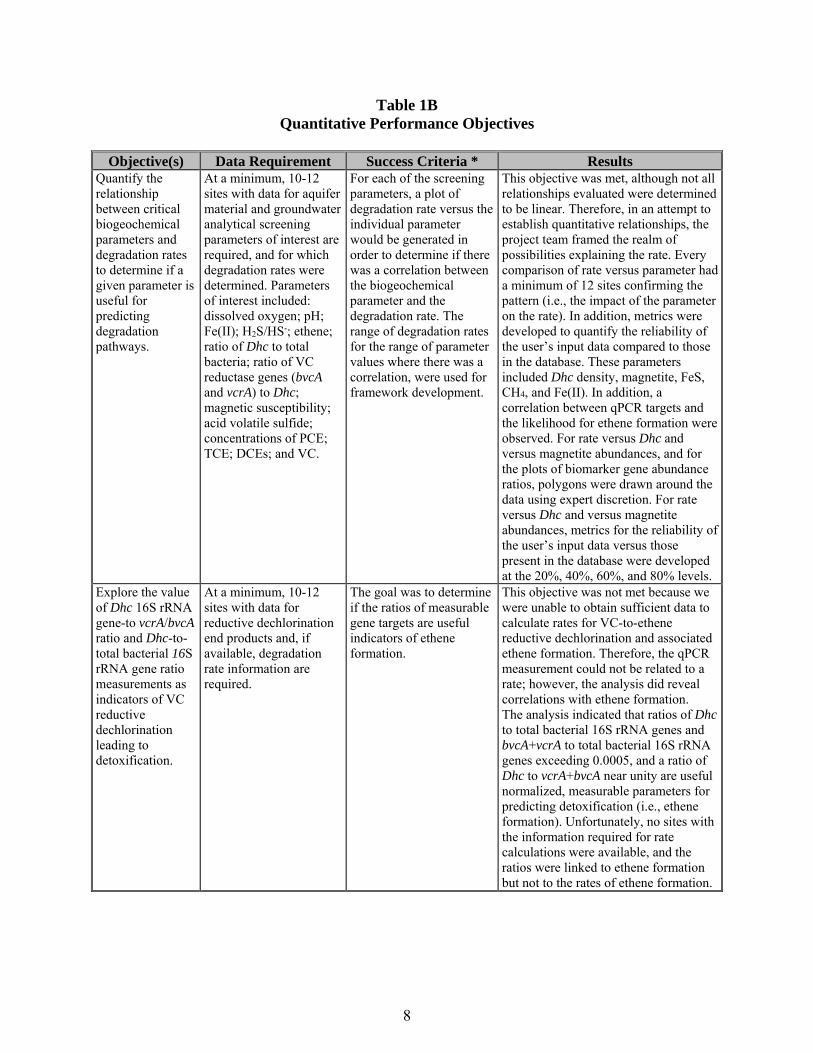
8
Table 1B Quantitative Performance Objectives
Objective(s) Data Requirement Success Criteria * Results
Quantify the relationship between critical biogeochemical parameters and degradation rates to determine if a given parameter is useful for predicting degradation pathways.
At a minimum, 10-12 sites with data for aquifer material and groundwater analytical screening parameters of interest are required, and for which degradation rates were determined. Parameters of interest included: dissolved oxygen; pH; Fe(II); H2S/HS-; ethene; ratio of Dhc to total bacteria; ratio of VC reductase genes (bvcA and vcrA) to Dhc; magnetic susceptibility; acid volatile sulfide; concentrations of PCE; TCE; DCEs; and VC.
For each of the screening parameters, a plot of degradation rate versus the individual parameter would be generated in order to determine if there was a correlation between the biogeochemical parameter and the degradation rate. The range of degradation rates for the range of parameter values where there was a correlation, were used for framework development.
This objective was met, although not all relationships evaluated were determined to be linear. Therefore, in an attempt to establish quantitative relationships, the project team framed the realm of possibilities explaining the rate. Every comparison of rate versus parameter had a minimum of 12 sites confirming the pattern (i.e., the impact of the parameter on the rate). In addition, metrics were developed to quantify the reliability of the user’s input data compared to those in the database. These parameters included Dhc density, magnetite, FeS, CH4, and Fe(II). In addition, a correlation between qPCR targets and the likelihood for ethene formation were observed. For rate versus Dhc and versus magnetite abundances, and for the plots of biomarker gene abundance ratios, polygons were drawn around the data using expert discretion. For rate versus Dhc and versus magnetite abundances, metrics for the reliability of the user’s input data versus those present in the database were developed at the 20%, 40%, 60%, and 80% levels.
Explore the value of Dhc 16S rRNA gene-to vcrA/bvcA ratio and Dhc-to-total bacterial 16S rRNA gene ratio measurements as indicators of VC reductive dechlorination leading to detoxification.
At a minimum, 10-12 sites with data for reductive dechlorination end products and, if available, degradation rate information are required.
The goal was to determine if the ratios of measurable gene targets are useful indicators of ethene formation.
This objective was not met because we were unable to obtain sufficient data to calculate rates for VC-to-ethene reductive dechlorination and associated ethene formation. Therefore, the qPCR measurement could not be related to a rate; however, the analysis did reveal correlations with ethene formation. The analysis indicated that ratios of Dhc to total bacterial 16S rRNA genes and bvcA+vcrA to total bacterial 16S rRNA genes exceeding 0.0005, and a ratio of Dhc to vcrA+bvcA near unity are useful normalized, measurable parameters for predicting detoxification (i.e., ethene formation). Unfortunately, no sites with the information required for rate calculations were available, and the ratios were linked to ethene formation but not to the rates of ethene formation.
9
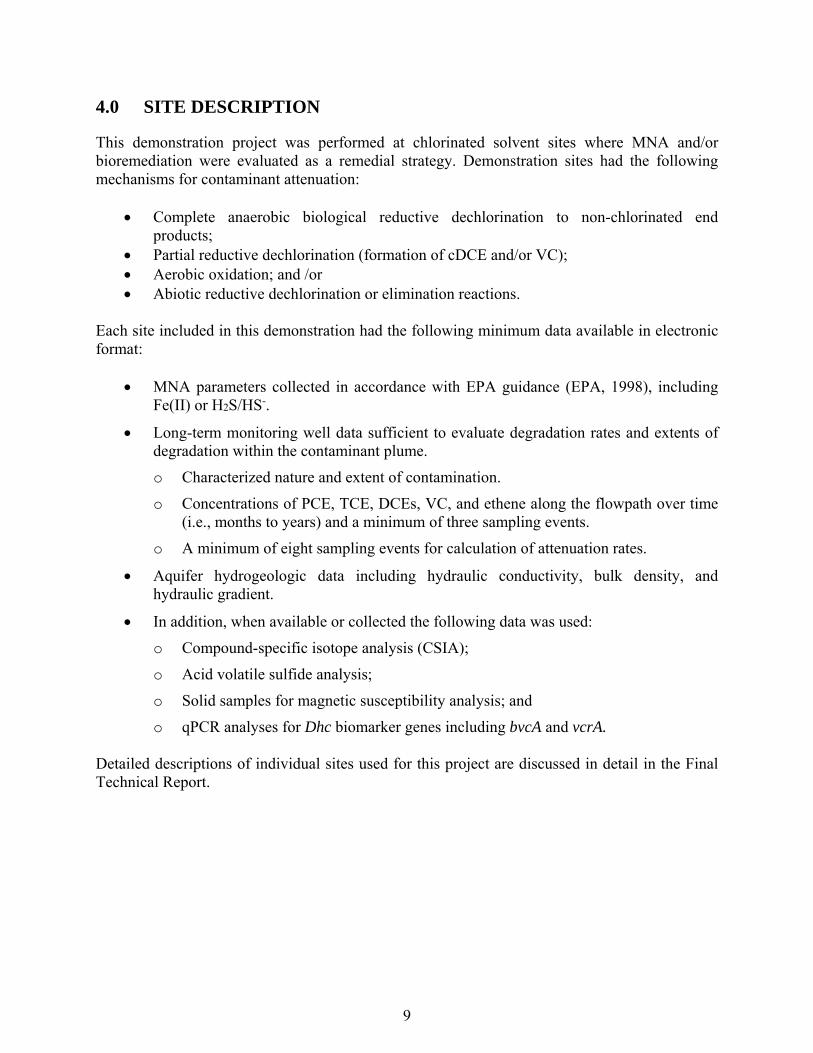
4.0 SITE DESCRIPTION
This demonstration project was performed at chlorinated solvent sites where MNA and/or bioremediation were evaluated as a remedial strategy. Demonstration sites had the following mechanisms for contaminant attenuation:
Complete anaerobic biological reductive dechlorination to non-chlorinated end products;
Partial reductive dechlorination (formation of cDCE and/or VC); Aerobic oxidation; and /or Abiotic reductive dechlorination or elimination reactions.
Each site included in this demonstration had the following minimum data available in electronic format:
MNA parameters collected in accordance with EPA guidance (EPA, 1998), including Fe(II) or H2S/HS-.
Long-term monitoring well data sufficient to evaluate degradation rates and extents of degradation within the contaminant plume.
o Characterized nature and extent of contamination.
o Concentrations of PCE, TCE, DCEs, VC, and ethene along the flowpath over time (i.e., months to years) and a minimum of three sampling events.
o A minimum of eight sampling events for calculation of attenuation rates.
Aquifer hydrogeologic data including hydraulic conductivity, bulk density, and hydraulic gradient.
In addition, when available or collected the following data was used:
o Compound-specific isotope analysis (CSIA);
o Acid volatile sulfide analysis;
o Solid samples for magnetic susceptibility analysis; and
o qPCR analyses for Dhc biomarker genes including bvcA and vcrA. Detailed descriptions of individual sites used for this project are discussed in detail in the Final Technical Report.

This page left blank intentionally.
11
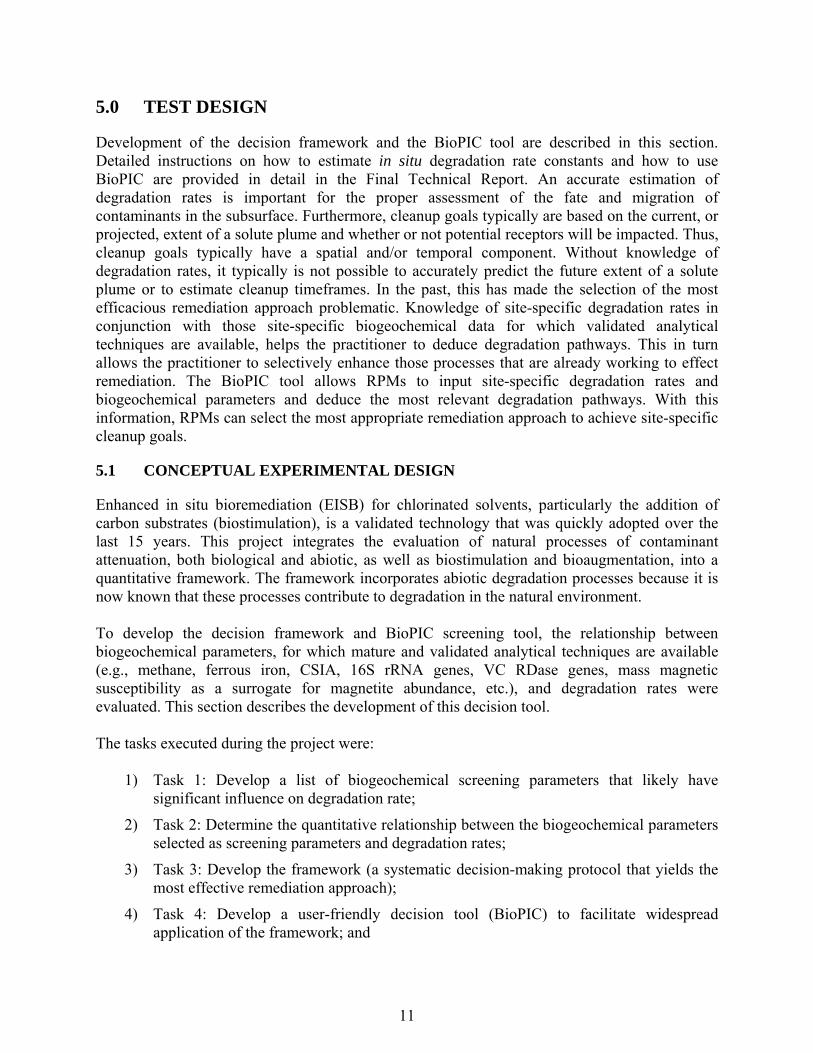
5.0 TEST DESIGN
Development of the decision framework and the BioPIC tool are described in this section. Detailed instructions on how to estimate in situ degradation rate constants and how to use BioPIC are provided in detail in the Final Technical Report. An accurate estimation of degradation rates is important for the proper assessment of the fate and migration of contaminants in the subsurface. Furthermore, cleanup goals typically are based on the current, or projected, extent of a solute plume and whether or not potential receptors will be impacted. Thus, cleanup goals typically have a spatial and/or temporal component. Without knowledge of degradation rates, it typically is not possible to accurately predict the future extent of a solute plume or to estimate cleanup timeframes. In the past, this has made the selection of the most efficacious remediation approach problematic. Knowledge of site-specific degradation rates in conjunction with those site-specific biogeochemical data for which validated analytical techniques are available, helps the practitioner to deduce degradation pathways. This in turn allows the practitioner to selectively enhance those processes that are already working to effect remediation. The BioPIC tool allows RPMs to input site-specific degradation rates and biogeochemical parameters and deduce the most relevant degradation pathways. With this information, RPMs can select the most appropriate remediation approach to achieve site-specific cleanup goals.
5.1 CONCEPTUAL EXPERIMENTAL DESIGN
Enhanced in situ bioremediation (EISB) for chlorinated solvents, particularly the addition of carbon substrates (biostimulation), is a validated technology that was quickly adopted over the last 15 years. This project integrates the evaluation of natural processes of contaminant attenuation, both biological and abiotic, as well as biostimulation and bioaugmentation, into a quantitative framework. The framework incorporates abiotic degradation processes because it is now known that these processes contribute to degradation in the natural environment. To develop the decision framework and BioPIC screening tool, the relationship between biogeochemical parameters, for which mature and validated analytical techniques are available (e.g., methane, ferrous iron, CSIA, 16S rRNA genes, VC RDase genes, mass magnetic susceptibility as a surrogate for magnetite abundance, etc.), and degradation rates were evaluated. This section describes the development of this decision tool. The tasks executed during the project were:
1) Task 1: Develop a list of biogeochemical screening parameters that likely have significant influence on degradation rate;
2) Task 2: Determine the quantitative relationship between the biogeochemical parameters selected as screening parameters and degradation rates;
3) Task 3: Develop the framework (a systematic decision-making protocol that yields the most effective remediation approach);
4) Task 4: Develop a user-friendly decision tool (BioPIC) to facilitate widespread application of the framework; and
12
5) Task 5: Validate cost and performance data.
The remainder of Section 5.1 describes how each of these tasks was completed.
5.1.1 Task 1 - Develop a List of Biogeochemical Screening Parameters that Likely Have a Significant Influence on Degradation Rate
During this task, those parameters that were anticipated to have significant influence on degradation rates were identified and evaluated. Sites were identified where the predominant pathway could be clearly distinguished, and which met the data requirements outlined in Section 4 of the Final Technical Report. Knowledge of the major degradation process was crucial for correlating measured values for the screening parameters with calculated degradation rates. Four degradation scenarios were identified: a) complete anaerobic biological reductive dechlorination (ethene/ethane are generated); b) incomplete reductive dechlorination leading to the formation of chlorinated daughter products (cDCE and/or VC accumulation); c) aerobic oxidation; and d) abiotic reductive dechlorination or elimination reactions. The screening parameters had/were:
Based on existing or emerging analytical techniques that had been validated and undergone peer review;
An acceptable probability for error when applied to field samples; Readily available and could be obtained at reasonable cost; A demonstrated effect on degradation rates and extents, and; A good probability that they would be able to predict the dominant degradation
processes (i.e., pathways) and the extent of degradation/detoxification.
The following list of screening parameters was developed:
Dhc abundance; The ratio of Dhc-to-total bacterial 16S rRNA genes; bvcA abundance; vcrA abundance; tceA abundance; The ratio of (bvcA + vcrA)-to-Dhc 16S rRNA genes; Dissolved oxygen concentration; Oxidation-reduction potential; Fe(II) concentration; Mn(II) concentration; Methane concentration; Ethene concentration; Total organic carbon (TOC) concentration in groundwater; and Mass magnetic susceptibility as a surrogate for the bulk concentration of magnetite.
The relationships between the range of values for these parameters and the calculated degradations rates were used to develop the decision framework that allows elucidation of
13
degradation pathways. Further, the BioPIC tool built on this framework guides the user to identify the most promising remedial approach. Figure 1 illustrates and summarizes the framework, and can be applied directly or by using the BioPIC tool.
5.1.2 Task 2 – Determine the Quantitative Relationship Between the Biogeochemical Parameters Selected as Screening Parameters and Degradation Rates
Task 2 involved determining the quantitative relationship between the screening parameters and the degradation rate. The team collected as much data as possible to develop these quantitative relationships. The database used to evaluate these relationships is included in Appendix A of the Final Technical Report and includes those sites where aquifer matrix and groundwater analytical screening parameters of interest were available, and for which degradation rates have been, or could be, calculated from temporal measurements of contaminant concentration data. Whenever possible, sites were selected where the concentrations or values of the screening parameters, as well as site-specific degradation rates, have been published in the peer-reviewed literature. This minimized the amount of labor required to extract degradation rate constants from site characterization and contaminant concentration data. As a starting point, the data from Lu et al. (2006) were used for data analysis. The database was supplemented with data from additional sources. For example, the team contacted environmental professionals to obtain unpublished data for sites with sufficient information to estimate degradation rate constants in order to compile the most comprehensive data set possible. Further, the team used existing information from Microbial Insights, Inc. to correlate qPCR data for Dhc biomarker gene abundances with VOC concentrations and other available biogeochemical datasets with degradation rates. In order to evaluate the quantitative relationship between screening parameters and degradation rates, the candidate screening parameters were individually plotted against the corresponding first order degradation rates achieved at the site to determine if there was a relationship between a given parameter and the degradation rate. Plots of parameter concentrations/abundances versus degradation rates were made for all of the screening parameters identified in Section 5.1.1. Based on these plots, the following parameters were found to correlate with degradation rates:
Dhc abundance for TCE, cDCE, and VC; Mass magnetic susceptibility; FeS; CH4; and Fe(II).
The relationships between the concentrations of these parameters and degradation rates were used to develop the decision framework, allowing elucidation of degradation pathways to aid the user in selection of the most appropriate remediation strategy (Task 3). Correlations between the following parameters also were identified:
14
vcrA+bvcA gene copies per liter and Dhc copies per liter for cDCE and VC;
A ratio of Dhc to total bacterial 16S rRNA genes exceeding 0.0005 correlates with ethene formation;
A ratio of bvcA+vcrA genes to total bacterial 16S rRNA genes exceeding 0.0005 correlates with ethene formation; and
A ratio of Dhc to vcrA+bvcA near unity correlates with ethene formation. These ratios are useful normalized parameters for predicting detoxification and validated qPCR assays to obtain this information are commercially available. No correlation was observed between dissolved oxygen concentrations and reductive dechlorination rates, verifying that dissolved oxygen data are unreliable for determining anoxia and the potential for anaerobic degradation activity. Although dissolved oxygen is known to be inhibitory to strict anaerobes, difficulties in sample collection and analysis negate the use of this parameter alone to deduce anoxic conditions. The measurement of Fe(II) and CH4 concentrations are more reliable parameters to determine the availability, or perhaps more importantly, the lack of dissolved oxygen to predict oxidative versus reductive degradation processes. The concentrations of CH4 and Fe(II) are determined on water samples from wells. These parameters were part of the original Technical Protocol for Evaluating Natural Attenuation of Chlorinated Solvents in Ground Water (EPA, 1998). The abundance of structural genes in Dehalococcoides bacteria (Dhc) is also determined in samples of groundwater, using an assay based on the qPCR. Analyses for all of these parameters are available from a number of vendors. In the past, attempts were made to measure the quantity of FeS in aquifer sediment as acid volatile sulfide. Unfortunately, the quantity of FeS determined as acid volatile sulfide does not correlate well to the rate of TCE degradation (Whiting et al., 2014). In this framework, information on the concentrations of sulfate and sulfide in groundwater, the pH of the groundwater, the residence time of contamination in the subsurface, and the groundwater flow velocity are used to calculate the accumulation of reactive FeS. Then, the calculated accumulation of reactive FeS is used to predict rate constants for degradation of TCE. Magnetic susceptibility is the tendency of a material of propagate a magnetic field. For example, when iron nails are attracted to a magnet, the nails temporarily become magnets. Almost all of the magnetic susceptibility in aquifer materials is associated with the mineral magnetite. Unfortunately, magnetic susceptibility is not a conventional analysis in the environmental market. The magnetic susceptibility of aquifer material in situ can be measured with a probe that can be inserted into open boreholes or into wells that have plastic screens and risers. The magnetic susceptibility of a core sample can be measured with an instrument in the laboratory. Down-hole probes to measure magnetic susceptibility can be purchased or rented from vendors that support geophysical investigations. The laboratory meters are available in many geology departments at universities. Recently, one vendor in the environmental market has added magnetic susceptibility of core samples to their line of services.
15
5.1.3 Task 3 - Develop a Decision Framework
The goal of Task 3 was to develop a decision-making framework using the range of values for each screening parameter for a range of rates for each degradation pathway. The decision framework uses simple if-then statements to develop the BioPIC tool.
5.1.4 Task 4 - Develop a User-Friendly Site Management Expectation Tool to Facilitate User Application of the Decision Framework
The goal of this task was to develop a user-friendly tool for easy application of the decision framework. This tool was developed using Microsoft Excel, and is called BioPIC. BioPIC allows the user to input site-specific values for the screening parameters that were determined to influence contaminant degradation and degradation rates as discussed under Tasks 2 and 3.
5.1.5 Task 5 - Validate Cost and Performance Data
During this task, cost of implementing the decision framework was estimated.
5.2 DESIGN AND LAYOUT OF TECHNOLOGY COMPONENTS
BioPIC is organized around the EPA lines of evidence for MNA (EPA, 1998). The first line of evidence is historical data that demonstrate a clear and meaningful trend of decreasing contaminant concentration over time at appropriate monitoring or sampling points. Therefore, the user must first apply a solute fate and transport model to determine if the rate of attenuation will bring solutes to acceptable concentrations before the groundwater reaches a receptor or a sentry well. If the predicted concentrations are acceptable, MNA is appropriate. If MNA is appropriate, BioPIC allows the user to deduce degradation pathways. This allows the user to meet the EPA’s second line of evidence that can be used to demonstrate the type(s) of natural attenuation processes active at the site, and the rate at which such processes will reduce contaminant concentrations to required levels. If MNA is not appropriate, BioPIC offers guidance on in situ bioremediation and, in particular, whether it is useful to bioaugment the site with active microorganisms as well as biostimulate with nutrients. BioPIC is organized as a series of decisions. In each step, BioPIC provides decision criteria based on quantitative values. Help is available for each decision to provide guidance and background. Figure 1 shows the logic used to develop BioPIC. This is the decision framework. One overarching question that pervades the decision criteria boxes is, “does a given parameter explain the rate of degradation.” Thus, estimating degradation rates is critical for using BioPIC. The following section discusses how to estimate degradation rates using BIOCHLOR. This modeling tool was selected because it was developed for the EPA and it is readily available at no cost (http://www2.epa.gov/water-research/biochlor-natural-attenuation-decision-support-system). There are numerous other software packages, which use analytical, numerical, or a combination of analytical and numerical models, that can also be used to extract degradation rate information from site-specific hydrogeologic and contaminant concentration data.
16
5.2.1 Estimating Degradation Rates Using BIOCHLOR
The use of BIOCHLOR to extract degradation rates from site-specific hydrogeologic, contaminant, and biogeochemical data consists of implementing the following steps:
1. Collect site-specific data/information;
2. Select flowpath along which analysis will be completed;
3. Enter site description information;
4. Select chlorinated ethenes or chlorinated ethanes;
5. Enter data for advective seepage velocity calculation;
6. Enter data to quantify dispersion;
7. Enter data to quantify sorption;
8. Enter field data for comparison;
9. Enter simulation time data;
10. Enter source data; and
11. Vary degradation rate constants and match to model-generated concentration versus distance plots until a match is achieved and degradation rate constants are extracted.
5.2.2 Using the Decision Tool
The Final Technical Report for ER-201129 provides a detailed description for using BioPIC. The decision framework includes key decision points that correspond, in a step-by-step fashion, with the decision point/questions in BioPIC. These include (as discussed in the Final Report):
1. Does natural attenuation currently meet the goal?
2. Are reductive dehalogenase genes present?
3. Is the EPA 2nd line of evidence required?
4. Is VC present?
5. Is VC degrading?
6. Does Dhc abundance explain the VC rate constant?
7. Does mass magnetic susceptibility explain the VC rate constant?
8. Adequate oxygen for aerobic VC biodegradation?
9. Are dichloroethene isomers (DCE) present?
10. Is DCE degrading?
11. Does Dhc abundance explain the cDCE rate constant?
12. Does mass magnetic susceptibility explain the cDCE rate constant?
13. Adequate oxygen for aerobic cDCE biodegradation?
17
14. Is TCE present?
15. Is TCE degrading?
16. Are cDCE or trans-1,2-dichloroethene (tDCE) or VC present?
17. Are cDCE or tDCE or VC present in relevant concentrations?
18. Does mass magnetic susceptibility explain the TCE degradation rate constant?
19. Does iron sulfide explain the TCE degradation rate constant?
20. Is PCE present?
21. Is PCE degrading?
22. Are TCE, cDCE, tDCE, or VC present?
23. Are TCE, cDCE, or VC present in relevant concentrations?
24. Does mass magnetic susceptibility explain the PCE rate constant?
A detailed discussion of each of these questions, and the method(s) for deducing the associated answers, are described in detail in the Final Technical Report.

18
This page was intentionally left blank.
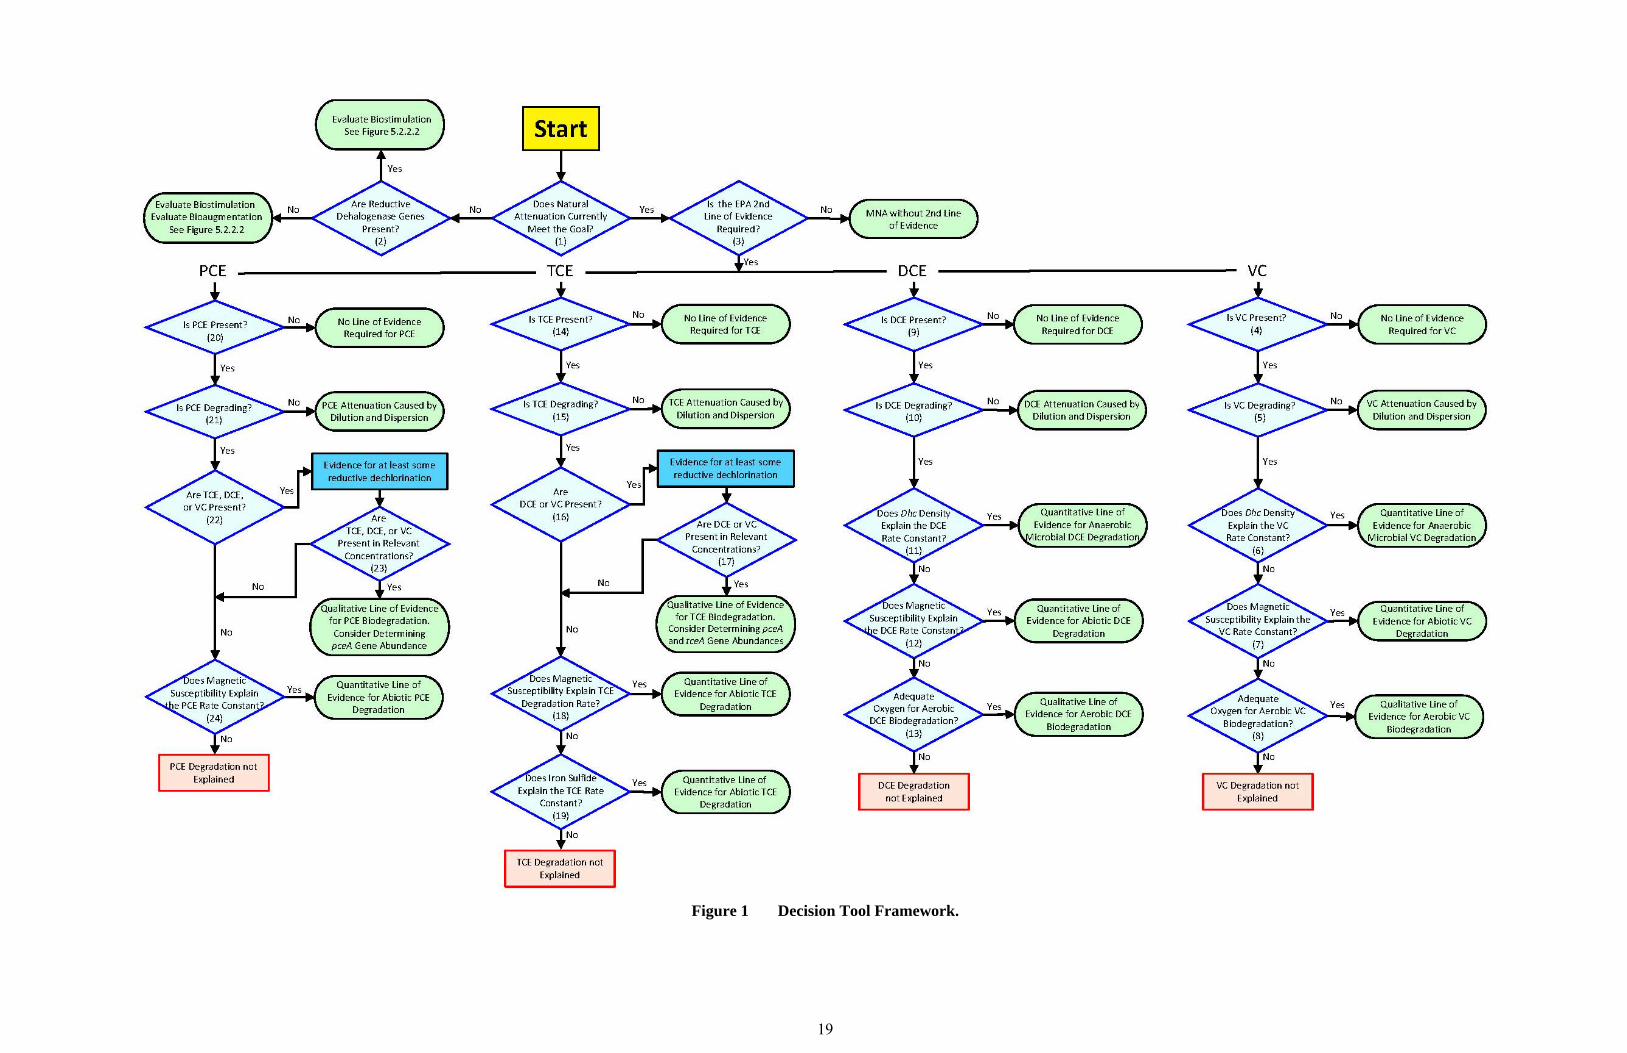
Figure 1 Decision Tool Framework.
19

This page was intentionally left blank.
21
6.0 PERFORMANCE ASSESSMENT
Qualitative and quantitative performance metrics were initially established and performance assessed through project execution. Performance was assessed using the performance objectives listed in Section 3 (Tables 1A and 1B) as a benchmark. The following subsections relate to the results that pertain to these metrics and goals.
6.1 QUALITATIVE PERFORMANCE OBJECTIVES
6.1.1 Easy to Use, Easy to Follow, and Easy to Interpret
The main performance objective of this project, which was to develop an easy to use decision-making framework and screening tool (BioPIC) to aid users in the selection of a bioremediation approach, was met. User feedback on the framework’s logic/reasoning and the BioPIC tool was obtained through direct contact with RPMs, consultants, and stakeholders. Objectives would be considered met if users applied the BioPIC tool without extensive training and without in-depth knowledge of the underlying science, assumptions, and models. User feedback was used to assess whether the performance metrics were met and identify what modifications/changes to the framework and BioPIC where needed. User feedback indicated that the framework paradigm was intuitive, focused, practical, and easy to use.
6.1.2 Focused Site Characterization and Sampling Regimes
This performance objective was met. The application of BioPIC assists RPMs in recognizing relevant attenuation processes at a site so that rational remediation decisions can be made. BioPIC requires the user to enter site-specific data, including, at a minimum, the following data: a) pH, b) Fe[II], c) sulfide (S-2), d) methane (CH4), e) Dhc abundance, and f) presence and abundance of VC RDase genes. Depending on a site’s specific conditions and characteristics, additional measurements (i.e., input parameters) may be necessary such that the BioPIC tool can provide reliable information about a plume’s trajectory and treatment options. Based on the database compiled under Tasks 1 and 2, a database was compiled along with plots of degradation rates for PCE, TCE, DCE, and VC against multiple parameters, as discussed in Sections 5.1.1 and 5.1.2. The team’s exercise relating degradation rates to the abundance of specific parameters ensured success of this performance objective. During this demonstration, the team developed distribution plots that allow users to quickly screen their own site against the benchmark sites included in the distribution plots. These figures are presented in the Final Technical Report. The decision framework (Figure 1), and subsequently BioPIC, were developed to enable users to identify parameters that have the greatest impact on the rate of attenuation. This information enables users to decipher whether the rate of attenuation at their site is due to a specific relevant parameter. During Beta testing, users’ feedback indicated that manipulating individual parameters enabled them to focus on those parameters that have the greatest impact on degradation rates. This was the project team’s intended outcome for the utility of the BioPIC tool, and therefore, this objective was met. Application of the BioPIC tool has great potential to
22
realize substantial cost savings for the DoD because RPMs can quickly exclude non-productive treatments, focus on the most promising remedies, and concentrate efforts and the measurements of parameters that provide meaningful information under the specific site conditions.
6.2 QUANTITATIVE PERFORMANCE OBJECTIVES
6.2.1 Quantify the Impact of Selected Parameters on Degradation Rates
This performance objective was met. The impact of the selected screening parameters was determined using data from 10-12 sites, for which degradation rates either were calculated, or had been calculated. Individual parameters were then plotted against degradation rates. Parameters of interest are listed in Section 5.1.2. As discussed in Section 5, it was determined that there were correlations between degradation rate constants for a given degradation pathway and certain parameters. Furthermore, it was determined that certain parameters could be useful for aiding in the determination of degradation pathways. These parameters and their associations with various degradation pathways are discussed in Section 5.1.2. Based on the correlations determined in Section 5.1.2, spreadsheets were developed and incorporated into the BioPIC tool to aid the user in deducing degradation pathways. These include plots of degradation rate versus Dhc density for cDCE and VC; degradation rate versus magnetic susceptibility for PCE, TCE, DCE, and VC; and plots of vcrA plus bvcA gene copies per liter versus Dhc density. The reliability of the user’s data compared to the benchmark database was developed for the Dhc and magnetic susceptibility plots. In order to help quantify the accuracy of the data input by the user, calculations were made to determine where the user’s rate constant for a given value of a parameter plot relative to the data in the database. This is discussed in detail in the Final Technical Report.
6.2.2 Correlate Dhc Biomarker Gene Measurements to Ethene Formation and Detoxification
Two hypotheses were tested. First, it was determined whether Dhc 16S rRNA gene-to vcrA/bvcA ratios near unity are characteristic of wells with extensive ethene formation. In contrast, ratios >100 were expected at wells that do not show ethene formation. Second, it was determined if Dhc-to-total bacterial 16S rRNA gene ratios > 0.0005 serve as an indicator for ethene formation. To validate this parameter, the Dhc-to-total bacterial 16S rRNA gene ratios in groundwater samples collected from wells that show ethene formation and wells where no ethene has been detected was determined. This criterion was not met because we were unable to obtain sufficient data to calculate rates for VC-to-ethene reductive dechlorination and associated ethene formation. Therefore, the qPCR measurement could not be related to a rate; however, the analysis did reveal correlations with ethene formation. The analysis indicated that ratios of Dhc to total bacterial 16S rRNA genes and bvcA+vcrA to total bacterial 16S rRNA genes exceeding 0.0005, and a ratio of Dhc to vcrA+bvcA near unity are useful normalized, measurable parameters for predicting detoxification

23
(i.e., ethene formation). Unfortunately, no sites with the information required for rate calculations were available, and the ratios were linked to ethene formation but not to the rates of ethene formation.

This page left blank intentionally.
25
7.0 COST ASSESSMENT
This section provides sufficient cost information that a remediation professional should be able to reasonably estimate costs for implementation of the decision framework. In addition, this section provides a discussion of the cost benefit of using the decision framework.
7.1 COST MODEL
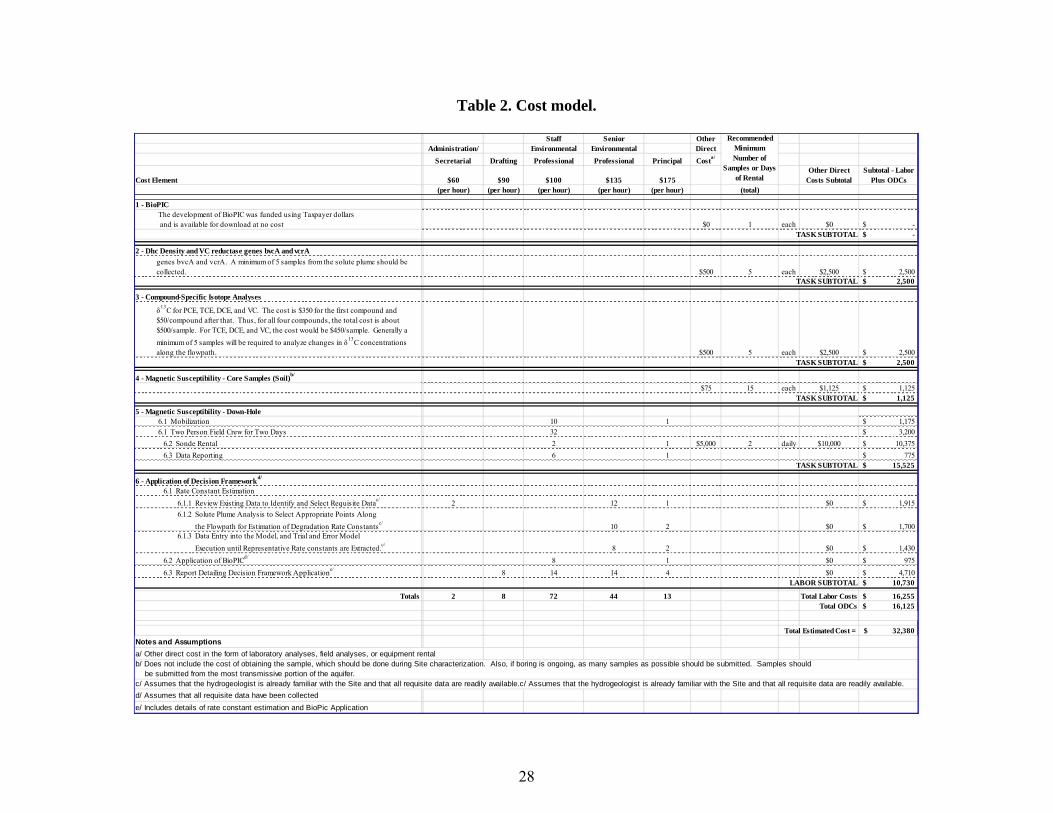
This report presents a systematic framework to make bioremediation decisions based on site-specific physical, chemical, and microbial characteristics and constraints. The cost components involved include: a) sample collection and analysis for parameters in addition to those specified in EPA (1998) required to implement the decision framework; b) estimation of degradation rate constants for the chlorinated ethenes of interest; and c) application of the decision framework using BioPIC. The tool is designed to use existing data and requires only a few additional measurements that were not included in the 1998 protocol. Additional measurements involved in site assessment and monitoring include: Dhc 16S rRNA genes, VC RDase genes, and magnetic susceptibility. With the exception of magnetic susceptibility analysis, the analytical parameters required for use of BioPIC and the decision framework are common site groundwater characterization parameters that are routinely measured. At the time of this writing, magnetic susceptibility information can be obtained by collecting aquifer cores and subsequent laboratory analysis, or by using a down-hole sensor in existing non-metal monitoring wells. In order to estimate the quantitative framework technology cost, only those parameters that currently are not commonly used and analyzed will be considered. Specifically, the costs for those parameters not already collected under EPA (1998) will be considered. These include qPCR analyses, CSIA, and magnetic susceptibility. In addition, since BioPIC will be available to the user free of cost, only the time/duration estimated to apply this tool will be considered in the cost assessment. The entire list of field and laboratory analytical parameters required to use the decision matrix includes:
1) Groundwater/In-Well Analyses:
a. Concentrations of PCE, TCE, DCE, and VC in groundwater, b. Dissolved oxygen concentrations in groundwater, c. Fe(II) concentrations in groundwater, d. FeS concentrations in groundwater, e. Methane dissolved in groundwater, f. Dhc abundance (Dhc 16S rRNA genes), g. VC reductase genes (bvcA and vcrA), h. CSIA, and i. Magnetic susceptibility (down-well sensor).
2) Soil/Sediment
a. Magnetic Susceptibility (core)
26
, All of these analyses are included in EPA (1998), with the exception of a) qPCR analysis including Dhc density and the VC reductase genes bvcA and vcrA, b) magnetic susceptibility tests to estimate magnetite abundance, and 3) CSIA. Therefore, only the costs for these analyses are included in this report. One important note is that not all of these analyses may be required for the application of BioPIC and the implementation of the decision framework. For example, if the application of BioPIC reveals that the degradation pathway is microbial reductive dechlorination to non-toxic end products (i.e., ethene and inorganic chloride), then CSIA, the VC reductase genes, and magnetic susceptibility analyses will not be required.
7.2 COST DRIVERS
The main cost drivers for implementation of the decision framework are summarized in Table 2 and include:
The cost for measuring specific parameters over and above those specified in EPA (1998);
The cost to estimate degradation rate constants using a solute fate and transport model such as BIOCHLOR; and
The cost (i.e., time) to run the BioPIC software tool. RPMs who apply the decision framework can realize substantial cost-savings for several reasons. The site decision framework provides guidance regarding technology implementation and RPMs can avoid expenditures for a technology that is inappropriate to accomplish cleanup at a given site. For example, the decision framework is designed to recognize those sites that are inappropriate for MNA or bioremediation. If these alternatives are not conducive to site remediation, then the decision framework will suggest that alternate remedies should be considered. The RPM can input site-specific data and remediation goals, which the site decision framework will consider. Consequently, the BioPIC software’s output reflects the most efficient technology in terms of cleanup goals, cost, and environmental impact.
7.2.1 Analytical Parameters in Addition to Those Specified in EPA (1998)
7.2.1.1 Dhc Density and VC reductase genes bvcA and vcrA
The costs for qPCR analysis in groundwater are in the range of $500 per sample for the relevant target genes indicated above (Table 2).
7.2.1.2 CSIA
CSIA for δ13C is offered by several analytical laboratories at the time of this writing. Values are provided for δ 13C for PCE, TCE, DCE, and VC. The cost is $350 for the first compound and $50 per compound after that. Thus, for the four chlorinated ethenes, the total cost is about $500 per sample. For TCE, DCE, and VC, the cost would be $450 per sample. Generally a minimum of five samples will be required to analyze changes in δ 13C concentrations along the flowpath, so the total cost to implement CSIA for monitoring the degradation of TCE, DCE, and VC in a given plume is about $2,500.
27
7.2.1.3 Magnetic Susceptibility
Magnetic susceptibility measurements for aquifer matrix core samples can now be obtained from analytical laboratories for about $75 per sample (Table 2). An alternative approach measures magnetic susceptibility with a down-hole probe inserted in an existing monitoring well. At a site in Albuquerque, New Mexico, a profile of magnetic susceptibility was developed in 2-inch inner diameter polyvinyl chloride wells using a magnetic susceptibility probe. The equipment rents for about $2,500 a week. Labor for a week of field work should be about $4,000, not including travel and per diem. During one week of field work, it should be possible to log at least 600 feet of borings into aquifer matrix.
7.2.2 Application of the Decision Framework
Site-specific degradation rate constants must be estimated in order to apply the decision framework and utilize the BioPIC tool. Section 5 discusses the estimation of rate constants. This is discussed in detail in the Final Technical Report. Table 2 presents an estimate of the costs for estimating degradation rate constants.
28
Table 2. Cost model.
Staff Senior OtherAdministration/ Environmental Environmental Direct
Secretarial Drafting Professional Professional Principal Costa/
Cost Element $60 $90 $100 $135 $175Other Direct
Costs SubtotalSubtotal - Labor
Plus ODCs(per hour) (per hour) (per hour) (per hour) (per hour) (total)
1 - BioPIC The development of BioPIC was funded using Taxpayer dollars and is available for download at no cost $0 1 each $0 -$
TASK SUBTOTAL -$
2 - Dhc Density and VC reductase genes bvcA and vcrAy y g q ygenes bvcA and vcrA. A minimum of 5 samples from the solute plume should be collected. $500 5 each $2,500 2,500$
TASK SUBTOTAL 2,500$
3 - Compound-Specific Isotope Analyses
δ13C for PCE, TCE, DCE, and VC. The cost is $350 for the first compound and
$50/compound after that. Thus, for all four compounds, the total cost is about $500/sample. For TCE, DCE, and VC, the cost would be $450/sample. Generally a
minimum of 5 samples will be required to analyze changes in δ13C concentrations
along the flowpath. $500 5 each $2,500 2,500$ TASK SUBTOTAL 2,500$
4 - Magnetic Susceptibility - Core Samples (Soil)b/
$75 15 each $1,125 1,125$ TASK SUBTOTAL 1,125$
5 - Magnetic Susceptibility - Down-Hole 6.1 Mobilization 10 1 1,175$
6.1 Two Person Field Crew for Two Days 32 3,200$
6.2 Sonde Rental 2 1 $5,000 2 daily $10,000 10,375$
6.3 Data Reporting 6 1 775$ TASK SUBTOTAL 15,525$
6 - Application of Decision Frameworkd/
6.1 Rate Constant Estimation
6.1.1 Review Existing Data to Identify and Select Requisite Datac/
2 12 1 $0 1,915$
6.1.2 Solute Plume Analysis to Select Appropriate Points Along
the Flowpath for Estimation of Degradation Rate Constantsc/
10 2 $0 1,700$ 6.1.3 Data Entry into the Model, and Trial and Error Model
Execution until Representative Rate constants are Extracted.c/
8 2 $0 1,430$
6.2 Application of BioPICd/
8 1 $0 975$
6.3 Report Detailing Decision Framework Applicatione/
8 14 14 4 $0 4,710$ LABOR SUBTOTAL 10,730$
Totals 2 8 72 44 13 Total Labor Costs 16,255$ Total ODCs 16,125$
Total Estimated Cost = 32,380$
Notes and Assumptions
a/ Other direct cost in the form of laboratory analyses, field analyses, or equipment rental
c/ Assumes that the hydrogeologist is already familiar with the Site and that all requisite data are readily available.c/ Assumes that the hydrogeologist is already familiar with the Site and that all requisite data are readily available.
d/ Assumes that all requisite data have been collected
e/ Includes details of rate constant estimation and BioPic Application
Recommended Minimum Number of
Samples or Days of Rental
b/ Does not include the cost of obtaining the sample, which should be done during Site characterization. Also, if boring is ongoing, as many samples as possible should be submitted. Samples should be submitted from the most transmissive portion of the aquifer.
29
8.0 IMPLEMENTATION ISSUES
The management expectation tool (BioPIC) is based on the current scientific understanding of the processes contributing to the detoxification of chlorinated ethenes. Although process understanding has significantly improved over the past decade, knowledge gaps remain. The quantitative framework validated herein only includes those parameters that are known to affect chlorinated ethene detoxification; however, additional parameters can easily be added to the framework should new scientific discoveries reveal novel information about the process. Obviously, balance has to be struck between the ease of use and generality of application and the level of detail the management expectation tool provides. To minimize uncertainty associated with the decision framework, the relationship between degradation rates and multiple biogeochemical screening parameters was quantified and incorporated into the tool. In some cases, the investigator may not want to expend the resources to fully implement the decision framework. For example, when the investigator has worked through the decision framework and will not be able to proceed without magnetic susceptibility data, the RPM may not want to expend the resources to collect soil core data, thus negating the further use of the tool to deduce degradation pathways. Development of downhole technologies for obtaining magnetic susceptibility data, such as through use of a downhole sonde, would circumvent this potential problem with implementation of the decision framework, including BioPIC. Another potential problem is that the examples given for the decision framework and BioPIC rely on meeting cleanup goals at a point of compliance, which is appropriate for sites regulated under the Resource Conservation and Recovery Act, but do not take into the temporal aspect of cleanup goals. Consideration of the temporal aspect is required for many regulatory frameworks, including those sites falling under the Comprehensive Environmental Response, Compensation, and Liability Act of 1980. This can be easily circumvented by the user when determining cleanup goals, or the decision framework can be updated to include examples that include the temporal aspect of cleanup goals. One additional implementation issue is that the decision framework only considers chlorinated ethenes. Separate decision frameworks for the chlorinated ethanes and chlorinated methanes could be developed to round out the toolkit to provide similar decision frameworks.

This page left blank intentionally.
9.0 REFERENCES
Air Force Center for Engineering and Environment, Naval Facilities Engineering Service Center, and ESTCP, 2004. Principles and Practices of Enhanced Anaerobic Bioremediation. August, 2004.
Fortenberry, J. et al., 2004. Principles and Practices of Enhanced Anaerobic Bioremediation of Chlorinated Solvents – Guidance Document. ESTCP Project No. ER-200125. Issued August 2004.
Lu, X., J.T. Wilson, and D.H. Kampbell, 2006. Relationship between Dehalococcoides DNA in ground water and rates of reductive dechlorination at field scale. Water Research 40: 3131-3140.
U.S. Environmental Protection Agency, 1998, Technical Protocol for Evaluating Natural Attenuation of Chlorinated Solvents in Ground Water; EPA/600/R-98/128; 1998. Prepared by Wiedemeier, T.H., Swanson, M.A., Moutoux, D.E., Gordon, E.K., Wilson, J.T., Wilson, B.H., Kampbell, D.H., Haas, P.E., Miller, R.N., Hansen, J.E., and Chapelle, F.H. http://www.epa.gov/superfund/health/conmedia/gwdocs/protocol.htm.
Whiting, K. S.; Evans, P. J.; Lebron, C.; Henry, B.; Wilson, J. T.; Becvar, E., 2014, Factors controlling in situ biogeochemical transformation of trichloroethene: Field survey. Ground Water Monitoring & Remediation, 34, (3), 79-94.
Wiedemeier, T. H., et al., 1999, Natural Attenuation of Fuels and Chlorinated Solvents in the Subsurface: John Wiley & Sons New York New York 617 p.

This page left blank intentionally.
A-1
APPENDIX A
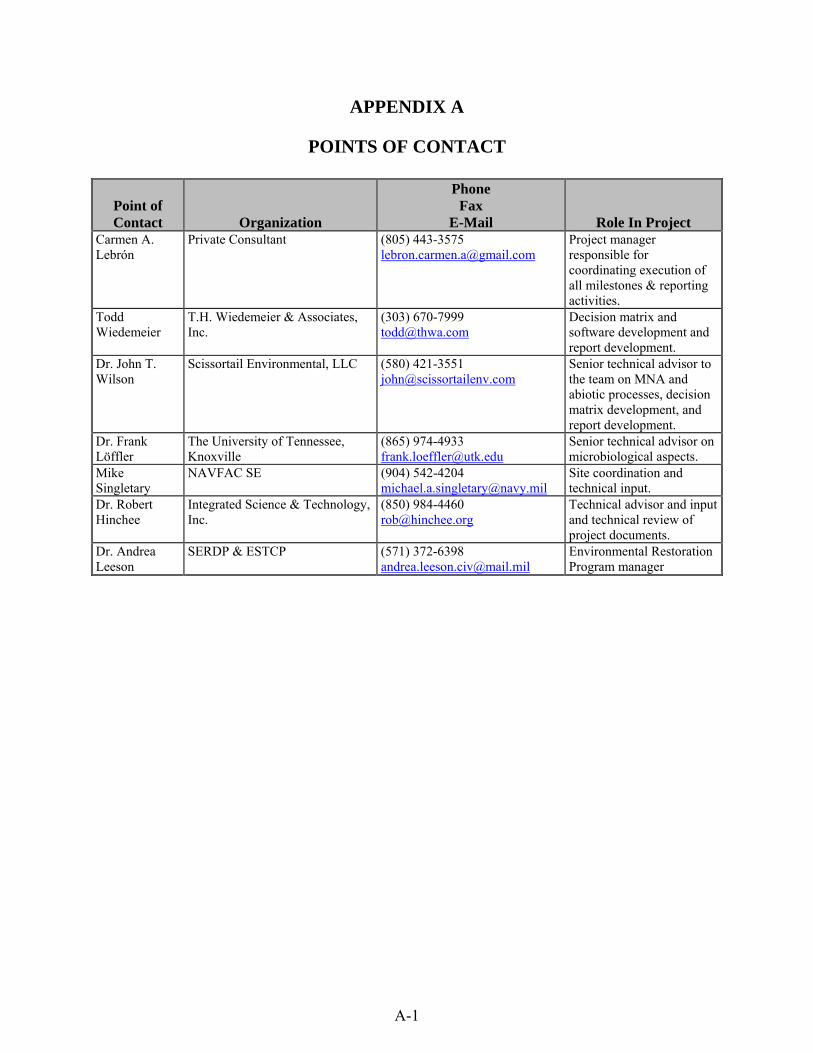
POINTS OF CONTACT
Point of Contact Organization
Phone Fax
E-Mail Role In Project Carmen A. Lebrón
Private Consultant (805) 443-3575 [email protected]
Project manager responsible for coordinating execution of all milestones & reporting activities.
Todd Wiedemeier
T.H. Wiedemeier & Associates, Inc.
(303) 670-7999 [email protected]
Decision matrix and software development and report development.
Dr. John T. Wilson
Scissortail Environmental, LLC (580) 421-3551 [email protected]
Senior technical advisor to the team on MNA and abiotic processes, decision matrix development, and report development.
Dr. Frank Löffler
The University of Tennessee, Knoxville
(865) 974-4933 [email protected]
Senior technical advisor on microbiological aspects.
Mike Singletary
NAVFAC SE (904) 542-4204 [email protected]
Site coordination and technical input.
Dr. Robert Hinchee
Integrated Science & Technology, Inc.
(850) 984-4460 [email protected]
Technical advisor and input and technical review of project documents.
Dr. Andrea Leeson
SERDP & ESTCP (571) 372-6398 [email protected]
Environmental Restoration Program manager