Embed Size (px)
Citation preview
International Journal of Mathematics and Statistics Invention (IJMSI)
E-ISSN: 2321 – 4767 P-ISSN: 2321 - 4759
www.ijmsi.org Volume 2 Issue 4 || April. 2014 || PP-40-46
www.ijmsi.org 40 | P a g e
Development and Validation of an Achievement Test in
Mathematics
J.Jayanthi, Ph.D Scholar, Department of Mathematics, Presidency College, Chennai – 600 005. India.
ABSTRACT: The main objective of the study was to develop and validate an achievement test in Mathematics
for high school students of standard 10 in Chennai district. A multiple choice test of 150 items from 10th
standard Mathematics syllabus was selected. The test was administrated to a sample of 327 students of 5
schools of Chennai district. The answer sheets were evaluated and marks were awarded. Several work sheets
were prepared to perform item analysis. Through regular method of item analysis, facility index and
discrimination index were calculated. The Cronbach’s alpha was calculated as 0.888.
I. INTRODUCTION Mathematics is the gate and key of the Science. Mathematics is a Science by any criterion, an efficient
and necessary tool used for all Sciences like Physics, Chemistry, Engineering and Medicine. It could be aptly
remarked as “Mathematics is a Science of all Sciences and Art of all Arts”. Mathematics is a universal part of
human culture. Mathematics provides us with a broad range of skills in problem solving, logical reasoning and
flexible thinking. Academic achievement in Mathematics seems to be one of the predictors of peoples success in
their career. Achievement in Mathematics is important in order to understand how society functions and for
people able to exercise their rights to democratic participation. Mathematics is significant in our daily life. The
need for high quality professional development programs in mathematics and science has become increasingly
important in the current climate of educational reform (Blank, Alas, & Smith, 2007). Mathematics is an
important school subject because it is associated with more academic and or career opportunities (Akinsola and
Tella, 2003). Burton cited in Agwagah and Usman (2003) relates the importance of mathematics to the
scientific, industrial, technology and social progress of a society.
II. OBJECTIVES OF THE STUDY The objective of the study is to develop and validate an achievement test in Mathematics of standard 10
to find the academic achievement in Mathematics with respect to the achievement test prepared and given by the
researcher.
III. METHOD OF THE STUDY This test is intended to evaluate the achievement in mathematics of the students of standard X. The
syllabus of Mathematics for standard X of Tamilnadu state for the academic year 2012-13 was analysed. Text
books, reference materials, question banks, question papers and hand books of Mathematics were utilized as
sources for framing items. The achievement test questionnaire was developed after the review of a large number
of related literature. The Mathematics text book was studied thoroughly and concepts were understood. Every
chapter was given importance and questions were selected with the help and advice of subject experts and also
by choosing repeated questions by verifying many question banks. The multiple choice item technique was used
to construct the items. There were 150 items totally.
IV. POPULATION Students of standard 10 in Chennai district of different management type of schools like corporation,
aided, unaided and government were selected as the population for the study.
V. SAMPLE Sample for the present study was selected randomly from schools located in Chennai district. Different
management schools like corporation, government, government-aided and matriculation and different types like
boys, girls and co-education schools were selected as sample.
VI. TOOL USED Mathematics achievement test of objective type for 10
th standard.
(Developed and constructed by the researcher).
Development and Validation of an Achievement Test in Mathematics
www.ijmsi.org 41 | P a g e
VII. STATISTICAL TECHNIQUES USED i). Simple random sampling technique was used to select the sample.
ii). Statistical methods were used to measure mean, variance, standard deviation, correlation, Cronbach’s alpha
and validity.
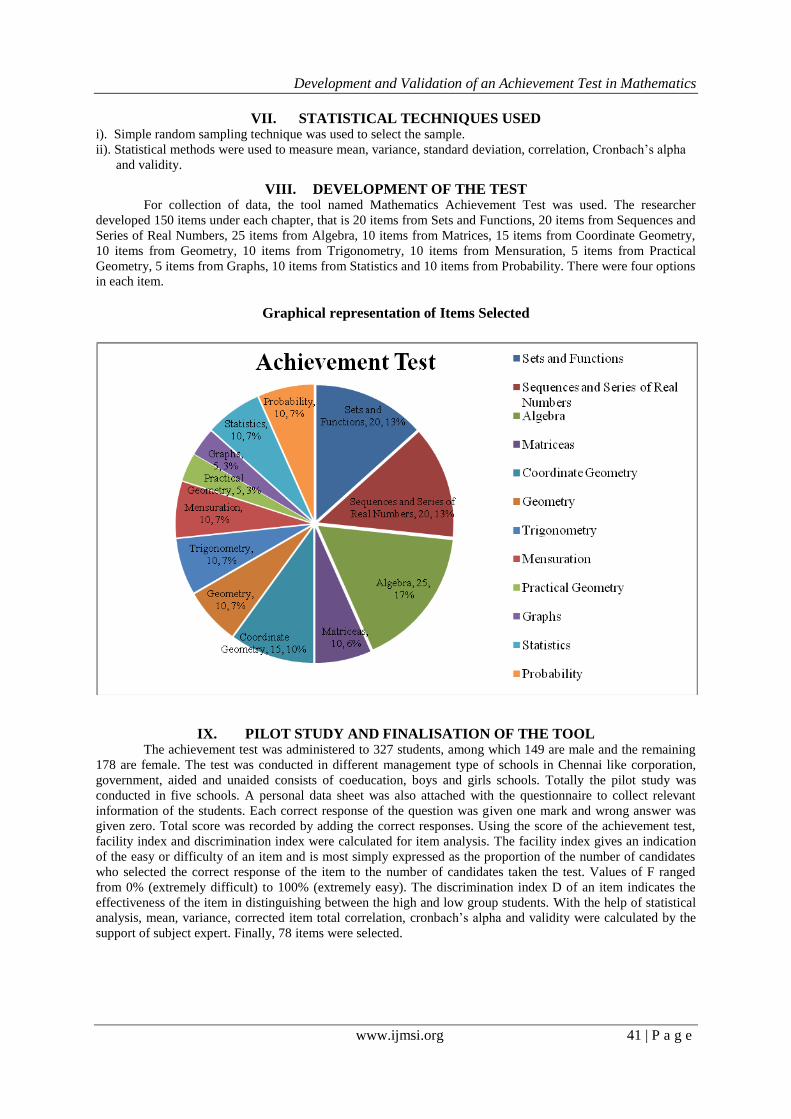
VIII. DEVELOPMENT OF THE TEST For collection of data, the tool named Mathematics Achievement Test was used. The researcher
developed 150 items under each chapter, that is 20 items from Sets and Functions, 20 items from Sequences and
Series of Real Numbers, 25 items from Algebra, 10 items from Matrices, 15 items from Coordinate Geometry,
10 items from Geometry, 10 items from Trigonometry, 10 items from Mensuration, 5 items from Practical
Geometry, 5 items from Graphs, 10 items from Statistics and 10 items from Probability. There were four options
in each item.
Graphical representation of Items Selected
IX. PILOT STUDY AND FINALISATION OF THE TOOL The achievement test was administered to 327 students, among which 149 are male and the remaining
178 are female. The test was conducted in different management type of schools in Chennai like corporation,
government, aided and unaided consists of coeducation, boys and girls schools. Totally the pilot study was
conducted in five schools. A personal data sheet was also attached with the questionnaire to collect relevant
information of the students. Each correct response of the question was given one mark and wrong answer was
given zero. Total score was recorded by adding the correct responses. Using the score of the achievement test,
facility index and discrimination index were calculated for item analysis. The facility index gives an indication
of the easy or difficulty of an item and is most simply expressed as the proportion of the number of candidates
who selected the correct response of the item to the number of candidates taken the test. Values of F ranged
from 0% (extremely difficult) to 100% (extremely easy). The discrimination index D of an item indicates the
effectiveness of the item in distinguishing between the high and low group students. With the help of statistical
analysis, mean, variance, corrected item total correlation, cronbach’s alpha and validity were calculated by the
support of subject expert. Finally, 78 items were selected.
Development and Validation of an Achievement Test in Mathematics
www.ijmsi.org 42 | P a g e
X. DATA COLLECTION AND DATA ANALYSIS The researcher personally visited various schools in Chennai district and met the Heads of the schools
and sought their permission and cooperation in administering the test, for their school students. Finally, the test
was conducted for five school students on different dates. The information about the test was communicated to
the students earlier itself so as to prepare themselves for the achievement test. A personal data sheet was
attached with the questionnaire to get relevant personal datas of the students. Clear instructions were given to
the students to respond to the questionnaire in time. The test procedure was strictly followed and answer sheets
were collected on time. One mark for each correct answer and zero for each wrong answer was awarded.
Answer key was prepared for scoring. The total scores were recorded for item analysis.
Total number of samples collected is 327. Total number of items in the achievement test is 150. The
procedure for calculating facility index and discrimination index is as follows:
i). Arrange 327 papers by score.
ii). Multiply 327 by 0.27 and round off to the nearest whole number, say N, that is N = 327 x 0.27, N = 88.
iii). Count N best papers from the bottom of the stack. This is called the high group.
iv). Count N poorest paper from the top of the stack. This is called the low group. The middle group
(appxly. 46 percent of papers), is not used in the item analysis.
v). Find RH and RL for each item. RH stands for number of right responses in high group. RL stands for
number of right responses in low group.
NH = NL = 88
1. Facility Index F = [(RH+ RL) x100] / (NH + NL)
2. Discrimination Index D = (RH – RL) / NH.
3. Cronbach Alpha = [k/(k-1)][1- (ΣSi2 – ST
2)],
where Si2 stands for variance of i
th item and
ST2 stands for variance of total.
4. Validity = √Cronbach’s alpha
Facility index and discrimination index were calculated and used for item analysis. The reliability coefficient
cronbach’s alpha and validity were also calculated.
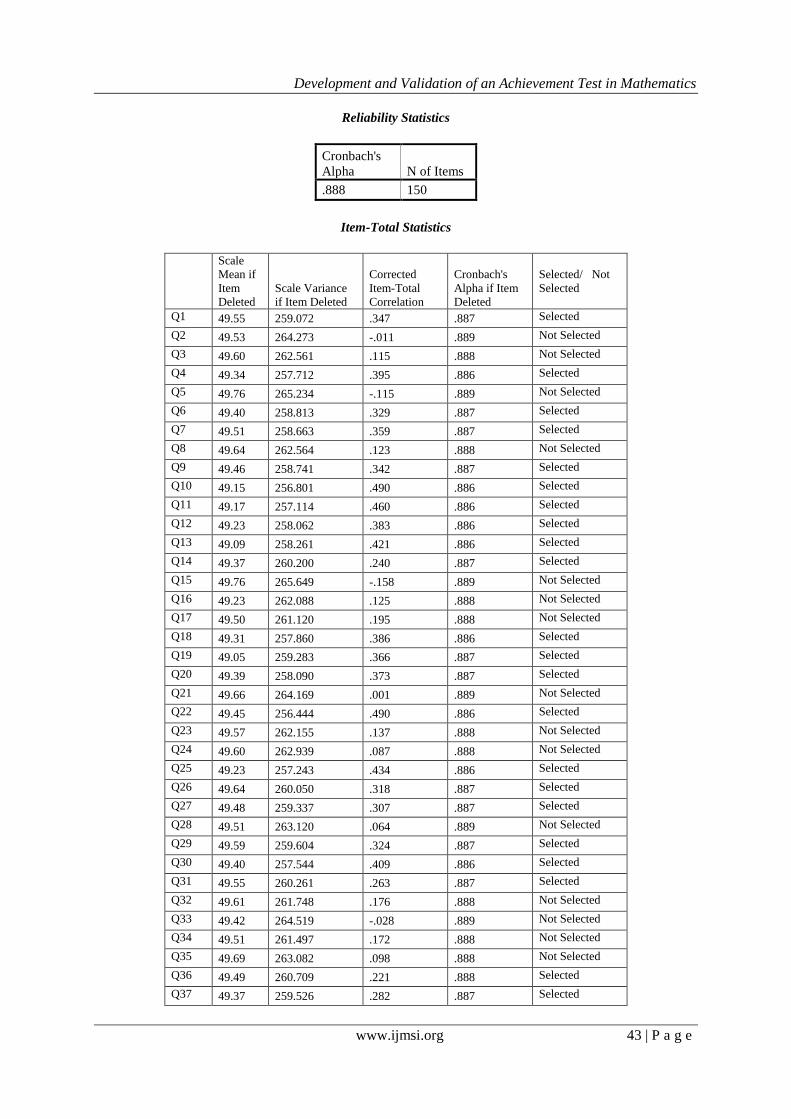
XI. RESULTS The value of facility index lies between 0.20 and 0.78. Item number 19 has largest value 0.78 and item
number 139 has smallest value 0.20. The value of discrimination index varies from 0.193 to 0.579. Item number
67 has the greatest discrimination power 0.579 and item number 81 has the least discrimination power 0.193.
Corrected item correlation lies between 0.204 and 0.546. Item number 124 has least and item number 67 has
greatest corrected item correlation. The reliability coefficient was calculated as 0.888 and validity coefficient is
calculated as 0.942. Also the mean, variance, standard deviations are calculated as 49.84, 264.321 and 16.258
respectively.
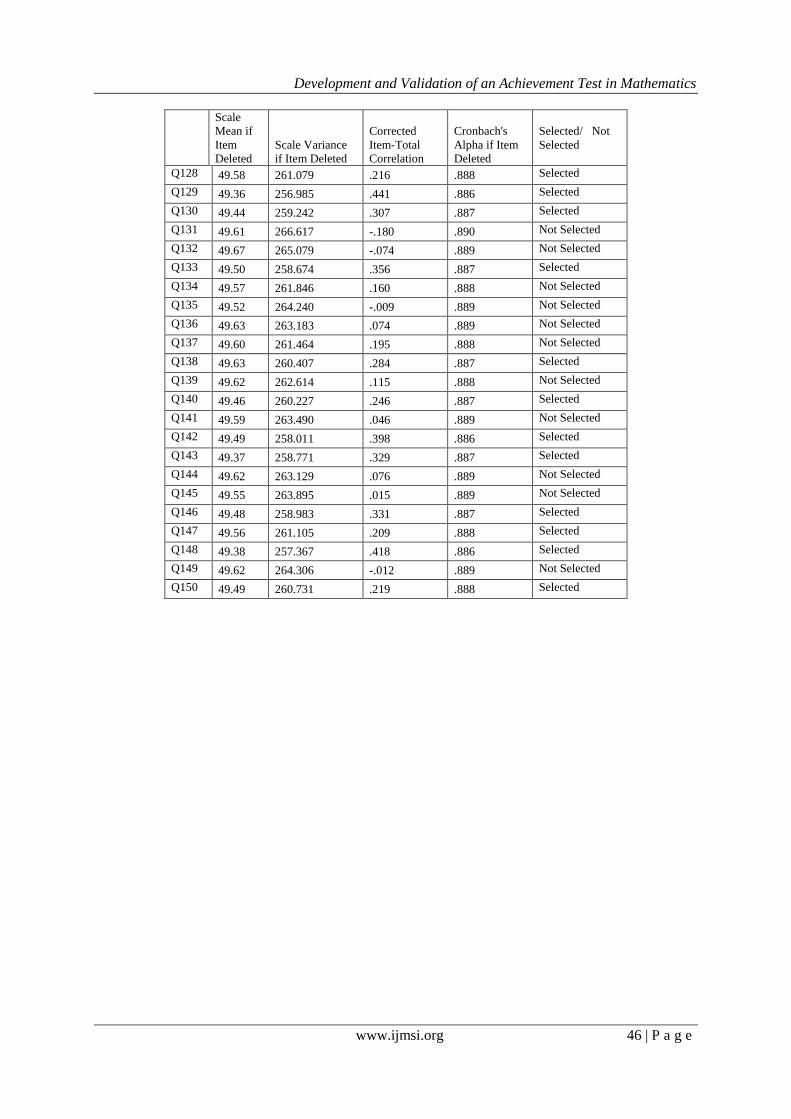
XII. DISCUSSION AND CONCLUSION Item total correlation less than 0.20 is dropped. The remaining items were selected for the final study.
78 items were selected based on the facility index and discrimination index and also based on the corrected item
total correlation. For the standardisation of the test, the sample size should be increased. Many other schools
from other districts also can included in the test. Schools belonging to rural areas are also can included in the
study.
REFERENCES [1] Aiken, L.R. (1988). Psychological testing and assessment (6th ed.). Boston: Allyn and Bacon Inc. [2] Ann, P.S.(2004). Measurement, Assessment and Evaluation, Lagos: Concepts Publications Ltd.
[3] Best, J.W. (2001), “Research in Education” (6th Ed.), New Delhi, Prentice Hall of India.
[4] Gronlund, N.E. (1981). Measurement and Evaluation in teaching. NewYork: Macmillan Publishing Co. [5] National Policy on Education (1986). Ministry of Human Resource Development. Government of India. New Delhi.
[6] Rao, S.N. (1990). “Educational Psychology”, New Delhi: Wiley Eastern Ltd.
[7] Saleem, M. (1994), “Development of an Aptitude Test of Mathematics at SSC level”. Dept. of Education Bahauddin Zakariya University, Multan.
[8] Wiersma, W. (1986), “Research Methods in Education: An Introduction”, (4th edition). Bostonl: Allyn Bacon Inc.
Development and Validation of an Achievement Test in Mathematics
www.ijmsi.org 43 | P a g e
Reliability Statistics
Cronbach's
Alpha N of Items
.888 150
Item-Total Statistics
Scale
Mean if
Item
Deleted
Scale Variance
if Item Deleted
Corrected
Item-Total
Correlation
Cronbach's
Alpha if Item
Deleted
Selected/ Not
Selected
Q1 49.55 259.072 .347 .887 Selected
Q2 49.53 264.273 -.011 .889 Not Selected
Q3 49.60 262.561 .115 .888 Not Selected
Q4 49.34 257.712 .395 .886 Selected
Q5 49.76 265.234 -.115 .889 Not Selected
Q6 49.40 258.813 .329 .887 Selected
Q7 49.51 258.663 .359 .887 Selected
Q8 49.64 262.564 .123 .888 Not Selected
Q9 49.46 258.741 .342 .887 Selected
Q10 49.15 256.801 .490 .886 Selected
Q11 49.17 257.114 .460 .886 Selected
Q12 49.23 258.062 .383 .886 Selected
Q13 49.09 258.261 .421 .886 Selected
Q14 49.37 260.200 .240 .887 Selected
Q15 49.76 265.649 -.158 .889 Not Selected
Q16 49.23 262.088 .125 .888 Not Selected
Q17 49.50 261.120 .195 .888 Not Selected
Q18 49.31 257.860 .386 .886 Selected
Q19 49.05 259.283 .366 .887 Selected
Q20 49.39 258.090 .373 .887 Selected
Q21 49.66 264.169 .001 .889 Not Selected
Q22 49.45 256.444 .490 .886 Selected
Q23 49.57 262.155 .137 .888 Not Selected
Q24 49.60 262.939 .087 .888 Not Selected
Q25 49.23 257.243 .434 .886 Selected
Q26 49.64 260.050 .318 .887 Selected
Q27 49.48 259.337 .307 .887 Selected
Q28 49.51 263.120 .064 .889 Not Selected
Q29 49.59 259.604 .324 .887 Selected
Q30 49.40 257.544 .409 .886 Selected
Q31 49.55 260.261 .263 .887 Selected
Q32 49.61 261.748 .176 .888 Not Selected
Q33 49.42 264.519 -.028 .889 Not Selected
Q34 49.51 261.497 .172 .888 Not Selected
Q35 49.69 263.082 .098 .888 Not Selected
Q36 49.49 260.709 .221 .888 Selected
Q37 49.37 259.526 .282 .887 Selected
Development and Validation of an Achievement Test in Mathematics
www.ijmsi.org 44 | P a g e
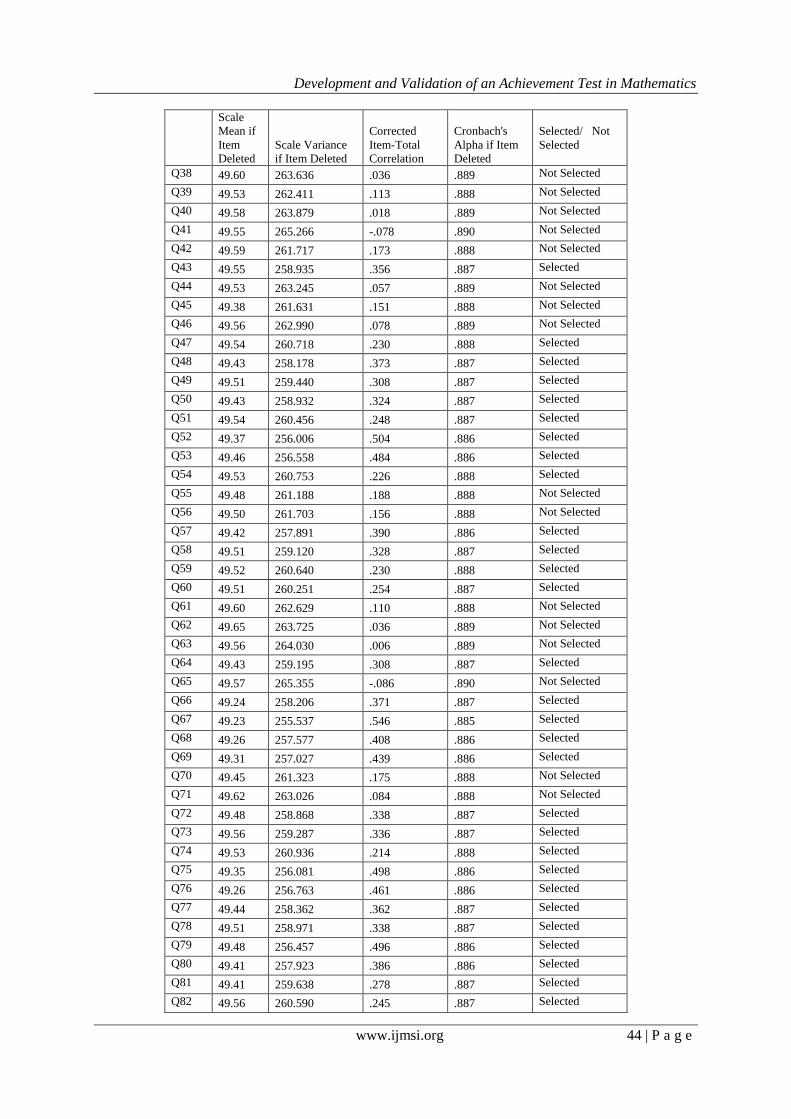
Scale
Mean if
Item
Deleted
Scale Variance
if Item Deleted
Corrected
Item-Total
Correlation
Cronbach's
Alpha if Item
Deleted
Selected/ Not
Selected
Q38 49.60 263.636 .036 .889 Not Selected
Q39 49.53 262.411 .113 .888 Not Selected
Q40 49.58 263.879 .018 .889 Not Selected
Q41 49.55 265.266 -.078 .890 Not Selected
Q42 49.59 261.717 .173 .888 Not Selected
Q43 49.55 258.935 .356 .887 Selected
Q44 49.53 263.245 .057 .889 Not Selected
Q45 49.38 261.631 .151 .888 Not Selected
Q46 49.56 262.990 .078 .889 Not Selected
Q47 49.54 260.718 .230 .888 Selected
Q48 49.43 258.178 .373 .887 Selected
Q49 49.51 259.440 .308 .887 Selected
Q50 49.43 258.932 .324 .887 Selected
Q51 49.54 260.456 .248 .887 Selected
Q52 49.37 256.006 .504 .886 Selected
Q53 49.46 256.558 .484 .886 Selected
Q54 49.53 260.753 .226 .888 Selected
Q55 49.48 261.188 .188 .888 Not Selected
Q56 49.50 261.703 .156 .888 Not Selected
Q57 49.42 257.891 .390 .886 Selected
Q58 49.51 259.120 .328 .887 Selected
Q59 49.52 260.640 .230 .888 Selected
Q60 49.51 260.251 .254 .887 Selected
Q61 49.60 262.629 .110 .888 Not Selected
Q62 49.65 263.725 .036 .889 Not Selected
Q63 49.56 264.030 .006 .889 Not Selected
Q64 49.43 259.195 .308 .887 Selected
Q65 49.57 265.355 -.086 .890 Not Selected
Q66 49.24 258.206 .371 .887 Selected
Q67 49.23 255.537 .546 .885 Selected
Q68 49.26 257.577 .408 .886 Selected
Q69 49.31 257.027 .439 .886 Selected
Q70 49.45 261.323 .175 .888 Not Selected
Q71 49.62 263.026 .084 .888 Not Selected
Q72 49.48 258.868 .338 .887 Selected
Q73 49.56 259.287 .336 .887 Selected
Q74 49.53 260.936 .214 .888 Selected
Q75 49.35 256.081 .498 .886 Selected
Q76 49.26 256.763 .461 .886 Selected
Q77 49.44 258.362 .362 .887 Selected
Q78 49.51 258.971 .338 .887 Selected
Q79 49.48 256.457 .496 .886 Selected
Q80 49.41 257.923 .386 .886 Selected
Q81 49.41 259.638 .278 .887 Selected
Q82 49.56 260.590 .245 .887 Selected
Development and Validation of an Achievement Test in Mathematics
www.ijmsi.org 45 | P a g e
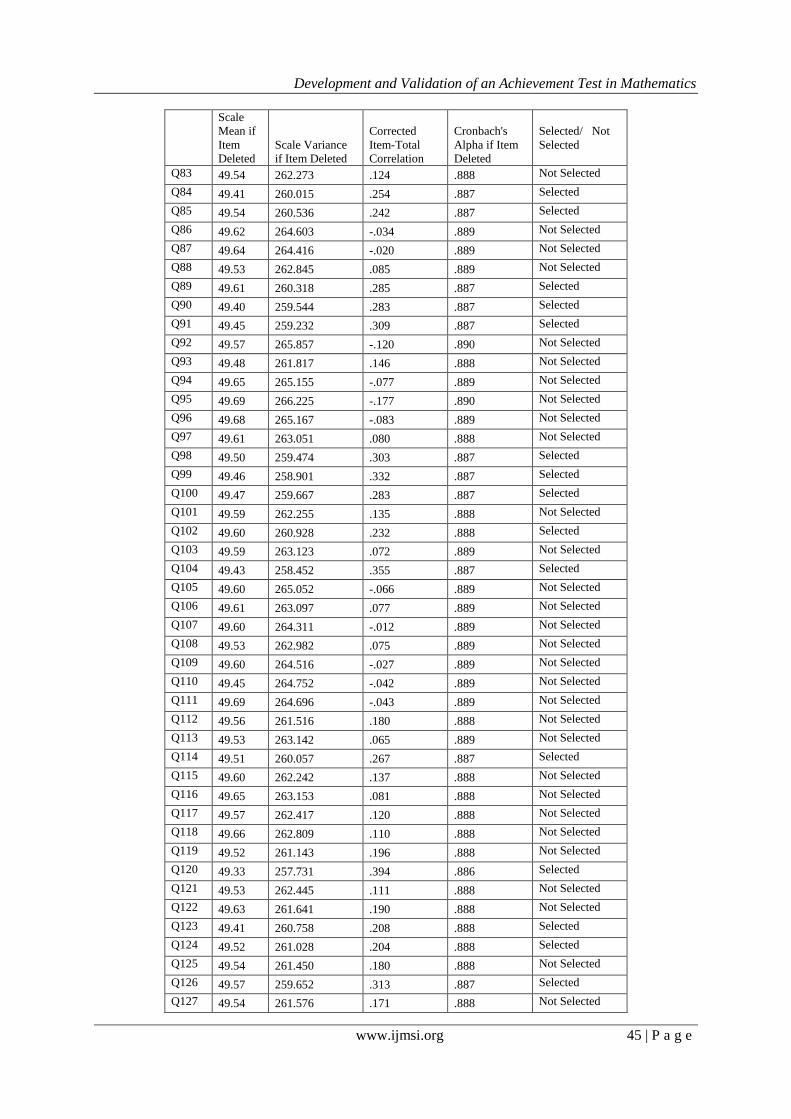
Scale
Mean if
Item
Deleted
Scale Variance
if Item Deleted
Corrected
Item-Total
Correlation
Cronbach's
Alpha if Item
Deleted
Selected/ Not
Selected
Q83 49.54 262.273 .124 .888 Not Selected
Q84 49.41 260.015 .254 .887 Selected
Q85 49.54 260.536 .242 .887 Selected
Q86 49.62 264.603 -.034 .889 Not Selected
Q87 49.64 264.416 -.020 .889 Not Selected
Q88 49.53 262.845 .085 .889 Not Selected
Q89 49.61 260.318 .285 .887 Selected
Q90 49.40 259.544 .283 .887 Selected
Q91 49.45 259.232 .309 .887 Selected
Q92 49.57 265.857 -.120 .890 Not Selected
Q93 49.48 261.817 .146 .888 Not Selected
Q94 49.65 265.155 -.077 .889 Not Selected
Q95 49.69 266.225 -.177 .890 Not Selected
Q96 49.68 265.167 -.083 .889 Not Selected
Q97 49.61 263.051 .080 .888 Not Selected
Q98 49.50 259.474 .303 .887 Selected
Q99 49.46 258.901 .332 .887 Selected
Q100 49.47 259.667 .283 .887 Selected
Q101 49.59 262.255 .135 .888 Not Selected
Q102 49.60 260.928 .232 .888 Selected
Q103 49.59 263.123 .072 .889 Not Selected
Q104 49.43 258.452 .355 .887 Selected
Q105 49.60 265.052 -.066 .889 Not Selected
Q106 49.61 263.097 .077 .889 Not Selected
Q107 49.60 264.311 -.012 .889 Not Selected
Q108 49.53 262.982 .075 .889 Not Selected
Q109 49.60 264.516 -.027 .889 Not Selected
Q110 49.45 264.752 -.042 .889 Not Selected
Q111 49.69 264.696 -.043 .889 Not Selected
Q112 49.56 261.516 .180 .888 Not Selected
Q113 49.53 263.142 .065 .889 Not Selected
Q114 49.51 260.057 .267 .887 Selected
Q115 49.60 262.242 .137 .888 Not Selected
Q116 49.65 263.153 .081 .888 Not Selected
Q117 49.57 262.417 .120 .888 Not Selected
Q118 49.66 262.809 .110 .888 Not Selected
Q119 49.52 261.143 .196 .888 Not Selected
Q120 49.33 257.731 .394 .886 Selected
Q121 49.53 262.445 .111 .888 Not Selected
Q122 49.63 261.641 .190 .888 Not Selected
Q123 49.41 260.758 .208 .888 Selected
Q124 49.52 261.028 .204 .888 Selected
Q125 49.54 261.450 .180 .888 Not Selected
Q126 49.57 259.652 .313 .887 Selected
Q127 49.54 261.576 .171 .888 Not Selected
Development and Validation of an Achievement Test in Mathematics
www.ijmsi.org 46 | P a g e
Scale
Mean if
Item
Deleted
Scale Variance
if Item Deleted
Corrected
Item-Total
Correlation
Cronbach's
Alpha if Item
Deleted
Selected/ Not
Selected
Q128 49.58 261.079 .216 .888 Selected
Q129 49.36 256.985 .441 .886 Selected
Q130 49.44 259.242 .307 .887 Selected
Q131 49.61 266.617 -.180 .890 Not Selected
Q132 49.67 265.079 -.074 .889 Not Selected
Q133 49.50 258.674 .356 .887 Selected
Q134 49.57 261.846 .160 .888 Not Selected
Q135 49.52 264.240 -.009 .889 Not Selected
Q136 49.63 263.183 .074 .889 Not Selected
Q137 49.60 261.464 .195 .888 Not Selected
Q138 49.63 260.407 .284 .887 Selected
Q139 49.62 262.614 .115 .888 Not Selected
Q140 49.46 260.227 .246 .887 Selected
Q141 49.59 263.490 .046 .889 Not Selected
Q142 49.49 258.011 .398 .886 Selected
Q143 49.37 258.771 .329 .887 Selected
Q144 49.62 263.129 .076 .889 Not Selected
Q145 49.55 263.895 .015 .889 Not Selected
Q146 49.48 258.983 .331 .887 Selected
Q147 49.56 261.105 .209 .888 Selected
Q148 49.38 257.367 .418 .886 Selected
Q149 49.62 264.306 -.012 .889 Not Selected
Q150 49.49 260.731 .219 .888 Selected