Embed Size (px)
Citation preview
DEVELOPMENT OF A DATABASE FOR ALTERNATIVE JET FUELS
BY
SIDDHARTHA JAHORIE
THESIS
Submitted in partial fulfillment of the requirements
for the degree of Master of Science in Mechanical Engineering
in the Graduate College of the
University of Illinois at Urbana-Champaign, 2018
Urbana, Illinois
Adviser:
Professor Tonghun Lee
ii
ABSTRACT
This work describes the development and benefits of a database for alternative jet fuels.
Data on alternative jet fuels, conventional jet fuels and blends of alternative and conventional jet
fuels were collected from the Air Force Research Lab, Metron Aviation and Petroleum Quality
Information System. This data was converted to a JSON (JavaScript Object Notation) form and
uploaded to the nonrelational database, DynamoDB. Accessing this data with python scripts,
various graphs were produced to analyze data. Stacked histograms were used to visually represent
fuel composition and to better understand how the production pathway influences the chemical
composition of the fuel. Distillation curves and boxplots were used to identify and isolate
erroneous data, and Multivariate Linear Regression analysis was performed to understand the
relationship among various fuel properties.

iii
ACKNOWLEDGEMENTS
I would like to express my gratitude to my adviser, Dr. Tonghun Lee, for his guidance
and support throughout my time as a graduate student.
This work would not be possible without the help of my lab mates. You all took the time
to orient me with the lab, explain concepts and even helped me with courses. It was fun spending
time with all of you. In particular, I would like to thank, Anna Oldani, who worked on
developing the alternative jet fuels database with me and whose keen organizational skills kept
the project on track.
Finally, I would like to thank my family who have always supported and encouraged
throughout my life.

iv
TABLE OF CONTENTS
LIST OF FIGURES ....................................................................................................................... vi
LIST OF TABLES ........................................................................................................................ vii
CHAPTER 1: INTRODUCTION ............................................................................................. 1
1.1. Background and Motivation ............................................................................................. 1
1.2. Database fundamentals ..................................................................................................... 5
1.2.1. Relational vs Non-Relational Databases ................................................................... 5
CHAPTER 2: DATABASE AND FUEL DATA ..................................................................... 8
2.1. Selection of Database Service .......................................................................................... 8
2.2. Collection of Data ............................................................................................................ 9
2.3. NJFCP Fuels ................................................................................................................... 11
2.4. Conventional Jet Fuels Nomenclature............................................................................ 13
CHAPTER 3: FUEL DATA AND TESTS ............................................................................. 14
3.1. Acidity ............................................................................................................................ 14
3.2. Aromatic Content ........................................................................................................... 14
3.3. Cetane Number ............................................................................................................... 15
3.4. Copper Corrosion ........................................................................................................... 16
3.5. Density ........................................................................................................................... 16
3.6. Distillation ...................................................................................................................... 17
3.7. Electrical Conductivity ................................................................................................... 17
3.8. Flash Point ...................................................................................................................... 18
3.9. Freezing Point ................................................................................................................ 18
3.10. Heat of Combustion .................................................................................................... 18
3.11. Thermal Stability ........................................................................................................ 19
3.12. Viscosity ..................................................................................................................... 20
3.13. Two-dimensional gas chromatography (GCxGC) ...................................................... 22
CHAPTER 4: ANALYSIS OF FUEL DATA ........................................................................ 23
4.1. Composition Histograms ................................................................................................ 23
4.2. Distillation Curves.......................................................................................................... 30
4.3. Boxplots ......................................................................................................................... 34
4.3.1. Heat of Combustion ................................................................................................ 34
v
4.3.2. Density .................................................................................................................... 37
4.3.3. Aromatics Content .................................................................................................. 38
4.4. Multivariate Linear Regression ...................................................................................... 39
CHAPTER 5: CONCLUSION ............................................................................................... 45
5.1. Future Studies ................................................................................................................. 45
REFERENCES ............................................................................................................................. 47
APPENDIX A: Guidelines for converting AFRL laboratory reports to excel tables ................... 51
APPENDIX B: Python scripts for extracting AFRL fuel data from excel files ........................... 54
vi
LIST OF FIGURES
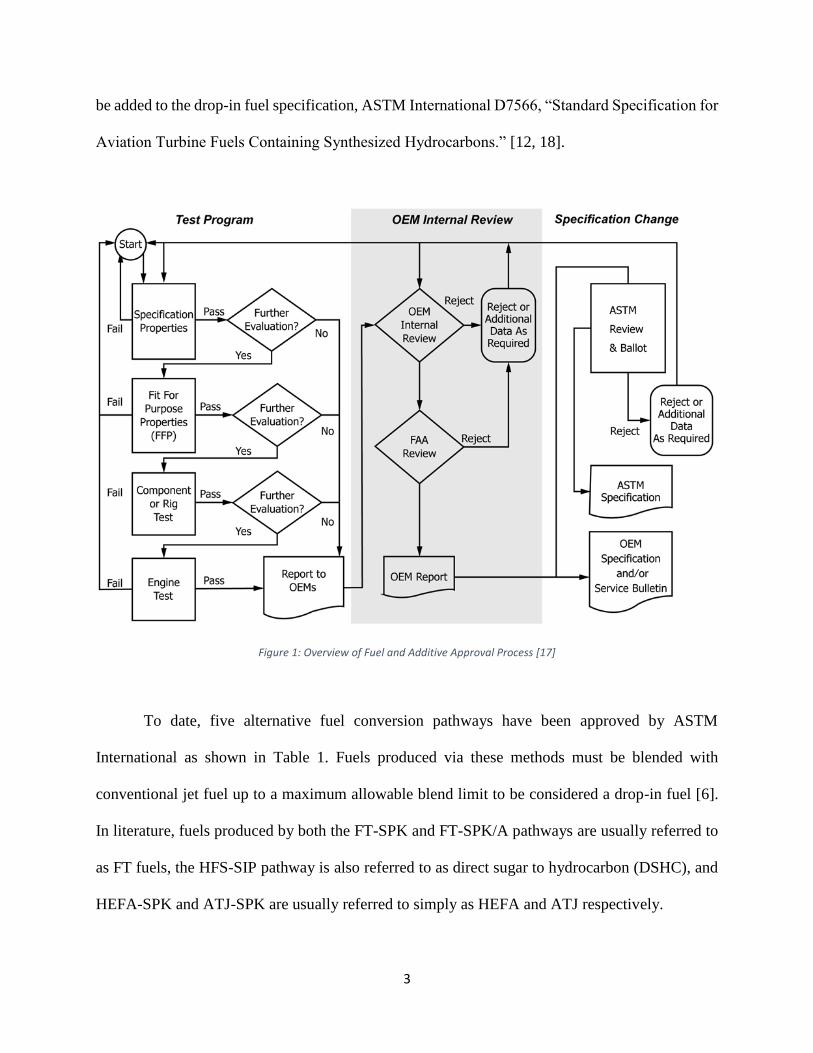
Figure 1: Overview of Fuel and Additive Approval Process [17] .................................................. 3
Figure 2: Conversion Process of AFRL laboratory reports from pdf reports to excel tables to
serialized JSON files ..................................................................................................................... 10
Figure 3: Tube deposit visual rating scale [36] ............................................................................. 20
Figure 4: GCxGC analysis for Category A conventional fuels .................................................... 24
Figure 5: GCxGC analysis for Category C fuels .......................................................................... 25
Figure 6: GCxGC analysis of Fischer-Tropsch (FT) fuels and an FT fuel blend ......................... 26
Figure 7: GCxGC analysis of Hydroprocessed fermented sugars to synthesized iso-parafins (SIP)
and SIP blends............................................................................................................................... 28
Figure 8: GCxGC analysis of alcohol-to-jet (ATJ) fuels .............................................................. 29
Figure 9: Distillation temperatures of category A and category C fuels as well as average
distillation temperatures for all AFRL fuels ................................................................................. 31
Figure 10: Distillation temperature of PQIS fuels ........................................................................ 32
Figure 11: Distillation temperatures averaged by airport for data collected from Metron Aviation
....................................................................................................................................................... 33
Figure 12: Heat of combustion boxplots by airport for unedited Metron Aviation data .............. 34
Figure 13: Heat of combustion boxplots by airport for adjusted Metron Aviation data............... 36
Figure 14: Density boxplot for AFRL fuels .................................................................................. 37
Figure 15: Aromatics boxplot for PQIS data ................................................................................ 38
Figure 16: Showing scatterplots and Pearson correlation coefficients for four CPTs: derived
cetane number, molecular weight, hydrogen to carbon ratio and smoke point ............................ 41
vii
LIST OF TABLES
Table 1: Approved Alternative Fuel Production Pathways [6] ....................................................... 4
Table 2: Comparison of relational and non-relational databases .................................................... 7
Table 3: Desired and actual properties of category A fuels .......................................................... 12
Table 4: Category C fuels ............................................................................................................. 12
Table 5: Copper Strip Classifications according to ASTM D130 ................................................ 16
Table 6: Fuel properties and corresponding ASTM and other international standard tests .......... 20
Table 7: Fuel composition of farnesane fuel blends ..................................................................... 30
Table 8: Outlier points for heat of combustion from Metron Aviation data ................................. 35
Table 9: Data used for Multivariate Linear Regression analysis .................................................. 40
Table 10: MLR coefficients for key combustion properties in the form Y = β0 + β1*DCN + β2 *
MW + β3*H/C ratio ....................................................................................................................... 42
Table 11: Multivariate Linear Regression for Heat of Combustion ............................................. 43
Table 12: Multivariate Linear Regression for Freezing Point ...................................................... 43
Table 13: Multivariate Linear Regression for Flash Point............................................................ 44
Table 14: Multivariate Linear Regression for Kinematic Viscosity ............................................. 44
1
CHAPTER 1: INTRODUCTION
1.1. Background and Motivation
Combustion engines are an essential part of today’s society, providing the bulk of our
energy and transportation needs. However, in recent times, concerns of the impact of combustion
emissions on human health and the environment have been raised. The most detrimental of these
emissions include carbon dioxide (CO2), nitrogen oxides (NOx) and particulate matter (PM) [1].
As possible alternatives to reduce harmful emissions from combustion are considered, an often
ignored sector is the aviation sector. Globally, air transportation consumes about 5 million barrels
of oil daily [2] and accounts for 2-3% of total CO2 emissions and 3% of NOx emissions from the
transportation sector [3]. Although this contribution to emissions may seem small compared to
other transportation sectors, the rapid growth of the aviation sector must also be accounted for.
Within the transportation sector, aviation is predicted to have the largest growth rate in energy
demand over the next 20 years [2]. The international air transport association also expects the
number of aircraft passengers to increase from 2.4 billion to 16 billion from 2010 to 2050 [4].
Additionally, the U.S. Air Force uses approximately 2 billion gallons of aviation fuel every year
and emits about 35 million metric tons of CO2. With growing environmental concerns, the U.S.
Air Force intends to move to cleaner sources of energy. However, these new energy sources must
be resilient, reliable and cost competitive [5].
Alternative jet fuels (AJFs) may be the answer to balancing economic, security and
environmental concerns. AJFs are jet fuels which are produced via nonconventional biochemical
and thermochemical process. These fuels are also primarily produced from nonpetroleum sources
[6]. Many studies have already been done to demonstrate the environmental benefits of AJFs [7,
2
8, 9, 10, 11]. In particular, AJFs are inherently low in particulate matter, void of sulfur and can
produce significant reductions in CO2 emissions depending on the method and feedstock used to
produce the AJF [12].
Many international organizations have already endorsed the development of AJFs. In 2006,
the Commercial Aviation Alternative Fuels Initiative (CAAFI) was formed to enhance energy
security and environmental sustainability by promoting research and development of AJFs.
CAAFI was cosponsored by Aerospace Industries Association, Airports Council International-
North America, Airlines for America and the U.S. Federal Aviation Administration (FAA) [13].
In 2008, the European Union also launched a program, Alternative Fuels and Biofuels for Aircraft
Development (ALFA-BIRD), to promote the development of AJFs [14]. In 2009, the International
Civil Aviation Organization (ICAO) identified the use of AJFs as an important step in reducing
aviation emissions. Furthermore, the adoption of resolution A37-19 during the 37th ICAO
Assembly encouraged member states to accelerate the development and deployment of AJFs [15].
The U.S. Air Force 2013 strategic plan also stated an objective to use 50% alternative aviation fuel
blends for all non-contingency missions by 2025 [16].
With strong motivations to study AJFs, ASTM International (formerly the American
Society for Testing Materials) developed a qualification procedure for new aviation fuels. This
standard, which was recently updated in December 2014, was designated as ASTM International
D4054-14, “Standard practice for the Qualification of and Approval of New Aviation Turbine
Fuels and Fuel Additives” [12, 17]. Once a new fuel is found to be sufficiently similar to
conventional jet fuel, it is referred to as a drop-in fuel. ‘Drop-in’ fuels are defined as fuels that are
completely interchangeable with conventional jet fuels and do not require any modifications to
current engine designs [16]. The process used to create the fuel, known as the pathway, may then
3
be added to the drop-in fuel specification, ASTM International D7566, “Standard Specification for
Aviation Turbine Fuels Containing Synthesized Hydrocarbons.” [12, 18].
Figure 1: Overview of Fuel and Additive Approval Process [17]
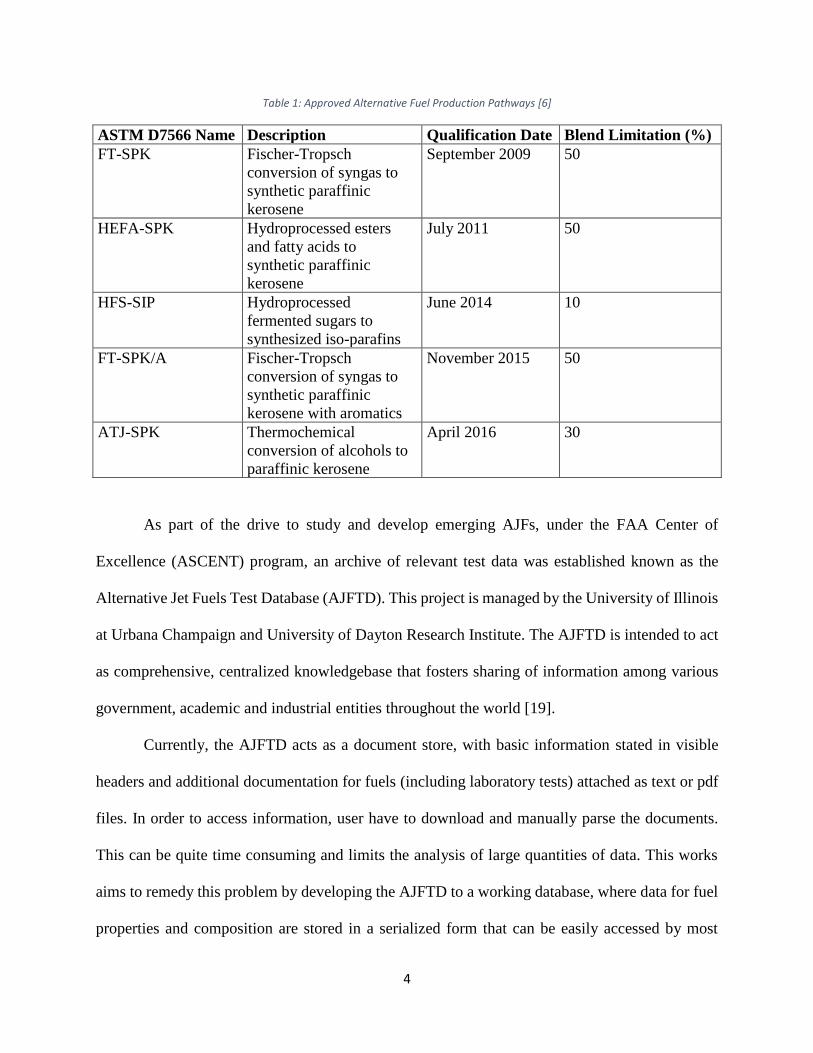
To date, five alternative fuel conversion pathways have been approved by ASTM
International as shown in Table 1. Fuels produced via these methods must be blended with
conventional jet fuel up to a maximum allowable blend limit to be considered a drop-in fuel [6].
In literature, fuels produced by both the FT-SPK and FT-SPK/A pathways are usually referred to
as FT fuels, the HFS-SIP pathway is also referred to as direct sugar to hydrocarbon (DSHC), and
HEFA-SPK and ATJ-SPK are usually referred to simply as HEFA and ATJ respectively.
4
Table 1: Approved Alternative Fuel Production Pathways [6]
ASTM D7566 Name Description Qualification Date Blend Limitation (%)
FT-SPK Fischer-Tropsch
conversion of syngas to
synthetic paraffinic
kerosene
September 2009 50
HEFA-SPK Hydroprocessed esters
and fatty acids to
synthetic paraffinic
kerosene
July 2011 50
HFS-SIP Hydroprocessed
fermented sugars to
synthesized iso-parafins
June 2014 10
FT-SPK/A Fischer-Tropsch
conversion of syngas to
synthetic paraffinic
kerosene with aromatics
November 2015 50
ATJ-SPK Thermochemical
conversion of alcohols to
paraffinic kerosene
April 2016 30
As part of the drive to study and develop emerging AJFs, under the FAA Center of
Excellence (ASCENT) program, an archive of relevant test data was established known as the
Alternative Jet Fuels Test Database (AJFTD). This project is managed by the University of Illinois
at Urbana Champaign and University of Dayton Research Institute. The AJFTD is intended to act
as comprehensive, centralized knowledgebase that fosters sharing of information among various
government, academic and industrial entities throughout the world [19].
Currently, the AJFTD acts as a document store, with basic information stated in visible
headers and additional documentation for fuels (including laboratory tests) attached as text or pdf
files. In order to access information, user have to download and manually parse the documents.
This can be quite time consuming and limits the analysis of large quantities of data. This works
aims to remedy this problem by developing the AJFTD to a working database, where data for fuel
properties and composition are stored in a serialized form that can be easily accessed by most
5
programming languages. It is also envisioned that basic querying operations will be integrated into
the website, which will allow users to filter fuels based on selected fuel property and composition
specifications. By providing tools to enable faster and more comprehensive analysis of jet fuel
data, this work hopes to advance and accelerate the development and approval of new AJFs.
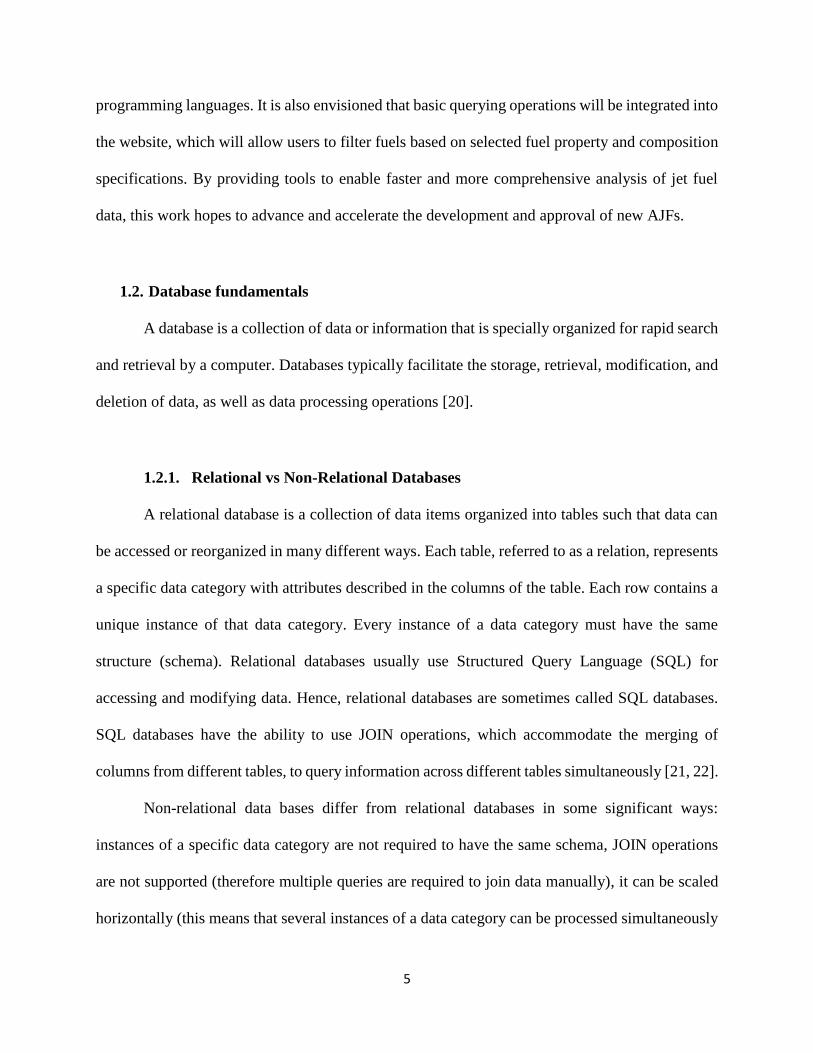
1.2. Database fundamentals
A database is a collection of data or information that is specially organized for rapid search
and retrieval by a computer. Databases typically facilitate the storage, retrieval, modification, and
deletion of data, as well as data processing operations [20].
1.2.1. Relational vs Non-Relational Databases
A relational database is a collection of data items organized into tables such that data can
be accessed or reorganized in many different ways. Each table, referred to as a relation, represents
a specific data category with attributes described in the columns of the table. Each row contains a
unique instance of that data category. Every instance of a data category must have the same
structure (schema). Relational databases usually use Structured Query Language (SQL) for
accessing and modifying data. Hence, relational databases are sometimes called SQL databases.
SQL databases have the ability to use JOIN operations, which accommodate the merging of
columns from different tables, to query information across different tables simultaneously [21, 22].
Non-relational data bases differ from relational databases in some significant ways:
instances of a specific data category are not required to have the same schema, JOIN operations
are not supported (therefore multiple queries are required to join data manually), it can be scaled
horizontally (this means that several instances of a data category can be processed simultaneously
6
on different servers) and SQL is not used as the query language. They are also called NoSQL
databases, meaning Not Only SQL or Not SQL. NoSQL databases can be divided into four main
categories: (1) column oriented databases, (2) key value stores, (3) document stores and (4) graph
databases. Column oriented databases are made of tables, similar to relational databases, and all
values in a column are serialized together. Key value stores consist of a key-value pairs where the
key is represented by a string, and a value, which is the actual data, can be any programming
language primitive (the simplest elements of a programming language). Document stores or
document oriented databases assume that data is encoded in a standard format, called a document.
Each document has a unique key and a query language is provided for fast retrieval of the
document on the basis of its content. Graph databases are schema-less databases in the form of
graphs with nodes, edges and properties. Nodes represents specific entities, the properties are the
data associated with a node and edges connect nodes based on some property [21, 22, 23].
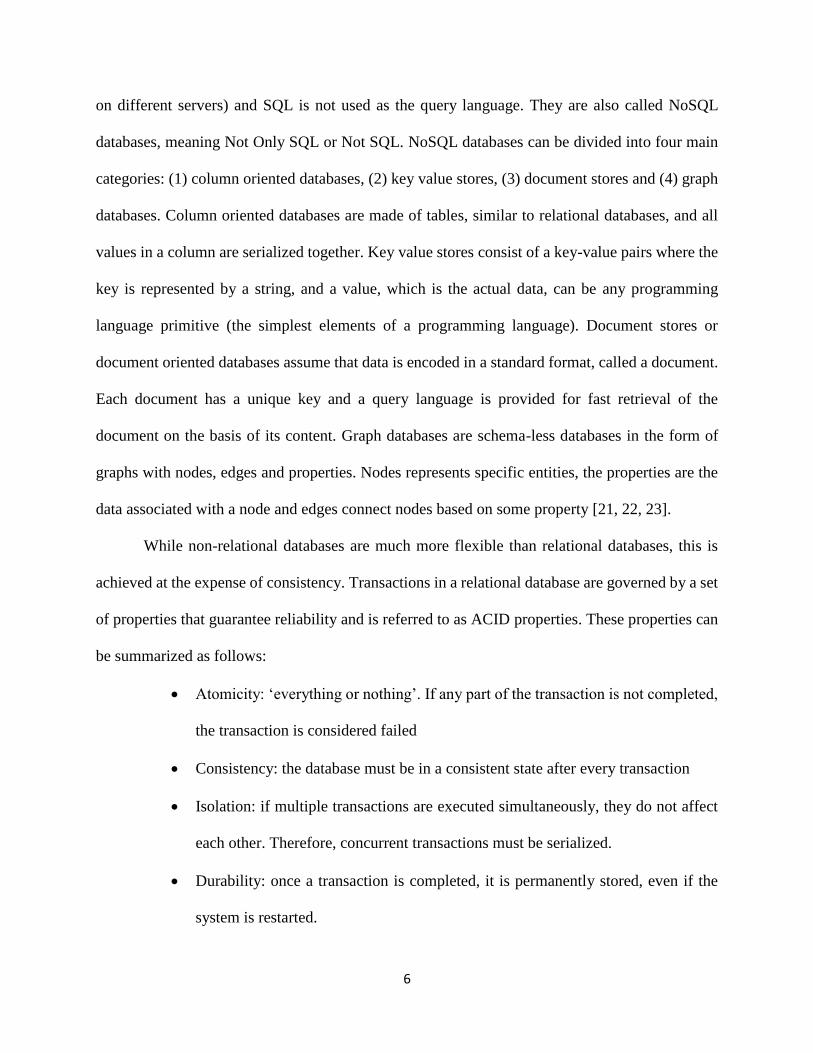
While non-relational databases are much more flexible than relational databases, this is
achieved at the expense of consistency. Transactions in a relational database are governed by a set
of properties that guarantee reliability and is referred to as ACID properties. These properties can
be summarized as follows:
• Atomicity: ‘everything or nothing’. If any part of the transaction is not completed,
the transaction is considered failed
• Consistency: the database must be in a consistent state after every transaction
• Isolation: if multiple transactions are executed simultaneously, they do not affect
each other. Therefore, concurrent transactions must be serialized.
• Durability: once a transaction is completed, it is permanently stored, even if the
system is restarted.
7
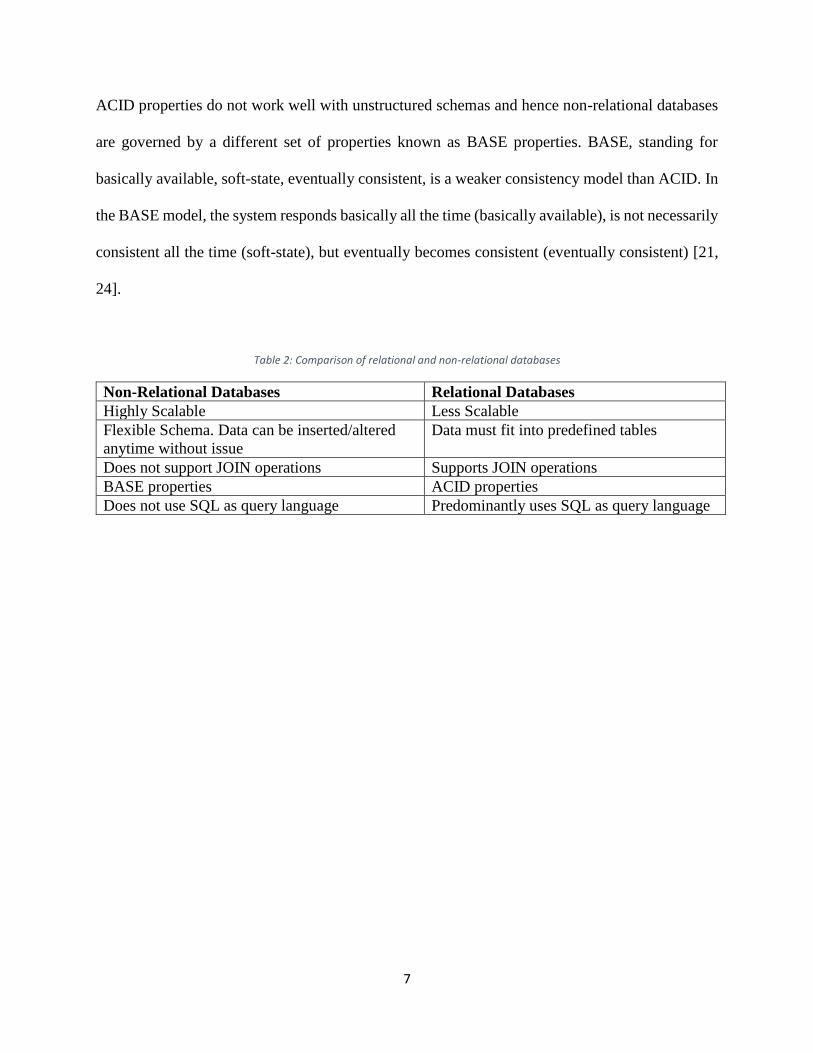
ACID properties do not work well with unstructured schemas and hence non-relational databases
are governed by a different set of properties known as BASE properties. BASE, standing for
basically available, soft-state, eventually consistent, is a weaker consistency model than ACID. In
the BASE model, the system responds basically all the time (basically available), is not necessarily
consistent all the time (soft-state), but eventually becomes consistent (eventually consistent) [21,
24].
Table 2: Comparison of relational and non-relational databases
Non-Relational Databases Relational Databases
Highly Scalable Less Scalable
Flexible Schema. Data can be inserted/altered
anytime without issue
Data must fit into predefined tables
Does not support JOIN operations Supports JOIN operations
BASE properties ACID properties
Does not use SQL as query language Predominantly uses SQL as query language
8
CHAPTER 2: DATABASE AND FUEL DATA
2.1. Selection of Database Service
For this project, a decision was made to use a NoSQL database for two major reasons.
Firstly, documents and reports gathered for fuels had different formats and varying amounts of
data. For example, data for one fuel may include viscosity, density and heat of combustion, while
data for another fuel may only include density. Furthermore, multiple tests may be performed for
a single fuel property. Data for one fuel may include 5 measurements of viscosity, while data for
another may only include 1. Due to these considerations, a flexible schema was considered to be
of primary importance when selecting a database service. Secondly, this project was done as part
of an initiative by the FAA to develop a centralized knowledgebase of AJF data. One of the goals
of this initiative included collaboration with a European Agency, JETSCREEN (JET fuel
SCREENing and optimization), which also studies AJFs. JETSCREEN’s AJF data is already
hosted by MongoDB, a NoSQL database service. Since MongoDB uses an unstructured schema,
interfacing with a SQL database using a fixed schema would impose greater complexity compared
to interfacing with a NoSQL database. While this work does not directly involve interfacing with
JETSCREEN, the overall goals and directives of the larger initiative must be considered.
While the most straightforward way to interface with JETSCREEN would be to use the
same database service (MongoDB), DynamoDB was selected for this project for several logistical
reasons. Using university resources, DynamoDB was the easiest NoSQL database service to use.
Firstly, the University of Illinois has an agreement with Amazon AWS, which provides the
DynamoDB service. As such, Amazon AWS representatives are present on campus to assist in the
setup of the database and handle any potential problems. Since the IT services at the university
9
does not have any staff experienced with NoSQL databases, implementation of any other NoSQL
database would have to be done in-house or arranged with an external organization. MongoDB is
notoriously difficult to setup and therefore it was decided to avoid doing this in-house. Using an
external organization would also involve additional challenges as this organization would need the
right clearances to work with government data. This was not an issue with DynamoDB due to their
partnership with the University of Illinois. Since DynamoDB and MongoDB both store data in the
JSON (JavaScript Object Notation) format, interfacing between the two services is not expected
to be difficult.
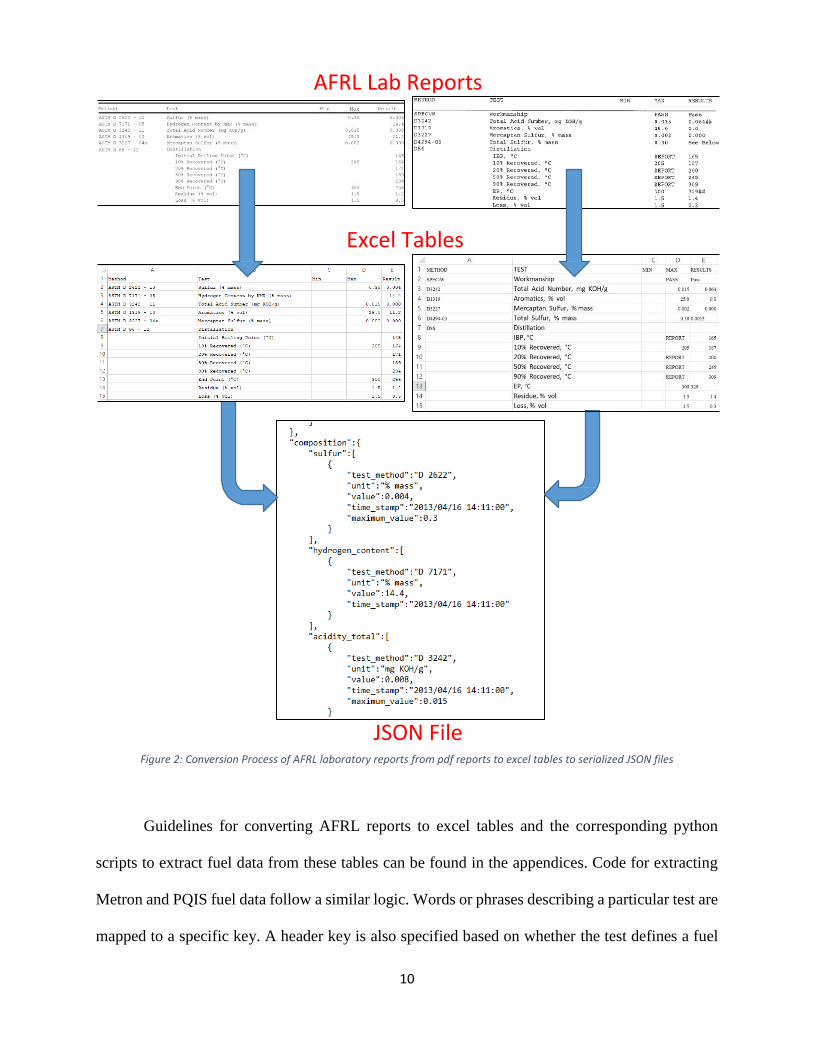
2.2. Collection of Data
Jet fuel data was received from the Air Force Research Laboratory (AFRL), Metron
Aviation and the Petroleum Quality Information System (PQIS), which is managed by the Defense
Logistics Agency (DLA). Data received from ARFL was in the form of pdf documents. These
documents were converted to excel documents using the Able2Extract software. While the
conversion of most documents was straightforward, excel tables had to be manually created for
some older, scanned reports. Figure 2 demonstrates this process. Each pdf laboratory report is
converted to an excel file, then all the excel files for a particular fuel is combined to create a single
serialized JSON file. Data from Metron Aviation and PQIS were received in excel form and
directly converted to JSON files. Scripts were written in python to extract the relevant information
and create serialized JSON documents.
10
Figure 2: Conversion Process of AFRL laboratory reports from pdf reports to excel tables to serialized JSON files
Guidelines for converting AFRL reports to excel tables and the corresponding python
scripts to extract fuel data from these tables can be found in the appendices. Code for extracting
Metron and PQIS fuel data follow a similar logic. Words or phrases describing a particular test are
mapped to a specific key. A header key is also specified based on whether the test defines a fuel
AFRL Lab Reports
Excel Tables
JSON File
11
property or measures the quantity of something in a fuel (composition). The value and unit
assigned to the test is found and stored using the unique pair of keys. Multiple tests of the same
property or composition measurement are differentiated by a timestamp. The keys used for
mapping fuel tests and the overall JSON schema is the same as that use by JETSCREEN which
facilitates the possibility of sharing information.
2.3. NJFCP Fuels
The fuels obtained from AFRL are particularly important. They are part of the National Jet
Fuels Combustion Program (NJFCP), a program created to enhance AJFs research by removing
redundancies among academic, industrial and government agencies. By evaluating reference fuels
through a series of laboratory and rig tests, it is hoped to obtain a better understanding of AJFs.
Two important categories of reference fuels are defined: Category A and Category C. Category A
fuels are conventional jet fuels derived from petroleum sources. They were designed to have
specific values of flash point, viscosity and aromatics content that are representative of the fuel
variations seen in practice as shown in Table 3. These fuel properties were selected as they were
expected to have the greatest impact on combustion behavior. Category C fuels were designed to
test hydrocarbons with unusual properties and explore the extreme limits of acceptable jet fuel
properties/composition. The AFRL fuels include several conventional and alternative fuels, as well
as blends and fuels with various additives. Specific batches of fuels are identified by an AFRL
identification number (or POSF number) in the form POSF XXXXX. POSF is not an acronym and
simply denotes the AFRL’s Fuels branch from 1981 [25].
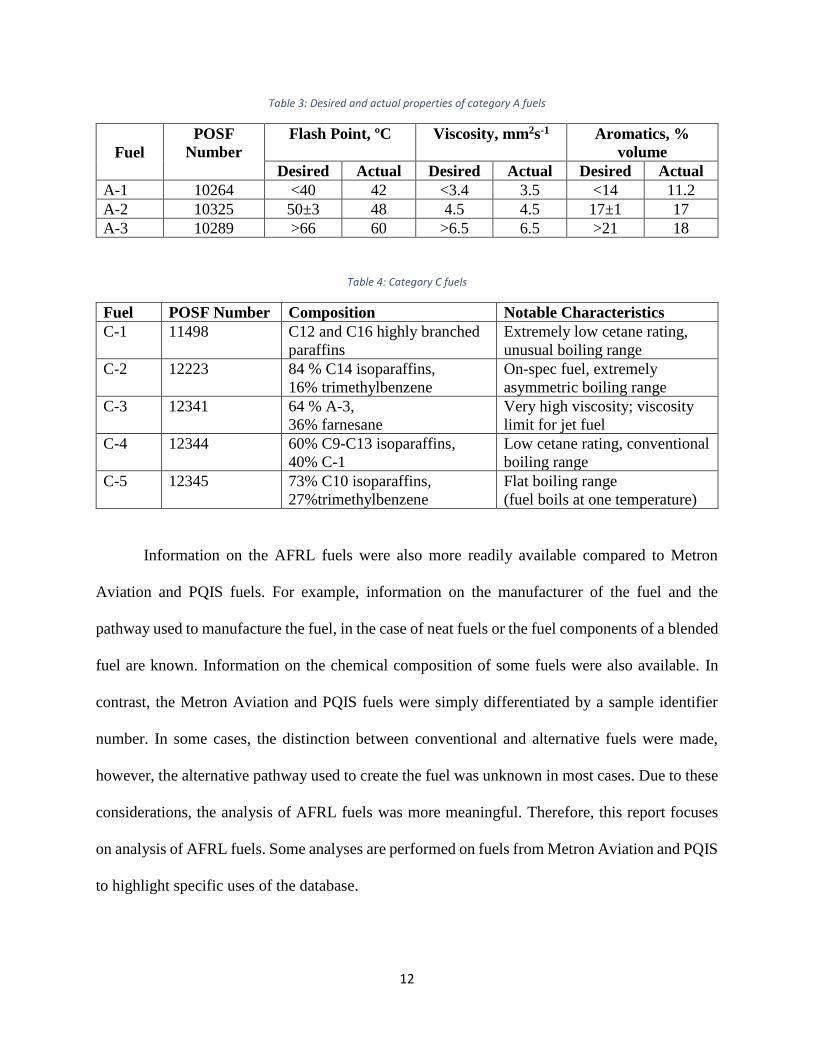
12
Table 3: Desired and actual properties of category A fuels
Fuel
POSF
Number
Flash Point, ºC Viscosity, mm2s-1 Aromatics, %
volume
Desired Actual Desired Actual Desired Actual
A-1 10264 <40 42 <3.4 3.5 <14 11.2
A-2 10325 50±3 48 4.5 4.5 17±1 17
A-3 10289 >66 60 >6.5 6.5 >21 18
Table 4: Category C fuels
Fuel POSF Number Composition Notable Characteristics
C-1 11498 C12 and C16 highly branched
paraffins
Extremely low cetane rating,
unusual boiling range
C-2 12223 84 % C14 isoparaffins,
16% trimethylbenzene
On-spec fuel, extremely
asymmetric boiling range
C-3 12341 64 % A-3,
36% farnesane
Very high viscosity; viscosity
limit for jet fuel
C-4 12344 60% C9-C13 isoparaffins,
40% C-1
Low cetane rating, conventional
boiling range
C-5 12345 73% C10 isoparaffins,
27%trimethylbenzene
Flat boiling range
(fuel boils at one temperature)
Information on the AFRL fuels were also more readily available compared to Metron
Aviation and PQIS fuels. For example, information on the manufacturer of the fuel and the
pathway used to manufacture the fuel, in the case of neat fuels or the fuel components of a blended
fuel are known. Information on the chemical composition of some fuels were also available. In
contrast, the Metron Aviation and PQIS fuels were simply differentiated by a sample identifier
number. In some cases, the distinction between conventional and alternative fuels were made,
however, the alternative pathway used to create the fuel was unknown in most cases. Due to these
considerations, the analysis of AFRL fuels was more meaningful. Therefore, this report focuses
on analysis of AFRL fuels. Some analyses are performed on fuels from Metron Aviation and PQIS
to highlight specific uses of the database.
13
2.4. Conventional Jet Fuels Nomenclature
JP-8, JP-5, JP-7, JP-TS, Jet A and Jet A-1 are conventional gas turbine fuels used in air
breathing engines. JP-8 is the primary fuel used by the U.S. Air Force. Jet A/A-1 are commercial
equivalents of JP-8. JP-8 differs from Jet A/A-1 in the additives that are included in JP-8 to meet
the military specifications for jet fuels. Jet A-1 is almost exactly the same as Jet A, but has lower
freezing point and normally contains a static dissipater additive. Jet A is required to have a freezing
point of -40 ºC or lower, while Jet A-1 is required to have a freezing point of -47 ºC or lower. JP-
5 is the primary fuels used by the U.S. Navy. This fuel has a higher flash point to make it safer for
naval vessels. JP-7 and JP-TS are specialty fuels designed for the SR-71 Blackbird and U-2
aircrafts respectively. Their thermal stability and cold flow characteristics are superior to those of
JP-8 and Jet A/A-1. The reference fuels A-1, A-2 and A-3 are JP-8, Jet A and JP-5 grade fuels
respectively [26, 27].
14
CHAPTER 3: FUEL DATA AND TESTS
This section provides an overview of some of the most common fuel data collected for
this project, their significance and the relevant ASTM tests used. A more extensive list of fuel
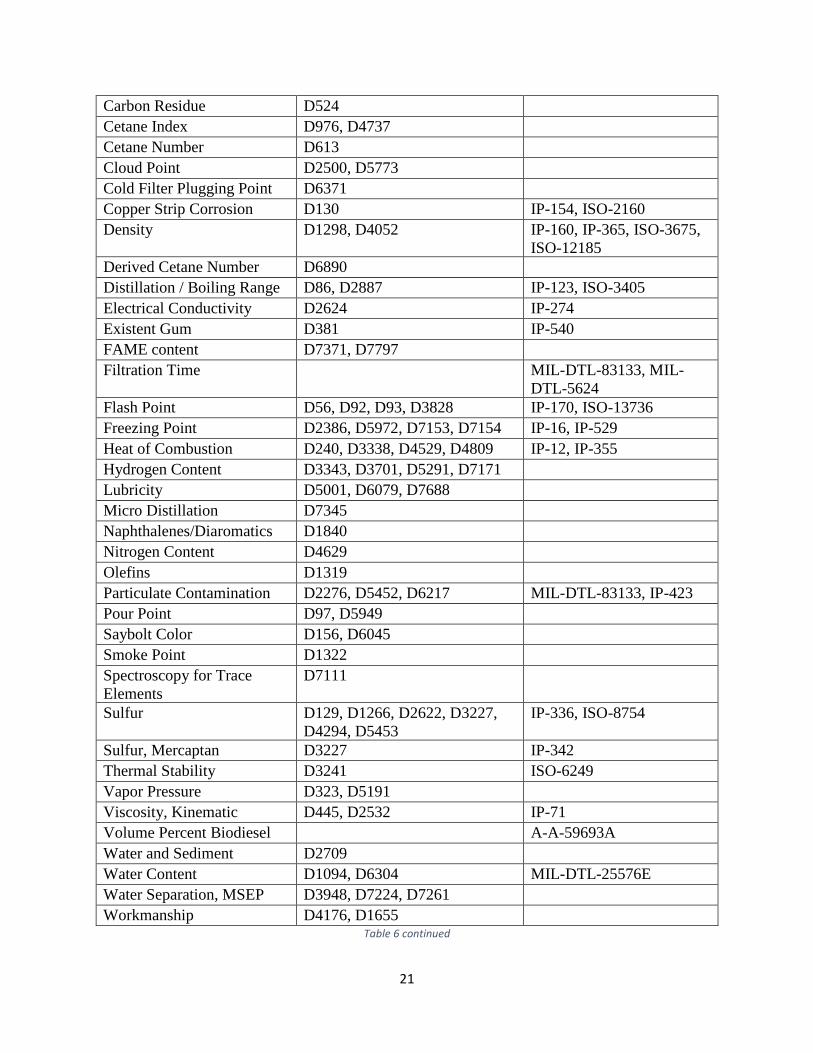
properties and corresponding standards are provided in Table 6.
3.1. Acidity
The acidity or acid number is a measure of the amount of carboxylic acid groups present
in the fuel. It quantifies the amount of acid present and is measured in milligrams of potassium
hydroxide required to neutralize the acid present in one gram of a sample. Acid in the fuel can lead
to severe corrosion of the fuel supply system. In lubricating oils, the acid umber is used as a
measure of degradation of the oil. It must be noted that the ASTM 664 standard states that there is
no general correlation between acid number and the corrosive tendency of the fuel towards metals.
This is because the acid number only measures the amount of acid in a sample and does not
differentiate between strong and weak acidic components [28, 29].
3.2. Aromatic Content
Aromatics have poorer combustion characteristics compared to paraffins and
cycloparaffins and increase the tendency of a fuel to produce soot. Despite these undesirable
characteristics, fuels with very low aromatics content may cause the elastomer seals in engines to
shrink and fail [26, 30].
15
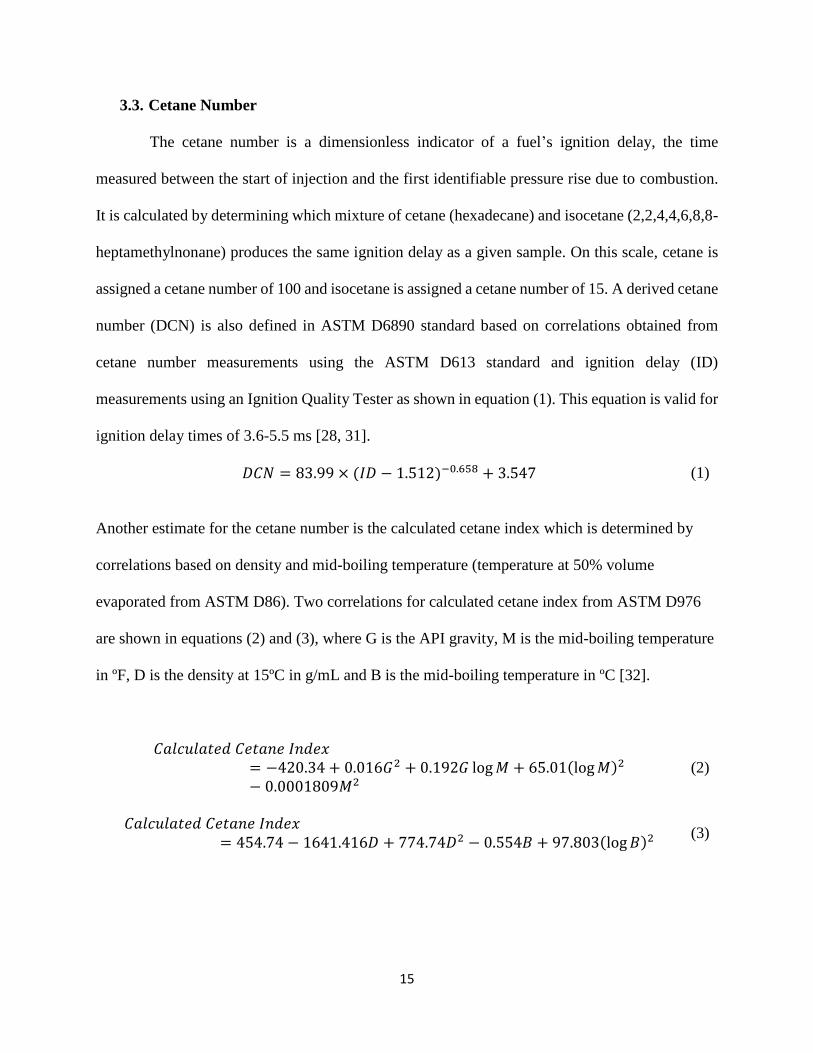
3.3. Cetane Number
The cetane number is a dimensionless indicator of a fuel’s ignition delay, the time
measured between the start of injection and the first identifiable pressure rise due to combustion.
It is calculated by determining which mixture of cetane (hexadecane) and isocetane (2,2,4,4,6,8,8-
heptamethylnonane) produces the same ignition delay as a given sample. On this scale, cetane is
assigned a cetane number of 100 and isocetane is assigned a cetane number of 15. A derived cetane
number (DCN) is also defined in ASTM D6890 standard based on correlations obtained from
cetane number measurements using the ASTM D613 standard and ignition delay (ID)
measurements using an Ignition Quality Tester as shown in equation (1). This equation is valid for
ignition delay times of 3.6-5.5 ms [28, 31].
𝐷𝐶𝑁 = 83.99 × (𝐼𝐷 − 1.512)−0.658 + 3.547 (1)
Another estimate for the cetane number is the calculated cetane index which is determined by
correlations based on density and mid-boiling temperature (temperature at 50% volume
evaporated from ASTM D86). Two correlations for calculated cetane index from ASTM D976
are shown in equations (2) and (3), where G is the API gravity, M is the mid-boiling temperature
in ºF, D is the density at 15ºC in g/mL and B is the mid-boiling temperature in ºC [32].
𝐶𝑎𝑙𝑐𝑢𝑙𝑎𝑡𝑒𝑑 𝐶𝑒𝑡𝑎𝑛𝑒 𝐼𝑛𝑑𝑒𝑥= −420.34 + 0.016𝐺2 + 0.192𝐺 log 𝑀 + 65.01(log 𝑀)2
− 0.0001809𝑀2
(2)
𝐶𝑎𝑙𝑐𝑢𝑙𝑎𝑡𝑒𝑑 𝐶𝑒𝑡𝑎𝑛𝑒 𝐼𝑛𝑑𝑒𝑥= 454.74 − 1641.416𝐷 + 774.74𝐷2 − 0.554𝐵 + 97.803(log 𝐵)2
(3)
16
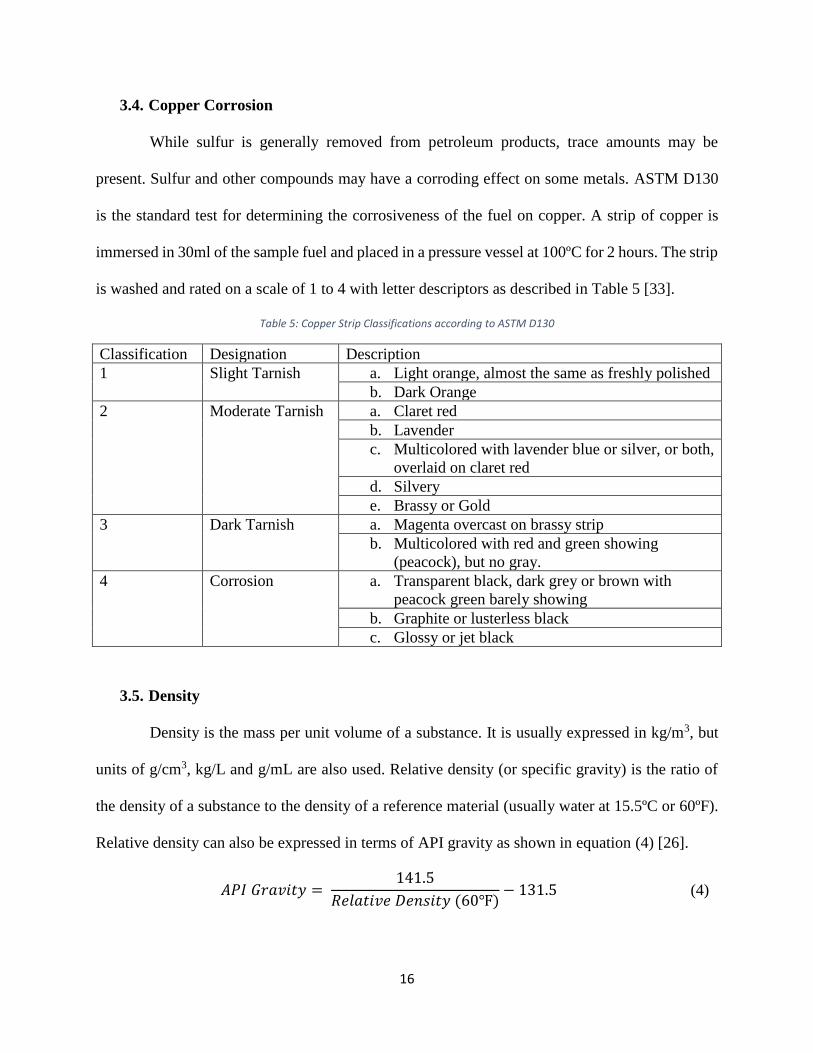
3.4. Copper Corrosion
While sulfur is generally removed from petroleum products, trace amounts may be
present. Sulfur and other compounds may have a corroding effect on some metals. ASTM D130
is the standard test for determining the corrosiveness of the fuel on copper. A strip of copper is
immersed in 30ml of the sample fuel and placed in a pressure vessel at 100ºC for 2 hours. The strip
is washed and rated on a scale of 1 to 4 with letter descriptors as described in Table 5 [33].
Table 5: Copper Strip Classifications according to ASTM D130
Classification Designation Description
1 Slight Tarnish a. Light orange, almost the same as freshly polished
b. Dark Orange
2 Moderate Tarnish a. Claret red
b. Lavender
c. Multicolored with lavender blue or silver, or both,
overlaid on claret red
d. Silvery
e. Brassy or Gold
3 Dark Tarnish a. Magenta overcast on brassy strip
b. Multicolored with red and green showing
(peacock), but no gray.
4 Corrosion a. Transparent black, dark grey or brown with
peacock green barely showing
b. Graphite or lusterless black
c. Glossy or jet black
3.5. Density
Density is the mass per unit volume of a substance. It is usually expressed in kg/m3, but
units of g/cm3, kg/L and g/mL are also used. Relative density (or specific gravity) is the ratio of
the density of a substance to the density of a reference material (usually water at 15.5ºC or 60ºF).
Relative density can also be expressed in terms of API gravity as shown in equation (4) [26].
𝐴𝑃𝐼 𝐺𝑟𝑎𝑣𝑖𝑡𝑦 = 141.5
𝑅𝑒𝑙𝑎𝑡𝑖𝑣𝑒 𝐷𝑒𝑛𝑠𝑖𝑡𝑦 (60℉)− 131.5 (4)
17
3.6. Distillation
Distillation tests are used to determine the boiling range of a fuel. The boiling range
provides information on the composition, properties and behavior of fuels under storage and in
use. Distillation characteristics is also a measure of the volatility of the fuel and determines how
much fuel evaporates under a given condition. This is important for safety evaluations of the fuel
as these characteristics determine the potential of fuel to produce explosive vapors. Distillation
characteristics are also useful in understanding the starting and warm-up performance of engines
and the tendency of the fuel to vapor lock at high temperatures and/or high altitudes [34].
3.7. Electrical Conductivity
Pure hydrocarbons are non-conductors, but trace amounts of other materials can
marginally increase the conductivity of a fuel. In most cases, the conductivity of fuels is generally
very low, and this can be problematic. A flowing fluid may become electrically charged due to a
phenomenon called charge separation. A buildup of electrostatic charge can easily occur in fuels
with low electrical conductivities. A buildup of enough free charges can cause static discharges
which can ignite the fuel. While various techniques have been developed to circumvent this issue,
the most successful solution involves the use of fuel additives to increase the electrical
conductivity of the fuel. Tests for electrical conductivity are necessary to ensure that the fuel’s
conductivity is high enough to prevent static discharges, but not too high as to cause malfunctions
of the fuel quantity capacitance gauges [26].

18
3.8. Flash Point
The flash point of a fuel is the lowest temperature at which it will produce enough vapors
to ignite when exposed to a spark or flame. This is often used to evaluate the fire hazard associated
with a fuel [28].
3.9. Freezing Point
The freezing point is the lowest temperature at which an aviation fuel remains free of solid
hydrocarbon crystals. These solid crystals can restrict the flow of fuel though filters. Due to the
complex nature of fuel pumpability, no specific requirements based on pumpability have been
established. Instead, the low temperature pumpability of fuels are arbitrarily controlled by the
freezing point and viscosity at -20ºC. The freezing point must always be lower than the minimum
operating condition of an aircraft [26, 35].
3.10. Heat of Combustion
The heat of combustion, measured in MJ/kg or BTU, is a measure of the energy available
from a fuel per unit mass. When a unit weight is burned in a bomb-type calorimeter under
controlled conditions to produce gaseous carbon dioxide and liquid water, the heat of combustion
is calculated from the resulting temperature rise after suitable corrections have been made. The net
heat of combustion is obtained by subtracting the heat of vaporization of water, determined from
the hydrogen content [26].
19
3.11. Thermal Stability
Thermal stability is a measure of a fuel’s resistance to oxidation at high temperatures.
Oxidation can degrade fuel performance and produce undesirable products such as sediments and
surface deposits. Oxygen dissolved in fuels undergo complex free radical reactions to form
sediments and surface deposits. Metals, such as copper iron, zinc, lead and calcium, react with
naphthenic acids in the fuel to produce acid salts.
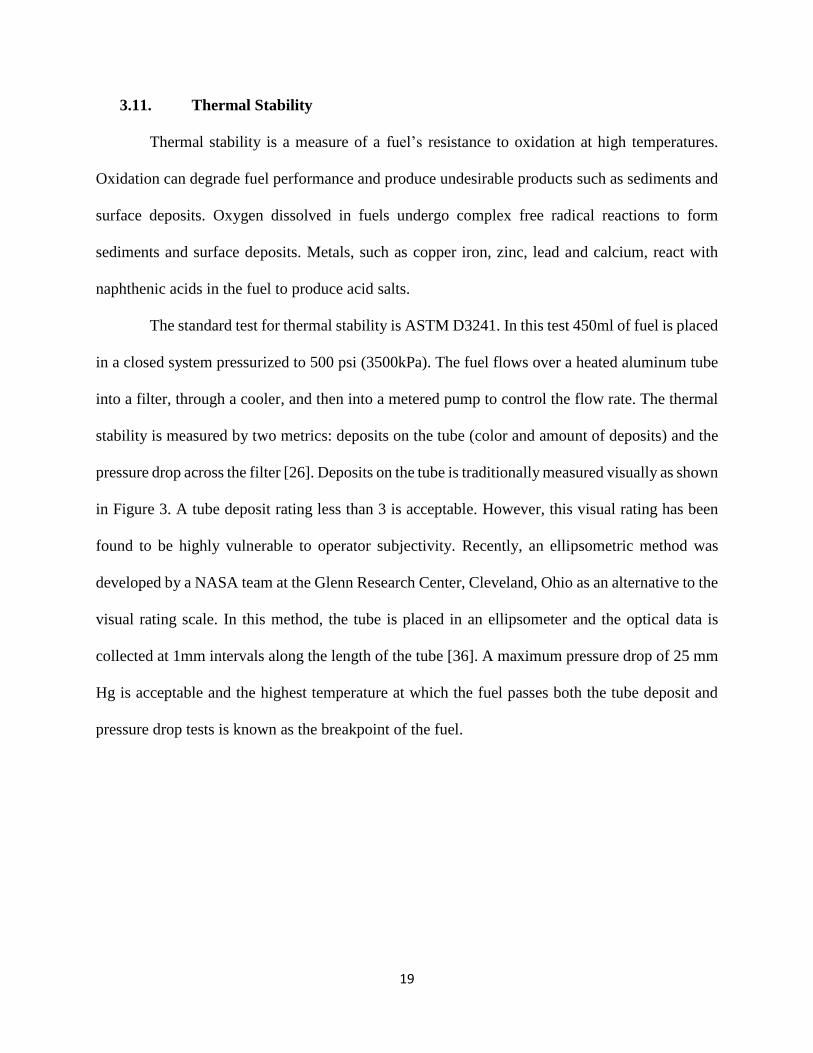
The standard test for thermal stability is ASTM D3241. In this test 450ml of fuel is placed
in a closed system pressurized to 500 psi (3500kPa). The fuel flows over a heated aluminum tube
into a filter, through a cooler, and then into a metered pump to control the flow rate. The thermal
stability is measured by two metrics: deposits on the tube (color and amount of deposits) and the
pressure drop across the filter [26]. Deposits on the tube is traditionally measured visually as shown
in Figure 3. A tube deposit rating less than 3 is acceptable. However, this visual rating has been
found to be highly vulnerable to operator subjectivity. Recently, an ellipsometric method was
developed by a NASA team at the Glenn Research Center, Cleveland, Ohio as an alternative to the
visual rating scale. In this method, the tube is placed in an ellipsometer and the optical data is
collected at 1mm intervals along the length of the tube [36]. A maximum pressure drop of 25 mm
Hg is acceptable and the highest temperature at which the fuel passes both the tube deposit and
pressure drop tests is known as the breakpoint of the fuel.
20
Figure 3: Tube deposit visual rating scale [36]
3.12. Viscosity
Viscosity is a measure of a fluid’s internal resistance to motion. Viscosity affects the
operation of the fuel in the following ways: (1) higher viscosity leads to lower fluidity and higher
pressure drops in fuel lines and (2) high viscosity may lead to soot formation and engine deposits
due to insufficient atomization. In practice, kinematic viscosity, defined as the ratio of the
(dynamic) viscosity to the density, is used. Kinematic viscosity is measured in centistokes (cSt) or
mm2/s, both of which are equivalent.
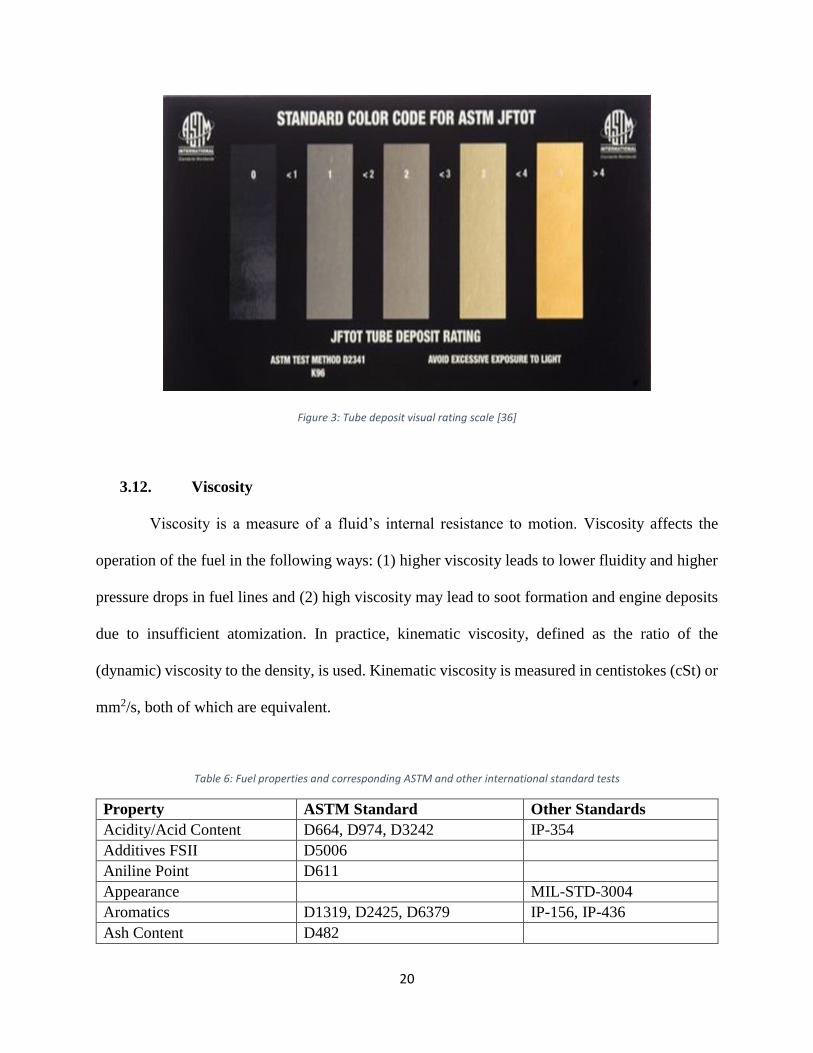
Table 6: Fuel properties and corresponding ASTM and other international standard tests
Property ASTM Standard Other Standards
Acidity/Acid Content D664, D974, D3242 IP-354
Additives FSII D5006
Aniline Point D611
Appearance
MIL-STD-3004
Aromatics D1319, D2425, D6379 IP-156, IP-436
Ash Content D482
21
Carbon Residue D524
Cetane Index D976, D4737
Cetane Number D613
Cloud Point D2500, D5773
Cold Filter Plugging Point D6371
Copper Strip Corrosion D130 IP-154, ISO-2160
Density D1298, D4052 IP-160, IP-365, ISO-3675,
ISO-12185
Derived Cetane Number D6890
Distillation / Boiling Range D86, D2887 IP-123, ISO-3405
Electrical Conductivity D2624 IP-274
Existent Gum D381 IP-540
FAME content D7371, D7797
Filtration Time
MIL-DTL-83133, MIL-
DTL-5624
Flash Point D56, D92, D93, D3828 IP-170, ISO-13736
Freezing Point D2386, D5972, D7153, D7154 IP-16, IP-529
Heat of Combustion D240, D3338, D4529, D4809 IP-12, IP-355
Hydrogen Content D3343, D3701, D5291, D7171
Lubricity D5001, D6079, D7688
Micro Distillation D7345
Naphthalenes/Diaromatics D1840
Nitrogen Content D4629
Olefins D1319
Particulate Contamination D2276, D5452, D6217 MIL-DTL-83133, IP-423
Pour Point D97, D5949
Saybolt Color D156, D6045
Smoke Point D1322
Spectroscopy for Trace
Elements
D7111
Sulfur D129, D1266, D2622, D3227,
D4294, D5453
IP-336, ISO-8754
Sulfur, Mercaptan D3227 IP-342
Thermal Stability D3241 ISO-6249
Vapor Pressure D323, D5191
Viscosity, Kinematic D445, D2532 IP-71
Volume Percent Biodiesel
A-A-59693A
Water and Sediment D2709
Water Content D1094, D6304 MIL-DTL-25576E
Water Separation, MSEP D3948, D7224, D7261
Workmanship D4176, D1655
Table 6 continued
22
3.13. Two-dimensional gas chromatography (GCxGC)
Gas chromatography is a technique for separating complex mixtures based on differences
in boiling point/vapor pressure and polarity. Two-dimensional gas chromatography (GCxGC)
subjects a sample to two dimensions of separation. The first separation is based on volatility and
the second is based on polarity. This allows identification of different hydrocarbon types and
carbon numbers.
The GCxGC technique provides important information for understanding fuel properties.
The carbon number provides information on fuel volatility, which also affects flash point and
freeze point. For example, lighter fuel fractions (with lower carbon numbers) are more reactive
and lower the flash point of the fuel. Heavier fuel fractions (with higher carbon numbers) raise the
freezing point of the fuel. Due to flash point and freezing point constraints, jet fuels typically do
not contain significant amounts of hydrocarbons below C8 and above C17. Hydrocarbon type also
imparts particular properties to fuels. For example, normal paraffins have high energy content and
is the most reactive hydrocarbon group. Isoparaffins have the same chemical formula as normal
paraffins but are less reactive and have much lower freezing points. Cycloparaffins have lower
freezing points and higher densities than both normal and isoparaffins of the same carbon number.
Single-ring aromatics (alkylbenzene) are important for elastomer (O-ring) swell and have high
energy density per unit volume, while multi-ring aromatics contribute to soot formation. It is worth
noting that GCxGC is weak in differentiating the level of branching in iso-paraffins and side chains
in aromatics and cycloparaffins. The level of branching in these molecules can impact the cetane
number and hence ignition delay of fuels [25, 37, 38].
23
CHAPTER 4: ANALYSIS OF FUEL DATA
This section demonstrates the utility of the database by showing some figures that can be
created using the database. The figures presented here were created using scripts written in python
3. Using the resources of the database these figures can be created very easily in a matter of minutes
using most programming languages. Previously, this would have involved manually collecting
information by perusing hundreds of laboratory reports, entering this information into excel or
some other software with plotting capabilities, and then creating the desired figures.
4.1. Composition Histograms
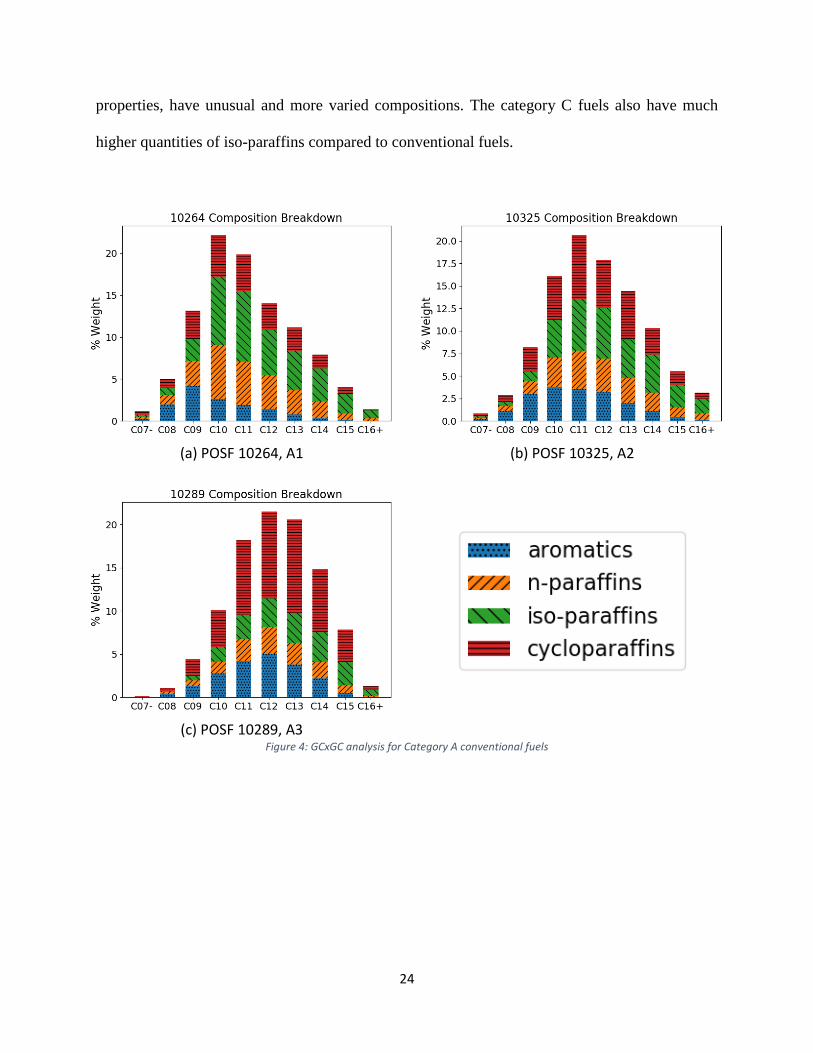
Figures 4-8 show analysis of GCxGC data performed on serialized jet fuels data. These
figures focus on the data obtained from AFRL and show the percent weight contribution of
different components in the fuel. The x-axis shows the carbon number component of the fuel. For
example, C12 refers to hydrocarbon components of the fuel that contain of 12 carbon atoms. C16+
refers to hydrocarbon components with 16 or more carbon atoms and C07- refer to hydrocarbon
components with 7 or less carbon atoms. Different hydrocarbon types can also be distinguished in
these graphs by both color and hatch type. The four main hydrocarbon types shown here are:
aromatics, normal paraffins (n-paraffins), iso-paraffins and cycloparaffins. The amount of other
hydrocarbons components, such as olefins and dienes, are usually negligible and hence left out for
this analysis.
Figure 4 shows the GCxGC analysis of the category A fuels. It can be observed that these
conventional fuels have a wide range of carbon numbers and significant amounts of all four
hydrocarbon types. Since these are middle distillate, jet fuels, the modal carbon number is around
C10-C12. The category C fuels, shown in Figure 5, which test the limits of acceptable jet fuel
24
properties, have unusual and more varied compositions. The category C fuels also have much
higher quantities of iso-paraffins compared to conventional fuels.
(a) POSF 10264, A1 (b) POSF 10325, A2
(c) POSF 10289, A3 Figure 4: GCxGC analysis for Category A conventional fuels

25
(a) POSF 11498, C1 (b) POSF 12223, C2
(c) POSF12341, C3 (d) POSF 12344, C4
(e) POSF 12345, C5 Figure 5: GCxGC analysis for Category C fuels
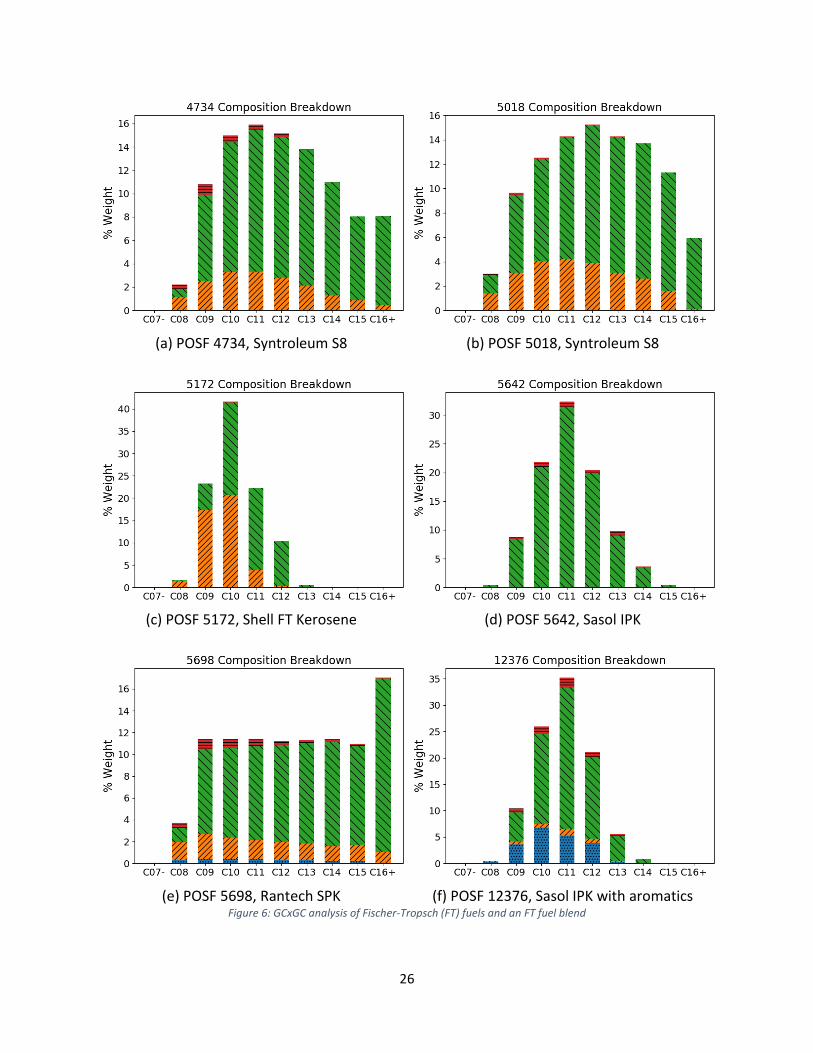
26
(a) POSF 4734, Syntroleum S8 (b) POSF 5018, Syntroleum S8
(c) POSF 5172, Shell FT Kerosene (d) POSF 5642, Sasol IPK
(e) POSF 5698, Rantech SPK (f) POSF 12376, Sasol IPK with aromatics
Figure 6: GCxGC analysis of Fischer-Tropsch (FT) fuels and an FT fuel blend
27
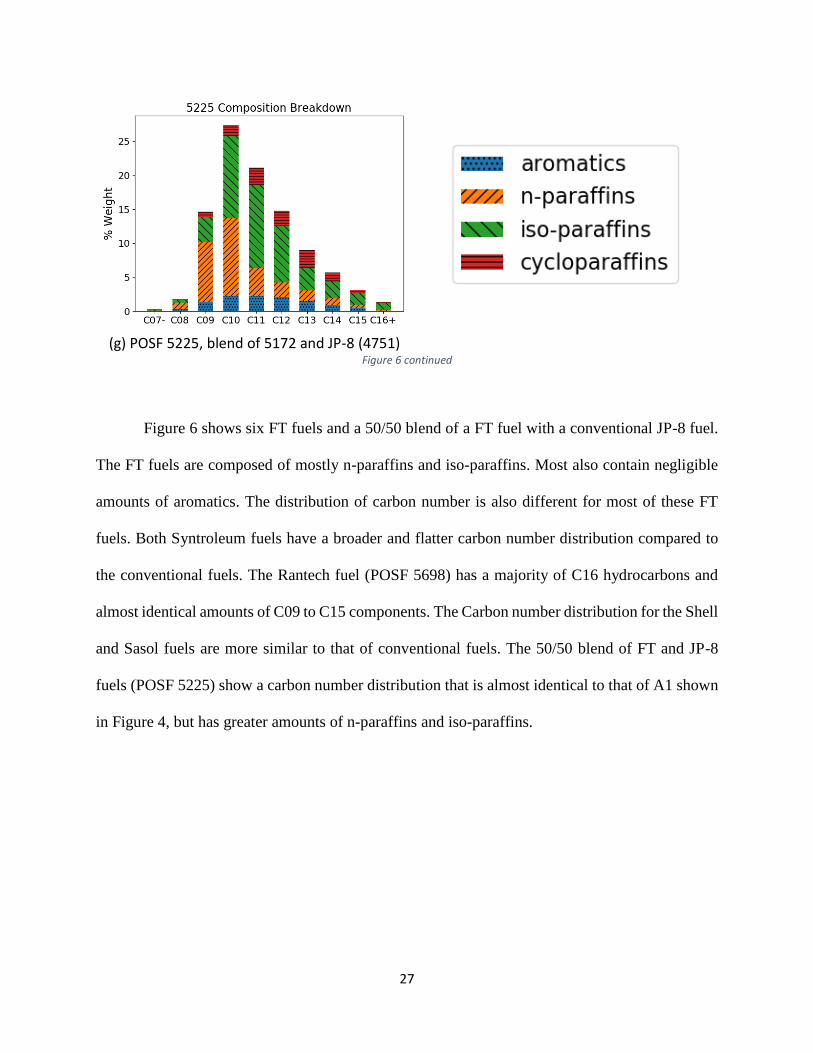
(g) POSF 5225, blend of 5172 and JP-8 (4751) Figure 6 continued
Figure 6 shows six FT fuels and a 50/50 blend of a FT fuel with a conventional JP-8 fuel.
The FT fuels are composed of mostly n-paraffins and iso-paraffins. Most also contain negligible
amounts of aromatics. The distribution of carbon number is also different for most of these FT
fuels. Both Syntroleum fuels have a broader and flatter carbon number distribution compared to
the conventional fuels. The Rantech fuel (POSF 5698) has a majority of C16 hydrocarbons and
almost identical amounts of C09 to C15 components. The Carbon number distribution for the Shell
and Sasol fuels are more similar to that of conventional fuels. The 50/50 blend of FT and JP-8
fuels (POSF 5225) show a carbon number distribution that is almost identical to that of A1 shown
in Figure 4, but has greater amounts of n-paraffins and iso-paraffins.
28
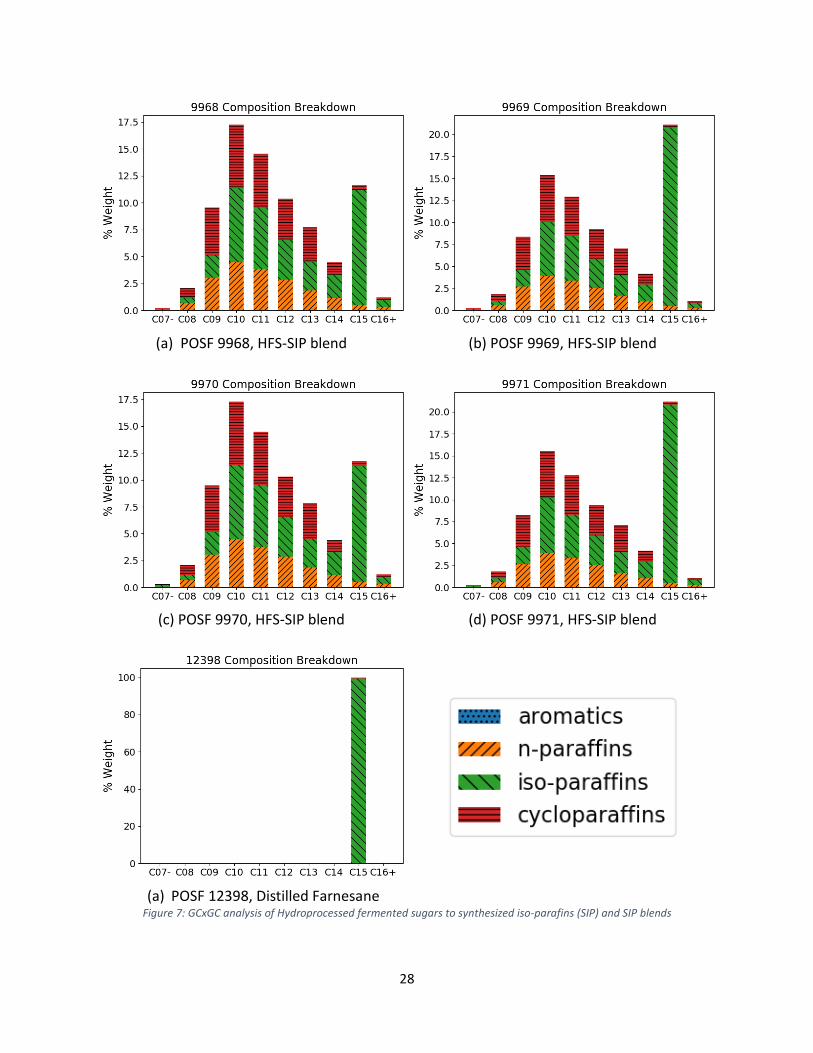
(a) POSF 9968, HFS-SIP blend (b) POSF 9969, HFS-SIP blend
(c) POSF 9970, HFS-SIP blend (d) POSF 9971, HFS-SIP blend
(a) POSF 12398, Distilled Farnesane Figure 7: GCxGC analysis of Hydroprocessed fermented sugars to synthesized iso-parafins (SIP) and SIP blends
29
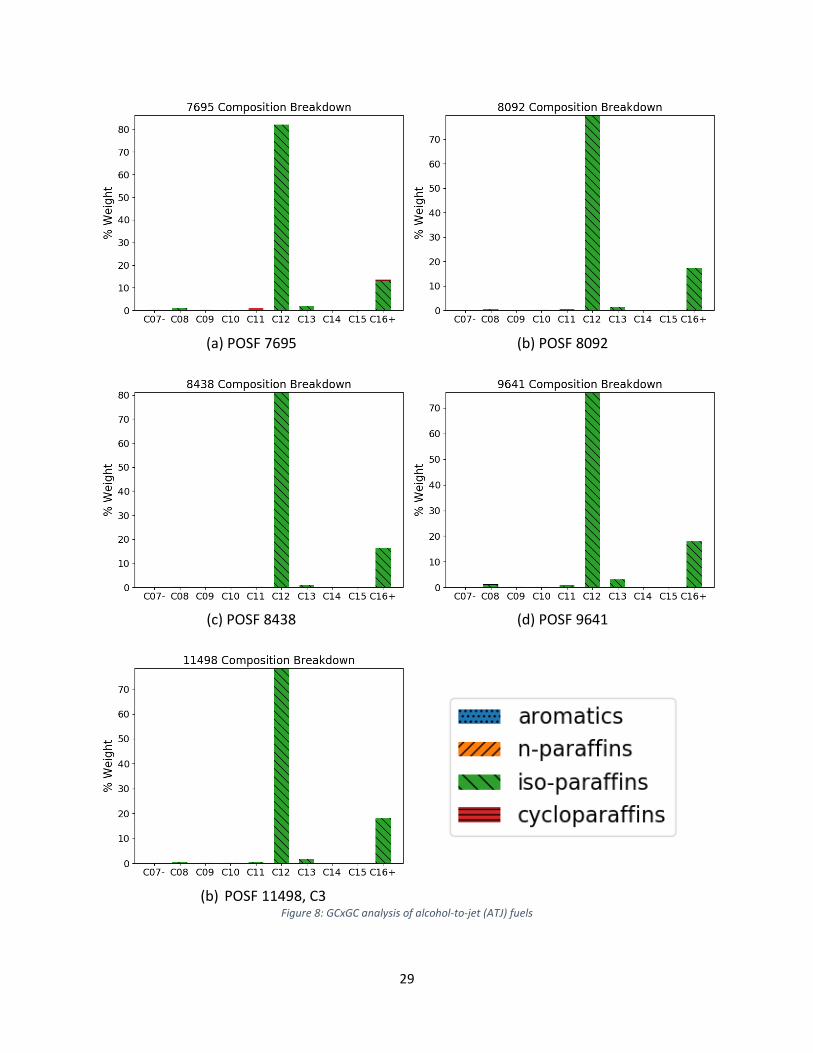
(a) POSF 7695 (b) POSF 8092
(c) POSF 8438 (d) POSF 9641
(b) POSF 11498, C3 Figure 8: GCxGC analysis of alcohol-to-jet (ATJ) fuels
30
Figure 7 shows the GCxGC analysis for four HFS-SIP blends and a pure HFS-SIP fuel.
POSF 12398 is distilled farnesane produced by Amyris Technologies using the HFS-SIP
conversion pathway. By blending fuels from two different batches of farnesane with the same Jet
A-1 batch at 10% and 20%, Amyris created POSF 9968 -9971 as shown in Table 7. Farnesane (2,
6, 10-trimethyldodecane) is iso-paraffin containing 15 carbon atoms [39]. Therefore, the GCxGC
plot shows a single bar at C15 containing 100% iso-paraffins. The C15 peak is also noticeable in
the GCxGC plots of the farnesane blends. Unsurprisingly, the plots for 9968 and 9970, and the
plots of 9969 and 9971 are almost identical.
Table 7: Fuel composition of farnesane fuel blends
POSF Number Fuel Composition
9968 10% Farnesane batch A and 90 % Jet A-1
9969 20% Farnesane batch A and 80 % Jet A-1
9970 10% Farnesane batch B and 90 % Jet A-1
9971 20% Farnesane batch B and 80 % Jet A-1
Figure 8 shows the GCxGC plots for five Gevo ATJ fuels. These plots are all very similar
with major peaks at C12 and C16, with the C12 peak being the larger. They are also composed of
almost 100% iso-paraffins. These fuels vary in trace amounts of carbon numbers, other than C12
and C16.
4.2. Distillation Curves
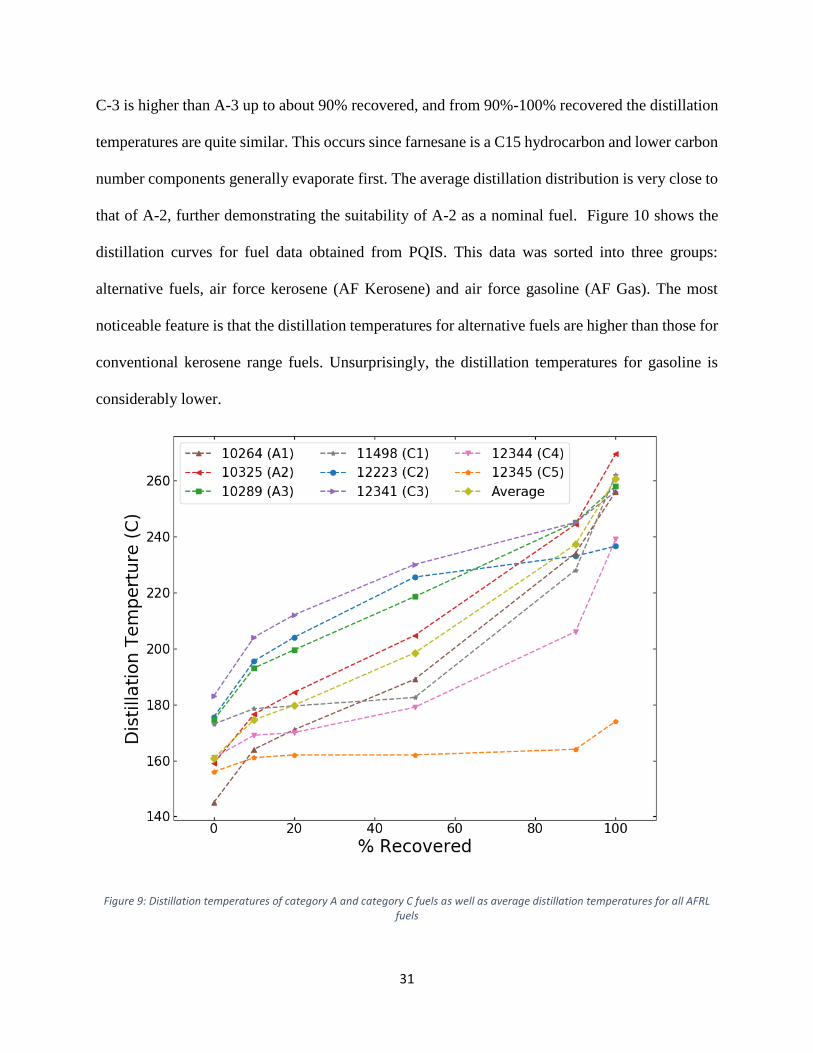
Figure 9 shows the distillation curves for Category A and C fuels and the average
distillation profile of all AFRL fuels. The unusual boiling curve of C-1, the asymmetric boiling
curve of C-2 and the flat boiling curve of C-5 can be easily observed from this plot. The effect of
farnesane on the boiling range of a fuel can be observed by comparing the distillation curve for C-
3, which is composed of 64% A-3 and 36% farnesane, and A-3. The distillation temperatures for
31
C-3 is higher than A-3 up to about 90% recovered, and from 90%-100% recovered the distillation
temperatures are quite similar. This occurs since farnesane is a C15 hydrocarbon and lower carbon
number components generally evaporate first. The average distillation distribution is very close to
that of A-2, further demonstrating the suitability of A-2 as a nominal fuel. Figure 10 shows the
distillation curves for fuel data obtained from PQIS. This data was sorted into three groups:
alternative fuels, air force kerosene (AF Kerosene) and air force gasoline (AF Gas). The most
noticeable feature is that the distillation temperatures for alternative fuels are higher than those for
conventional kerosene range fuels. Unsurprisingly, the distillation temperatures for gasoline is
considerably lower.
Figure 9: Distillation temperatures of category A and category C fuels as well as average distillation temperatures for all AFRL fuels

32
Figure 10: Distillation temperature of PQIS fuels
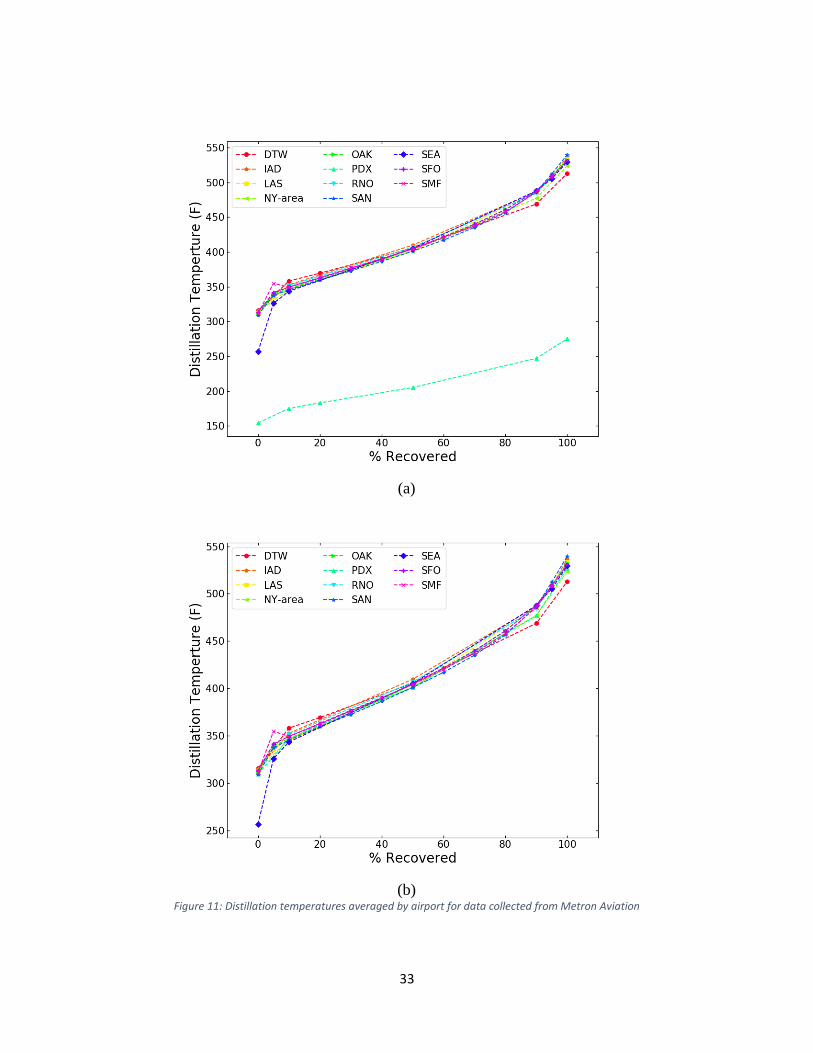
Distillation data collected from Metron Aviation averaged over airport locations is shown
in Figure 11. While the reporting units for distillation temperatures are supposed to be in degrees
Fahrenheit, it appears that the data collected at Portland airport (PDX) were reported in degrees
Celsius. The distillation temperatures for PDX, seen in Figure 11 (a) appears to be too low for a
kerosene range fuel. Figure 11 (b) was produced by assuming that these values were in Celsius
and converting them to Fahrenheit. The graphs with the converted values fit much better with the
traditional boiling ranges for kerosene range fuels.
33
(a)
(b)
Figure 11: Distillation temperatures averaged by airport for data collected from Metron Aviation
34
4.3. Boxplots
4.3.1. Heat of Combustion
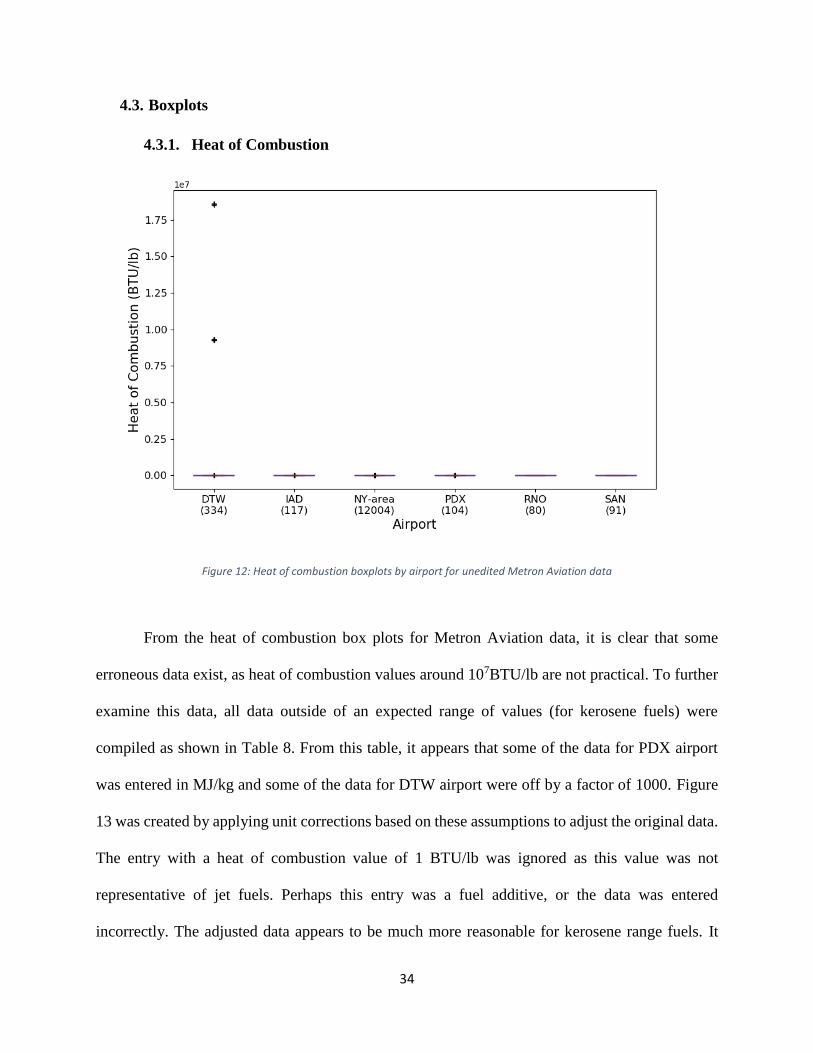
Figure 12: Heat of combustion boxplots by airport for unedited Metron Aviation data
From the heat of combustion box plots for Metron Aviation data, it is clear that some
erroneous data exist, as heat of combustion values around 107BTU/lb are not practical. To further
examine this data, all data outside of an expected range of values (for kerosene fuels) were
compiled as shown in Table 8. From this table, it appears that some of the data for PDX airport
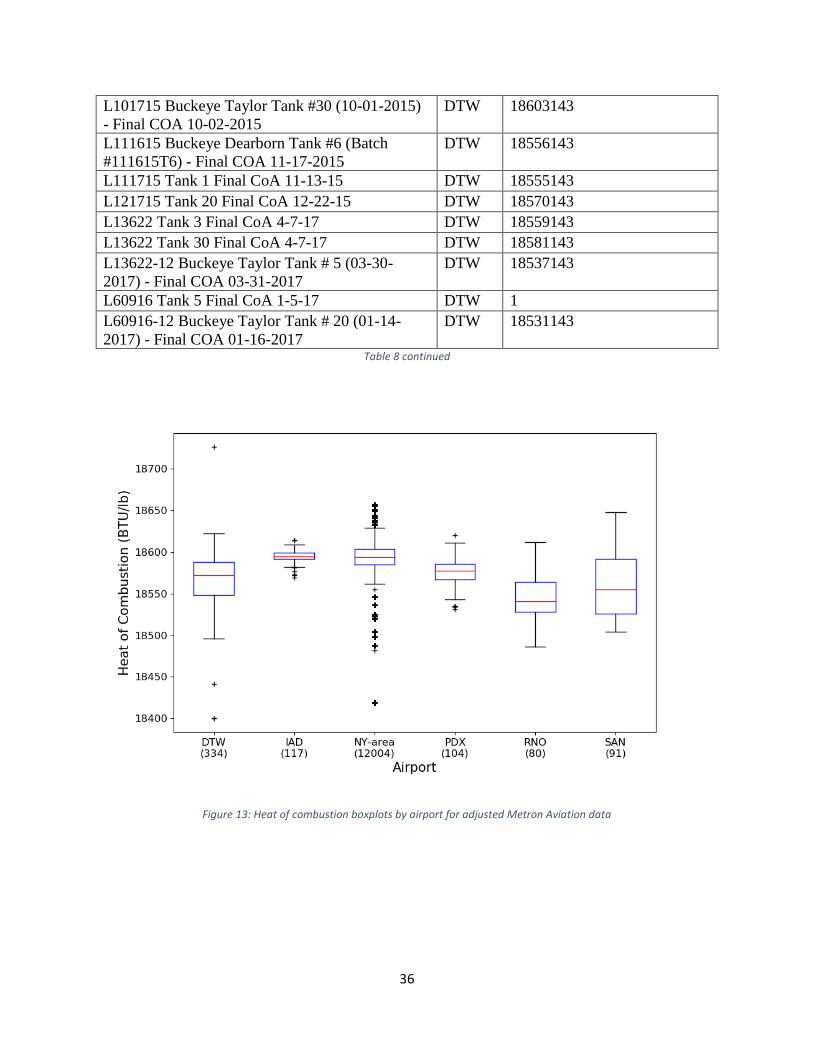
was entered in MJ/kg and some of the data for DTW airport were off by a factor of 1000. Figure
13 was created by applying unit corrections based on these assumptions to adjust the original data.
The entry with a heat of combustion value of 1 BTU/lb was ignored as this value was not
representative of jet fuels. Perhaps this entry was a fuel additive, or the data was entered
incorrectly. The adjusted data appears to be much more reasonable for kerosene range fuels. It
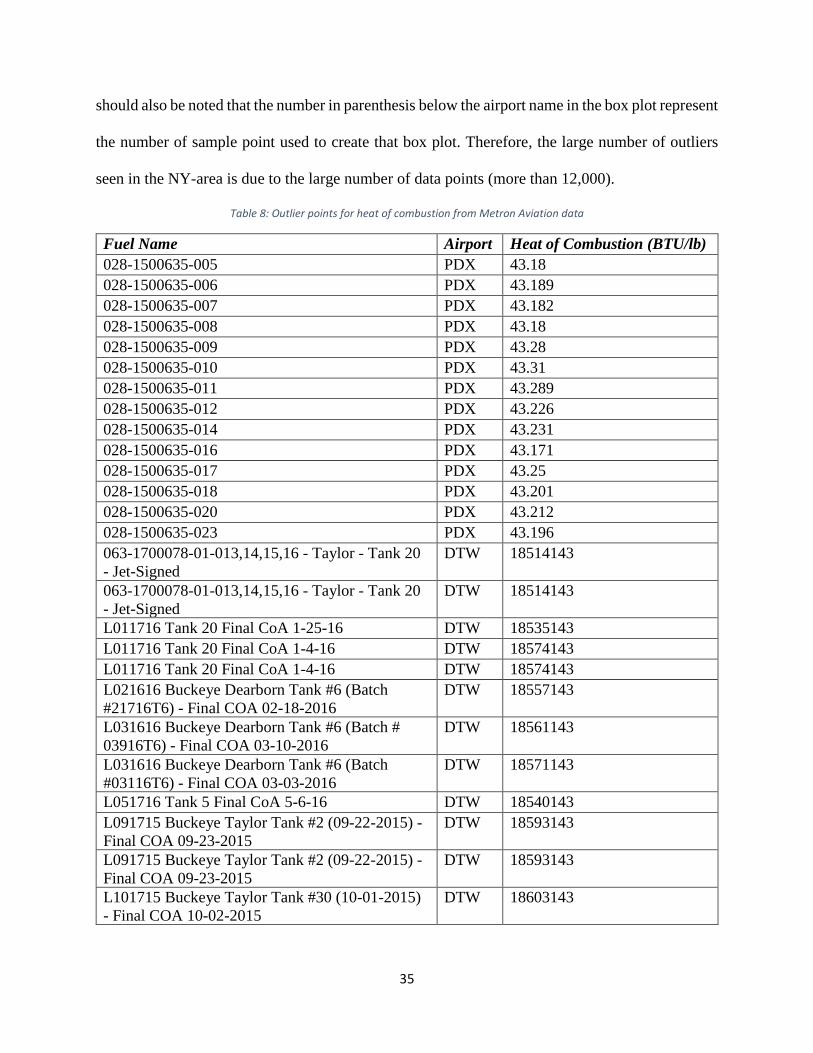
35
should also be noted that the number in parenthesis below the airport name in the box plot represent
the number of sample point used to create that box plot. Therefore, the large number of outliers
seen in the NY-area is due to the large number of data points (more than 12,000).
Table 8: Outlier points for heat of combustion from Metron Aviation data
Fuel Name Airport Heat of Combustion (BTU/lb)
028-1500635-005 PDX 43.18
028-1500635-006 PDX 43.189
028-1500635-007 PDX 43.182
028-1500635-008 PDX 43.18
028-1500635-009 PDX 43.28
028-1500635-010 PDX 43.31
028-1500635-011 PDX 43.289
028-1500635-012 PDX 43.226
028-1500635-014 PDX 43.231
028-1500635-016 PDX 43.171
028-1500635-017 PDX 43.25
028-1500635-018 PDX 43.201
028-1500635-020 PDX 43.212
028-1500635-023 PDX 43.196
063-1700078-01-013,14,15,16 - Taylor - Tank 20
- Jet-Signed
DTW 18514143
063-1700078-01-013,14,15,16 - Taylor - Tank 20
- Jet-Signed
DTW 18514143
L011716 Tank 20 Final CoA 1-25-16 DTW 18535143
L011716 Tank 20 Final CoA 1-4-16 DTW 18574143
L011716 Tank 20 Final CoA 1-4-16 DTW 18574143
L021616 Buckeye Dearborn Tank #6 (Batch
#21716T6) - Final COA 02-18-2016
DTW 18557143
L031616 Buckeye Dearborn Tank #6 (Batch #
03916T6) - Final COA 03-10-2016
DTW 18561143
L031616 Buckeye Dearborn Tank #6 (Batch
#03116T6) - Final COA 03-03-2016
DTW 18571143
L051716 Tank 5 Final CoA 5-6-16 DTW 18540143
L091715 Buckeye Taylor Tank #2 (09-22-2015) -
Final COA 09-23-2015
DTW 18593143
L091715 Buckeye Taylor Tank #2 (09-22-2015) -
Final COA 09-23-2015
DTW 18593143
L101715 Buckeye Taylor Tank #30 (10-01-2015)
- Final COA 10-02-2015
DTW 18603143
36
L101715 Buckeye Taylor Tank #30 (10-01-2015)
- Final COA 10-02-2015
DTW 18603143
L111615 Buckeye Dearborn Tank #6 (Batch
#111615T6) - Final COA 11-17-2015
DTW 18556143
L111715 Tank 1 Final CoA 11-13-15 DTW 18555143
L121715 Tank 20 Final CoA 12-22-15 DTW 18570143
L13622 Tank 3 Final CoA 4-7-17 DTW 18559143
L13622 Tank 30 Final CoA 4-7-17 DTW 18581143
L13622-12 Buckeye Taylor Tank # 5 (03-30-
2017) - Final COA 03-31-2017
DTW 18537143
L60916 Tank 5 Final CoA 1-5-17 DTW 1
L60916-12 Buckeye Taylor Tank # 20 (01-14-
2017) - Final COA 01-16-2017
DTW 18531143
Table 8 continued
Figure 13: Heat of combustion boxplots by airport for adjusted Metron Aviation data
37
4.3.2. Density
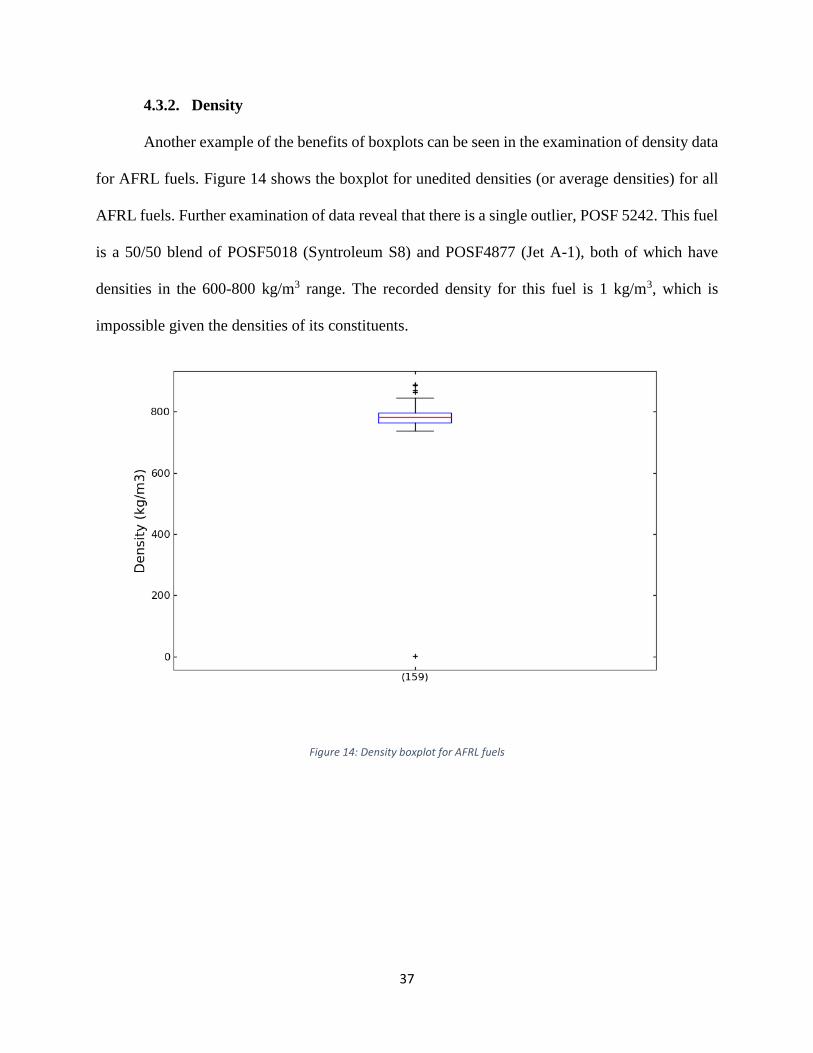
Another example of the benefits of boxplots can be seen in the examination of density data
for AFRL fuels. Figure 14 shows the boxplot for unedited densities (or average densities) for all
AFRL fuels. Further examination of data reveal that there is a single outlier, POSF 5242. This fuel
is a 50/50 blend of POSF5018 (Syntroleum S8) and POSF4877 (Jet A-1), both of which have
densities in the 600-800 kg/m3 range. The recorded density for this fuel is 1 kg/m3, which is
impossible given the densities of its constituents.
Figure 14: Density boxplot for AFRL fuels
38
4.3.3. Aromatics Content
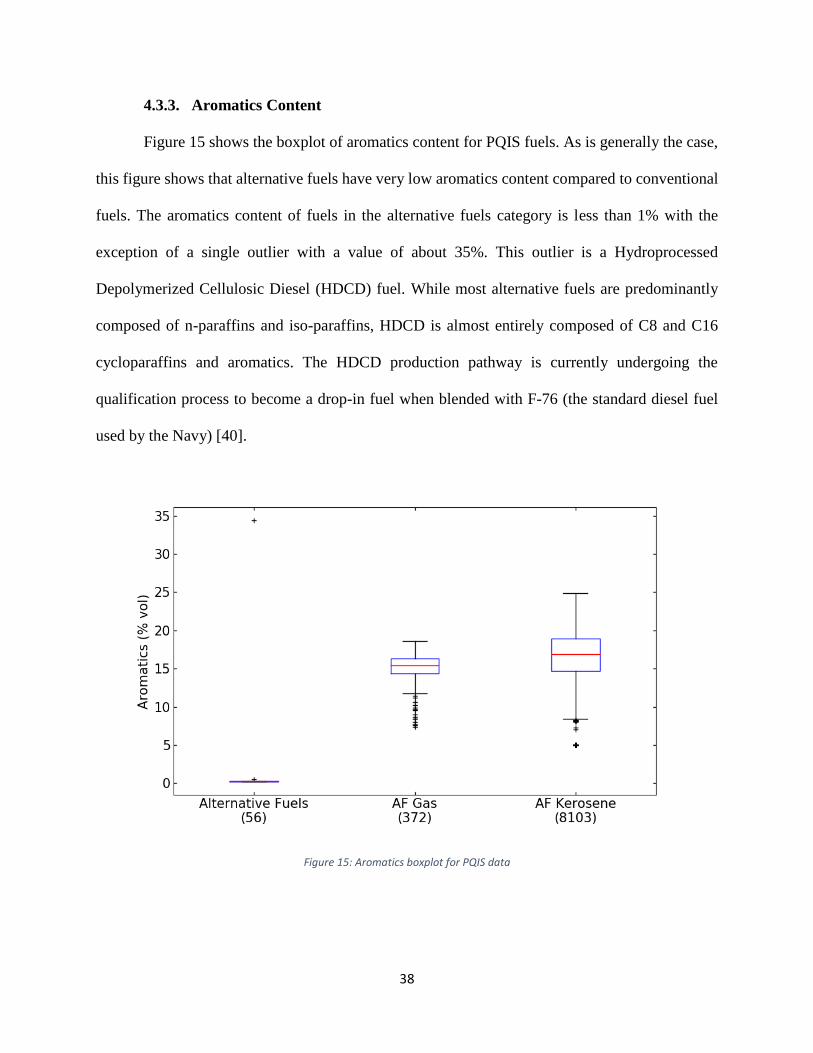
Figure 15 shows the boxplot of aromatics content for PQIS fuels. As is generally the case,
this figure shows that alternative fuels have very low aromatics content compared to conventional
fuels. The aromatics content of fuels in the alternative fuels category is less than 1% with the
exception of a single outlier with a value of about 35%. This outlier is a Hydroprocessed
Depolymerized Cellulosic Diesel (HDCD) fuel. While most alternative fuels are predominantly
composed of n-paraffins and iso-paraffins, HDCD is almost entirely composed of C8 and C16
cycloparaffins and aromatics. The HDCD production pathway is currently undergoing the
qualification process to become a drop-in fuel when blended with F-76 (the standard diesel fuel
used by the Navy) [40].
Figure 15: Aromatics boxplot for PQIS data
39
4.4. Multivariate Linear Regression
In order to expedite the certification process of alternative fuels, Won et al recognized the
utility of developing an a priori screening method for shortlisting viable candidates. The screening
method should (a) require a minimal fuel sample volume, (b) use standardized commercially
available test equipment/methods, and (c) provide quantitative metrics between test metrics and
combustion performance. To achieve these goals, the use of a surrogate formulation was
suggested, where specific combustion property targets (CPTs) are used to predicted global
combustion behaviors. The CPTs are selected from a list of combustion property indicators, which
reflect the physical and chemical processes of combustion [41].
To develop a quantitative relationship between a global combustion behavior metric and
some selected CPTs, Multivariate Linear Regression (MLR) is used. This is a technique which
uses least squares regression to fit data to the form shown in Equation (5).
𝑌 = 𝛽0 + 𝛽1𝑋1 + 𝛽2𝑋2 + ⋯ + 𝛽𝑛𝑋𝑛 (5)
Where Y represents a dependent variable (in this case the combustion behavior metric), X’s
represent the independent variables (CPTs) and the β’s define the correlation coefficients, which
are optimized by the least squares regression technique. Before using MLR, null or nonsensical
data must be removed, and the independence of the X variables must be verified. The dataset is
then split into training and test sets. The training set is used to calculate the β coefficients and the
test sets are used to test the accuracy of the model. It should also be noted that to used MLR, there
must be more data points than independent variables [42].
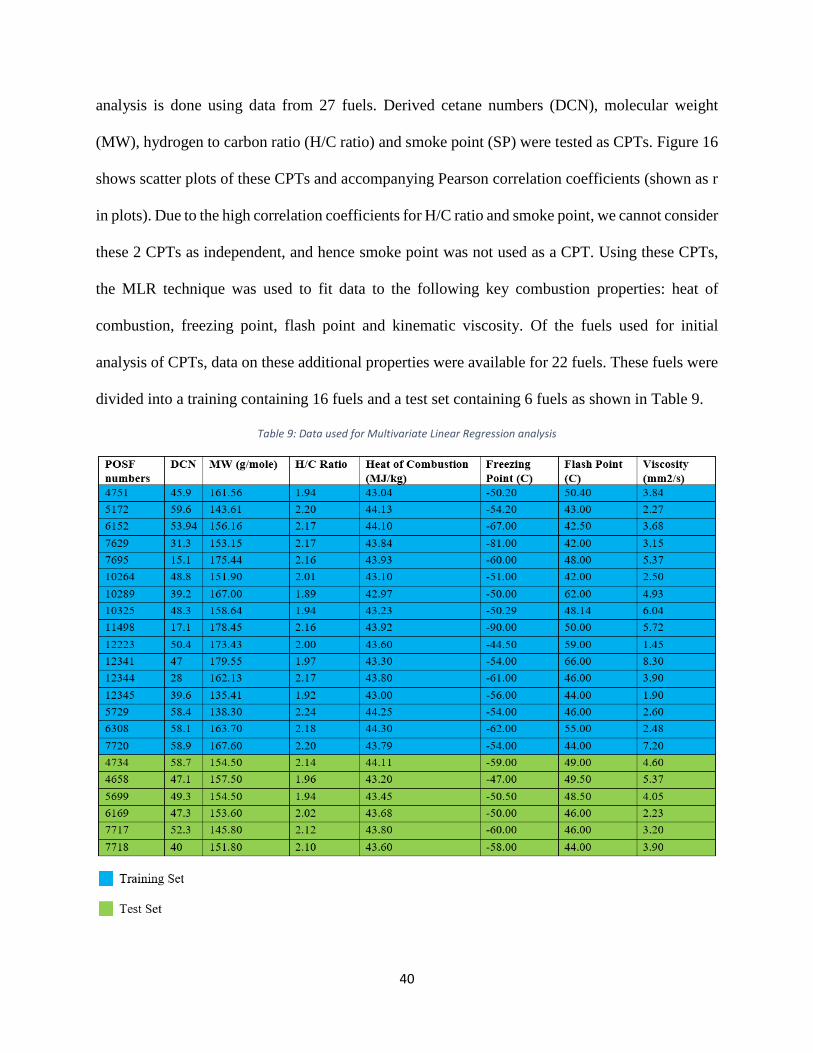
This section includes some preliminary MLR analysis using the database. In this example,
the study done by Won et al. is emulated using additional data for 13 AFRL fuels. Thus, the
40
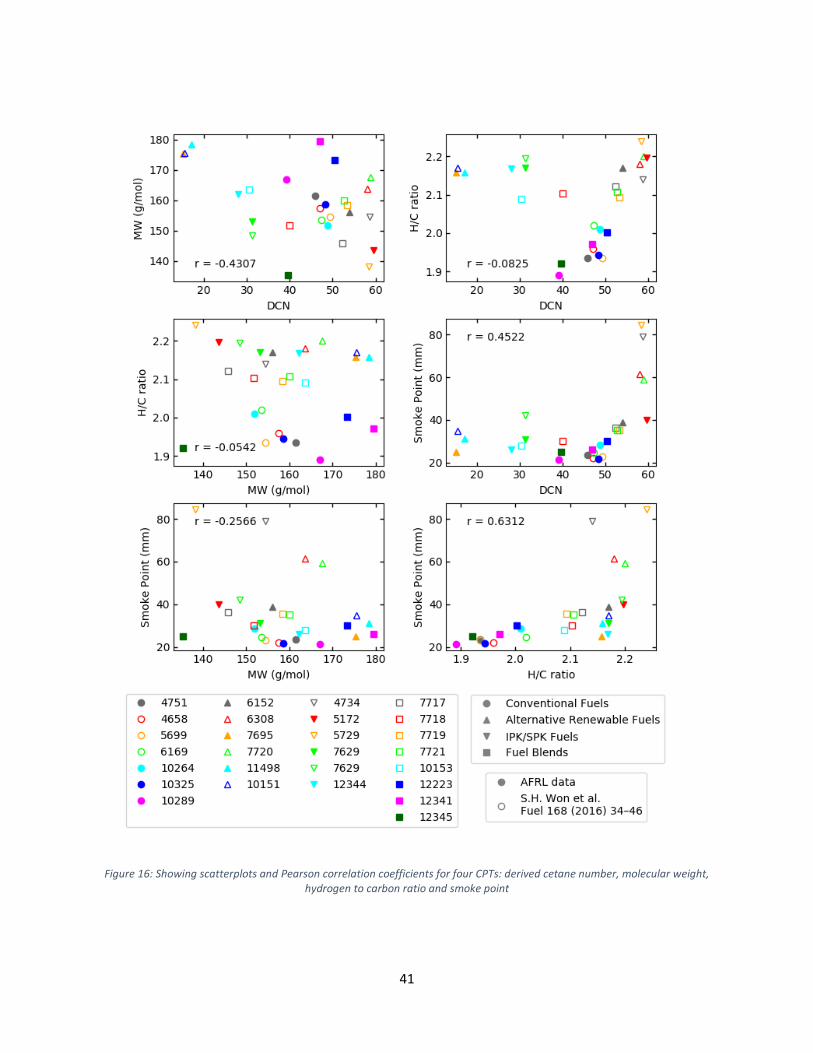
analysis is done using data from 27 fuels. Derived cetane numbers (DCN), molecular weight
(MW), hydrogen to carbon ratio (H/C ratio) and smoke point (SP) were tested as CPTs. Figure 16
shows scatter plots of these CPTs and accompanying Pearson correlation coefficients (shown as r
in plots). Due to the high correlation coefficients for H/C ratio and smoke point, we cannot consider
these 2 CPTs as independent, and hence smoke point was not used as a CPT. Using these CPTs,
the MLR technique was used to fit data to the following key combustion properties: heat of
combustion, freezing point, flash point and kinematic viscosity. Of the fuels used for initial
analysis of CPTs, data on these additional properties were available for 22 fuels. These fuels were
divided into a training containing 16 fuels and a test set containing 6 fuels as shown in Table 9.
Table 9: Data used for Multivariate Linear Regression analysis
41
Figure 16: Showing scatterplots and Pearson correlation coefficients for four CPTs: derived cetane number, molecular weight, hydrogen to carbon ratio and smoke point
42
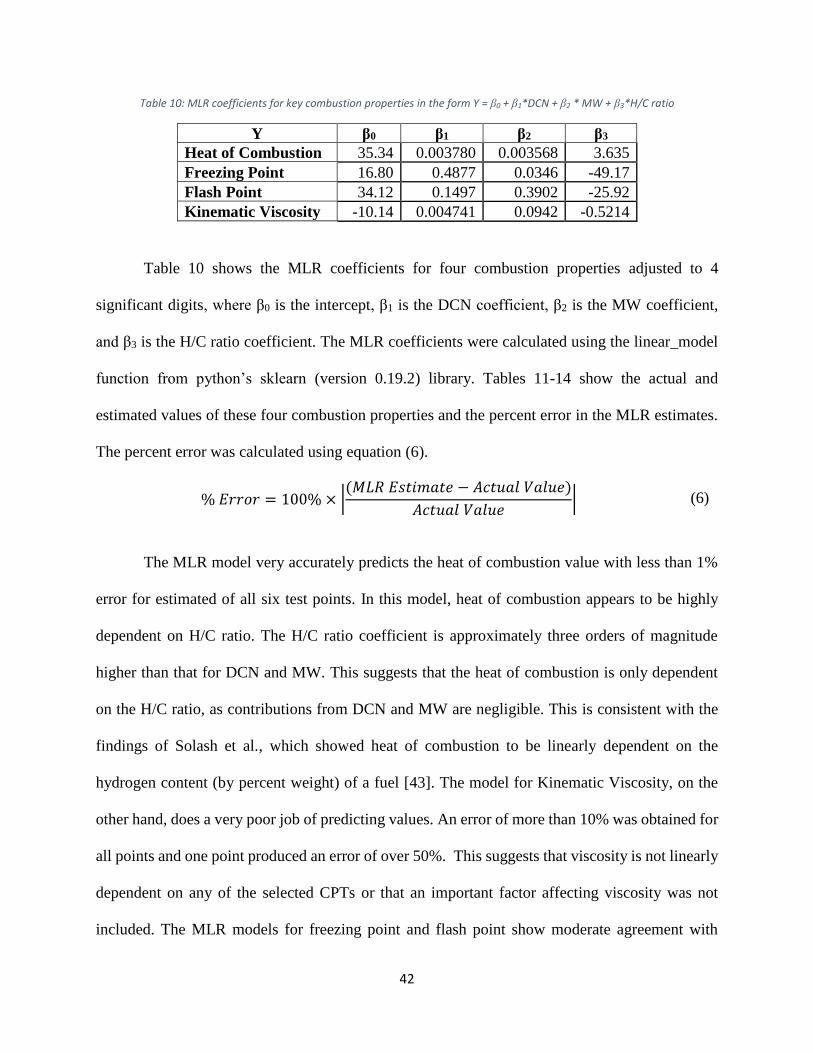
Table 10: MLR coefficients for key combustion properties in the form Y = β0 + β1*DCN + β2 * MW + β3*H/C ratio
Y β0 β1 β2 β3
Heat of Combustion 35.34 0.003780 0.003568 3.635
Freezing Point 16.80 0.4877 0.0346 -49.17
Flash Point 34.12 0.1497 0.3902 -25.92
Kinematic Viscosity -10.14 0.004741 0.0942 -0.5214
Table 10 shows the MLR coefficients for four combustion properties adjusted to 4
significant digits, where β0 is the intercept, β1 is the DCN coefficient, β2 is the MW coefficient,
and β3 is the H/C ratio coefficient. The MLR coefficients were calculated using the linear_model
function from python’s sklearn (version 0.19.2) library. Tables 11-14 show the actual and
estimated values of these four combustion properties and the percent error in the MLR estimates.
The percent error was calculated using equation (6).
% 𝐸𝑟𝑟𝑜𝑟 = 100% × |(𝑀𝐿𝑅 𝐸𝑠𝑡𝑖𝑚𝑎𝑡𝑒 − 𝐴𝑐𝑡𝑢𝑎𝑙 𝑉𝑎𝑙𝑢𝑒)
𝐴𝑐𝑡𝑢𝑎𝑙 𝑉𝑎𝑙𝑢𝑒| (6)
The MLR model very accurately predicts the heat of combustion value with less than 1%
error for estimated of all six test points. In this model, heat of combustion appears to be highly
dependent on H/C ratio. The H/C ratio coefficient is approximately three orders of magnitude
higher than that for DCN and MW. This suggests that the heat of combustion is only dependent
on the H/C ratio, as contributions from DCN and MW are negligible. This is consistent with the
findings of Solash et al., which showed heat of combustion to be linearly dependent on the
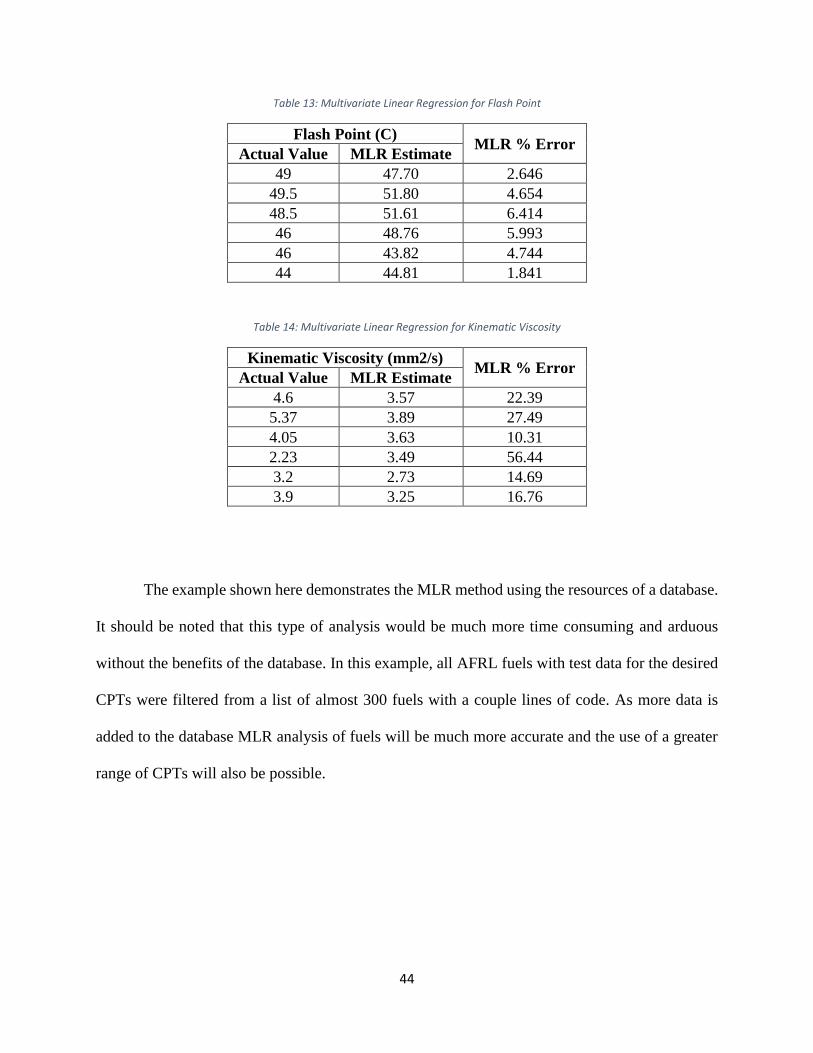
hydrogen content (by percent weight) of a fuel [43]. The model for Kinematic Viscosity, on the
other hand, does a very poor job of predicting values. An error of more than 10% was obtained for
all points and one point produced an error of over 50%. This suggests that viscosity is not linearly
dependent on any of the selected CPTs or that an important factor affecting viscosity was not
included. The MLR models for freezing point and flash point show moderate agreement with
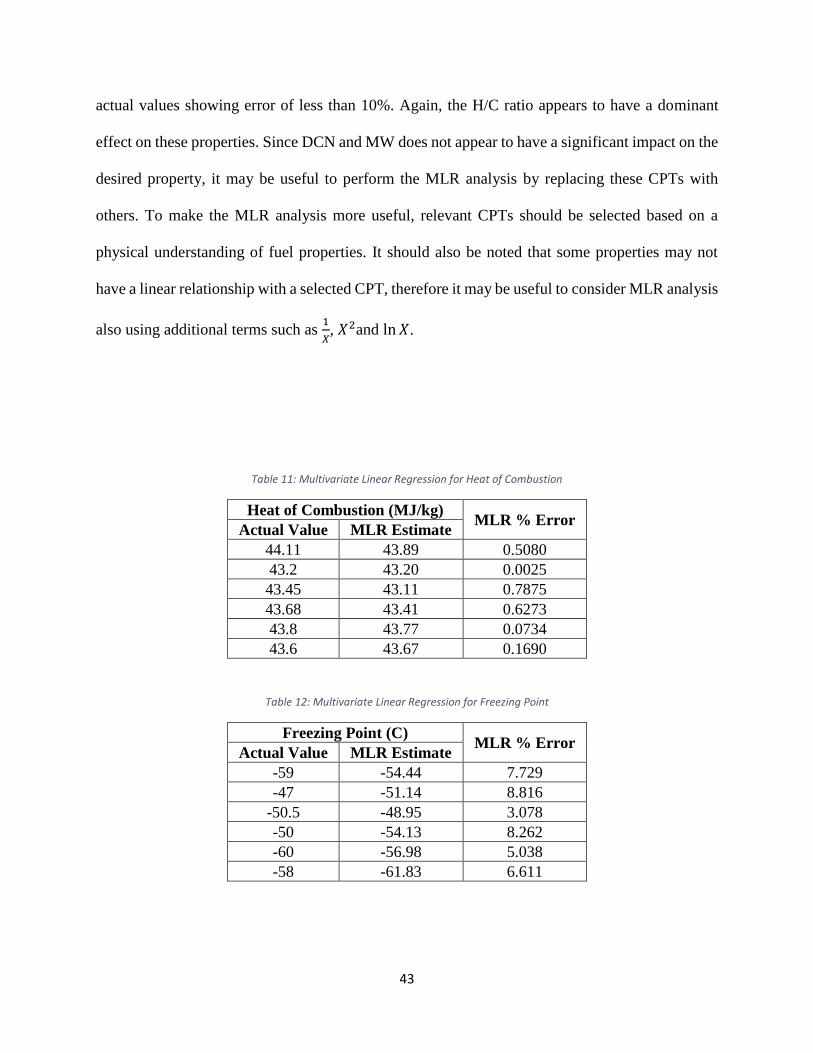
43
actual values showing error of less than 10%. Again, the H/C ratio appears to have a dominant
effect on these properties. Since DCN and MW does not appear to have a significant impact on the
desired property, it may be useful to perform the MLR analysis by replacing these CPTs with
others. To make the MLR analysis more useful, relevant CPTs should be selected based on a
physical understanding of fuel properties. It should also be noted that some properties may not
have a linear relationship with a selected CPT, therefore it may be useful to consider MLR analysis
also using additional terms such as 1
𝑋, 𝑋2and ln 𝑋.
Table 11: Multivariate Linear Regression for Heat of Combustion
Heat of Combustion (MJ/kg) MLR % Error
Actual Value MLR Estimate
44.11 43.89 0.5080
43.2 43.20 0.0025
43.45 43.11 0.7875
43.68 43.41 0.6273
43.8 43.77 0.0734
43.6 43.67 0.1690
Table 12: Multivariate Linear Regression for Freezing Point
Freezing Point (C) MLR % Error
Actual Value MLR Estimate
-59 -54.44 7.729
-47 -51.14 8.816
-50.5 -48.95 3.078
-50 -54.13 8.262
-60 -56.98 5.038
-58 -61.83 6.611
44
Table 13: Multivariate Linear Regression for Flash Point
Flash Point (C) MLR % Error
Actual Value MLR Estimate
49 47.70 2.646
49.5 51.80 4.654
48.5 51.61 6.414
46 48.76 5.993
46 43.82 4.744
44 44.81 1.841
Table 14: Multivariate Linear Regression for Kinematic Viscosity
Kinematic Viscosity (mm2/s) MLR % Error
Actual Value MLR Estimate
4.6 3.57 22.39
5.37 3.89 27.49
4.05 3.63 10.31
2.23 3.49 56.44
3.2 2.73 14.69
3.9 3.25 16.76
The example shown here demonstrates the MLR method using the resources of a database.
It should be noted that this type of analysis would be much more time consuming and arduous
without the benefits of the database. In this example, all AFRL fuels with test data for the desired
CPTs were filtered from a list of almost 300 fuels with a couple lines of code. As more data is
added to the database MLR analysis of fuels will be much more accurate and the use of a greater
range of CPTs will also be possible.
45
CHAPTER 5: CONCLUSION
A database of alternative jet fuels (AJFs) was setup to advance and accelerate the
development and approval of new alternative jet fuels. Data sourced from the Air Force Research
Lab, Metron Aviation and Petroleum Quality Information Systems were serialized and uploaded
to the database. The scope and significance of some of the most pertinent fuel tests were explained.
Some preliminary analysis of data was preformed to demonstrate the utility of the database. In
particular, composition histograms, distillation plots and boxplots were produced to highlight
specific features of fuels and identify erroneous data. A multivariate linear regression analysis on
selected fuel properties was also performed.
5.1. Future Studies
The goal of this work is to create a database where information on AJFs is stored and can
be easily retrieved by researchers from academic, government and industrial institutions. It is
hoped that this database will facilitate future studies of AJFs, and in particular permit large scale
statistical analysis of data. Since many of the correlations used for conventional fuels are not
applicable to alternative fuels, new correlations will have to be developed and a database of AJFs
can mitigate many of the challenges in developing these new correlations.
One of the current limitations of the database, is that limited data is available for many
fuels. Therefore, when performing analysis which require multiple fuel properties, a much smaller
dataset is available. It is also hoped that in the future the capability for research groups to augment
the information in the database by uploading data will be implemented. This feature will require a
system of approval to maintain the validity of data. A section of the database can also be developed

46
to host a collection of previous work done on AJFs. This feature could make it easier to identify
the unresolved areas of research and reduce the number of redundant studies, hence making future
studies of AJFs more meaningful.
47
REFERENCES
[1] M. E. Klapmeyer and L. C. Marr, "CO2, NOx, and Particle Emissions from Aircraft and Support
Activities," Environmental Science and Technology, vol. 46, pp. 10974-10981, 2012.
[2] ExxonMobil, "Outlook for Energy: A View to 2014," 2018. [Online]. Available:
http://cdn.exxonmobil.com/en/energy/energy-outlook/a-view-to-2040. [Accessed 24 05 2018].
[3] Federal Aviation Administration Office of Environment and Energy, "Aviation and Emissions: a
Primer," 01 2005. [Online]. Available:
https://www.faa.gov/regulations_policies/policy_guidance/envir_policy/media/AEPRIMER.pdf.
[Accessed 24 05 2018].
[4] International Air Transport Association, "Vision 2050 Report," 2011. [Online]. Available:
https://www.iata.org/pressroom/facts_figures/Documents/vision-2050.pdf. [Accessed 24 05
2018].
[5] U.S. Air Force, "Energy Flight Plan 2017-2036," 2017. [Online]. Available:
http://www.safie.hq.af.mil/Portals/78/AFEnergyFlightPlan2017.pdf?ver=2017-01-13-133958-
503. [Accessed 24 05 2018].
[6] The National Academics of Sciences, Engineering and Medicine, "Sustainable Alternative Jet
Fuels," in Commmercial Aircraft Propulsion and Energy Systems Research: Reducing Global
Carbon Emissions, Washigton, DC, The National Academics Press, 2016, pp. 71-87.
[7] E. Corporan, T. Edwards, L. Shafer, M. J. Dewitt, C. Klingshirn, S. Zabarnick, Z. West, R.
Striebich, J. Graham and J. Klein, "Chemical, Thermal Stability, Seal Swell, and Emissions
Studies of Alternative Jet Fuels," Energy & Fuels, vol. 25, no. 3, pp. 955-966, 2011.
[8] K. Lokesh, V. Sethi, T. Nikolaidis, E. Goodger and D. Nalianda, "Life cycle greenhouse gas
analysis of biojet fuels with a technical investigation into their impact on jet engine
performance," Biomass and Bioenergy, vol. 77, pp. 26-44, 2015.
[9] P. Trivedi, H. Olcay, M. D. Staples, M. R. Withers, R. Malina and S. R. Barrett, "Energy return
on investment for alternative jet fuels," Applied Energy, vol. 141, pp. 167-174, 2014.
[10] M. D. Staples, R. Malina, H. Olcay, M. N. Pearlson, J. I. Hileman, A. Boies and S. R. Barrett,
"Lifecycle greenhouse gas footprint and minimum selling price of renewable diesel and jet fuel
from fermentation and advanced fermentation production technologies," Energy &
Environmental Science, vol. 7, pp. 1545-1554, 2014.
48
[11] S. de Jong, K. Antonissen, R. Hoefnagels, L. Lonza, M. Wang, A. Faaij and M. Junginger,
"Life-cycle analysis of greenhouse gas emissions from renewable jet fuel production,"
Biotechnology for Biofuels, vol. 10, no. 64, 2017.
[12] M. Colket, J. Heyne, M. Rumizen, M. Gupta, T. Edwards, W. M. Roquemore, G. Andac, R.
Boehm, J. Lovett, J. Condevaux, D. Turner, N. Rizk, R. Williams, J. Tishkoff, C. Li, J. Moder,
D. Friend and V. Sankaran, "Overveiw of the National Jet Fuels Combustion Program," AIAA,
vol. 55, no. 4, pp. 1087-1104, 2017.
[13] Commercial Aviation Alternative Fuels Initiative, "About CAAFI," 2018. [Online]. Available:
http://www.caafi.org/about/caafi.html. [Accessed 31 05 2018].
[14] M. Braun-Unkhoff, "ALFA-BIRD: Alternative Fuels and Biofuels for Aircraft Development
Overview of main results," 2012. [Online]. Available: https://www.airtn.eu/downloads/airtn-
alfabird-web-sent-2012.pdf. [Accessed 31 05 2018].
[15] International Air Transportation Association, "IATA 2015 Report on Alternative Fuels," 12
2015. [Online]. Available: https://www.iata.org/publications/Documents/2015-report-
alternative-fuels.pdf. [Accessed 31 05 2018].
[16] C. Zhang, X. Hui, Y. Lin and C.-J. Sung, "Recent development in studies of alternative jet fuel
combustion: Progress, challenges, and opportunities," Renewable and Sustainable Energy
Reviews, vol. 54, pp. 120-138, 2016.
[17] "D4054-17: Standard Practice for Evaluation of New Aviation Turbine Fuels and Fuel
Additives," ASTM International, Conshohocken, PA, 2017.
[18] "D7566-18: Standard Specification for Aviation Turbine Fuel Containing Synthesized
Hydrocarbons," ASTM International, Conshohocken, PA, 2018.
[19] University of Illinois, "Alternative Jet Fuels Test Database," [Online]. Available:
http://altjetfuels.illinois.edu/. [Accessed 04 06 2018].
[20] T. E. o. E. Britannica, "Database," Encyclopaedia Britannica, Inc, 02 11 2017. [Online].
Available: https://www.britannica.com/technology/database. [Accessed 05 06 2018].
[21] N. Jatana, S. Puri, M. Ahuja, I. Kathuria and D. Gosain, "A survey and comparison of Relational
and Non-Relational Database," International Journal of Engineering Reseach & Technology,
vol. 1, no. 6, 2012.
[22] C.-H. Lee and Y.-L. Zheng, "Automatic SQL-to-NoSQL Schema Transformation over the
MySQL and HBase Databases," in International Conference on Consumer Electronics, Taiwan,
2015.
49
[23] M. Praveenkumar, T. Gowdhaman, S. P. Santhoshkumar and A. W. Raja, "Handling Big Data
using NoSQL Database," International Journal of Engineering Research & Technology, vol. 5,
no. 22, 2017.
[24] L. Wu, L. Yuan and J. You, "Survey of Large-Scale Data Management Systems for Big Data
Applications," Journal of Computer Science and Technology, vol. 30, no. 1, pp. 163-183, 2015.
[25] J. T. Edwards, "Reference Fuels for Combustion Testing," in 55th AIAA Aerospace Sciences
Meeting, AIAA SciTech Forum, Grapevine, Texas, 2017.
[26] T. Edwards, J. M. Stricker and W. E. Harrison III, "Handbook of Aviation Fuel Properties, 3rd
Edition," SAE, Alpharetta, GA, 2004.
[27] Exxon Mobil Corporation, "Jet A/Jet A-1," [Online]. Available:
https://www.exxonmobil.com/en/aviation/products-and-services/products/jet-a-jet-a-1.
[Accessed 10 09 2018].
[28] N. K. Patel and S. N. Shah, "Biodiesel from Plant Oils," in Food, Energy, and Water, Calabash,
NC, Elsevier, 2015, pp. 278-304.
[29] "D664-17: Standard Test Method for Acid Number of Petroleum Products by Potentiometric
Titration," ASTM International, Conshohocken, PA, 2017.
[30] J. L. Graham, R. C. Striebach, K. J. Myers, D. K. Minus and W. E. Harrison III, "Swelling of
Nitrile Rubber by Selected Aromatics Blended in a Synthetic Jet Fuel," Energy & Fuels, vol. 20,
no. 2, pp. 759-765, 2006.
[31] G. Knothe, J. Krahl and J. Van Gerpen, The Biodiesel Handbook, Champaign, IL: AOCS Press,
2005.
[32] "D976-06: Standard Test Method for Calculated Cetane Index of Distillate Fuels," ASTM
International, Conshohocken, PA, 2013.
[33] "D130-18: Standard Test Method for Corrosiveness to Copper from Petroleum Products by
Copper Strip Test," ASTM International, Conshohocken, PA, 2018.
[34] "D86-17: Standard Test for Distillation of Petroleum Products and Liquid Fuels at Atmospheric
Pressure," ASTM International, Conshohocken, PA, 2017.
[35] "D2386-15: Standard Test Method for Freezing Point of Aviation Fuels," ASTM International,
Conshohocken, PA, 2015.
[36] S. T. Browne, H. Wong, C. B. Hinderer and J. Klettinger, "Enhancement of Aviation Fuel
Thermal Stability Characterization Through Application of Ellipsometry," NASA, Cleveland,
Ohio, 2012.
50
[37] E. Stauffer, J. A. Dolan and R. Newman, "Gas Chromatography and Gas Chromatography -
Mass Spectrometry," in Fire Debris Analysis, Academic Press, 2008, pp. 235-293.
[38] R. C. Striebach, L. M. Shafer, R. K. Adams, Z. J. West, M. J. Dewitt and S. Zabarnick,
"Hydrocarbon Group-Type Analysis of Petroleum-Derived and Synthetic Fuels Using Two-
Dimensional Gas Chromatography," Energy & Fuels, vol. 28, pp. 5696-5706, 2014.
[39] O. Rolland and F. Garcia, "Evaluation of Synthesized Iso-Paraffins produced from
Hydroprocessed Fermented Sugars (SIP Fuels), Research Report Final Version," Total New
Energies, Amyris Inc., 2014.
[40] E. Bermudez, A. McDaniel, T. Dickerson, D. L. Prak, L. Hamilton and J. Cowart, "START-UP
AND STEADY-STATE PERFORMANCE OF A NEW RENEWABLE HYDROPROCESSED
DEPOLYMERIZED CELLULOSIC DIESEL (HDCD) FUEL IN MULTIPLE DIESEL
ENGINES," in Proceedings of the ASME 2015 Internal Combustion Engine Division Fall
Technical Conference, Houston, 2015.
[41] S. H. Won, P. S. Veloo, S. Dooley, J. Santner, F. M. Haas, Y. Ju and F. L. Dryer, "Predicting the
global combustion behaviors of petroleum-derived and alternative jet fuels by simple fuel
property measurements," Fuel, vol. 168, pp. 34-46, 2016.
[42] J. O. Rawling, S. G. Pantula and D. A. Dickey, "Models with Several Independent Variables," in
Applied Regression Analysis: A Research Tool, Second Edition, New York, Springer, 1998, pp.
27-29.
[43] J. Solash, R. N. Hazlett, J. M. Hall and C. J. Nowack, "Relation between fuel properties and
chemical composition 1. Jet fuels from coal, oil shale and tar sands," Fuel, vol. 57, pp. 521-528,
1978.
51
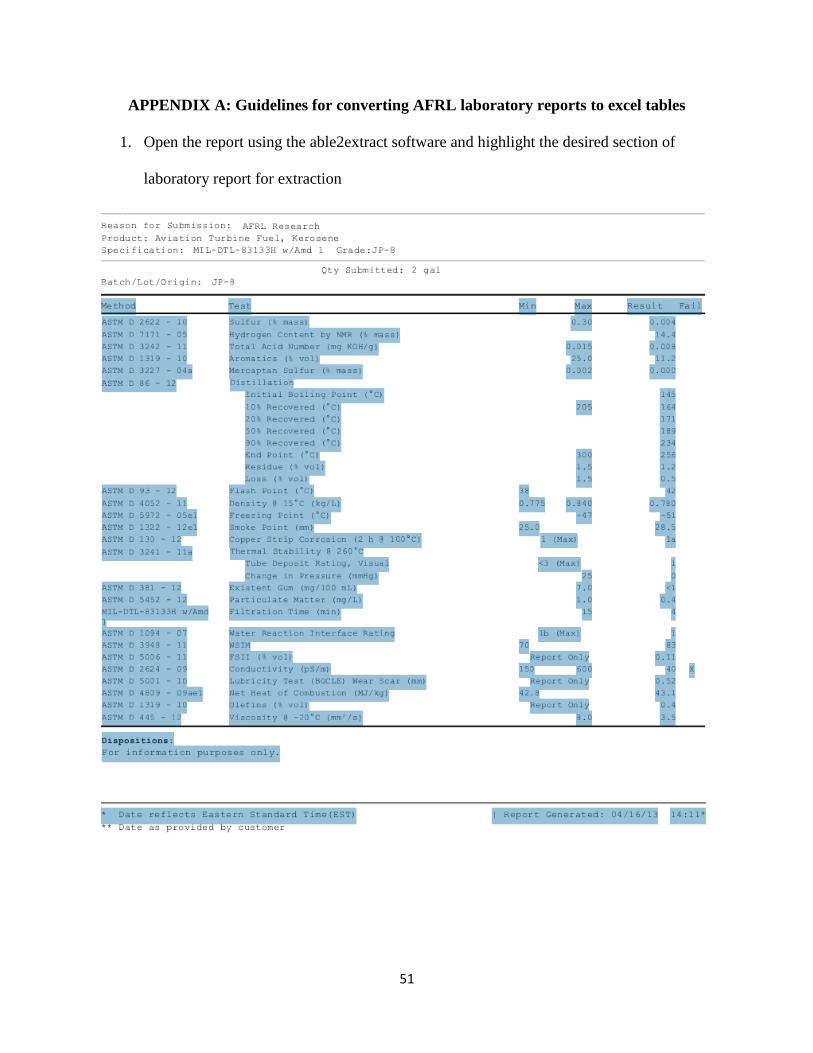
APPENDIX A: Guidelines for converting AFRL laboratory reports to excel tables
1. Open the report using the able2extract software and highlight the desired section of
laboratory report for extraction
52
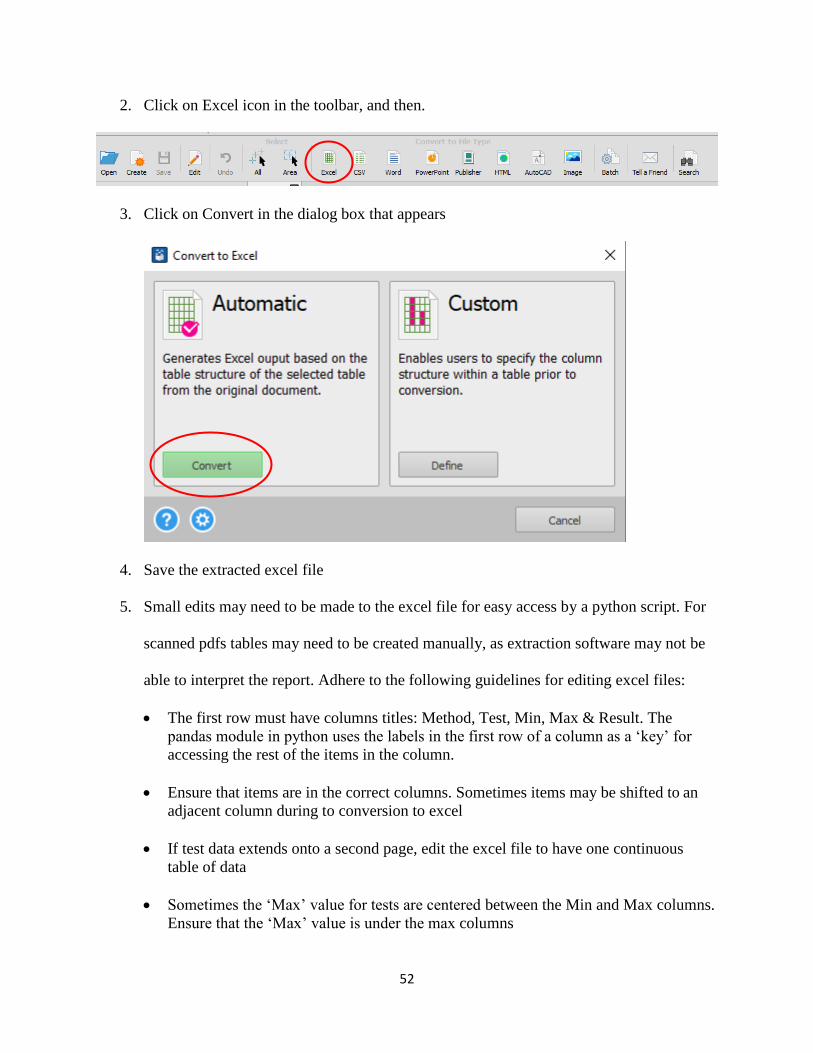
2. Click on Excel icon in the toolbar, and then.
3. Click on Convert in the dialog box that appears
4. Save the extracted excel file
5. Small edits may need to be made to the excel file for easy access by a python script. For
scanned pdfs tables may need to be created manually, as extraction software may not be
able to interpret the report. Adhere to the following guidelines for editing excel files:
• The first row must have columns titles: Method, Test, Min, Max & Result. The
pandas module in python uses the labels in the first row of a column as a ‘key’ for
accessing the rest of the items in the column.
• Ensure that items are in the correct columns. Sometimes items may be shifted to an
adjacent column during to conversion to excel
• If test data extends onto a second page, edit the excel file to have one continuous
table of data
• Sometimes the ‘Max’ value for tests are centered between the Min and Max columns.
Ensure that the ‘Max’ value is under the max columns
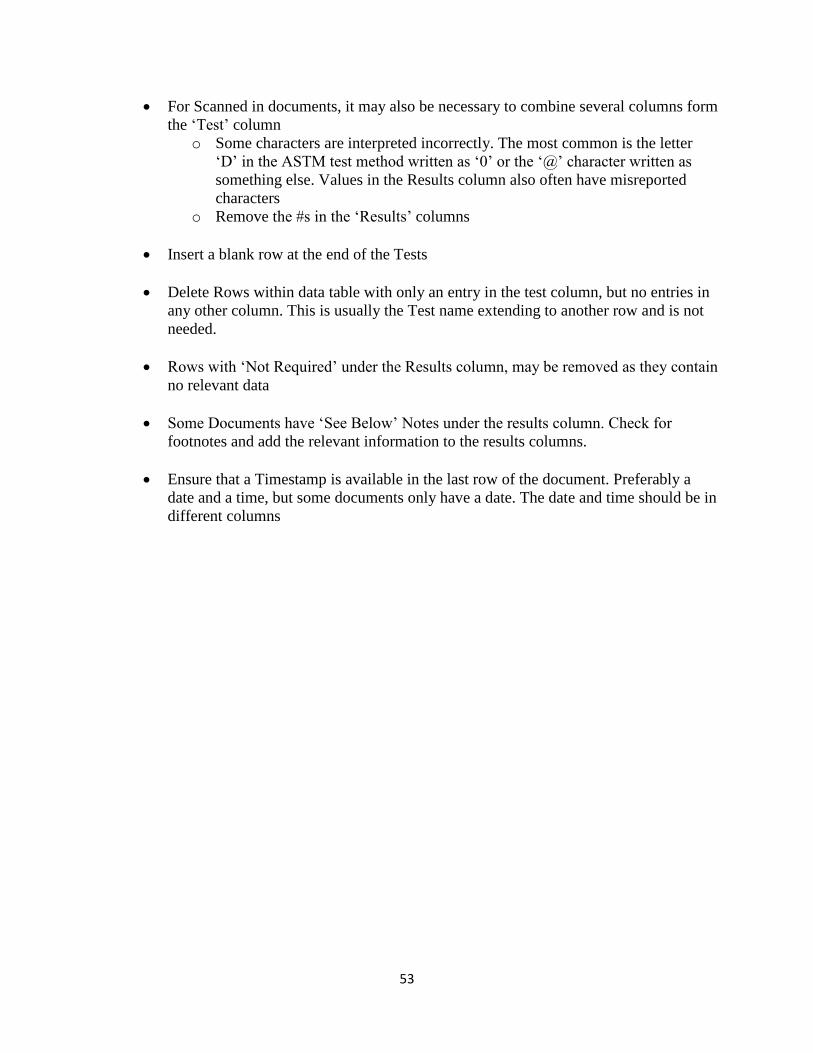
53
• For Scanned in documents, it may also be necessary to combine several columns form
the ‘Test’ column
o Some characters are interpreted incorrectly. The most common is the letter
‘D’ in the ASTM test method written as ‘0’ or the ‘@’ character written as
something else. Values in the Results column also often have misreported
characters
o Remove the #s in the ‘Results’ columns
• Insert a blank row at the end of the Tests
• Delete Rows within data table with only an entry in the test column, but no entries in
any other column. This is usually the Test name extending to another row and is not
needed.
• Rows with ‘Not Required’ under the Results column, may be removed as they contain
no relevant data
• Some Documents have ‘See Below’ Notes under the results column. Check for
footnotes and add the relevant information to the results columns.
• Ensure that a Timestamp is available in the last row of the document. Preferably a
date and a time, but some documents only have a date. The date and time should be in
different columns
54
APPENDIX B: Python scripts for extracting AFRL fuel data from excel files

55
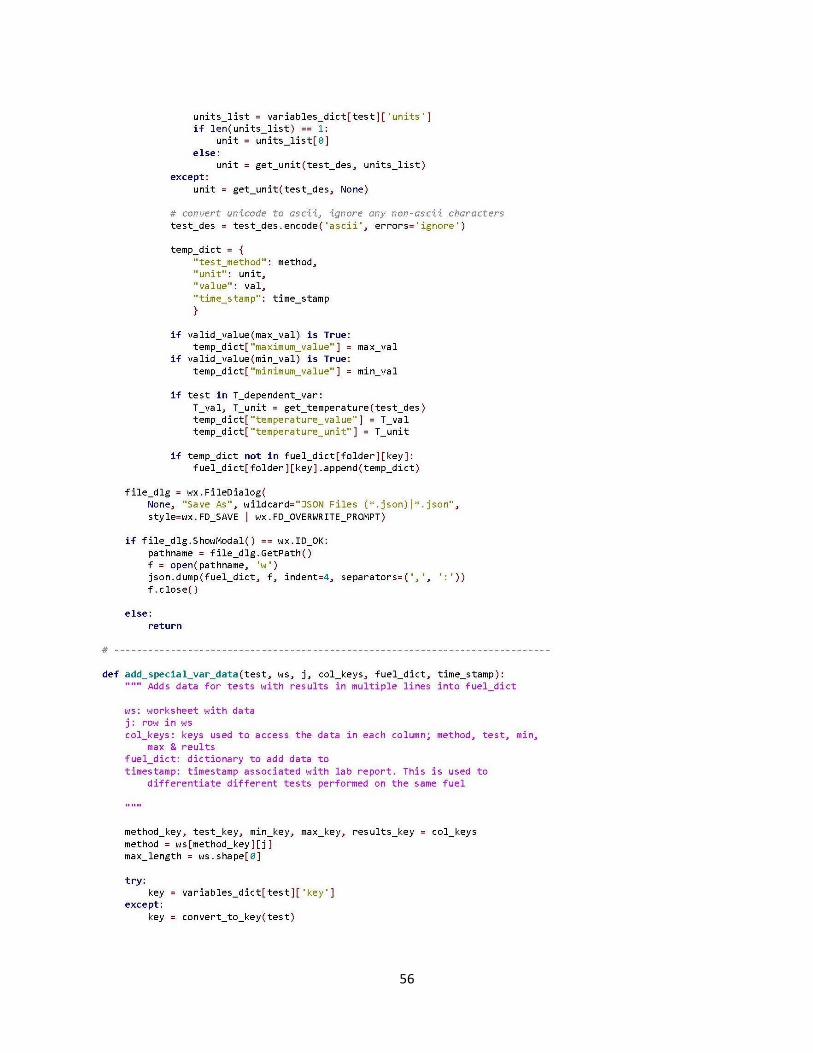
56
57
58
59
60
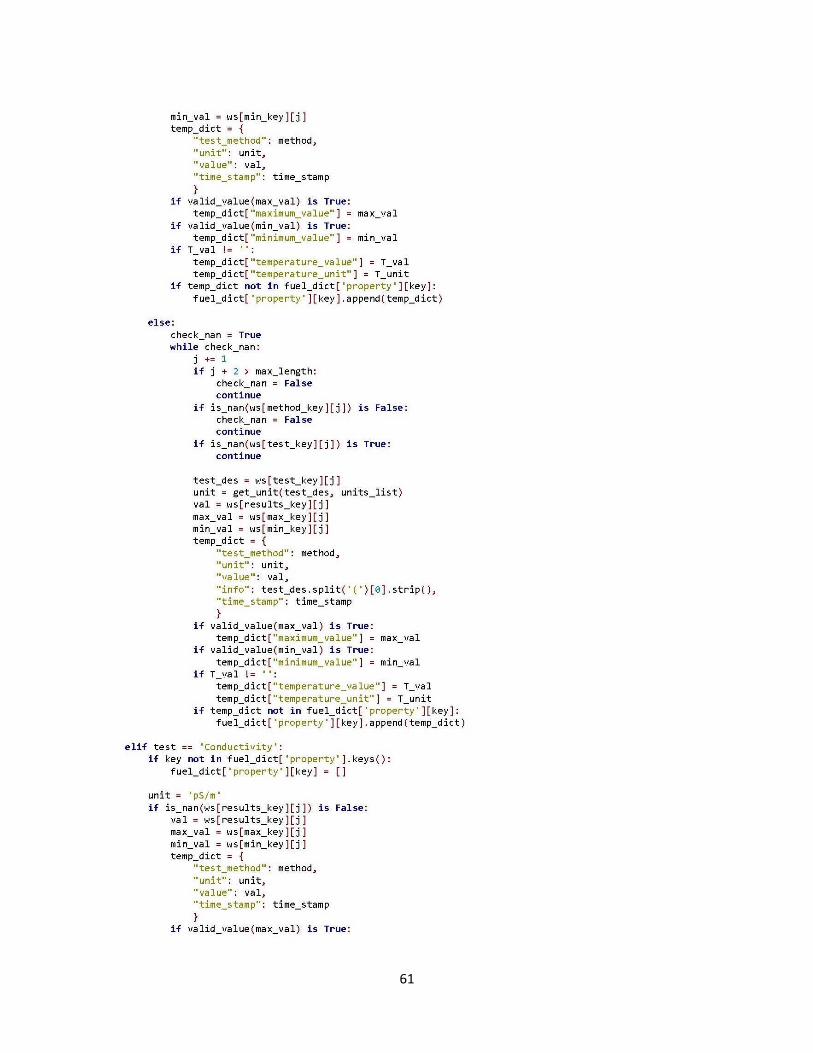
61
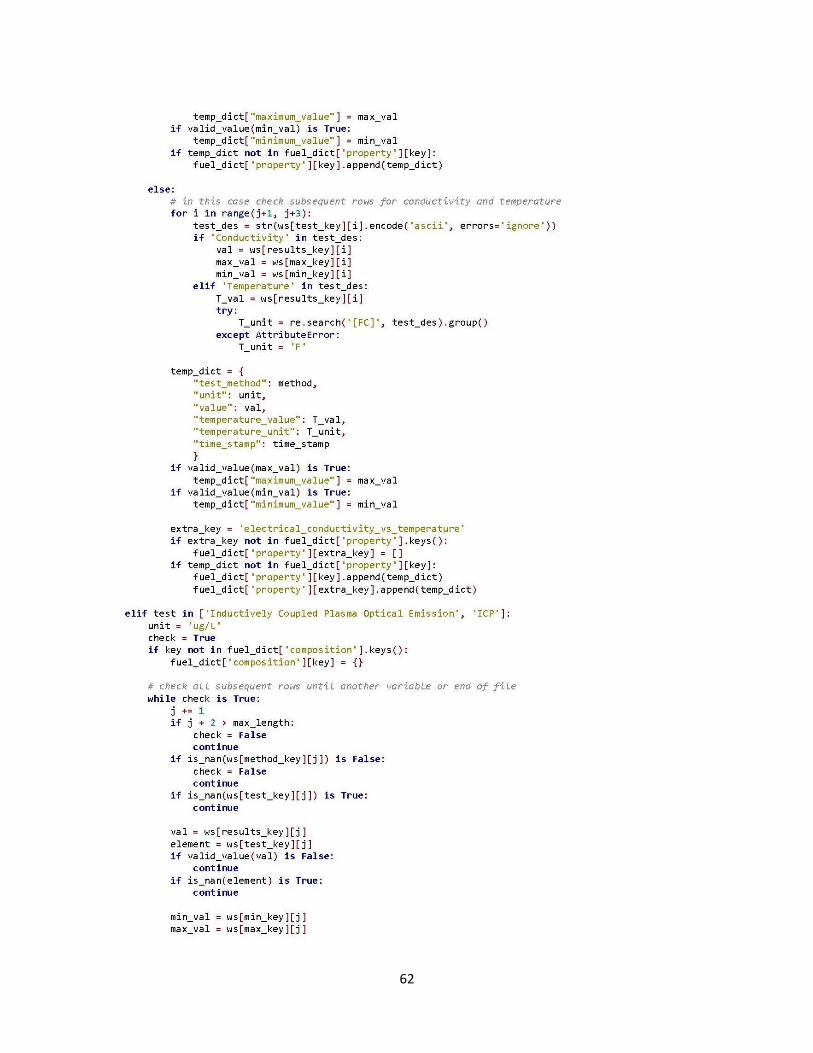
62

63
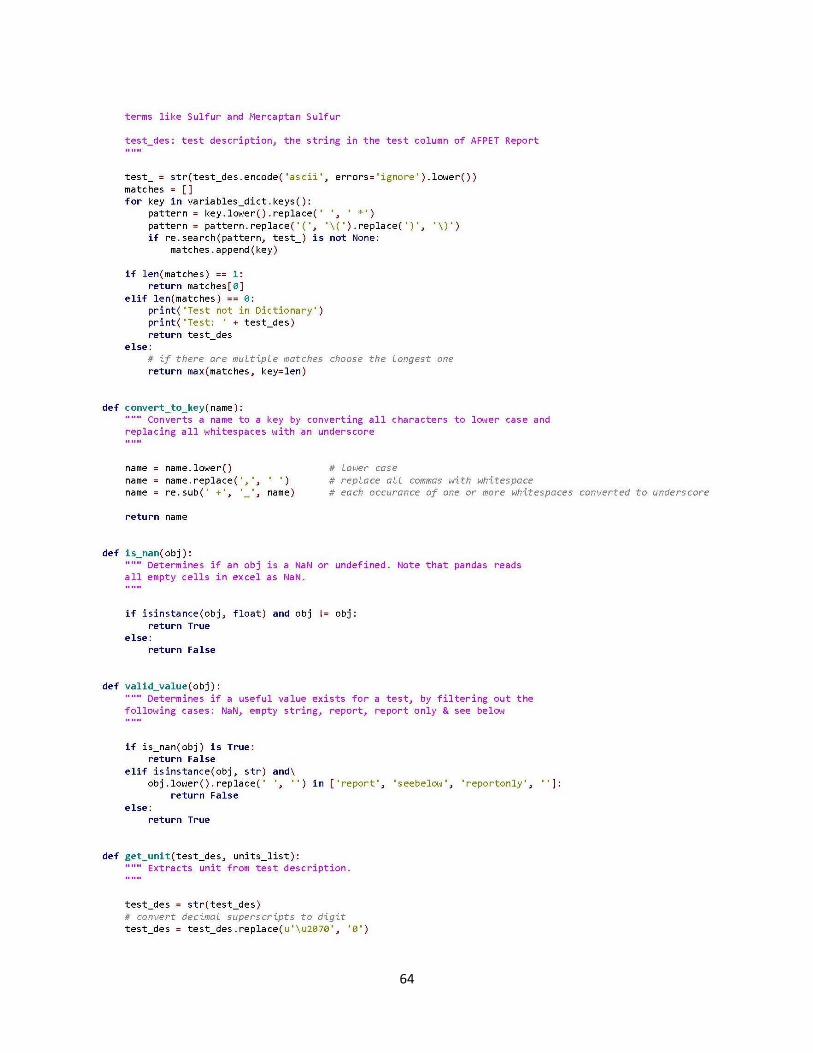
64
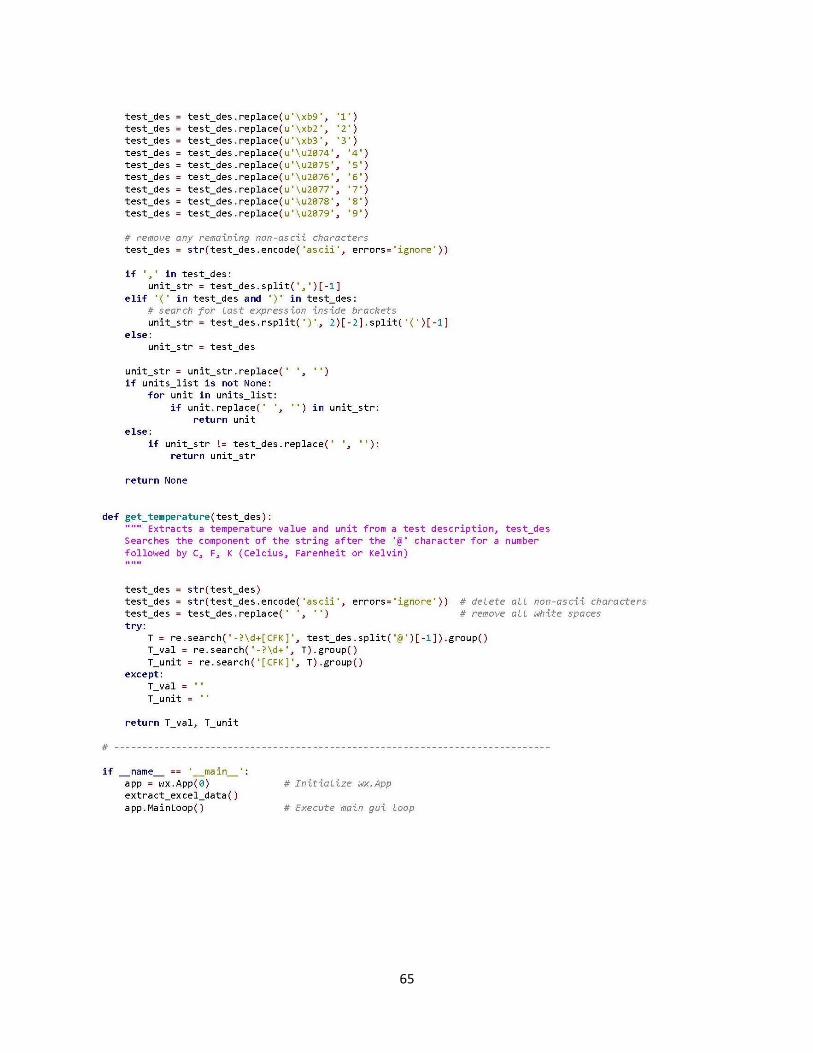
65
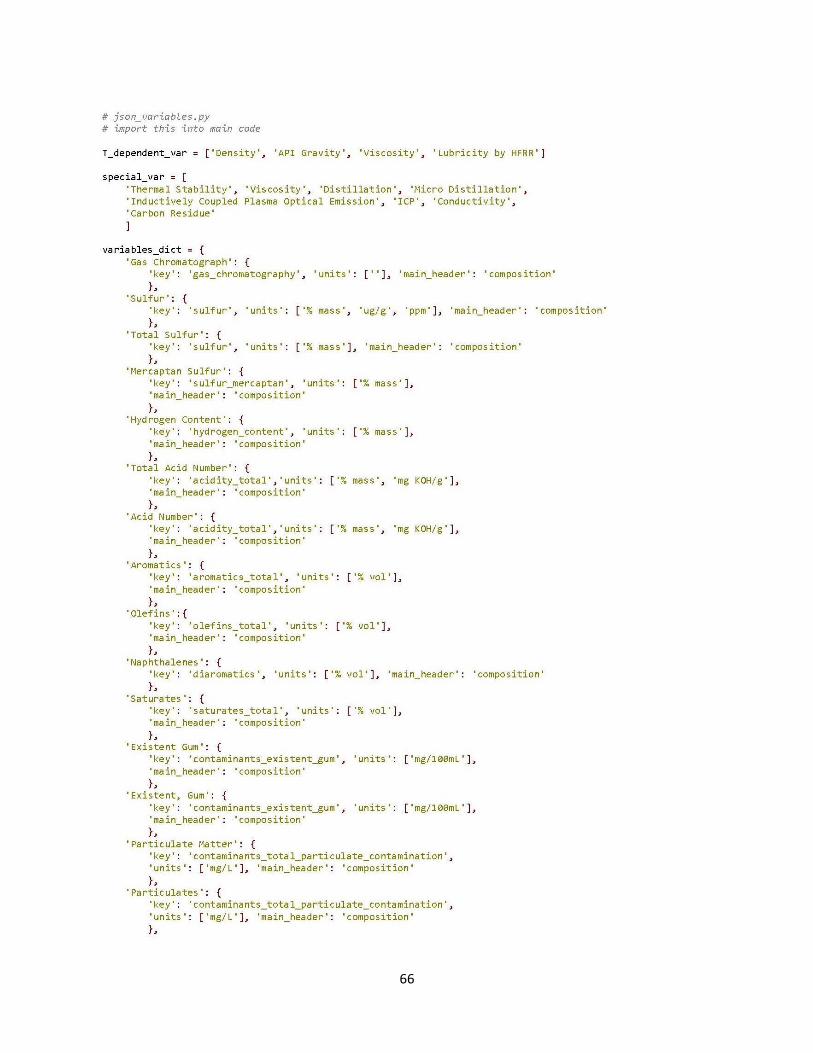
66
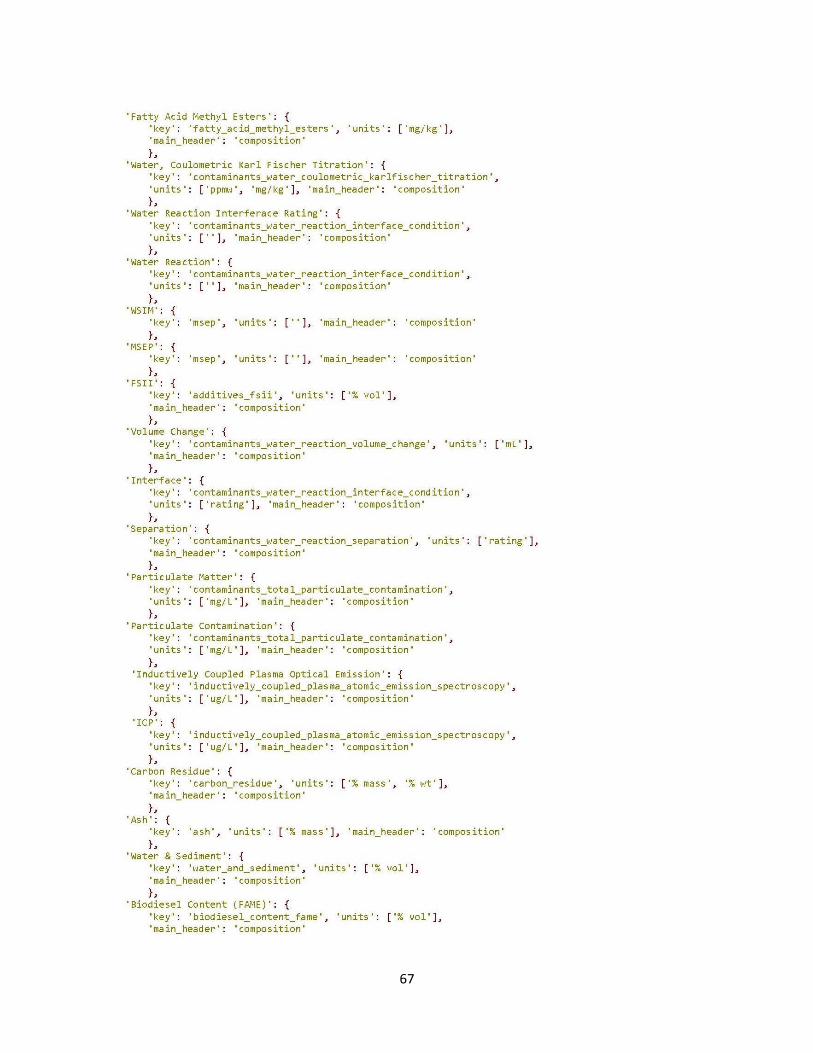
67
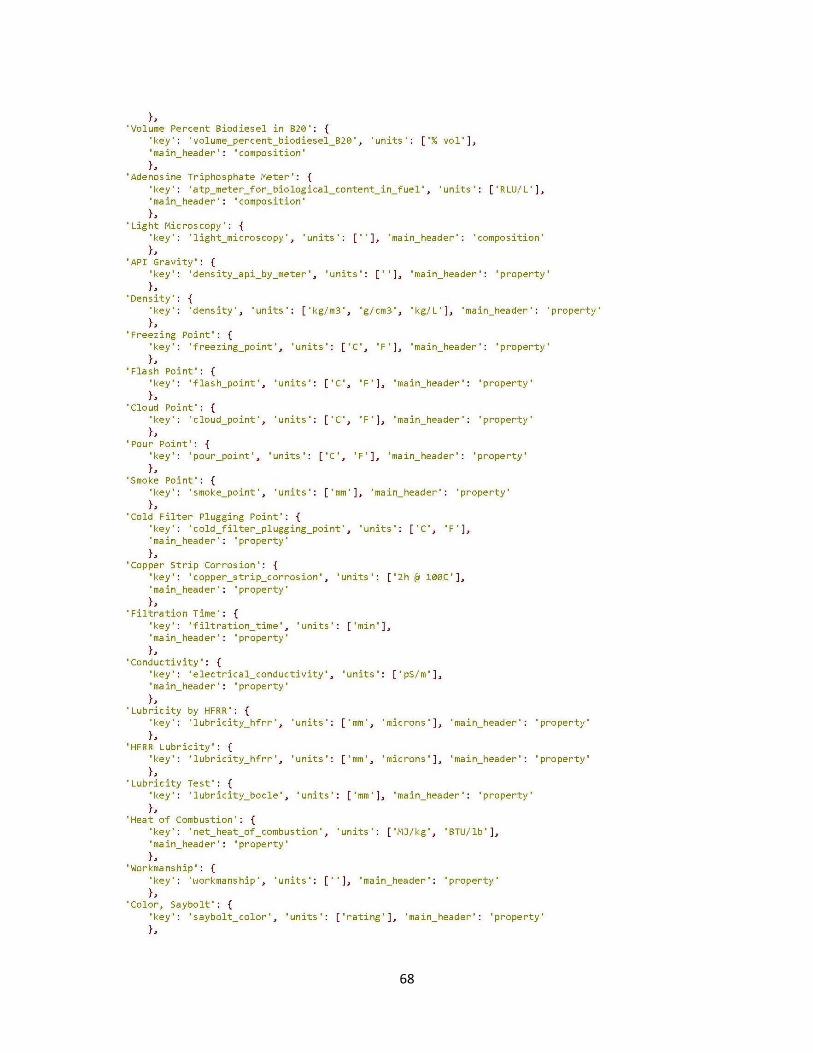
68
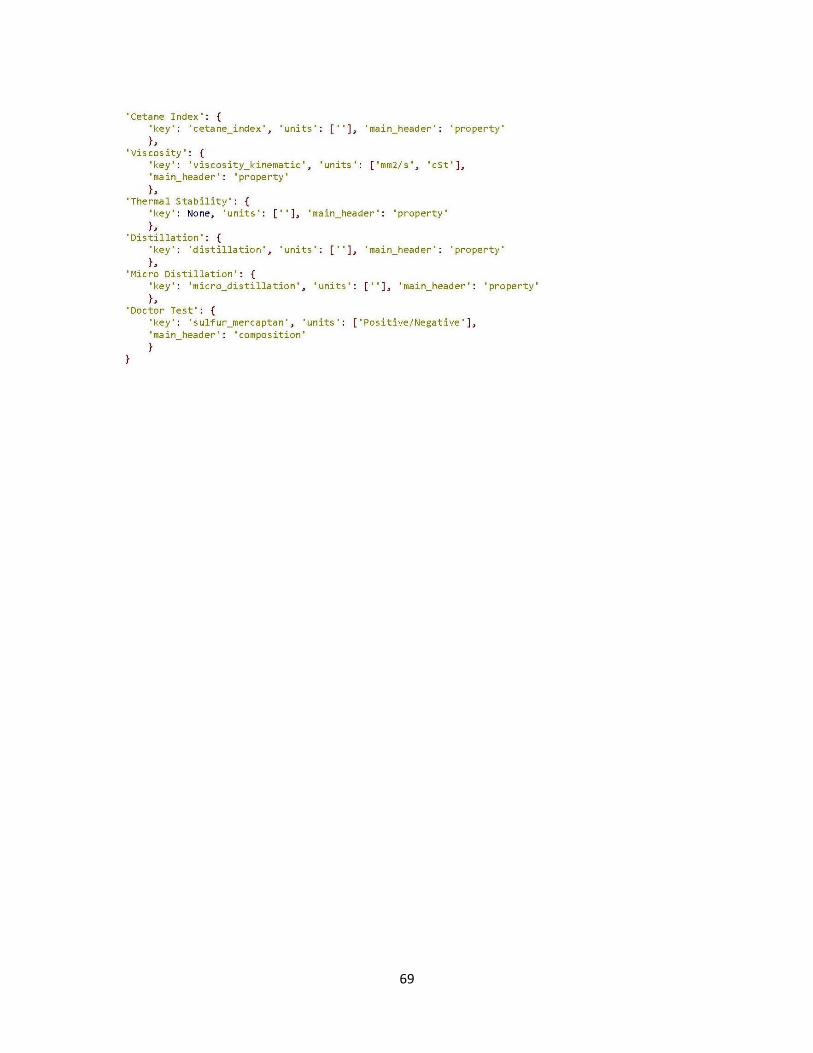
69