Embed Size (px)
Citation preview
1st International Conference of Underground Mining
October 19-21, 2016, Santiago, Chile
Development of a Fire Modeling Study for the Chuquicamata
Underground Mine
Brian Prosser, Mine Ventilation Services – SRK
Sergio Valencia Briones, Codelco‐Chuquicamata
Jess Van Diest, Mine Ventilation Services – SRK
Roberto Alvarez Zuñiga, Codelco – Chuquicamata
Alvaro Gonzalez Marin, Codelco ‐ Chuquicamata
Gonzalo Lasagna Barrena, Codelco ‐ Chuquicamata
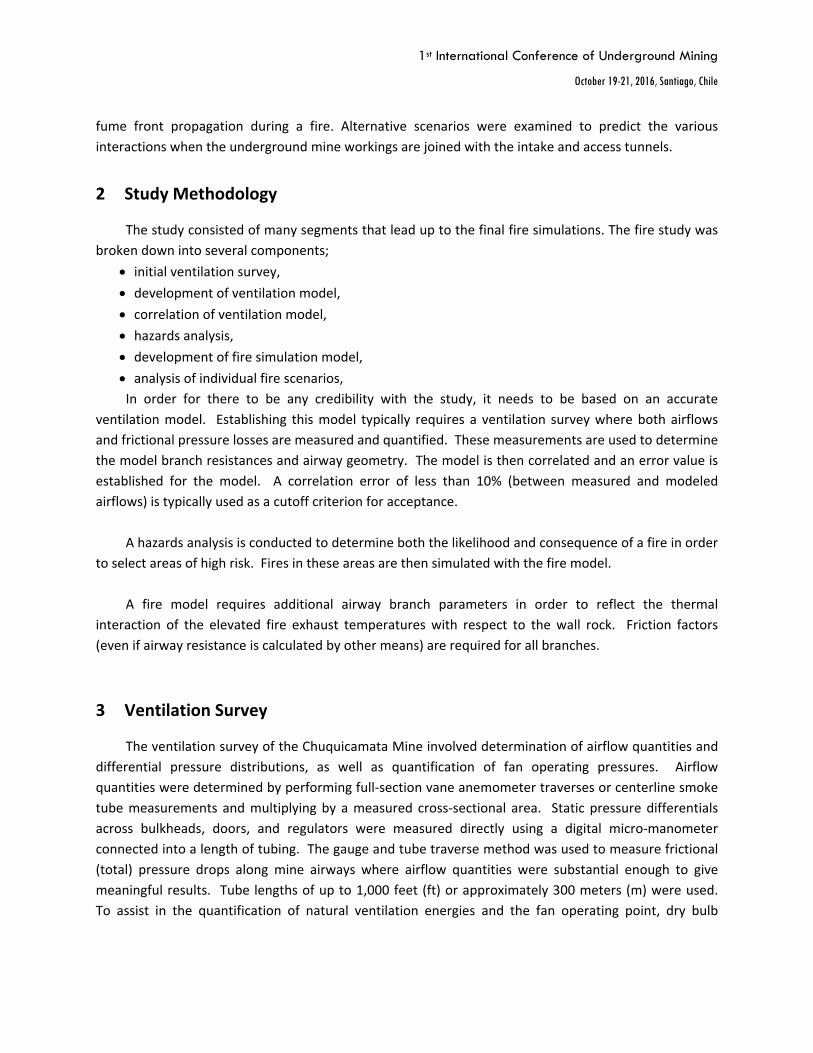
Abstract
The addition of fire modeling during the development of a ventilation system design can greatly
enhance the safety aspects of the mine. When a fire modeling program is developed in conjunction with
the ventilation design then mitigation aspects and infrastructure can be included in the design process.
Understanding how the ventilation system will respond to fires in key or high risk/consequence areas is
a foundational building block for the ventilation design. The ventilation system for the new
Chuquicamata underground block cave mine is in the intermediate stages of development. During
November 2015 a fire modeling study was developed that established a correlated ventilation model
that was used to simulate fire scenarios at key locations in the mine. The study was used to determine
the placement and application of key mitigation infrastructure and to identify the consequences of a fire
including fume spread, heat, and air reversals. This paper will describe the methodology and results of
the fire modeling study.
1 Introduction
The Chuquicamata underground mine is located in the northern Atacama Desert and is part of the
Chuquicamata mining complex. The economical ore reserves accessed from the central open pit mine at
the Codelco Chuquicamata mining complex is being rapidly depleted. To continue mining operations a
decision was made to develop an underground block cave mine below the existing open pit. The
development of workings needed to support the new block cave mine require a significant amount of
equipment, personnel, and construction headings. The close proximity of personnel, equipment, and
development areas greatly elevates both the risks and consequences of a fire. In 2015, Codelco and
MVS/SRK performed a fire modeling study for the current underground developments at the
Chuquicamata Mine. The study started with a full pressure/quantity ventilation survey to develop an
accurate correlated ventilation model. The correlated model was used as a basis for the fire simulation
models. The fire models are computer simulations used to predict temperatures, airflow reversals, and
1st International Conference of Underground Mining
October 19-21, 2016, Santiago, Chile
fume front propagation during a fire. Alternative scenarios were examined to predict the various
interactions when the underground mine workings are joined with the intake and access tunnels.
2 Study Methodology
The study consisted of many segments that lead up to the final fire simulations. The fire study was
broken down into several components;
initial ventilation survey, development of ventilation model,
correlation of ventilation model,
hazards analysis, development of fire simulation model,
analysis of individual fire scenarios, In order for there to be any credibility with the study, it needs to be based on an accurate
ventilation model. Establishing this model typically requires a ventilation survey where both airflows
and frictional pressure losses are measured and quantified. These measurements are used to determine
the model branch resistances and airway geometry. The model is then correlated and an error value is
established for the model. A correlation error of less than 10% (between measured and modeled
airflows) is typically used as a cutoff criterion for acceptance.
A hazards analysis is conducted to determine both the likelihood and consequence of a fire in order
to select areas of high risk. Fires in these areas are then simulated with the fire model.
A fire model requires additional airway branch parameters in order to reflect the thermal
interaction of the elevated fire exhaust temperatures with respect to the wall rock. Friction factors
(even if airway resistance is calculated by other means) are required for all branches.
3 Ventilation Survey
The ventilation survey of the Chuquicamata Mine involved determination of airflow quantities and
differential pressure distributions, as well as quantification of fan operating pressures. Airflow
quantities were determined by performing full‐section vane anemometer traverses or centerline smoke
tube measurements and multiplying by a measured cross‐sectional area. Static pressure differentials
across bulkheads, doors, and regulators were measured directly using a digital micro‐manometer
connected into a length of tubing. The gauge and tube traverse method was used to measure frictional
(total) pressure drops along mine airways where airflow quantities were substantial enough to give
meaningful results. Tube lengths of up to 1,000 feet (ft) or approximately 300 meters (m) were used.
To assist in the quantification of natural ventilation energies and the fan operating point, dry bulb
1st International Conference of Underground Mining
October 19-21, 2016, Santiago, Chile
temperature, relative humidity and barometric pressure were also measured at key locations
throughout the mine.
Quality assurance procedures were adhered to throughout the ventilation survey with at least two
velocity readings taken at each airflow station and evaluated for consistency. Readings deviating more
than 10% from each other were repeated as necessary. At ventilation airstream splits, measurements
were taken to ensure adherence to Kirchhoff's First Law of airflow (the sum of the airflow entering a
junction equals the sum of the airflow exiting a junction). In order to define airway resistances
accurately, measurements of frictional pressure drop were taken at approximately the same location
and time as measurements of airflow. Where possible, frictional pressure drop traverses were
performed around closed loops and the data checked for adherence to Kirchhoff's Second Law (the
algebraic sum of the frictional pressure drops around any closed circuit must equate to zero, after
having accounted for fans and Natural Ventilation Pressure [NVP]).
4 Ventilation Model Development
The ventilation network simulation software used to establish the network model of the
Chuquicamata Mine was the VnetPC Pro program. Using data obtained from ventilation surveys or
determined from known airway dimensions and characteristics, existing ventilation networks can be
simulated in such a manner that airflow rates, frictional pressure drops and fan operating points
approximate those of the actual system.
Branch resistances, determined from measured survey data along with empirical methods,
measured fan pressures and calculated natural ventilation pressures were input to the VnetPC Pro
program.
The overall network correlation error is computed by dividing the sum of the absolute differences
between measured and predicted flow for each branch by the total measured flow, as shown below in
Eq(1):
%100FlowMeasuredTotal
Flow Predicted - Flow Measured nCorrelatio
(1)
A correlation error of less than 10% is desired to ensure the model is sufficiently accurate to
provide the basis for future ventilation planning.
The ventilation model created for the Chuquicamata Mine had a correlation error of approximately
5.4%. There are various factors contributing to this error. Although the overall ventilation quantity of the
mine will remain relatively constant if no major changes are made to the system, some local variances
will occur during the course of normal activity. Airflows in local areas are affected by traffic, mucking,
and auxiliary ventilation
1st International Conference of Underground Mining
October 19-21, 2016, Santiago, Chile
While the model adequately represents the ventilation system at the time the survey was
conducted, it displays differences that vary from the measured data. Total airflow in the Chuquicamata
Mine closely approximates measured data; however, individual airflow quantities for each entry differ
due to traffic in the respective areas.
It is important to remember that this ventilation model represents the ventilation system at a given
point in time and it will need to be maintained and updated based on the current conditions of the
mine.
4.1 Frictional Pressure Differentials
Frictional pressure differentials measured across regulators, bulkheads, and along the main entries
were plotted on field maps. The pressure differentials were measured in all accessible locations where
airflow quantities were significant enough to produce meaningful frictional pressure drops.
4.2 Measurements of Psychrometric Properties
Measurements of barometric pressure, dry bulb temperature and relative humidity were taken at a
number of locations throughout the mine. These psychrometric properties were used to compute air
density for evaluation of the natural ventilation pressure, air expansion and to define the fan operating
points. Results of these calculations can be found in Appendix A with the calculated NVP.
4.3 Fan Measurement
Pressure measurements were obtained during the ventilation survey of the Chuquicamata
Underground Mine and development areas. Throughout the report the fan pressure values referenced
are fan total pressure, which are given at average mine air density, shown in Table 1. Information for
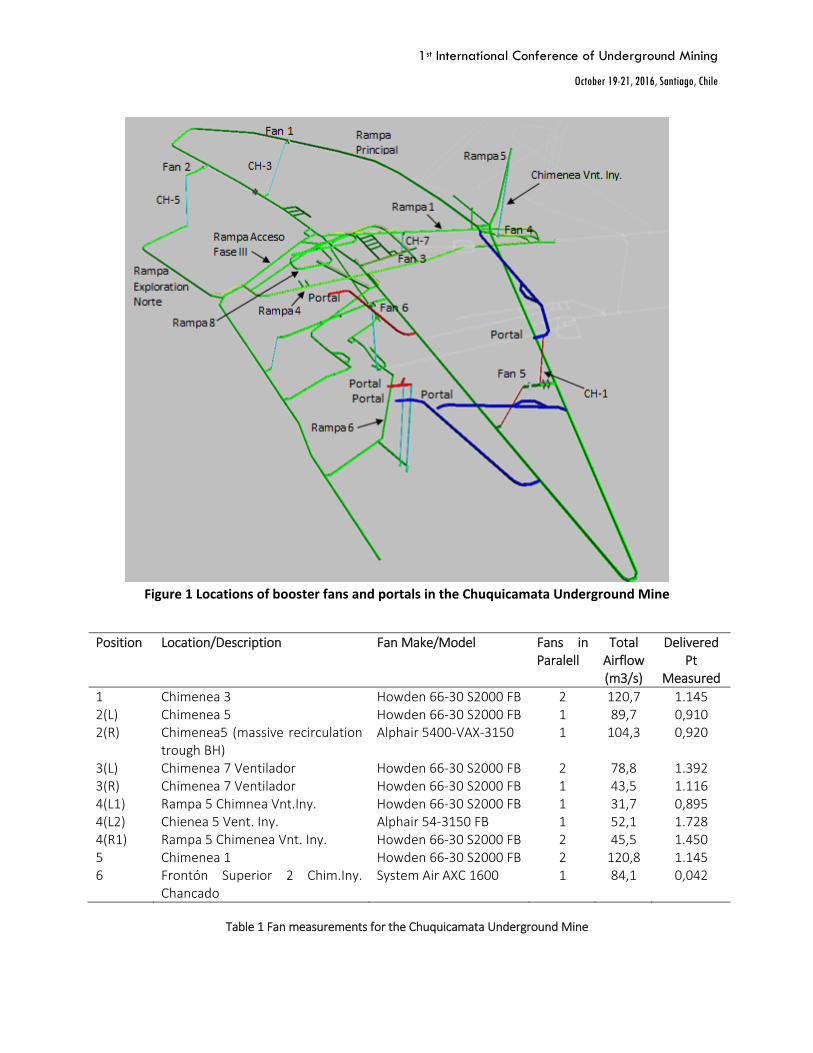
voltage, current, and power factor was not available. The location of these fans are shown in Figure 1.
1st International Conference of Underground Mining
October 19-21, 2016, Santiago, Chile
Figure 1 Locations of booster fans and portals in the Chuquicamata Underground Mine
Position Location/Description Fan Make/Model Fans in Paralell
Total Airflow (m3/s)
Delivered Pt
Measured
1 Chimenea 3 Howden 66‐30 S2000 FB 2 120,7 1.145 2(L) Chimenea 5 Howden 66‐30 S2000 FB 1 89,7 0,910 2(R) Chimenea5 (massive recirculation
trough BH) Alphair 5400‐VAX‐3150 1 104,3 0,920
3(L) Chimenea 7 Ventilador Howden 66‐30 S2000 FB 2 78,8 1.392 3(R) Chimenea 7 Ventilador Howden 66‐30 S2000 FB 1 43,5 1.116 4(L1) Rampa 5 Chimnea Vnt.Iny. Howden 66‐30 S2000 FB 1 31,7 0,895 4(L2) Chienea 5 Vent. Iny. Alphair 54‐3150 FB 1 52,1 1.728 4(R1) Rampa 5 Chimenea Vnt. Iny. Howden 66‐30 S2000 FB 2 45,5 1.450 5 Chimenea 1 Howden 66‐30 S2000 FB 2 120,8 1.145 6 Frontón Superior 2 Chim.Iny.
Chancado System Air AXC 1600 1 84,1 0,042
Table 1 Fan measurements for the Chuquicamata Underground Mine
1st International Conference of Underground Mining
October 19-21, 2016, Santiago, Chile
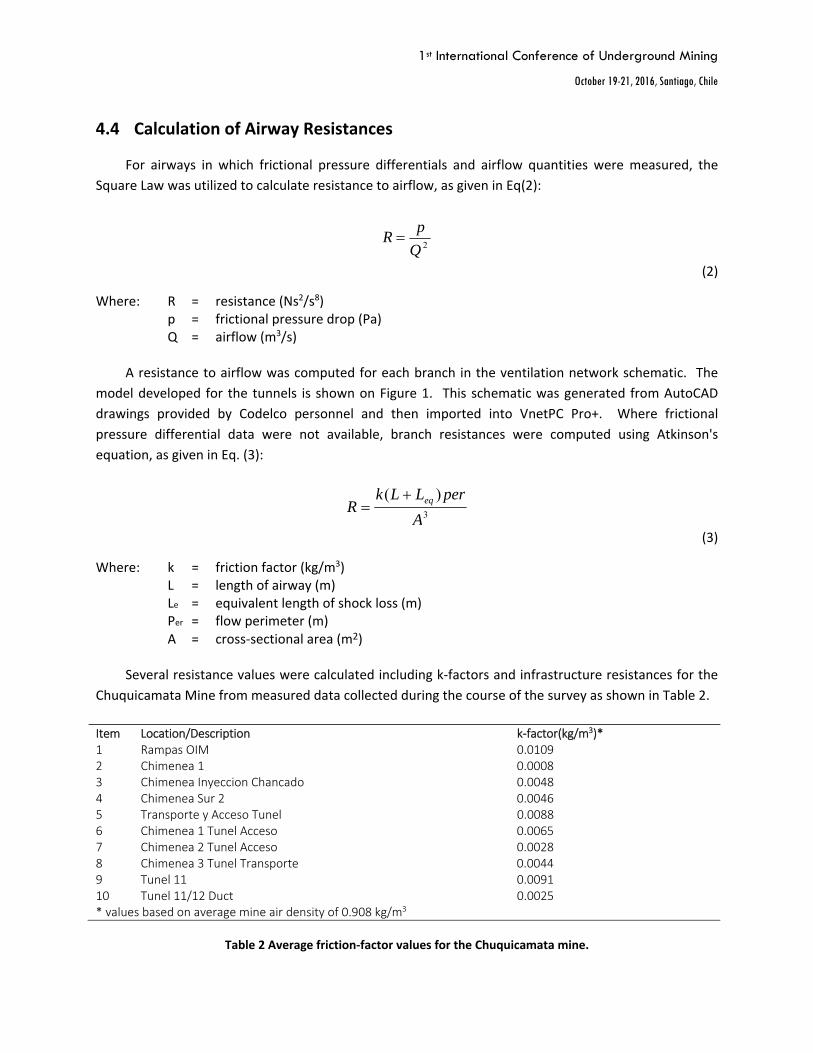
4.4 Calculation of Airway Resistances
For airways in which frictional pressure differentials and airflow quantities were measured, the
Square Law was utilized to calculate resistance to airflow, as given in Eq(2):
2Q
pR
(2)
Where: R = resistance (Ns2/s8) p = frictional pressure drop (Pa) Q = airflow (m3/s)
A resistance to airflow was computed for each branch in the ventilation network schematic. The
model developed for the tunnels is shown on Figure 1. This schematic was generated from AutoCAD
drawings provided by Codelco personnel and then imported into VnetPC Pro+. Where frictional
pressure differential data were not available, branch resistances were computed using Atkinson's
equation, as given in Eq. (3):
3
)(
A
perLLkR eq
(3)
Where: k = friction factor (kg/m3) L = length of airway (m) Le = equivalent length of shock loss (m) Per = flow perimeter (m) A = cross‐sectional area (m2)
Several resistance values were calculated including k‐factors and infrastructure resistances for the
Chuquicamata Mine from measured data collected during the course of the survey as shown in Table 2.
Item Location/Description k‐factor(kg/m3)* 1 Rampas OIM 0.01092 Chimenea 1 0.00083 Chimenea Inyeccion Chancado 0.00484 Chimenea Sur 2 0.00465 Transporte y Acceso Tunel 0.00886 Chimenea 1 Tunel Acceso 0.00657 Chimenea 2 Tunel Acceso 0.00288 Chimenea 3 Tunel Transporte 0.00449 Tunel 11 0.009110 Tunel 11/12 Duct 0.0025* values based on average mine air density of 0.908 kg/m3
Table 2 Average friction‐factor values for the Chuquicamata mine.
1st International Conference of Underground Mining
October 19-21, 2016, Santiago, Chile
5 Hazards and Scenario Identification
At the beginning of the study a hazards analysis was performed by the mine engineering personnel
in order to identify likely fire locations and locations of high consequence. Sources of underground mine
fires at the Chuquicamata Mine include:
1. Mobile diesel mining equipment
2. Other vehicles, buses, transport trucks, service vehicles, etc.
3. Electrical substations
4. Compressor stations
5. Electric motors on various machines and pumps
6. Oil/Lubricant storage areas
7. Diesel fueling/storage bays
8. Sulfide dust (spontaneous and flash combustion) and at dry dust collectors
9. Grinding/welding areas in shops
10. Shop maintenance areas
11. General housekeeping (e.g. trash, etc.)
12. Electrical cable sheathing
13. Powder/explosive magazine
14. Lunch room, offices
15. Tires and wood in warehouse
16. Compressed gas storage facilities
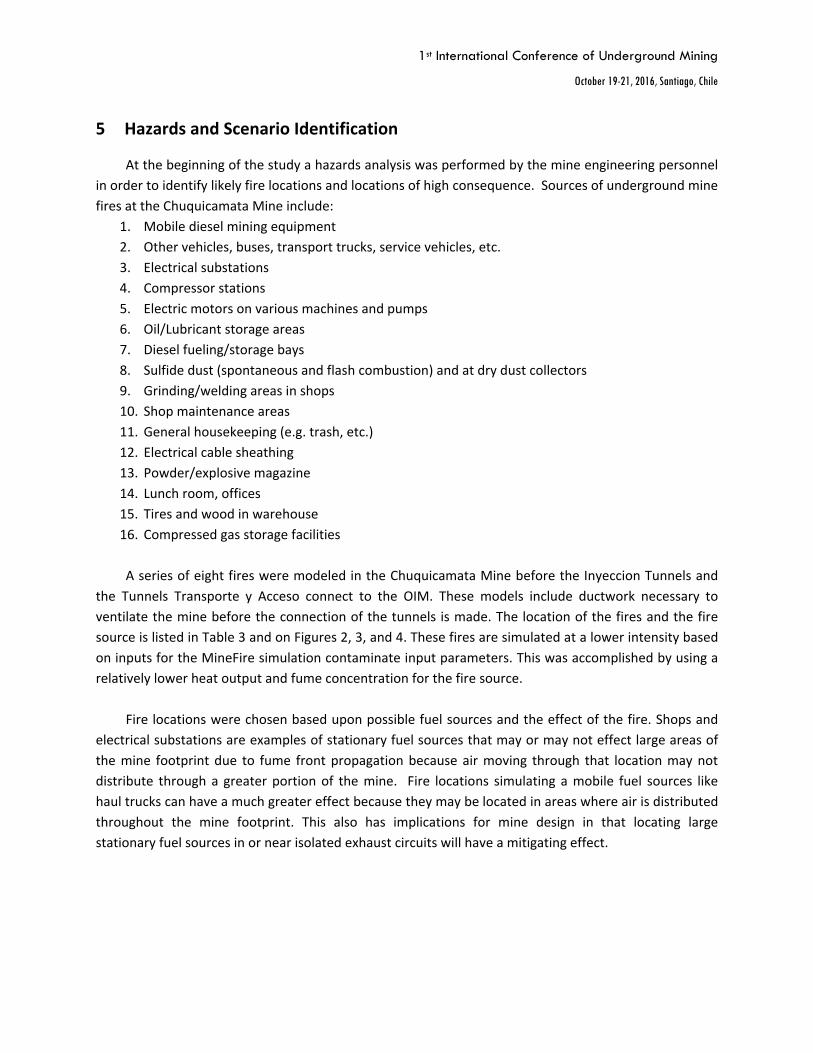
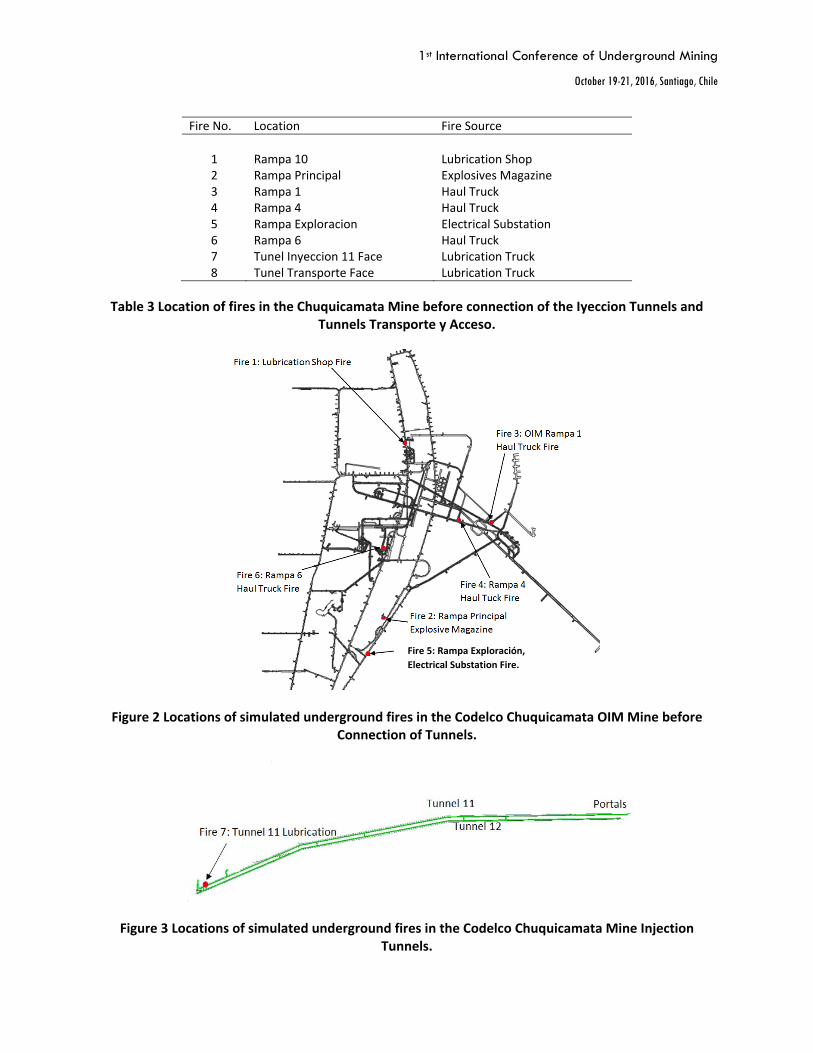
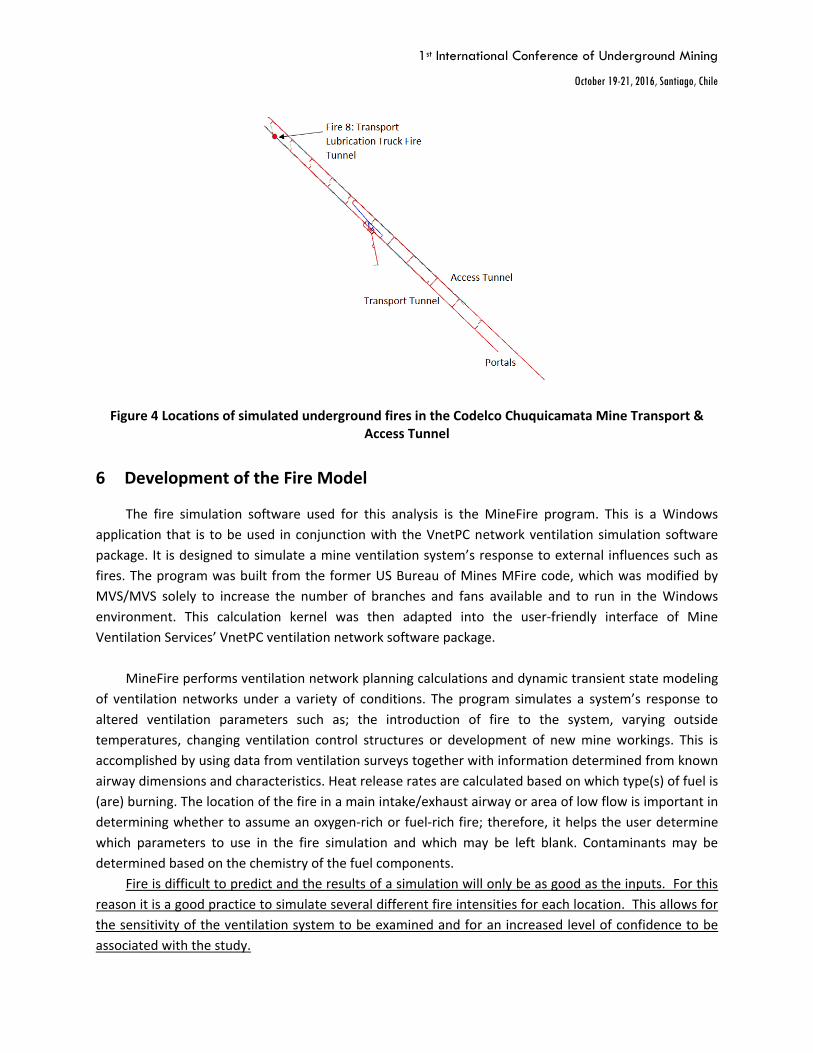
A series of eight fires were modeled in the Chuquicamata Mine before the Inyeccion Tunnels and
the Tunnels Transporte y Acceso connect to the OIM. These models include ductwork necessary to
ventilate the mine before the connection of the tunnels is made. The location of the fires and the fire
source is listed in Table 3 and on Figures 2, 3, and 4. These fires are simulated at a lower intensity based
on inputs for the MineFire simulation contaminate input parameters. This was accomplished by using a
relatively lower heat output and fume concentration for the fire source.
Fire locations were chosen based upon possible fuel sources and the effect of the fire. Shops and
electrical substations are examples of stationary fuel sources that may or may not effect large areas of
the mine footprint due to fume front propagation because air moving through that location may not
distribute through a greater portion of the mine. Fire locations simulating a mobile fuel sources like
haul trucks can have a much greater effect because they may be located in areas where air is distributed
throughout the mine footprint. This also has implications for mine design in that locating large
stationary fuel sources in or near isolated exhaust circuits will have a mitigating effect.
1st International Conference of Underground Mining
October 19-21, 2016, Santiago, Chile
Fire No. Location Fire Source
1 Rampa 10 Lubrication Shop2 Rampa Principal Explosives Magazine3 Rampa 1 Haul Truck4 Rampa 4 Haul Truck5 Rampa Exploracion Electrical Substation6 Rampa 6 Haul Truck7 Tunel Inyeccion 11 Face Lubrication Truck8 Tunel Transporte Face Lubrication Truck
Table 3 Location of fires in the Chuquicamata Mine before connection of the Iyeccion Tunnels and Tunnels Transporte y Acceso.
Figure 2 Locations of simulated underground fires in the Codelco Chuquicamata OIM Mine before Connection of Tunnels.
Figure 3 Locations of simulated underground fires in the Codelco Chuquicamata Mine Injection Tunnels.
Fire 5: Rampa Exploración,
Electrical Substation Fire.
1st International Conference of Underground Mining
October 19-21, 2016, Santiago, Chile
Figure 4 Locations of simulated underground fires in the Codelco Chuquicamata Mine Transport & Access Tunnel
6 Development of the Fire Model
The fire simulation software used for this analysis is the MineFire program. This is a Windows
application that is to be used in conjunction with the VnetPC network ventilation simulation software
package. It is designed to simulate a mine ventilation system’s response to external influences such as
fires. The program was built from the former US Bureau of Mines MFire code, which was modified by
MVS/MVS solely to increase the number of branches and fans available and to run in the Windows
environment. This calculation kernel was then adapted into the user‐friendly interface of Mine
Ventilation Services’ VnetPC ventilation network software package.
MineFire performs ventilation network planning calculations and dynamic transient state modeling
of ventilation networks under a variety of conditions. The program simulates a system’s response to
altered ventilation parameters such as; the introduction of fire to the system, varying outside
temperatures, changing ventilation control structures or development of new mine workings. This is
accomplished by using data from ventilation surveys together with information determined from known
airway dimensions and characteristics. Heat release rates are calculated based on which type(s) of fuel is
(are) burning. The location of the fire in a main intake/exhaust airway or area of low flow is important in
determining whether to assume an oxygen‐rich or fuel‐rich fire; therefore, it helps the user determine
which parameters to use in the fire simulation and which may be left blank. Contaminants may be
determined based on the chemistry of the fuel components.
Fire is difficult to predict and the results of a simulation will only be as good as the inputs. For this
reason it is a good practice to simulate several different fire intensities for each location. This allows for
the sensitivity of the ventilation system to be examined and for an increased level of confidence to be
associated with the study.
1st International Conference of Underground Mining
October 19-21, 2016, Santiago, Chile
6.1 Conductivity
The Conductivity variable is the rock thermal conductivity for the rock mass. The value is used by
the program to define the thermal diffusion to or from the air as it travels through the airway. This will
affect airflows in the mine. An understanding of which rock type defines a branch is needed for detailed
models. A theoretical average or general value for the rock mass may be sufficient. Where the rock type
in the model is uniform, large numbers of branches will have the same value. The units are Btu/hr×ft×°F
or W/m×°C. For this model a global value of 3.5 W/m×°C was chosen.
6.2 Diffusivity
Rock diffusivity is obtained through lab testing of core samples or from tables. It defines how
quickly heat moves on the boundary between the rock and the air as air moves through a branch. The
units are ft2/hr or m2/sec. For this model a global value of 1.6 × 10‐6 m2/sec (0.072 ft2/hr) was chosen.
6.3 Rock Temperature
The Rock Temperature variable uses the average temperature of the rock for a given branch.
Samples can be taken in numerous key locations throughout the mine or the geothermal step can be
used to determine average rock temperature at a given elevation and may be averaged as necessary for
branches with vertical relief. Note that the geothermal step may not provide entirely accurate results for
older workings where the rock has aged and the temperature profile has changed. Detailed information
regarding rock temperature was unavailable therefore a value of 25.4°C was used as a basic rock
temperature. This value is based on average air temperatures measured inside the mine.
6.4 Fan Data
Fan characteristic curves are registered by entering between two and ten sets of pressure/airflow
data points. Fans must be entered with a curve of at least two points for the MineFire program. Since
MineFire assumes compressible flow, the use of inject and reject branches and NVP fans are not
recommended except where absolutely necessary to balance the basic, “Initial” network. The effects of
auto‐compression and ventilating energies are accounted for by MineFire based on the temperature,
elevation, and density values.
1st International Conference of Underground Mining
October 19-21, 2016, Santiago, Chile
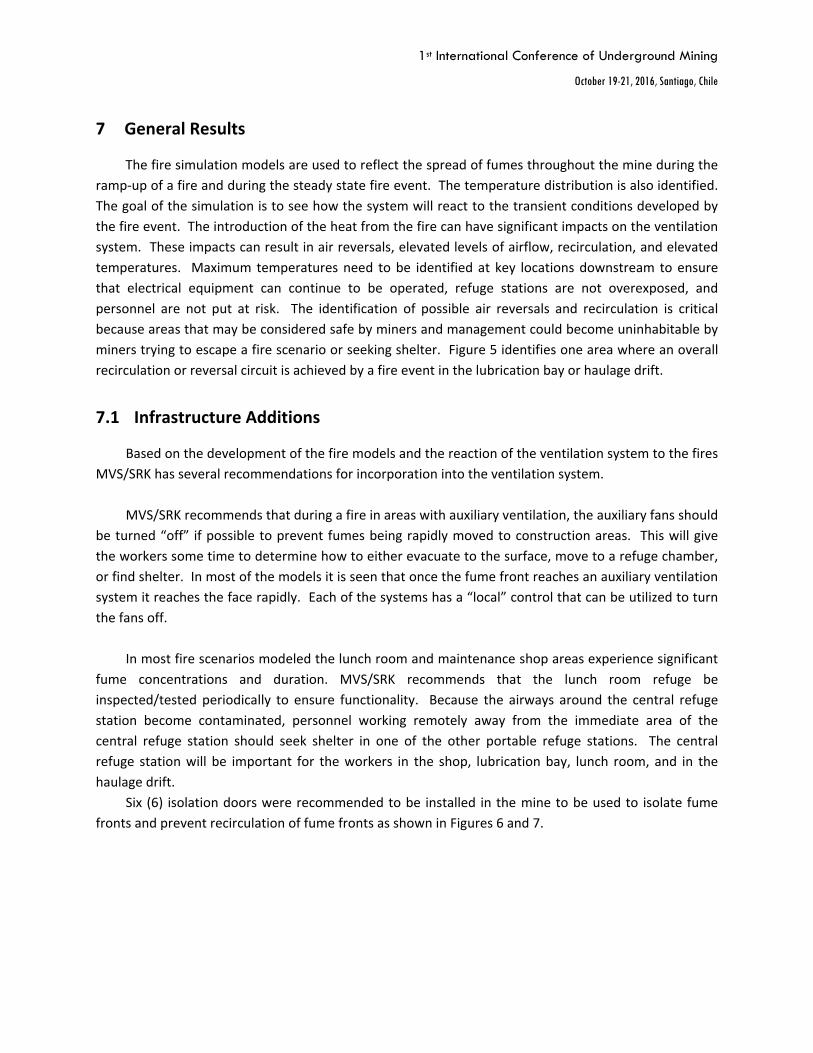
7 General Results
The fire simulation models are used to reflect the spread of fumes throughout the mine during the
ramp‐up of a fire and during the steady state fire event. The temperature distribution is also identified.
The goal of the simulation is to see how the system will react to the transient conditions developed by
the fire event. The introduction of the heat from the fire can have significant impacts on the ventilation
system. These impacts can result in air reversals, elevated levels of airflow, recirculation, and elevated
temperatures. Maximum temperatures need to be identified at key locations downstream to ensure
that electrical equipment can continue to be operated, refuge stations are not overexposed, and
personnel are not put at risk. The identification of possible air reversals and recirculation is critical
because areas that may be considered safe by miners and management could become uninhabitable by
miners trying to escape a fire scenario or seeking shelter. Figure 5 identifies one area where an overall
recirculation or reversal circuit is achieved by a fire event in the lubrication bay or haulage drift.
7.1 Infrastructure Additions
Based on the development of the fire models and the reaction of the ventilation system to the fires
MVS/SRK has several recommendations for incorporation into the ventilation system.
MVS/SRK recommends that during a fire in areas with auxiliary ventilation, the auxiliary fans should
be turned “off” if possible to prevent fumes being rapidly moved to construction areas. This will give
the workers some time to determine how to either evacuate to the surface, move to a refuge chamber,
or find shelter. In most of the models it is seen that once the fume front reaches an auxiliary ventilation
system it reaches the face rapidly. Each of the systems has a “local” control that can be utilized to turn
the fans off.
In most fire scenarios modeled the lunch room and maintenance shop areas experience significant
fume concentrations and duration. MVS/SRK recommends that the lunch room refuge be
inspected/tested periodically to ensure functionality. Because the airways around the central refuge
station become contaminated, personnel working remotely away from the immediate area of the
central refuge station should seek shelter in one of the other portable refuge stations. The central
refuge station will be important for the workers in the shop, lubrication bay, lunch room, and in the
haulage drift.
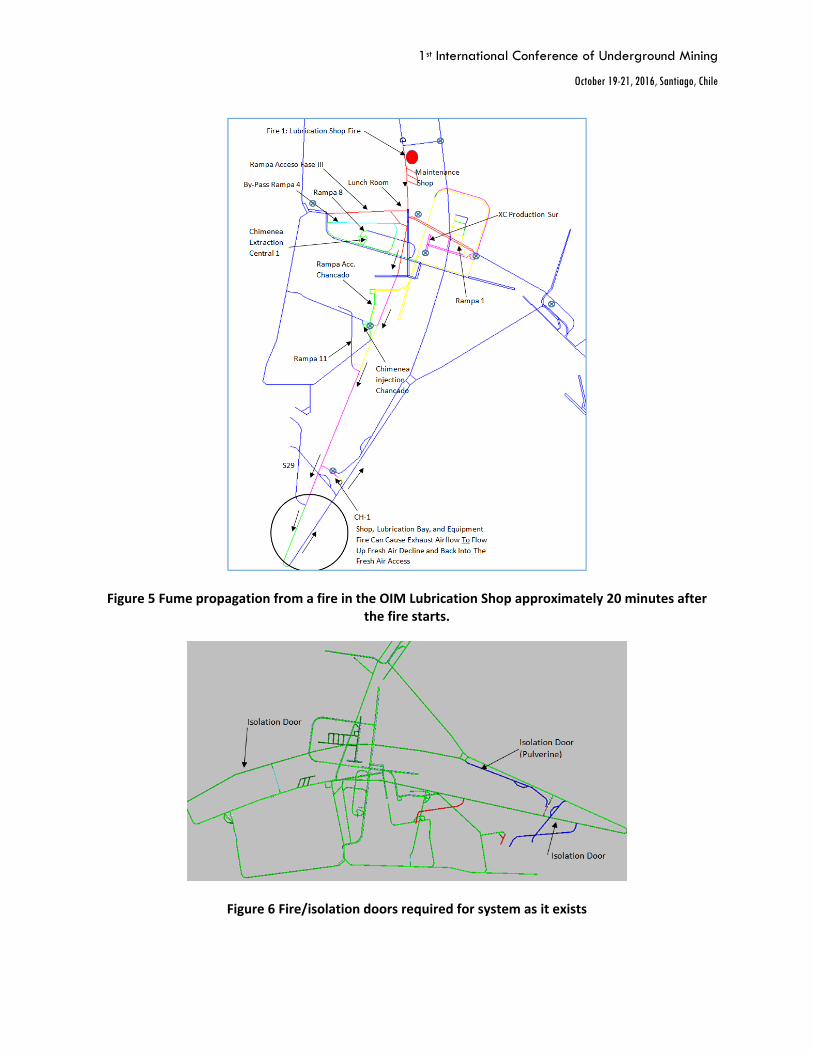
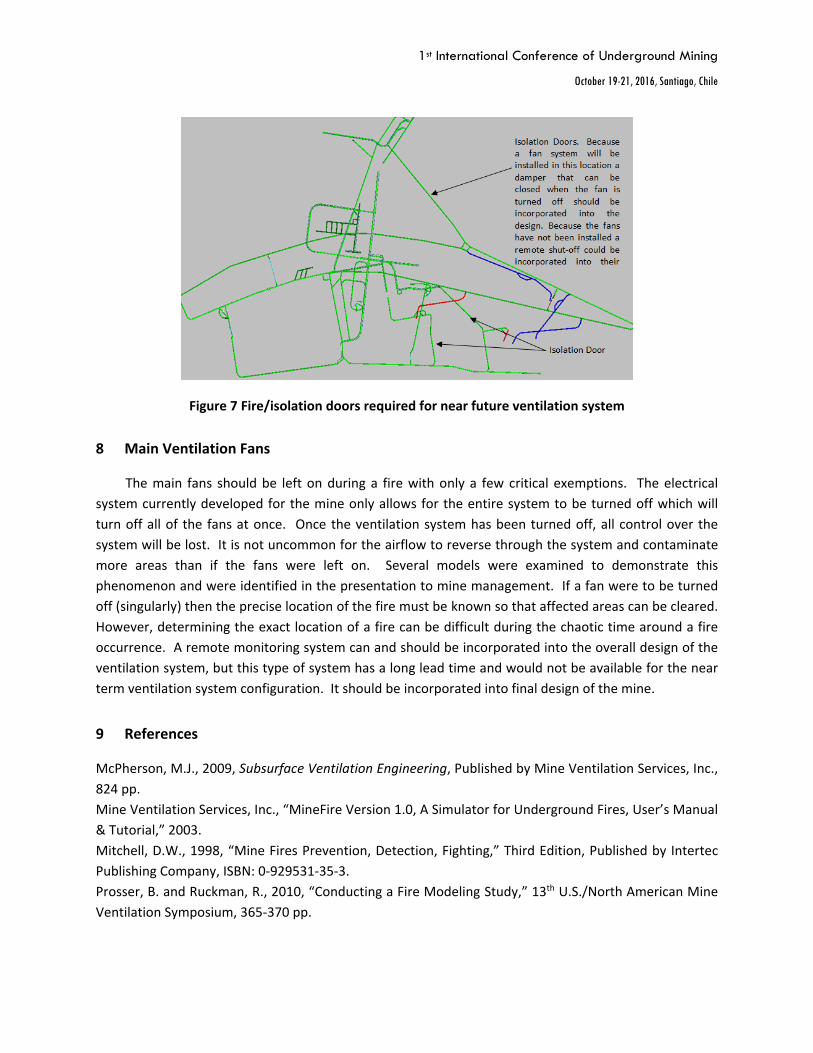
Six (6) isolation doors were recommended to be installed in the mine to be used to isolate fume
fronts and prevent recirculation of fume fronts as shown in Figures 6 and 7.
1st International Conference of Underground Mining
October 19-21, 2016, Santiago, Chile
Figure 5 Fume propagation from a fire in the OIM Lubrication Shop approximately 20 minutes after the fire starts.
Figure 6 Fire/isolation doors required for system as it exists
1st International Conference of Underground Mining
October 19-21, 2016, Santiago, Chile
Figure 7 Fire/isolation doors required for near future ventilation system
8 Main Ventilation Fans
The main fans should be left on during a fire with only a few critical exemptions. The electrical
system currently developed for the mine only allows for the entire system to be turned off which will
turn off all of the fans at once. Once the ventilation system has been turned off, all control over the
system will be lost. It is not uncommon for the airflow to reverse through the system and contaminate
more areas than if the fans were left on. Several models were examined to demonstrate this
phenomenon and were identified in the presentation to mine management. If a fan were to be turned
off (singularly) then the precise location of the fire must be known so that affected areas can be cleared.
However, determining the exact location of a fire can be difficult during the chaotic time around a fire
occurrence. A remote monitoring system can and should be incorporated into the overall design of the
ventilation system, but this type of system has a long lead time and would not be available for the near
term ventilation system configuration. It should be incorporated into final design of the mine.
9 References
McPherson, M.J., 2009, Subsurface Ventilation Engineering, Published by Mine Ventilation Services, Inc.,
824 pp.
Mine Ventilation Services, Inc., “MineFire Version 1.0, A Simulator for Underground Fires, User’s Manual
& Tutorial,” 2003.
Mitchell, D.W., 1998, “Mine Fires Prevention, Detection, Fighting,” Third Edition, Published by Intertec
Publishing Company, ISBN: 0‐929531‐35‐3.
Prosser, B. and Ruckman, R., 2010, “Conducting a Fire Modeling Study,” 13th U.S./North American Mine
Ventilation Symposium, 365‐370 pp.

1st International Conference of Underground Mining
October 19-21, 2016, Santiago, Chile
Thomson, N., 2002, “Fire Hazards in Industry,” Published by Butterworth‐Heinemann, ISBN: 0‐7506‐
53210‐3
Chilean Mining Safety Rules, Title III, Underground Mine Exploration, Chapter Eight, “Fire Prevention and
Control.”
Hartman, H.L, et. Al, 1997, “Mine Ventilation and Air Conditioning,” Third Edition, John Wiley and Sons,
Inc., 730 pp.