Embed Size (px)
Citation preview
Development of Hybrid Maximum Power Point Tracking Control Algorithm for Photovoltaic system
Ayaz Ahmad, Research Scholar, Singhania University, Pacheri Bari, India and L. Rajaji, Principal, ARM College of Engineering & Technology, Chennai
Abstract: Renewable energy now-a-days is playing vital role in energy demand market and solar and wind are most wanted renewable energy resources to support the enormous power demand across the globe. Due to insufficient wind for more than half of the year, wind turbines are not capable of meeting the power demand. Hence, solar is treated as the main energy resource among all the renewable energy resources since sunlight is available almost all the days even though it is only available in day time. Solar system or photovoltaic (PV) system is capturing sunlight and converts it into electricity either for off-grid or in-grid applications. Amount of generation of electricity is purely depending upon the amount of sunlight captured by the PV panels and hence tracking of sunlight in order to capture maximum power is the main requirement in solar energy sector. In this paper, a novel hybrid maximum power point tracking (MPPT) algorithm is presented and it has the combination of the features of perturb & observe algorithm and constant voltage algorithm. Proposed hybrid MPPT algorithm is applied to single phase residential and commercial solar inverters and the results have been captured. Both simulation and experimental results have been presented in this paper in order to validate the proposed algorithm. Key words: PV panel, MPPT algorithm, Tracking efficiency, Solar system and DCDC converter.
1. Introduction
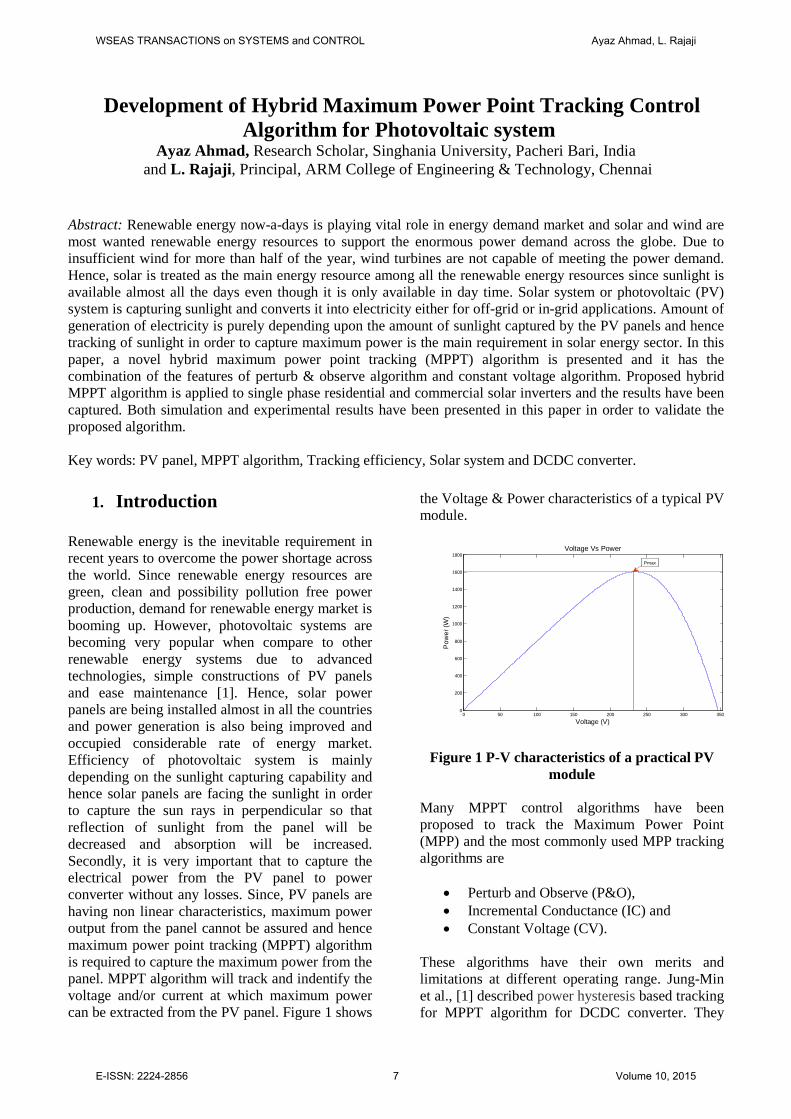
Renewable energy is the inevitable requirement in recent years to overcome the power shortage across the world. Since renewable energy resources are green, clean and possibility pollution free power production, demand for renewable energy market is booming up. However, photovoltaic systems are becoming very popular when compare to other renewable energy systems due to advanced technologies, simple constructions of PV panels and ease maintenance [1]. Hence, solar power panels are being installed almost in all the countries and power generation is also being improved and occupied considerable rate of energy market. Efficiency of photovoltaic system is mainly depending on the sunlight capturing capability and hence solar panels are facing the sunlight in order to capture the sun rays in perpendicular so that reflection of sunlight from the panel will be decreased and absorption will be increased. Secondly, it is very important that to capture the electrical power from the PV panel to power converter without any losses. Since, PV panels are having non linear characteristics, maximum power output from the panel cannot be assured and hence maximum power point tracking (MPPT) algorithm is required to capture the maximum power from the panel. MPPT algorithm will track and indentify the voltage and/or current at which maximum power can be extracted from the PV panel. Figure 1 shows
the Voltage & Power characteristics of a typical PV module.
0 50 100 150 200 250 300 3500
200
400
600
800
1000
1200
1400
1600
1800
Voltage (V)
Pow
er (W
)
Voltage Vs Power
Pmax
Figure 1 P-V characteristics of a practical PV module
Many MPPT control algorithms have been proposed to track the Maximum Power Point (MPP) and the most commonly used MPP tracking algorithms are
• Perturb and Observe (P&O), • Incremental Conductance (IC) and • Constant Voltage (CV).
These algorithms have their own merits and limitations at different operating range. Jung-Min et al., [1] described power hysteresis based tracking for MPPT algorithm for DCDC converter. They
WSEAS TRANSACTIONS on SYSTEMS and CONTROL Ayaz Ahmad, L. Rajaji
E-ISSN: 2224-2856 7 Volume 10, 2015
have also proposed this MPPT for three level DCDC power converter to reduce the reverse recovery losses of the diodes during boost operation. With a view to minimize the overall cost and control complexity, a novel MPPT algorithm presented in [2] in order to operate in continuous conduction mode of boost converter. This algorithm was presented by the authors in order to reduce the stress on the power components. Similarly, in [3-6], maximum power point tracking phenomenon with different approaches such as perturb and observe, constant voltage algorithms presented by respective authors. One of the effective algorithms is Incremental-conductance algorithm (IC) which is widely employed due to easy implementation and high tracking accuracy. In [7] and [8], variable step-size IC MPPT algorithm is presented, it has not only the merits of IC but also automatically adjusts the step size to track the PV array MPP as proposed by authors. Single stage and double stage photovoltaic systems are presented in [9] and [10] respectively in which perturb and observe algorithm was proposed. In [11-14], adaptive MPPT algorithms for photovoltaic system are presented which is suitable for unstable sunlight with more non-linear conditions to capture maximum possible power. FPGA-based Fuzzy MPPT control algorithm is proposed in [15] and authors mentioned that this method is simple, reliable, and can automatically adjust with the changes of external environment. Its fast optimization capability makes the system stable at the maximum power point. MPPT algorithms are analyzed for this research in detail not only for solar energy systems and also for other applications such as aerospace [16] and wind energy system [17]. In [16], perturb and observe algorithm has been proposed for aerospace and electronic application and in [17] a novel maximum power point tracking controller with an adaptive compensation control is first proposed for a micro scale wind power generation system. A short introduction on the general development and forecast of world market in photovoltaic (PV) are presented in [18].
To overcome inherent limitations of these algorithms in solar power converters, a Hybrid algorithm based on combination of Perturb and Observe (P&O) algorithm and Constant Voltage (CV) algorithm is presented in this paper. In this proposed approach, the system selects either P&O or CV algorithm based on the light intensity which is measured as a function of current.
2. PV Panel Modeling
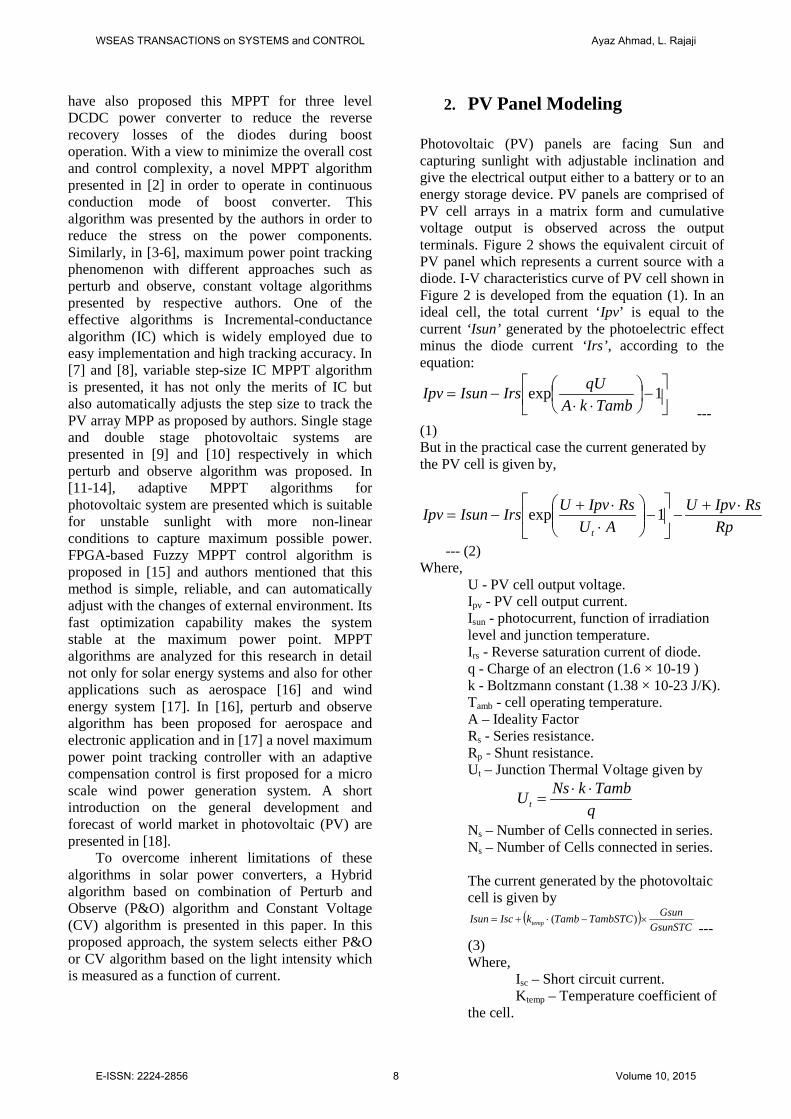
Photovoltaic (PV) panels are facing Sun and capturing sunlight with adjustable inclination and give the electrical output either to a battery or to an energy storage device. PV panels are comprised of PV cell arrays in a matrix form and cumulative voltage output is observed across the output terminals. Figure 2 shows the equivalent circuit of PV panel which represents a current source with a diode. I-V characteristics curve of PV cell shown in Figure 2 is developed from the equation (1). In an ideal cell, the total current ‘Ipv’ is equal to the current ‘Isun’ generated by the photoelectric effect minus the diode current ‘Irs’, according to the equation:
−
⋅⋅−= 1exp
TambkAqUIrsIsunIpv
--- (1) But in the practical case the current generated by the PV cell is given by,
RpRsIpvU
AURsIpvUIrsIsunIpv
t
⋅+−
−
⋅⋅+
−= 1exp
--- (2) Where,
U - PV cell output voltage. Ipv - PV cell output current. Isun - photocurrent, function of irradiation level and junction temperature. Irs - Reverse saturation current of diode. q - Charge of an electron (1.6 × 10⁻¹⁹ ) k - Boltzmann constant (1.38 × 10⁻²³ J/K). Tamb - cell operating temperature. A – Ideality Factor Rs - Series resistance. Rp - Shunt resistance. Ut – Junction Thermal Voltage given by
qTambkNsUt⋅⋅
=
Ns – Number of Cells connected in series. Ns – Number of Cells connected in series. The current generated by the photovoltaic cell is given by
( )GsunSTC
GsunTambSTCTambkIscIsun temp ×−⋅+= )( ---
(3) Where, Isc – Short circuit current. Ktemp – Temperature coefficient of the cell.
WSEAS TRANSACTIONS on SYSTEMS and CONTROL Ayaz Ahmad, L. Rajaji
E-ISSN: 2224-2856 8 Volume 10, 2015
Tamb - Ambient Temperature. TambSTC - Ambient Temperature at
standard test condition. Gsun – Sun Light Intensity (W/m2) GsunSTC – Sun Light Intensity at
standard test condition (1000 W/m2).
IsunIrs
Figure 2. Electrical circuit of PV panel
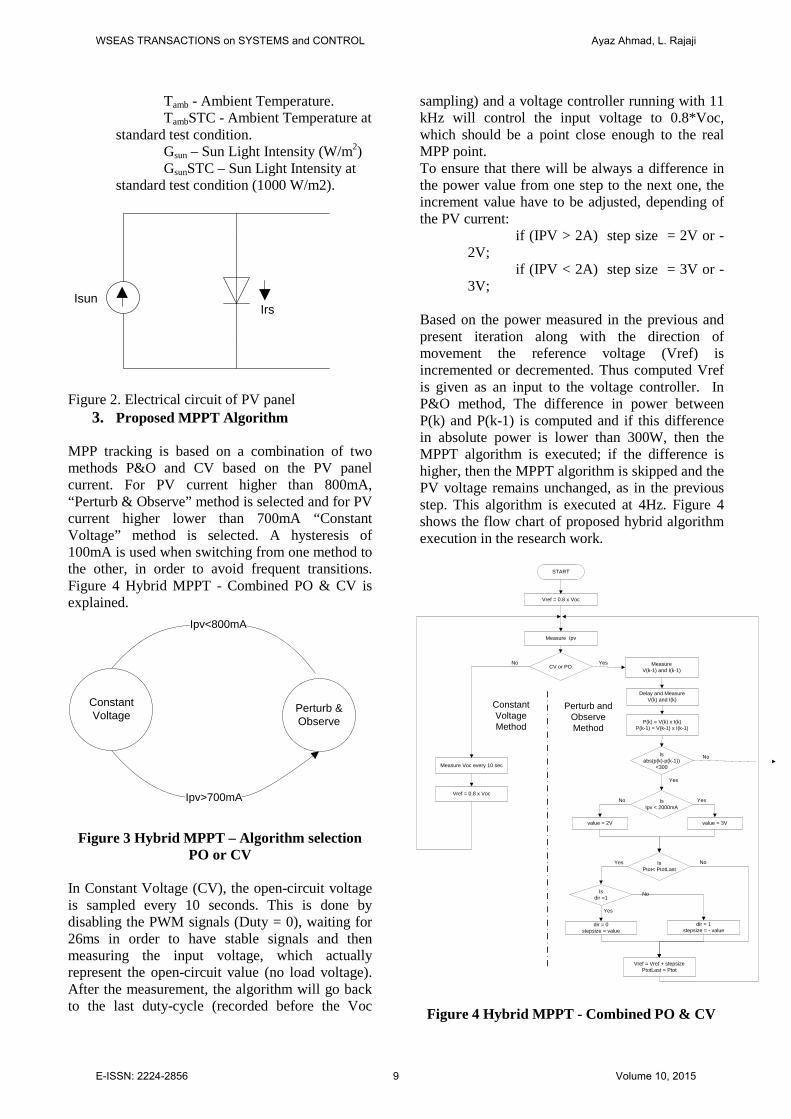
3. Proposed MPPT Algorithm MPP tracking is based on a combination of two methods P&O and CV based on the PV panel current. For PV current higher than 800mA, “Perturb & Observe” method is selected and for PV current higher lower than 700mA “Constant Voltage” method is selected. A hysteresis of 100mA is used when switching from one method to the other, in order to avoid frequent transitions. Figure 4 Hybrid MPPT - Combined PO & CV is explained.
Constant Voltage
Perturb & Observe
Ipv>700mA
Ipv<800mA
Figure 3 Hybrid MPPT – Algorithm selection PO or CV
In Constant Voltage (CV), the open-circuit voltage is sampled every 10 seconds. This is done by disabling the PWM signals (Duty = 0), waiting for 26ms in order to have stable signals and then measuring the input voltage, which actually represent the open-circuit value (no load voltage). After the measurement, the algorithm will go back to the last duty-cycle (recorded before the Voc
sampling) and a voltage controller running with 11 kHz will control the input voltage to 0.8*Voc, which should be a point close enough to the real MPP point. To ensure that there will be always a difference in the power value from one step to the next one, the increment value have to be adjusted, depending of the PV current:
if (IPV > 2A) step size = 2V or -2V;
if (IPV < 2A) step size = 3V or -3V;
Based on the power measured in the previous and present iteration along with the direction of movement the reference voltage (Vref) is incremented or decremented. Thus computed Vref is given as an input to the voltage controller. In P&O method, The difference in power between P(k) and P(k-1) is computed and if this difference in absolute power is lower than 300W, then the MPPT algorithm is executed; if the difference is higher, then the MPPT algorithm is skipped and the PV voltage remains unchanged, as in the previous step. This algorithm is executed at 4Hz. Figure 4 shows the flow chart of proposed hybrid algorithm execution in the research work.
START
Measure V(k-1) and I(k-1)
Delay and Measure V(k) and I(k)
P(k) = V(k) x I(k)P(k-1) = V(k-1) x I(k-1)
IsPtot< PtotLast
Isdir =1
dir = 0stepsize = value
dir = 1stepsize = - value
Yes
No
Yes
Vref = 0.8 x Voc
CV or PO
Measure Ipv
No
Vref = Vref + stepsize PtotLast = Ptot
IsIpv < 2000mA
value = 2V value = 3V
YesNo
Isabs(p(k)-p(k-1))
<300
Yes
No
YesNo
Vref = 0.8 x Voc
Measure Voc every 10 sec
Constant Voltage Method
Perturb and Observe Method
Figure 4 Hybrid MPPT - Combined PO & CV
WSEAS TRANSACTIONS on SYSTEMS and CONTROL Ayaz Ahmad, L. Rajaji
E-ISSN: 2224-2856 9 Volume 10, 2015
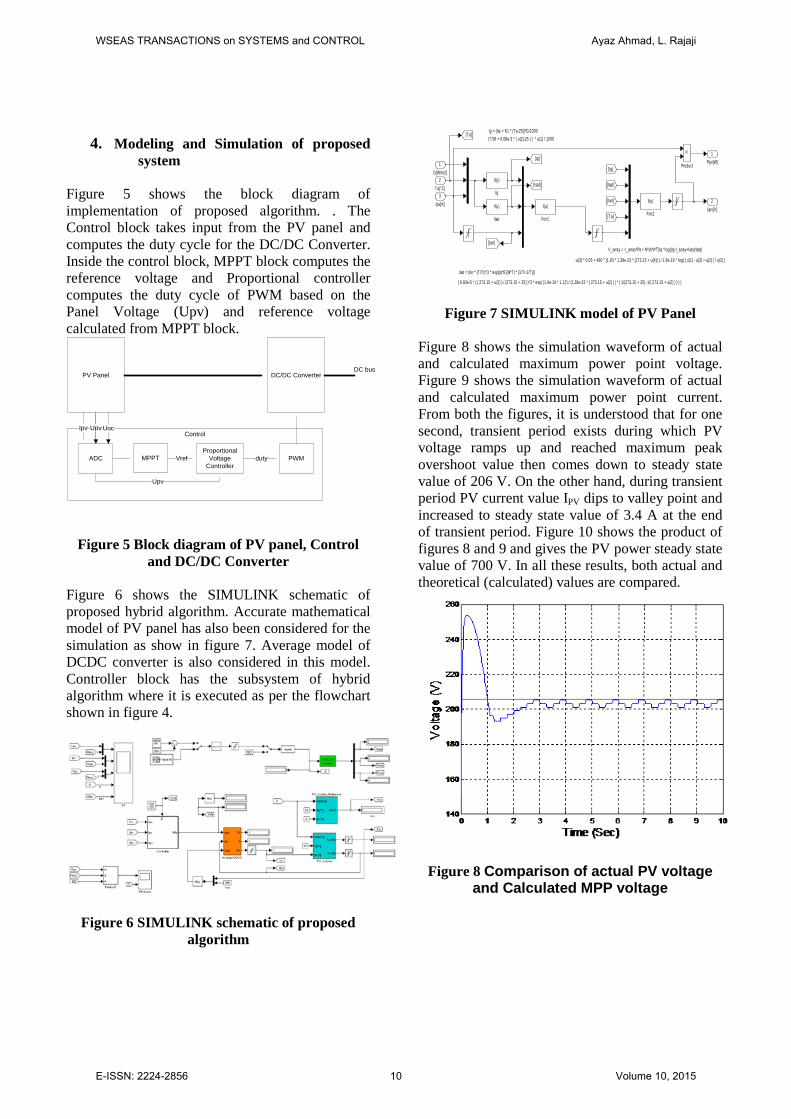
4. Modeling and Simulation of proposed
system Figure 5 shows the block diagram of implementation of proposed algorithm. . The Control block takes input from the PV panel and computes the duty cycle for the DC/DC Converter. Inside the control block, MPPT block computes the reference voltage and Proportional controller computes the duty cycle of PWM based on the Panel Voltage (Upv) and reference voltage calculated from MPPT block.
PV Panel DC/DC Converter
Control
ADC MPPTProportional
Voltage Controller
PWM
UocIpv Upv
Vref duty
Upv
DC bus
Figure 5 Block diagram of PV panel, Control and DC/DC Converter
Figure 6 shows the SIMULINK schematic of proposed hybrid algorithm. Accurate mathematical model of PV panel has also been considered for the simulation as show in figure 7. Average model of DCDC converter is also considered in this model. Controller block has the subsystem of hybrid algorithm where it is executed as per the flowchart shown in figure 4.
Figure 6 SIMULINK schematic of proposed algorithm
(7.58 + 6.08e-3 * ( u(2)-25 ) ) * u(1) / 1000Ig = (Isc + K1 * (Ta-25))*G/1000
V_array = -I_array*Rs + N*(A*k*T)/q *log((Ig-I_array+Isat)/Isat)
-u(3) * 0.05 + 480 * (1.93 * 1.38e-23 * (273.15 + u(4)) ) / 1.6e-19 * log( ( u(1) - u(3) + u(2) ) / u(2) )
( 6.93e-5 * ( ( 273.15 + u(2) ) / (273.15 + 25) )^3 * exp( (1.6e-19 * 1.12) / (1.38e-23 * ( 273.15 + u(2) ) ) * ( 1/(273.15 + 25) -1/( 273.15 + u(2) ) ) ) )
Isat = (Ior * (T/Tr)^3 * exp((q*E)/(k*T) * (1/Tr-1/T)))
2Upv[V]
1Ppv[W]
Product
f(u)
Isat
f(u)
Ig
[Ta]
[Iarr]
[Isat]
[Ig]
[Ta]
[Iarr]
[Ig]
[Isat]
f(u)
Fcn2f(u)
Fcn1
3Ipv[A]
2Ta[°C]
1G[W/m2]
Figure 7 SIMULINK model of PV Panel
Figure 8 shows the simulation waveform of actual and calculated maximum power point voltage. Figure 9 shows the simulation waveform of actual and calculated maximum power point current. From both the figures, it is understood that for one second, transient period exists during which PV voltage ramps up and reached maximum peak overshoot value then comes down to steady state value of 206 V. On the other hand, during transient period PV current value IPV dips to valley point and increased to steady state value of 3.4 A at the end of transient period. Figure 10 shows the product of figures 8 and 9 and gives the PV power steady state value of 700 V. In all these results, both actual and theoretical (calculated) values are compared.
Figure 8 Comparison of actual PV voltage and Calculated MPP voltage
WSEAS TRANSACTIONS on SYSTEMS and CONTROL Ayaz Ahmad, L. Rajaji
E-ISSN: 2224-2856 10 Volume 10, 2015
0 1 2 3 4 5 6 7 8 9 100
1
2
3
4
5
6
7
8
9
10
Time (Sec)
Cur
rent
(A)
Comparision of Impp with Ipv (Model)
Ipv-ModelImpp
Figure 9 Comparison of actual PV Current (Ipv) and Calculated MPP Current (Impp)
1 2 3 4 5 6 7 8 9 10200
300
400
500
600
700
800
Time (Sec)
Pow
er (W
)
Comparision of Pmpp with Ppv (Model)
Ppv-ModelPmpp
Figure 10 Comparison of actual PV Power
(Ppv) and Calculated Maximum power (Pmpp)
Figure 11 shows the variation of duty cycle and based on the duty cycle values output photovoltaic power is controlled. During transient period between 0 and 1 second, duty cycle varies from 0 to 0.37 and comes to steady state value which oscillates from 0.33 to 0.35.
0 1 2 3 4 5 6 7 8 9 10-0.05
0
0.05
0.1
0.15
0.2
0.25
0.3
0.35
0.4
Time (Sec)
Dut
y
Duty Cycle
Figure 11 Variation of Duty cycle
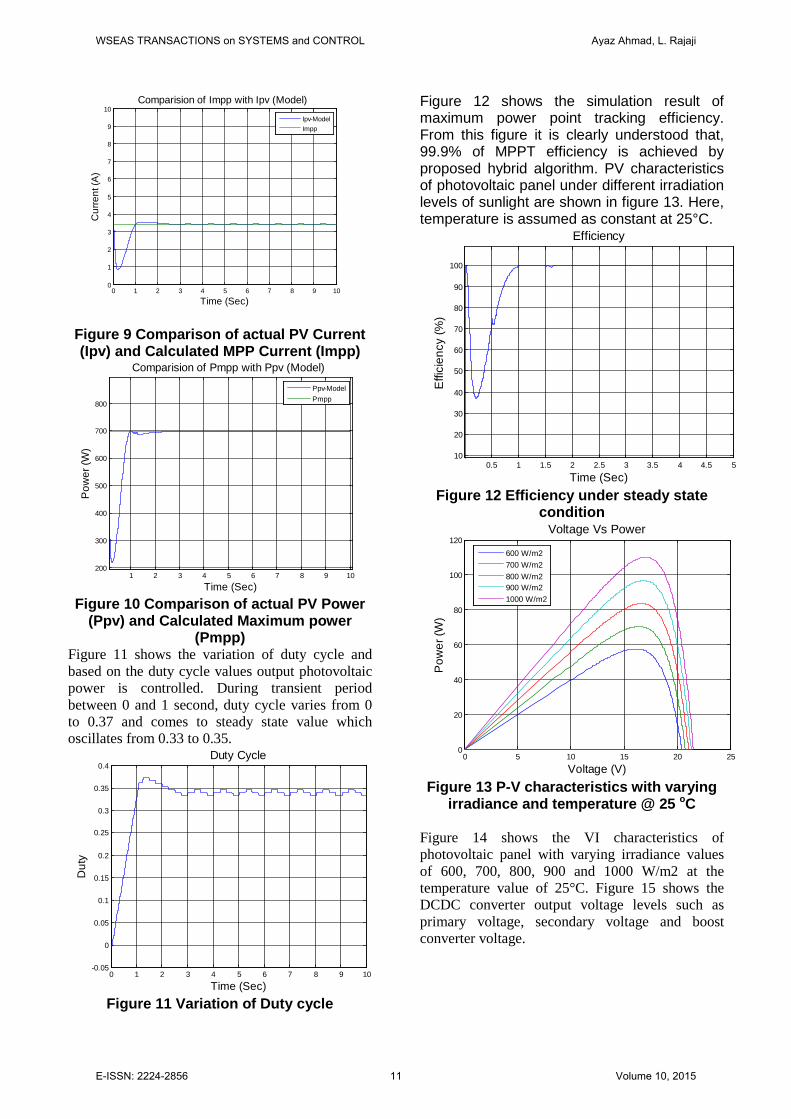
Figure 12 shows the simulation result of maximum power point tracking efficiency. From this figure it is clearly understood that, 99.9% of MPPT efficiency is achieved by proposed hybrid algorithm. PV characteristics of photovoltaic panel under different irradiation levels of sunlight are shown in figure 13. Here, temperature is assumed as constant at 25°C.
0.5 1 1.5 2 2.5 3 3.5 4 4.5 510
20
30
40
50
60
70
80
90
100
Time (Sec)
Effi
cien
cy (%
)
Efficiency
Figure 12 Efficiency under steady state
condition
0 5 10 15 20 250
20
40
60
80
100
120
Voltage (V)
Pow
er (W
)
Voltage Vs Power
600 W/m2700 W/m2800 W/m2900 W/m21000 W/m2
Figure 13 P-V characteristics with varying
irradiance and temperature @ 25 oC
Figure 14 shows the VI characteristics of photovoltaic panel with varying irradiance values of 600, 700, 800, 900 and 1000 W/m2 at the temperature value of 25°C. Figure 15 shows the DCDC converter output voltage levels such as primary voltage, secondary voltage and boost converter voltage.
WSEAS TRANSACTIONS on SYSTEMS and CONTROL Ayaz Ahmad, L. Rajaji
E-ISSN: 2224-2856 11 Volume 10, 2015
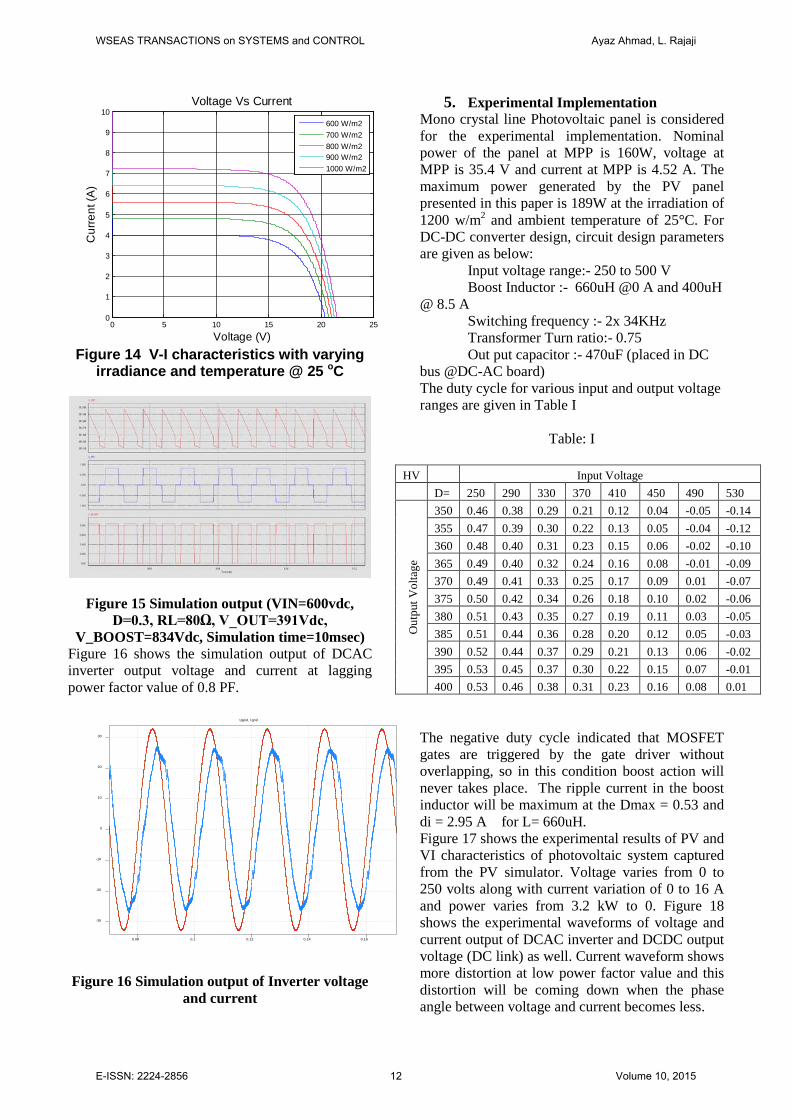
0 5 10 15 20 250
1
2
3
4
5
6
7
8
9
10
Voltage (V)
Cur
rent
(A)
Voltage Vs Current
600 W/m2700 W/m2800 W/m2900 W/m21000 W/m2
Figure 14 V-I characteristics with varying
irradiance and temperature @ 25 oC
Figure 15 Simulation output (VIN=600vdc, D=0.3, RL=80Ω, V_OUT=391Vdc,
V_BOOST=834Vdc, Simulation time=10msec) Figure 16 shows the simulation output of DCAC inverter output voltage and current at lagging power factor value of 0.8 PF.
Ugrid, Igrid
0.160.08 0.1 0.12 0.14
-10
30
0
-30
20
10
-20
Figure 16 Simulation output of Inverter voltage and current
5. Experimental Implementation Mono crystal line Photovoltaic panel is considered for the experimental implementation. Nominal power of the panel at MPP is 160W, voltage at MPP is 35.4 V and current at MPP is 4.52 A. The maximum power generated by the PV panel presented in this paper is 189W at the irradiation of 1200 w/m2 and ambient temperature of 25°C. For DC-DC converter design, circuit design parameters are given as below: Input voltage range:- 250 to 500 V Boost Inductor :- 660uH @0 A and 400uH @ 8.5 A Switching frequency :- 2x 34KHz Transformer Turn ratio:- 0.75 Out put capacitor :- 470uF (placed in DC bus @DC-AC board) The duty cycle for various input and output voltage ranges are given in Table I
Table: I
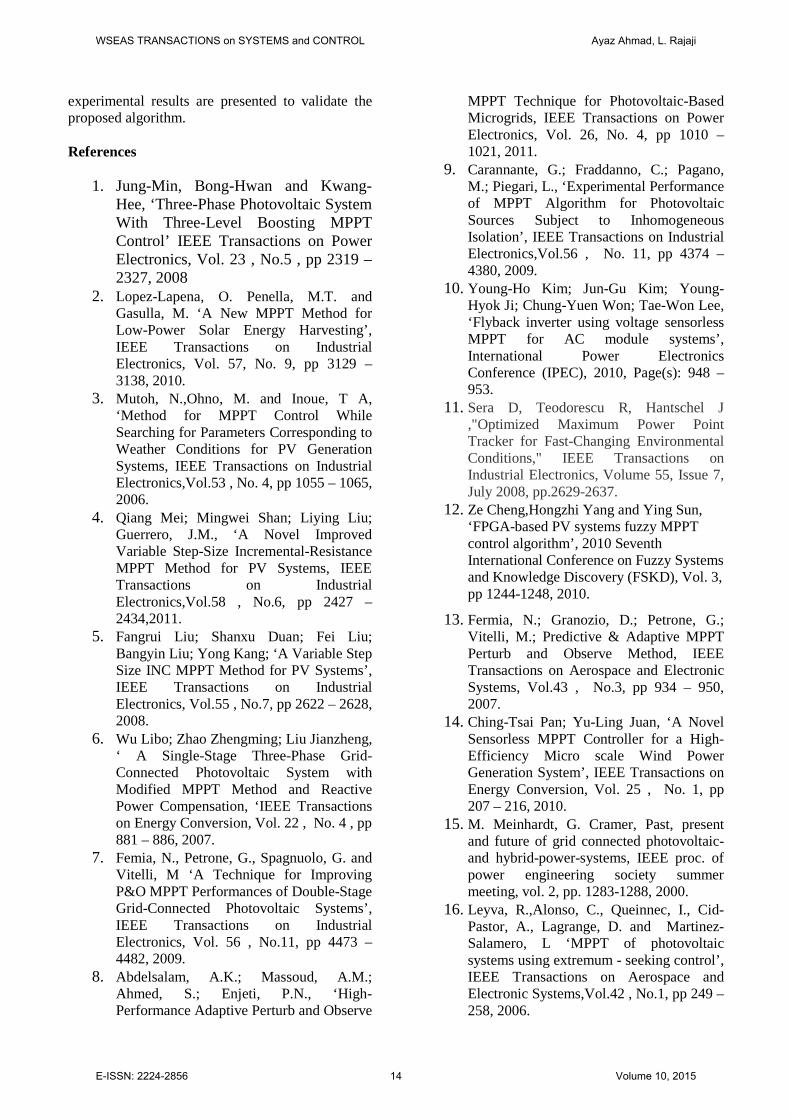
The negative duty cycle indicated that MOSFET gates are triggered by the gate driver without overlapping, so in this condition boost action will never takes place. The ripple current in the boost inductor will be maximum at the Dmax = 0.53 and di = 2.95 A for L= 660uH. Figure 17 shows the experimental results of PV and VI characteristics of photovoltaic system captured from the PV simulator. Voltage varies from 0 to 250 volts along with current variation of 0 to 16 A and power varies from 3.2 kW to 0. Figure 18 shows the experimental waveforms of voltage and current output of DCAC inverter and DCDC output voltage (DC link) as well. Current waveform shows more distortion at low power factor value and this distortion will be coming down when the phase angle between voltage and current becomes less.
HV Input Voltage D= 250 290 330 370 410 450 490 530
Out
put V
olta
ge
350 0.46 0.38 0.29 0.21 0.12 0.04 -0.05 -0.14 355 0.47 0.39 0.30 0.22 0.13 0.05 -0.04 -0.12 360 0.48 0.40 0.31 0.23 0.15 0.06 -0.02 -0.10 365 0.49 0.40 0.32 0.24 0.16 0.08 -0.01 -0.09 370 0.49 0.41 0.33 0.25 0.17 0.09 0.01 -0.07 375 0.50 0.42 0.34 0.26 0.18 0.10 0.02 -0.06 380 0.51 0.43 0.35 0.27 0.19 0.11 0.03 -0.05 385 0.51 0.44 0.36 0.28 0.20 0.12 0.05 -0.03 390 0.52 0.44 0.37 0.29 0.21 0.13 0.06 -0.02 395 0.53 0.45 0.37 0.30 0.22 0.15 0.07 -0.01 400 0.53 0.46 0.38 0.31 0.23 0.16 0.08 0.01
WSEAS TRANSACTIONS on SYSTEMS and CONTROL Ayaz Ahmad, L. Rajaji
E-ISSN: 2224-2856 12 Volume 10, 2015
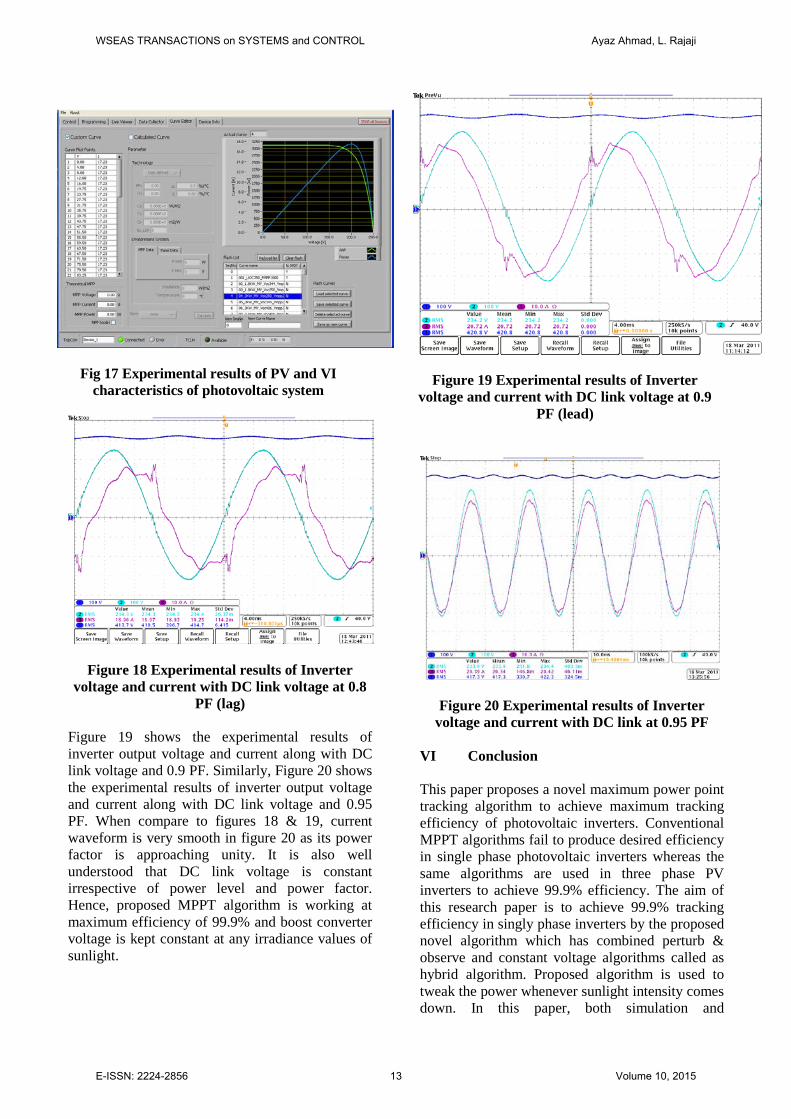
Fig 17 Experimental results of PV and VI characteristics of photovoltaic system
Figure 18 Experimental results of Inverter voltage and current with DC link voltage at 0.8
PF (lag)
Figure 19 shows the experimental results of inverter output voltage and current along with DC link voltage and 0.9 PF. Similarly, Figure 20 shows the experimental results of inverter output voltage and current along with DC link voltage and 0.95 PF. When compare to figures 18 & 19, current waveform is very smooth in figure 20 as its power factor is approaching unity. It is also well understood that DC link voltage is constant irrespective of power level and power factor. Hence, proposed MPPT algorithm is working at maximum efficiency of 99.9% and boost converter voltage is kept constant at any irradiance values of sunlight.
Figure 19 Experimental results of Inverter voltage and current with DC link voltage at 0.9
PF (lead)
Figure 20 Experimental results of Inverter voltage and current with DC link at 0.95 PF
VI Conclusion This paper proposes a novel maximum power point tracking algorithm to achieve maximum tracking efficiency of photovoltaic inverters. Conventional MPPT algorithms fail to produce desired efficiency in single phase photovoltaic inverters whereas the same algorithms are used in three phase PV inverters to achieve 99.9% efficiency. The aim of this research paper is to achieve 99.9% tracking efficiency in singly phase inverters by the proposed novel algorithm which has combined perturb & observe and constant voltage algorithms called as hybrid algorithm. Proposed algorithm is used to tweak the power whenever sunlight intensity comes down. In this paper, both simulation and
WSEAS TRANSACTIONS on SYSTEMS and CONTROL Ayaz Ahmad, L. Rajaji
E-ISSN: 2224-2856 13 Volume 10, 2015
experimental results are presented to validate the proposed algorithm. References
1. Jung-Min, Bong-Hwan and Kwang-Hee, ‘Three-Phase Photovoltaic System With Three-Level Boosting MPPT Control’ IEEE Transactions on Power Electronics, Vol. 23 , No.5 , pp 2319 – 2327, 2008
2. Lopez-Lapena, O. Penella, M.T. and Gasulla, M. ‘A New MPPT Method for Low-Power Solar Energy Harvesting’, IEEE Transactions on Industrial Electronics, Vol. 57, No. 9, pp 3129 – 3138, 2010.
3. Mutoh, N.,Ohno, M. and Inoue, T A, ‘Method for MPPT Control While Searching for Parameters Corresponding to Weather Conditions for PV Generation Systems, IEEE Transactions on Industrial Electronics,Vol.53 , No. 4, pp 1055 – 1065, 2006.
4. Qiang Mei; Mingwei Shan; Liying Liu; Guerrero, J.M., ‘A Novel Improved Variable Step-Size Incremental-Resistance MPPT Method for PV Systems, IEEE Transactions on Industrial Electronics,Vol.58 , No.6, pp 2427 – 2434,2011.
5. Fangrui Liu; Shanxu Duan; Fei Liu; Bangyin Liu; Yong Kang; ‘A Variable Step Size INC MPPT Method for PV Systems’, IEEE Transactions on Industrial Electronics, Vol.55 , No.7, pp 2622 – 2628, 2008.
6. Wu Libo; Zhao Zhengming; Liu Jianzheng, ‘ A Single-Stage Three-Phase Grid-Connected Photovoltaic System with Modified MPPT Method and Reactive Power Compensation, ‘IEEE Transactions on Energy Conversion, Vol. 22 , No. 4 , pp 881 – 886, 2007.
7. Femia, N., Petrone, G., Spagnuolo, G. and Vitelli, M ‘A Technique for Improving P&O MPPT Performances of Double-Stage Grid-Connected Photovoltaic Systems’, IEEE Transactions on Industrial Electronics, Vol. 56 , No.11, pp 4473 – 4482, 2009.
8. Abdelsalam, A.K.; Massoud, A.M.; Ahmed, S.; Enjeti, P.N., ‘High-Performance Adaptive Perturb and Observe
MPPT Technique for Photovoltaic-Based Microgrids, IEEE Transactions on Power Electronics, Vol. 26, No. 4, pp 1010 – 1021, 2011.
9. Carannante, G.; Fraddanno, C.; Pagano, M.; Piegari, L., ‘Experimental Performance of MPPT Algorithm for Photovoltaic Sources Subject to Inhomogeneous Isolation’, IEEE Transactions on Industrial Electronics,Vol.56 , No. 11, pp 4374 – 4380, 2009.
10. Young-Ho Kim; Jun-Gu Kim; Young-Hyok Ji; Chung-Yuen Won; Tae-Won Lee, ‘Flyback inverter using voltage sensorless MPPT for AC module systems’, International Power Electronics Conference (IPEC), 2010, Page(s): 948 – 953.
11. Sera D, Teodorescu R, Hantschel J ,"Optimized Maximum Power Point Tracker for Fast-Changing Environmental Conditions," IEEE Transactions on Industrial Electronics, Volume 55, Issue 7, July 2008, pp.2629-2637.
12. Ze Cheng,Hongzhi Yang and Ying Sun, ‘FPGA-based PV systems fuzzy MPPT control algorithm’, 2010 Seventh International Conference on Fuzzy Systems and Knowledge Discovery (FSKD), Vol. 3, pp 1244-1248, 2010.
13. Fermia, N.; Granozio, D.; Petrone, G.; Vitelli, M.; Predictive & Adaptive MPPT Perturb and Observe Method, IEEE Transactions on Aerospace and Electronic Systems, Vol.43 , No.3, pp 934 – 950, 2007.
14. Ching-Tsai Pan; Yu-Ling Juan, ‘A Novel Sensorless MPPT Controller for a High-Efficiency Micro scale Wind Power Generation System’, IEEE Transactions on Energy Conversion, Vol. 25 , No. 1, pp 207 – 216, 2010.
15. M. Meinhardt, G. Cramer, Past, present and future of grid connected photovoltaic- and hybrid-power-systems, IEEE proc. of power engineering society summer meeting, vol. 2, pp. 1283-1288, 2000.
16. Leyva, R.,Alonso, C., Queinnec, I., Cid-Pastor, A., Lagrange, D. and Martinez-Salamero, L ‘MPPT of photovoltaic systems using extremum - seeking control’, IEEE Transactions on Aerospace and Electronic Systems,Vol.42 , No.1, pp 249 – 258, 2006.
WSEAS TRANSACTIONS on SYSTEMS and CONTROL Ayaz Ahmad, L. Rajaji
E-ISSN: 2224-2856 14 Volume 10, 2015

17. N. Mohan, T. M. Undeland, W. P. Robbins, Power electronics: Converters, Applications and Design, 3rd edition, John Wiley & Sons, Inc., ISBN: 0-471-58408-8, 2003.
18. X. Long, R. Liao and J. Zhou, ‘Low-cost charge collector of photovoltaic power conditioning system based dynamic DC/DC topology’, IET Renew. Power Generation, March 2011, Volume 5, Issue 2, p.167–174
WSEAS TRANSACTIONS on SYSTEMS and CONTROL Ayaz Ahmad, L. Rajaji
E-ISSN: 2224-2856 15 Volume 10, 2015