Embed Size (px)
Citation preview
Development of low-costphotoacoustic imaging systems usingvery low-energy pulsed laser diodes
Ali HaririAfreen FatimaNafiseh MohammadianSadreddin MahmoodkalayehMohammad Ali AnsariNicholas BelyMohammad R. N. Avanaki
Ali Hariri, Afreen Fatima, Nafiseh Mohammadian, Sadreddin Mahmoodkalayeh, Mohammad Ali Ansari,Nicholas Bely, Mohammad R. N. Avanaki, “Development of low-cost photoacoustic imaging systems usingvery low-energy pulsed laser diodes,” J. Biomed. Opt. 22(7), 075001 (2017),doi: 10.1117/1.JBO.22.7.075001.
Downloaded From: https://www.spiedigitallibrary.org/journals/Journal-of-Biomedical-Optics on 09 Feb 2022Terms of Use: https://www.spiedigitallibrary.org/terms-of-use
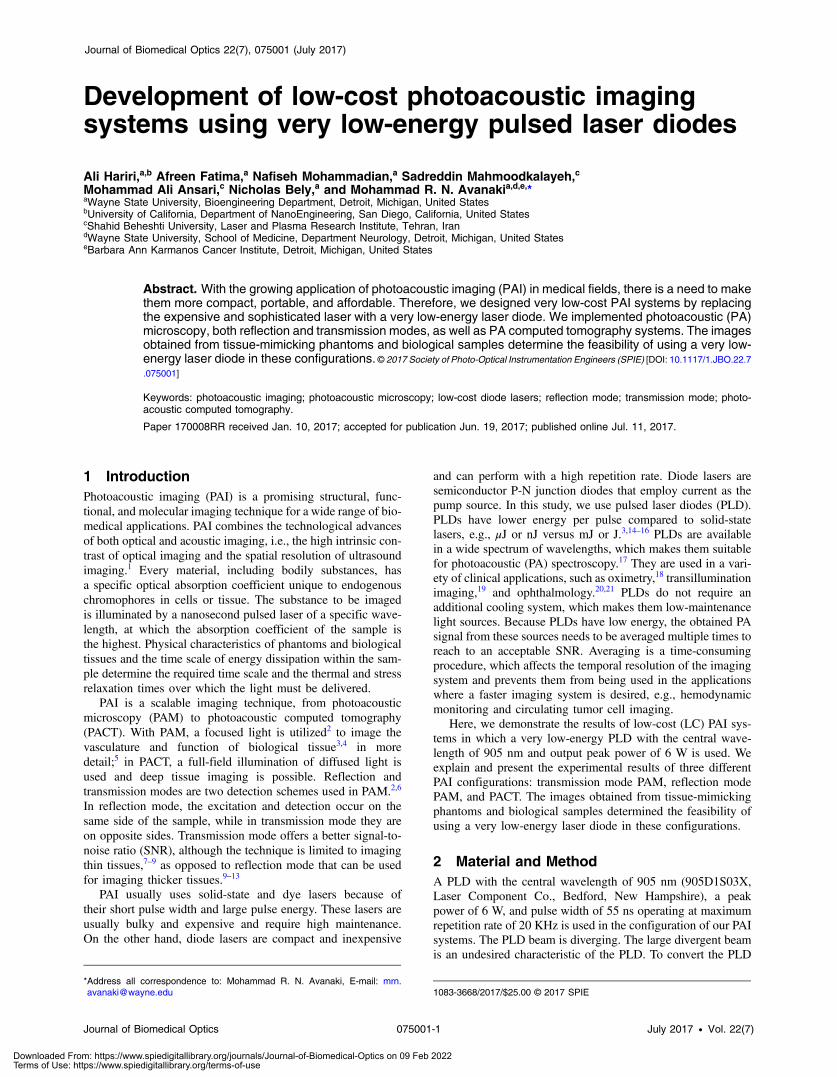
Development of low-cost photoacoustic imagingsystems using very low-energy pulsed laser diodes
Ali Hariri,a,b Afreen Fatima,a Nafiseh Mohammadian,a Sadreddin Mahmoodkalayeh,cMohammad Ali Ansari,c Nicholas Bely,a and Mohammad R. N. Avanakia,d,e,*aWayne State University, Bioengineering Department, Detroit, Michigan, United StatesbUniversity of California, Department of NanoEngineering, San Diego, California, United StatescShahid Beheshti University, Laser and Plasma Research Institute, Tehran, IrandWayne State University, School of Medicine, Department Neurology, Detroit, Michigan, United StateseBarbara Ann Karmanos Cancer Institute, Detroit, Michigan, United States
Abstract. With the growing application of photoacoustic imaging (PAI) in medical fields, there is a need to makethem more compact, portable, and affordable. Therefore, we designed very low-cost PAI systems by replacingthe expensive and sophisticated laser with a very low-energy laser diode. We implemented photoacoustic (PA)microscopy, both reflection and transmission modes, as well as PA computed tomography systems. The imagesobtained from tissue-mimicking phantoms and biological samples determine the feasibility of using a very low-energy laser diode in these configurations. © 2017 Society of Photo-Optical Instrumentation Engineers (SPIE) [DOI: 10.1117/1.JBO.22.7
.075001]
Keywords: photoacoustic imaging; photoacoustic microscopy; low-cost diode lasers; reflection mode; transmission mode; photo-acoustic computed tomography.
Paper 170008RR received Jan. 10, 2017; accepted for publication Jun. 19, 2017; published online Jul. 11, 2017.
1 IntroductionPhotoacoustic imaging (PAI) is a promising structural, func-tional, and molecular imaging technique for a wide range of bio-medical applications. PAI combines the technological advancesof both optical and acoustic imaging, i.e., the high intrinsic con-trast of optical imaging and the spatial resolution of ultrasoundimaging.1 Every material, including bodily substances, hasa specific optical absorption coefficient unique to endogenouschromophores in cells or tissue. The substance to be imagedis illuminated by a nanosecond pulsed laser of a specific wave-length, at which the absorption coefficient of the sample isthe highest. Physical characteristics of phantoms and biologicaltissues and the time scale of energy dissipation within the sam-ple determine the required time scale and the thermal and stressrelaxation times over which the light must be delivered.
PAI is a scalable imaging technique, from photoacousticmicroscopy (PAM) to photoacoustic computed tomography(PACT). With PAM, a focused light is utilized2 to image thevasculature and function of biological tissue3,4 in moredetail;5 in PACT, a full-field illumination of diffused light isused and deep tissue imaging is possible. Reflection andtransmission modes are two detection schemes used in PAM.2,6
In reflection mode, the excitation and detection occur on thesame side of the sample, while in transmission mode they areon opposite sides. Transmission mode offers a better signal-to-noise ratio (SNR), although the technique is limited to imagingthin tissues,7–9 as opposed to reflection mode that can be usedfor imaging thicker tissues.9–13
PAI usually uses solid-state and dye lasers because oftheir short pulse width and large pulse energy. These lasers areusually bulky and expensive and require high maintenance.On the other hand, diode lasers are compact and inexpensive
and can perform with a high repetition rate. Diode lasers aresemiconductor P-N junction diodes that employ current as thepump source. In this study, we use pulsed laser diodes (PLD).PLDs have lower energy per pulse compared to solid-statelasers, e.g., μJ or nJ versus mJ or J.3,14–16 PLDs are availablein a wide spectrum of wavelengths, which makes them suitablefor photoacoustic (PA) spectroscopy.17 They are used in a vari-ety of clinical applications, such as oximetry,18 transilluminationimaging,19 and ophthalmology.20,21 PLDs do not require anadditional cooling system, which makes them low-maintenancelight sources. Because PLDs have low energy, the obtained PAsignal from these sources needs to be averaged multiple times toreach to an acceptable SNR. Averaging is a time-consumingprocedure, which affects the temporal resolution of the imagingsystem and prevents them from being used in the applicationswhere a faster imaging system is desired, e.g., hemodynamicmonitoring and circulating tumor cell imaging.
Here, we demonstrate the results of low-cost (LC) PAI sys-tems in which a very low-energy PLD with the central wave-length of 905 nm and output peak power of 6 W is used. Weexplain and present the experimental results of three differentPAI configurations: transmission mode PAM, reflection modePAM, and PACT. The images obtained from tissue-mimickingphantoms and biological samples determined the feasibility ofusing a very low-energy laser diode in these configurations.
2 Material and MethodA PLD with the central wavelength of 905 nm (905D1S03X,Laser Component Co., Bedford, New Hampshire), a peakpower of 6 W, and pulse width of 55 ns operating at maximumrepetition rate of 20 KHz is used in the configuration of our PAIsystems. The PLD beam is diverging. The large divergent beamis an undesired characteristic of the PLD. To convert the PLD
*Address all correspondence to: Mohammad R. N. Avanaki, E-mail: [email protected] 1083-3668/2017/$25.00 © 2017 SPIE
Journal of Biomedical Optics 075001-1 July 2017 • Vol. 22(7)
Journal of Biomedical Optics 22(7), 075001 (July 2017)
Downloaded From: https://www.spiedigitallibrary.org/journals/Journal-of-Biomedical-Optics on 09 Feb 2022Terms of Use: https://www.spiedigitallibrary.org/terms-of-use
linear pattern to a tightly focused pattern, several methods havebeen tested in the literature. The most popular method is to use asingle aspheric lens to collimate the PLD.22 To focus the PLDbeam, a two-lens system is utilized: one lens collimates thehighly divergent beam and the second lens focuses the colli-mated light. Another method for collimating while simultane-ously circularizing the beam emitted by a PLD is to use twoorthogonally positioned cylindrical lenses. One lens is placed
to collimate the beam in the fast axis direction and another inslow axis direction.23 A pair of anamorphic prisms is used inaddition to an aspheric lens for PLD beam circularization.In this way, a collimated elliptical beam can be circularizedby either expanding in the slow axis of the ellipsis or com-pressing in the fast axis direction.24 In Table 1, a comparisonbetween size, cost, ellipticity, beam quality, and beam focusabil-ity of different collimation methods of PLD is given.
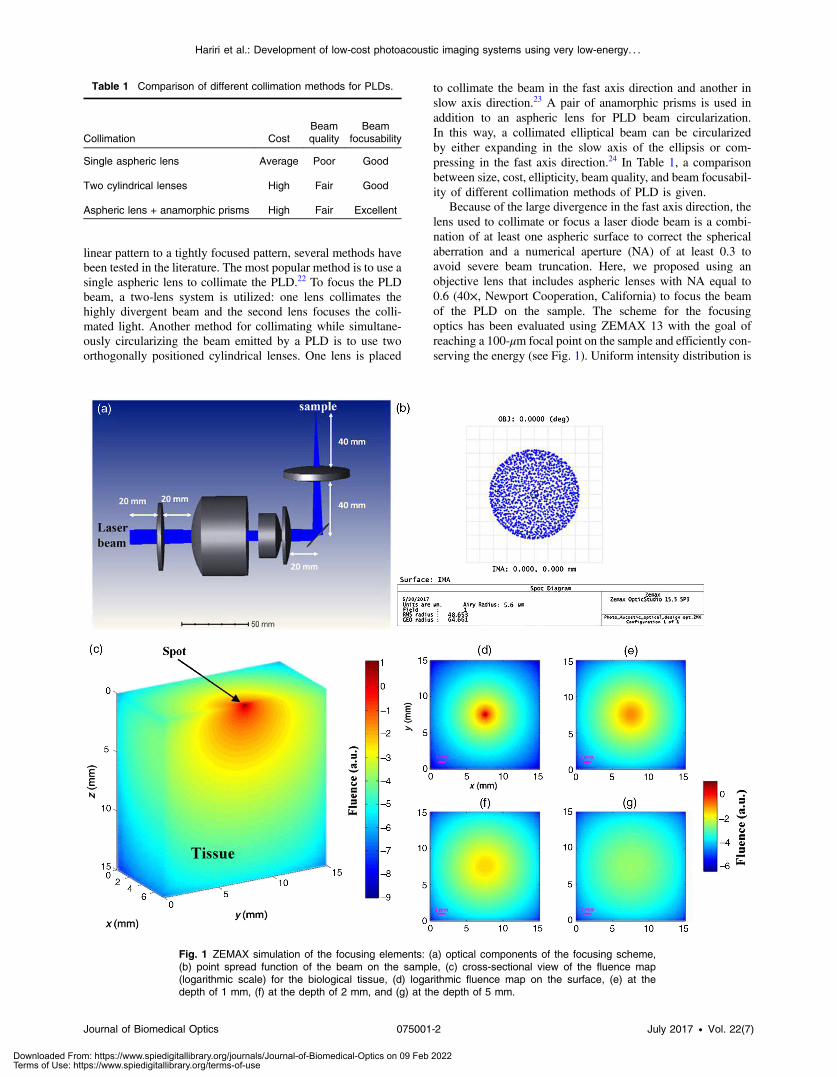
Because of the large divergence in the fast axis direction, thelens used to collimate or focus a laser diode beam is a combi-nation of at least one aspheric surface to correct the sphericalaberration and a numerical aperture (NA) of at least 0.3 toavoid severe beam truncation. Here, we proposed using anobjective lens that includes aspheric lenses with NA equal to0.6 (40×, Newport Cooperation, California) to focus the beamof the PLD on the sample. The scheme for the focusingoptics has been evaluated using ZEMAX 13 with the goal ofreaching a 100-μm focal point on the sample and efficiently con-serving the energy (see Fig. 1). Uniform intensity distribution is
Table 1 Comparison of different collimation methods for PLDs.
Collimation CostBeamquality
Beamfocusability
Single aspheric lens Average Poor Good
Two cylindrical lenses High Fair Good
Aspheric lens + anamorphic prisms High Fair Excellent
Fig. 1 ZEMAX simulation of the focusing elements: (a) optical components of the focusing scheme,(b) point spread function of the beam on the sample, (c) cross-sectional view of the fluence map(logarithmic scale) for the biological tissue, (d) logarithmic fluence map on the surface, (e) at thedepth of 1 mm, (f) at the depth of 2 mm, and (g) at the depth of 5 mm.
Journal of Biomedical Optics 075001-2 July 2017 • Vol. 22(7)
Hariri et al.: Development of low-cost photoacoustic imaging systems using very low-energy. . .
Downloaded From: https://www.spiedigitallibrary.org/journals/Journal-of-Biomedical-Optics on 09 Feb 2022Terms of Use: https://www.spiedigitallibrary.org/terms-of-use
considered in this design for a laser beam. Using this opticalconfiguration, a spot size of 97.3 μm [Fig. 1(b)] is reachedand can be considered the spatial resolution of the PAM system.The working distance of the objective lens is about 600 μm, andthe overall depth of focus is about 300 μm.
We also showed how 905-nm light is propagated through atissue. The tissue is considered a single layer 15 × 15 × 15 mm(L ×W ×H) cube with optical properties of μa ¼ 0.35 cm−1
and μ 0s ¼ 18 cm−1, corresponding to that of biological tissue
for 905-nm wavelength.25 A light source illuminates the surfaceof the tissue with a spot size of 100 μm in diameter [Fig. 1(c)].Normalized fluence is calculated by Monte Carlo simulation.2.5 × 108 photons are simulated using MCX software.26
The size of voxels is 0.1 × 0.1 × 0.1 mm. Figure 1(c) showsa fluence map (logarithmic scale) at a vertical cross sectionwith x ¼ 7.5 mm, which is where the source is located.Figures 1(d)–1(g) show the fluence map at the x-y plane onthe surface, at the depths of 1, 2, and 5 mm below the surface,respectively.
In the following, three LC PAI configurations are presented.
2.1 Transmission Mode Low-Cost PhotoacousticMicroscopy
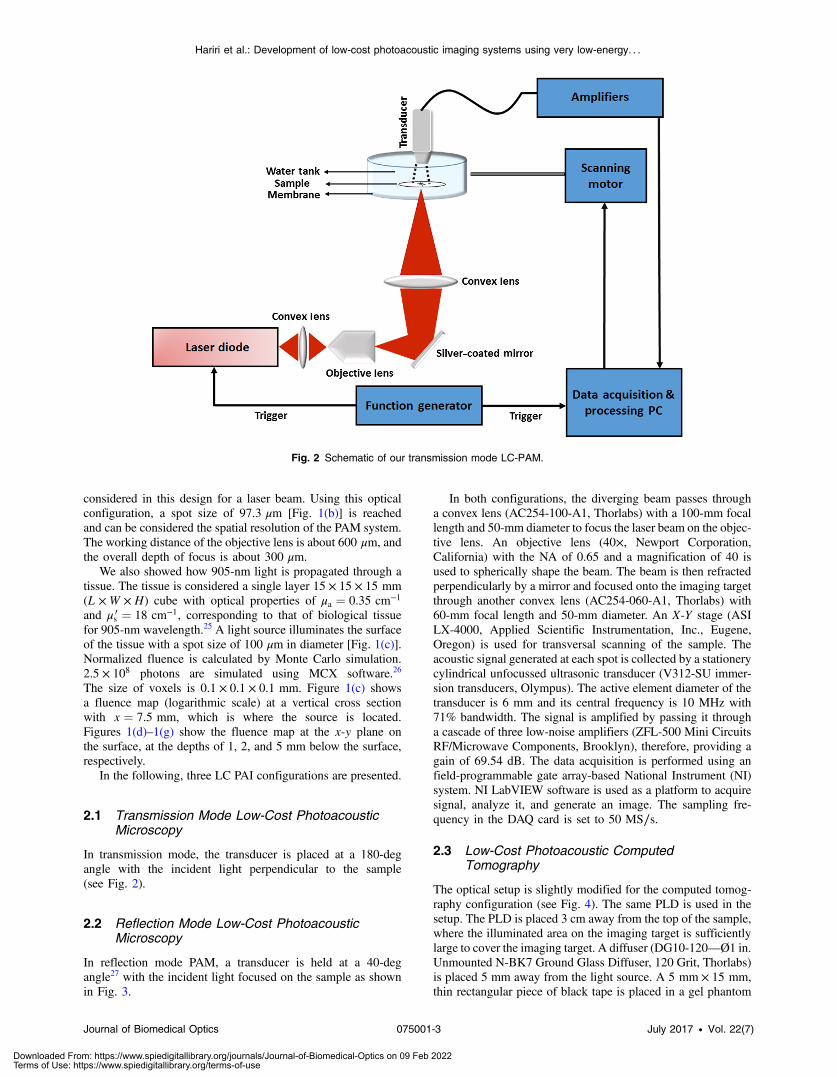
In transmission mode, the transducer is placed at a 180-degangle with the incident light perpendicular to the sample(see Fig. 2).
2.2 Reflection Mode Low-Cost PhotoacousticMicroscopy
In reflection mode PAM, a transducer is held at a 40-degangle27 with the incident light focused on the sample as shownin Fig. 3.
In both configurations, the diverging beam passes througha convex lens (AC254-100-A1, Thorlabs) with a 100-mm focallength and 50-mm diameter to focus the laser beam on the objec-tive lens. An objective lens (40×, Newport Corporation,California) with the NA of 0.65 and a magnification of 40 isused to spherically shape the beam. The beam is then refractedperpendicularly by a mirror and focused onto the imaging targetthrough another convex lens (AC254-060-A1, Thorlabs) with60-mm focal length and 50-mm diameter. An X-Y stage (ASILX-4000, Applied Scientific Instrumentation, Inc., Eugene,Oregon) is used for transversal scanning of the sample. Theacoustic signal generated at each spot is collected by a stationerycylindrical unfocussed ultrasonic transducer (V312-SU immer-sion transducers, Olympus). The active element diameter of thetransducer is 6 mm and its central frequency is 10 MHz with71% bandwidth. The signal is amplified by passing it througha cascade of three low-noise amplifiers (ZFL-500 Mini CircuitsRF/Microwave Components, Brooklyn), therefore, providing again of 69.54 dB. The data acquisition is performed using anfield-programmable gate array-based National Instrument (NI)system. NI LabVIEW software is used as a platform to acquiresignal, analyze it, and generate an image. The sampling fre-quency in the DAQ card is set to 50 MS∕s.
2.3 Low-Cost Photoacoustic ComputedTomography
The optical setup is slightly modified for the computed tomog-raphy configuration (see Fig. 4). The same PLD is used in thesetup. The PLD is placed 3 cm away from the top of the sample,where the illuminated area on the imaging target is sufficientlylarge to cover the imaging target. A diffuser (DG10-120—Ø1 in.Unmounted N-BK7 Ground Glass Diffuser, 120 Grit, Thorlabs)is placed 5 mm away from the light source. A 5 mm × 15 mm,thin rectangular piece of black tape is placed in a gel phantom
Fig. 2 Schematic of our transmission mode LC-PAM.
Journal of Biomedical Optics 075001-3 July 2017 • Vol. 22(7)
Hariri et al.: Development of low-cost photoacoustic imaging systems using very low-energy. . .
Downloaded From: https://www.spiedigitallibrary.org/journals/Journal-of-Biomedical-Optics on 09 Feb 2022Terms of Use: https://www.spiedigitallibrary.org/terms-of-use
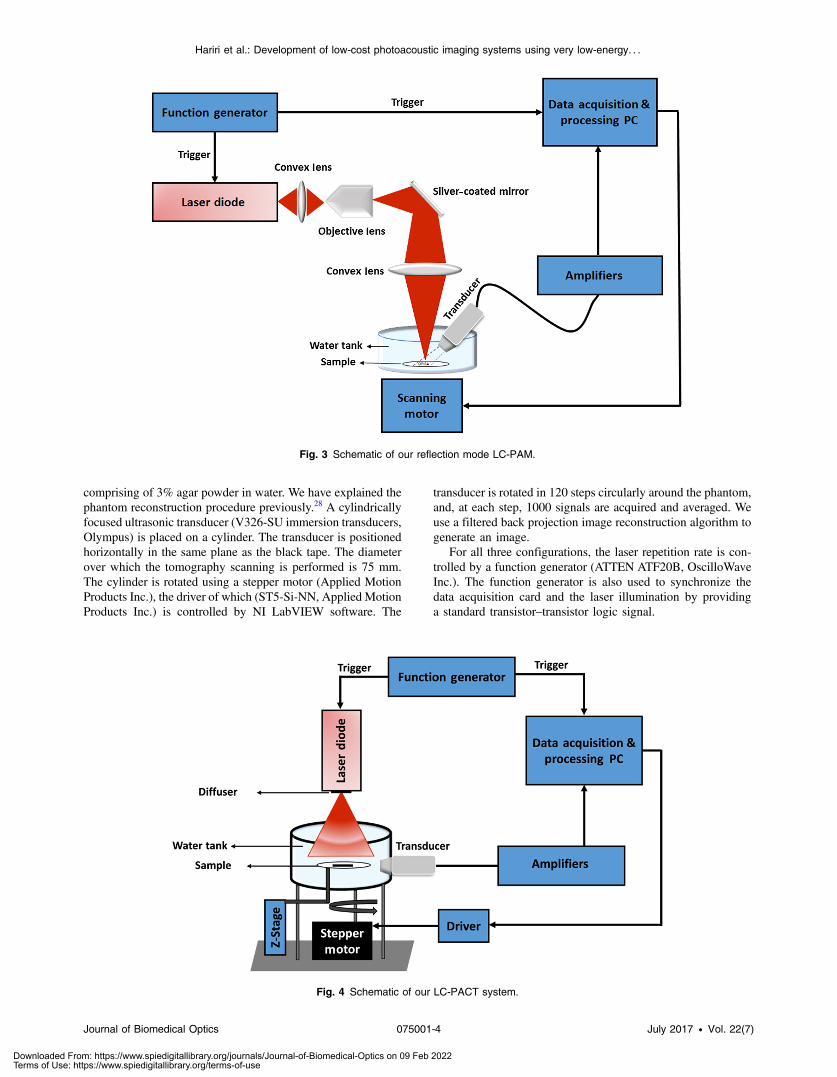
comprising of 3% agar powder in water. We have explained thephantom reconstruction procedure previously.28 A cylindricallyfocused ultrasonic transducer (V326-SU immersion transducers,Olympus) is placed on a cylinder. The transducer is positionedhorizontally in the same plane as the black tape. The diameterover which the tomography scanning is performed is 75 mm.The cylinder is rotated using a stepper motor (Applied MotionProducts Inc.), the driver of which (ST5-Si-NN, Applied MotionProducts Inc.) is controlled by NI LabVIEW software. The
transducer is rotated in 120 steps circularly around the phantom,and, at each step, 1000 signals are acquired and averaged. Weuse a filtered back projection image reconstruction algorithm togenerate an image.
For all three configurations, the laser repetition rate is con-trolled by a function generator (ATTEN ATF20B, OscilloWaveInc.). The function generator is also used to synchronize thedata acquisition card and the laser illumination by providinga standard transistor–transistor logic signal.
Fig. 3 Schematic of our reflection mode LC-PAM.
Fig. 4 Schematic of our LC-PACT system.
Journal of Biomedical Optics 075001-4 July 2017 • Vol. 22(7)
Hariri et al.: Development of low-cost photoacoustic imaging systems using very low-energy. . .
Downloaded From: https://www.spiedigitallibrary.org/journals/Journal-of-Biomedical-Optics on 09 Feb 2022Terms of Use: https://www.spiedigitallibrary.org/terms-of-use
3 Results
3.1 Transmission Mode Low-Cost PhotoacousticMicroscopy
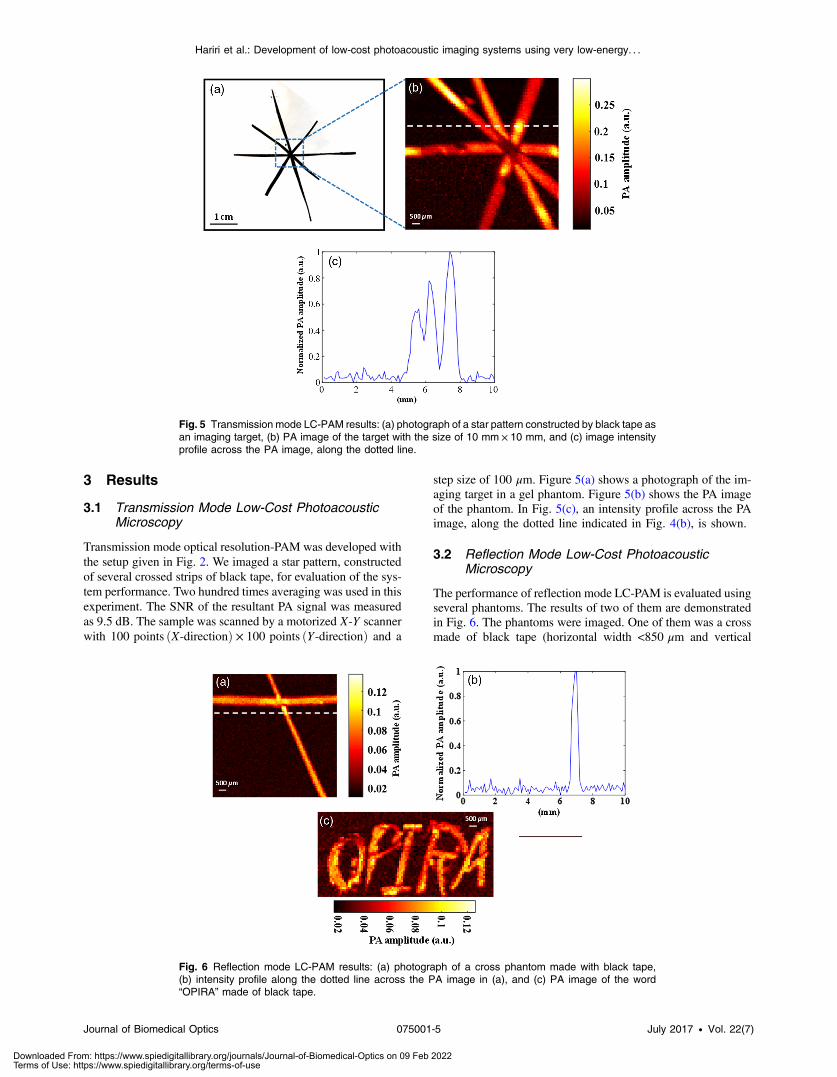
Transmission mode optical resolution-PAM was developed withthe setup given in Fig. 2. We imaged a star pattern, constructedof several crossed strips of black tape, for evaluation of the sys-tem performance. Two hundred times averaging was used in thisexperiment. The SNR of the resultant PA signal was measuredas 9.5 dB. The sample was scanned by a motorized X-Y scannerwith 100 points ðX-directionÞ × 100 points ðY-directionÞ and a
step size of 100 μm. Figure 5(a) shows a photograph of the im-aging target in a gel phantom. Figure 5(b) shows the PA imageof the phantom. In Fig. 5(c), an intensity profile across the PAimage, along the dotted line indicated in Fig. 4(b), is shown.
3.2 Reflection Mode Low-Cost PhotoacousticMicroscopy
The performance of reflection mode LC-PAM is evaluated usingseveral phantoms. The results of two of them are demonstratedin Fig. 6. The phantoms were imaged. One of them was a crossmade of black tape (horizontal width <850 μm and vertical
Fig. 5 Transmission mode LC-PAM results: (a) photograph of a star pattern constructed by black tape asan imaging target, (b) PA image of the target with the size of 10 mm × 10 mm, and (c) image intensityprofile across the PA image, along the dotted line.
Fig. 6 Reflection mode LC-PAM results: (a) photograph of a cross phantom made with black tape,(b) intensity profile along the dotted line across the PA image in (a), and (c) PA image of the word“OPIRA” made of black tape.
Journal of Biomedical Optics 075001-5 July 2017 • Vol. 22(7)
Hariri et al.: Development of low-cost photoacoustic imaging systems using very low-energy. . .
Downloaded From: https://www.spiedigitallibrary.org/journals/Journal-of-Biomedical-Optics on 09 Feb 2022Terms of Use: https://www.spiedigitallibrary.org/terms-of-use
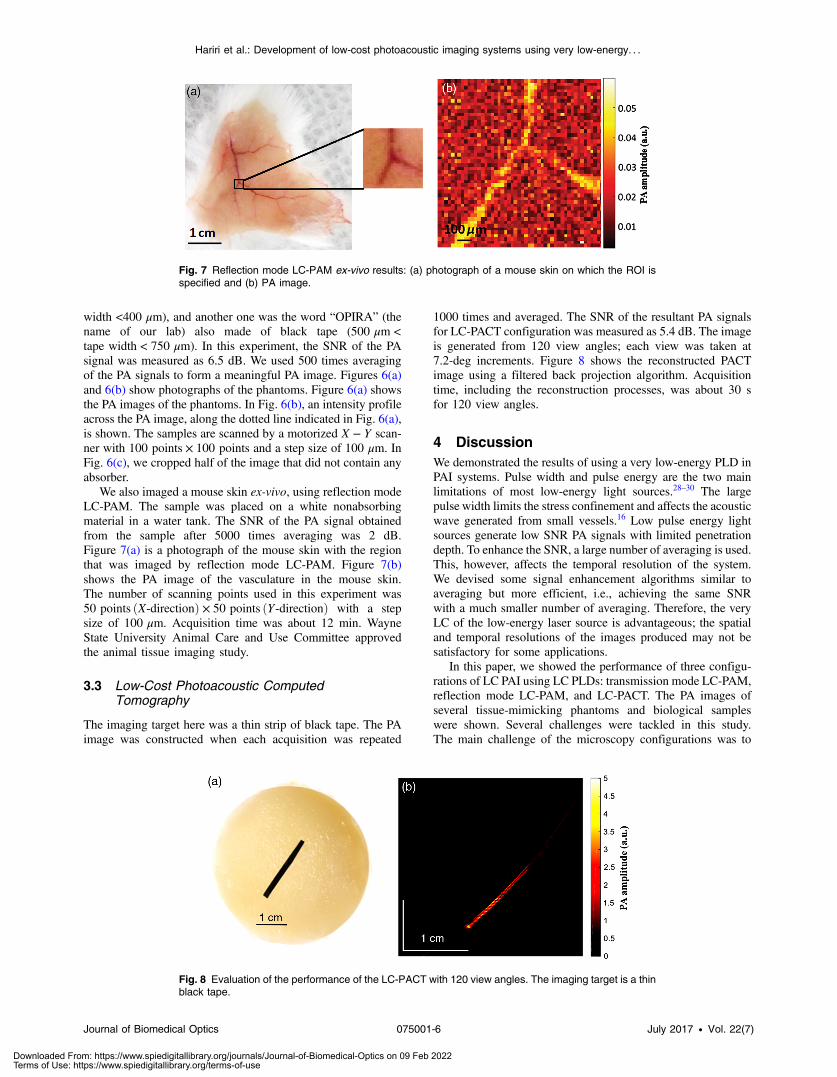
width <400 μm), and another one was the word “OPIRA” (thename of our lab) also made of black tape (500 μm <tape width < 750 μm). In this experiment, the SNR of the PAsignal was measured as 6.5 dB. We used 500 times averagingof the PA signals to form a meaningful PA image. Figures 6(a)and 6(b) show photographs of the phantoms. Figure 6(a) showsthe PA images of the phantoms. In Fig. 6(b), an intensity profileacross the PA image, along the dotted line indicated in Fig. 6(a),is shown. The samples are scanned by a motorized X − Y scan-ner with 100 points × 100 points and a step size of 100 μm. InFig. 6(c), we cropped half of the image that did not contain anyabsorber.
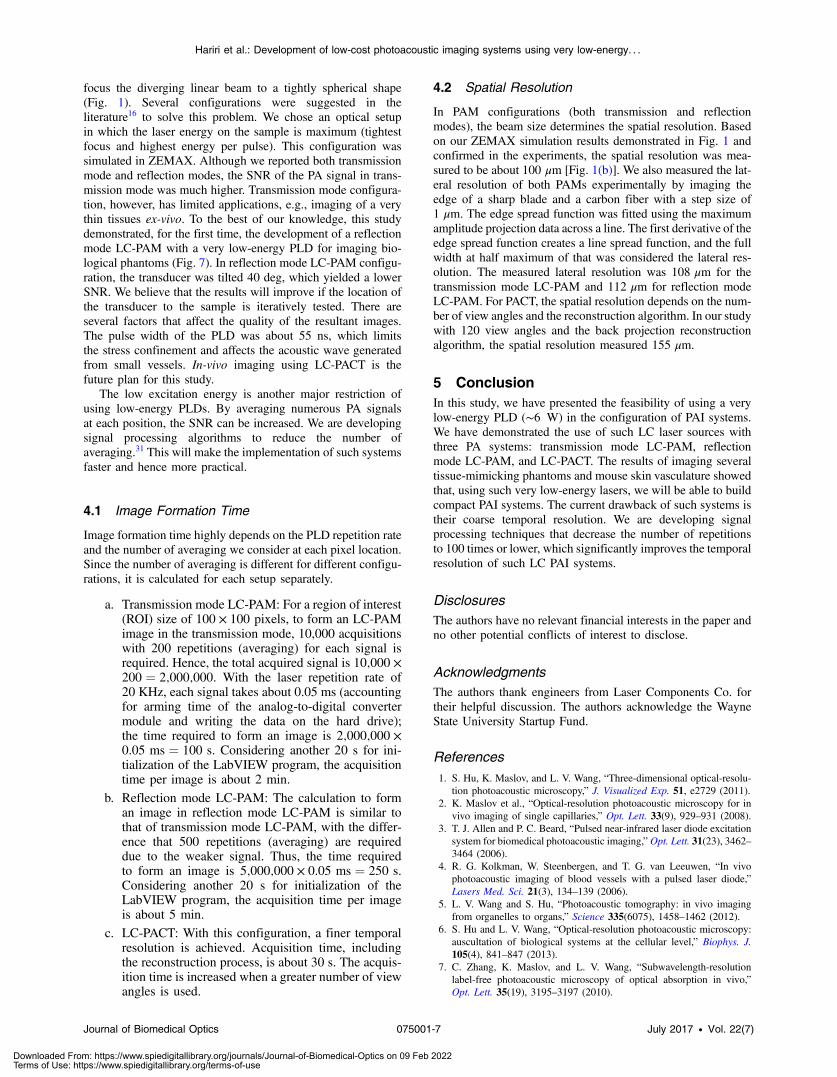
We also imaged a mouse skin ex-vivo, using reflection modeLC-PAM. The sample was placed on a white nonabsorbingmaterial in a water tank. The SNR of the PA signal obtainedfrom the sample after 5000 times averaging was 2 dB.Figure 7(a) is a photograph of the mouse skin with the regionthat was imaged by reflection mode LC-PAM. Figure 7(b)shows the PA image of the vasculature in the mouse skin.The number of scanning points used in this experiment was50 points ðX-directionÞ × 50 points ðY-directionÞ with a stepsize of 100 μm. Acquisition time was about 12 min. WayneState University Animal Care and Use Committee approvedthe animal tissue imaging study.
3.3 Low-Cost Photoacoustic ComputedTomography
The imaging target here was a thin strip of black tape. The PAimage was constructed when each acquisition was repeated
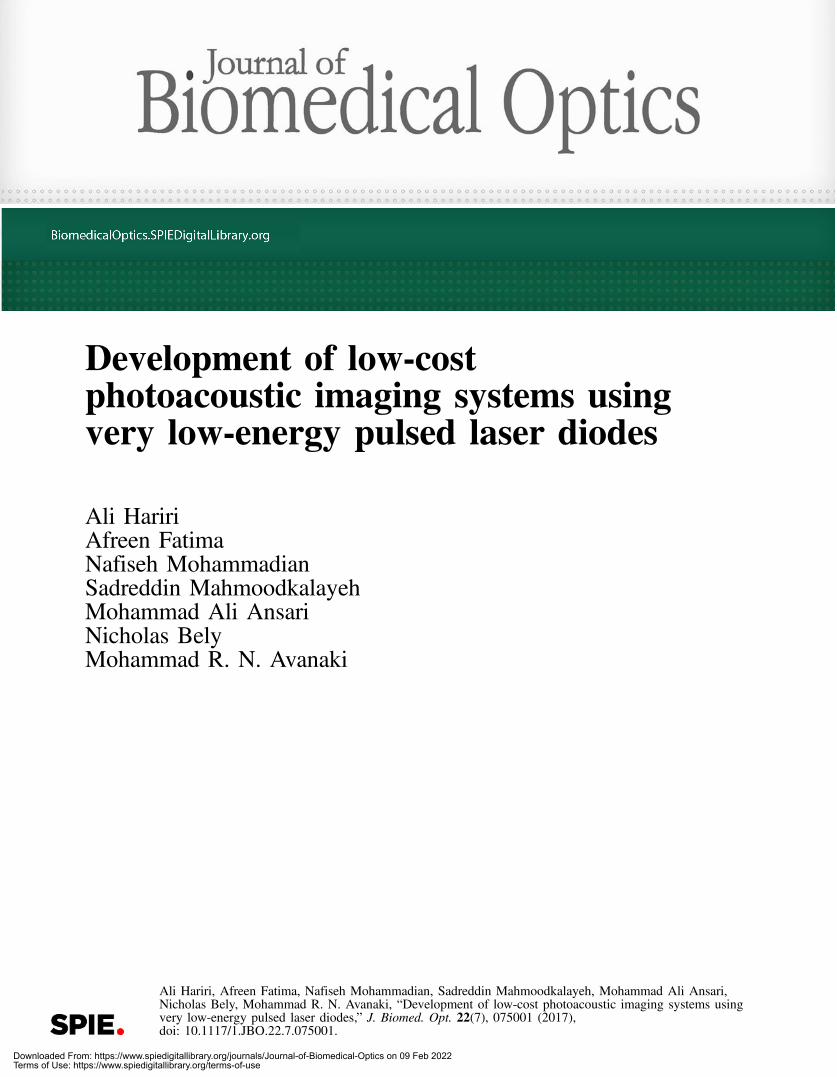
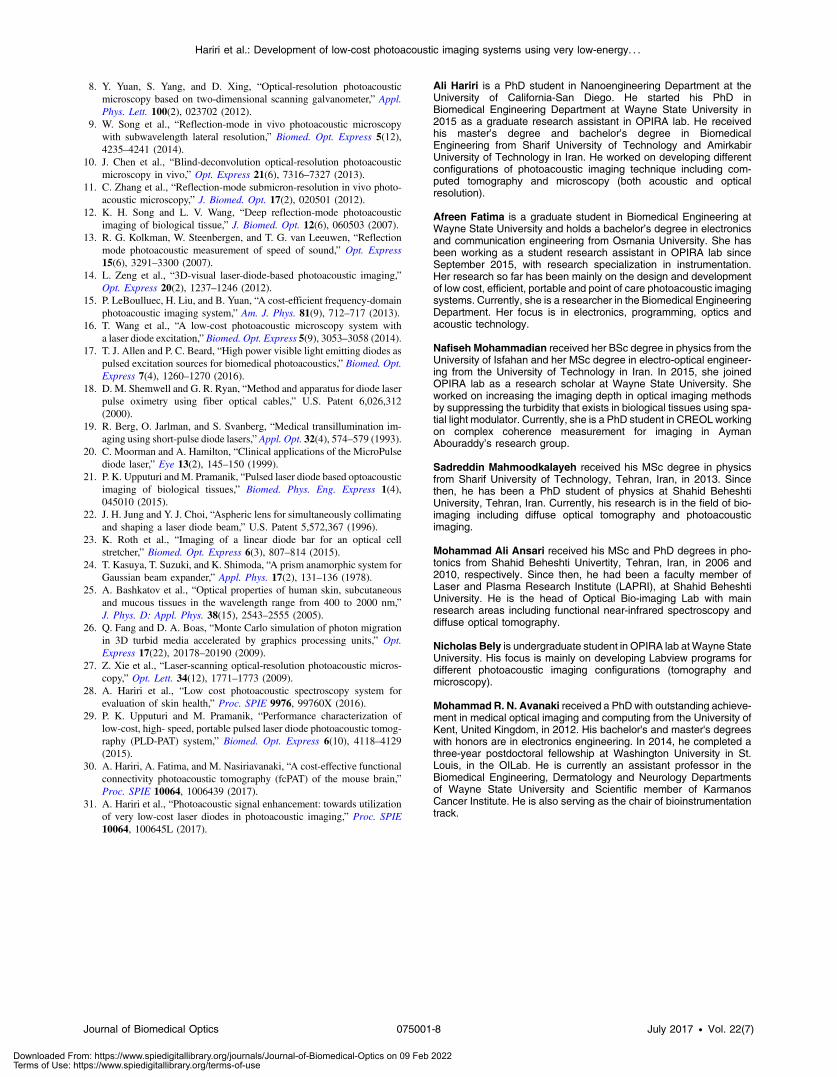
1000 times and averaged. The SNR of the resultant PA signalsfor LC-PACT configuration was measured as 5.4 dB. The imageis generated from 120 view angles; each view was taken at7.2-deg increments. Figure 8 shows the reconstructed PACTimage using a filtered back projection algorithm. Acquisitiontime, including the reconstruction processes, was about 30 sfor 120 view angles.
4 DiscussionWe demonstrated the results of using a very low-energy PLD inPAI systems. Pulse width and pulse energy are the two mainlimitations of most low-energy light sources.28–30 The largepulse width limits the stress confinement and affects the acousticwave generated from small vessels.16 Low pulse energy lightsources generate low SNR PA signals with limited penetrationdepth. To enhance the SNR, a large number of averaging is used.This, however, affects the temporal resolution of the system.We devised some signal enhancement algorithms similar toaveraging but more efficient, i.e., achieving the same SNRwith a much smaller number of averaging. Therefore, the veryLC of the low-energy laser source is advantageous; the spatialand temporal resolutions of the images produced may not besatisfactory for some applications.
In this paper, we showed the performance of three configu-rations of LC PAI using LC PLDs: transmission mode LC-PAM,reflection mode LC-PAM, and LC-PACT. The PA images ofseveral tissue-mimicking phantoms and biological sampleswere shown. Several challenges were tackled in this study.The main challenge of the microscopy configurations was to
Fig. 7 Reflection mode LC-PAM ex-vivo results: (a) photograph of a mouse skin on which the ROI isspecified and (b) PA image.
Fig. 8 Evaluation of the performance of the LC-PACT with 120 view angles. The imaging target is a thinblack tape.
Journal of Biomedical Optics 075001-6 July 2017 • Vol. 22(7)
Hariri et al.: Development of low-cost photoacoustic imaging systems using very low-energy. . .
Downloaded From: https://www.spiedigitallibrary.org/journals/Journal-of-Biomedical-Optics on 09 Feb 2022Terms of Use: https://www.spiedigitallibrary.org/terms-of-use
focus the diverging linear beam to a tightly spherical shape(Fig. 1). Several configurations were suggested in theliterature16 to solve this problem. We chose an optical setupin which the laser energy on the sample is maximum (tightestfocus and highest energy per pulse). This configuration wassimulated in ZEMAX. Although we reported both transmissionmode and reflection modes, the SNR of the PA signal in trans-mission mode was much higher. Transmission mode configura-tion, however, has limited applications, e.g., imaging of a verythin tissues ex-vivo. To the best of our knowledge, this studydemonstrated, for the first time, the development of a reflectionmode LC-PAM with a very low-energy PLD for imaging bio-logical phantoms (Fig. 7). In reflection mode LC-PAM configu-ration, the transducer was tilted 40 deg, which yielded a lowerSNR. We believe that the results will improve if the location ofthe transducer to the sample is iteratively tested. There areseveral factors that affect the quality of the resultant images.The pulse width of the PLD was about 55 ns, which limitsthe stress confinement and affects the acoustic wave generatedfrom small vessels. In-vivo imaging using LC-PACT is thefuture plan for this study.
The low excitation energy is another major restriction ofusing low-energy PLDs. By averaging numerous PA signalsat each position, the SNR can be increased. We are developingsignal processing algorithms to reduce the number ofaveraging.31 This will make the implementation of such systemsfaster and hence more practical.
4.1 Image Formation Time
Image formation time highly depends on the PLD repetition rateand the number of averaging we consider at each pixel location.Since the number of averaging is different for different configu-rations, it is calculated for each setup separately.
a. Transmission mode LC-PAM: For a region of interest(ROI) size of 100 × 100 pixels, to form an LC-PAMimage in the transmission mode, 10,000 acquisitionswith 200 repetitions (averaging) for each signal isrequired. Hence, the total acquired signal is 10;000 ×200 ¼ 2;000;000. With the laser repetition rate of20 KHz, each signal takes about 0.05 ms (accountingfor arming time of the analog-to-digital convertermodule and writing the data on the hard drive);the time required to form an image is 2;000;000 ×0.05 ms ¼ 100 s. Considering another 20 s for ini-tialization of the LabVIEW program, the acquisitiontime per image is about 2 min.
b. Reflection mode LC-PAM: The calculation to forman image in reflection mode LC-PAM is similar tothat of transmission mode LC-PAM, with the differ-ence that 500 repetitions (averaging) are requireddue to the weaker signal. Thus, the time requiredto form an image is 5;000;000 × 0.05 ms ¼ 250 s.Considering another 20 s for initialization of theLabVIEW program, the acquisition time per imageis about 5 min.
c. LC-PACT: With this configuration, a finer temporalresolution is achieved. Acquisition time, includingthe reconstruction process, is about 30 s. The acquis-ition time is increased when a greater number of viewangles is used.
4.2 Spatial Resolution
In PAM configurations (both transmission and reflectionmodes), the beam size determines the spatial resolution. Basedon our ZEMAX simulation results demonstrated in Fig. 1 andconfirmed in the experiments, the spatial resolution was mea-sured to be about 100 μm [Fig. 1(b)]. We also measured the lat-eral resolution of both PAMs experimentally by imaging theedge of a sharp blade and a carbon fiber with a step size of1 μm. The edge spread function was fitted using the maximumamplitude projection data across a line. The first derivative of theedge spread function creates a line spread function, and the fullwidth at half maximum of that was considered the lateral res-olution. The measured lateral resolution was 108 μm for thetransmission mode LC-PAM and 112 μm for reflection modeLC-PAM. For PACT, the spatial resolution depends on the num-ber of view angles and the reconstruction algorithm. In our studywith 120 view angles and the back projection reconstructionalgorithm, the spatial resolution measured 155 μm.
5 ConclusionIn this study, we have presented the feasibility of using a verylow-energy PLD (∼6 W) in the configuration of PAI systems.We have demonstrated the use of such LC laser sources withthree PA systems: transmission mode LC-PAM, reflectionmode LC-PAM, and LC-PACT. The results of imaging severaltissue-mimicking phantoms and mouse skin vasculature showedthat, using such very low-energy lasers, we will be able to buildcompact PAI systems. The current drawback of such systems istheir coarse temporal resolution. We are developing signalprocessing techniques that decrease the number of repetitionsto 100 times or lower, which significantly improves the temporalresolution of such LC PAI systems.
DisclosuresThe authors have no relevant financial interests in the paper andno other potential conflicts of interest to disclose.
AcknowledgmentsThe authors thank engineers from Laser Components Co. fortheir helpful discussion. The authors acknowledge the WayneState University Startup Fund.
References1. S. Hu, K. Maslov, and L. V. Wang, “Three-dimensional optical-resolu-
tion photoacoustic microscopy,” J. Visualized Exp. 51, e2729 (2011).2. K. Maslov et al., “Optical-resolution photoacoustic microscopy for in
vivo imaging of single capillaries,” Opt. Lett. 33(9), 929–931 (2008).3. T. J. Allen and P. C. Beard, “Pulsed near-infrared laser diode excitation
system for biomedical photoacoustic imaging,” Opt. Lett. 31(23), 3462–3464 (2006).
4. R. G. Kolkman, W. Steenbergen, and T. G. van Leeuwen, “In vivophotoacoustic imaging of blood vessels with a pulsed laser diode,”Lasers Med. Sci. 21(3), 134–139 (2006).
5. L. V. Wang and S. Hu, “Photoacoustic tomography: in vivo imagingfrom organelles to organs,” Science 335(6075), 1458–1462 (2012).
6. S. Hu and L. V. Wang, “Optical-resolution photoacoustic microscopy:auscultation of biological systems at the cellular level,” Biophys. J.105(4), 841–847 (2013).
7. C. Zhang, K. Maslov, and L. V. Wang, “Subwavelength-resolutionlabel-free photoacoustic microscopy of optical absorption in vivo,”Opt. Lett. 35(19), 3195–3197 (2010).
Journal of Biomedical Optics 075001-7 July 2017 • Vol. 22(7)
Hariri et al.: Development of low-cost photoacoustic imaging systems using very low-energy. . .
Downloaded From: https://www.spiedigitallibrary.org/journals/Journal-of-Biomedical-Optics on 09 Feb 2022Terms of Use: https://www.spiedigitallibrary.org/terms-of-use
8. Y. Yuan, S. Yang, and D. Xing, “Optical-resolution photoacousticmicroscopy based on two-dimensional scanning galvanometer,” Appl.Phys. Lett. 100(2), 023702 (2012).
9. W. Song et al., “Reflection-mode in vivo photoacoustic microscopywith subwavelength lateral resolution,” Biomed. Opt. Express 5(12),4235–4241 (2014).
10. J. Chen et al., “Blind-deconvolution optical-resolution photoacousticmicroscopy in vivo,” Opt. Express 21(6), 7316–7327 (2013).
11. C. Zhang et al., “Reflection-mode submicron-resolution in vivo photo-acoustic microscopy,” J. Biomed. Opt. 17(2), 020501 (2012).
12. K. H. Song and L. V. Wang, “Deep reflection-mode photoacousticimaging of biological tissue,” J. Biomed. Opt. 12(6), 060503 (2007).
13. R. G. Kolkman, W. Steenbergen, and T. G. van Leeuwen, “Reflectionmode photoacoustic measurement of speed of sound,” Opt. Express15(6), 3291–3300 (2007).
14. L. Zeng et al., “3D-visual laser-diode-based photoacoustic imaging,”Opt. Express 20(2), 1237–1246 (2012).
15. P. LeBoulluec, H. Liu, and B. Yuan, “A cost-efficient frequency-domainphotoacoustic imaging system,” Am. J. Phys. 81(9), 712–717 (2013).
16. T. Wang et al., “A low-cost photoacoustic microscopy system witha laser diode excitation,” Biomed. Opt. Express 5(9), 3053–3058 (2014).
17. T. J. Allen and P. C. Beard, “High power visible light emitting diodes aspulsed excitation sources for biomedical photoacoustics,” Biomed. Opt.Express 7(4), 1260–1270 (2016).
18. D. M. Shemwell and G. R. Ryan, “Method and apparatus for diode laserpulse oximetry using fiber optical cables,” U.S. Patent 6,026,312(2000).
19. R. Berg, O. Jarlman, and S. Svanberg, “Medical transillumination im-aging using short-pulse diode lasers,” Appl. Opt. 32(4), 574–579 (1993).
20. C. Moorman and A. Hamilton, “Clinical applications of the MicroPulsediode laser,” Eye 13(2), 145–150 (1999).
21. P. K. Upputuri andM. Pramanik, “Pulsed laser diode based optoacousticimaging of biological tissues,” Biomed. Phys. Eng. Express 1(4),045010 (2015).
22. J. H. Jung and Y. J. Choi, “Aspheric lens for simultaneously collimatingand shaping a laser diode beam,” U.S. Patent 5,572,367 (1996).
23. K. Roth et al., “Imaging of a linear diode bar for an optical cellstretcher,” Biomed. Opt. Express 6(3), 807–814 (2015).
24. T. Kasuya, T. Suzuki, and K. Shimoda, “A prism anamorphic system forGaussian beam expander,” Appl. Phys. 17(2), 131–136 (1978).
25. A. Bashkatov et al., “Optical properties of human skin, subcutaneousand mucous tissues in the wavelength range from 400 to 2000 nm,”J. Phys. D: Appl. Phys. 38(15), 2543–2555 (2005).
26. Q. Fang and D. A. Boas, “Monte Carlo simulation of photon migrationin 3D turbid media accelerated by graphics processing units,” Opt.Express 17(22), 20178–20190 (2009).
27. Z. Xie et al., “Laser-scanning optical-resolution photoacoustic micros-copy,” Opt. Lett. 34(12), 1771–1773 (2009).
28. A. Hariri et al., “Low cost photoacoustic spectroscopy system forevaluation of skin health,” Proc. SPIE 9976, 99760X (2016).
29. P. K. Upputuri and M. Pramanik, “Performance characterization oflow-cost, high- speed, portable pulsed laser diode photoacoustic tomog-raphy (PLD-PAT) system,” Biomed. Opt. Express 6(10), 4118–4129(2015).
30. A. Hariri, A. Fatima, and M. Nasiriavanaki, “A cost-effective functionalconnectivity photoacoustic tomography (fcPAT) of the mouse brain,”Proc. SPIE 10064, 1006439 (2017).
31. A. Hariri et al., “Photoacoustic signal enhancement: towards utilizationof very low-cost laser diodes in photoacoustic imaging,” Proc. SPIE10064, 100645L (2017).
Ali Hariri is a PhD student in Nanoengineering Department at theUniversity of California-San Diego. He started his PhD inBiomedical Engineering Department at Wayne State University in2015 as a graduate research assistant in OPIRA lab. He receivedhis master’s degree and bachelor’s degree in BiomedicalEngineering from Sharif University of Technology and AmirkabirUniversity of Technology in Iran. He worked on developing differentconfigurations of photoacoustic imaging technique including com-puted tomography and microscopy (both acoustic and opticalresolution).
Afreen Fatima is a graduate student in Biomedical Engineering atWayne State University and holds a bachelor’s degree in electronicsand communication engineering from Osmania University. She hasbeen working as a student research assistant in OPIRA lab sinceSeptember 2015, with research specialization in instrumentation.Her research so far has been mainly on the design and developmentof low cost, efficient, portable and point of care photoacoustic imagingsystems. Currently, she is a researcher in the Biomedical EngineeringDepartment. Her focus is in electronics, programming, optics andacoustic technology.
Nafiseh Mohammadian received her BSc degree in physics from theUniversity of Isfahan and her MSc degree in electro-optical engineer-ing from the University of Technology in Iran. In 2015, she joinedOPIRA lab as a research scholar at Wayne State University. Sheworked on increasing the imaging depth in optical imaging methodsby suppressing the turbidity that exists in biological tissues using spa-tial light modulator. Currently, she is a PhD student in CREOL workingon complex coherence measurement for imaging in AymanAbouraddy’s research group.
Sadreddin Mahmoodkalayeh received his MSc degree in physicsfrom Sharif University of Technology, Tehran, Iran, in 2013. Sincethen, he has been a PhD student of physics at Shahid BeheshtiUniversity, Tehran, Iran. Currently, his research is in the field of bio-imaging including diffuse optical tomography and photoacousticimaging.
Mohammad Ali Ansari received his MSc and PhD degrees in pho-tonics from Shahid Beheshti Univertity, Tehran, Iran, in 2006 and2010, respectively. Since then, he had been a faculty member ofLaser and Plasma Research Institute (LAPRI), at Shahid BeheshtiUniversity. He is the head of Optical Bio-imaging Lab with mainresearch areas including functional near-infrared spectroscopy anddiffuse optical tomography.
Nicholas Bely is undergraduate student in OPIRA lab at Wayne StateUniversity. His focus is mainly on developing Labview programs fordifferent photoacoustic imaging configurations (tomography andmicroscopy).
MohammadR. N. Avanaki received a PhD with outstanding achieve-ment in medical optical imaging and computing from the University ofKent, United Kingdom, in 2012. His bachelor's and master's degreeswith honors are in electronics engineering. In 2014, he completed athree-year postdoctoral fellowship at Washington University in St.Louis, in the OILab. He is currently an assistant professor in theBiomedical Engineering, Dermatology and Neurology Departmentsof Wayne State University and Scientific member of KarmanosCancer Institute. He is also serving as the chair of bioinstrumentationtrack.
Journal of Biomedical Optics 075001-8 July 2017 • Vol. 22(7)
Hariri et al.: Development of low-cost photoacoustic imaging systems using very low-energy. . .
Downloaded From: https://www.spiedigitallibrary.org/journals/Journal-of-Biomedical-Optics on 09 Feb 2022Terms of Use: https://www.spiedigitallibrary.org/terms-of-use