Embed Size (px)
Citation preview
Development of rapid Development of rapid bioassessmentbioassessment approaches approaches using benthic using benthic macroinvertebratesmacroinvertebrates for streams, for streams, northeast, northeast, ThailandThailand
NarumonNarumon SangpradubSangpradubChutimaChutima HanjavanitHanjavanitBoonsatienBoonsatien BoonsoongBoonsoongPaiboonPaiboon GetwongsaGetwongsaPornchaiPornchai UttarakUttarakNisaratNisarat TungpairojwongTungpairojwong
• Introduction
• Objective
• Research Methodology
• Results and Discussion
• Conclusions
OutlinesOutlines
Bioassessment is the process of evaluating the condition of a water body, using biological surveys and other direct measurements of the resident biota (fish, benticmacroinvertebrates, algae, etc.) in freshwater
Rapid Bioassessment Protocols
•Integrated assessment of habitat (physical structure), water quality, and biological condition
•Habitat Quality + Water quality =
Biological Condition of the Community
When physical habitat quality at two sites is equal, differences in biological condition are the result of water quality stress
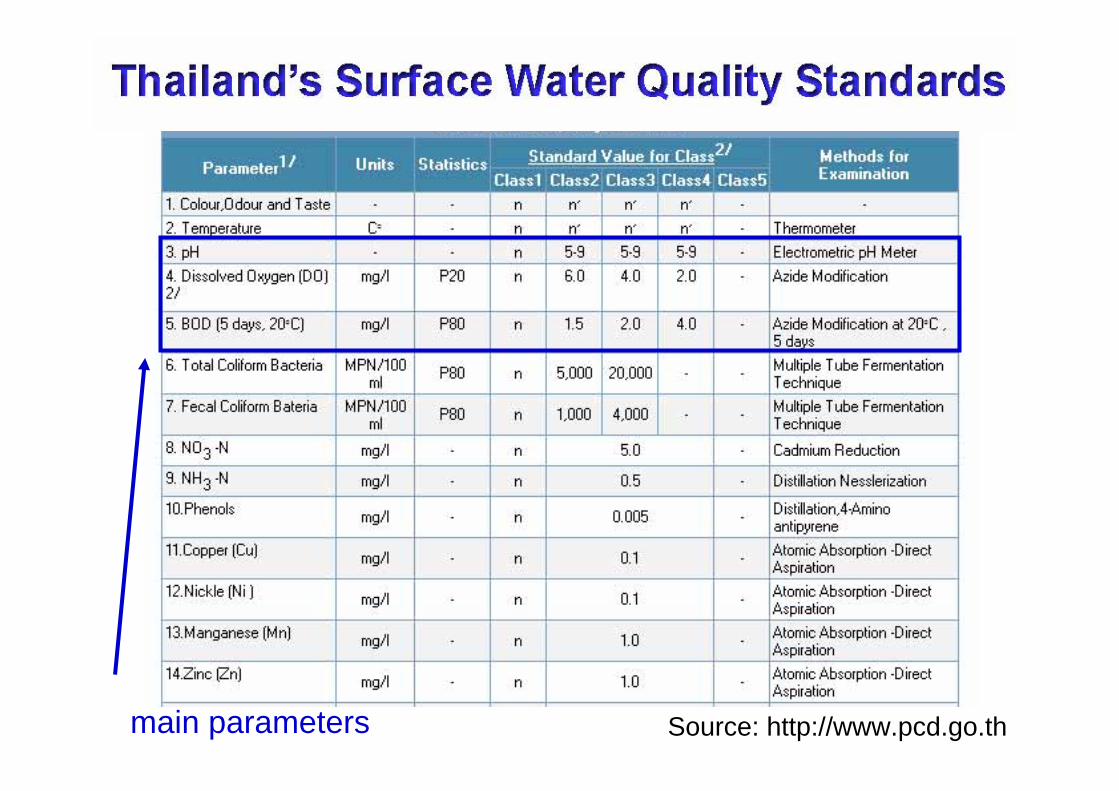
Source: http://www.pcd.go.thmain parameters
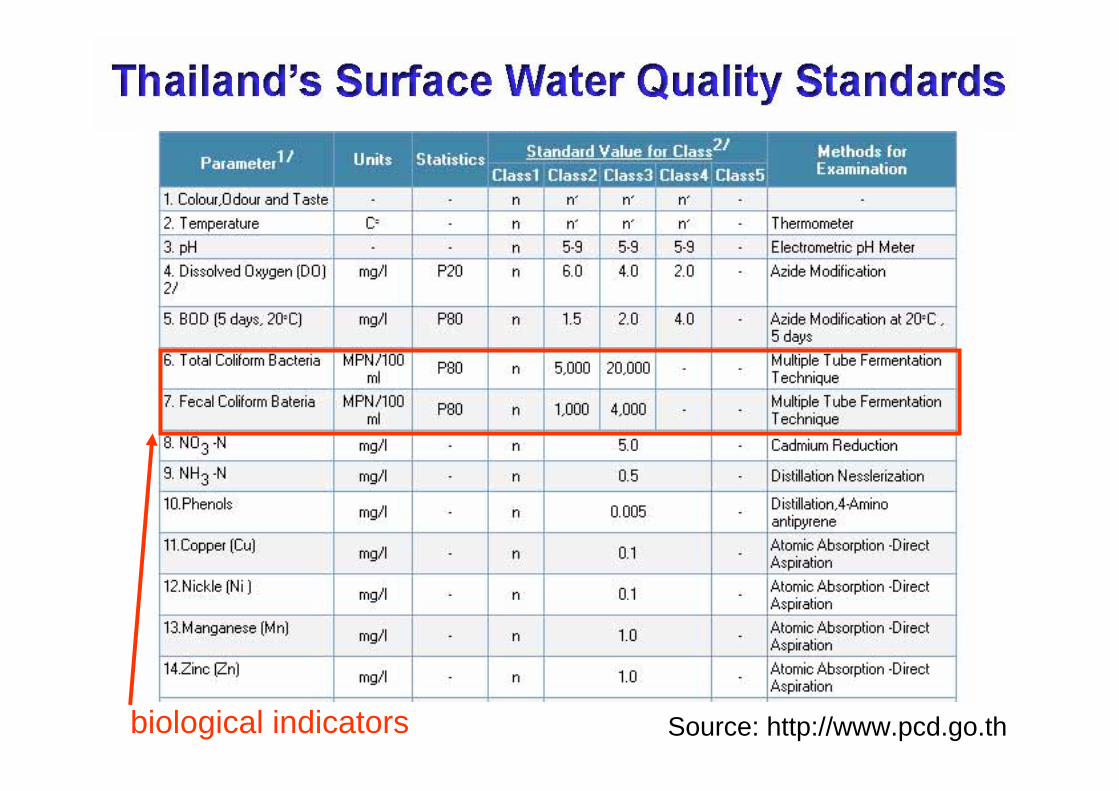
Source: http://www.pcd.go.thbiological indicators
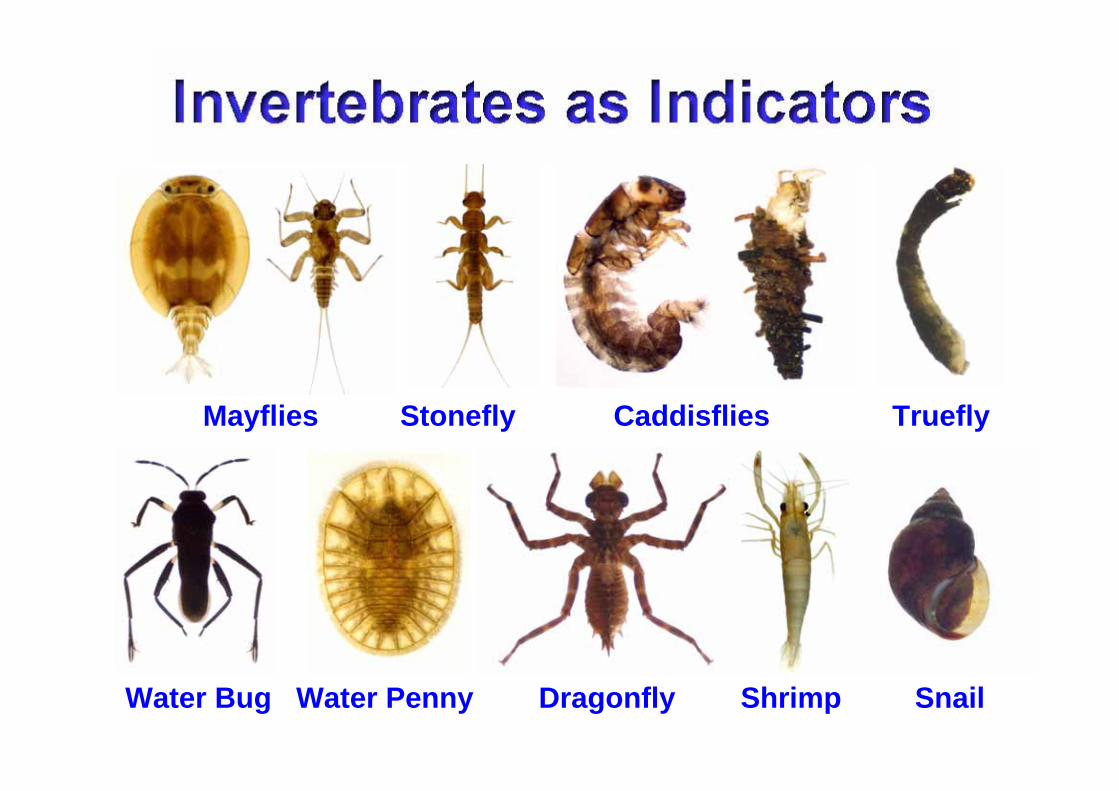
Mayflies Stonefly Caddisflies Truefly
Water Bug Water Penny Dragonfly Shrimp Snail
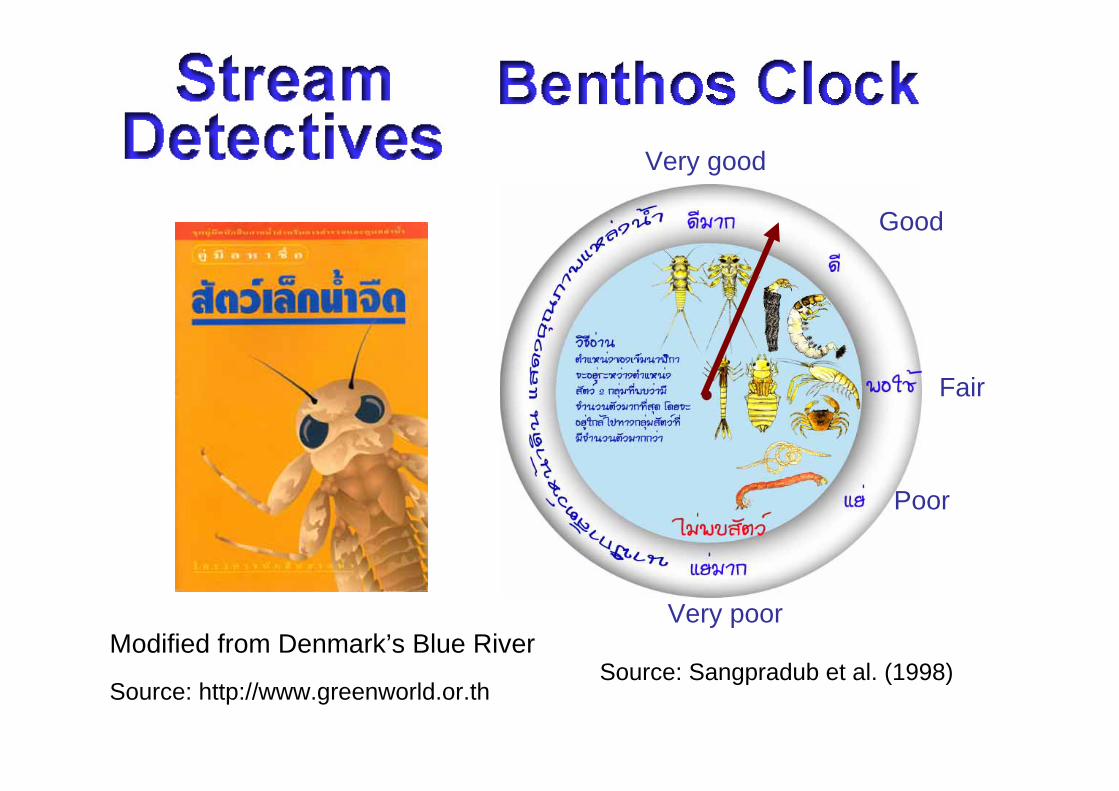
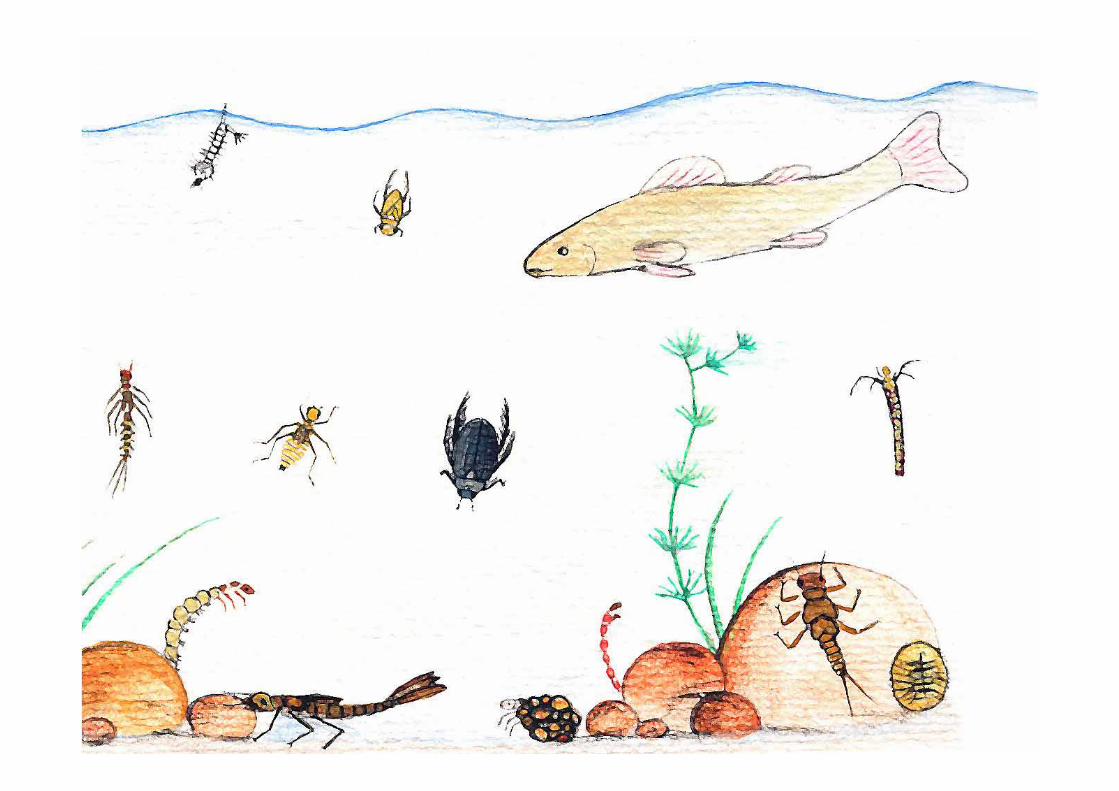
Source: http://www.greenworld.or.th
Modified from Denmark’s Blue RiverSource: Sangpradub et al. (1998)
Very good
Good
Fair
Poor
Very poor
• Rapid Bioassessment Protocol (Barbour et al. 1999)
• Develop Biotic Index for streams, Northeast, Thailand
ObjectivesObjectives
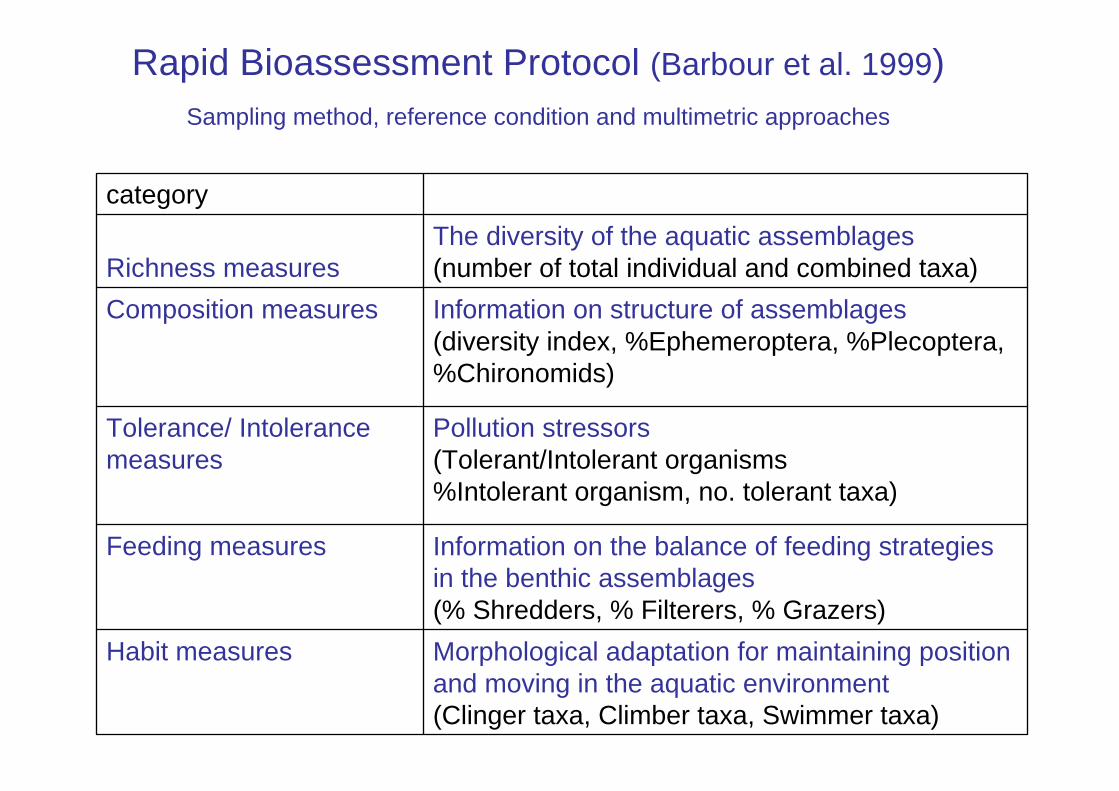
Rapid Bioassessment Protocol (Barbour et al. 1999)Sampling method, reference condition and multimetric approaches
Morphological adaptation for maintaining position and moving in the aquatic environment (Clinger taxa, Climber taxa, Swimmer taxa)
Habit measures
Information on the balance of feeding strategies in the benthic assemblages(% Shredders, % Filterers, % Grazers)
Feeding measures
Pollution stressors(Tolerant/Intolerant organisms%Intolerant organism, no. tolerant taxa)
Tolerance/ Intolerancemeasures
Information on structure of assemblages(diversity index, %Ephemeroptera, %Plecoptera, %Chironomids)
Composition measures
The diversity of the aquatic assemblages(number of total individual and combined taxa)Richness measures
category
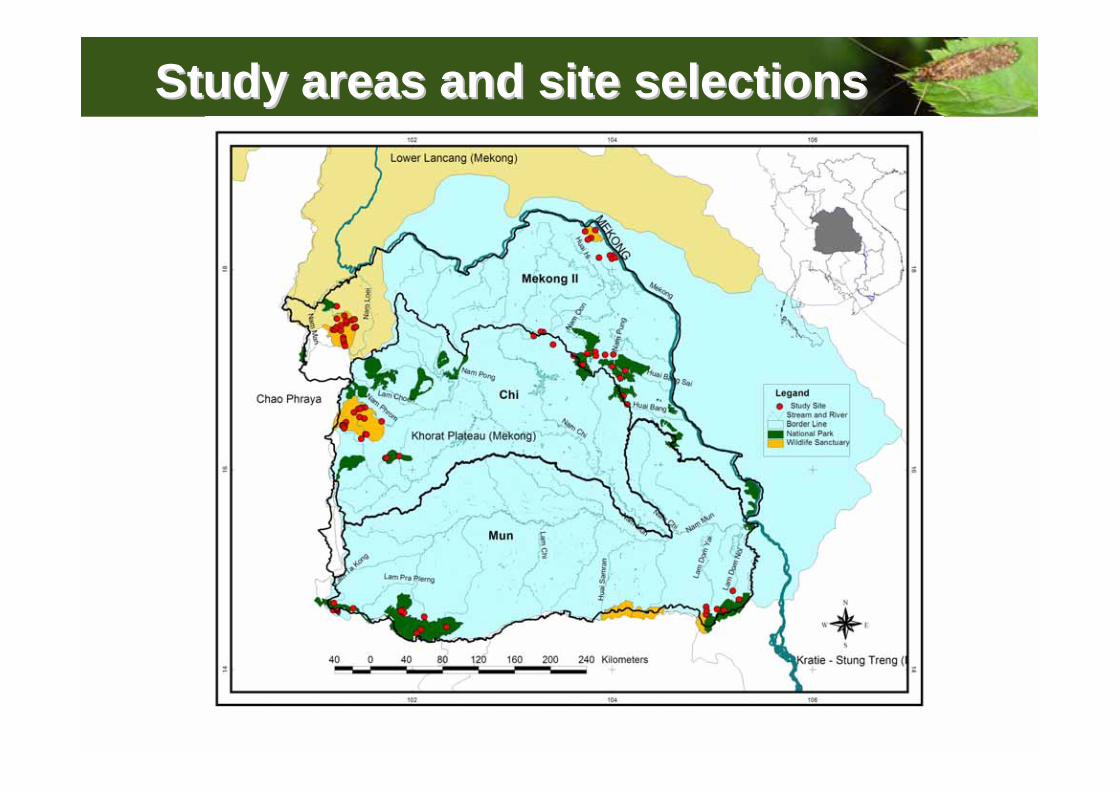
Study areas and site selectionsStudy areas and site selections
• Field Sampling-Physico-chemical sampling-Habitat assessment-Macroinvertebrates sampling
• Data Analysis-Site classification-Reference condition
Research MethodologyResearch Methodology
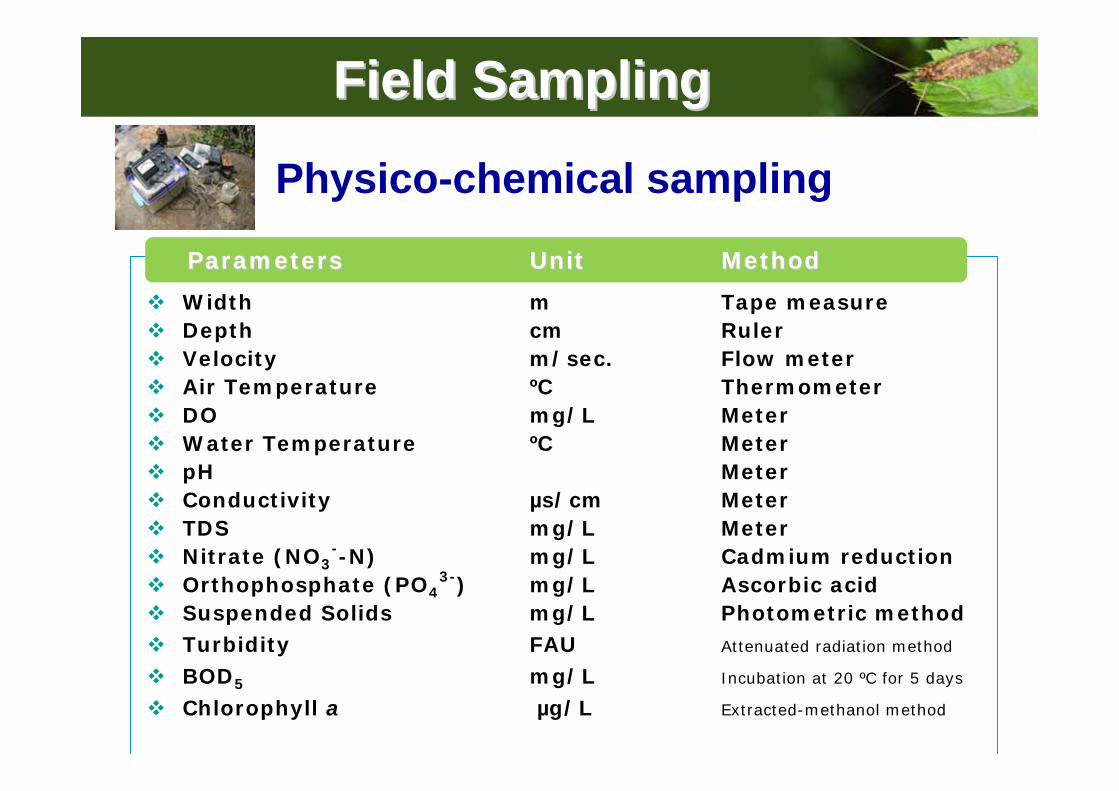
ParametersParameters UnitUnit MethodMethod
Width m Tape measureDepth cm RulerVelocity m/sec. Flow meterAir Temperature ºC ThermometerDO mg/L MeterWater Temperature ºC MeterpH MeterConductivity µs/cm MeterTDS mg/L MeterNitrate (NO3
--N) mg/L Cadmium reductionOrthophosphate (PO4
3-) mg/L Ascorbic acidSuspended Solids mg/L Photometric methodTurbidity FAU Attenuated radiation method
BOD5 mg/L Incubation at 20 ºC for 5 days
Chlorophyll a µg/L Extracted-methanol method
Field SamplingField Sampling
Physico-chemical sampling
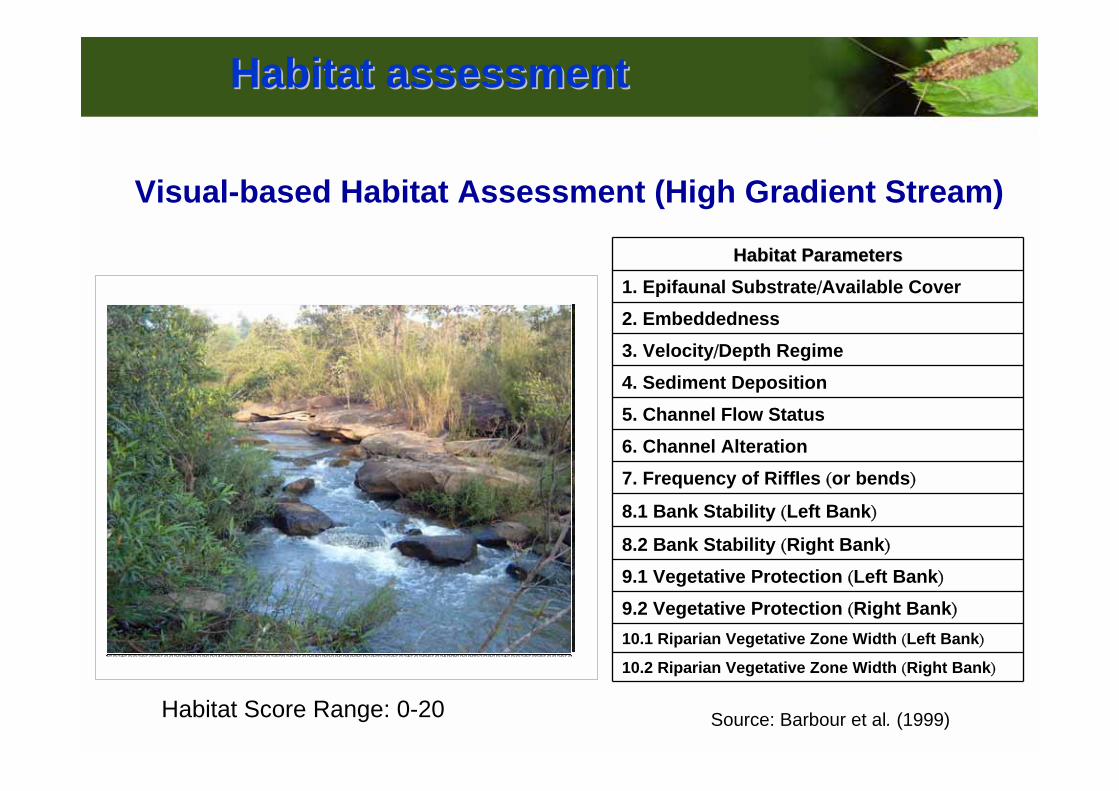
HabitatHabitat ParametersParameters1. Epifaunal Substrate/Available Cover2. Embeddedness3. Velocity/Depth Regime4. Sediment Deposition5. Channel Flow Status6. Channel Alteration7. Frequency of Riffles (or bends)
8.1 Bank Stability (Left Bank)
8.2 Bank Stability (Right Bank)9.1 Vegetative Protection (Left Bank)9.2 Vegetative Protection (Right Bank)10.1 Riparian Vegetative Zone Width (Left Bank)
10.2 Riparian Vegetative Zone Width (Right Bank)
Habitat Score Range: 0-20 Source: Barbour et al. (1999)
Visual-based Habitat Assessment (High Gradient Stream)
Habitat assessmentHabitat assessment
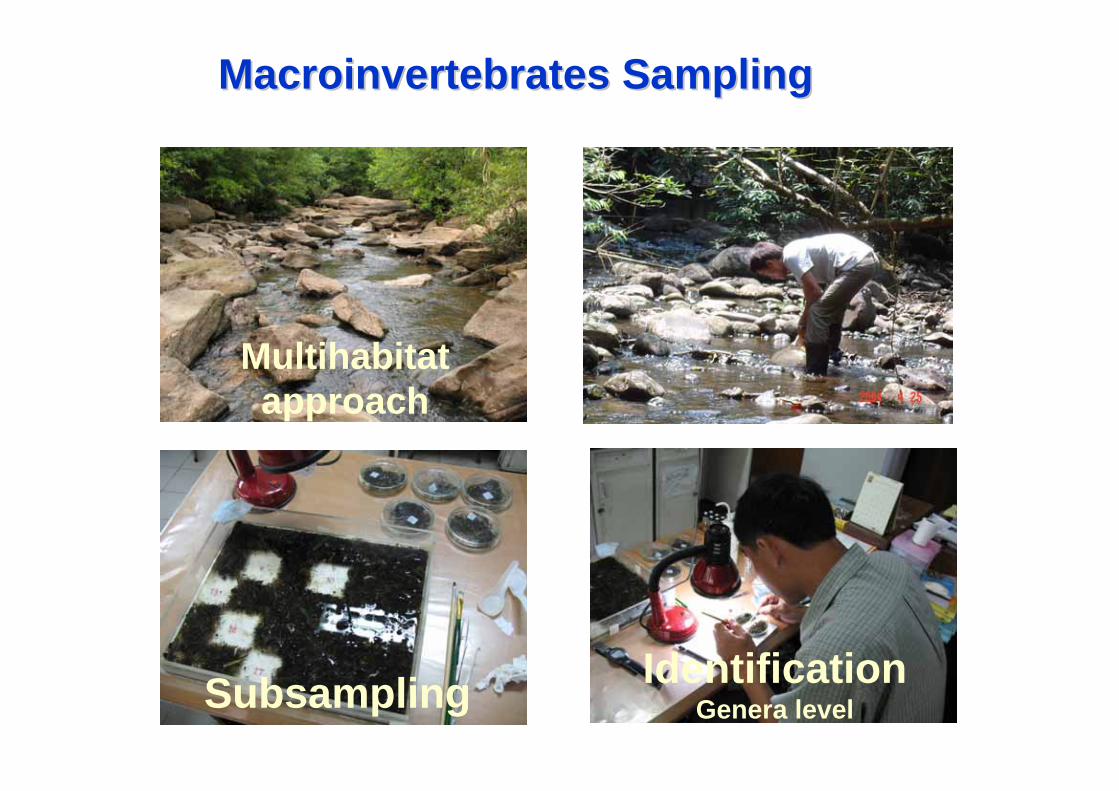
MacroinvertebratesMacroinvertebrates SamplingSampling
Subsampling IdentificationGenera level
Multihabitatapproach
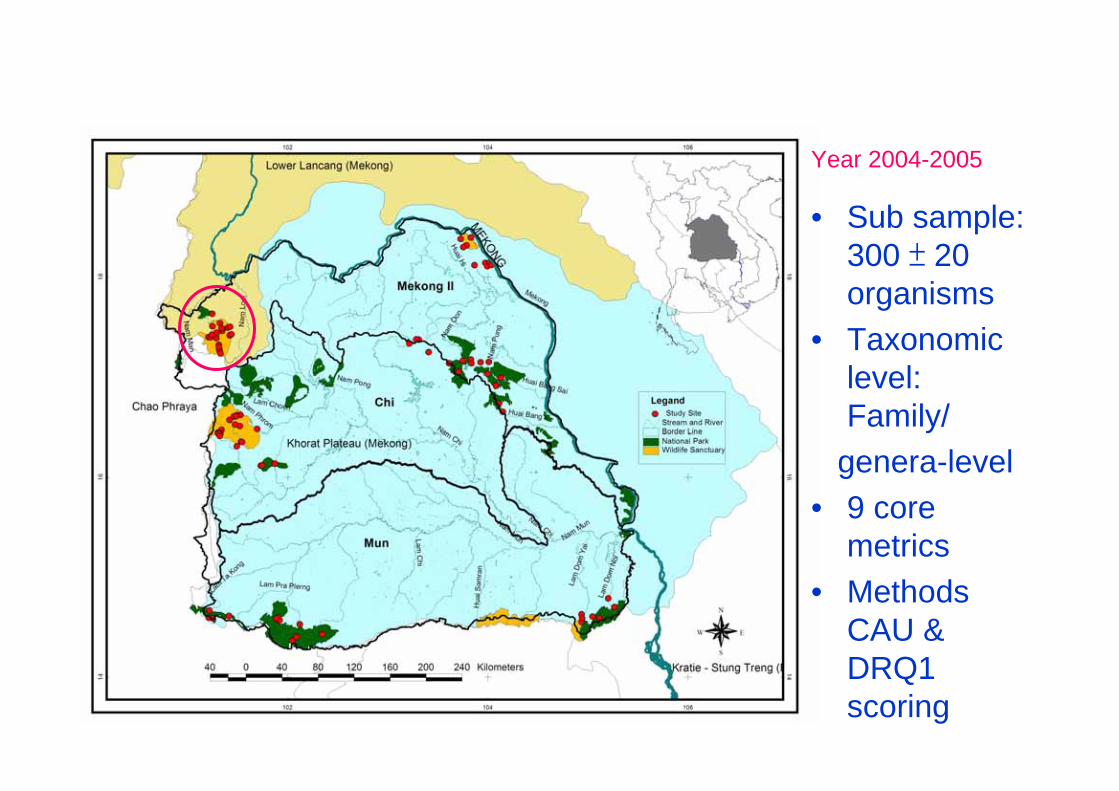
Year 2004-2005
• Sub sample: 300 ± 20 organisms
• Taxonomic level: Family/
genera-level• 9 core
metrics• Methods
CAU & DRQ1 scoring
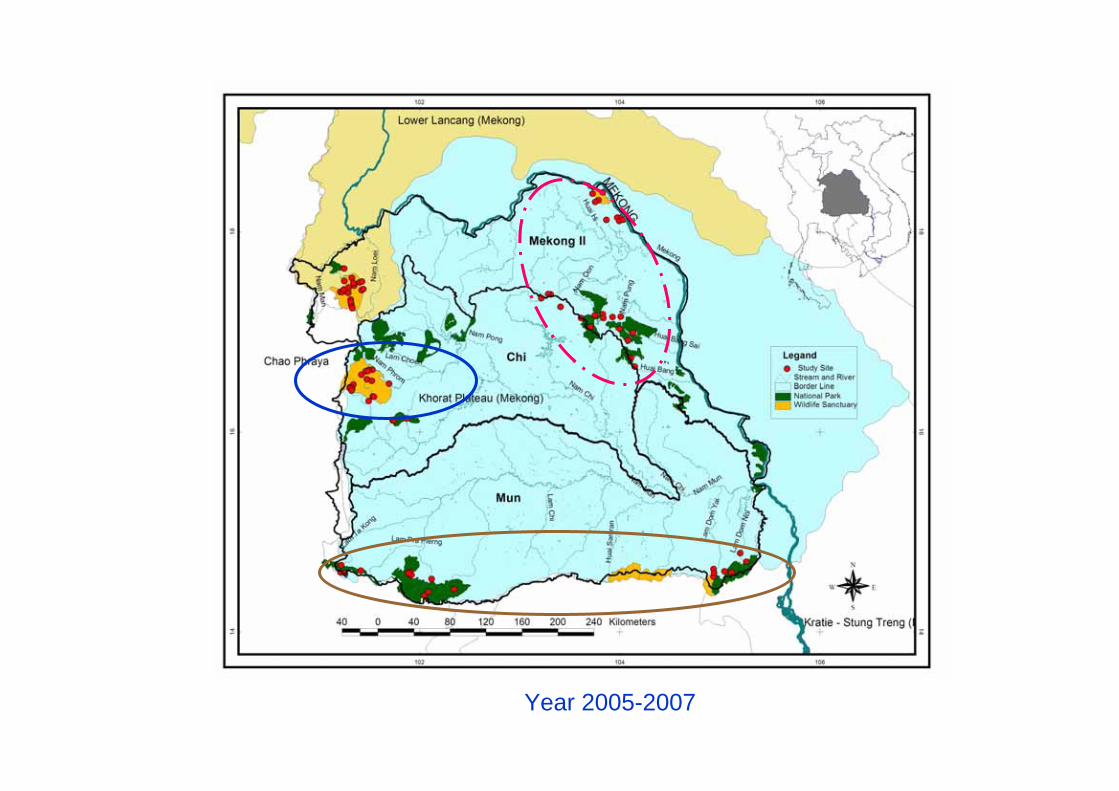
Year 2005-2007
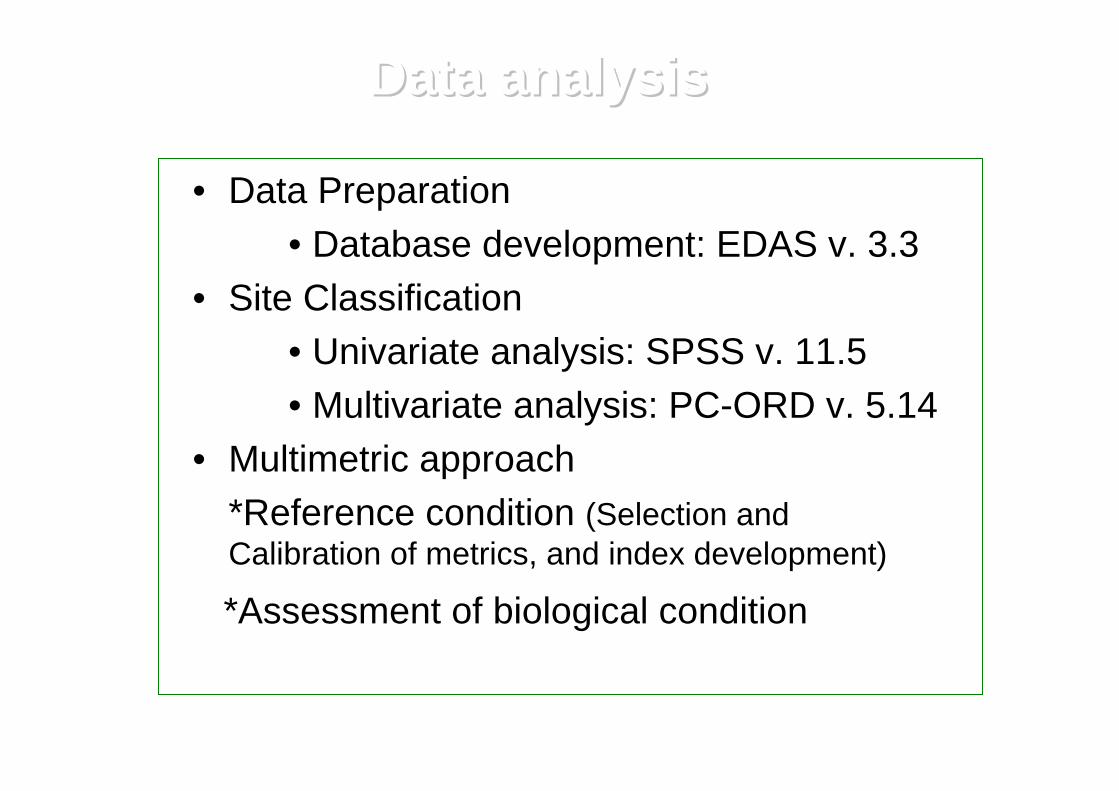
• Data Preparation• Database development: EDAS v. 3.3
• Site Classification• Univariate analysis: SPSS v. 11.5• Multivariate analysis: PC-ORD v. 5.14
• Multimetric approach*Reference condition (Selection and Calibration of metrics, and index development)
*Assessment of biological condition
Data analysisData analysis

Results and DiscussionResults and Discussion
Results andResults and DiscussionDiscussion
• Benthic macroinvertebrate assemblages
• Biotic Index development
*Site Classification and reference condition
• Stream assessment
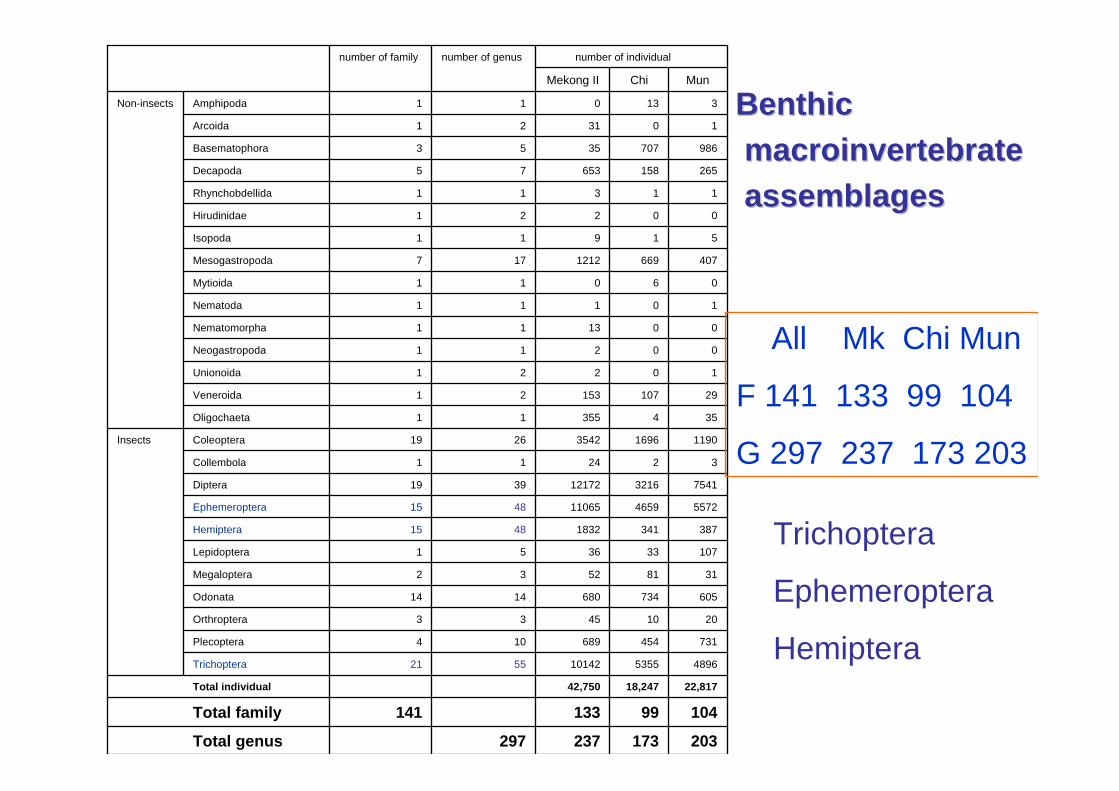
203173237297Total genus
10499133141Total family22,81718,24742,750Total individual
48965355101425521Trichoptera
731454689104Plecoptera
20104533Orthroptera
6057346801414Odonata
31815232Megaloptera
107333651Lepidoptera
38734118324815Hemiptera
55724659110654815Ephemeroptera
75413216121723919Diptera
322411Collembola
1190169635422619ColeopteraInsects
35435511Oligochaeta
2910715321Veneroida
10221Unionoida
00211Neogastropoda
001311Nematomorpha
10111Nematoda
06011Mytioida
4076691212177Mesogastropoda
51911Isopoda
00221Hirudinidae
11311Rhynchobdellida
26515865375Decapoda
9867073553Basematophora
103121Arcoida
313011AmphipodaNon-insects
MunChiMekong II
number of individualnumber of genusnumber of family
BenthicBenthicmacroinvertebratemacroinvertebrateassemblagesassemblages
All Mk Chi Mun
F 141 133 99 104
G 297 237 173 203
Trichoptera
Ephemeroptera
Hemiptera
• Site classification
• Reference condition
Biotic Index developmentBiotic Index development
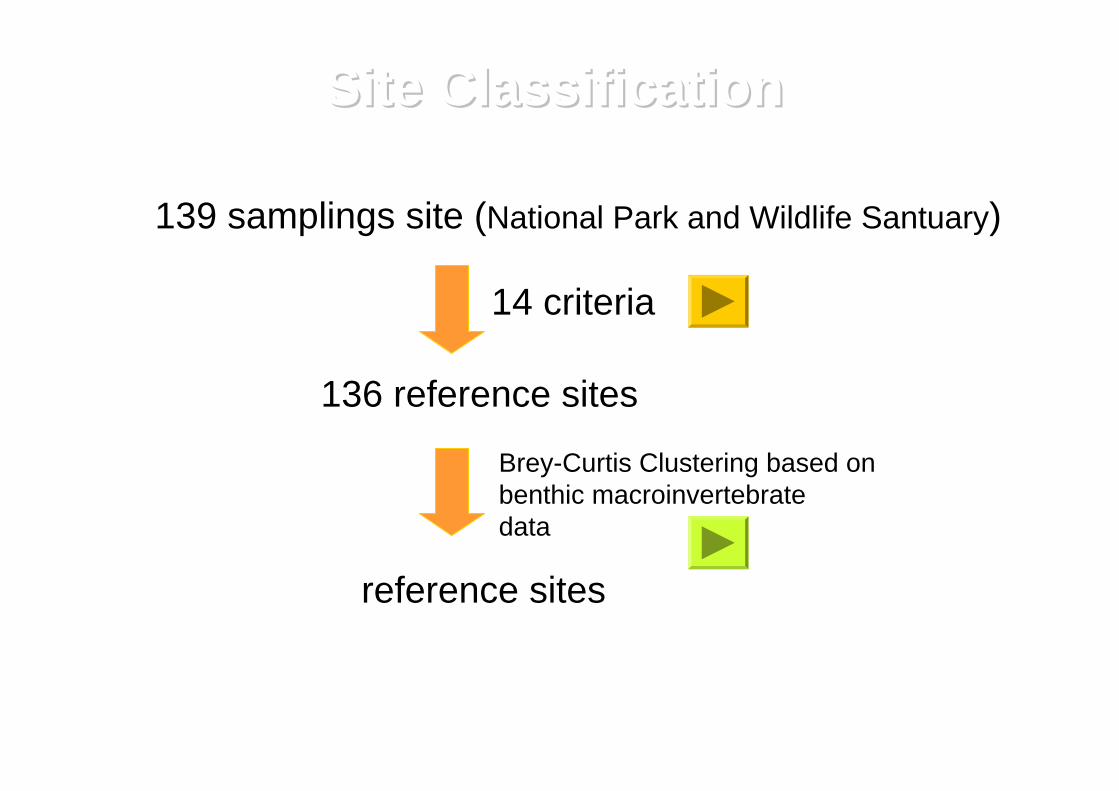
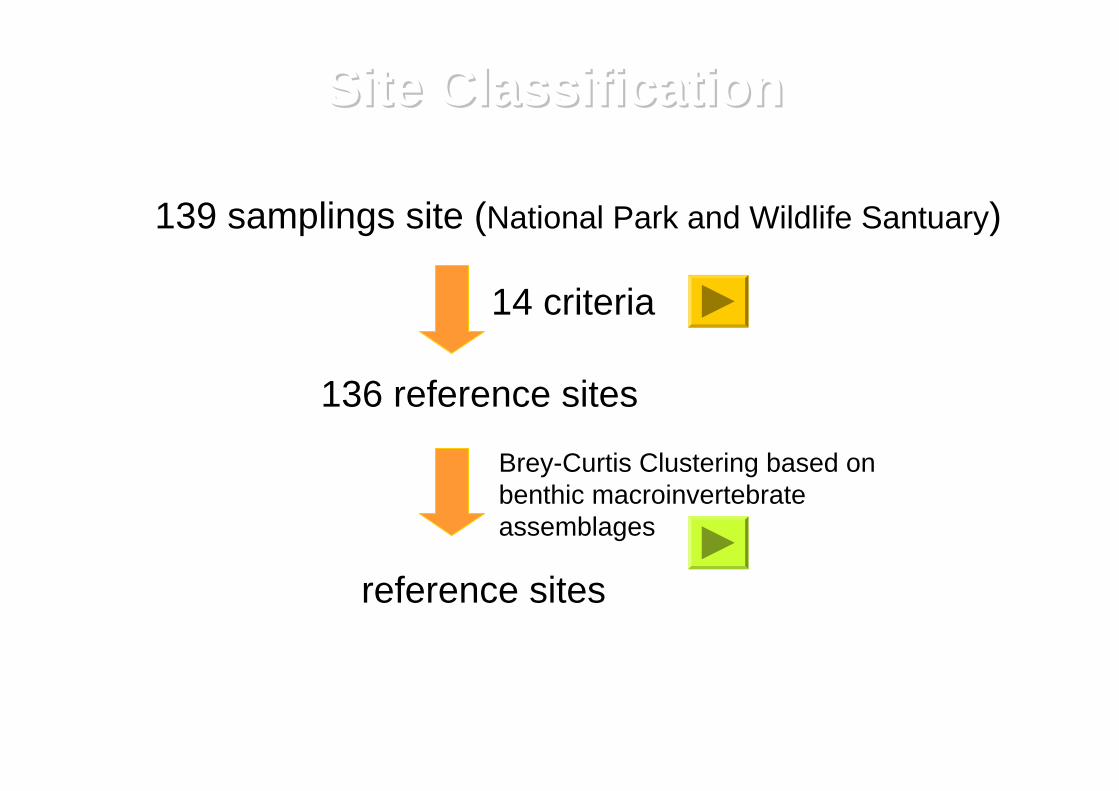
Site ClassificationSite Classification
139 samplings site (National Park and Wildlife Santuary)
136 reference sites
14 criteria
reference sites
Brey-Curtis Clustering based on benthic macroinvertebratedata
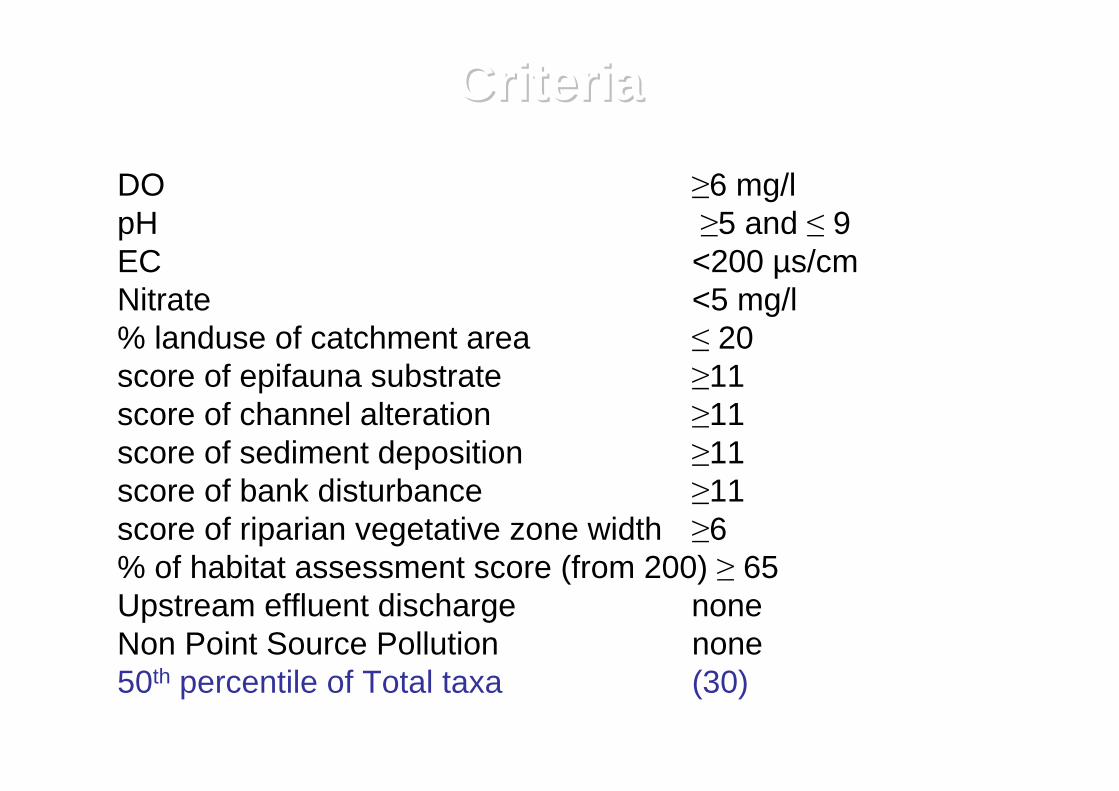
DO ≥6 mg/lpH ≥5 and ≤ 9EC <200 µs/cmNitrate <5 mg/l% landuse of catchment area ≤ 20score of epifauna substrate ≥11score of channel alteration ≥11score of sediment deposition ≥11score of bank disturbance ≥11score of riparian vegetative zone width ≥6% of habitat assessment score (from 200) ≥ 65Upstream effluent discharge noneNon Point Source Pollution none50th percentile of Total taxa (30)
CriteriaCriteria
Site ClassificationSite Classification
139 samplings site (National Park and Wildlife Santuary)
136 reference sites
14 criteria
reference sites
Brey-Curtis Clustering based on benthic macroinvertebrateassemblages
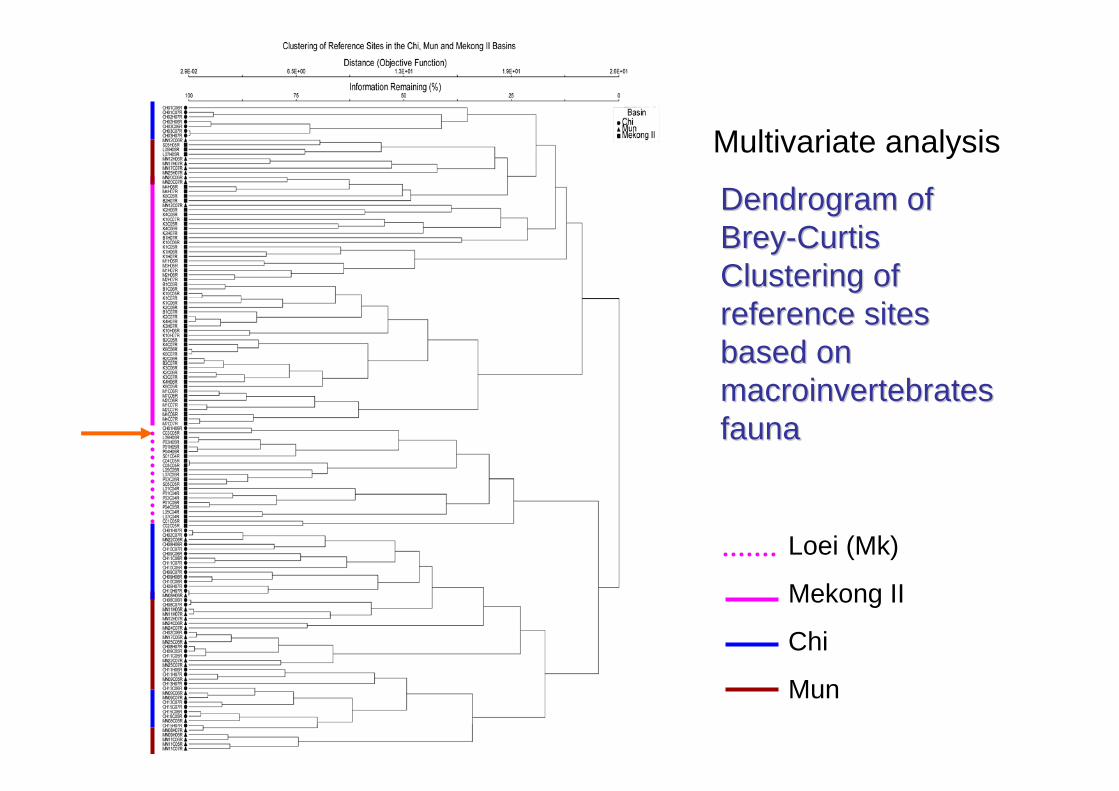
DendrogramDendrogram of of BreyBrey--Curtis Curtis Clustering of Clustering of reference sites reference sites based on based on macroinvertebratesmacroinvertebratesfaunafauna
Loei (Mk)
Mekong II
Chi
Mun
Multivariate analysis
Reference ConditionReference Condition
•Selection of metrics
•Metrics calibration
•Index development
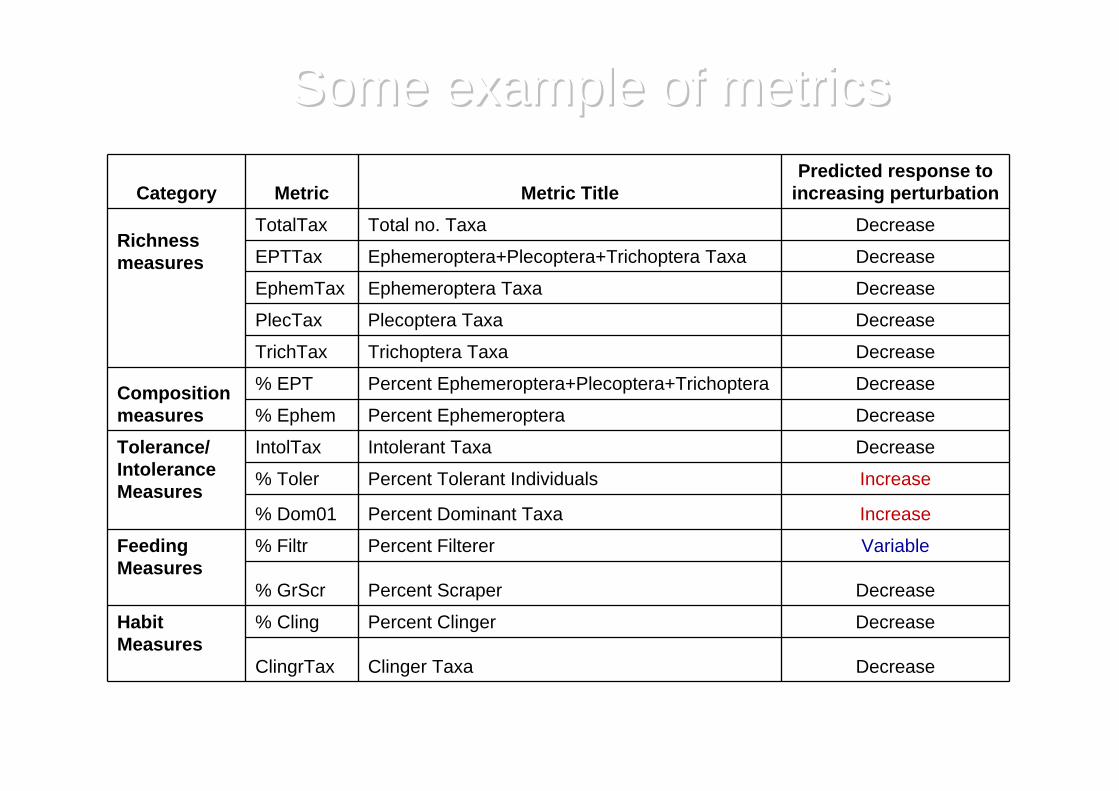
Category Metric Metric TitlePredicted response to
increasing perturbation
Richnessmeasures
TotalTax Total no. Taxa Decrease
EPTTax Ephemeroptera+Plecoptera+Trichoptera Taxa Decrease
EphemTax Ephemeroptera Taxa Decrease
PlecTax Plecoptera Taxa Decrease
TrichTax Trichoptera Taxa Decrease
Compositionmeasures
% EPT Percent Ephemeroptera+Plecoptera+Trichoptera Decrease
% Ephem Percent Ephemeroptera Decrease
Tolerance/IntoleranceMeasures
IntolTax Intolerant Taxa Decrease
% Toler Percent Tolerant Individuals Increase
% Dom01 Percent Dominant Taxa Increase
FeedingMeasures
% Filtr Percent Filterer Variable
% GrScr Percent Scraper Decrease
HabitMeasures
% Cling Percent Clinger Decrease
ClingrTax Clinger Taxa Decrease
Some example of metrics Some example of metrics
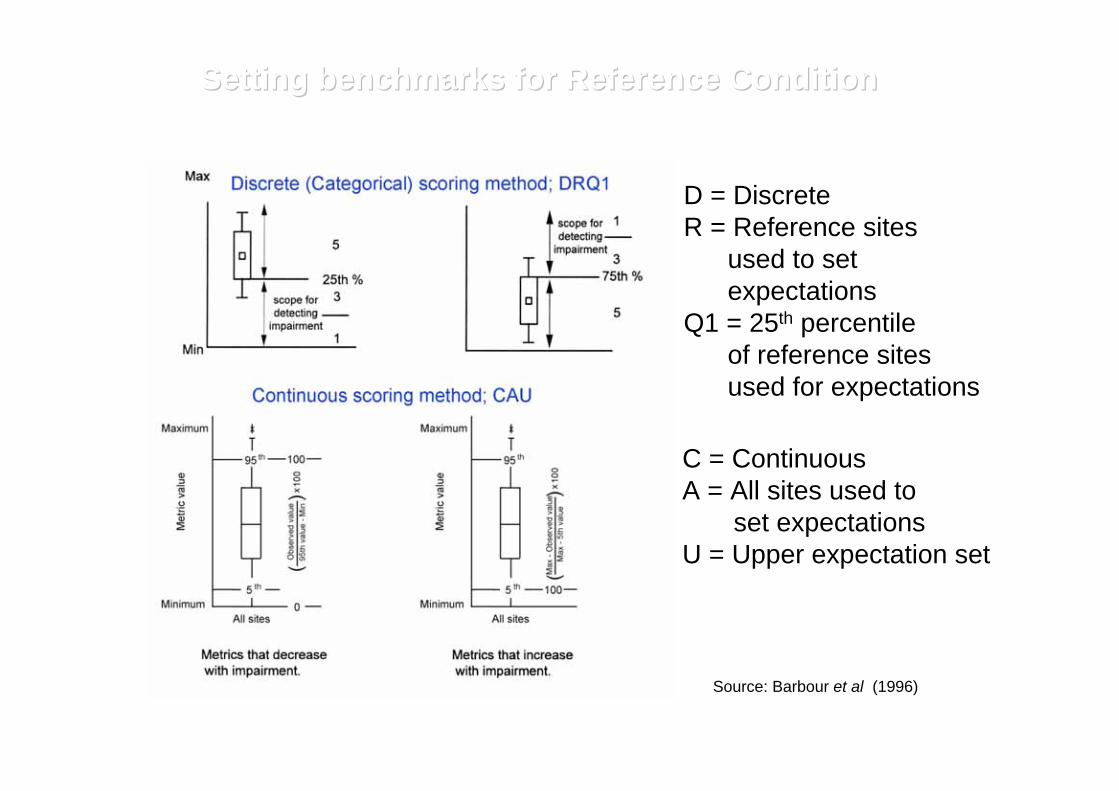
SettingSetting benchmarksbenchmarks forfor ReferenceReference ConditionCondition
D = DiscreteR = Reference sites
used to set expectations
Q1 = 25th percentile of reference sites used for expectations
Source: Barbour et al (1996)
C = ContinuousA = All sites used to
set expectations U = Upper expectation set
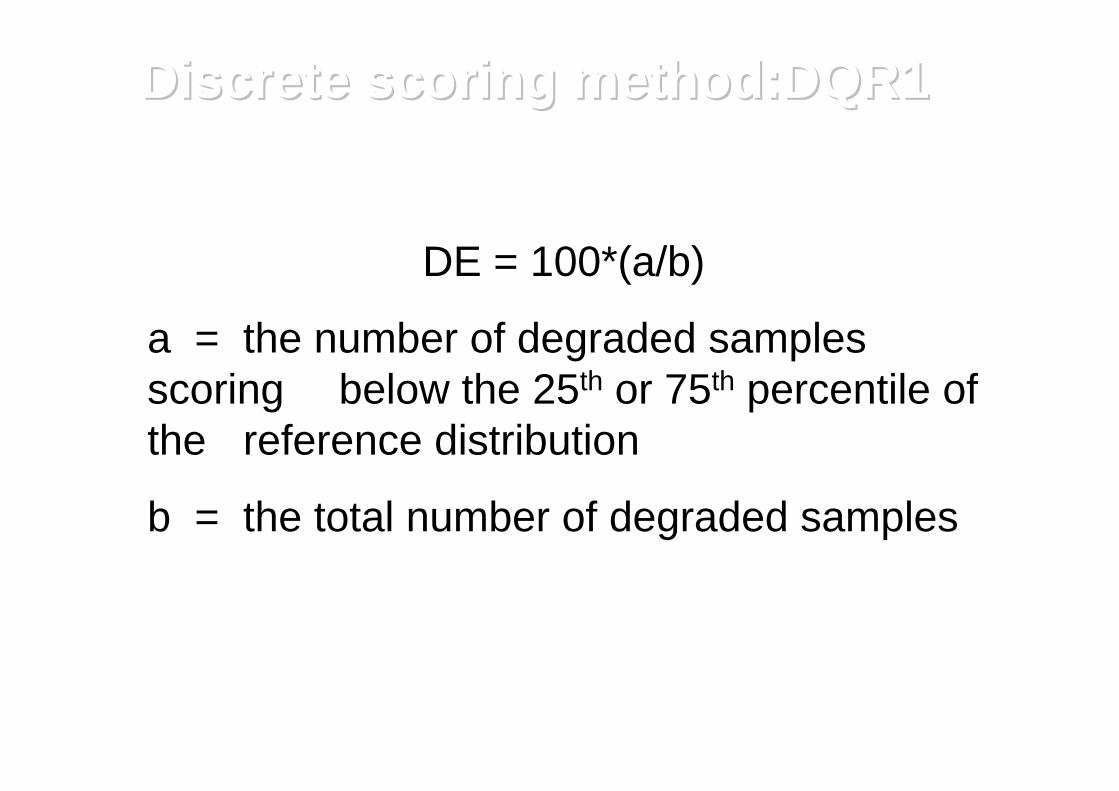
DE = 100*(a/b)
a = the number of degraded samples scoring below the 25th or 75th percentile of the reference distribution
b = the total number of degraded samples
Discrete scoring method:DQR1Discrete scoring method:DQR1
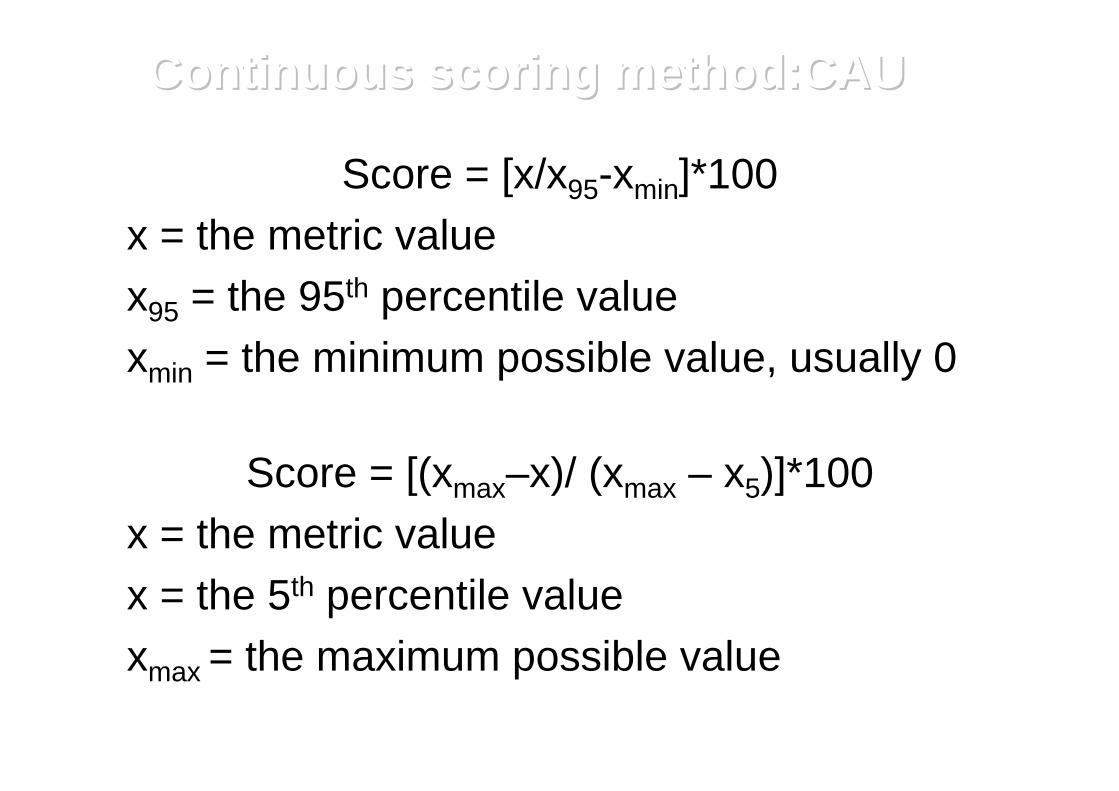
Score = [x/x95-xmin]*100x = the metric valuex95 = the 95th percentile valuexmin = the minimum possible value, usually 0
Score = [(xmax–x)/ (xmax – x5)]*100x = the metric valuex = the 5th percentile valuexmax = the maximum possible value
Continuous scoring Continuous scoring method:CAUmethod:CAU
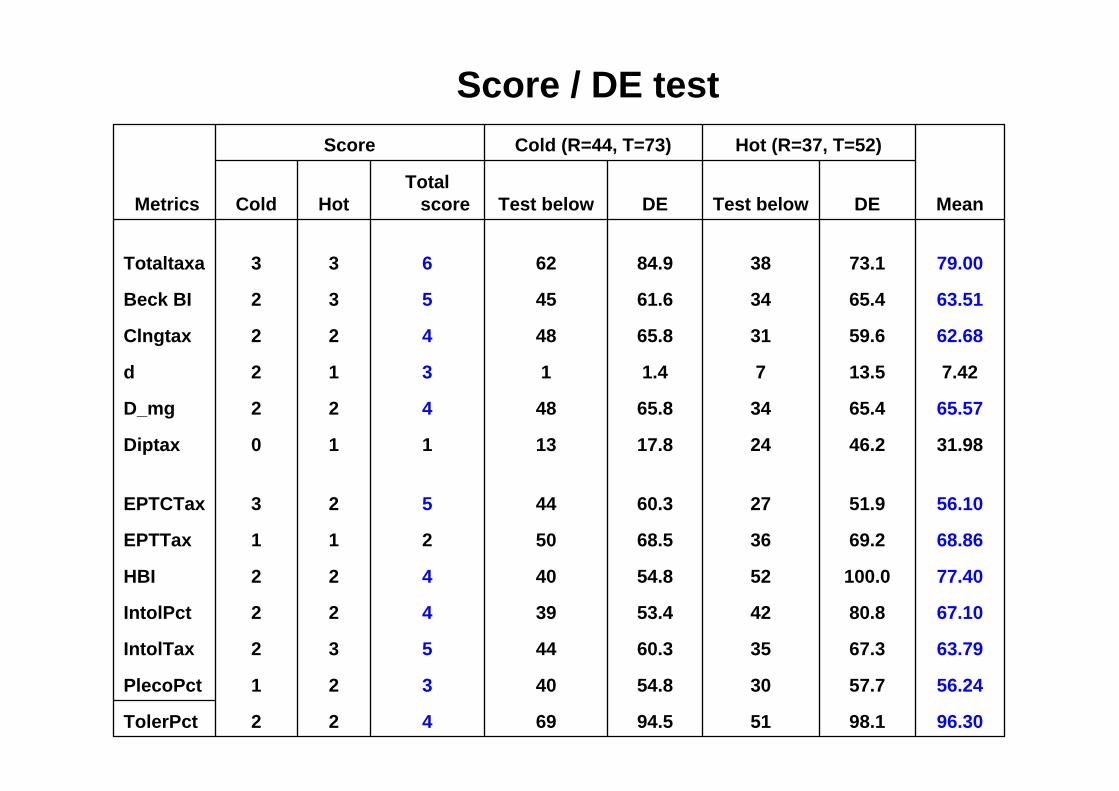
96.3098.15194.569422TolerPct
56.2457.73054.840321PlecoPct
63.7967.33560.344532IntolTax
67.1080.84253.439422IntolPct
77.40100.05254.840422HBI
68.8669.23668.550211EPTTax
56.1051.92760.344523EPTCTax
31.9846.22417.813110Diptax
65.5765.43465.848422D_mg
7.4213.571.41312d
62.6859.63165.848422Clngtax
63.5165.43461.645532Beck BI
79.0073.13884.962633Totaltaxa
DETest belowDETest belowTotal
scoreHotCold Mean
Hot (R=37, T=52)Cold (R=44, T=73)Score
Metrics
Score / DE test
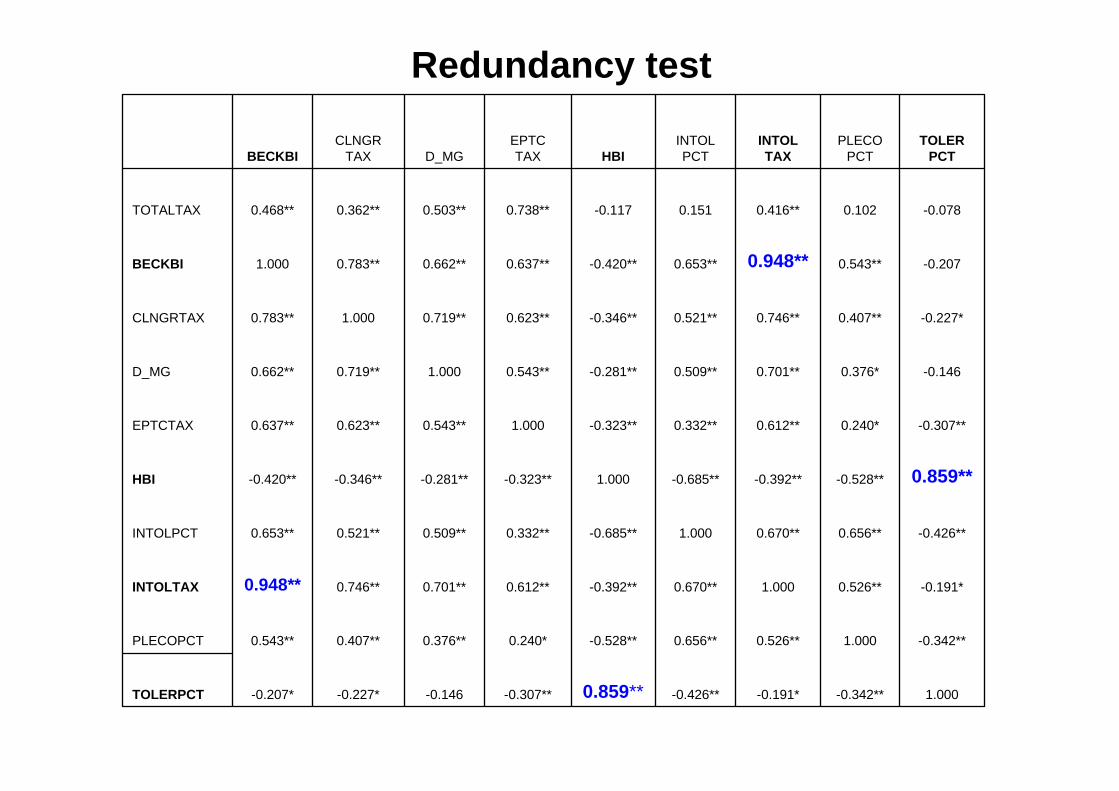
1.000-0.342**-0.191*-0.426**0.859**-0.307**-0.146-0.227*-0.207*TOLERPCT
-0.342**1.0000.526**0.656**-0.528**0.240*0.376**0.407**0.543**PLECOPCT
-0.191*0.526**1.0000.670**-0.392**0.612**0.701**0.746**0.948**INTOLTAX
-0.426**0.656**0.670**1.000-0.685**0.332**0.509**0.521**0.653**INTOLPCT
0.859**-0.528**-0.392**-0.685**1.000-0.323**-0.281**-0.346**-0.420**HBI
-0.307**0.240*0.612**0.332**-0.323**1.0000.543**0.623**0.637**EPTCTAX
-0.1460.376*0.701**0.509**-0.281**0.543**1.0000.719**0.662**D_MG
-0.227*0.407**0.746**0.521**-0.346**0.623**0.719**1.0000.783**CLNGRTAX
-0.2070.543**0.948**0.653**-0.420**0.637**0.662**0.783**1.000BECKBI
-0.0780.1020.416**0.151-0.1170.738**0.503**0.362**0.468**TOTALTAX
TOLERPCT
PLECOPCT
INTOLTAX
INTOLPCTHBI
EPTCTAXD_MG
CLNGRTAXBECKBI
Redundancy test
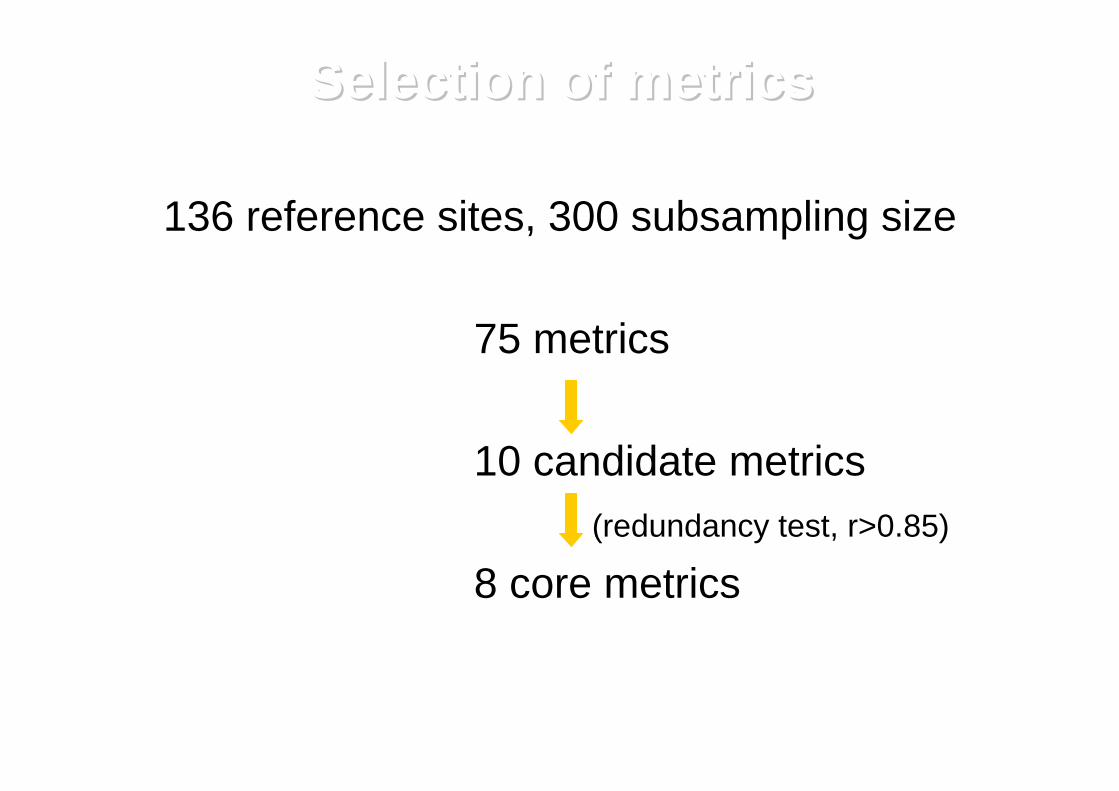
Selection of metricsSelection of metrics
136 reference sites, 300 subsampling size
75 metrics
10 candidate metrics(redundancy test, r>0.85)
8 core metrics
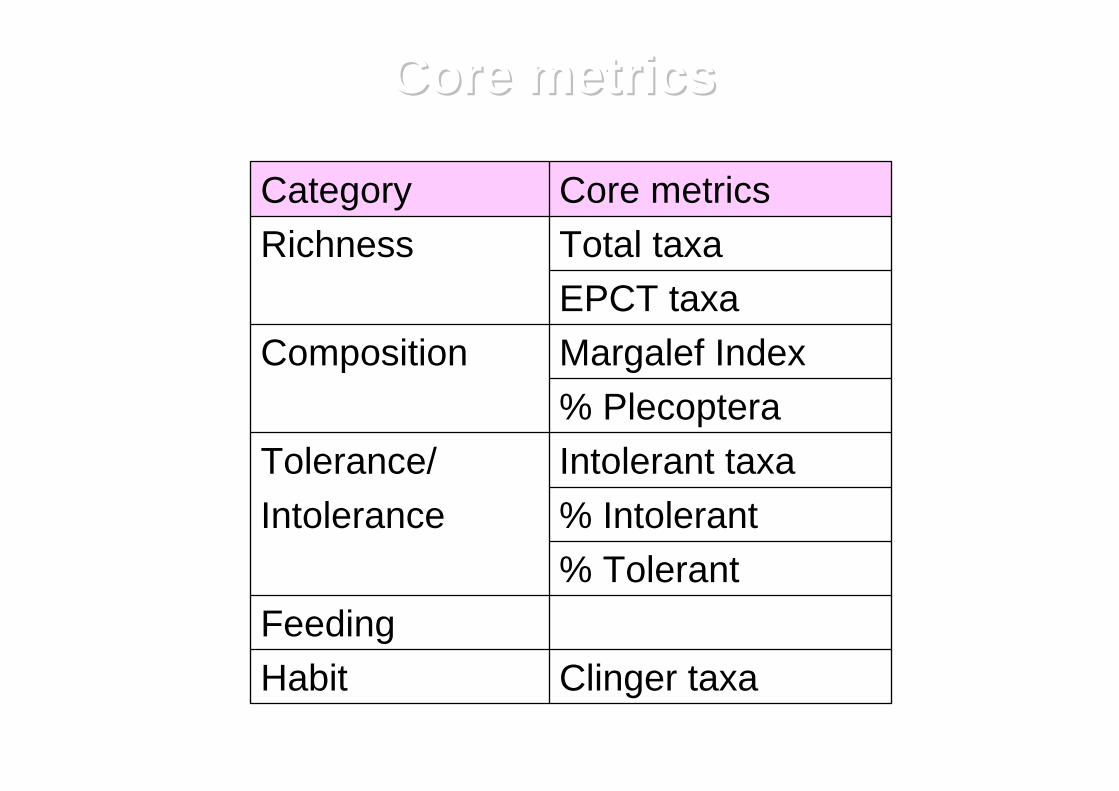
Core metricsCore metrics
Clinger taxaHabitFeeding
% Tolerant% IntolerantIntoleranceIntolerant taxaTolerance/% PlecopteraMargalef IndexCompositionEPCT taxaTotal taxaRichnessCore metricsCategory
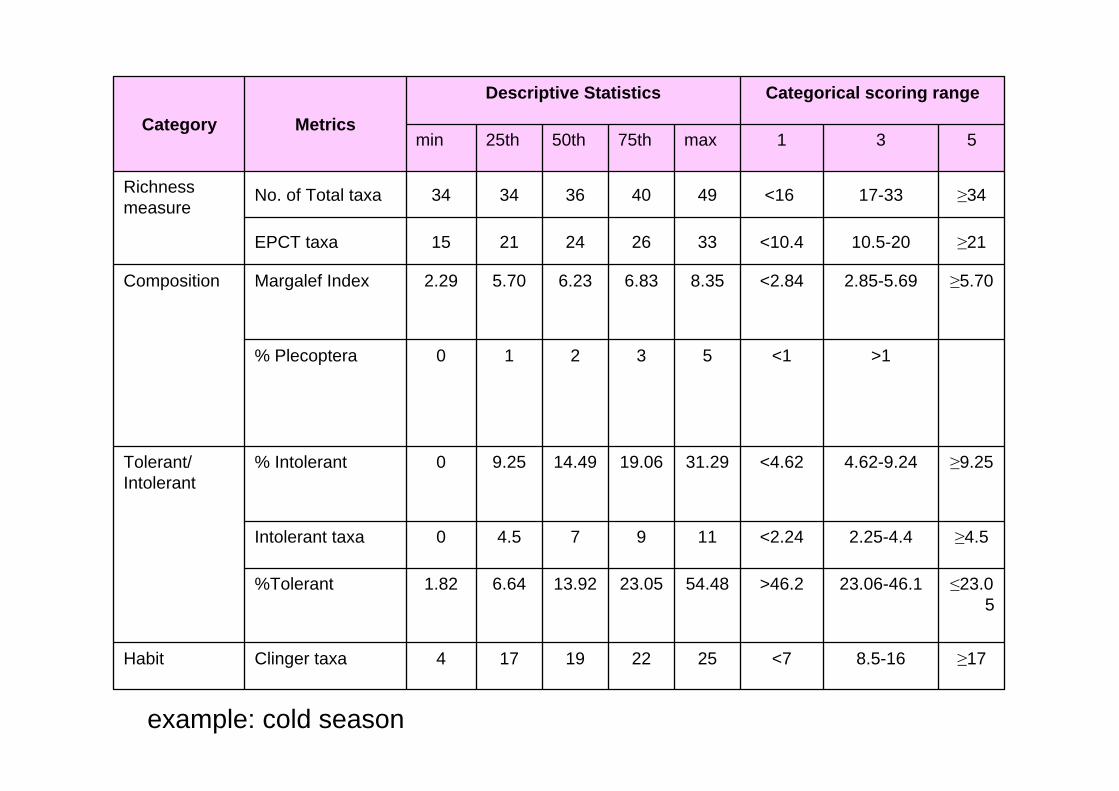
≥178.5-16<7252219174Clinger taxaHabit
≤23.05
23.06-46.1>46.254.4823.0513.926.641.82%Tolerant
≥4.52.25-4.4<2.2411974.50Intolerant taxa
≥9.254.62-9.24<4.6231.2919.0614.499.250% IntolerantTolerant/Intolerant
>1<153210% Plecoptera
≥5.702.85-5.69<2.848.356.836.235.702.29Margalef IndexComposition
≥2110.5-20<10.43326242115EPCT taxa
≥3417-33<164940363434No. of Total taxaRichnessmeasure
531max75th50th25thmin
Categorical scoring rangeDescriptive Statistics
MetricsCategory
example: cold season
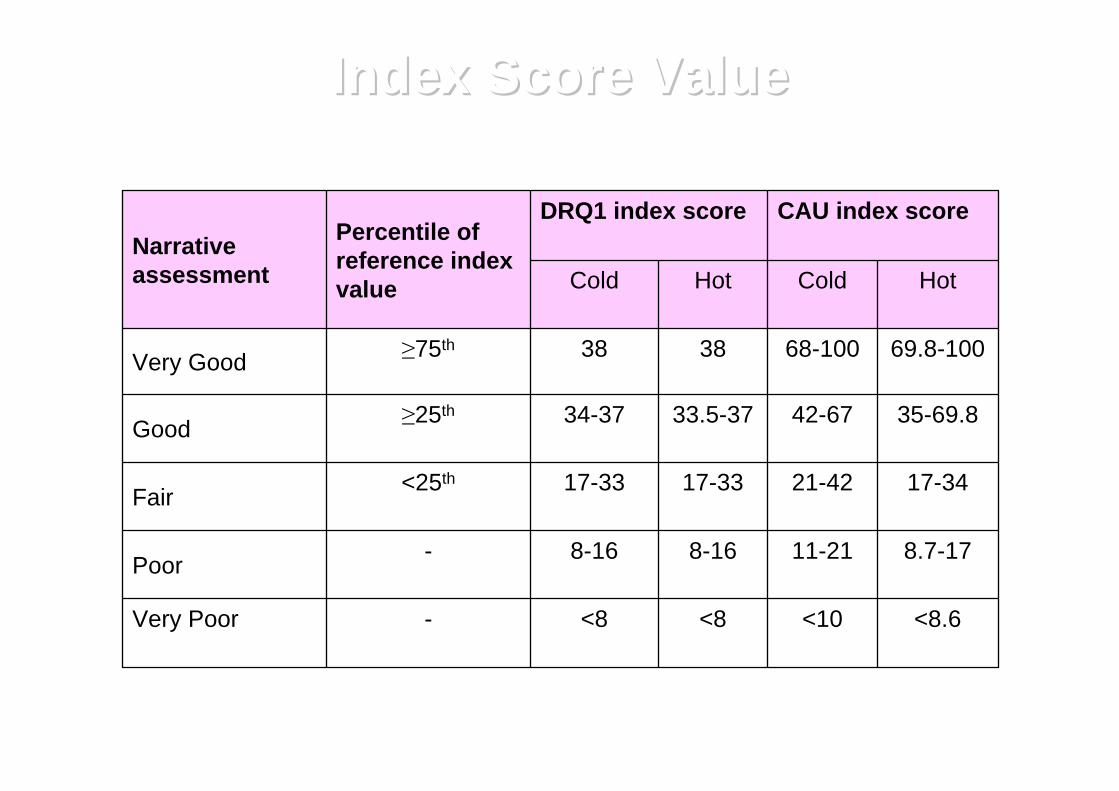
<8.6<10<8<8-Very Poor
8.7-1711-218-168-16-Poor
17-3421-4217-3317-33<25thFair
35-69.842-6733.5-3734-37≥25thGood
69.8-10068-1003838≥75thVery Good
HotColdHotCold
CAU index scoreDRQ1 index scorePercentile ofreference indexvalue
Narrativeassessment
Index Score ValueIndex Score Value
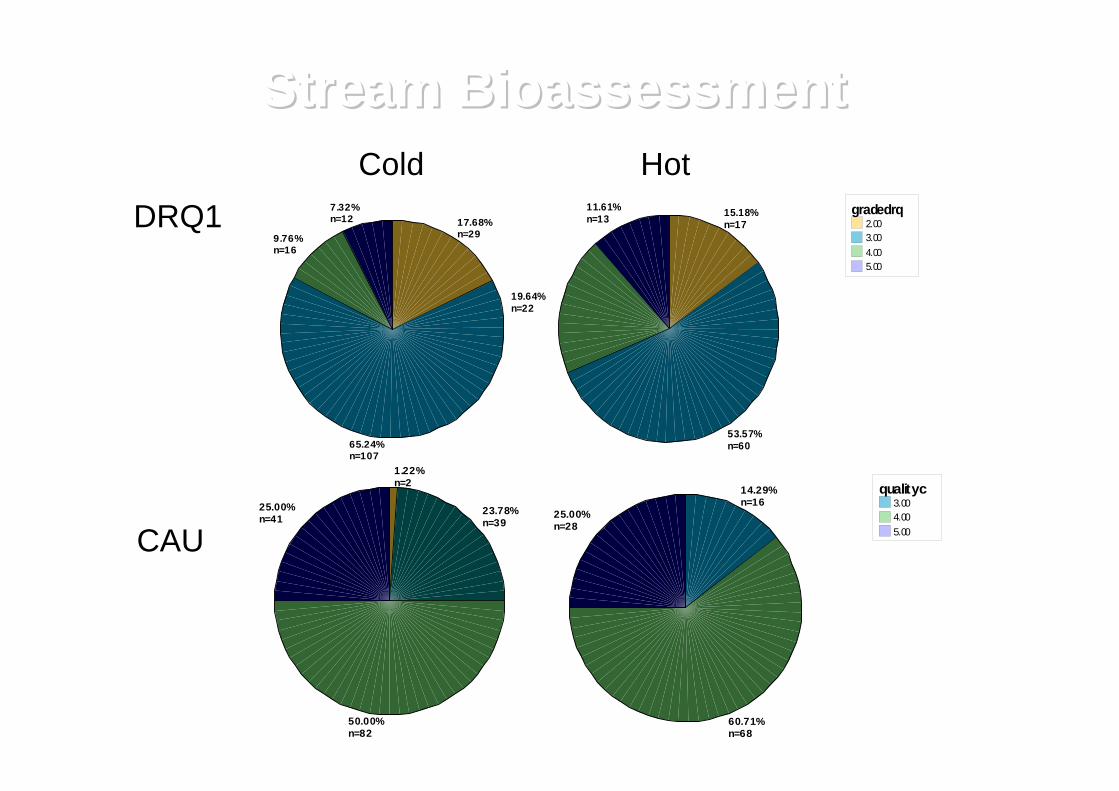
2.003.004.005.00
gradedrq17.68%n=29
65.24%n=107
9.76%n=16
7.32%n=12 2.00
3.004.005.00
gradedrq15.18%n=17
53.57%n=60
19.64%n=22
11.61%n=13
2.003.004.005.00
qualityc1.22%n=2
23.78%n=39
50.00%n=82
25.00%n=41
3.004.005.00
qualityc14.29%n=16
60.71%n=68
25.00%n=28
DRQ1
CAU
Cold Hot
Stream Stream BioassessmentBioassessment
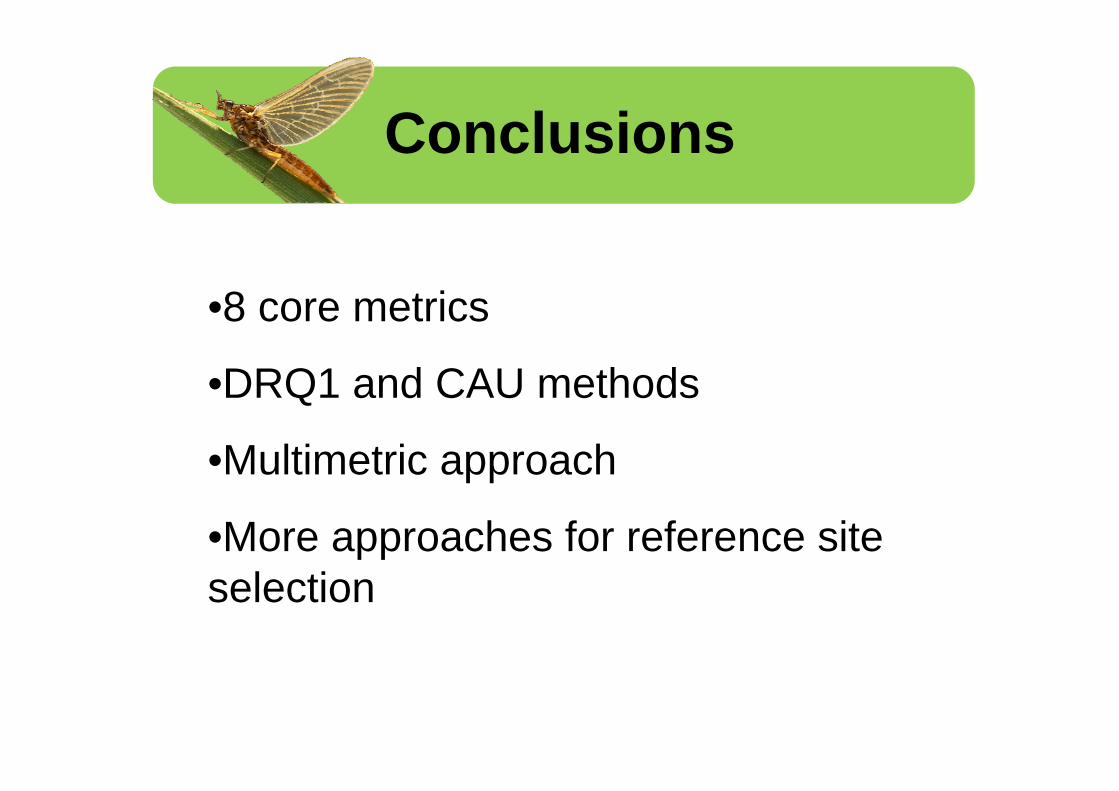
Conclusions
•8 core metrics
•DRQ1 and CAU methods
•Multimetric approach
•More approaches for reference site selection
Thank you very much for your attention