Embed Size (px)
Citation preview
Development of Standardized Efficiency Indicators for Plastic injection Moulds Gil, M.
1/10
Development of Standardized Efficiency Indicators for Plastic injection Moulds
Mariana Joaquina Borralho Gil
Instituto Superior Técnico – Departamento de Engenharia Mecânica
Avenida Rovisco Pais, 1096-001 Lisboa, Portugal
Abstract: Operational Efficiency, a ratio between input and output of a business, was adapted in this study to Injection
Moulding process in order to create the Standardized Efficiency Indicators for Plastics Injection Moulds. The proposed
indicators regards to mass and energy consumption. The input, the minimum amount of resources required, was named
Baseline, and the output, the real amount of resources consumed, was named Actual Value. The values used in the
calculation of the Baseline are based on theoretical and empirical knowledge. The values used in the calculation of Actual
Value are obtained from injection moulding simulation software. To calculate the Baseline’s and Actual Value’s energy
consumption is used an energy consumption model. To use the model is created an injection moulding machine databases in
order to obtain a standard installed power/clamping force equation. The Standardized Efficiency Indicators aim is to compare
moulds with different design alternatives and parts with different sizes. Sensitive analyses were performed to material
variation and number of cavities. With the results obtained were developed and proposed classification labels for moulds.
Keywords: Injection Moulding; Operation Efficiency; Standardized Efficiency Indicators; Design Mould Alternatives; Mould Label;
1. Introduction
Nowadays companies want to stay competitive while
reducing the environmental impact of processes and
products, therefore they are realizing the financial and
environmental benefits of practising sustainable
manufacturing. Coupled with the concept of sustainability,
methodologies like Life Cycle Assessment, Eco-
efficiency, Eco-Design etc. have emerged and become
the main evaluation and decision tools for process and
products development focused on resource efficiency. It
is mandatory that these processes become more and
more resource efficient in order to be sustainable and to
guarantee the desired competitiveness level.
In this thesis the concept of operational efficiency is
applied to formulate the Standardized Efficiency
Indicators for Plastic Injection Moulds. Injection moulding
process is a manufacturing process with great
prominence in the processing of polymers materials. The
mould is the main tool that shapes the part to be
produced. Therefore the design and the quality of the
mould are very important to ensure that the consumed
resources are minimized and a cyclic reproduction of
plastics without defects.
To improve the efficiency of injection moulding
process efforts are made to reduce the cycle time and
improve the cooling, in order to produce products with
quality and increase productivity.
Depending on the part to produce and on the
company production volume required, the design mould
alternatives can be more or less advantageous. With the
several engineering solutions available for mould design,
it is important to know what the best suited choice for a
particular part is. The main issue is how injection
moulding companies can compare moulds and moulds’
efficiency, from different potential suppliers. With the lack
of a decision tool, it is pertinent to develop a metric that
attempt to classify moulds, making their comparison fair,
comprehensive and accurate as possible.
The Standardized Efficiency Indicators methodology
are proposed in order to compare the performance of
different mould designs in the injection moulding process,
regarding three main aspects: mass and energy
consumption, related with resources efficiency; and
execution time, related with productivity. The efficiency is
calculated using simple ratios between the minimum input
required to accomplish the process (Baseline values) and
the real or expected actual time and resources consumed
(Actual value). The minimum process resources
consumptions are estimated by empirical and theoretical
models and the actual values can be estimated by
Development of Standardized Efficiency Indicators for Plastic injection Moulds Gil, M.
2/10
numerical simulation of injection moulding (or real
industrial data if available). The aims of this thesis are to
propose and validate the concept behind these indicators,
to assess if they can be used in the future as a standard
to characterize the performance and efficiency of the
injection moulds.
As an application case for the developed indicators,
three plastics parts were designed with different
dimensions. For each part, four mould design alternatives
were considered to analyse two types of feeding system
and two types of cooling systems. Additionally a
sensitivity analysis to the material and to the number of
cavities variation was performed.
2. Proposed Methodology
In injection moulding one of the main goals is to
reduce the total cycle time, in order to increase
productivity and reduce production costs. Every part
design requires a different mould and even for the same
part the mould can be different in terms of the design of
the feeding and cooling channels, among other design
features. The different possible designs of the channels
across the mould influence the performance of the
process and by consequence the part quality [1].
Aiming to evaluate the efficiency of the process
regarding energy and material consumption in different
mould designs and in different moulds sizes,
Standardized Efficiency Indicators are proposed in this
thesis.
The formulation of Standardized Efficiency Indicators
it is based on the concept of operational efficiency.
Operational efficiency is a ratio between the input and out
of a business [2]. Once the matter of study in this thesis is
a manufacturing process and not a business the inputs
and outputs are defined as follows.
The input is defined as a minimum amount of a
certain variable (resource) required for the injection
moulding of a specific part. The output is defined as the
real amount of that variable that is actually used in the
process. The variables select for analysis are: part
material and the energy consumption of the injection
moulding process, as referred previously. The equation
(1) is the ratio between input and output, i.e., the
Standardized Efficiency Indicator.
Baseline
Standardized Efficiency Indicator % Actual Value
(1)
2.1 Input and Output definitions
The input, as mentioned before, is the minimum
amount of material or energy required for the injection
moulding process that from now on is called Baseline.
The Baseline concept intends to represent the amount of
variables that would be required in an ideal process.
Therefore all values assumed in the calculation of the
Baseline are based on theoretical and empirical
knowledge.
The output is the actual value of material or energy
consumed in the process. This amount can be obtained
directly from the production system (part injection
moulding industrial data) or as done in this thesis, through
injection moulding simulation software. To apply this
concept was defined a Case Study.
To calculate the energy consumed for the Baseline
and for the Actual Value the energy consumption model
proposed by Ribeiro et al.[3] is used. Regarding material
consumption the Mass Baseline is calculated based on
theoretical and empirical knowledge and the actual value
is obtained from Simulation Software.
2.2 Case Study
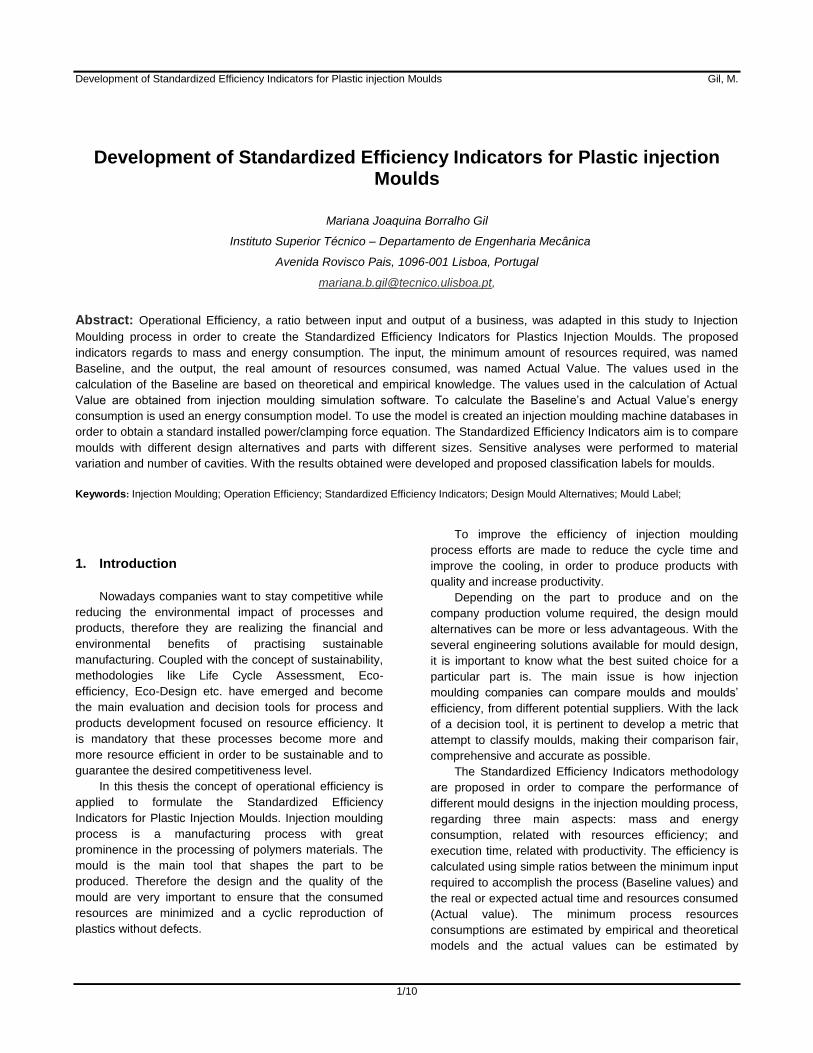
The Case study objective is to assess the influence
of the design characteristics of the mould along with the
variation of the parts size. To analyse the influences of
each type of feeding and cooling system it was defined a
geometry similar to a cup with three dimensions, in
polypropylene PPC 3120 MU5, from TOTAL Refining &
Chemicals, with 2 mm of thickness each. The geometries
are denominated as Part1, Part2 and Part3 (Figure 1).
Their dimensions varies proportionally (Table 1).
Figure 1 Parts
Part 1 Part 2 Part 3
50 50 500
27.44 2.32 274.39
42.68 28.05 426.83
Table 1 Parts Dimensions
To obtain the variables and parameters of the
process for Actual Value, Software Moldflow Insight was
used. For each part four design mould alternatives are
analysed (Table 2). The Engineering Solutions regarding
feeding and cooling system, were matched resulting in
the total in 12 alternatives, so 12 Actual Values. Further
h mm
][ Bd mm
Td mm
Development of Standardized Efficiency Indicators for Plastic injection Moulds Gil, M.
3/10
ahead will be referred using the nomenclature presented
in Table 2.
Cold runners Hot runners
Conventional cooling
1,2,3 (CN)
1,2,3 (HN)
Conformal cooling
1,2,3 (CC)
1,2,3 (HC)
Table 2 Design Mould Alternatives
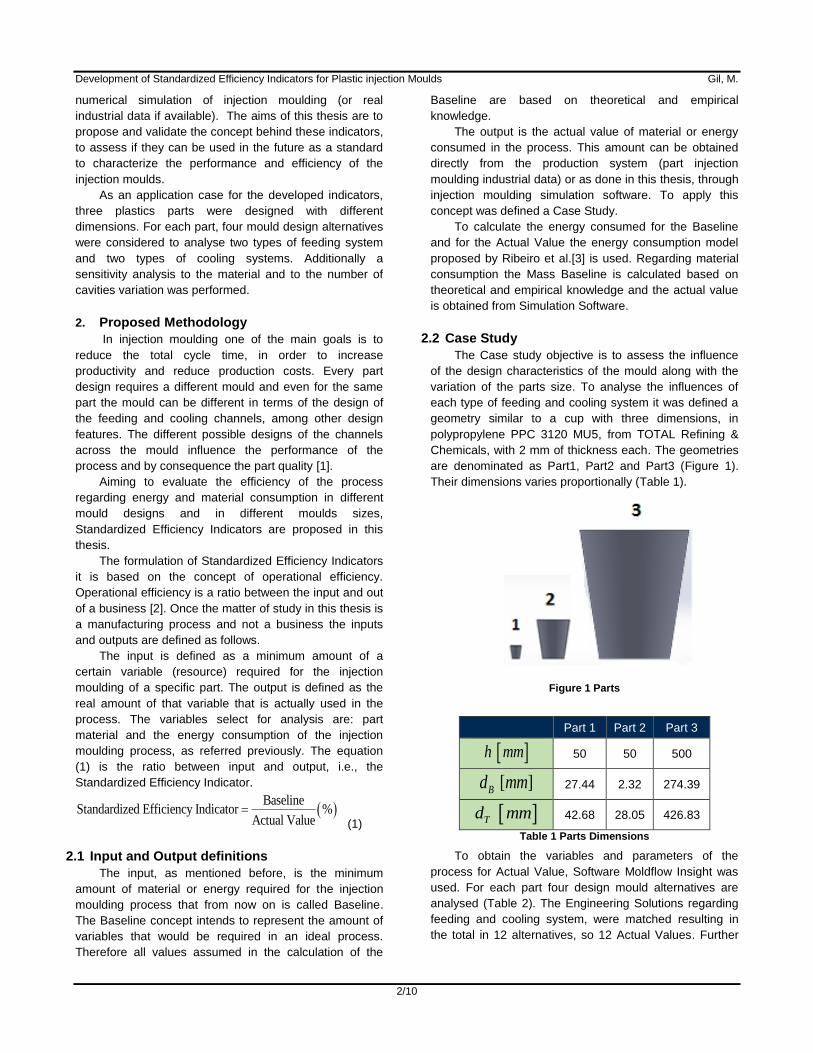
In Figure 2 the approach to the development of
Standardized Efficiency Indicator is summarized.
Figure 2 Study Methodology
3. BASELINE
3.1 Mass Baseline
The mass baseline is calculated through equation
(2), where V is the volume of the part and the ρ material
density.
m V (2)
The mass baseline is the minimum quantity of
material required to produce a part without accounting
with the feeding system.
3.2 Energy Baseline As mentioned before the energy is calculated using
the energy consumption model proposed by Ribeiro et
al.[3]. The Total Energy is the sum of the Thermodynamic
Energy with the Energy Consumption of the injection
machine.
The Thermodynamic Energy is the energy needed to
melt the raw plastic material that is injected. The energy
consumption of the injection moulding machine includes
the machine and part specifications. The Total Energy is
given by equation (3), the Thermodynamic Energy is
given by equation (4) and the Machine Energy is given by
(5).
total thermo machineE E E (3)
,
( )p melt ambient F inj
thermo
melt fill
mc T T mH pVE
(4)
( ) cmachine inst
tE CfM CfP P
CfT
(5)
The values used to calculate the Thermodynamic
Energy derived from the material properties and from the
part characteristics. The Machine Energy, equation (5),
depends on Model Coefficients, on the Installed Power
and on the Cycle Time of the process. In order to
estimate a theoretical cycle time for each part, the cycle
time is defined as the sum of: injection + cooling
+open/close times times.[4][5].
Determination of cycle time
Injection time
The injection time, time in which the material is
injected in the cavity mould, is estimated by equation (6)
as reported by [4] .
max
2 cavity
fill
Vt
Q
(6)
Qmáx is the maximum flow rate of the material from
the nozzle. To find the value of the maximum flow rate,
it’s required the selection of a machine available on the
market with the nearest installed power regarding the
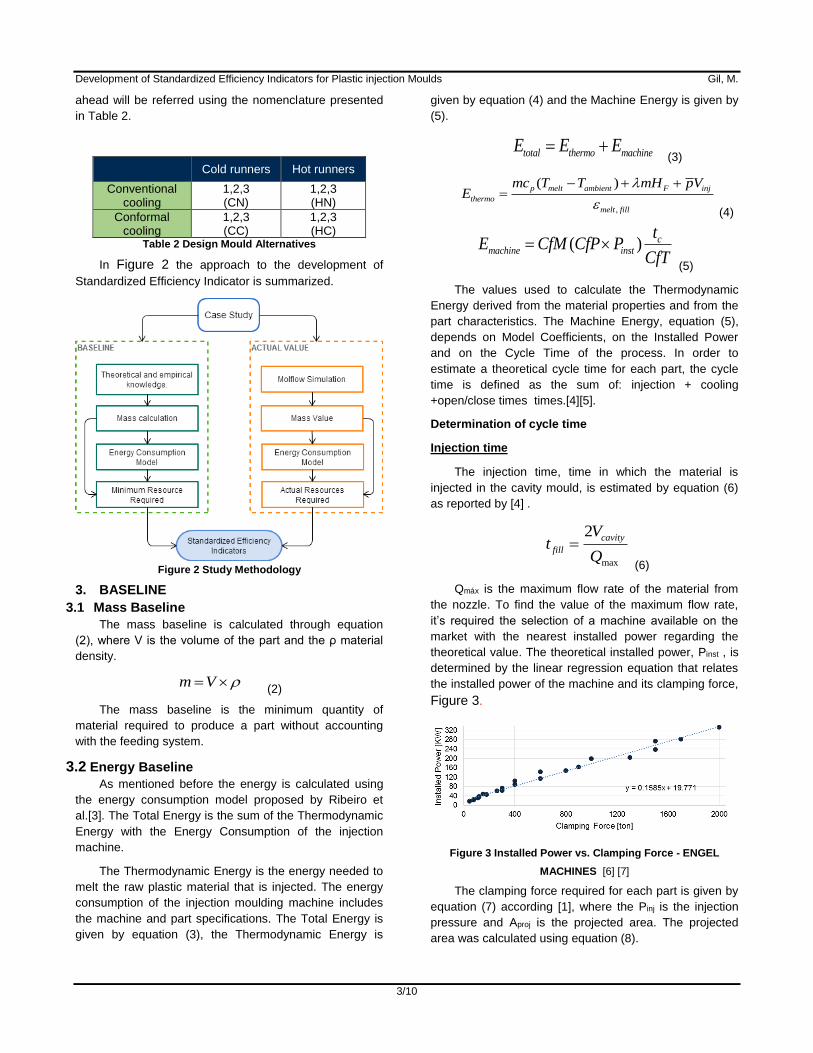
theoretical value. The theoretical installed power, Pinst , is
determined by the linear regression equation that relates
the installed power of the machine and its clamping force,
Figure 3.
Figure 3 Installed Power vs. Clamping Force - ENGEL
MACHINES [6] [7]
The clamping force required for each part is given by
equation (7) according [1], where the Pinj is the injection
pressure and Aproj is the projected area. The projected
area was calculated using equation (8).
Development of Standardized Efficiency Indicators for Plastic injection Moulds Gil, M.
4/10
proj injClamping Force A P
(7)
2
proj tA r (8)
As mentioned by [8] the clamping force required for
PP is 2 to 4 tonnes per square inch of projected area. So
2 tonnes per square inch were assigned to the smallest
part, 3 tonnes per square inch to the medium part and 4
tonnes per square inch for the biggest part.
In equation (9) the x is the Clamping Force and y is
the installed power.
0.1585 19.771xy (9)
Though equation (9), replacing the x with the value of
the Clamping force, the value of the installed power is
determined. With the value of installed power is possible
to select a machine available on market that best suits the
installed power and clamping force calculated. From
catalogues or databases of machines is it possible to find
the maximum flow rate of the material from the nozzle for
the selected machine.
Cooling time
The cooling time, is the most relevant time of the total
cycle time. Since the concept of baseline is the minimum
amount of the variables, the cooling time to take into
account is the cooling time for hot runners that minimizes
the cycle time. The equation (10) allows to calculate the
cooling time for hot runners. The set of temperatures
needed to calculate Y depends on the selected material.
The s is the part thickness,αef is the thermal diffusivity and
k is the thickness coefficient of the part and is given by
equation 11.
2
2
2
ln( . ), hot runners
ln(0.692 ), cold runners23.14
ef
cooling
ef
inj mould
ext mould
sk Y
tD
Y
T TY
T T
(10)
2
4 if 3
8 if 3
k s mm
k s mm
(11)
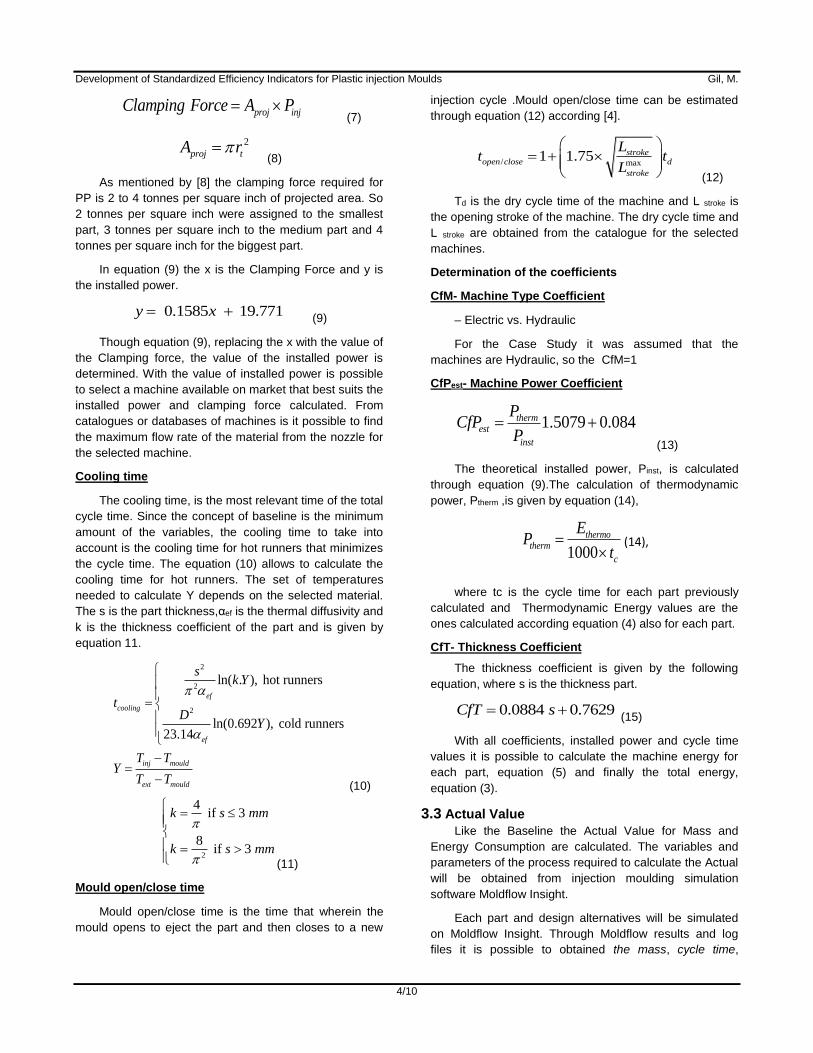
Mould open/close time
Mould open/close time is the time that wherein the
mould opens to eject the part and then closes to a new
injection cycle .Mould open/close time can be estimated
through equation (12) according [4].
/ max1 1.75 stroke
open close d
stroke
Lt t
L
(12)
Td is the dry cycle time of the machine and L stroke is
the opening stroke of the machine. The dry cycle time and
L stroke are obtained from the catalogue for the selected
machines.
Determination of the coefficients
CfM- Machine Type Coefficient
– Electric vs. Hydraulic
For the Case Study it was assumed that the
machines are Hydraulic, so the CfM=1
CfPest- Machine Power Coefficient
1.5079 0.084thermest
inst
PCfP
P
(13)
The theoretical installed power, Pinst, is calculated
through equation (9).The calculation of thermodynamic
power, Ptherm ,is given by equation (14),
1000
thermotherm
c
EP
t
(14),
where tc is the cycle time for each part previously
calculated and Thermodynamic Energy values are the
ones calculated according equation (4) also for each part.
CfT- Thickness Coefficient
The thickness coefficient is given by the following
equation, where s is the thickness part.
0.0884 0.7629CfT s (15)
With all coefficients, installed power and cycle time
values it is possible to calculate the machine energy for
each part, equation (5) and finally the total energy,
equation (3).
3.3 Actual Value Like the Baseline the Actual Value for Mass and
Energy Consumption are calculated. The variables and
parameters of the process required to calculate the Actual
will be obtained from injection moulding simulation
software Moldflow Insight.
Each part and design alternatives will be simulated
on Moldflow Insight. Through Moldflow results and log
files it is possible to obtained the mass, cycle time,
Development of Standardized Efficiency Indicators for Plastic injection Moulds Gil, M.
5/10
clamping force, the injected volume, the injection
pressure etc. These parameters and variables will be
used to calculate the energy consumption, using the
same energy model used in the Baseline (Equation 3).
The material properties required to the energy model are
taken from Moldflow Database’s. Beside the processing
conditions and parameters of the process, the
characteristics of the part are also provided by Moldflow
analysis.
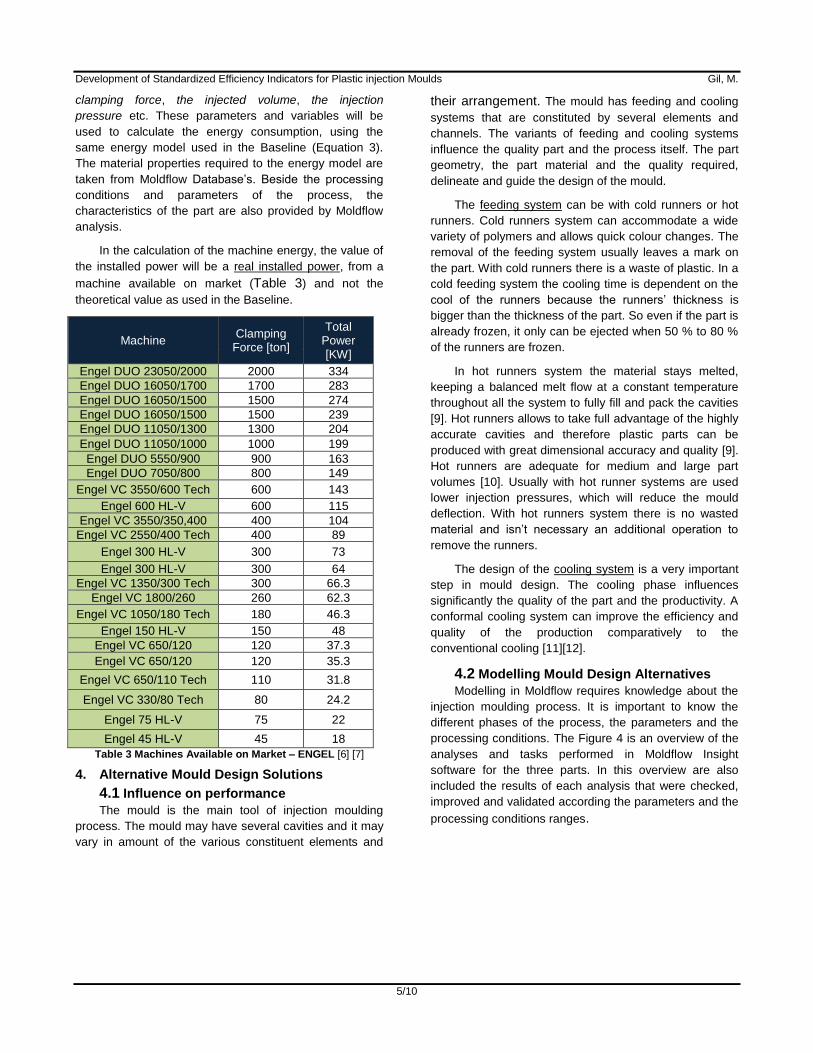
In the calculation of the machine energy, the value of
the installed power will be a real installed power, from a
machine available on market (Table 3) and not the
theoretical value as used in the Baseline.
Machine Clamping
Force [ton]
Total Power [KW]
Engel DUO 23050/2000 2000 334
Engel DUO 16050/1700 1700 283
Engel DUO 16050/1500 1500 274
Engel DUO 16050/1500 1500 239
Engel DUO 11050/1300 1300 204
Engel DUO 11050/1000 1000 199
Engel DUO 5550/900 900 163
Engel DUO 7050/800 800 149
Engel VC 3550/600 Tech 600 143
Engel 600 HL-V 600 115
Engel VC 3550/350,400 400 104
Engel VC 2550/400 Tech 400 89
Engel 300 HL-V 300 73
Engel 300 HL-V 300 64
Engel VC 1350/300 Tech 300 66.3
Engel VC 1800/260 260 62.3
Engel VC 1050/180 Tech 180 46.3
Engel 150 HL-V 150 48
Engel VC 650/120 120 37.3
Engel VC 650/120 120 35.3
Engel VC 650/110 Tech 110 31.8
Engel VC 330/80 Tech 80 24.2
Engel 75 HL-V 75 22
Engel 45 HL-V 45 18
Table 3 Machines Available on Market – ENGEL [6] [7]
4. Alternative Mould Design Solutions
4.1 Influence on performance The mould is the main tool of injection moulding
process. The mould may have several cavities and it may
vary in amount of the various constituent elements and
their arrangement. The mould has feeding and cooling
systems that are constituted by several elements and
channels. The variants of feeding and cooling systems
influence the quality part and the process itself. The part
geometry, the part material and the quality required,
delineate and guide the design of the mould.
The feeding system can be with cold runners or hot
runners. Cold runners system can accommodate a wide
variety of polymers and allows quick colour changes. The
removal of the feeding system usually leaves a mark on
the part. With cold runners there is a waste of plastic. In a
cold feeding system the cooling time is dependent on the
cool of the runners because the runners’ thickness is
bigger than the thickness of the part. So even if the part is
already frozen, it only can be ejected when 50 % to 80 %
of the runners are frozen.
In hot runners system the material stays melted,
keeping a balanced melt flow at a constant temperature
throughout all the system to fully fill and pack the cavities
[9]. Hot runners allows to take full advantage of the highly
accurate cavities and therefore plastic parts can be
produced with great dimensional accuracy and quality [9].
Hot runners are adequate for medium and large part
volumes [10]. Usually with hot runner systems are used
lower injection pressures, which will reduce the mould
deflection. With hot runners system there is no wasted
material and isn’t necessary an additional operation to
remove the runners.
The design of the cooling system is a very important
step in mould design. The cooling phase influences
significantly the quality of the part and the productivity. A
conformal cooling system can improve the efficiency and
quality of the production comparatively to the
conventional cooling [11][12].
4.2 Modelling Mould Design Alternatives Modelling in Moldflow requires knowledge about the
injection moulding process. It is important to know the
different phases of the process, the parameters and the
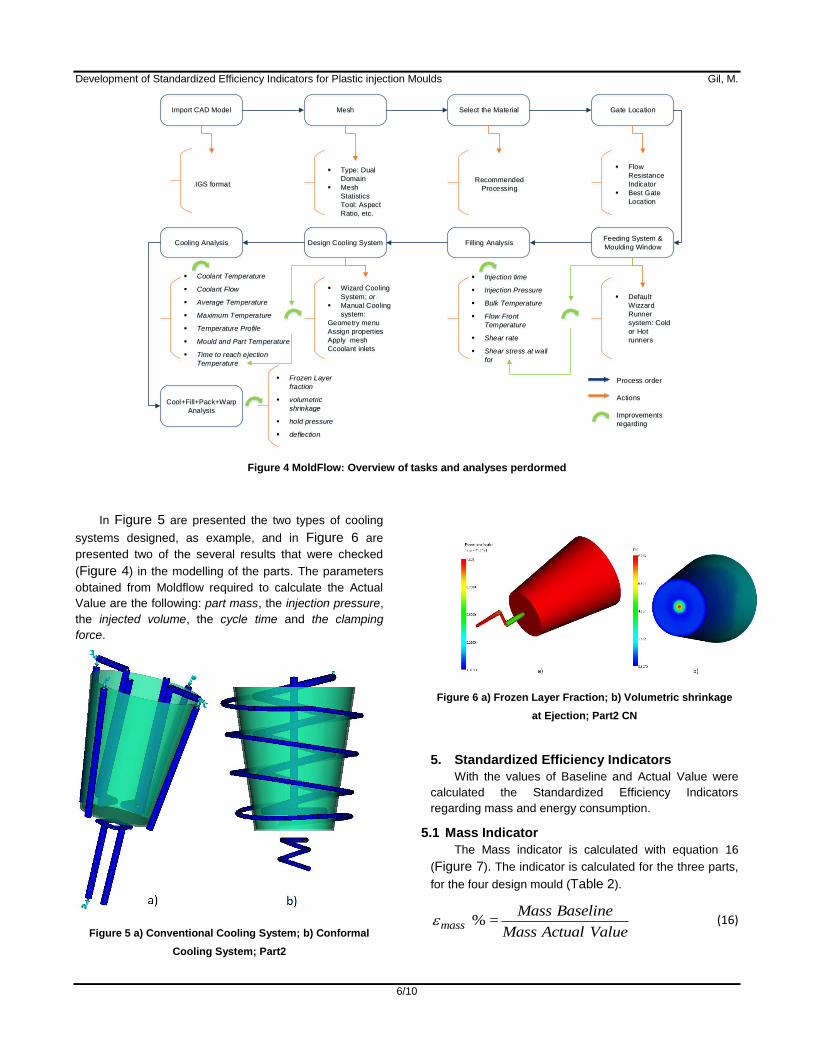
processing conditions. The Figure 4 is an overview of the
analyses and tasks performed in Moldflow Insight
software for the three parts. In this overview are also
included the results of each analysis that were checked,
improved and validated according the parameters and the
processing conditions ranges.
Development of Standardized Efficiency Indicators for Plastic injection Moulds Gil, M.
6/10
Import CAD Model Mesh Select the Material Gate Location
Feeding System &
Moulding WindowFilling AnalysisDesign Cooling SystemCooling Analysis
Cool+Fill+Pack+Warp
Analysis
.IGS format
Type: Dual
Domain
Mesh
Statistics
Tool: Aspect
Ratio, etc.
Wizard Cooling
System; or
Manual Cooling
system:
Geometry menu
Assign properties
Apply mesh
Ccoolant inlets
Injection time
Injection Pressure
Bulk Temperature
Flow Front
Temperature
Shear rate
Shear stress at wall
for
Flow
Resistance
Indicator
Best Gate
Location
Default
Wizzard
Runner
system: Cold
or Hot
runners
Recommended
Processing
Coolant Temperature
Coolant Flow
Average Temperature
Maximum Temperature
Temperature Profile
Mould and Part Temperature
Time to reach ejection
Temperature
Process order
Actions
Improvements
regarding
Frozen Layer
fraction
volumetric
shrinkage
hold pressure
deflection
Figure 4 MoldFlow: Overview of tasks and analyses perdormed
In Figure 5 are presented the two types of cooling
systems designed, as example, and in Figure 6 are
presented two of the several results that were checked
(Figure 4) in the modelling of the parts. The parameters
obtained from Moldflow required to calculate the Actual
Value are the following: part mass, the injection pressure,
the injected volume, the cycle time and the clamping
force.
Figure 5 a) Conventional Cooling System; b) Conformal
Cooling System; Part2
Figure 6 a) Frozen Layer Fraction; b) Volumetric shrinkage
at Ejection; Part2 CN
5. Standardized Efficiency Indicators
With the values of Baseline and Actual Value were
calculated the Standardized Efficiency Indicators
regarding mass and energy consumption.
5.1 Mass Indicator
The Mass indicator is calculated with equation 16
(Figure 7). The indicator is calculated for the three parts,
for the four design mould (Table 2).
% =
mass
Mass Baseline
Mass Actual Value (16)
Development of Standardized Efficiency Indicators for Plastic injection Moulds Gil, M.
7/10
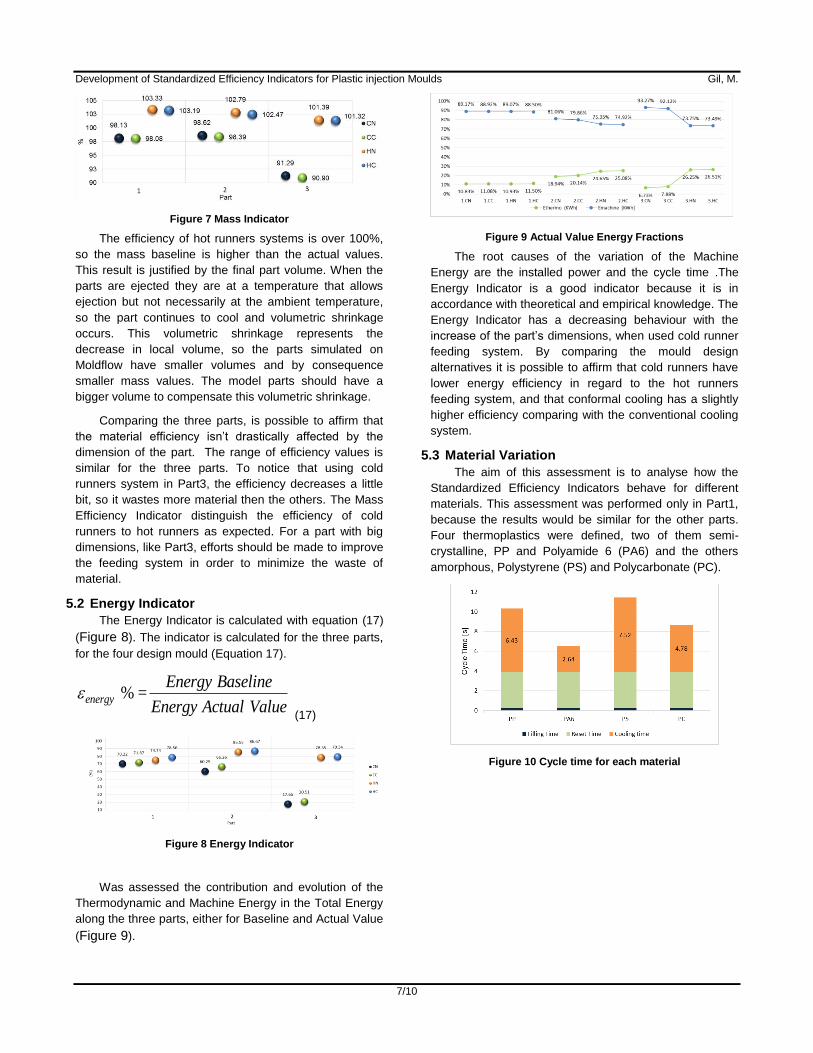
Figure 7 Mass Indicator
The efficiency of hot runners systems is over 100%,
so the mass baseline is higher than the actual values.
This result is justified by the final part volume. When the
parts are ejected they are at a temperature that allows
ejection but not necessarily at the ambient temperature,
so the part continues to cool and volumetric shrinkage
occurs. This volumetric shrinkage represents the
decrease in local volume, so the parts simulated on
Moldflow have smaller volumes and by consequence
smaller mass values. The model parts should have a
bigger volume to compensate this volumetric shrinkage.
Comparing the three parts, is possible to affirm that
the material efficiency isn’t drastically affected by the
dimension of the part. The range of efficiency values is
similar for the three parts. To notice that using cold
runners system in Part3, the efficiency decreases a little
bit, so it wastes more material then the others. The Mass
Efficiency Indicator distinguish the efficiency of cold
runners to hot runners as expected. For a part with big
dimensions, like Part3, efforts should be made to improve
the feeding system in order to minimize the waste of
material.
5.2 Energy Indicator
The Energy Indicator is calculated with equation (17)
(Figure 8). The indicator is calculated for the three parts,
for the four design mould (Equation 17).
% =
energy
Energy Baseline
Energy Actual Value
(17)
Figure 8 Energy Indicator
Was assessed the contribution and evolution of the
Thermodynamic and Machine Energy in the Total Energy
along the three parts, either for Baseline and Actual Value
(Figure 9).
Figure 9 Actual Value Energy Fractions
The root causes of the variation of the Machine
Energy are the installed power and the cycle time .The
Energy Indicator is a good indicator because it is in
accordance with theoretical and empirical knowledge. The
Energy Indicator has a decreasing behaviour with the
increase of the part’s dimensions, when used cold runner
feeding system. By comparing the mould design
alternatives it is possible to affirm that cold runners have
lower energy efficiency in regard to the hot runners
feeding system, and that conformal cooling has a slightly
higher efficiency comparing with the conventional cooling
system.
5.3 Material Variation
The aim of this assessment is to analyse how the
Standardized Efficiency Indicators behave for different
materials. This assessment was performed only in Part1,
because the results would be similar for the other parts.
Four thermoplastics were defined, two of them semi-
crystalline, PP and Polyamide 6 (PA6) and the others
amorphous, Polystyrene (PS) and Polycarbonate (PC).
Figure 10 Cycle time for each material
Development of Standardized Efficiency Indicators for Plastic injection Moulds Gil, M.
8/10
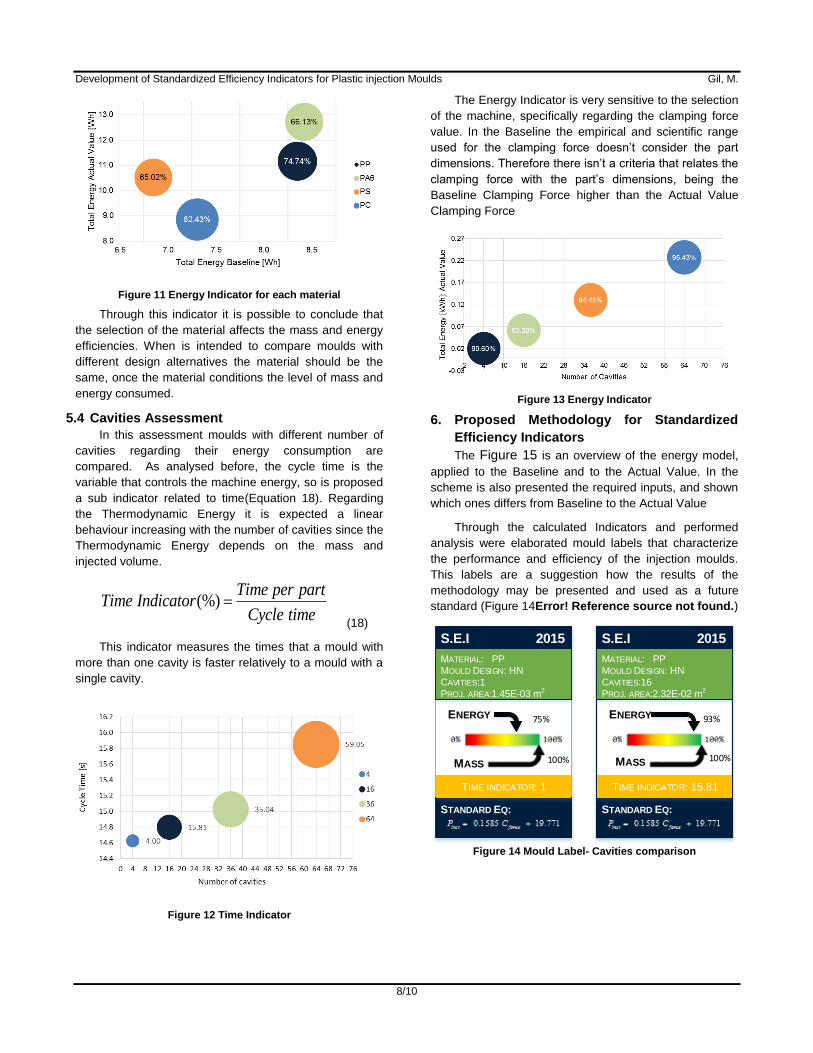
Figure 11 Energy Indicator for each material
Through this indicator it is possible to conclude that
the selection of the material affects the mass and energy
efficiencies. When is intended to compare moulds with
different design alternatives the material should be the
same, once the material conditions the level of mass and
energy consumed.
5.4 Cavities Assessment
In this assessment moulds with different number of
cavities regarding their energy consumption are
compared. As analysed before, the cycle time is the
variable that controls the machine energy, so is proposed
a sub indicator related to time(Equation 18). Regarding
the Thermodynamic Energy it is expected a linear
behaviour increasing with the number of cavities since the
Thermodynamic Energy depends on the mass and
injected volume.
(%)
Time per partTime Indicator
Cycle time
(18)
This indicator measures the times that a mould with
more than one cavity is faster relatively to a mould with a
single cavity.
Figure 12 Time Indicator
The Energy Indicator is very sensitive to the selection
of the machine, specifically regarding the clamping force
value. In the Baseline the empirical and scientific range
used for the clamping force doesn’t consider the part
dimensions. Therefore there isn’t a criteria that relates the
clamping force with the part’s dimensions, being the
Baseline Clamping Force higher than the Actual Value
Clamping Force
Figure 13 Energy Indicator
6. Proposed Methodology for Standardized
Efficiency Indicators
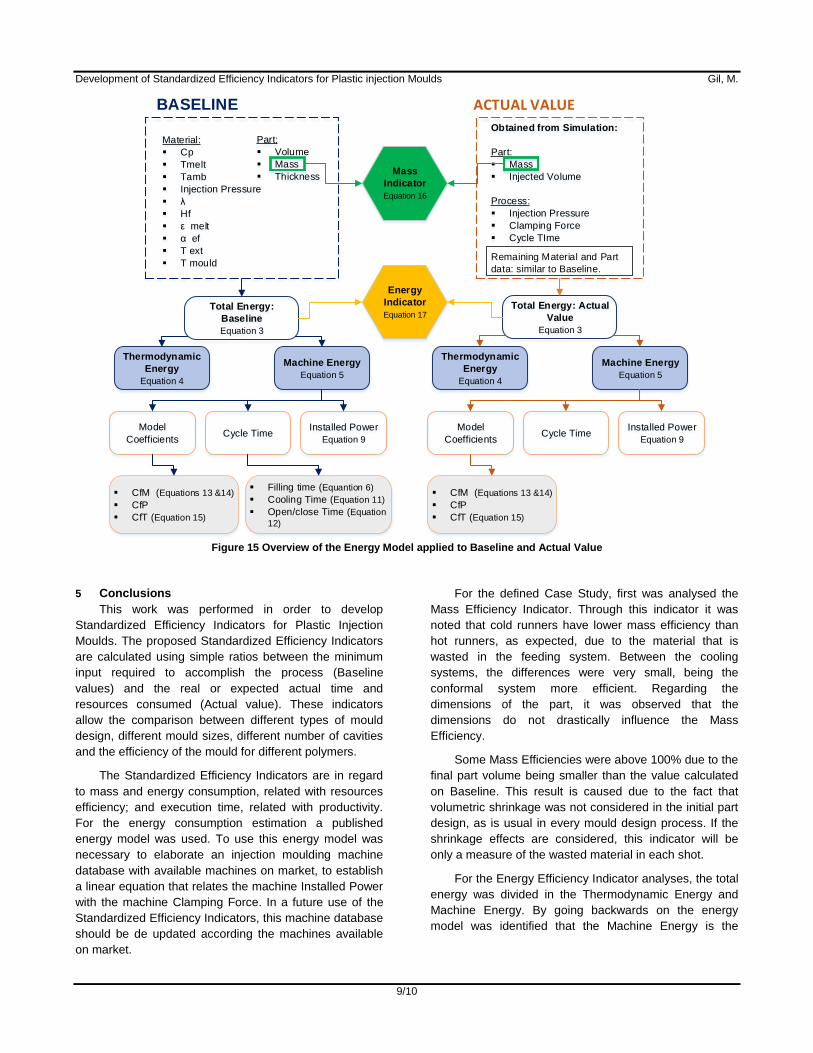
The Figure 15 is an overview of the energy model,
applied to the Baseline and to the Actual Value. In the
scheme is also presented the required inputs, and shown
which ones differs from Baseline to the Actual Value
Through the calculated Indicators and performed
analysis were elaborated mould labels that characterize
the performance and efficiency of the injection moulds.
This labels are a suggestion how the results of the
methodology may be presented and used as a future
standard (Figure 14Error! Reference source not found.)
S.E.I 2015
STANDARD EQ:
ENERGY
MATERIAL: PPMOULD DESIGN: HNCAVITIES:1PROJ. AREA:1.45E-03 m2
S.E.I 2015
STANDARD EQ:
TIME INDICATOR: 15.81
ENERGY
MATERIAL: PPMOULD DESIGN: HNCAVITIES:16PROJ. AREA:2.32E-02 m2
TIME INDICATOR: 1
75% 93%
MASS 100% MASS 100%
Figure 14 Mould Label- Cavities comparison
Development of Standardized Efficiency Indicators for Plastic injection Moulds Gil, M.
9/10
Part:
Volume
Mass
Thickness
Material:
Cp
Tmelt
Tamb
Injection Pressure
λ
Hf
ε melt
α ef
T ext
T mould
BASELINE ACTUAL VALUE
Obtained from Simulation:
Part:
Mass
Injected Volume
Process:
Injection Pressure
Clamping Force
Cycle TIme
Thermodynamic
Energy
Equation 4
Machine Energy
Equation 5
Mass
Indicator
Equation 16
Filling time (Equantion 6)
Cooling Time (Equation 11)
Open/close Time (Equation
12)
CfM (Equations 13 &14)
CfP
CfT (Equation 15)
Total Energy:
Baseline
Equation 3
Model
Coefficients Cycle Time
Installed Power
Equation 9
Thermodynamic
Energy
Equation 4
Machine Energy
Equation 5
CfM (Equations 13 &14)
CfP
CfT (Equation 15)
Total Energy: Actual
Value
Equation 3
Model
Coefficients Cycle Time
Installed Power
Equation 9
Energy
Indicator
Equation 17
Remaining Material and Part
data: similar to Baseline.
Figure 15 Overview of the Energy Model applied to Baseline and Actual Value
5 Conclusions
This work was performed in order to develop
Standardized Efficiency Indicators for Plastic Injection
Moulds. The proposed Standardized Efficiency Indicators
are calculated using simple ratios between the minimum
input required to accomplish the process (Baseline
values) and the real or expected actual time and
resources consumed (Actual value). These indicators
allow the comparison between different types of mould
design, different mould sizes, different number of cavities
and the efficiency of the mould for different polymers.
The Standardized Efficiency Indicators are in regard
to mass and energy consumption, related with resources
efficiency; and execution time, related with productivity.
For the energy consumption estimation a published
energy model was used. To use this energy model was
necessary to elaborate an injection moulding machine
database with available machines on market, to establish
a linear equation that relates the machine Installed Power
with the machine Clamping Force. In a future use of the
Standardized Efficiency Indicators, this machine database
should be de updated according the machines available
on market.
For the defined Case Study, first was analysed the
Mass Efficiency Indicator. Through this indicator it was
noted that cold runners have lower mass efficiency than
hot runners, as expected, due to the material that is
wasted in the feeding system. Between the cooling
systems, the differences were very small, being the
conformal system more efficient. Regarding the
dimensions of the part, it was observed that the
dimensions do not drastically influence the Mass
Efficiency.
Some Mass Efficiencies were above 100% due to the
final part volume being smaller than the value calculated
on Baseline. This result is caused due to the fact that
volumetric shrinkage was not considered in the initial part
design, as is usual in every mould design process. If the
shrinkage effects are considered, this indicator will be
only a measure of the wasted material in each shot.
For the Energy Efficiency Indicator analyses, the total
energy was divided in the Thermodynamic Energy and
Machine Energy. By going backwards on the energy
model was identified that the Machine Energy is the
Development of Standardized Efficiency Indicators for Plastic injection Moulds Gil, M.
10/10
predominant energy, and the variable that influences it is
the Cycle Time.
In the Materials assessment, the comparison of the
Baselines allowed to understand that each material has
its own level of mass and energy consumption, depending
on the materials properties. Once again in the Energy
Efficiency Indicator analysis, the Cycle time is a variable
that greatly influences the efficiency. When is intended to
compare moulds with different design alternatives the
material should be the same, once the material conditions
the level of mass and energy consumed.
Regarding the Cavities assessment, was calculated
the energy per part of the several moulds concluding that
with the increase of the number of cavities, the energy per
part decreases. The proposed Time Indicator allows to
measure the times that a mould with more than one cavity
is faster relatively to a mould with a single cavity. In this
assessment it was analysed that the variable that
influences Energy Efficiency the most is the selection of
the machine in the Baseline and in the Actual Value,
depending on the Clamping Force defined for Baseline
and obtained from the simulation, for the Actual Value.
In the several assessments performed some
fluctuations values were negative, which indicates that the
Baseline is higher than the Actual Value. This occurred
for some values of injection pressure and clamping force.
To improve these results it is recommended a review and
a more extensive research of information regarding the
material properties and processing conditions for the
Baseline, to better adjust the available ranges of values to
the part sizes.
Finally the proposed labels gather and relate the
several studied Standardized Efficiency Indicators,
representing how the indicators can by implemented in
moulds. A data collection during the testing mould phase,
allows that the final Standardized Efficiency Indicators
Label is
References
[1] A. Cunha, “Moldação por Injecção e Materiais PLásticos - Volume 2,” in Manual do Projectista para moldes de injeção de plástico, Departamento de Enga de Polímeros da Universidade do Minho, 2001.
[2] F. Wikipedia, “Measuring operational efficiency Wikipedia,” Wikipedia, 2015. [Online]. Available:
https://en.wikipedia.org/wiki/Operational_efficiency. [Accessed: 03-Aug-2015].
[3] I. Ribeiro, P. Peças, and E. Henriques, “Modelling the Energy Consumption in the Injection Moulding Process,” 2009.
[4] A. Weissman, S. K. Gupta, A. Ananthanarayanan, and R. D. Sriram, “A Systematic Methodology for Accurate Design-Stage Estimation of Energy Consumption for Injection Molded Parts,” Proc. ASME 2010 Int. Des. Eng. Tech. Conf. Comput. Inf. Eng. Conf., pp. 1–13, 2010.
[5] “Estimating molding cycle time _ AMILAN® _ TORAY PLASTICS _ TORAY.” [Online]. Available: http://www.toray.jp/plastics/en/amilan/technical/tec_012.html. [Accessed: 03-Aug-2015].
[6] MDPlastics, Catalogo ENGEL. 2014.
[7] ENGEL, “ENGEL Catalog.” pp. 1–76, 2015.
[8] D. Tripathi, “Polypropylene, Practical Guide to,” iSmithers Rapra Publishing - Technology & Engineering -, 2002, p. 80.
[9] J. Thirlwel, “Seven Key Advantages of Hot Runner Systems,” MoldMaking Technology, 2002. [Online]. Available: http://www.moldmakingtechnology.com/articles/seven-key-advantages-of-hot-runner-systems. [Accessed: 25-Aug-2015].
[10] L. T. First-rate Mold Solution Co., “Why we use Hot Runner,” 2010. [Online]. Available: http://www.firstratemold.com/about-us/blog/why-we-use-hot-runner/. [Accessed: 27-Aug-2015].
[11] Y. Wang, K.-M. Yu, and C. C. L. Wang, “Spiral and conformal cooling in plastic injection molding,” Comput. Des., vol. 63, pp. 1–11, 2015.
[12] R. P. . Beard, “Why Conformal Cooling Makes Sense _ Plastics Technology,” Plastics Technology, 2014. [Online]. Available: http://www.ptonline.com/articles/why-conformal-cooling-makes-ense. [Accessed: 30-Sep-2015].