Embed Size (px)
Citation preview
Development of Statistics on Climate Change in India
Mohan Singh CSO, India
1
Strong correlation between energy use and human development.
India needs to substantially increase its per capita energy consumption to provide a minimal acceptable level of well being to its people.
India being a developing country is facing a major challenge to maintain its high growth rate and impacts of climate change.
India is one of the low per capita greenhouse gas emission countries
India is determined that its per capita greenhouse gas emissions will at no point of time exceed the that of developed countries while pursuing its developmental goals.
2
Climate Changes in India
Increase in surface temperature by 0.4 degree C over the past century.
Warming trend along the west coast, in central India, the interior peninsula, and northeastern India.
Cooling trend in northwest India and parts of South India.
Regional monsoon variations: increased monsoon seasonal rainfall along the west coast, northern Andhra Pradesh and North-western India, decreased monsoon seasonal rainfall over eastern Madhya Pradesh, North-eastern India, and parts of Gujrat and Kerala. 3
Climate Changes in India
Observed trends of multi-decadal periods of more frequent droughts, followed by less severe droughts.
Studies have shown a rising trend in the frequency of heavy rain events and decrease in frequency of moderate events over central India from 1951 to 2000.
Records of coastal tide gauges in the north Indian ocean for the last 40 years has revealed an estimated sea level rise between 1.06-1.75 mm per year.
The available monitoring data on Himalayan glaciers indicates recession of some glaciers.
4
Impacts of Climate Changes water resources agriculture and food production health forests coastal areas vulnerability to extreme events
5
National Action Plan for Climate Change (NAPCC)
Protecting the poor and vulnerable sections of society through sustainable development sensitive to climate change
Achieving national growth objectives through a qualitative change in direction, ecological sustainability, mitigation of greenhouse gas emissions.
Efficient and cost effective strategies for end use Demand side Management.
Technologies for adaptation and mitigation of greenhouse gases emissions.
Promote sustainable development - Regulatory and voluntary mechanisms 6
Core of NAPCC - National Missions
(i) National Solar Mission (ii) National Mission for Enhanced Energy Efficiency (iii) National Mission on Sustainable Habitat (iv) National Water Mission (v) National Mission for Sustaining the Himalyan
Ecosystem (vi) National Mission for a Green India (vii) National Mission for Sustainable Agriculture and(viii) National Mission on Strategic Knowledge for
Climate Change. These National Missions are being institutionalized by the respective Ministries/ Departments.
7
Different Ministries/Organisations/institutions collect and compile the data relating to different indicators of climate changes
Indian Metrological Departments (IMD) is the nodal agency for cyclone warning and monitoring
IMD has a list of all depressions and cyclonic storms formed in Arabian Sea as well as Bay of Bengal for more than 50 years.
8
This data is useful in identifying the areas prone to cyclones, storms, and land slides
The daily report of the data is available in the website of IMD (www.imd.ernet.in)
Centre Pollution Control Board (www.cpcb.nic.in) and State Pollution Control Board collects the data on different air pollutants like SO2, NOx, SPM, RSPM at all the important locations through out the country
9
CPCB also collects the data on green houses gases GHG) for a few important locations
Ministry of Home Affairs (www.mha.nic.in) is monitoring the data on damages due to heavy rains, flood and cyclone during South-West monsoon at State and district level
The month-wise data is also available10
Geological Survey of India (www.gsi.gov.in) is having a wide net-work of field level offices but presently there does not exists any dedicated network for land slide data collection
GSI are studying only the incidents reported by the district administration
Central Water Commission (www.cwc.nic.in) has 147 flood forecasting sites in all the major river basins of the country
11
No uniform format is available with CWC indicting the location of the centre and the district, and the moderate, high and unprecedented flood level for dissemination of flood data at district level
CWC is also monitoring the water availability in the major reservoirs located in different parts of the country particularly in the summer season.
12
Central Bureau of Health Intelligence (www.cbhidghs.nic.in) publishes the data on health in their publication ‘Health Information of India’ every third year
Integrated Disease Surveillance Project is currently in progress and is expected to be completed by 2009 which would provide the health database
Hospital level data is available on morbidity and mortality
13
Department of Agriculture and Cooperation in Ministry of Agriculture (www.agricrop.nic.in) maintains the data on land use as per nine fold classification
It also maintains the data on area sown under different crops for different seasons.
The impact of extreme temperature on production and productivity is also monitored by the agriculture department
14
Department of Agriculture and Cooperation does the coordination of relief measures necessitated by drought
It maintains the data on drought through out the country
Central Statistical Organisation (www.mospi.gov.in) publish ‘compendium of Environment Statistics’ which covers many indicators relating to climate change
15
A New Initiative in India…
16
While some of the hazards and disasters are manmade but most of them occurs due to change in climate
At present no database on hazards and disaster statistics exists in India
A database of disaster and hazards can help researchers and policy makers to analyse the impact of climate more fruitfully
It will also help in identifying the disaster prone areas
17
Realizing the need to develop a National database on hazards and disasters, the Central Statistical Organisation (CSO) of India has taken an initiative for developing a framework for compilation of hazards and disaster statistics on regular basis
Central Statistical Organisation (CSO) and National Institute of Disaster Management (NIDM) is currently working on this database
18
In India few scientific organizations like IMD, CWC, GSI are collecting hazard/disaster data
Different organizations are using different formats and different geographical levels
India is currently developing a uniform framework for compilation of Hazard and Disaster Statistics to get an overall picture of hazard/disaster profile of States and Districts on annual basis
The District has been selected as primary unit for collection of data.
19
There will be two sets of broad dataset Hazard Statistics Disaster Statistics Hazard Statistics will include: Rainfall:- District-wise data on heavy and
scant rainfall and comparison table with normal rainfall
Tropical Depressions:-District-wise tropical depressions in all coastal districts
20
Seismic Hazards:- Seismic data of all earthquakes with magnitude of 5 and above for districts in India and neighboring countries
Landslides:- Data on all reported landslides Floods:- District-wise moderate, high and
unprecedented floods, Data on reservoir levels of all major reservoirs in the country
Drought, Hailstorms, Pest Attacts :- District-wise data on drought, hailstorm and pest attacks
21
Industrial Hazards:- Industrial/chemical accidents
Railway hazards and Accidents:- Data on railway deaths, injuries and damages to railway infrastructure
Aviation Accidents:- Aviation accidents involving deaths, injuries and danger to infrastructure
Health Hazards: Important Public health hazards
22
Disaster Statistics will contain three parts: Damage, Relief and Reconstruction
Damage data has been classified into eight categories:
1. Lives (deaths & injuries)2. Livestock (deaths)3. Agriculture (Sown area affected and
production loss)4. Housing (full or partial damage)
23
5. Infrastructure (damage to roads, bridges, water supply, sewerage system, irrigation, electric supply, shops/commercial buildings, other utilities)
6. Environmental Damage7. Damage at macro-economic level8. Health (occurrence of epidemic due to
water borne and vector borne disease)
24
Relief and Rehabilitation will contain Gratuitous relief Supplementary Nutrition Assistance to small and marginal farmers Input subsidy to farmers other than small
and marginal farmers Employment Generation Assistance to small and marginal farmers/
agricultural labourers
25
Assistance to fisherman Assistance to Artisans in handicrafts/handloom
sectors by way of subsidy for repair/replacement of damaged equipments
Assistance for repair/restoration of damaged houses
Provision of emergency supply of drinking water in rural and urban areas
Provision of medicines, disinfectants, insecticides for prevention of outbreak of epidemics
26
Medical care of cattle and poultry against epidemics as a sequel to a notified natural calamity
Evacuation of people affected/likely to be affected
Hiring of boats for carrying immediate relief and saving life
Provision of temporary accommodation, flood, clothing, medical care etc.
27
Air dropping of essential supplies Repair / restoration of immediate nature
of the damaged infrastructure Replacement of damaged medical
equipment and lost medicines of government hospitals/ health centres Operational cost of relief
measure/services Cost of clearance of debris
28
Draining off flood water in affected areas Disposal of dead bodies/care cases Procurement of essential search, rescue
and evacuation equipments Reconstruction will contain Information on reconstruction measures
29
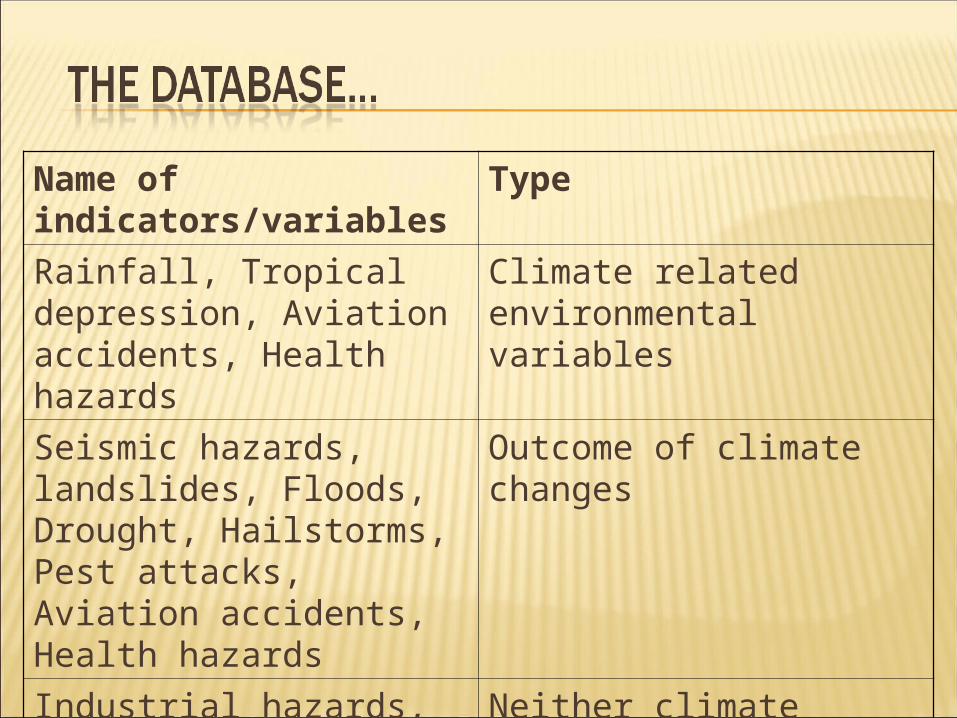
Name of indicators/variables
Type
Rainfall, Tropical depression, Aviation accidents, Health hazards
Climate related environmental variables
Seismic hazards, landslides, Floods, Drought, Hailstorms, Pest attacks, Aviation accidents, Health hazards
Outcome of climate changes
Industrial hazards, Railway hazards
Neither climate related environmental variables nor an outcome of climate change
Linking these climate related variables and outcomes of climate changes to the data on damages, one can perform a detailed level analysis at the district level
The effect on climate change on economic development, ecosystem and human lives can be analysed for different environmental zones using the detailed level data at district level

32
Thank you