Embed Size (px)
Citation preview
DDEEVVEELLOOPPMMEENNTT PPHHAASSIINNGG SSTTRRAATTEEGGYY:: RREEGGIIOONNAALL MMUUNNIICCIIPPAALLIITTYY OOFF NNIIAAGGAARRAA
FFIINNAALL RREEPPOORRTT
HEMSON C o n s u l t i n g L t d.
November 4, 2013
TABLE OF CONTENTS
EXECUTIVE SUMMARY ............................................................................................... 1
I INTRODUCTION ............................................................................................... 2
II GROWTH PROSPECTS ....................................................................................... 7
A. GROWTH TRENDS ................................................................................... 7 B. FUTURE OUTLOOK ................................................................................ 16 C. CAPACITY TO ACCOMMODATE GROWTH .......................................... 19
III BEST PRACTICE REVIEW & CONSULTATION EFFORTS .................................. 25
A. ROUND ONE: ISSUES AND OPPORTUNITIES ........................................ 25 B. JURISDICTIONAL REVIEW AND BEST PRACTICES .................................. 29 C. ROUND TWO: APPROACHES TO PHASING POLICY ............................ 31
IV CONCLUSIONS AND POLICY RECOMMENDATIONS ................................... 39
A. PRINCIPLES TO GUIDE PHASING IN NIAGARA ..................................... 39 B. REGIONAL AND LOCAL ROLES IN PHASING IMPLEMENTATION ........ 40 C. DRAFT PHASING POLICY AMENDMENT ............................................... 42
APPENDIX ................................................................................................................. 44
HEMSON
List of Exhibits Table 1 Total Population Growth, Niagara Region, 2001-2011 Exhibit 1: Local Municipal Rates and Shares of Regional Population Growth, Niagara Region, 2001-2011 Table 2: Total Housing Unit Growth, Niagara Region, 2001-2011 Exhibit 2: Local Municipal Rates and Shares of Regional Housing Growth, Niagara Region, 2001-2011 Exhibit 3: Shares of Total Regional Resident Employed Labour Force & Place of Work Employment by Local Municipality, Niagara Region, 2011 Table 3: Total Resident Employed Labour Force Growth, Region of Niagara, 2001 – 2011 Table 4: Total Place of Work Employment Growth, Region of Niagara, 2001-2011 Table 5: Forecast Total Population Growth, Region of Niagara, 2011-2031 Table 6: Forecast Total Employment Growth, Region of Niagara, 2011-2031 Table 7: Niagara Region - Forecast Total Housing Unit Growth under Growth Plan Schedule 3 Table 8: Designated Urban Land Supply (Gross Ha), Region of Niagara, 2011 Table 9: Residential Intensification Targets by Local Municipality, Region of Niagara Table 10: Housing Unit Mix, Region of Niagara Table 11 Housing Starts, Region of Niagara, 2011 to 2013 (Year to Date) Table 12 Housing Completions, Region of Niagara, 2011 to 2013 (Year to Date)
1
HEMSON
EXECUTIVE SUMMARY
The Region of Niagara engaged Hemson Consulting Ltd. in 2012 to prepare a Regional Development Phasing Strategy intended to complement work undertaken for Amendment 2-2009 to the Regional Policy Plan (RPPA 2-2009) and to bring the Plan into conformity with the Growth Plan for the Greater Golden Horseshoe, 2006. The Phasing Strategy will result with an amendment to the RPP containing policies aimed at ensuring logical, orderly and timely development; aligning land use planning with infrastructure investment; and providing clarity in the urban development process.
This final report is the culmination of two study phases and builds on the interim Development Phasing: Issues and Opportunities report prepared for the Region in August 2013. This report includes the results of the background research, jurisdictional scan and two rounds of stakeholder consultation undertaken to identify a best fit approach to phasing policy in a Niagara context. Recommendations and a draft phasing policy amendment are included. Key findings include:
Niagara’s modest growth overall within the Greater Golden Horseshoe is marked by significant differentiation at the local municipal level. The Region is forecast to grow steadily in population, housing and employment over the 2011 to 2031 period and, if appropriately planned, has the capacity to accommodate anticipated growth from land supply and servicing perspectives.
The range of approaches taken to phasing by upper-tier municipalities across the GGH provided a sound basis for key stakeholders to consider a range of phasing policy options. Input from stakeholders helped to reveal local conditions and priorities for guiding growth through phasing policy and have clarified potential roles for the Region and local municipalities in phasing implementation.
A draft phasing policy amendment has been developed which acknowledges the diversity of issues and opportunities experienced in managing growth in Niagara and provides key parameters within which the Region and its local municipalities can work together towards a shared vision for future growth and development.
2
HEMSON
I INTRODUCTION
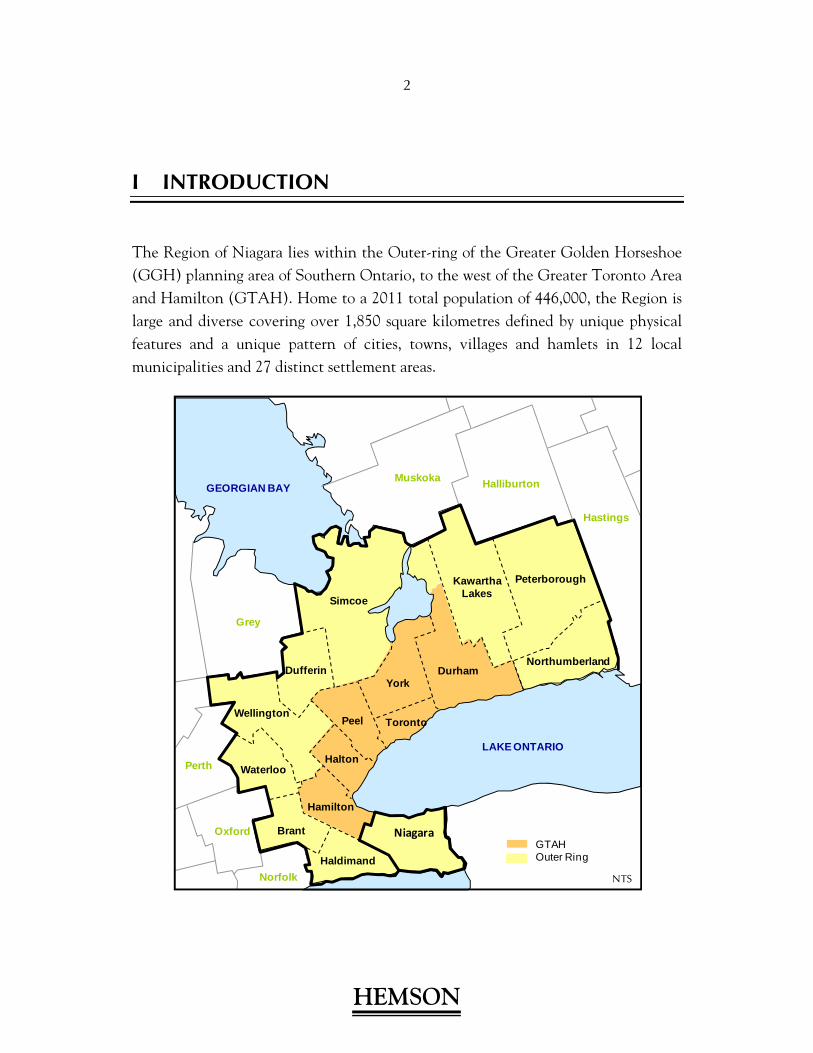
The Region of Niagara lies within the Outer-ring of the Greater Golden Horseshoe (GGH) planning area of Southern Ontario, to the west of the Greater Toronto Area and Hamilton (GTAH). Home to a 2011 total population of 446,000, the Region is large and diverse covering over 1,850 square kilometres defined by unique physical features and a unique pattern of cities, towns, villages and hamlets in 12 local municipalities and 27 distinct settlement areas.
KawarthaLakes
Norfolk
Haldimand
GEORGIAN BAY
LAKE ONTARIO
Halliburton
Peterborough
Northumberland
Simcoe
YorkDurham
Peel Toronto
Dufferin
Wellington
Waterloo
Hamilton
BrantOxford
Perth
Grey
Muskoka
Hastings
Halton
GTAHOuter Ring
NTS
Niagara
3
HEMSON
The Regional Policy Plan (RPP) is the guiding document for growth management and land use planning in the Region and provides direction to the Regional Council and local municipalities related to managing growth and development while protecting natural features and promoting sustainable economic growth. Development in the Region is governed by Provincial policies found in the Niagara Escarpment Plan (2005), the Greenbelt Plan (2005) the Provincial Policy Statement (PPS) 2005, and the Growth Plan for the Greater Golden Horseshoe (the Growth Plan) (2006), as well as Regional and local municipal plans and strategies.
Phasing policies are key requirements within the Provincial policy framework for growth management in Ontario.
The Provincial Policy Statement 2005 (PPS) requires municipalities to ensure sufficient land is available to accommodate growth for 20 years and requires municipalities to establish and implement phasing policies to ensure specific targets for intensification and redevelopment are met “prior to, or concurrent with, new development within designated growth areas” (s.1.1.3.6).
In specifying policies that municipalities must follow when planning for new development in ‘Designated Greenfield Areas’, the Growth Plan supports the PPS in directing municipalities to “develop and implement official plan policies, including phasing policies, and other strategies, for designated greenfield areas to achieve the intensification target and density targets of (the) Plan” (s.2.2.7.6). The Growth Plan introduced policies for accommodating growth within settlement area boundaries to 2031.
The Region’s approach to planning will continue to reflect and support Provincial planning policy objectives and work towards the development of more compact, sustainable urban patterns based on the notion of complete communities. Phasing policies can play a key role to this end, helping to ensure policy targets for intensification in Built-up Areas and density targets in Designated Greenfields Areas are met and supporting a shared vision for Niagara’s future based on appropriate and sustainable urban development.
4
HEMSON
The objective of this exercise is to adopt an amendment to the RPP to ensure a consistent approach across the Region to managing growth within the 2031 boundaries, while recognizing differing development conditions across the Region. The phasing policy amendment will build on RPPA 2-2009 in order to bring the regional policy plan into conformity with the Growth Plan. This work has been based on the forecasts in Schedule 3 of the Growth Plan, incorporated in the Regional Policy Plan as Schedule B. The 2031 boundaries found on Schedule A of RPPA 2-2009 reflect the forecast allocations in Schedule B and are fixed1 until the next five-year review under the Planning Act.
A phasing strategy is a way to manage anticipated growth on Designated Greenfield Areas and in Built Up Areas to appropriately plan for orderly and logical urban development in a manner which recognizes differing development opportunities, supports policy goals for sustainable and complete communities and maximizes Regional and local servicing and infrastructure capacity and investment. Phasing policy will tie-in with, and help to complete, the policy framework for managing growth and development within Niagara Region:
1 Note: There are two urban area boundary expansions proposed for the communities of Smithville and Fort Erie, which could alter the boundaries as delineated on Schedule A; the subject lands are currently on hold pending the outcome of appeals before the Ontario Municipal Board.
5
HEMSON
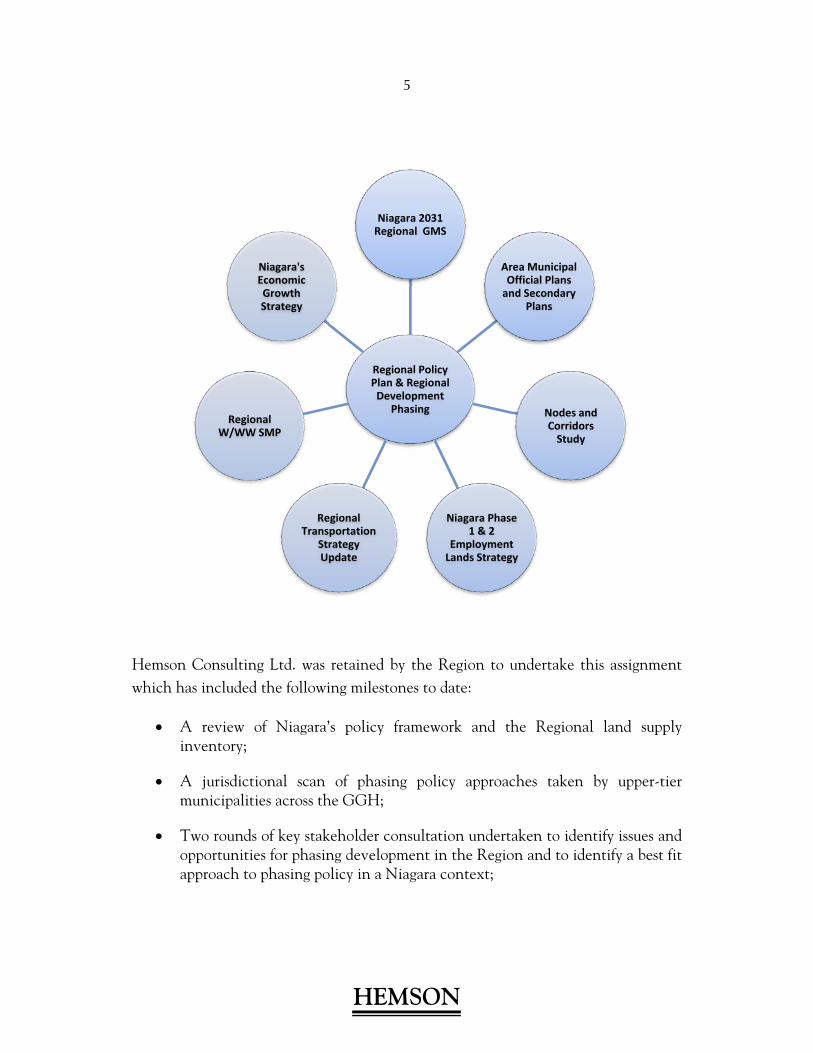
Hemson Consulting Ltd. was retained by the Region to undertake this assignment which has included the following milestones to date:
A review of Niagara’s policy framework and the Regional land supply inventory;
A jurisdictional scan of phasing policy approaches taken by upper-tier municipalities across the GGH;
Two rounds of key stakeholder consultation undertaken to identify issues and opportunities for phasing development in the Region and to identify a best fit approach to phasing policy in a Niagara context;
Regional Policy Plan & Regional Development
Phasing
Niagara 2031 Regional GMS
Area Municipal Official Plans and Secondary
Plans
Nodes and Corridors Study
Niagara Phase 1 & 2
Employment Lands Strategy
Regional Transportation
Strategy Update
Regional W/WW SMP
Niagara's Economic Growth Strategy
6
HEMSON
A Development Phasing: Issues and Opportunities report was prepared which overviewed recent growth trends for the Region within the GGH context, the results of the Regional land supply work, key challenges and opportunities related to phasing policy in Niagara and findings from the first round of consultation activities;
This final report documents the results of the background research, jurisdictional scan and the round two consultation sessions and makes recommendations with respect to an amendment to the RPP.
The balance of this report is organized into three chapters:
Chapter 2 provides an overview of recent population, housing and employment growth trends within the 12 local municipalities and examines the Region’s planned growth and capacity to accommodate urban development from a land supply and servicing perspective;
Chapter 3 describes the two rounds of consultation activities, presents key findings from a jurisdictional scan of upper-tier municipalities within the GGH and summarizes best-practice approaches to phasing policy;
Chapter 4 identifies consensus points from the stakeholder feedback and presents a refined set of underlying principles, working towards a phasing policy approach best suited to the Niagara context. Conclusions and recommendations for the Region to consider in planning for future growth and development are presented along with a proposed draft phasing policy amendment to the Regional Policy Plan.
7
HEMSON
II GROWTH PROSPECTS
As described in the Issues and Opportunities report, Niagara Region has been growing modestly over the past decade as compared with other regions in the Greater Golden Horseshoe planning area. The Region is anticipated to grow steadily in population, housing and employment over the period to 2031 and, based on appropriate long-term planning, will have the capacity to accommodate anticipated growth from land supply and servicing perspectives.
A. GROWTH TRENDS
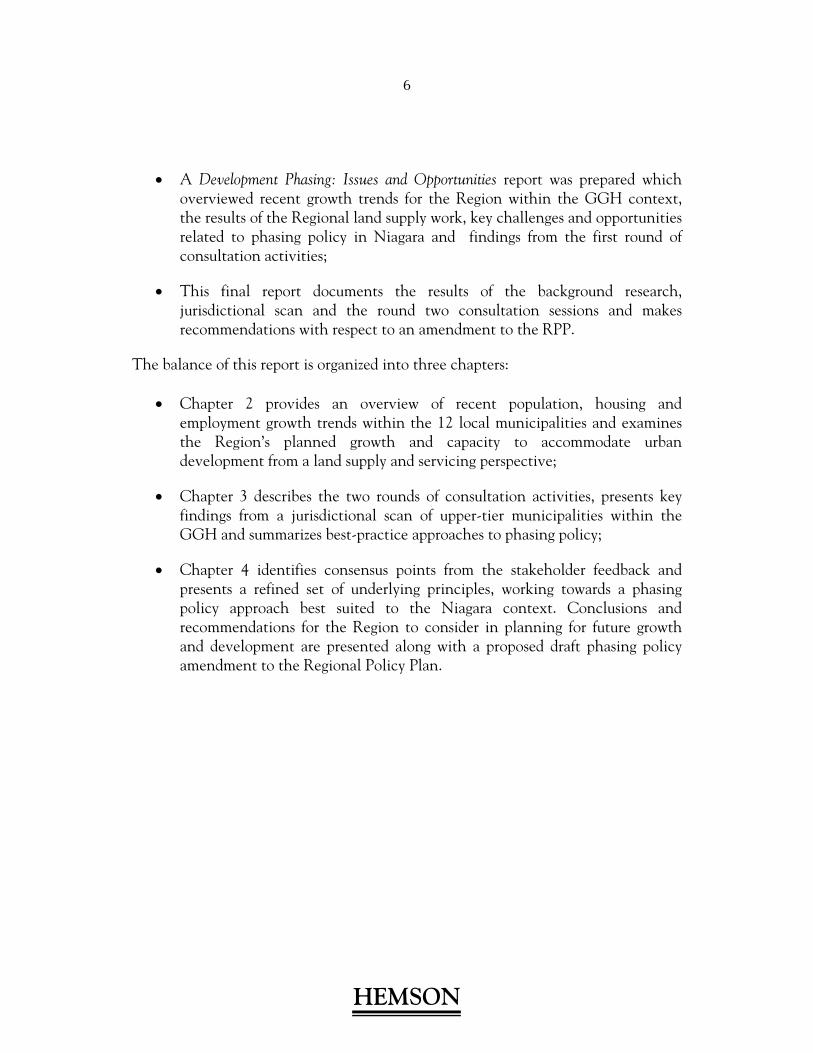
This section takes a closer look at how the local municipalities have been growing in terms of absolute growth and respective shares of population, housing and employment growth occurring Region-wide and benefits from newly acquired data from the 2011 National Household Survey. Table 1 below illustrates Regional and local municipal population growth over the 2001- 2011 period.
Table 1Total Population Growth, 2001-2011
Niagara Region
Municipality 2001 2011 Absolute Growth
2001-2011
Growth Rate2001-2011
Share of Regional Growth 2001-
2011 Grimsby Lincoln West Lincoln Niagara Falls St. Catharines Niagara-on-the-Lake Fort Erie Pelham Port Colborne Thorold Welland Wainfleet
22,000 21,300 12,700 81,600
133,700 14,300 29,100 15,800 19,100 18,700 50,100
6,500
26,10023,20014,30085,700
135,60015,90030,90017,10019,00018,50052,300
6,600
4,1001,9001,6004,1002,0001,6001,8001,300-100-200
2,200100
19%9%
13%5%1%
11%6%8%0%
-1%4%1%
20%9%8%
20%10%8%9%7%0%
-1%11%0%
Niagara Region 424,800 445,200 20,400 5% 100%
Source: Hemson Consulting Ltd. based on Statistics Canada Census of Population, 2001 & 2011. Note: Refers to total population, including 4% undercount. Figures are rounded.
8
HEMSON
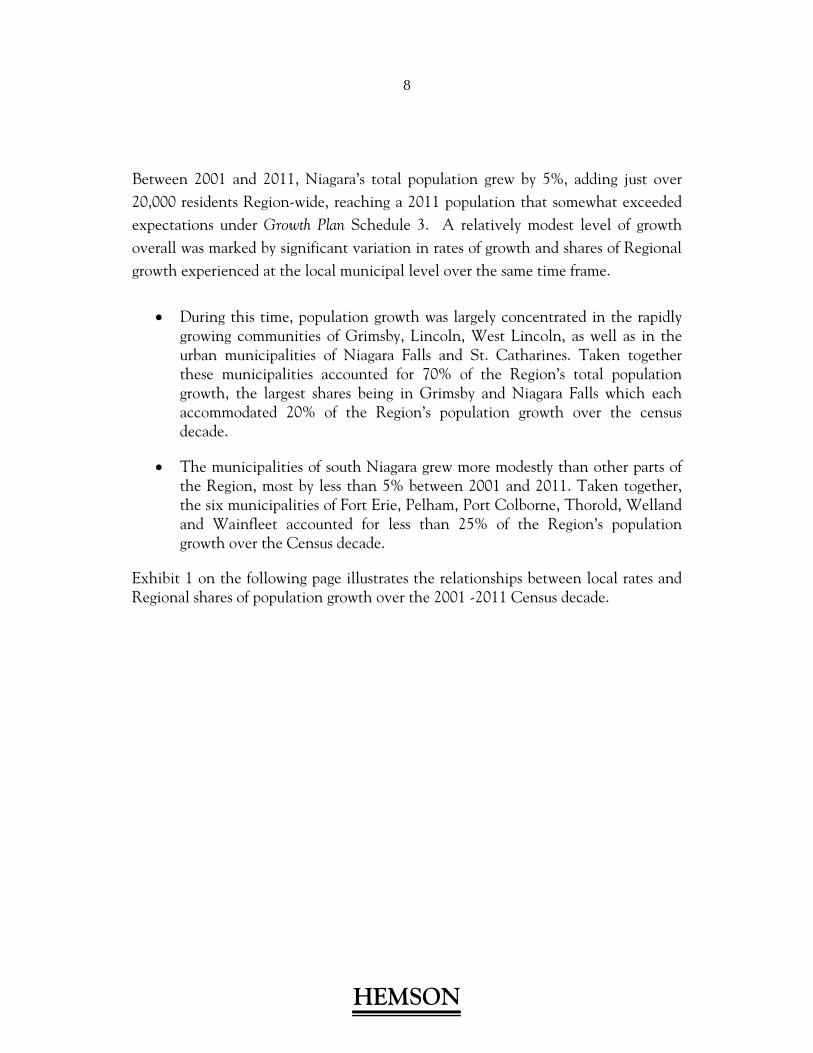
Between 2001 and 2011, Niagara’s total population grew by 5%, adding just over 20,000 residents Region-wide, reaching a 2011 population that somewhat exceeded expectations under Growth Plan Schedule 3. A relatively modest level of growth overall was marked by significant variation in rates of growth and shares of Regional growth experienced at the local municipal level over the same time frame.
During this time, population growth was largely concentrated in the rapidly growing communities of Grimsby, Lincoln, West Lincoln, as well as in the urban municipalities of Niagara Falls and St. Catharines. Taken together these municipalities accounted for 70% of the Region’s total population growth, the largest shares being in Grimsby and Niagara Falls which each accommodated 20% of the Region’s population growth over the census decade.
The municipalities of south Niagara grew more modestly than other parts of the Region, most by less than 5% between 2001 and 2011. Taken together, the six municipalities of Fort Erie, Pelham, Port Colborne, Thorold, Welland and Wainfleet accounted for less than 25% of the Region’s population growth over the Census decade.
Exhibit 1 on the following page illustrates the relationships between local rates and Regional shares of population growth over the 2001 -2011 Census decade.
9
HEMSON
Exhibit 1: Local Municipal Rates and Shares of Regional Population Growth, Niagara Region, 2001-2011
Source: Hemson Consulting Ltd. based on Statistics Canada Census of Population, 2001 & 2011.
Niagara Falls grew by 5% between 2001 and 2011, however accounted for 20% of the Region-wide growth over the same time frame. Likewise, St. Catharines grew by only 1%, yet represented 10% of the Region-wide total population growth.
The communities of Welland and Fort Erie also experienced more modest rates of local growth in comparison to their respective shares of Region-wide growth.
‐5%
0%
5%
10%
15%
20%
25%
Grim Lin WL NF St.C NOTL FE Pel PC Th Well Wain
Local Rate of Growth
Share of Regional Growth
Total Population GrowthNiagara Region, 2001-2011
10
HEMSON
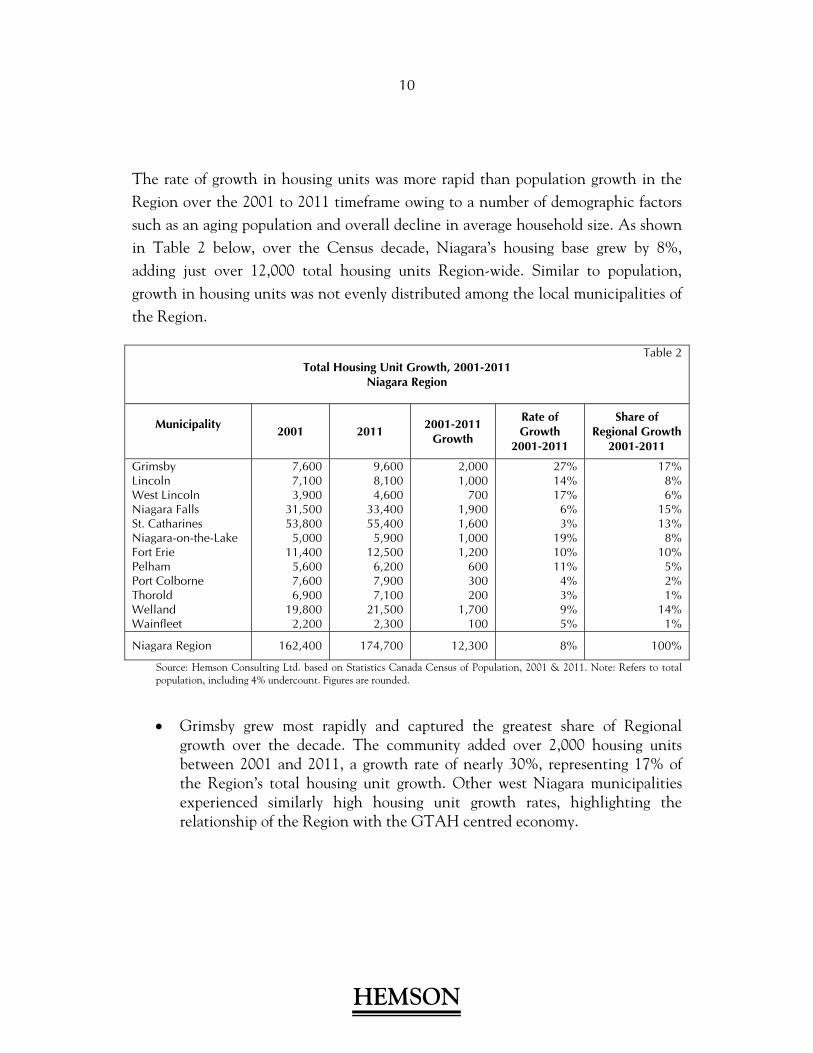
The rate of growth in housing units was more rapid than population growth in the Region over the 2001 to 2011 timeframe owing to a number of demographic factors such as an aging population and overall decline in average household size. As shown in Table 2 below, over the Census decade, Niagara’s housing base grew by 8%, adding just over 12,000 total housing units Region-wide. Similar to population, growth in housing units was not evenly distributed among the local municipalities of the Region.
Table 2Total Housing Unit Growth, 2001-2011
Niagara Region
Municipality
2001 2011 2001-2011
Growth
Rate of Growth
2001-2011
Share of Regional Growth
2001-2011
Grimsby Lincoln West Lincoln Niagara Falls St. Catharines Niagara-on-the-Lake Fort Erie Pelham Port Colborne Thorold Welland Wainfleet
7,600 7,100 3,900
31,500 53,800
5,000 11,400
5,600 7,600 6,900
19,800 2,200
9,6008,1004,600
33,40055,400
5,90012,500
6,2007,9007,100
21,5002,300
2,0001,000
7001,9001,6001,0001,200
600300200
1,700100
27% 14% 17% 6% 3%
19% 10% 11% 4% 3% 9% 5%
17%8%6%
15%13%8%
10%5%2%1%
14%1%
Niagara Region 162,400 174,700 12,300 8% 100%
Source: Hemson Consulting Ltd. based on Statistics Canada Census of Population, 2001 & 2011. Note: Refers to total population, including 4% undercount. Figures are rounded.
Grimsby grew most rapidly and captured the greatest share of Regional
growth over the decade. The community added over 2,000 housing units between 2001 and 2011, a growth rate of nearly 30%, representing 17% of the Region’s total housing unit growth. Other west Niagara municipalities experienced similarly high housing unit growth rates, highlighting the relationship of the Region with the GTAH centred economy.
11
HEMSON
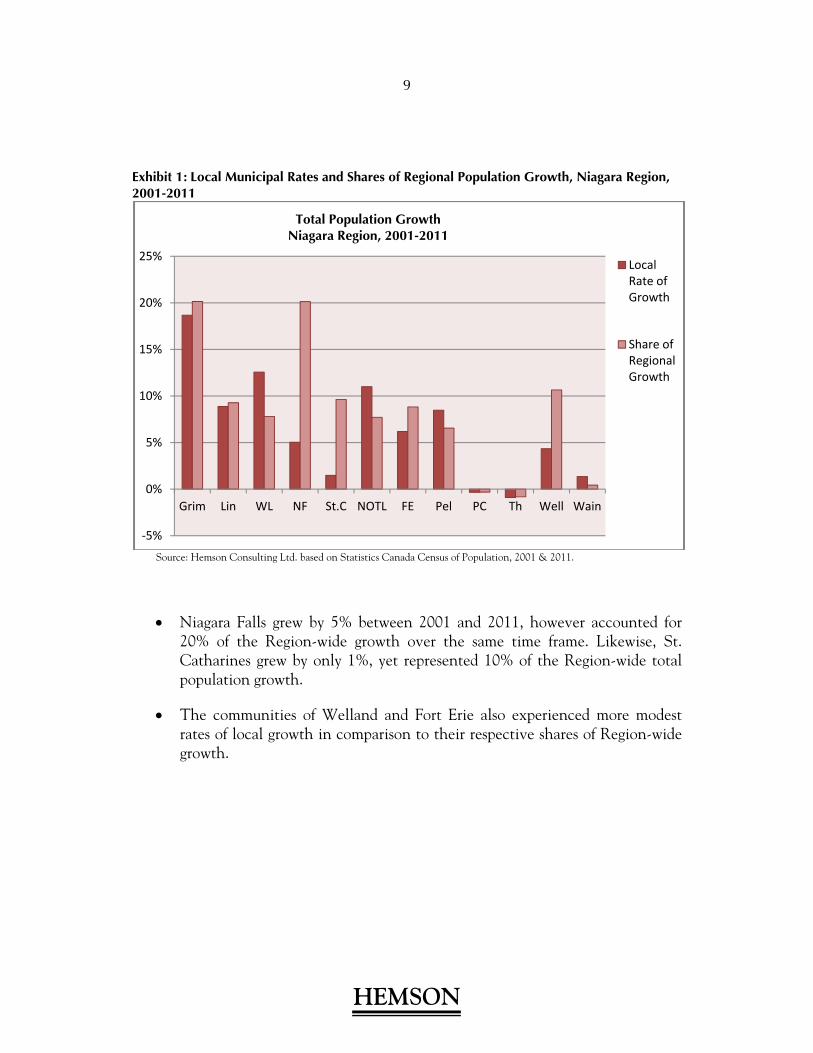
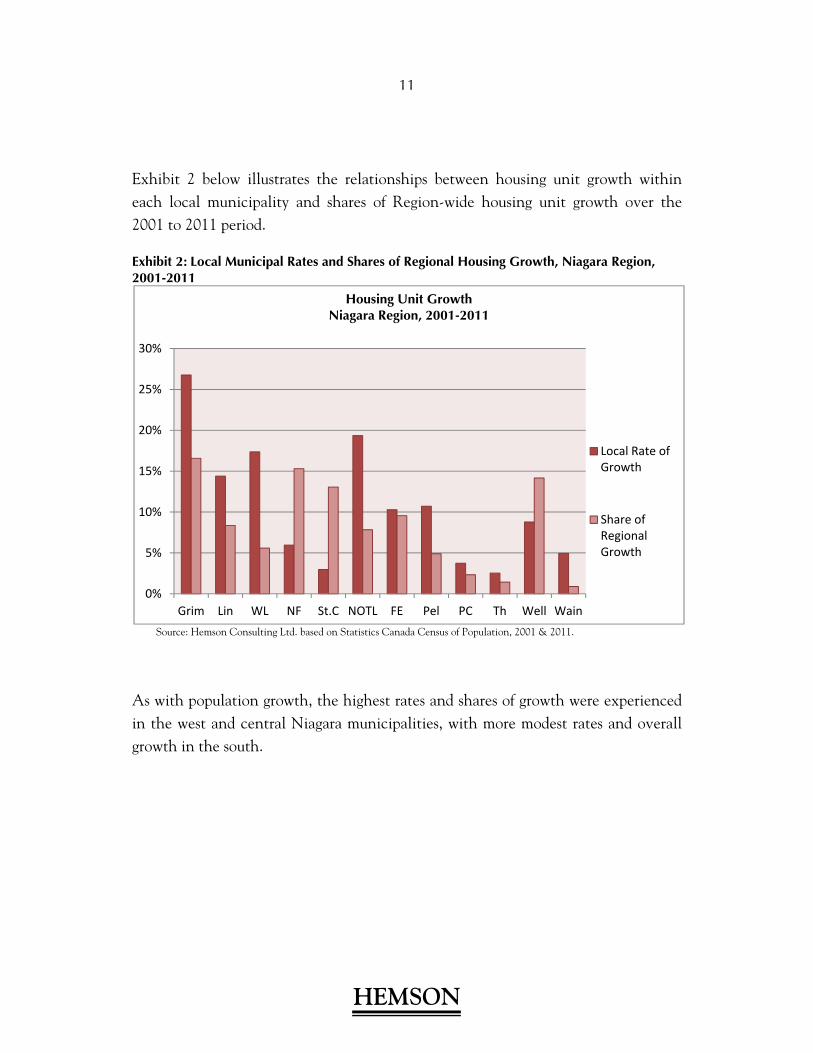
Exhibit 2 below illustrates the relationships between housing unit growth within each local municipality and shares of Region-wide housing unit growth over the 2001 to 2011 period.
Exhibit 2: Local Municipal Rates and Shares of Regional Housing Growth, Niagara Region, 2001-2011
Source: Hemson Consulting Ltd. based on Statistics Canada Census of Population, 2001 & 2011.
As with population growth, the highest rates and shares of growth were experienced in the west and central Niagara municipalities, with more modest rates and overall growth in the south.
0%
5%
10%
15%
20%
25%
30%
Grim Lin WL NF St.C NOTL FE Pel PC Th Well Wain
Local Rate of Growth
Share of Regional Growth
Housing Unit Growth Niagara Region, 2001-2011
12
HEMSON
St. Catharines and Niagara Falls grew modestly in terms of adding to their existing housing unit base, however at a Regional level, the cities taken together accounted for approximately 30% of the Region’s total housing unit growth, adding nearly 3,500 units to the Region’s housing base between 2001 and 2011.
Thorold and Port Colborne experienced the lowest housing growth rates, at 3% and 4% respectively, while over the same period both communities lost population.
High rates of growth in Grimsby, Lincoln and West Lincoln are consistent with GTAH commutershed while growth in Niagara-on-the-Lake reflects the niche housing market there. High shares of Regional housing unit growth in central Niagara confirm the importance of the urban centres of Niagara Falls and St. Catharine’s to overall growth within the Region.
Similar to the variation observed in local municipal population and housing growth, changes in the employed resident base and local job opportunities have displayed significant heterogeneity across the Region, as illustrated through trends in the Region’s ‘Resident Employed Labour Force’ and ‘Place of Work’ employment over the 2001 to 2011 Census decade2.
2 Resident Employed Labour Force refers to the number of residents living within a municipality that are employed, irrespective of what municipality they work in; and Place of Work refers to the number of workers employed within a municipality, irrespective of what municipality they live in.
13
HEMSON
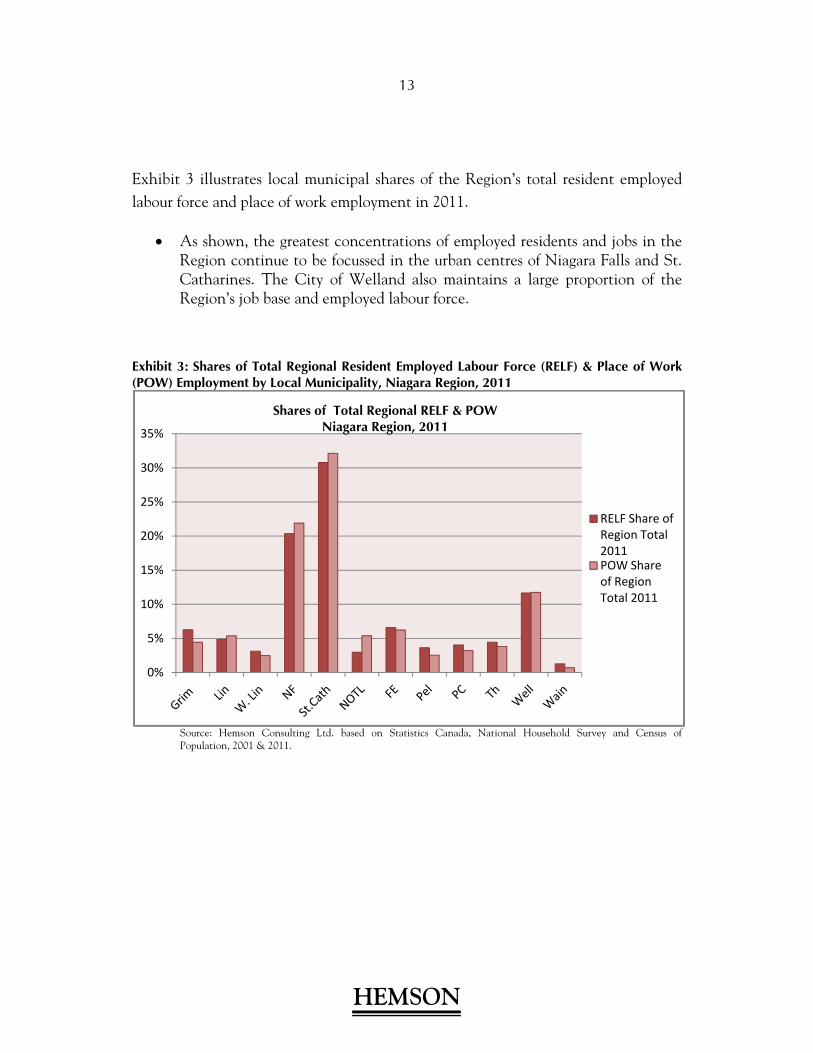
Exhibit 3 illustrates local municipal shares of the Region’s total resident employed labour force and place of work employment in 2011.
As shown, the greatest concentrations of employed residents and jobs in the Region continue to be focussed in the urban centres of Niagara Falls and St. Catharines. The City of Welland also maintains a large proportion of the Region’s job base and employed labour force.
Exhibit 3: Shares of Total Regional Resident Employed Labour Force (RELF) & Place of Work (POW) Employment by Local Municipality, Niagara Region, 2011
Source: Hemson Consulting Ltd. based on Statistics Canada, National Household Survey and Census of Population, 2001 & 2011.
0%
5%
10%
15%
20%
25%
30%
35%
RELF Share of Region Total 2011POW Share of Region Total 2011
Shares of Total Regional RELF & POW Niagara Region, 2011
14
HEMSON
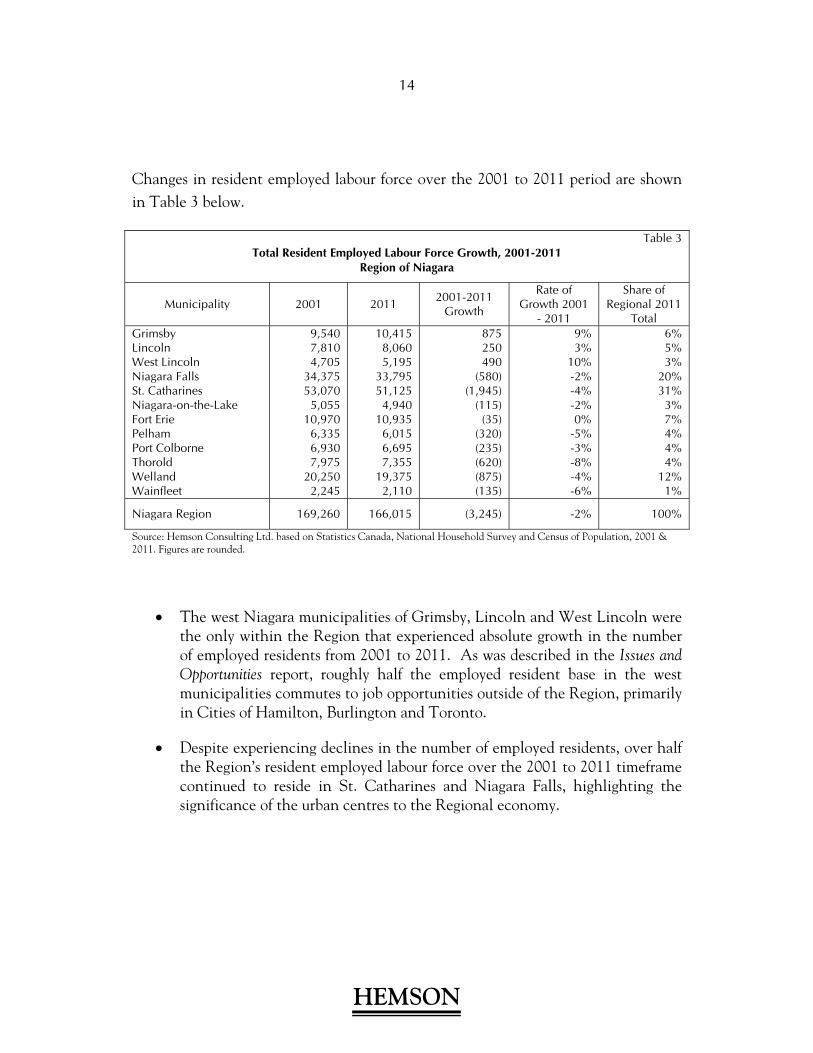
Changes in resident employed labour force over the 2001 to 2011 period are shown in Table 3 below.
Table 3Total Resident Employed Labour Force Growth, 2001-2011
Region of Niagara
Municipality 2001 2011 2001-2011 Growth
Rate of Growth 2001
- 2011
Share of Regional 2011
Total Grimsby Lincoln West Lincoln Niagara Falls St. Catharines Niagara-on-the-Lake Fort Erie Pelham Port Colborne Thorold Welland Wainfleet
9,540 7,810 4,705
34,375 53,070 5,055
10,970 6,335 6,930 7,975
20,250 2,245
10,415 8,060 5,195
33,795 51,125 4,940
10,935 6,015 6,695 7,355
19,375 2,110
875 250 490
(580) (1,945)
(115) (35)
(320) (235) (620) (875) (135)
9% 3%
10% -2% -4% -2% 0%
-5% -3% -8% -4% -6%
6%5%3%
20%31%3%7%4%4%4%
12%1%
Niagara Region 169,260 166,015 (3,245) -2% 100%
Source: Hemson Consulting Ltd. based on Statistics Canada, National Household Survey and Census of Population, 2001 & 2011. Figures are rounded.
The west Niagara municipalities of Grimsby, Lincoln and West Lincoln were the only within the Region that experienced absolute growth in the number of employed residents from 2001 to 2011. As was described in the Issues and Opportunities report, roughly half the employed resident base in the west municipalities commutes to job opportunities outside of the Region, primarily in Cities of Hamilton, Burlington and Toronto.
Despite experiencing declines in the number of employed residents, over half the Region’s resident employed labour force over the 2001 to 2011 timeframe continued to reside in St. Catharines and Niagara Falls, highlighting the significance of the urban centres to the Regional economy.
15
HEMSON
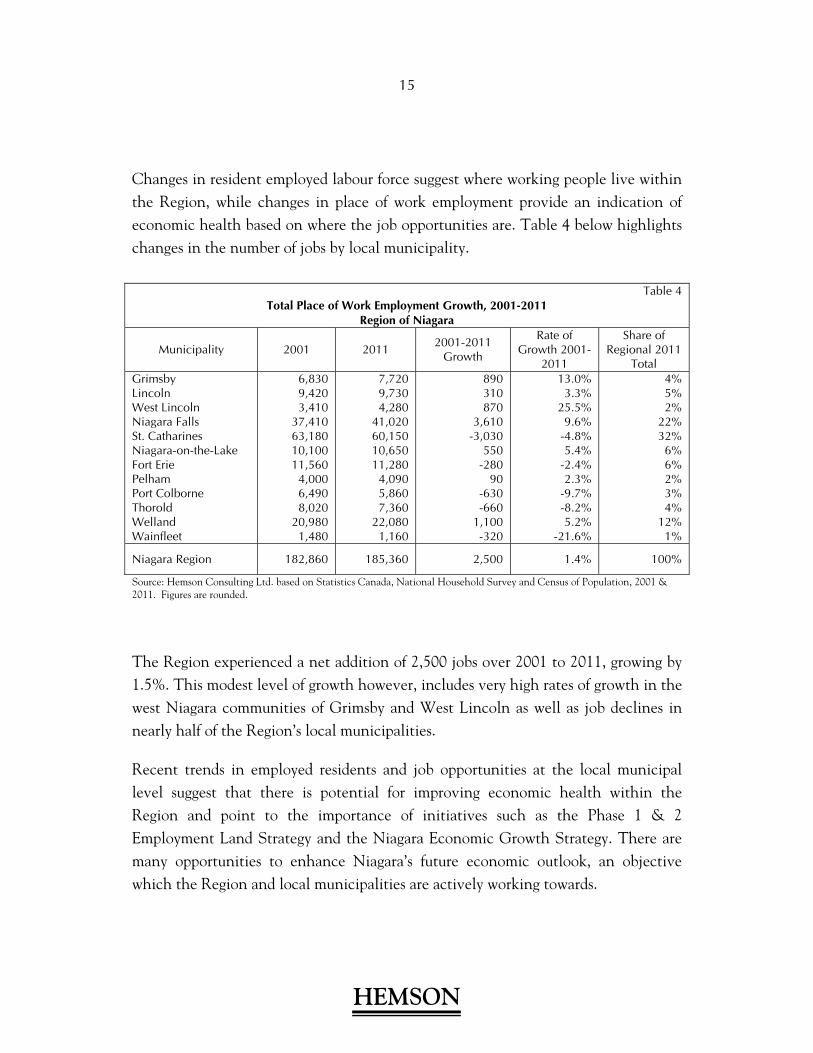
Changes in resident employed labour force suggest where working people live within the Region, while changes in place of work employment provide an indication of economic health based on where the job opportunities are. Table 4 below highlights changes in the number of jobs by local municipality.
Table 4Total Place of Work Employment Growth, 2001-2011
Region of Niagara
Municipality 2001 2011 2001-2011
Growth
Rate of Growth 2001-
2011
Share of Regional 2011
Total Grimsby Lincoln West Lincoln Niagara Falls St. Catharines Niagara-on-the-Lake Fort Erie Pelham Port Colborne Thorold Welland Wainfleet
6,8309,4203,410
37,41063,18010,10011,560
4,0006,4908,020
20,9801,480
7,7209,7304,280
41,02060,15010,65011,280
4,0905,8607,360
22,0801,160
890310870
3,610-3,030
550-280
90-630-660
1,100-320
13.0% 3.3%
25.5% 9.6%
-4.8% 5.4%
-2.4% 2.3%
-9.7% -8.2% 5.2%
-21.6%
4%5%2%
22%32%6%6%2%3%4%
12%1%
Niagara Region 182,860 185,360 2,500 1.4% 100%
Source: Hemson Consulting Ltd. based on Statistics Canada, National Household Survey and Census of Population, 2001 & 2011. Figures are rounded.
The Region experienced a net addition of 2,500 jobs over 2001 to 2011, growing by 1.5%. This modest level of growth however, includes very high rates of growth in the west Niagara communities of Grimsby and West Lincoln as well as job declines in nearly half of the Region’s local municipalities.
Recent trends in employed residents and job opportunities at the local municipal level suggest that there is potential for improving economic health within the Region and point to the importance of initiatives such as the Phase 1 & 2 Employment Land Strategy and the Niagara Economic Growth Strategy. There are many opportunities to enhance Niagara’s future economic outlook, an objective which the Region and local municipalities are actively working towards.
16
HEMSON
B. FUTURE OUTLOOK
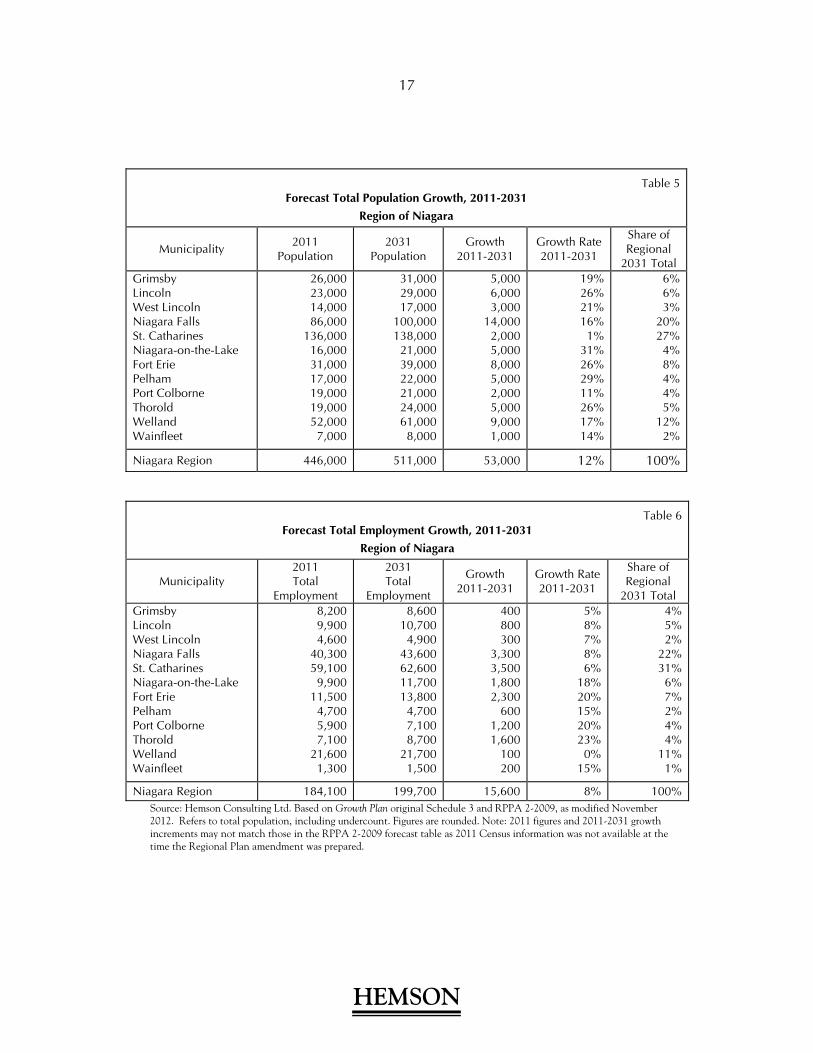
Notwithstanding modest growth in Niagara’s population, housing and employment base over the last decade, the Region is anticipated to add nearly 70,000 residents and 16,000 jobs over the 2011 to 2031 horizon, reaching a total of 511,000 residents and 218,000 jobs at 2031.
Growth Plan Schedule 3 provides the population and employment forecasts that the Region must plan to and the Region has allocated this growth to each local municipality through RPPA 2-20093. Planned population and employment growth as anticipated under the Growth Plan and RPPA 2-2009 is shown in Tables 5 and 6 on the following page.
3 Under Amendment 2 to the Growth Plan which updates the Schedule 3 forecasts and extends them to 2041, the Region is anticipated to see somewhat higher levels of growth although for phasing strategy purposes the Region is still planning to original Schedule 3 forecast growth, owing to the transition regulations related to Amendment 2.
17
HEMSON
Table 5Forecast Total Population Growth, 2011-2031
Region of Niagara
Municipality 2011
Population 2031
Population Growth
2011-2031 Growth Rate 2011-2031
Share of Regional
2031 Total Grimsby Lincoln West Lincoln Niagara Falls St. Catharines Niagara-on-the-Lake Fort Erie Pelham Port Colborne Thorold Welland Wainfleet
26,000 23,000 14,000 86,000
136,000 16,000 31,000 17,000 19,000 19,000 52,000 7,000
31,000 29,000 17,000
100,000 138,000
21,000 39,000 22,000 21,000 24,000 61,000 8,000
5,000 6,000 3,000
14,000 2,000 5,000 8,000 5,000 2,000 5,000 9,000 1,000
19% 26% 21% 16% 1%
31% 26% 29% 11% 26% 17% 14%
6%6%3%
20%27%4%8%4%4%5%
12%2%
Niagara Region 446,000 511,000 53,000 12% 100%
Table 6Forecast Total Employment Growth, 2011-2031
Region of Niagara
Municipality 2011 Total
Employment
2031 Total
Employment
Growth 2011-2031
Growth Rate 2011-2031
Share of Regional
2031 Total Grimsby Lincoln West Lincoln Niagara Falls St. Catharines Niagara-on-the-Lake Fort Erie Pelham Port Colborne Thorold Welland Wainfleet
8,200 9,900 4,600
40,300 59,100 9,900
11,500 4,700 5,900 7,100
21,600 1,300
8,600 10,700 4,900
43,600 62,600 11,700 13,800 4,700 7,100 8,700
21,700 1,500
400 800 300
3,300 3,500 1,800 2,300
600 1,200 1,600
100 200
5% 8% 7% 8% 6%
18% 20% 15% 20% 23% 0%
15%
4%5%2%
22%31%6%7%2%4%4%
11%1%
Niagara Region 184,100 199,700 15,600 8% 100%Source: Hemson Consulting Ltd. Based on Growth Plan original Schedule 3 and RPPA 2-2009, as modified November 2012. Refers to total population, including undercount. Figures are rounded. Note: 2011 figures and 2011-2031 growth increments may not match those in the RPPA 2-2009 forecast table as 2011 Census information was not available at the time the Regional Plan amendment was prepared.
18
HEMSON
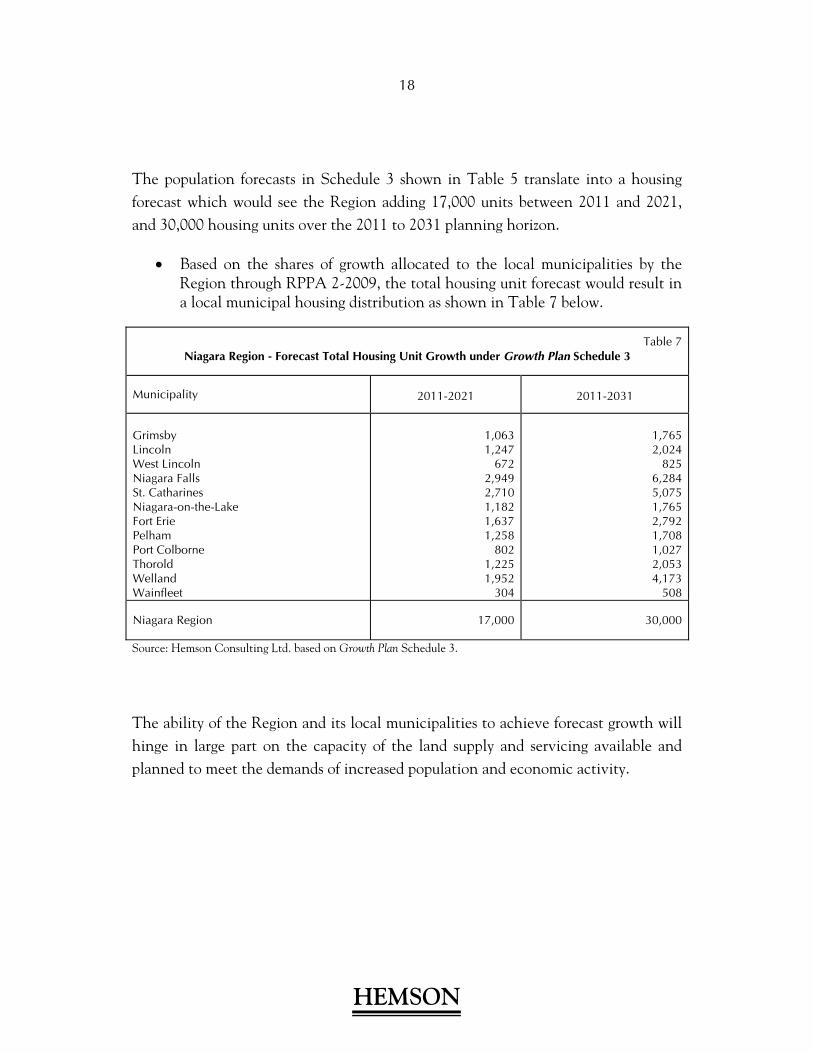
The population forecasts in Schedule 3 shown in Table 5 translate into a housing forecast which would see the Region adding 17,000 units between 2011 and 2021, and 30,000 housing units over the 2011 to 2031 planning horizon.
Based on the shares of growth allocated to the local municipalities by the Region through RPPA 2-2009, the total housing unit forecast would result in a local municipal housing distribution as shown in Table 7 below.
Table 7Niagara Region - Forecast Total Housing Unit Growth under Growth Plan Schedule 3
Municipality 2011-2021 2011-2031
Grimsby Lincoln West Lincoln Niagara Falls St. Catharines Niagara-on-the-Lake Fort Erie Pelham Port Colborne Thorold Welland Wainfleet
1,063 1,247
672 2,949 2,710 1,182 1,637 1,258
802 1,225 1,952 304
1,765 2,024
825 6,284 5,075 1,765 2,7921,708
1,027 2,053 4,173 508
Niagara Region 17,000 30,000
Source: Hemson Consulting Ltd. based on Growth Plan Schedule 3.
The ability of the Region and its local municipalities to achieve forecast growth will hinge in large part on the capacity of the land supply and servicing available and planned to meet the demands of increased population and economic activity.
19
HEMSON
C. CAPACITY TO ACCOMMODATE GROWTH
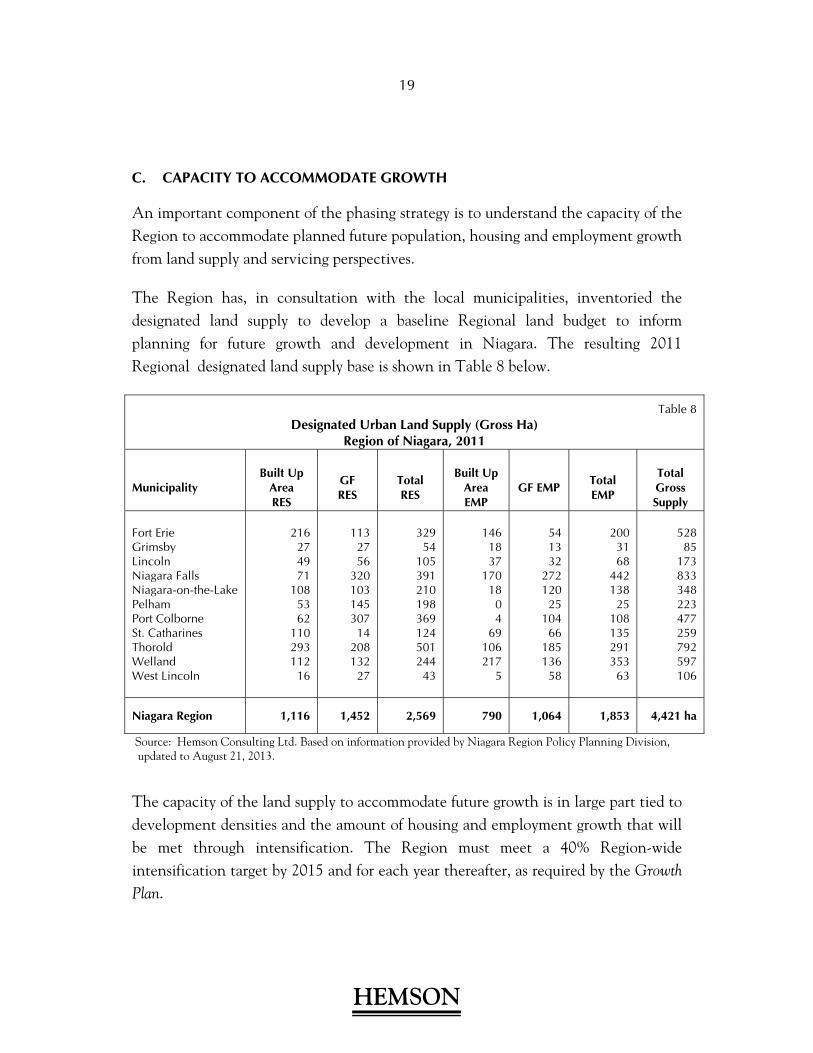
An important component of the phasing strategy is to understand the capacity of the Region to accommodate planned future population, housing and employment growth from land supply and servicing perspectives.
The Region has, in consultation with the local municipalities, inventoried the designated land supply to develop a baseline Regional land budget to inform planning for future growth and development in Niagara. The resulting 2011 Regional designated land supply base is shown in Table 8 below.
Table 8Designated Urban Land Supply (Gross Ha)
Region of Niagara, 2011
Municipality
Built Up
Area RES
GF RES
Total RES
Built Up
Area EMP
GF EMP
Total EMP
Total Gross Supply
Fort Erie Grimsby Lincoln Niagara Falls Niagara-on-the-Lake Pelham Port Colborne St. Catharines Thorold Welland West Lincoln
216 27 49 71
108 53 62
110 293 112 16
1132756
32010314530714
20813227
32954
10539121019836912450124443
1461837
17018
04
69106217
5
541332
27212025
10466
18513658
200 31 68
442 138 25
108 135 291 353 63
52885
173833348223477259792597106
Niagara Region 1,116 1,452 2,569 790 1,064 1,853 4,421 ha
Source: Hemson Consulting Ltd. Based on information provided by Niagara Region Policy Planning Division, updated to August 21, 2013.
The capacity of the land supply to accommodate future growth is in large part tied to development densities and the amount of housing and employment growth that will be met through intensification. The Region must meet a 40% Region-wide intensification target by 2015 and for each year thereafter, as required by the Growth Plan.
20
HEMSON
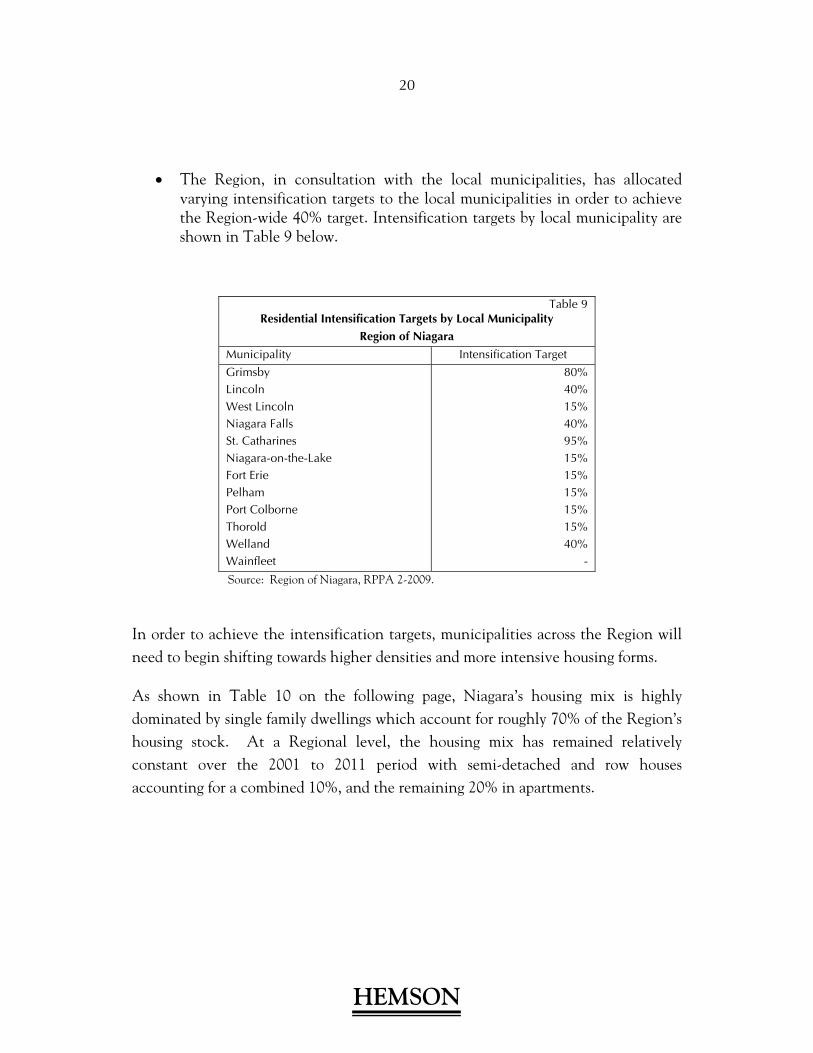
The Region, in consultation with the local municipalities, has allocated varying intensification targets to the local municipalities in order to achieve the Region-wide 40% target. Intensification targets by local municipality are shown in Table 9 below.
Table 9 Residential Intensification Targets by Local Municipality
Region of Niagara
Municipality Intensification Target Grimsby Lincoln West Lincoln Niagara Falls St. Catharines Niagara-on-the-Lake Fort Erie Pelham Port Colborne Thorold Welland Wainfleet
80% 40% 15% 40% 95% 15% 15% 15% 15% 15% 40%
-
Source: Region of Niagara, RPPA 2-2009.
In order to achieve the intensification targets, municipalities across the Region will need to begin shifting towards higher densities and more intensive housing forms.
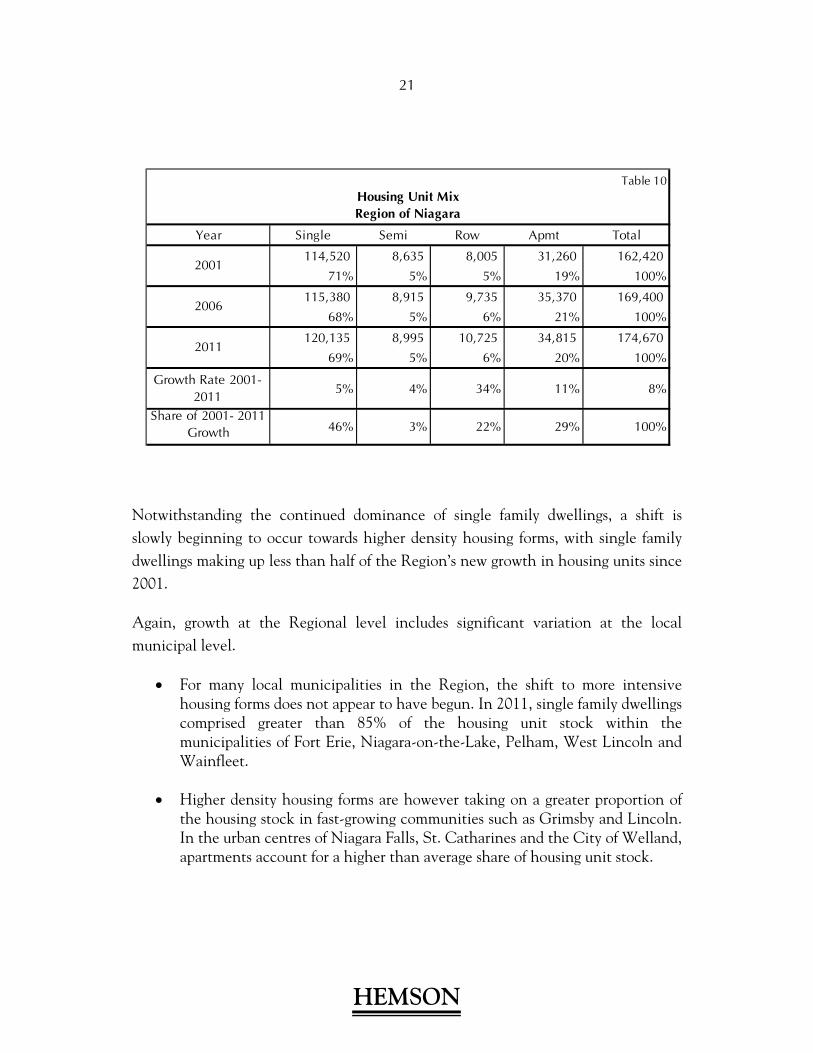
As shown in Table 10 on the following page, Niagara’s housing mix is highly dominated by single family dwellings which account for roughly 70% of the Region’s housing stock. At a Regional level, the housing mix has remained relatively constant over the 2001 to 2011 period with semi-detached and row houses accounting for a combined 10%, and the remaining 20% in apartments.
21
HEMSON
Notwithstanding the continued dominance of single family dwellings, a shift is slowly beginning to occur towards higher density housing forms, with single family dwellings making up less than half of the Region’s new growth in housing units since 2001.
Again, growth at the Regional level includes significant variation at the local municipal level.
For many local municipalities in the Region, the shift to more intensive housing forms does not appear to have begun. In 2011, single family dwellings comprised greater than 85% of the housing unit stock within the municipalities of Fort Erie, Niagara-on-the-Lake, Pelham, West Lincoln and Wainfleet.
Higher density housing forms are however taking on a greater proportion of the housing stock in fast-growing communities such as Grimsby and Lincoln. In the urban centres of Niagara Falls, St. Catharines and the City of Welland, apartments account for a higher than average share of housing unit stock.
Table 10
Year Single Semi Row Apmt Total
114,520 8,635 8,005 31,260 162,420
71% 5% 5% 19% 100%
115,380 8,915 9,735 35,370 169,400
68% 5% 6% 21% 100%
120,135 8,995 10,725 34,815 174,670
69% 5% 6% 20% 100%
Growth Rate 2001-2011
5% 4% 34% 11% 8%
Share of 2001- 2011 Growth 46% 3% 22% 29% 100%
2006
2011
Housing Unit Mix Region of Niagara
2001
22
HEMSON
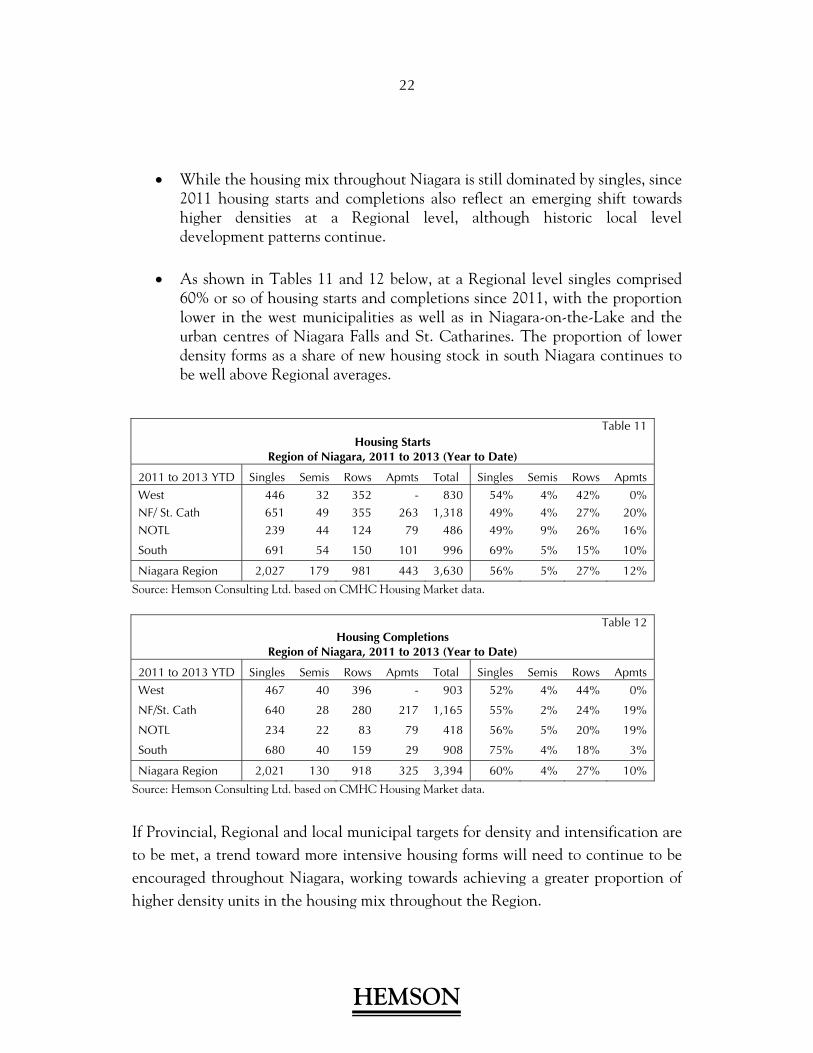
While the housing mix throughout Niagara is still dominated by singles, since 2011 housing starts and completions also reflect an emerging shift towards higher densities at a Regional level, although historic local level development patterns continue.
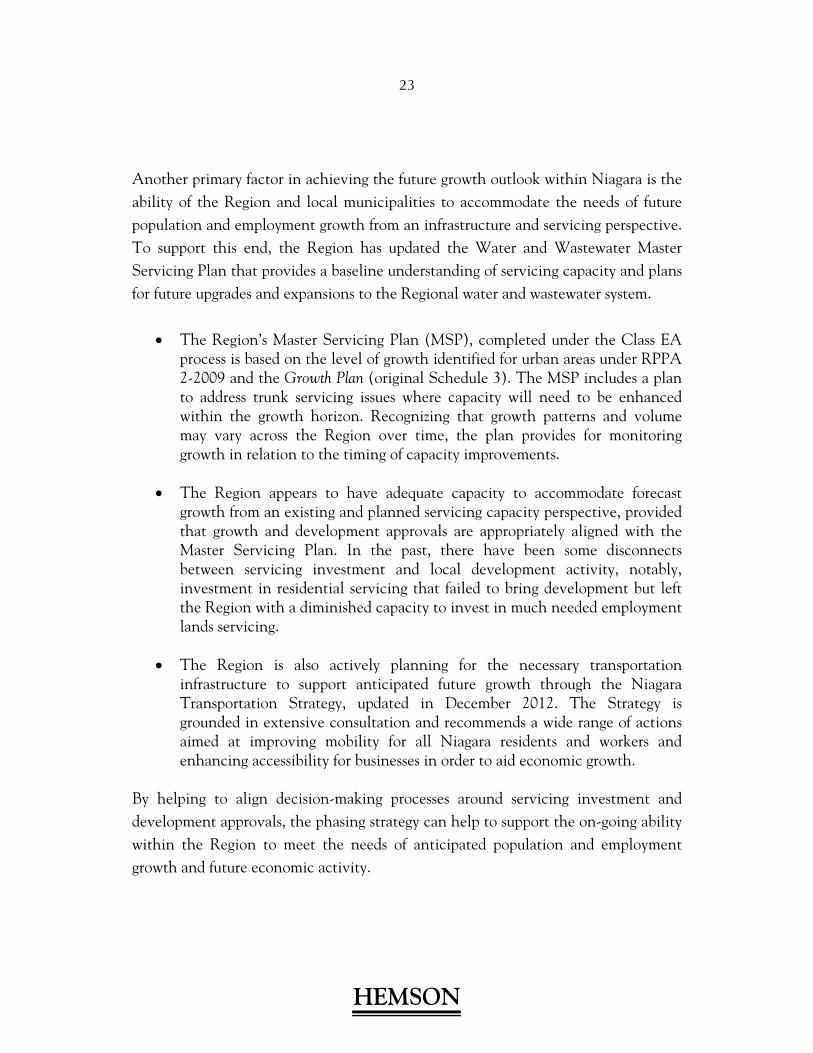
As shown in Tables 11 and 12 below, at a Regional level singles comprised
60% or so of housing starts and completions since 2011, with the proportion lower in the west municipalities as well as in Niagara-on-the-Lake and the urban centres of Niagara Falls and St. Catharines. The proportion of lower density forms as a share of new housing stock in south Niagara continues to be well above Regional averages.
Table 11 Housing Starts
Region of Niagara, 2011 to 2013 (Year to Date)
2011 to 2013 YTD Singles Semis Rows Apmts Total Singles Semis Rows Apmts West 446 32 352 - 830 54% 4% 42% 0% NF/ St. Cath 651 49 355 263 1,318 49% 4% 27% 20% NOTL 239 44 124 79 486 49% 9% 26% 16%
South 691 54 150 101 996 69% 5% 15% 10%
Niagara Region 2,027 179 981 443 3,630 56% 5% 27% 12%
Source: Hemson Consulting Ltd. based on CMHC Housing Market data.
Table 12 Housing Completions
Region of Niagara, 2011 to 2013 (Year to Date)
2011 to 2013 YTD Singles Semis Rows Apmts Total Singles Semis Rows Apmts West 467 40 396 - 903 52% 4% 44% 0%
NF/St. Cath 640 28 280 217 1,165 55% 2% 24% 19%
NOTL 234 22 83 79 418 56% 5% 20% 19%
South 680 40 159 29 908 75% 4% 18% 3%
Niagara Region 2,021 130 918 325 3,394 60% 4% 27% 10%
Source: Hemson Consulting Ltd. based on CMHC Housing Market data.
If Provincial, Regional and local municipal targets for density and intensification are to be met, a trend toward more intensive housing forms will need to continue to be encouraged throughout Niagara, working towards achieving a greater proportion of higher density units in the housing mix throughout the Region.
23
HEMSON
Another primary factor in achieving the future growth outlook within Niagara is the ability of the Region and local municipalities to accommodate the needs of future population and employment growth from an infrastructure and servicing perspective. To support this end, the Region has updated the Water and Wastewater Master Servicing Plan that provides a baseline understanding of servicing capacity and plans for future upgrades and expansions to the Regional water and wastewater system.
The Region’s Master Servicing Plan (MSP), completed under the Class EA process is based on the level of growth identified for urban areas under RPPA 2-2009 and the Growth Plan (original Schedule 3). The MSP includes a plan to address trunk servicing issues where capacity will need to be enhanced within the growth horizon. Recognizing that growth patterns and volume may vary across the Region over time, the plan provides for monitoring growth in relation to the timing of capacity improvements.
The Region appears to have adequate capacity to accommodate forecast growth from an existing and planned servicing capacity perspective, provided that growth and development approvals are appropriately aligned with the Master Servicing Plan. In the past, there have been some disconnects between servicing investment and local development activity, notably, investment in residential servicing that failed to bring development but left the Region with a diminished capacity to invest in much needed employment lands servicing.
The Region is also actively planning for the necessary transportation infrastructure to support anticipated future growth through the Niagara Transportation Strategy, updated in December 2012. The Strategy is grounded in extensive consultation and recommends a wide range of actions aimed at improving mobility for all Niagara residents and workers and enhancing accessibility for businesses in order to aid economic growth.
By helping to align decision-making processes around servicing investment and development approvals, the phasing strategy can help to support the on-going ability within the Region to meet the needs of anticipated population and employment growth and future economic activity.
24
HEMSON
Niagara’s modest growth over the 2001 to 2011 period was characterized by significant variation in rates and shares of Regional growth at the local municipal level. Population and employment has remained largely concentrated in the urban centres of central Niagara, while communities in the western portion of the Region have experienced markedly high growth rates in population and housing. Many south Niagara municipalities saw declines in population base and jobs over the census decade. Notwithstanding a slow growth decade, the Region is anticipated to grow steadily to 2031, driven by market factors and planning policy. The phasing policy amendment will support Provincial and Regional growth management objectives, providing a framework for local decision-making and planning future urban growth and development that supports a healthy growth outlook and a shared vision for the future of Niagara. In order to understand and build on a shared vision, key stakeholder consultation was undertaken at various stages in the phasing strategy project, as described in the next chapter of this report.
25
HEMSON
III BEST PRACTICE REVIEW & CONSULTATION EFFORTS
The adoption of an effective phasing policy amendment is dependent on the support of local municipalities and key stakeholders in the development industry. Urban Areas across the Region vary in size, levels of development intensity, and economic and demographic characteristics. Additionally, different parts of the Region enjoy different relationships within the economic life of the Region, notably in respect to ties to the economy of the Greater Toronto Area and Hamilton. The policies that emerge from this project will support a shared vision of where the Region is going, and how it is going to get there. In an effort to understand the differences across the Region and begin to develop some form of consensus with respect to phasing policy, two rounds of consultations with stakeholders were conducted. The following summarizes the important input they contributed.
A. ROUND ONE: ISSUES AND OPPORTUNITIES
In May a number of workshop sessions were held with key stakeholders to discuss issues and opportunities around the topic of including a phasing policy section within the Regional Policy Plan. Planning staff members from the local municipalities were consulted, along with Regional staff responsible for major infrastructure, economic development and planning approvals. The regional Chamber of Commerce, homebuilders’ association and school board representatives were also consulted in this first round of consultation along with Provincial policy staff from the Ministries of Infrastructure and Municipal Affairs and Housing.
Comments regarding opportunities that might shape growth and the issues that stakeholders face in dealing with growth management were documented in our first phase report: Regional Development Phasing: Issues and Opportunities, August 21, 2013.
26
HEMSON
We heard that proposed phasing policies should address the following Issues:
Mismatch between land supply and demand for both residential and employment.
Policy and market disconnect.
Legacy of draft plans of subdivision not being taken up by the market.
These first three issues are related and speak to long standing policy objectives to stimulate growth in the southern part of the Region. Meanwhile, municipalities in the western part of the Region have emerged as a distinct housing sub-market tied to the prospects of the labour market in the western part of the GTAH. While some homebuilders based in Hamilton are also active in the western part of Niagara Region, their contributions here serve to meet the housing demand arising from the growth forecast for Niagara. There is a designated land supply within Hamilton that will serve to meet the growth allocated to Hamilton in the Growth Plan.
The fixed urban boundaries and Greenbelt boundaries in north-west Niagara will necessitate higher densities in this area in the future. While some commented that planning should follow the market there were also suggestions that strengthened planning policy coupled with incentives could shift the market to realize Regional and local objectives for managing growth.
Different levels of commitment for servicing investment across the Region were noted, highlighting the need to better align capacity with growth potential.
A lack of co-ordination between levels of government was also cited as an area for potential improvement in effectively managing growth in the Region.
These issues touch on the desire for Provincial investment to align with Regional and local policies and servicing priorities. Comments in this vein also reflected the need to better align local servicing connections with the extension of Regional services.
27
HEMSON
Employment lands continue to be converted to residential.
There is a need to have designated employment lands “shovel-ready”; that is, fully serviced.
When approvals are granted to convert greenfield employment lands to residential use Regional service allocations are affected. Furthermore, this reassignment affects the ability to attract new business investment to highly marketable locations.
There is a lack of jobs across the Region.
Demographic trends present challenges to improving local economy.
Phasing policy may not directly address these latter two issues, but implementation measures to ensure cohesive growth can work towards a change in these patterns. The demographic trend toward an aging population cannot be influenced without growing the local economy and making Niagara an attractive and prosperous location for young families. Protecting employment lands and facilitating investment will help in this vein.
Significant opportunities are on the horizon which, if managed with effective phasing of new growth, could lead to economic growth and the creation of complete communities and more sustainable urban development:
There is ample residential and employment land supply4 and servicing capacity to accommodate anticipated growth. End-of-pipe capacity does not appear to pose a constraint to reaching Growth Plan Schedule 3 2031 forecast growth. Connections are needed in strategic locations and are planned for through the Region’s Water and Wastewater Servicing Master Plan.
4 Refers to the amount of designated land Region-wide to accommodate forecast housing growth – the uptake of lands at the local level may result in shortages or surpluses owing to varied market demand factors across the Region. It is also noted that in some cases, servicing capacity at the local level may not be aligned with market demand.
28
HEMSON
Transportation system improvements may help to open up growth throughout the Region, notably in the south of the Region. The prospect of the NGTA Corridor in particular could enhance the Region’s connectivity to the GTAH market. Improved public transit links were pointed to as key to attracting workers in the growing sectors of tourism, culture and post-secondary education. Given present commuting patterns, it is important to continue to work towards a Region-wide integrated transit framework.
GO Transit expansion could be a catalyst for growth – but will it bring economic investment and jobs or will it merely create bedroom communities for the Greater Toronto and Hamilton labour markets?
Increased co-ordination between government levels and branches is evidenced by institutional investment in Downtown St. Catharines, the Region’s only Urban Growth Centre designated in the Growth Plan and in the selection of a site in south Niagara Falls for a new hospital to serve the southern part of the Region.
Secondary plans can be a useful implementation strategy to implement phasing: a tool that is not fully employed across the Region. There is an opportunity for local and Regional planners to discuss best practices in this area.
Niagara’s Employment Lands Strategy and incentives should attract business investment. These recent incentives need time to develop success stories; hence considerable interest was expressed in protecting strategic employment lands. Increasing the local employment base increases the desirability of local housing markets which improves the overall viability of the community as it evolves over the longer term.
Planning approvals for higher densities are beginning to occur in some locations, suggesting housing market shifts in some local municipalities may be beginning which can help to achieve intensification targets.
Local plans have forecasts and policies to support growth and intensification – they are positioned to support phasing.
A number of potential “game changers” were also identified. These are potential developments or investments that could affect the magnitude, timing and location of development in the Region. Game changers “for the better” include:
29
HEMSON
The mid-peninsula highway;
Extension of GO Transit;
Continued investment in post-secondary education facilities and related research facilities;
New hospital in southern Niagara Falls;
Motor Speedway in Fort Erie;
Economic Growth Strategy;
Performing Arts Centre in Downtown St. Catharines.
B. JURISDICTIONAL REVIEW AND BEST PRACTICES
The requirement to meet a density target of 50 residents and jobs combined per hectare has raised the importance of phasing strategies to manage growth on Designated Greenfields Area lands. The Province and Regional municipalities are looking to phasing as a means to curb urban sprawl, avoid unwarranted expansions, ensure urban expansion is contiguous with the built area; ensure the cost-effective extension of urban services; and to rationalize urban development in cases of an oversupply of designated lands. A review of two-tier planning jurisdictions revealed a range of approaches to dealing with phasing throughout the Greater Golden Horseshoe.
Intensification is a priority for all municipalities in the GGH. All regions are targeting at least 40% of new residential growth to be achieved within existing Built Up Areas of the Region. Some assign minimum intensification targets to local municipalities, while others leave it to local municipalities to address intensification. The Halton approach may provide the most explicit direction in this regard, tabling housing units to be built within the Built-up Area and on Designated Greenfields at five year increments for each local municipality within the Region.
Many upper-tier municipalities defer the specifics of phasing to the local municipalities; sometimes requiring local municipalities to address phasing in
30
HEMSON
their official plans; for some the requirement for local phasing is “encouraged”. Still others identify phasing as an issue to be dealt with through a plan amendment exercise to expand the urban area.
Phasing is implied in some cases by the inclusion in a regional plan of specific population and employment targets in 5-year increments for each local municipality, and requiring phasing at the local level to address regional policy directives with respect to infrastructure and the environment.
Many upper-tier municipalities require the preparation of secondary plans by local municipalities and the alignment of local phasing of development with Regional transportation, infrastructure and servicing plans, while speaking to the development of complete communities.
Explicit direction is sometimes provided regarding build out requirements in advance of releasing next phase lands. York Region, for example, specifies the sequencing of growth in Designated Greenfields by requiring 75% of one “block” of new community to be built prior to the next phase beginning. Regional policy also requires “sequencing plans” within secondary plans that local municipalities develop.
Phasing is sometimes explicitly articulated, including maps of lands for near-term and long-term growth, within the regional plan. This usually reflects the ability of regional services to be extended to specific lands.
An emerging approach is the development of a detailed upper-tier land budget as a basis for phasing, such as the approach taken in the new Simcoe County Official Plan. Local municipalities are required to track and report to the upper-tier on an annual basis with respect to residential and employment land absorption within the built boundary and on greenfields, building and occupancy permits, status of planning approvals on vacant parcels and progress towards density and intensification targets.
31
HEMSON
C. ROUND TWO: APPROACHES TO PHASING POLICY
On September 13, 2013 a second round of consultation was held with many of the round one stakeholders as well as additional participants from the development industry. Following a presentation of the issues and opportunities as well as a summary of growth prospects for the Region, stakeholders were grouped into tables of eight and tasked with developing a consensus response to a range of options for modeling a phasing policy amendment.
The GGH upper-tier jurisdictional review was used as a basis to identify degrees of policy prescriptiveness in terms of relative roles of the Region and local municipalities in seven policy areas:
role of local municipalities; coordination; timing; mapping; secondary plans; intensification; and employment areas.
32
HEMSON
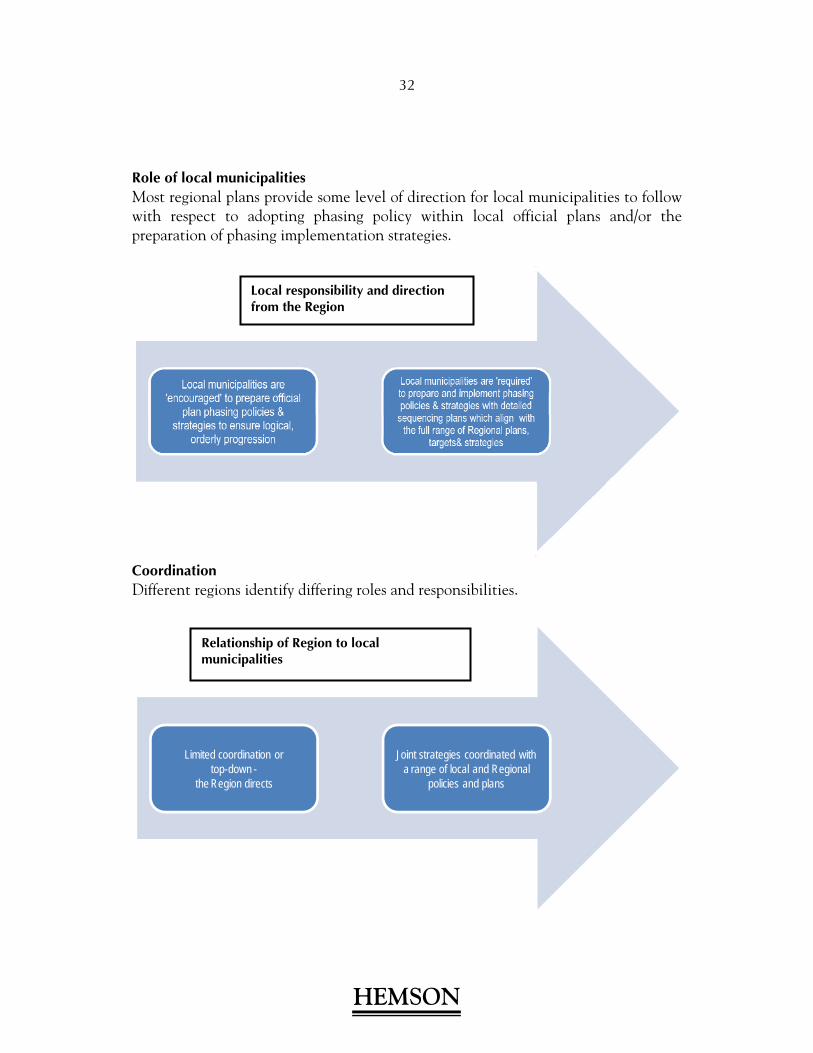
Role of local municipalities Most regional plans provide some level of direction for local municipalities to follow with respect to adopting phasing policy within local official plans and/or the preparation of phasing implementation strategies.
Coordination Different regions identify differing roles and responsibilities.
Limited coordination or top-down -
the Region directs
Joint strategies coordinated with a range of local and Regional
policies and plans
Local responsibility and direction from the Region
Relationship of Region to localmunicipalities
33
HEMSON
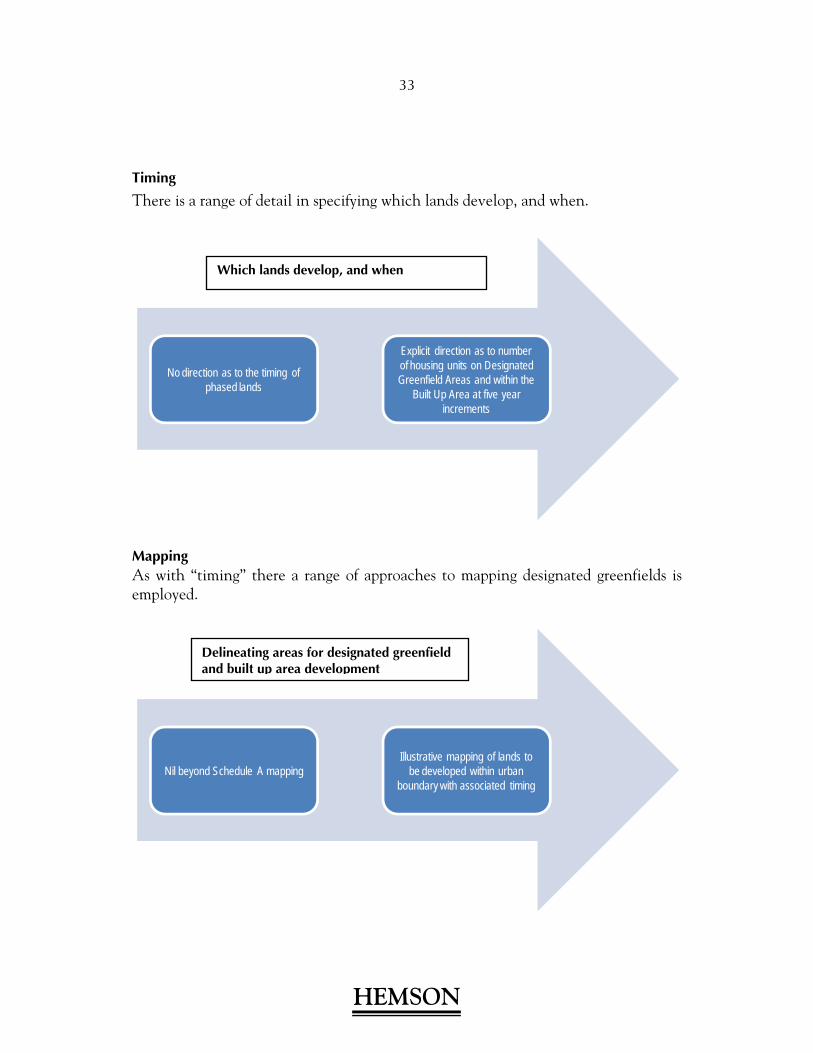
Timing
There is a range of detail in specifying which lands develop, and when.
Mapping As with “timing” there a range of approaches to mapping designated greenfields is employed.
No direction as to the timing of phased lands
Explicit direction as to number of housing units on Designated Greenfield Areas and within the
Built Up Area at five year increments
Nil beyond Schedule A mappingIllustrative mapping of lands to
be developed within urban boundary with associated timing
Which lands develop, and when
Delineating areas for designated greenfield and built up area development
34
HEMSON
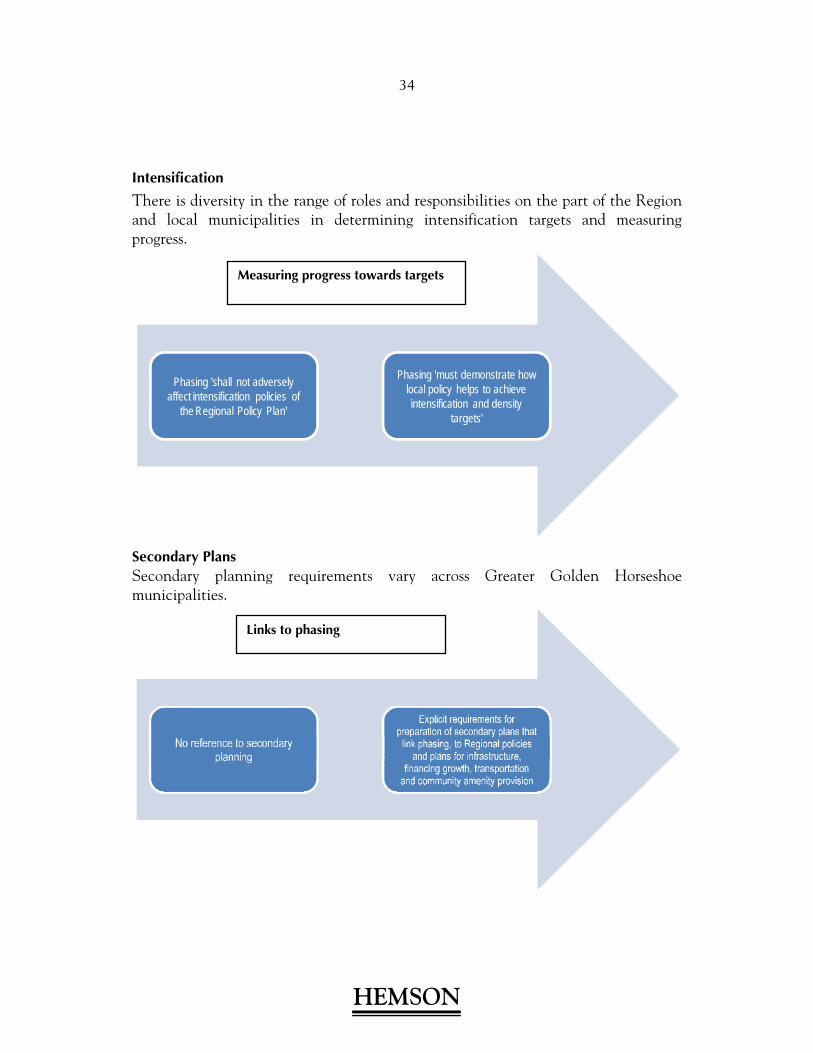
Intensification
There is diversity in the range of roles and responsibilities on the part of the Region and local municipalities in determining intensification targets and measuring progress.
Secondary Plans Secondary planning requirements vary across Greater Golden Horseshoe municipalities.
Phasing 'shall not adversely affect intensification policies of
the Regional Policy Plan'
Phasing 'must demonstrate how local policy helps to achieve intensification and density
targets'
Measuring progress towards targets
Links to phasing
35
HEMSON
Employment Areas: Few upper-tier plans clearly tie employment development to phasing.
An approach best-suited to Niagara needs to acknowledge an historic Regional level over-investment in residential servicing relative to employment lands and begin to prioritize investment in employment lands readiness.
The employment lands focussed strategies already underway in Niagara will help to address a shortage of employment opportunities and support economic growth in the Region. There is a recognized need to enhance “shovel-ready” employment land opportunities in the Region.
The range of approaches identified in various upper-tier plans and presented to stakeholders for discussion is captured in the following summary statements:
Option 1: The features under Option 1 represented a relatively minimalist approach. Many aspects of this option appear to be most common among Outer-Ring regions/counties, with lower growth communities featuring ample land supply and limited urban expansion pressure. Here, the Region defers phasing policy largely to local municipalities; does not specify lands, timing or mapping of phased lands. The policy action terms feature: 'encourages' and 'may'. Case studies: Counties of Brant, Haldimand, Peterborough, Wellington and the City of Kawartha Lakes.
Option 2: Option 2 was somewhat more interventionist but represents a collaborative approach with examples found in both GTAH and the Outer-Ring. Generally, the upper-tier sets the framework within which local municipalities prepare phasing and secondary plans. No specification of timing or location of development lands. However, often found is a set of precursor requirements which must be met before the next phase of greenfield lands can be released. There is a greater emphasis on alignment of phasing with Regional servicing, infrastructure, community improvement and financing plans. Local municipalities maintain and report on land budget. Key action terms include 'shall' and 'required'. Case studies: –Regions of Peel, Simcoe, Waterloo and York.
36
HEMSON
Option 3: This is the most prescriptive approach and is found among high growth GTAH communities, especially those with limited greenfields designated for urban expansion. The upper-tier provides explicit direction for specific housing units by housing type, densities, timing and location of lands at 5 year intervals, with specific mapping related to an interim growth horizon and boundary, ie. 2021. Additional emphasis is given to the implementation component, with requirements not only to prepare phasing strategies and secondary plans but also to demonstrate achievement of Regional intensification targets and housing unit allocations to greenfield and built-up area lands. Such demonstration is a necessary precursor before the next phase of lands can be released. Key action terms include 'required' 'directed to' 'must demonstrate' Case studies: Regions of Halton, York and Durham.
What We Heard
The working groups discussed the phasing policy options at length and some degree of consensus emerged on many of the themes. In some cases, one option was favoured while others suggested wording refinements. Some groups saw fit to blend the features of two different options. The following is a phasing policy approach based on a synthesis of the commentary that emerged from the table groups, as well as incorporating additional written comments received after the session.
Role of Local Municipality
The Region and Area municipalities have collaborated to establish municipal shares of Growth Plan Schedule 3 forecasts for population and employment growth, as well as intensification targets which recognize the differential capacity for intensification. Area municipalities must plan to the growth allocations and targets contained within RPPA 2-2009. Area municipalities are encouraged to prepare local phasing strategies for greenfield areas and intensification areas, where appropriate, and reflect them in their official plans. Recognizing variations in the size of local municipalities and capacity to undertake a phasing strategy, the Region may provide direction and support for this exercise as needed. The Region maintains a Regional land budget which area municipalities monitor at the local level and report on annually to their Council and the Region.
37
HEMSON
Co-ordination The Region establishes the capacity for urban development setting the 2031 boundaries of Designated Greenfield Areas. Regional Water and Wastewater Master Servicing Plan identifies capacity constraints and plans to improve and / or extend servicing within the 2031 boundary based on the readiness of local municipalities through phasing, and based on realistic development opportunities within the servicing timeframe. Local municipalities are encouraged to co-ordinate phasing of urban development with local and regional servicing and infrastructure investment plans. Area municipal official plan updates and phasing policies shall align with Regional directions including: Regional Water and Wastewater Master Servicing Plan, Regional Transportation Strategy, Phase 1 & 2 Employment Lands Strategy and emerging recommendations from the Niagara Nodes and Corridors Study. Timing
In collaboration with local municipalities, the Region sets the 2031 boundaries and local municipalities are responsible for allocating growth on their respective Designated Greenfield Areas. Sequencing of growth outward toward the 2031 boundaries is important to ensure the creation of complete communities and the cost-effective extension of all municipal services. As both planned and achieved growth will continue to vary by municipality, local municipalities will monitor growth, including the sequencing of outward urban development and intensification, and will report on progress to the Region. Mapping
As shown on Schedule A of RPPA 2-2009, the 2031 boundary is established. Sequencing illustrations, for information purposes, will be prepared by the Region in collaboration with the local municipalities. No interim horizons will be illustrated on Schedule A, but it is recognized that secondary plans will identify priority areas to be developed within the 2031 boundaries.
Local municipalities can determine timing and location of phased
development within the Region’s 2031 urban
boundaries
38
HEMSON
Intensification
The Region and local municipalities have collaboratively determined intensification targets for each municipality’s contribution toward the Region-wide target of 40% intensification by 2015 and for each year thereafter. Local municipalities are encouraged to prepare intensification strategies to achieve their contribution toward the Region-wide target. Progress toward intensification targets is monitored locally and reported to the Region as a component of updating the Regional land budget and measuring progress towards Regional and local plan policies. Secondary Plans
Area municipalities are required to prepare detailed secondary plans for significant areas of greenfield undergoing urban development and are encouraged to prepare secondary plans for areas within the built boundary demonstrating intensification potential. Secondary plans should work towards the development of complete communities. Employment Areas
Area municipalities are required to align local planning for employment with Regional employment land studies and strategies and to prioritize the protection and development of serviced employment lands. Area municipalities should employ the range of tools available to encourage investment and development of strategic locations for economic growth that have been identified collaboratively through studies and strategies.
It is important to consider both the quantitative and
qualitative aspects of the land supply and demand
relationship in Niagara
39
HEMSON
IV CONCLUSIONS AND POLICY RECOMMENDATIONS
This report summarizes findings from background research, a best practices review of GGH upper-tier approaches to phasing policy, and stakeholder consultation. A baseline understanding of growth trends and development issues and opportunities characterizing Niagara was developed, working towards an appropriate approach to a phasing policy for the Region. Through this assignment a set of key principles emerged to guide development phasing along with a better understanding of the respective roles the Region and local municipalities should play in implementing phasing policy at the local level, working together towards a shared vision for healthy and sustainable growth and development.
A. PRINCIPLES TO GUIDE PHASING IN NIAGARA
A number of guiding principles emerged from the first round of consultation which can serve as an appropriate basis upon which to develop a phasing policy for Niagara.
Ensure cost effective and orderly development.
Align servicing capacity and infrastructure investment (trunk services, transportation, and community infrastructure), with designated land supply.
Enhance co-ordination between Province, Region and Local Municipalities.
Reinforce Regional Policy Plan Urban Structure objectives and a shared vision for the future of the Region.
Support economic growth and job creation by prioritizing employment lands servicing and investment.
To these, the second round of consultation contributed some important concepts to guide the drafting of policy.
Collaboration between Regional and local staff in determining the land supply, setting targets for greenfield growth and intensification.
40
HEMSON
Cooperation in monitoring and reporting on growth on Designated Greenfield Areas as well as toward intensification targets.
Flexibility at the Regional level in where and how the identified greenfield land supply is urbanized, recognizing differential market conditions across Niagara. The Region should not prioritize growth in one municipality over others.
B. REGIONAL AND LOCAL ROLES IN PHASING IMPLEMENTATION
The following outlines some concepts for moving forward. What follows may not represent a full consensus, but does build on the approaches most commonly identified as preferred through the working group discussions and subsequent feedback received. Key concepts emerging throughout the discussion include:
Collaboration Support Encourage Monitor Enable Complete communities Recognize differences across the region
The direction moving forward with a policy plan amendment includes the following priorities and roles and responsibilities for the Region and area municipalities. The Region:
Looks to the long term, establishes growth expectations for the Region to 2031 and beyond
Works collaboratively with local municipalities to identify lands to be urbanized to the horizon year of the Regional Policy Plan and establish specific growth targets for each local municipality by five-year increments
41
HEMSON
Collaborates with local municipalities to determine local shares of growth and intensification targets
Includes boundaries for Designated Greenfields in Schedule A of the Regional Policy Plan to the planning horizon (e.g. currently 2031), but no map of mid-term growth expectations. These first three items are already in part addressed through RPPA-2-2009.
Monitors urbanization and intensification with data supplied by the local municipalities
Maintains and updates the Regional land budget
Ensures plans for extending / improving regional trunk services and transportation services align with growth expectations
Enables, guides, supports local municipalities in preparation of phasing strategies to guide growth
Establishes financial incentives and tools to attract economic investment in appropriate locations.
Local Municipalities:
Prepare phasing strategies for growth within the Designated Greenfield boundaries
Prepare intensification strategies to meet the collaboratively established targets
Are guided by Regional servicing strategies and plans which identify near-term and mid-term capacity enhancements
Ensure local servicing aligns with Regional servicing plans for extension / enhancement and is based on realistic development potential
Prepare secondary plans to implement the Phasing Strategy, both for new development on designated greenfields and intensification in built up areas as appropriate
42
HEMSON
Approve development in appropriate locations in keeping with local and regional planning objectives and ability to service growth
Monitor growth and report to Region for updates to regional land budget and report on progress towards the achievement of local municipal intensification targets.
C. DRAFT PHASING POLICY AMENDMENT
Based on the analysis and consultation undertaken for this assignment, a proposed amendment to the Regional Policy Plan has been drafted and is attached as Appendix to this report. Once finalized, this policy will be adopted as an amendment to the ‘Implementation’ section of the RPP, reflecting the Region’s approach to phasing growth in Urban Areas and on Designated Greenfields to accommodate anticipated population and employment growth to 2031 and beyond as enumerated in Schedule B of RPPA 2-2009 and mapped on Schedule A. This policy will be relevant for future planning horizons determined through successive five-year reviews of the plan.
The policy amendment is consistent with the Provincial Policy Statement, 2005 and conforms to the policy directions of the Growth Plan, 2006. It is premised on the continuation of a collaborative approach to growth management among the Region and local municipalities, and reflects the principles, roles and responsibilities outlined above.
It is widely recognized that the Region and local municipalities place a high priority on economic development and job creation, adding to the importance of creating and maintaining an adequate supply of shovel-ready and marketable employment lands. As such, this phasing policy does not focus on limiting conditions for employment lands development but rather provides parameters for appropriately planning future residential development across the Region. The proposed phasing policy will work to ensure policy targets for intensification in Built-up Areas and density targets on Designated Greenfields Areas are met.
43
HEMSON
Implementation of phasing policy lies principally with local municipalities as they are the approval authorities, along with appropriate Regional planning and funding of major infrastructure. The Region will also play an important role in implementation by facilitating research into land supply and fostering collaboration including workshops into best practices in, for example, preparation of secondary plans and intensification studies.
The objective of building complete communities and achieving sustainable urban growth across the Region will be achieved if growth occurs in an orderly fashion, is contiguous with the existing urban fabric, and is in keeping with Regional infrastructure services constraints and plans.
The following proposed phasing policy amendment acknowledges the diversity of issues and opportunities with respect to managing growth across the Region and provides a framework within which the Region and local municipalities can work together towards a shared vision for future growth and urban development in Niagara.

44
HEMSON
APPENDIX
RPPA 8‐2013 Draft 1 Page 1
AMENDMENT NO. 8‐2013
TO THE OFFICIAL PLAN FOR THE NIAGARA PLANNING AREA
PART “A” ‐ THE PREAMBLE The preamble provides an explanation of the Amendment including the purpose, location, background, and basis of the policies, and implementation, but does not form part of this Amendment.
Title and Components Purpose of the Amendment Location of the Amendment Background Basis for the Amendment Implementation
PART “B” – THE AMENDMENT The Amendment describes the additions and/or modifications to the Official Plan for the Niagara Planning Area, which constitute Official Plan Amendment No. 8‐2013.
Text Changes PART “C” – THE APPENDICES The Appendices provide information, public participation and agency comments relevant to the Amendment, but do not form part of this Amendment.
RPPA 8‐2013 Draft 1 Page 2
PART “A” – THE PREAMBLE TITLE AND COMPONENTS: This document, when approved in accordance with Section 26 of the Planning Act, 1990, shall be known as Amendment 8‐2013 to the Official Plan of the Niagara Planning Area. Part “A” – The Preamble, contains background information and does not constitute part of this Amendment. Part “B” – The Amendment, consisting of map and text changes, constitutes Amendment 8‐2013 to the Official Plan of the Niagara Planning Area. Part “C” – The Appendices, does not constitute part of the Amendment. These Appendices contain information related to public involvement and agency comments associated with the Amendment. PURPOSE OF THE AMENDMENT: The purpose of this amendment is to:
a) To establish a development phasing strategy for the Region building on the growth management policy framework established through Regional Policy Plan Amendment 2‐2009;
b) To complete the conformity exercise with the Province’s Growth Plan for the Greater Golden Horseshoe (2006) and the Provincial Policy Statement (2005) which was initiated with Regional Policy Plan Amendment 2‐2009; and,
c) To establish a development phasing strategy which ensures a consistent approach across the Region to managing growth, while recognizing differing development conditions across the Region.
LOCATION OF THE AMENDMENT: This amendment applies to the entire Niagara Planning Area. BACKGROUND: Amendment 2‐2009 to the Official Plan for the Niagara Planning Area implemented the Growth Plan for the Greater Golden Horseshoe through an amendment to the Official Plan for the Niagara Planning Area. In particular, it updated the Region’s Policy Plan to align existing policies with the Province’s Growth Plan for the Greater Golden Horseshoe (2006) and the Provincial Policy Statement (2005); implemented strategic directions of Niagara’s Growth Management Strategy (Niagara 2031); and established a new urban vision for the long term growth and development of Niagara. Arising from that amendment a requirement was identified to establish a development phasing strategy for the Region in the Official Plan to complete the conformity exercise with the Growth Plan for the Greater Golden Horseshoe (2006) and the Provincial Policy Statement (2005). The phasing strategy is an implementation tool to assist in the management of anticipated growth in Designated Greenfield Areas and in Built‐Up Areas to appropriately plan for orderly and logical urban development in a manner which recognizes differing development opportunities across the Region, supports policy goals for sustainable and complete communities, and maximizes Regional and local servicing and infrastructure capacity and investment. The development phasing strategy will integrate with, and help to complete, the policy framework for managing growth and development in Niagara Region.
RPPA 8‐2013 Draft 1 Page 3
BASIS FOR THE AMENDMENT:
1. This Amendment implements and conforms to the Growth Plan for the Greater Golden Horseshoe (2006) and other Provincial Plans with respect to development phasing across the Region. The Amendment is consistent with the Provincial Policy Statement (2005).
2. The Amendment is consistent with Niagara’s Growth Management Strategy (Niagara 2031). Niagara’s Development Phasing Strategy (2013), and Regional Policy Plan Amendment 2‐2009.
3. The Amendment will provide for the addition of new policies which incorporate a development phasing strategy in the Official Plan for the Niagara Planning Area.
4. The Amendment is divided into sections, which constitute the Amendment:
a) Part I: Addition of new policies to the Implementation section of the Plan b) Part II: Alterations to Amendment 2‐2009
6. The Amendment was the subject of a Public Open House and a Public Meeting held under
the Planning Act on November 7, 2013 and December 4, 2013 respectively. Public and agency comments were addressed as part of the preparation of this Amendment.
7. Based on the Region’s review of the Planning Act, Growth Plan for the Greater Golden
Horseshoe (2006), other Provincial Plans, the Provincial Policy Statement (2005), the Regional Policy Plan, public consultation, and agency consultation, Regional staff is of the opinion that the Amendment is consistent with, and conforms to, Provincial and Regional policies and plans and, therefore, represents good planning.
IMPLEMENTATION: The Implementation Section of the Official Plan for the Niagara Planning Area shall apply where applicable.
RPPA 8‐2013 Draft 1 Page 4
PART “B” – THE AMENDMENT
Amendment 82013
To the Official Plan for the Niagara Planning Area
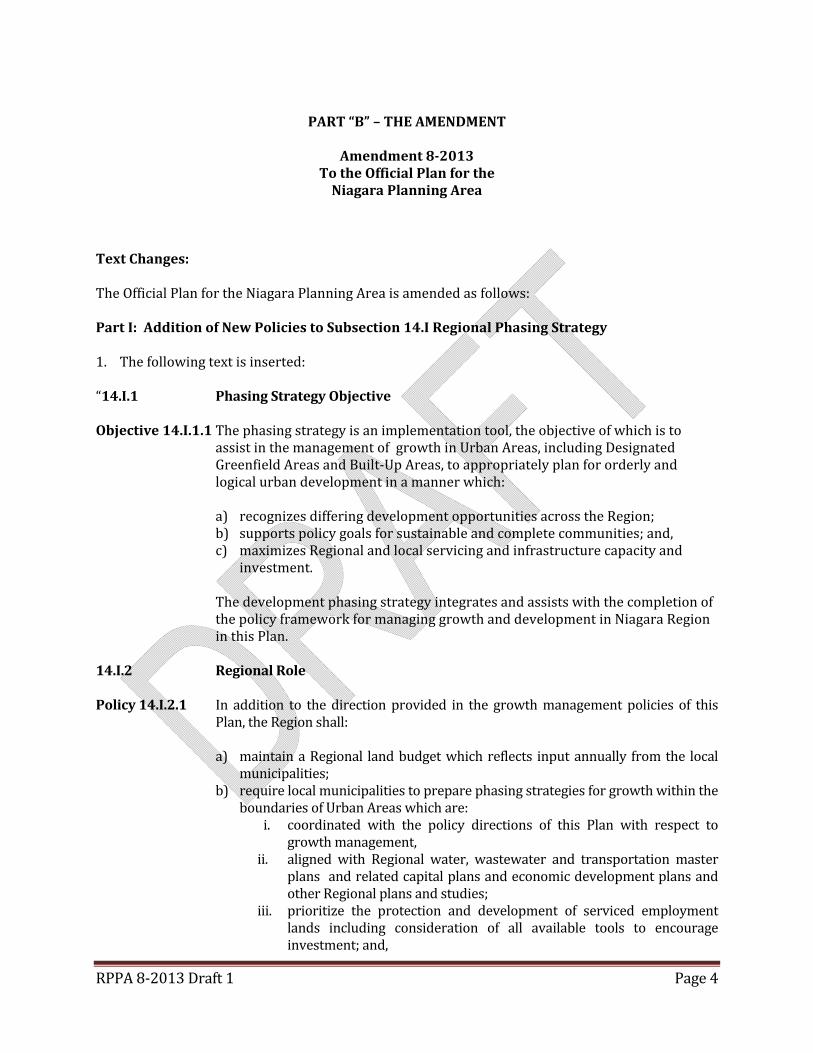
Text Changes: The Official Plan for the Niagara Planning Area is amended as follows: Part I: Addition of New Policies to Subsection 14.I Regional Phasing Strategy 1. The following text is inserted: “14.I.1 Phasing Strategy Objective
Objective 14.I.1.1 The phasing strategy is an implementation tool, the objective of which is to
assist in the management of growth in Urban Areas, including Designated Greenfield Areas and Built‐Up Areas, to appropriately plan for orderly and logical urban development in a manner which: a) recognizes differing development opportunities across the Region; b) supports policy goals for sustainable and complete communities; and, c) maximizes Regional and local servicing and infrastructure capacity and
investment.
The development phasing strategy integrates and assists with the completion of the policy framework for managing growth and development in Niagara Region in this Plan.
14.I.2 Regional Role Policy 14.I.2.1 In addition to the direction provided in the growth management policies of this
Plan, the Region shall: a) maintain a Regional land budget which reflects input annually from the local
municipalities; b) require local municipalities to prepare phasing strategies for growth within the
boundaries of Urban Areas which are: i. coordinated with the policy directions of this Plan with respect to
growth management, ii. aligned with Regional water, wastewater and transportation master
plans and related capital plans and economic development plans and other Regional plans and studies;
iii. prioritize the protection and development of serviced employment lands including consideration of all available tools to encourage investment; and,
RPPA 8‐2013 Draft 1 Page 5
iv. reflected in the local official plan. c) work with and support local municipalities in the preparation of phasing
strategies to guide growth as appropriate, including the preparation of sequencing illustrations for information purposes in collaboration with the local municipalities;
d) require local municipalities to prepare secondary plans for significant Greenfield Areas which shall generally be areas of 25 hectares or greater in size, and approve development which implements their Phasing Strategy; and,
e) work with local municipalities to develop intensification strategies and, where appropriate, secondary plans for areas within the Built Boundary to assist in the achievement of the local intensification target.
14.I.3 Local Municipal Role
Policy 14.I.3.1 Local municipalities shall:
a) prepare phasing strategies in conformity with the policies of this Plan
including Section 14.I.2 and such strategies will be incorporated in the local official plan, and reflected in secondary plans where appropriate, and through development approvals;
b) prepare secondary plans for significant Greenfield Areas and identify in secondary plans priority development areas in particular mixed use areas, employment areas, and major community facilities such as hospitals, universities and colleges, transportation hubs, and cultural and recreational facilities;
c) monitor and report to the local Council and the Region annually with respect to land supply, sequencing of greenfield development, progress toward the achievement of local intensification targets, population, housing, employment and other trends that may be required to update the Regional land budget; and,
d) undertake the preparation of intensification strategies, and, where appropriate, secondary plans for areas within the Built Boundary demonstrating intensification potential.”
Part II – Alterations to Amendment 22009 1. Policy 4.6 is amended by deleting subsection 4.6.1, 4.6.2 and 4.6.3 and replaced with a new
subsection 4.6.1 as follows:
“The Region shall implement the Regional Phasing Strategy in Section 14.I of this Plan.”
2. The following policies are renumbered:
Policy Number New Policy Number 4.6.4 4.6.24.6.5 4.6.34.6.6 4.6.44.6.7 4.6.5

RPPA 8‐2013 Draft 1 Page 6
PART “C” – THE APPENDICES