Embed Size (px)
Citation preview
Accepted Manuscript
Development, reliability, and validity of the Alberta Perinatal Stroke Project (APSP)Parental Outcome Measure
Taryn B. Bemister, MSc Brian L. Brooks, PhD Adam Kirton, MD, MSc, FRCPC
PII: S0887-8994(14)00087-3
DOI: 10.1016/j.pediatrneurol.2014.01.052
Reference: PNU 8272
To appear in: Pediatric Neurology
Received Date: 3 November 2013
Revised Date: 22 January 2014
Accepted Date: 28 January 2014
Please cite this article as: Bemister TB, Brooks BL, Kirton A, Development, reliability, and validity of theAlberta Perinatal Stroke Project (APSP) Parental Outcome Measure, Pediatric Neurology (2014), doi:10.1016/j.pediatrneurol.2014.01.052.
This is a PDF file of an unedited manuscript that has been accepted for publication. As a service toour customers we are providing this early version of the manuscript. The manuscript will undergocopyediting, typesetting, and review of the resulting proof before it is published in its final form. Pleasenote that during the production process errors may be discovered which could affect the content, and alllegal disclaimers that apply to the journal pertain.
MANUSCRIP
T
ACCEPTED
ACCEPTED MANUSCRIPT
Development, reliability, and validity of the Alberta Perinatal Stroke Project (APSP) Parental Outcome Measure
Taryn B. Bemister, MSc Department of Psychology, University of Calgary
Alberta Children’s Hospital Research Institute, University of Calgary Calgary, Alberta, Canada
Brian L. Brooks, PhD Neurosciences (Brain Injury and Rehabilitation Programs), Alberta Children’s Hospital Departments of Paediatrics and Clinical Neurosciences, University of Calgary Alberta
Children’s Hospital Research Institute, University of Calgary Calgary, Alberta, Canada
Adam Kirton MD, MSc, FRCPC Calgary Pediatric Stroke Program, Departments of Paediatrics and Clinical Neurosciences,
Alberta Children’s Hospital Research Institute, University of Calgary Calgary, Alberta, Canada
Word count: 3991
Address all correspondence to: Dr. Adam Kirton
Section of Neurology, Room C1-320 Alberta Children’s Hospital, 2888 Shaganappi Trail NW
Calgary, Alberta, Canada Phone: 403.955.7816 Fax: 403.955-7609
Running foot: APSP Parental Outcome Measure
MANUSCRIP
T
ACCEPTED
ACCEPTED MANUSCRIPT 2
APSP PARENTAL OUTCOME MEASURE
Abstract
BACKGROUND: Perinatal stroke is a leading cause of cerebral palsy and lifelong disability,
though parent and family outcomes have not yet been studied in this specific population. The
Alberta Perinatal Stroke Program (APSP) Parental Outcome Measure (POM) was developed as a
26-item questionnaire on the impact of perinatal stroke on parents and families. METHODS: The
items were derived from expert opinion and scientific literature on issues salient to parents of
children with perinatal stroke, including guilt and blame, which are not well captured in existing
measures of family impact. Data was collected from 82 mothers and 28 fathers who completed
the POM and related questionnaires (mean age: 39.5 years; mean child age: 7.4 years). Analyses
examined the POM’s internal consistency, test-retest reliability, validity, and factor structure.
RESULTS: The POM demonstrated three unique theoretical constructs: Psychosocial Impact,
Guilt, and Blame. The POM has excellent internal consistency (Cronbach’s α = .91) and very
good test-retest reliability over two to five weeks (r = .87). Regarding validity, the POM is
sensitive to condition severity, accounts for additional variance in parent outcomes, and strongly
correlates with measures of anxiety, depression, stress, quality of life, family functioning, and
parent adjustment. CONCLUSIONS: The POM contributes to the literature as the first brief
measure of family impact designed for parents of children with perinatal stroke.
Keywords: perinatal stroke, caregivers, family impact, parent impact, APSP Parental Outcome Measure, POM, reliability, validity
MANUSCRIP
T
ACCEPTED
ACCEPTED MANUSCRIPT 3
APSP PARENTAL OUTCOME MEASURE
Introduction
Perinatal stroke is a common but poorly understood focal cerebovascular brain injury
occurring between 20 weeks gestation and 28 days of postnatal life 1. With an incidence of more
than 1 in 2500 live births, it remains a leading cause of pediatric neurological disability and the
primary cause of hemiplegic cerebral palsy. While motor impairments are the most prevalent
deficit (affecting 60-80%), other common outcomes include developmental delays, cognitive
deficits, behavioural problems, and epilepsy 2, 3. Such morbidities last decades with potentially
severe and longstanding impacts on the child and family.
Parents of children with perinatal stroke not only need to adjust to their child’s diagnosis,
but also the additional caregiver demands that accompany raising a child with a disability.
Although there are currently no published studies on the impact of raising a child with perinatal
stoke, a myriad of research exists on the impact of raising a child with other neurological
conditions, such as cerebral palsy 4, epilepsy 5, and developmental disabilities 6. These studies
indicate that parents of children with neurological diagnoses tend to have poorer psychological
wellbeing than parents of children with typical development, albeit the majority of these families
adapt well. Recognizing the variation that exists in parent outcomes, researchers have begun to
focus on why some parents and families cope better than others 7.
Many caregiver stress models help explain differences in the impact of caring for a child
with a disability, the most influential in the literature being the Double ABCX Model 8.
According to this model, parent adaptation is based on the balance between the pile-up of
stressors and the parent's capabilities for meeting those demands. While the majority of research
studies in this area fail to note a conceptual framework (as highlighted by Turnbull and
colleagues 9), studies that assess the impact of pediatric disability on parents and families tend to
measure stressors and resources that are interpersonal, emotional, and physical in nature.
Parents of children with perinatal stroke may share many of the same stressors as parents
MANUSCRIP
T
ACCEPTED
ACCEPTED MANUSCRIPT 4
APSP PARENTAL OUTCOME MEASURE
of children with other disabilities and medical conditions, which are captured in widely used
questionnaires of family impact (e.g., Impact on Family Scale 10, Child Health Questionnaire 11,
Beach Centre Family Quality of Life Scale 12, and PedsQL Family Impact Module 13). These
questionnaires tend to measure family functioning, parent wellbeing (e.g., social, emotional, and
physical), and resources (e.g., finances and time). However, they fail to directly assess guilt and
blame, which has been noted as a salient concern among mothers of children with perinatal
stroke 14, but has received limited attention in the literature thus far.
Mothers of children with perinatal stroke may be highly susceptible to feelings of guilt
and blame because the approximate timing of the stroke is known, but the causes are not well
understood. Some mothers consequently turn to apparent perinatal events as possible
explanations, such as personal actions during pregnancy or medical staff actions approximating
delivery. Unaddressed, these feelings may exacerbate caregiver burden, depression, and anxiety,
as evidenced by previous studies on caregiver guilt 16-18. Feelings of guilt and blame may also
adversely affect parent adaptation to their child’s condition 19, 20, which consequently can have
detrimental effects on the child’s wellbeing 21. Furthermore, our clinical experiences suggest that
these feelings of guilt and blame are amendable to simple psycho-education interventions
regarding the generally unpreventable nature of perinatal stroke.
At this time, there is no existing measure of the impact of raising a child with a disability
or medical condition that quantifies parent guilt and blame. The Parent Experience of Childhood
Illness scale (PECI 22) is a family adaptation measure that examines a related but distinct
construct of ‘Guilt and Worry’. Thus, currently available family impact measures fail to assess
all of the issues salient to families affected by perinatal stroke.
The purpose of this study was to develop and validate a family impact measure designed
for parents affected by perinatal stroke. The questionnaire was constructed to quantify guilt and
blame, as well as assess the general impact of perinatal stroke on parents’ psychological
MANUSCRIP
T
ACCEPTED
ACCEPTED MANUSCRIPT 5
APSP PARENTAL OUTCOME MEASURE
wellbeing, personal activities, resources, and family functioning. We predicted that the
questionnaire would strongly correlate with other measures of family impact and emotional
wellbeing (stress, depression, and anxiety), while uniquely capturing parents’ sense of guilt and
blame.
Methods
Participants
Parents of children with perinatal stroke were identified through the Alberta Perinatal
Stroke Project (APSP), a population-based research cohort of >180 perinatal stroke patients in
southern Alberta. Inclusion criteria were biological parents of children 0-18 years with clinico-
radiographically confirmed perinatal stroke according to validated criteria (i.e., neonatal arterial
ischemic stroke, periventricular venous infarction, or arterial presumed perinatal stroke 23).
Children with neurological conditions not attributable to stroke and parents with less than Grade
9 education or unable to read English (self-report) were excluded to ensure comprehensibility of
the questionnaires.
Questionnaire Development
The APSP Parental Outcome Measure (POM) was developed by a multidisciplinary team
with expertise in perinatal stroke. Team members included a pediatric stroke neurologist (AK),
neuropsychologist (BB), doctoral clinical psychology student (TB), and stroke nurse (SR; see
acknowledgements). This team reviewed the literature on caring for children with disabilities and,
combined with their clinical experiences, created a list of 34 items relevant to parents of children
with perinatal stroke. The list included both resources and stressors (e.g., adequate support caring
for child and financial strain).
A draft of the POM was then distributed to 10 healthcare professionals familiar with the
target population and six parents of children with perinatal stroke. Feedback was obtained
regarding the POM’s item content, face validity, and wording. Recommendations included
MANUSCRIP
T
ACCEPTED
ACCEPTED MANUSCRIPT 6
APSP PARENTAL OUTCOME MEASURE
simplifying the wording (14 items), adding one item about family planning, and removing four
items due to redundancy.
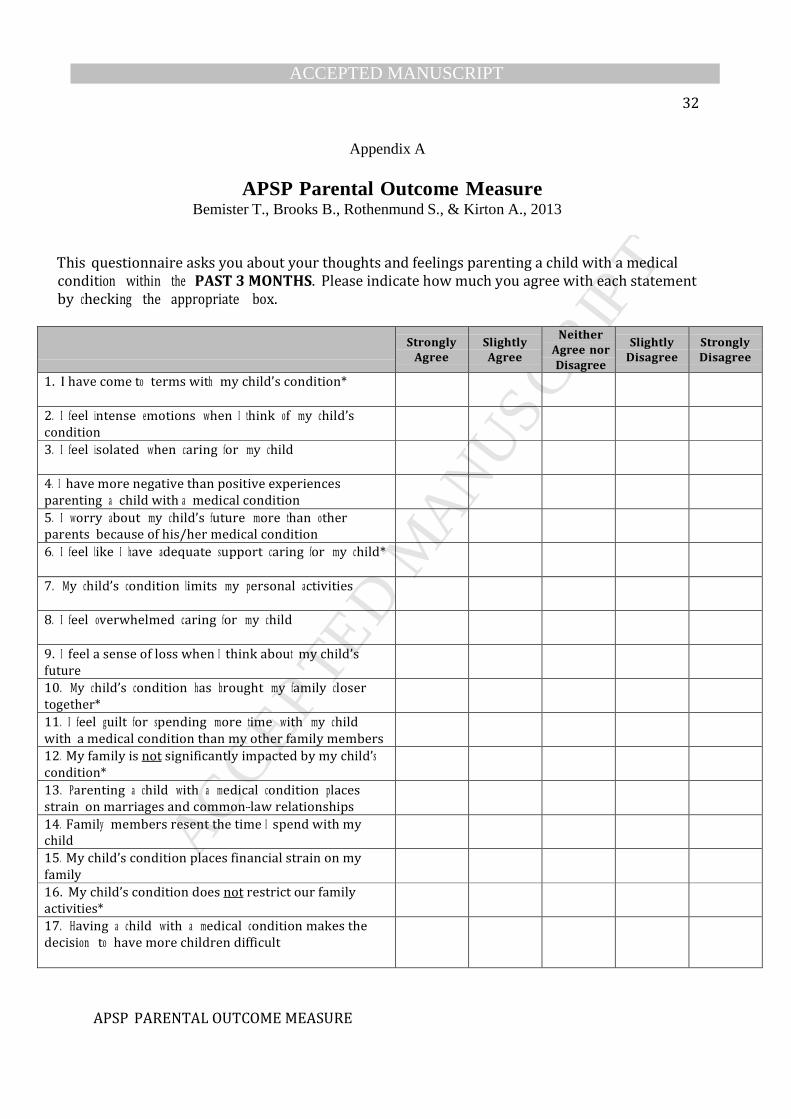
The resulting scale of 31 items was later revised to 26 items based on exploratory factor
analysis (see Appendix A for the scale). Each item is scored on a 5-point Likert scale from 0
(Strongly Disagree) to 4 (Strongly Agree) with higher scores indicating poorer functioning. The
final questionnaire takes approximately five minutes to complete and is at a Grade 7.6 reading
level (Flesch-Kincaid Grade Level).
Data Collection
Approval was obtained from the Conjoint Health Research Ethics Board at the University
of Calgary. APSP parents previously consented to be contacted for research were approached via
telephone or e-mail depending on their preference. The study was explained and informed consent
was obtained. Participants were e-mailed a URL to a battery of questionnaires, including the
POM, at Time Point 1 (closed survey design). They were able to save and alter their responses
prior to submission. Two weeks after submission, participants were e-mailed a second URL to the
POM (Time Point 2). Those failing to submit responses were e-mailed reminders after two weeks.
Participants received a $10 eGift card in recognition of their contribution.
Questionnaires were administered between August 2012 and June 2013 with the online
survey software, Qualtrics. Data were downloaded from Qualtrics and stored in a secure database
at the Alberta Children’s Hospital.
General Measures
Demographics. The Demographics Questionnaire is a 26-item scale created for this study to assess basic demographic information.
Anxiety and Depression. The Hospital Anxiety and Depression Scale (HADS 24) is a 14-
item scale that measures self-reported symptoms of anxiety (HADS-A) and depression (HADS-
D) within the past week. Comprehensive reviews have indicated that the subscales have good
reliability and validity 25, 26. Although the HADS was originally developed for medical patients in
MANUSCRIP
T
ACCEPTED
ACCEPTED MANUSCRIPT 7
APSP PARENTAL OUTCOME MEASURE
hospital settings, the scale has since been validated in community populations 25 and used among
populations similar to the current study 27, 28.
Perceived Stress. The Perceived Stress Scale (PSS 29) is a 14-item self-report measure that
generates a total score reflecting the extent to which situations are judged as being stressful. The
PSS is considered an effective tool for evaluating stress in parents of children with disabilities 30,
and the authors have demonstrated the scale’s reliability and validity among two college samples
and one community sample.
Family Impact Measures for Pediatric Health Conditions
Quality of Life and Family Functioning. The Pediatric Quality of Life Inventory-
Family Impact Module (PedsQL-FIM 13) measures the impact of pediatric chronic health
conditions on parent quality of life and family functioning. The scale consists of 36 self-report
items, which generate two summary scores (Family Functioning and Health-Related Quality of
Life) and a total score. The PedsQL-FIM has been validated in parents of children with and
without chronic conditions, demonstrating excellent internal consistency and convergent
validity in both populations 31, 32.
Psychosocial Impact, Guilt and Blame. The APSP Parental Outcome Measure (POM)
is a scale designed for parents of children with perinatal stroke to examine the impact of their
child’s condition on the family. The final scale consists of 26 items that examine psychosocial
impact, guilt, and blame. Evidence for the scale’s psychometric properties are gathered in this
study (see results).
Emotional Adjustment to Illness. The Parent Experience of Child Illness (PECI 22) is a
measure of parent adjustment to caring for a child with a chronic illness. The scale consists of 25
self-report items measuring four domains: 1) guilt and worry; 2) emotional resources; 3)
unresolved anger and sorrow; and 4) long-term uncertainty. The PECI was originally validated
with parents of children with brain tumors and cancer and has since been applied to parents of
MANUSCRIP
T
ACCEPTED
ACCEPTED MANUSCRIPT 8
APSP PARENTAL OUTCOME MEASURE
children with other chronic conditions 33. This questionnaire was chosen for comparison purposes
because it most closely resembles the POM in that it measures parent guilt and worry. To make it
applicable to this study’s population, the wording of the PECI was modified slightly to align with
parenting a child with a chronic condition.
Statistical Analyses
Parents who did and did not participate in the study were compared on basic demographic
variables using chi-square analyses for categorical data and t-tests for continuous data. These
analyses were repeated for both time points. Basic demographic information was available for
the parents who participated in the study and was approximated for those who did not using
Postal Code Conversion Files 34.
Shapiro-Wilk Test of Normality indicated that the POM data did not violate the assumption of normality, therefore parametric analyses were used. Item analysis and tests of the data’s amenability to factoring were conducted (KMO test and Bartlett’s test of sphericity) followed by assessments of the POM’s factor structure, reliability, and validity.
To evaluate the POM’s factor structure, principal axis factoring with promax rotation was
used 35. Person-product moment correlations were employed to evaluate the POM’s internal
consistency, test-retest reliability, convergent validity, and concurrent validity. Concurrent validity
was further assessed by examining whether the POM could differentiate between parents of
children with mild, moderate, and severe outcomes using a one-way analysis of variance
(ANOVA) and planned comparisons. An auxiliary analysis used a paired t-test to examine
whether the POM could differentiate between mother-father pairs. Hierarchical multiple
regression analyses were conducted to evaluate the POM’s incremental validity over other family
impact measures (PedsQL-FIM and PECI). Separate analyses were conducted for the parent
outcomes of anxiety (HADS-A), depression (HADS-D), and stress (PSS). For all of the analyses,
SPSS Version 19.0 was used and Bonferroni corrections were applied as needed.
Results
Sample. A total of 110 parents of children with perinatal stroke participated in this study
MANUSCRIP
T
ACCEPTED
ACCEPTED MANUSCRIPT 9
APSP PARENTAL OUTCOME MEASURE
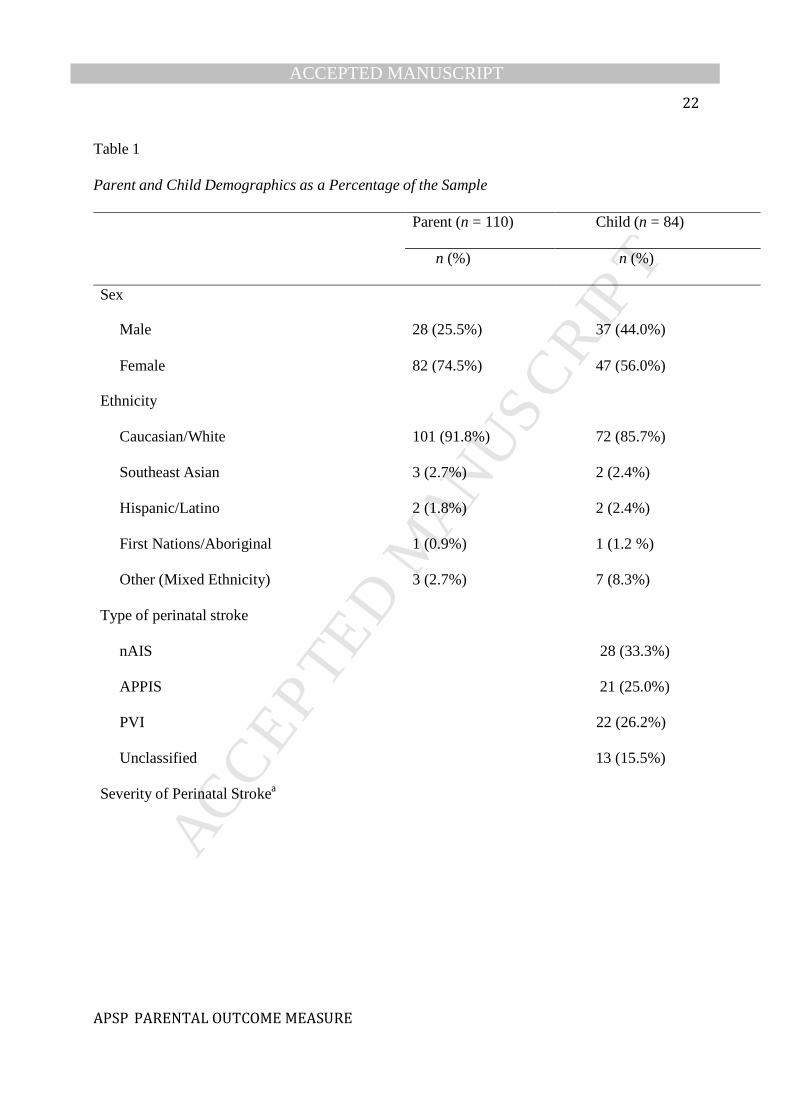
(Figure 1). The majority of the parents were female (74.5%) and Caucasian (91.8%; Table 1).
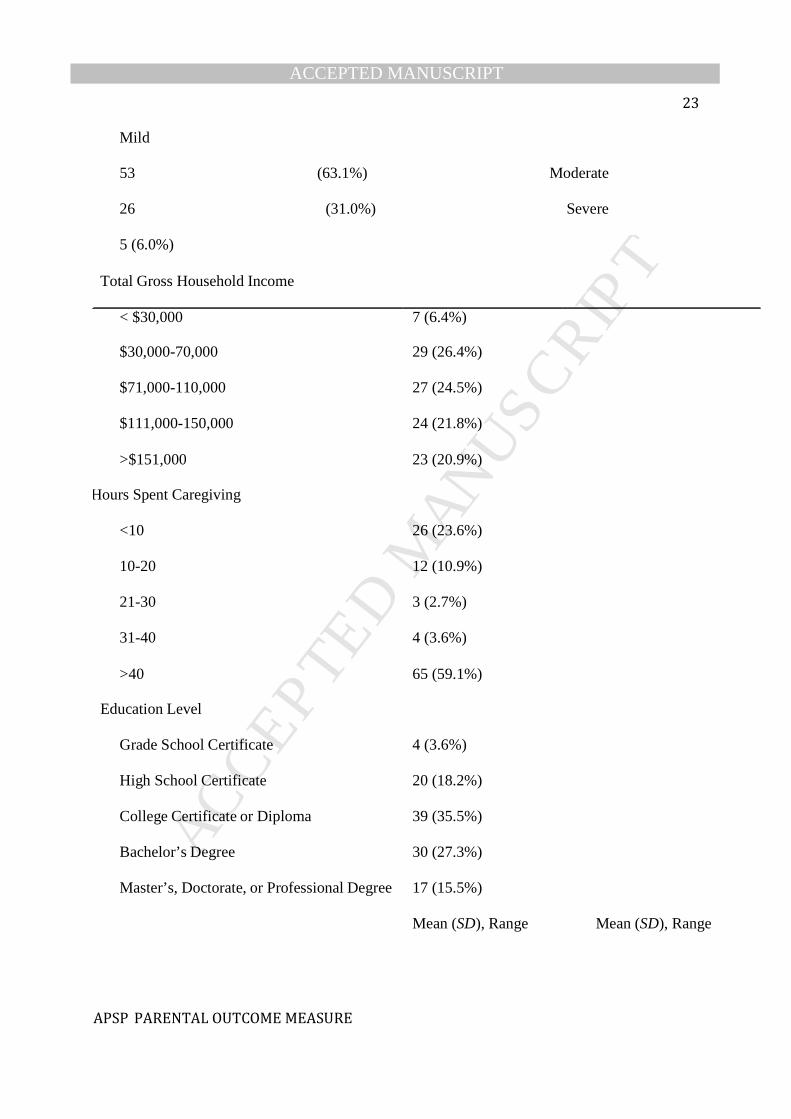
Condition severity was classified as mild (63.1%), moderate (31.0%), or severe (6.0%) according
to parents’ ratings, which were in strong agreement with the results of the standardized Pediatric
Stroke Outcome Measure (PSOM 36; Goodman and Krusk’s gamma correlation (γ) = 0.64,
p<.001). PSOM data was accessed from the APSP database for the children in which the data was
available and consent was obtained (n = 76).
There were no significant differences between those who did and did not complete the
questionnaire battery at Time Point 1 in terms of the child’s sex and type of stroke. However,
differences emerged when evaluating parent sex (χ2(1, 110) = 26.51, p < .001), ethnicity
(χ2(1,110) = 10.20, p = .001), gross family income (χ2(2,110) = 9.23, p = .01), and level of
education (χ2(4,110) = 33.73, p < .001) suggesting that fathers, ethnic minorities, and those with
lower incomes and levels of education were less likely to participate in this study. No differences
existed among parents who participated and did or did not complete the POM at Time Point 2.
Insert Figure 1 Here
Insert Table 1 Here
Item Analysis. To examine the effectiveness of the POM’s items, inter-item correlations,
corrected item-total correlations, and Cronbach’s α values following the deletion of items were
examined. The results revealed one problematic item (“Having a family member with a medical
condition positively impacts my other family members”) that was removed from the scale. This
item demonstrated a relatively low corrected item-total correlation and inter-item correlations
(<.30), and its removal improved the internal consistency of the scale based on changes to
Cronbach’s α (from .91 to .92).
Factor Structure. Initial analyses revealed that the data were suitable for factor analysis
(KMO = .85; Bartlett’s test of sphericity, p < .001). In order to determine the number of factors,
MANUSCRIP
T
ACCEPTED
ACCEPTED MANUSCRIPT 10
APSP PARENTAL OUTCOME MEASURE
the scree test 37, parallel analysis 38, and minimum average partial test 39 were conducted
according to O’Connor’s recommendations 40. The results of all three analyses indicated the
presence of three factors. The percentage of variance explained for the first three factors were as
follows: 30.60%, 9.76%, and 6.47%. Thus, the model accounted for a total of 46.83% of the variance.
The factor structure was then rotated using a promax rotation and factor loadings of .32
or higher in the pattern matrix were considered substantial 41. The results revealed that two items
about parent education and two items about the benefit of raising a child with a medical condition
failed to adequately load on any of the factors. As a result, these items were dropped.
An additional two items cross-loaded on multiple factors, all of which were theoretically related.
These items were assigned to a single factor based on their highest loading and theoretical
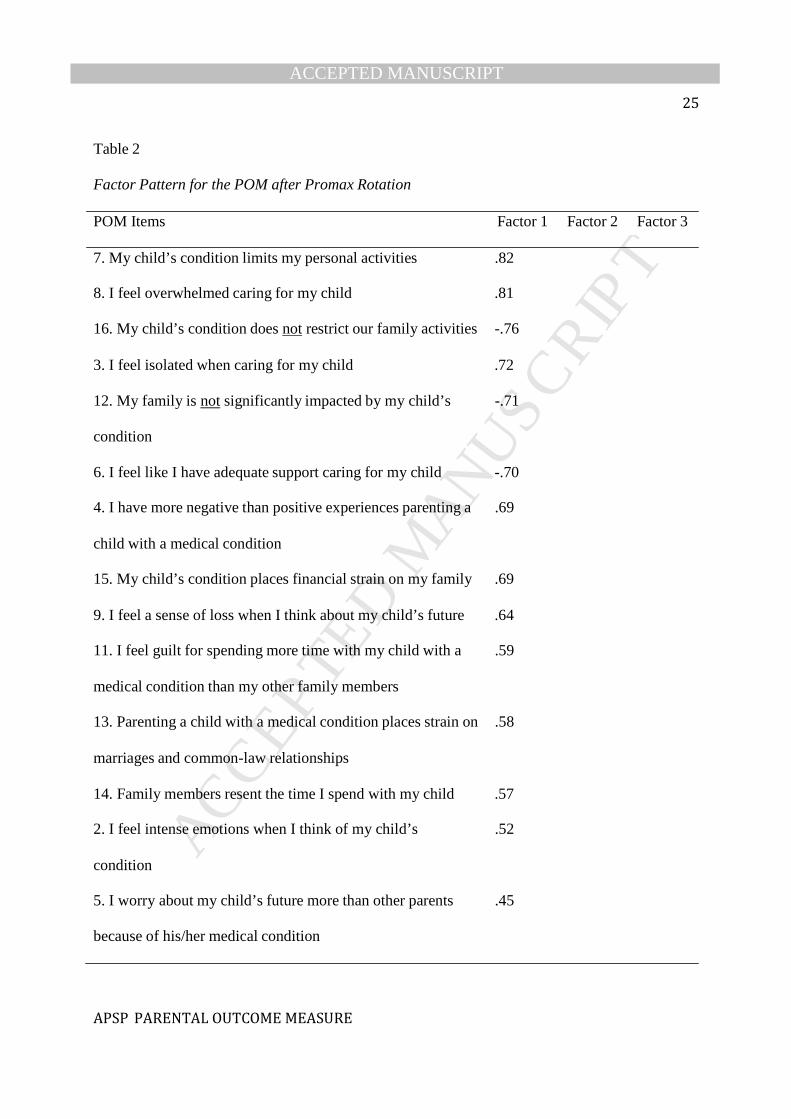
relevance. See Table 2 for a summary of the rotated factor structure based on the pattern matrix.
Insert Table 2 Here
A total of 17 items loaded on the first factor, making it the largest component of the
scale. These items capture the psychosocial impact of raising a child with a neurological
condition on parents and families, including the impact on their personal activities, family
functioning, and psychosocial wellbeing (Psychosocial Impact). The remaining two factors
capture parents’ guilt (Guilt) and blame (Blame) regarding the cause of their child’s condition.
Normality and Descriptive Statistics. The data from the revised POM did not deviate
from normality (Shapiro-Wilk’s W = 0.98, p = 0.07) nor did it demonstrate ceiling or floor
effects for the total score. Low ceiling/floor effects were observed for the subscales (<20% of the
respondents). Table 2 summarizes the descriptive statistics of the POM.
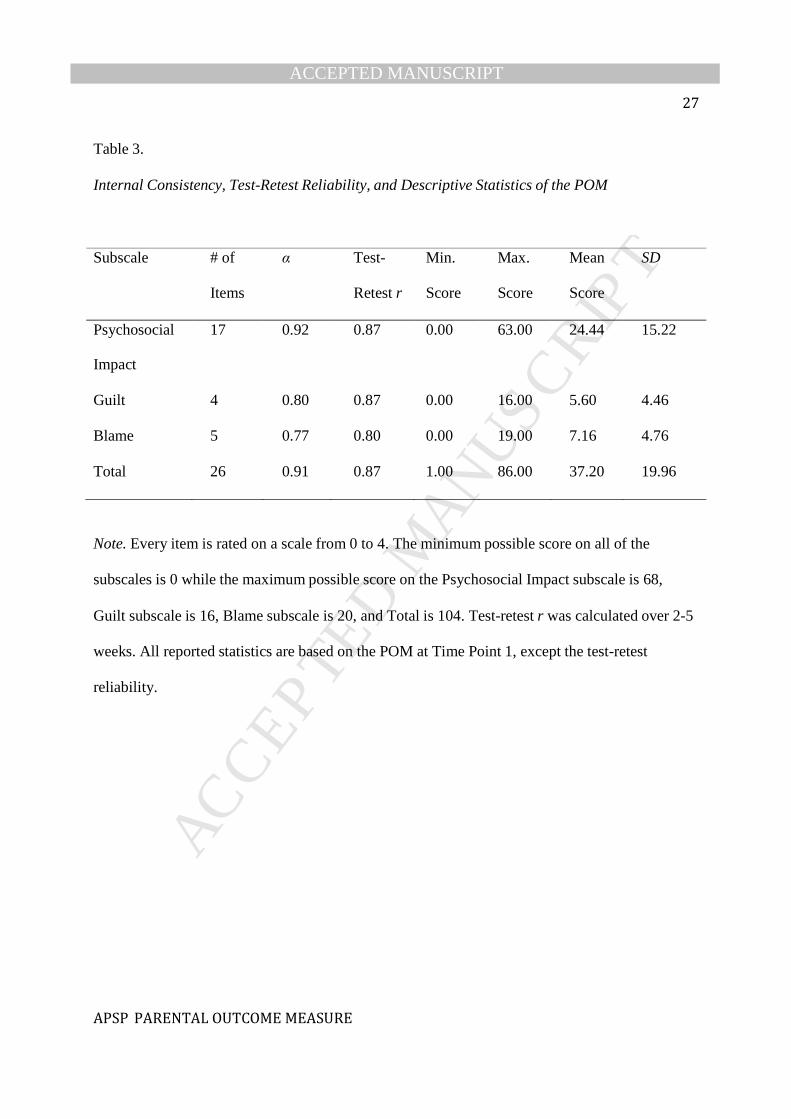
Internal Consistency. The results demonstrated that the POM exceeds the minimum
reliability standard for Chronbach’s α (0.70). The POM has excellent internal consistency
MANUSCRIP
T
ACCEPTED
ACCEPTED MANUSCRIPT 11
APSP PARENTAL OUTCOME MEASURE
(Cronbach’s α = 0.91) while its subscales have acceptable to excellent internal consistency
(Chronbach’s α ranged from 0.77 to 0.92; Table 3).
Test-Retest Reliability. The POM total score demonstrated very good reliability (r =
.87) across two to five weeks (Days: M = 19.09, SD = 6.27, range = 12-37), while the subscale
scores demonstrated good to very good reliability (r ranged from .80 to .87; Table 3).
Insert Table 3 Here
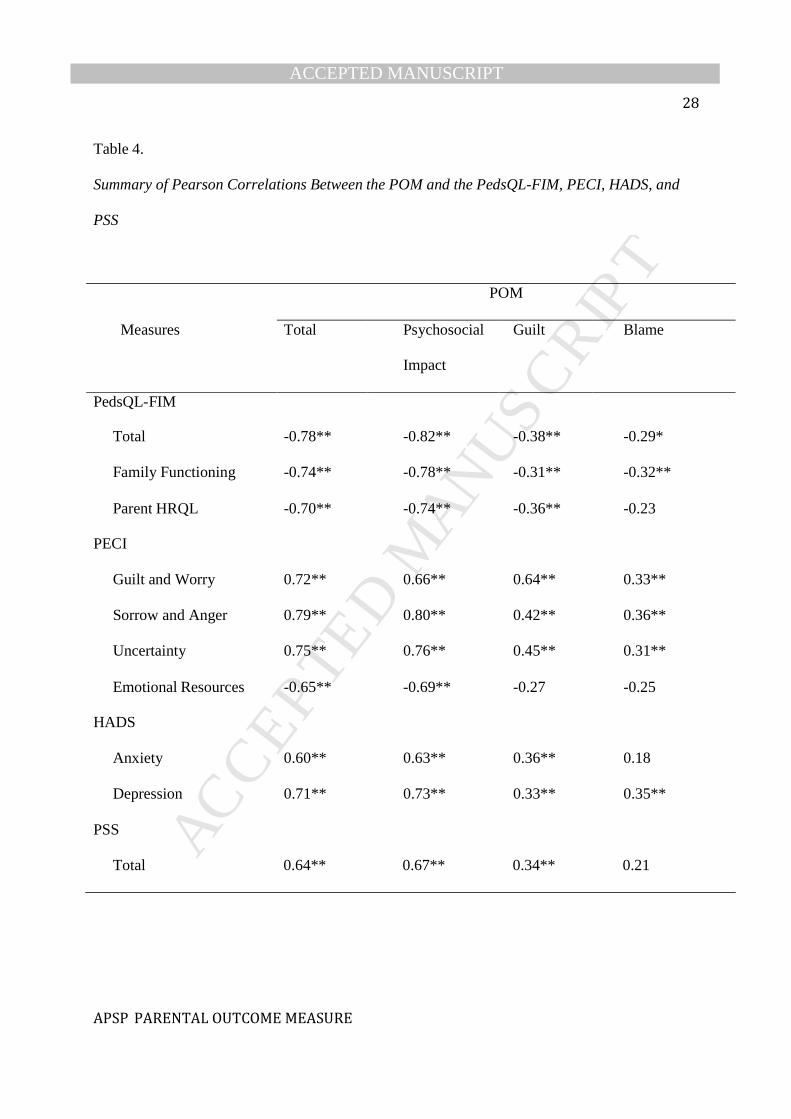
Concurrent Validity. Comparisons between the POM and other family impact measures
(PedsQL-FIM and PECI) supported the POM’s concurrent validity. The results revealed that the
POM total score and Psychosocial Impact subscale score had strong and significant correlations
with these measures. The Guilt and Blame subscale scores, however, generally demonstrated
weaker correlations suggestive of possible discriminant validity (Table 4).
In addition, the POM was able to differentiate between parents of children with different
condition severities (F(2,107) = 13.22, p < .001), providing further support for the scale’s
concurrent validity. Parents of children with mild conditions tended to have lower scores on the
POM (M = 30.51, SD = 16.81) compared to parents of children with moderate conditions (M =
48.97, SD = 19.37) and severe conditions (M = 48.50, SD = 24.32). However, only the finding
comparing the mild and moderate conditions reached statistical significance after controlling for
family-wise error (t(102) = -4.99, p < .001). This is likely due to limited sample size in the
severe condition (n = 6).
An auxiliary analysis was conducted to compare POM scores of mother-father pairs who
live in the same household. The results revealed that the POM was unable to differentiate
between the mothers and fathers, t(25) = 2.00, p = .06.
Convergent Validity. Correlations between the POM and theoretically related measures
MANUSCRIP
T
ACCEPTED
ACCEPTED MANUSCRIPT 12
APSP PARENTAL OUTCOME MEASURE
(HADS- A, HADS-D and PSS) are summarized in Table 4. Results from these analyses revealed
significant correlations between the POM and all of the aforementioned measures.
Insert Table 4 Here
Incremental Validity. Box-and-whisker plots of the criterion and predictor variables
revealed that three outliers were present in the HADS-A, HADS-D, and PSS data. The multiple
regression results did not differ when the outliers were excluded, so they were retained in the
analyses.
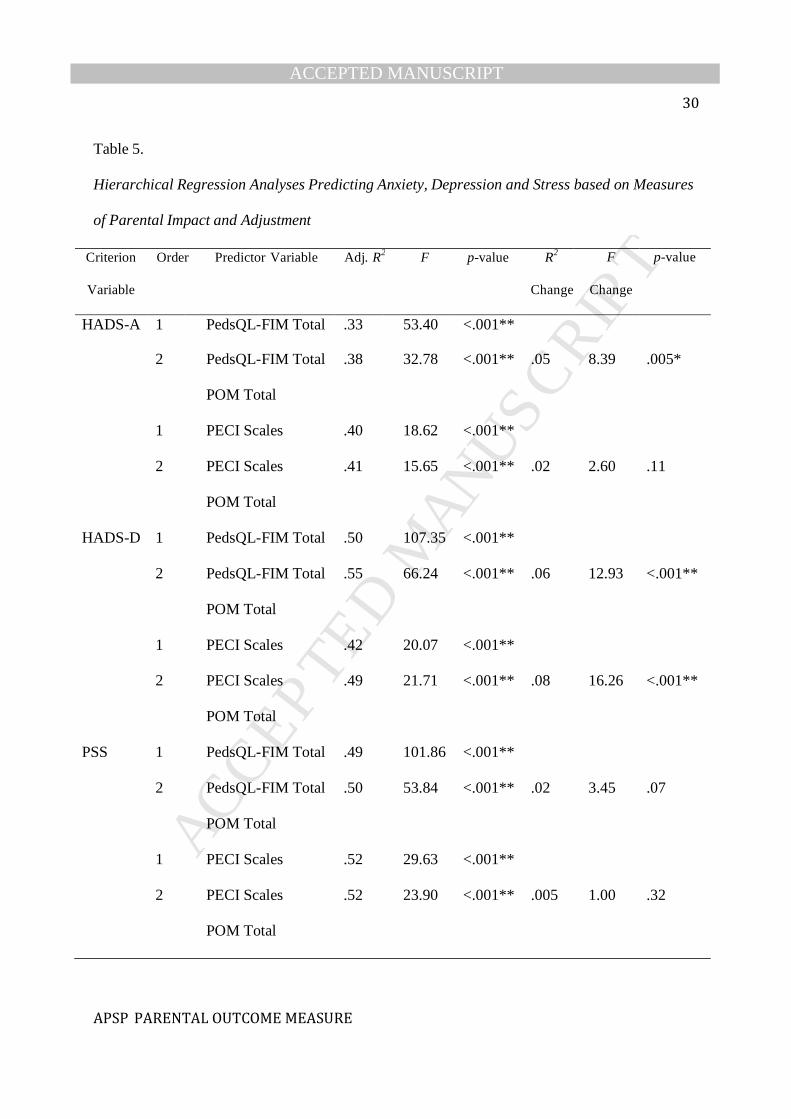
The results from the multiple regression analyses illustrate that the POM accounted for
shared and additional variance in parent outcomes when combined with other family impact
measures (Table 5). The PedsQL-FIM on its own, and in combination with the POM, accounted
for a significant portion of variance in all of the parent outcomes examined. Importantly, the
POM accounted for additional variance, above and beyond that captured in the PedsQL-FIM, in
measures of parent anxiety (HADS-A; ΔR2 = .05, F(1,107) = 8.39, p = .005) and depression
(HADS-D; ΔR2 = .06, F(1,107) = 12.93, p < .001). The incremental validity of the POM for
predicting these outcomes was not only statistically significant, but also substantial 42
(semipartial r = .22 for HADS-A and .23 for HADS-D).
Similar results were found when controlling for outcomes on a measure of parent
adjustment, the PECI (Table 5). The POM, however, only accounted for additional and
substantial variance, above and beyond the PECI, in parent depression (HADS-D; ∆R2 = .08,
F(1, 104) = 16.26, p < .001; semipartial r = .28).
Insert Table 5 Here
Discussion
MANUSCRIP
T
ACCEPTED
ACCEPTED MANUSCRIPT 13
APSP PARENTAL OUTCOME MEASURE
The purpose of this study was to develop and validate a family impact scale for parents
affected by perinatal stroke that includes a quantifiable measure of guilt and blame. The POM
consists of 26 items and three subscales derived from an exploratory factor analysis:
Psychosocial Impact, Guilt, and Blame. Preliminary evidence for the POM’s reliability and
validity was obtained from 110 parents of children with perinatal stroke. The results indicate that
the POM has excellent internal reliability and very good test-retest reliability over two to five
weeks. In addition, this study provides evidence for the POM’s convergent, concurrent, and
incremental validity. The results revealed strong correlations between the POM and measures of
anxiety, depression, stress, quality of life, family functioning, and parent adjustment. The results
also illustrated that scores on the POM varied depending on the child’s condition severity.
Lastly, the results revealed that the POM was able to predict parent outcomes of emotional
wellbeing (anxiety and depression) above and beyond that of related measures (PedsQL FIM and
PECI).
The POM is comprehensive with the bulk of the items focusing on the parent and family
impact of raising a child with a neurological condition. Not surprisingly, the POM demonstrated
criterion validity through its strong correlations with the family impact measures, PedsQL-FIM
and PECI. Dramatic decreases in the magnitude of the correlations between the POM and these
scales were observed when the Guilt and Blame subscales were specifically evaluated. These
results emphasize that the Guilt and Blame subscales are relatively novel contributions of the
POM. Furthermore, these constructs appear to be relevant to the vast majority of the parents who
participated in this study, as highlighted by the subscales’ low floor effects.
The PECI appears to be the only other family impact measure that resembles the POM in
that it measures ‘Guilt and Worry’. However, the magnitude of the correlation between the POM
and PECI’s guilt-related subscales suggests that they are not measuring the same construct. An
evaluation of the items sheds light on this observation: the PECI’s Guilt and Worry subscale
MANUSCRIP
T
ACCEPTED
ACCEPTED MANUSCRIPT 14
APSP PARENTAL OUTCOME MEASURE
places a strong emphasis on acute anxiety and worry whereas the POM’s Guilt subscale focuses
exclusively on the construct of guilt. Thus, the PECI and the POM appear to be complimentary
measures of family and parent impact.
The POM further augments the current literature by adding to efforts to improve family-
centered care for those affected by perinatal stroke. The results of this study highlight the clinical
utility of the scale in predicting common outcomes among parents of children with neurological
conditions, such as depression and anxiety. This study’s findings support the use of the POM,
along with other measures, to elucidate which parents are at greater risk for psychological health
concerns. In addition, the POM may prove to be useful for identifying targets for intervention
(based on subscale scores and items endorsed), as well as monitoring outcomes of interventions
and services. The POM therefore has many potential applications to clinicians, researchers and
policymakers who provide support to families affected by perinatal stroke.
Limitations. The results of this study should be interpreted within the scope of its
limitations. First, the generalizability of the findings is limited by the study’s sample. Fathers,
ethnic minorities, and families with low socioeconomic status appeared to be underrepresented.
In addition, parents of children with severe conditions may have been underrepresented given
that they only consisted of 5.6% of the sample. Future research is needed to validate the POM in
these diverse populations, as well as beyond the southern Alberta region. Whether the POM is
suitable for other pediatric health populations also remains to be determined. It is anticipated that
the POM may be useful for measuring parent impact in a variety of neurological conditions,
which the authors are beginning to test with parents of children with epilepsy.
This study is also limited by its relatively small sample size. Sample sizes present an
ongoing challenge when working with populations affected by specific and understudied
neurological conditions such as perinatal stroke. In order to help mitigate this limitation, we
recruited participants from one of the largest population-based perinatal stroke cohorts in Canada
MANUSCRIP
T
ACCEPTED
ACCEPTED MANUSCRIPT 15
APSP PARENTAL OUTCOME MEASURE
(APSP). As a result, this study includes the largest population of parents affected by perinatal
stroke published to date. Nonetheless, this study fails to satisfy the commonly accepted sample
size criteria of five participants per variable for exploratory factor analysis 35. However,
Guadagnoli and Velicer 43 argue that factor loadings, along with total sample size and number of
items per factor, determine the stability of factor solutions. According to Guadognoli and
Velicer, “If components possess four or more variables with loadings above .60, the pattern may
be interpreted whatever sample size is used” 43(p274). When using principal components analysis
(as Guadagnoli and Velicer did in their study), the Psychosocial Impact and Guilt factors exceed
this criteria while the Blame factor has three variables loading above .60. Thus, there is reason to
believe that our current factor structure may be stable, but further research is warranted.
Conclusions. This study provides preliminary evidence that the POM is a reliable, valid,
and useful tool for quantifying psychosocial functioning, guilt, and blame among parents of
children with perinatal stroke. The scale takes approximately five minutes to complete and
appears to adequately measure the impact of perinatal stroke on parents and families. The POM
may serve to identify families who are adapting well and those who may benefit from additional
psychosocial, educational, and health services. Furthermore, the scale may propel research on the
family impact of raising a child with perinatal stroke, a topic not yet explored in the published
literature. Such research is necessary in order to improve services and resources available to this
underserved population.
Acknowledgements
We would like to extend our sincerest appreciation to Ms. Sonia Rothenmund, Dr.
Richard Dyck and Dr. Alberto Netell-Aguirre for their assistance with this project. This research
was supported in part by the Canadian Institute of Health Research.

MANUSCRIP
T
ACCEPTED
ACCEPTED MANUSCRIPT 16
APSP PARENTAL OUTCOME MEASURE
REFERENCES
1. Raju TNK, Nelson KB, Ferriero D, Lynch JK. Ischemic perinatal stroke: Summary of a
workshop sponsored by the national institute of child health and human development and
the national institute of neurological disorders and stroke. Pediatrics. 2007;120(3):609---616.
2. Golomb MR. Outcomes of perinatal arterial ischemic stroke and cerebral sinovenous
thrombosis. Semin Fetal Neonatal Med. 2009;14(5):318---322.
3. Lynch JK. Epidemiology and classification of perinatal stroke. Semin Fetal Neonatal Med.
2009;14(5):245---249.
4. Pousada M, Guillamón N, Hernández---Encuentra E, et al. Impact of caring for a child with
cerebral palsy on the quality of life of parents: A systematic review of the literature. J Dev
Phys Disabil. 2013:1---33.
5. Duffy LV. Parental coping and childhood epilepsy: The need for future research. J
Neurosci Nurs. 2011;43(1):29---35.
6. Miodrag N, Hodapp RM. Chronic stress and health among parents of children with
intellectual and developmental disabilities. Curr Opin Psychiatry. 2010;23(5):407---411.
7. Rentinck ICM, Ketelaar M, Schuengel C, et al. Short---term changes in parents' resolution
regarding their young child's diagnosis of cerebral palsy. Child Care Health Dev.
2010;36(5):703---708.
8. McCubbin HI, Patterson JM. The family stress process: The double ABCX model of
adjustment and adaptation. In: Social stress and the family: Advances and developments in
MANUSCRIP
T
ACCEPTED
ACCEPTED MANUSCRIPT 17
APSP PARENTAL OUTCOME MEASURE
family stress theory and research. McGubbin H, Sussman M, Patterson J (eds). New York:
Haworth; 1983: 7---37.
9. Turnbull AP, Summers JA, Lee S, Kyzar K. Conceptualization and measurement of family
outcomes associated with families of individuals with intellectual disabilities. Ment Retard
Dev Disabil Res Rev. 2007;13(4):346---356.
10. Stein RE, Riessman CK. The development of an impact---on---family scale: Preliminary
findings. Med Care. 1980:465---472.
11. Landgraf JM, Abetz L, Ware JE. Child Health Questionnaire (CHQ): A User's Manual.
Health Institute, New England Medical Center Boston, MA; 1996.
12. Summers J, Poston D, Turnbull A, et al. Conceptualizing and measuring family quality of
life. J Intellect Disabil Res. 2005;49(10):777---783.
13. Varni JW, Sherman SA, Burwinkle TM, Dickinson PE, Dixon P. The PedsQL Family
Impact Module: Preliminary reliability and validity. Health Qual Life Outcomes. 2004;2:55.
14. Kirton A, Westmacott R, Deveber G. Pediatric stroke: Rehabilitation of focal injury in the
developing brain. NeuroRehabilitation. 2007;22(5):371--382.
15. Mineyko A, Kirton A. The black box of perinatal ischemic stroke pathogenesis. J Child
Neurol. 2011;26(9):1154-
--1162.
16. Boye B, Bentsen H, Malt U. Does guilt proneness predict acute and long---term distress in
relatives of patients with schizophrenia? Acta Psychiatr Scand. 2002;106(5):351---357.
MANUSCRIP
T
ACCEPTED
ACCEPTED MANUSCRIPT 18
APSP PARENTAL OUTCOME MEASURE
17. Spillers RL, Wellisch DK, Kim Y, Matthews A, Baker F. Family caregivers and guilt in the
context of cancer care. Psychosomatics. 2008;49(6):511---519.
18. Gonyea JG, Paris R, de Saxe Zerden L. Adult daughters and aging mothers: The role of
guilt in the experience of caregiver burden. Aging Mental Health. 2008;12(5):559---567.
19. Gallagher S, Phillips AC, Oliver C, Carroll D. Predictors of psychological morbidity in
parents of children with intellectual disabilities. J Pediatr Psychol. 2008;33(10):1129---1136.
20. Hall S, Marteau T. Causal attributions and blame: Associations with mothers'
adjustment to the birth of a child with down syndrome. Psychol, Health Med.
2003;8(4):415---423.
21. Carona C, Crespo C, Canavarro M. Similarities amid the difference: Caregiving burden
and adaptation outcomes in dyads of parents and their children with and without cerebral
palsy. Res Dev Disabil. 2013;34(3):882---893.
22. Bonner MJ, Hardy KK, Guill AB, McLaughlin C, Schweitzer H, Carter K. Development and
validation of the Parent Experience of Child Illness. J Pediatr Psychol. 2006;31(3):310---321.
23. Kirton A, deVeber G. Advances in perinatal ischemic stroke. Pediatr Neurol.
2009;40(3):205---214.
24. Zigmond AS, Snaith RP. The Hospital Anxiety and Depression cale. Acta Psychiatr Scand.
1983;67(6):361---370.
25. Bjelland I, Dahl AA, Haug TT, Neckelmann D. The validity of the Hospital Anxiety and
Depression Scale: An updated literature review. J Psychosom Res. 2002;52(2):69---77.
26. Herrmann C. International experiences with the Hospital Anxiety and Depression Scale:
MANUSCRIP
T
ACCEPTED
ACCEPTED MANUSCRIPT 19
APSP PARENTAL OUTCOME MEASURE
A review of validation data and clinical results. J Psychosom Res. 1997;42(1):17---41.
27. Cheshire A, Barlow JH, Powell LA. The psychosocial well---being of parents of children
with cerebral palsy: A comparison study. Disab Rehabil. 2010;32(20):1673---1677.
28. Shariff EM, Sinha S, Samman SK, ElBakri NK, Siddiqui KA, Mahmoud AA. Depression and
anxiety in parents of children with epilepsy: Are fathers involved?. Neurosciences.
2013;18(2): 183---184.
29. Cohen S, Kamarck T, Mermelstein R. A global measure of perceived stress. J Health Soc
Behav. 1983;24(4):385---396.
30. Lessenberry BM, Rehfeldt RA. Evaluating stress levels of parents of children with
disabilities. Except Child. 2004;70(2):231---244.
31. Mano KEJ, Khan KA, Ladwig RJ, Weisman SJ. The impact of pediatric chronic pain on
parents’ health---related quality of life and family functioning: Reliability and validity of the
PedsQL 4.0 Family Impact Module. J Pediatr Psychol. 2011;36(5):517---527.
32. Medrano GR, Berlin KS, Davies WH. Utility of the PedsQL™ Family Impact Module:
Assessing the psychometric properties in a community sample. Quality of Life Research.
2013:1---9. doi 10.1007/s11136---013---0422---9
33. Storch EA, Lehmkuhl H, Pence SL, et al. Parental experiences of having a child with
obsessive---compulsive disorder: Associations with clinical characteristics and caregiver
adjustment. J Child Fam Stud. 2009;18(3):249---258.
34. Statistics Canada. Postal code conversion files: May 2006 postal codes. 2011.
35. Gorsuch RL. Common factor analysis versus component analysis: Some well and little
MANUSCRIP
T
ACCEPTED
ACCEPTED MANUSCRIPT 20
APSP PARENTAL OUTCOME MEASURE
known facts. Multivariate Behavioral Research. 1990;25(1):33---39.
36. deVeber GA, MacGregor D, Curtis R, Mayank S. Neurologic outcome in survivors of
childhood arterial ischemic stroke and sinovenous thrombosis. J Child Neurol.
2000;15(5):316---324.
37. Cattell RB. The scree test for the number of factors. Multivariate behavioral research.
1966;1(2):245---276.
38. Horn JL. A rationale and test for the number of factors in factor analysis. Psychometrika.
1965;30(2):179---185.
39. Velicer WF. Determining the number of components from the matrix of partial
correlations. Psychometrika. 1976;41(3):321---327.
40. O’connor BP. SPSS and SAS programs for determining the number of components using
parallel analysis and velicer’s MAP test. Behav Res Meth Ins C. 2000;32(3):396---402.
41. Tabachnick BG, Fidell LS, Osterlind SJ. Principal components and factor analysis. 4th ed. In:
Using multivariate statistics. Tabachnick B, Fidell L (eds). Needham Heights, MA: Allyn and
Bacon; 2001: 582-652.
42. Hunsley J, Meyer GJ. The incremental validity of psychological testing and assessment:
Conceptual, methodological, and statistical issues. Psychol Assess. 2003;15(4):446---455.
43. Guadagnoli E, Velicer WF. Relation to sample size to the stability of component patterns.
Psychol Bull. 1988;103(2):265---275.
MANUSCRIP
T
ACCEPTED
ACCEPTED MANUSCRIPT 21
APSP PARENTAL OUTCOME MEASURE
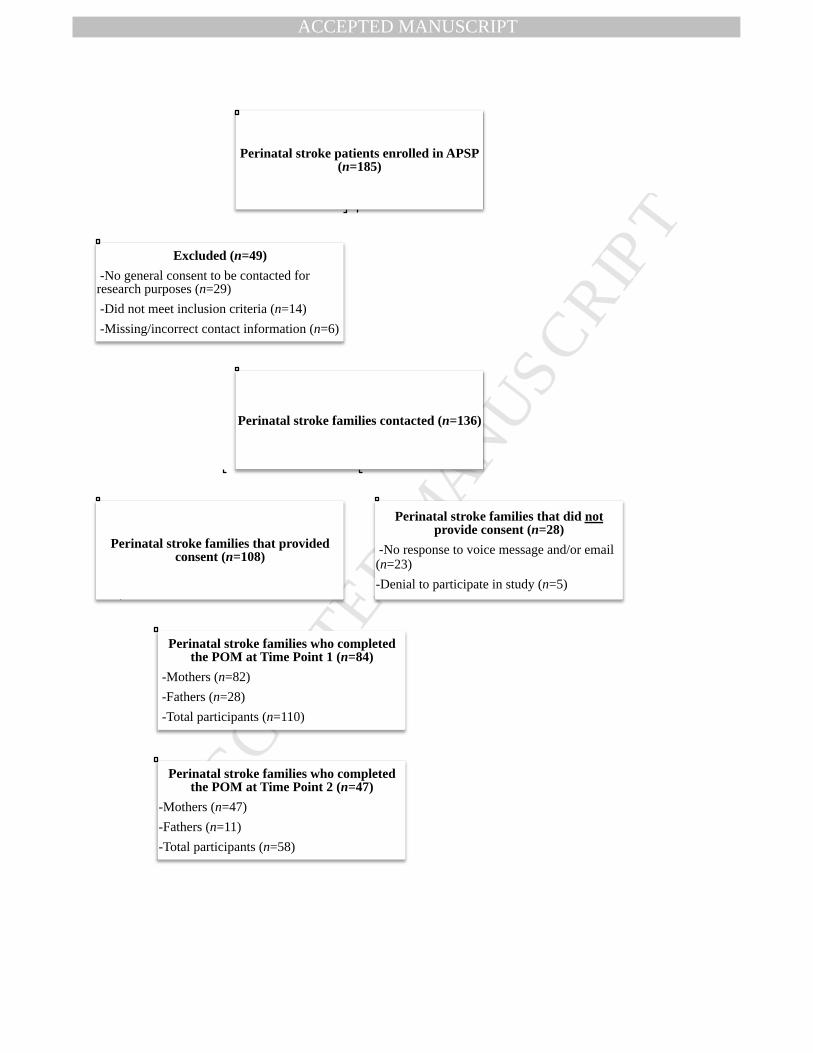
Figure 1. Response rate throughout the recruitment process. Participants with partially
completed data (n = 3) were not included in the final count. Both parents completed the
POM in 26 cases at Time Point 1 and 11 cases at Time Point 2. APSP = Alberta Perinatal
Stroke Project; POM = APSP Parental Outcome Measure.
MANUSCRIP
T
ACCEPTED
ACCEPTED MANUSCRIPT 22
APSP PARENTAL OUTCOME MEASURE
Table 1
Parent and Child Demographics as a Percentage of the Sample
Parent (n = 110) Child (n = 84)
n (%) n (%)
Sex
Male
28 (25.5%)
37 (44.0%)
Female
82 (74.5%)
47 (56.0%)
Ethnicity
Caucasian/White
101 (91.8%)
72 (85.7%)
Southeast Asian
3 (2.7%)
2 (2.4%)
Hispanic/Latino
2 (1.8%)
2 (2.4%)
First Nations/Aboriginal
1 (0.9%)
1 (1.2 %)
Other (Mixed Ethnicity)
3 (2.7%)
7 (8.3%)
Type of perinatal stroke
nAIS 28 (33.3%)
APPIS 21 (25.0%)
PVI 22 (26.2%)
Unclassified
Severity of Perinatal Strokea
13 (15.5%)
MANUSCRIP
T
ACCEPTED
ACCEPTED MANUSCRIPT 23
APSP PARENTAL OUTCOME MEASURE
Mild
53 (63.1%) Moderate
26 (31.0%) Severe
5 (6.0%)
Total Gross Household Income
< $30,000 7 (6.4%)
$30,000-70,000
29 (26.4%)
$71,000-110,000
27 (24.5%)
$111,000-150,000
24 (21.8%)
>$151,000
23 (20.9%)
Hours Spent Caregiving
<10
26 (23.6%)
10-20
12 (10.9%)
21-30
3 (2.7%)
31-40
4 (3.6%)
>40
65 (59.1%)
Education Level
Grade School Certificate
4 (3.6%)
High School Certificate
20 (18.2%)
College Certificate or Diploma
39 (35.5%)
Bachelor’s Degree
30 (27.3%)
Master’s, Doctorate, or Professional Degree
17 (15.5%)
Mean (SD), Range
Mean (SD), Range
MANUSCRIP
T
ACCEPTED
ACCEPTED MANUSCRIPT 24
APSP PARENTAL OUTCOME MEASURE
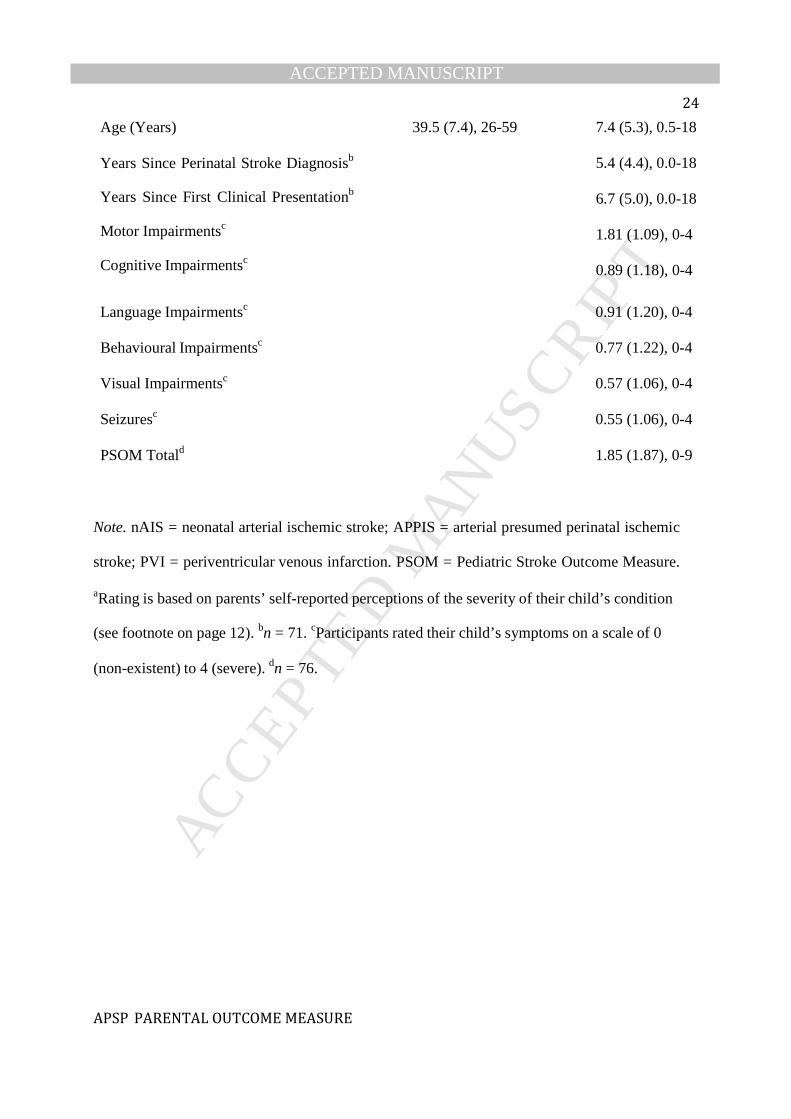
Age (Years)
Years Since Perinatal Stroke Diagnosisb
Years Since First Clinical Presentationb
Motor Impairmentsc
Cognitive Impairmentsc
39.5 (7.4), 26-59
7.4 (5.3), 0.5-18
5.4 (4.4), 0.0-18
6.7 (5.0), 0.0-18
1.81 (1.09), 0-4
0.89 (1.18), 0-4
Language Impairmentsc 0.91 (1.20), 0-4
Behavioural Impairmentsc 0.77 (1.22), 0-4
Visual Impairmentsc 0.57 (1.06), 0-4
Seizuresc 0.55 (1.06), 0-4
PSOM Totald 1.85 (1.87), 0-9
Note. nAIS = neonatal arterial ischemic stroke; APPIS = arterial presumed perinatal ischemic
stroke; PVI = periventricular venous infarction. PSOM = Pediatric Stroke Outcome Measure.
aRating is based on parents’ self-reported perceptions of the severity of their child’s condition
(see footnote on page 12). bn = 71. cParticipants rated their child’s symptoms on a scale of 0
(non-existent) to 4 (severe). dn = 76.
MANUSCRIP
T
ACCEPTED
ACCEPTED MANUSCRIPT 25
APSP PARENTAL OUTCOME MEASURE
Table 2
Factor Pattern for the POM after Promax Rotation
POM Items Factor 1 Factor 2 Factor 3
7. My child’s condition limits my personal activities .82
8. I feel overwhelmed caring for my child .81
16. My child’s condition does not restrict our family activities -.76
3. I feel isolated when caring for my child .72
12. My family is not significantly impacted by my child’s -.71
condition
6. I feel like I have adequate support caring for my child -.70
4. I have more negative than positive experiences parenting a
child with a medical condition
.69
15. My child’s condition places financial strain on my family .69
9. I feel a sense of loss when I think about my child’s future .64
11. I feel guilt for spending more time with my child with a
medical condition than my other family members
.59
13. Parenting a child with a medical condition places strain on
marriages and common-law relationships
.58
14. Family members resent the time I spend with my child .57
2. I feel intense emotions when I think of my child’s
condition
.52
5. I worry about my child’s future more than other parents
because of his/her medical condition
.45

MANUSCRIP
T
ACCEPTED
ACCEPTED MANUSCRIPT 26
APSP PARENTAL OUTCOME MEASURE
1. I have come to terms with my child’s condition -.41
10. My child’s condition has brought my family closer
together
-.36
17. Having a child with a medical condition makes the
decision to have more children difficult
.34
21. I worry that something I did or my partner did during
pregnancy caused my child’s condition
.75
20. I feel guilt about the potential cause(s) of my child’s
condition
.74
19. I am focused on finding a specific reason for why this
happened to my child
.67
18. I worry that something related to my body or my
partner’s body caused my child’s condition (e.g., a pre-
existing medical condition)
.51
23. No one is to blame for my child’s condition .69
25. My child’s condition could not have been prevented .64
26. I worry that medical mismanagement caused my child’s
condition
-.55
22. I accept that I may never understand the cause of my
child’s condition
.35
24. I feel anger when I think about the potential cause(s) of
my child’s condition
-.35
MANUSCRIP
T
ACCEPTED
ACCEPTED MANUSCRIPT 27
APSP PARENTAL OUTCOME MEASURE
Table 3.
Internal Consistency, Test-Retest Reliability, and Descriptive Statistics of the POM
Subscale # of
Items
α Test-
Retest r
Min.
Score
Max.
Score
Mean
Score
SD
Psychosocial 17 0.92 0.87 0.00 63.00 24.44 15.22
Impact
Guilt
4
0.80
0.87
0.00
16.00
5.60
4.46
Blame
5
0.77
0.80
0.00
19.00
7.16
4.76
Total
26
0.91
0.87
1.00
86.00
37.20
19.96
Note. Every item is rated on a scale from 0 to 4. The minimum possible score on all of the
subscales is 0 while the maximum possible score on the Psychosocial Impact subscale is 68,
Guilt subscale is 16, Blame subscale is 20, and Total is 104. Test-retest r was calculated over 2-5
weeks. All reported statistics are based on the POM at Time Point 1, except the test-retest
reliability.
MANUSCRIP
T
ACCEPTED
ACCEPTED MANUSCRIPT 28
APSP PARENTAL OUTCOME MEASURE
Table 4.
Summary of Pearson Correlations Between the POM and the PedsQL-FIM, PECI, HADS, and
PSS
POM
Measures Total Psychosocial
Impact
Guilt Blame
PedsQL-FIM
Total
-0.78**
-0.82**
-0.38**
-0.29*
Family Functioning
-0.74**
-0.78**
-0.31**
-0.32**
Parent HRQL
-0.70**
-0.74**
-0.36**
-0.23
PECI
Guilt and Worry
0.72**
0.66**
0.64**
0.33**
Sorrow and Anger
0.79**
0.80**
0.42**
0.36**
Uncertainty
0.75**
0.76**
0.45**
0.31**
Emotional Resources
-0.65**
-0.69**
-0.27
-0.25
HADS
Anxiety
0.60**
0.63**
0.36**
0.18
Depression
0.71**
0.73**
0.33**
0.35**
PSS
Total 0.64** 0.67** 0.34** 0.21
MANUSCRIP
T
ACCEPTED
ACCEPTED MANUSCRIPT 29
APSP PARENTAL OUTCOME MEASURE
Note. For all of the scales, except PedsQL-FIM and the PECI Emotional Resources subscale,
higher scores indicate poorer functioning with respect to the construct being assessed. Adjusted
p-value for multiple comparisons = 0.00125. HADS = Hospital Anxiety and Depression Scale;
PSS = Perceived Stress Scale; PedsQL-FIM = Pediatric Quality of Life Inventory - Family
Impact Module; HRQL = Health-Related Quality of Life; PECI = Parent Experience of Child
Illness.
*p-value < 0.00125. ** p-value < 0.001.
MANUSCRIP
T
ACCEPTED
ACCEPTED MANUSCRIPT 30
APSP PARENTAL OUTCOME MEASURE
Table 5.
Hierarchical Regression Analyses Predicting Anxiety, Depression and Stress based on Measures
of Parental Impact and Adjustment
Criterion Order Predictor Variable Adj. R2 F p-value R2
Variable Change
F
Change
p-value
HADS-A 1 PedsQL-FIM Total .33 53.40 <.001**
2
PedsQL-FIM Total
.38
32.78
<.001**
.05
8.39
.005*
POM Total
1
PECI Scales
.40
18.62
<.001**
2
PECI Scales
.41
15.65
<.001**
.02
2.60
.11
POM Total
HADS-D
1
PedsQL-FIM Total
.50
107.35
<.001**
2
PedsQL-FIM Total
.55
66.24
<.001**
.06
12.93
<.001**
POM Total
1
PECI Scales
.42
20.07
<.001**
2
PECI Scales
.49
21.71
<.001**
.08
16.26
<.001**
POM Total
PSS
1
PedsQL-FIM Total
.49
101.86
<.001**
2
PedsQL-FIM Total
.50
53.84
<.001**
.02
3.45
.07
POM Total
1
PECI Scales
.52
29.63
<.001**
2
PECI Scales
.52
23.90
<.001**
.005
1.00
.32
POM Total
MANUSCRIP
T
ACCEPTED
ACCEPTED MANUSCRIPT 31
APSP PARENTAL OUTCOME MEASURE
Note. n = 107. HADS-A = Hospital Anxiety and Depression Scale – Anxiety; PedsQL-FIM =
Pediatric Quality of Life Inventory – Family Impact Module; POM = (Alberta Perinatal Stroke
Project) Parent Outcome Measure; PECI = Parent Experience of Child Illness; HADS-D =
Hospital Anxiety and Depression Scale – Depression; PSS = Perceived Stress Scale. PECI Scales
included the following: 1) Guilt and Worry, 2) Unresolved Anger and Sorrow, 3) Long-term
Uncertainty, and 4) Emotional Resources.
*p < .017. ** p < .001.
MANUSCRIP
T
ACCEPTED
ACCEPTED MANUSCRIPT 32
APSP PARENTAL OUTCOME MEASURE
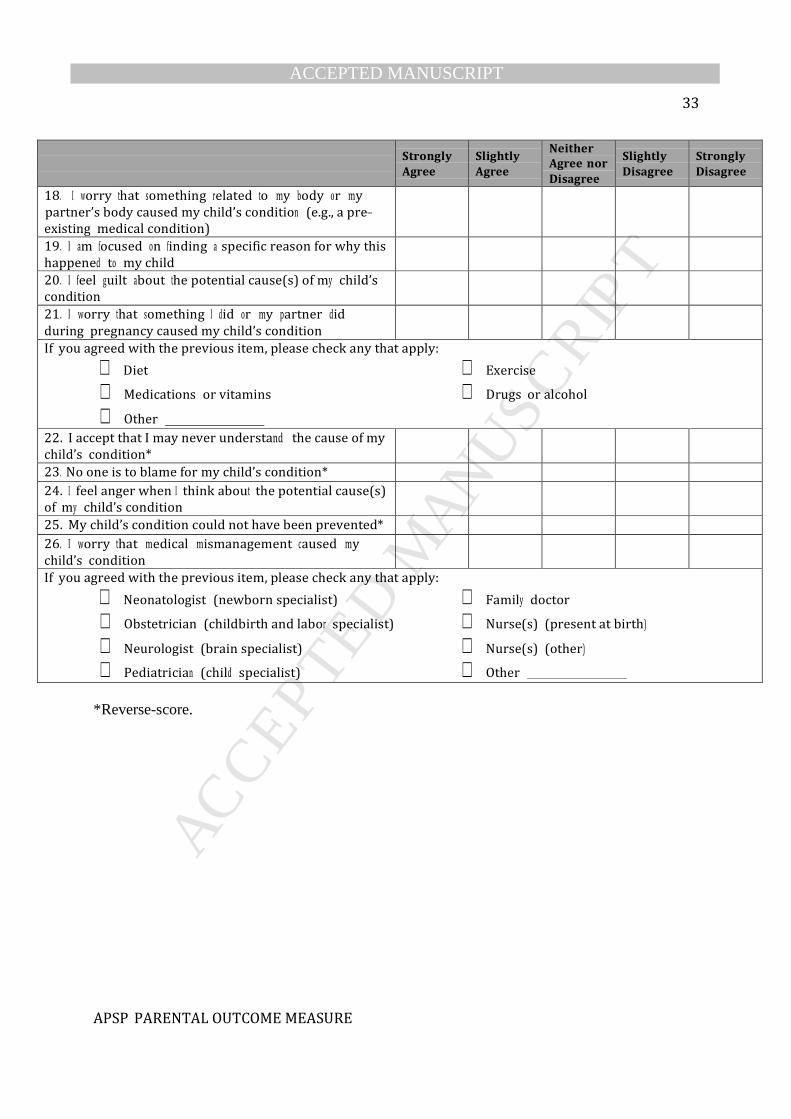
Appendix A
APSP Parental Outcome Measure Bemister T., Brooks B., Rothenmund S., & Kirton A., 2013
This questionnaire asks you about your thoughts and feelings parenting a child with a medical
condition within the PAST 3 MONTHS. Please indicate how much you agree with each statement
by checking the appropriate box.
Strongly
Agree
Slightly
Agree
Neither
Agree nor
Disagree
Slightly
Disagree
Strongly
Disagree
1. I have come to terms with my child’s condition*
2. I feel intense emotions when I think of my child’s
condition
3. I feel isolated when caring for my child
4. I have more negative than positive experiences
parenting a child with a medical condition
5. I worry about my child’s future more than other
parents because of his/her medical condition
6. I feel like I have adequate support caring for my child*
7. My child’s condition limits my personal activities
8. I feel overwhelmed caring for my child
9. I feel a sense of loss when I think about my child’s
future
10. My child’s condition has brought my family closer
together*
11. I feel guilt for spending more time with my child
with a medical condition than my other family members
12. My family is not significantly impacted by my child’s
condition*
13. Parenting a child with a medical condition places
strain on marriages and common---law relationships
14. Family members resent the time I spend with my
child
15. My child’s condition places financial strain on my
family
16. My child’s condition does not restrict our family
activities*
17. Having a child with a medical condition makes the
decision to have more children difficult
MANUSCRIP
T
ACCEPTED
ACCEPTED MANUSCRIPT 33
APSP PARENTAL OUTCOME MEASURE
Strongly
Agree
Slightly
Agree
Neither
Agree nor
Disagree
Slightly
Disagree
Strongly
Disagree
18. I worry that something related to my body or my
partner’s body caused my child’s condition (e.g., a pre---
existing medical condition)
19. I am focused on finding a specific reason for why this
happened to my child
20. I feel guilt about the potential cause(s) of my child’s
condition
21. I worry that something I did or my partner did
during pregnancy caused my child’s condition
If you agreed with the previous item, please check any that apply:
Diet Exercise
Medications or vitamins Drugs or alcohol
Other
22. I accept that I may never understand the cause of my
child’s condition*
23. No one is to blame for my child’s condition* 24. I feel anger when I think about the potential cause(s)
of my child’s condition
25. My child’s condition could not have been prevented* 26. I worry that medical mismanagement caused my
child’s condition
If you agreed with the previous item, please check any that apply:
Neonatologist (newborn specialist) Family doctor
Obstetrician (childbirth and labor specialist) Nurse(s) (present at birth)
Neurologist (brain specialist) Nurse(s) (other)
Pediatrician (child specialist) Other
*Reverse-score.
MANUSCRIP
T
ACCEPTED
ACCEPTED MANUSCRIPT 34
APSP PARENTAL OUTCOME MEASURE
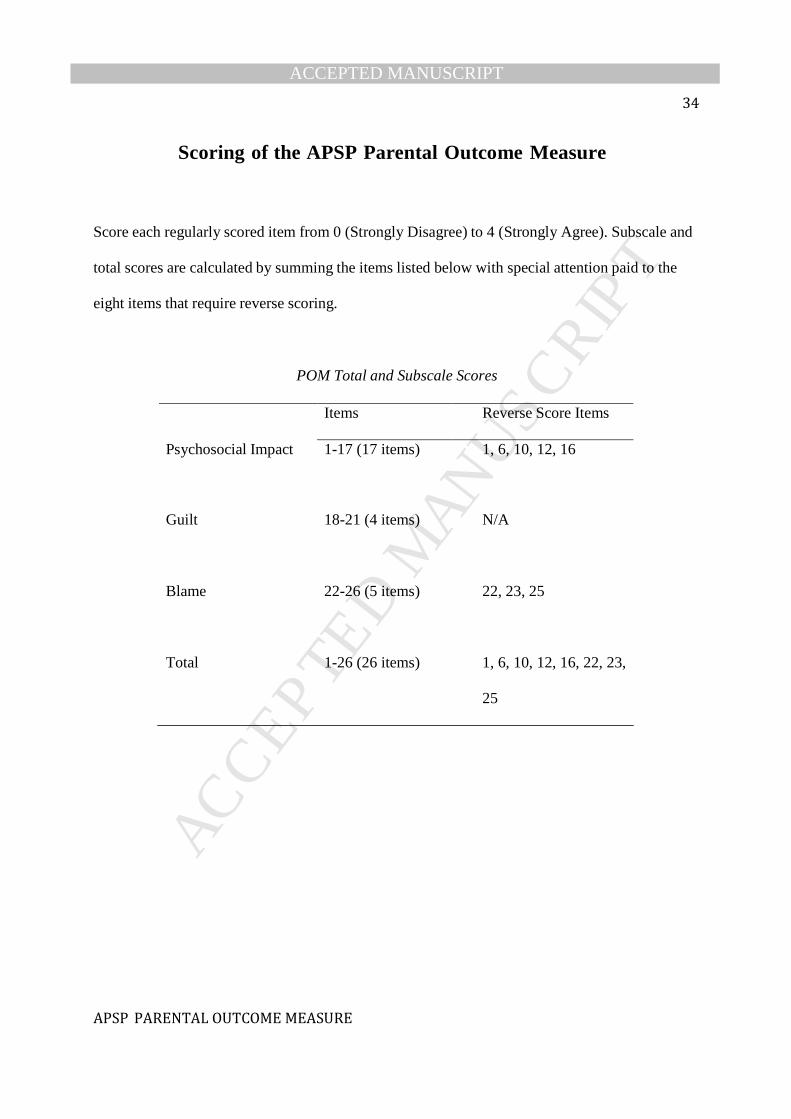
Scoring of the APSP Parental Outcome Measure
Score each regularly scored item from 0 (Strongly Disagree) to 4 (Strongly Agree). Subscale and
total scores are calculated by summing the items listed below with special attention paid to the
eight items that require reverse scoring.
POM Total and Subscale Scores
Items Reverse Score Items
Psychosocial Impact 1-17 (17 items) 1, 6, 10, 12, 16
Guilt
18-21 (4 items)
N/A
Blame
22-26 (5 items)
22, 23, 25
Total
1-26 (26 items)
1, 6, 10, 12, 16, 22, 23,
25
MANUSCRIP
T
ACCEPTED
ACCEPTED MANUSCRIPT
Perinatal stroke patients enrolled in APSP (n=185)
Perinatal stroke families contacted (n=136)
Perinatal stroke families that provided consent (n=108)
Perinatal stroke families who completed the POM at Time Point 1 (n=84)
-Mothers (n=82) -Fathers (n=28) -Total participants (n=110)
Perinatal stroke families who completed the POM at Time Point 2 (n=47)
-Mothers (n=47) -Fathers (n=11) -Total participants (n=58)
Perinatal stroke families that did not provide consent (n=28)
-No response to voice message and/or email (n=23) -Denial to participate in study (n=5)
Excluded (n=49) -No general consent to be contacted for research purposes (n=29) -Did not meet inclusion criteria (n=14) -Missing/incorrect contact information (n=6)