Embed Size (px)
Citation preview
Devon County Council
Technical Note North Devon Transport Model
North Devon Model.doc Page 1
1. North Devon Transport Model
1.1 Devon County Council has developed a transport model for Barnstaple and Bideford to inform their response to the joint LDF / Local Plan and to identify transport schemes and measures to support the LDF / Local Plan. The transport model for Barnstaple and Bideford has been used to assess the impact of future development and identify appropriate transport infrastructure requirements.
1.2 A SATURN highway assignment model has been developed for the working weekday AM and PM peak hours and an average inter peak hour for the 2008 base year with subsequent updates to represent 2010 levels. The model meets the required WebTAG validation criteria of networks, traffic flows, journey time, model convergence and trip distribution.
2. Model Development
2.1 The previous Barnstaple SATURN highway network was extended to include Bideford with a more detailed network and a finer 139 zone system. The coded base year network consists of 1,266 road links (single direction) and 630 nodes with 475 priority, 4 roundabouts and 19 traffic signal junctions. Most roundabouts were coded as a series of priority junctions.
2.2 The highway network was not extended outside the external modelling cordon as roads crossing the cordon formed external traffic loading points and no switching of traffic movements between external loading points was envisaged.
2.3 The whole model area was included in the simulation area and all junctions, apart from minor and access roads, were simulated in SATURN. Speed/flow relationships were included only for the long links on the A39 and A361. Junction coding from the previous model was reviewed and generally retained. For junctions in the extended network a simplified coding method was adopted with standardised saturation capacities and gap sizes.
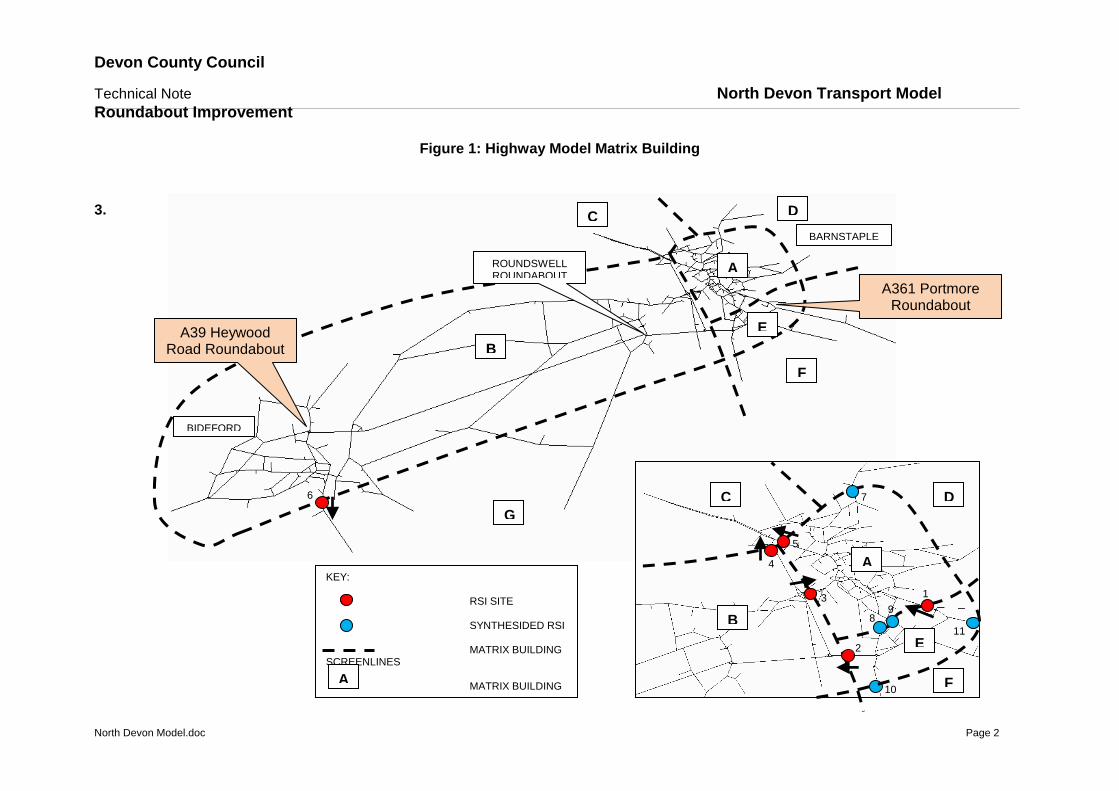
2.4 Roadside interviews were carried out at 6 sites in November 2008. Synthesised data was generated for the non-interview direction using TEMPRO trip time probabilities. Matrices were also synthesised for 5 sites needed to complete screen lines for the matrix building process, see Figure 1. Select link matrices were obtained from the previous SATURN model and factored to up to date traffic counts. Unobserved traffic movements within the matrix building sectors were also synthesised using TEMPRO trip end data, 2001 Census journey to work data and gravity models calibrated from the roadside interview data.
2.5 Matrix building used combinations of observed and synthesised roadside interview data to form different parts of the origin destination matrices. The synthesised matrices were used to fill in internal intra-sector movements.
2.6 Interview and synthesised data was processed to build AM and PM peak hour and average inter peak hour vehicle matrices by 5 separate user classes (private vehicle HB Work, HB Employers Business and Other purposes plus LGV and HGV). The user class matrices were kept separate for multi user class assignment in SATURN.
Devon County Council
Technical Note North Devon Transport Model
Roundabout Improvement
North Devon Model.doc Page 2
Figure 1: Highway Model Matrix Building
3.
A
B
C D
E
F
G
KEY: RSI SITE SYNTHESIDED RSI MATRIX BUILDING SCREENLINES MATRIX BUILDING SECTOR
A
A
B
C D
E
F
1
2
3
4
5
6 7
8 9
10
11
BIDEFORD
BARNSTAPLE
ROUNDSWELL ROUNDABOUT
A39 Heywood Road Roundabout
A361 Portmore Roundabout
Devon County Council
Technical Note North Devon Transport Model
North Devon Model.doc Page 3
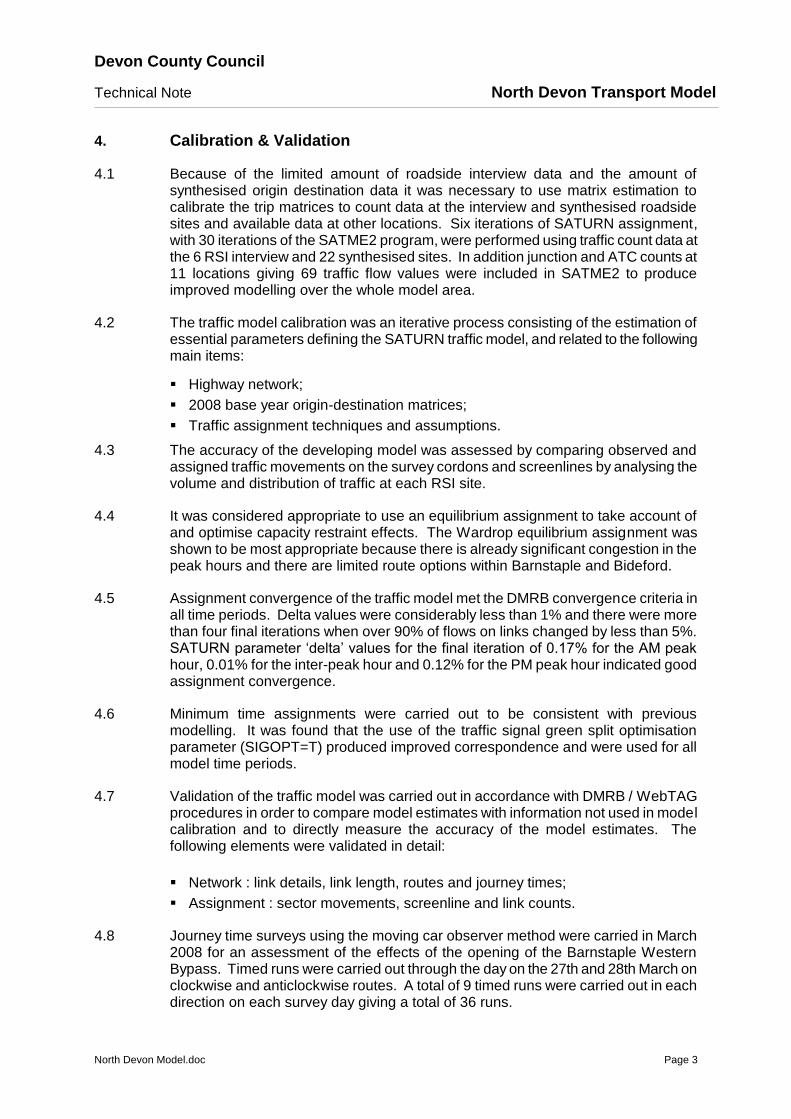
4. Calibration & Validation
4.1 Because of the limited amount of roadside interview data and the amount of synthesised origin destination data it was necessary to use matrix estimation to calibrate the trip matrices to count data at the interview and synthesised roadside sites and available data at other locations. Six iterations of SATURN assignment, with 30 iterations of the SATME2 program, were performed using traffic count data at the 6 RSI interview and 22 synthesised sites. In addition junction and ATC counts at 11 locations giving 69 traffic flow values were included in SATME2 to produce improved modelling over the whole model area.
4.2 The traffic model calibration was an iterative process consisting of the estimation of essential parameters defining the SATURN traffic model, and related to the following main items:
Highway network;
2008 base year origin-destination matrices;
Traffic assignment techniques and assumptions.
4.3 The accuracy of the developing model was assessed by comparing observed and assigned traffic movements on the survey cordons and screenlines by analysing the volume and distribution of traffic at each RSI site.
4.4 It was considered appropriate to use an equilibrium assignment to take account of and optimise capacity restraint effects. The Wardrop equilibrium assignment was shown to be most appropriate because there is already significant congestion in the peak hours and there are limited route options within Barnstaple and Bideford.
4.5 Assignment convergence of the traffic model met the DMRB convergence criteria in all time periods. Delta values were considerably less than 1% and there were more than four final iterations when over 90% of flows on links changed by less than 5%. SATURN parameter ‘delta’ values for the final iteration of 0.17% for the AM peak hour, 0.01% for the inter-peak hour and 0.12% for the PM peak hour indicated good assignment convergence.
4.6 Minimum time assignments were carried out to be consistent with previous modelling. It was found that the use of the traffic signal green split optimisation parameter (SIGOPT=T) produced improved correspondence and were used for all model time periods.
4.7 Validation of the traffic model was carried out in accordance with DMRB / WebTAG procedures in order to compare model estimates with information not used in model calibration and to directly measure the accuracy of the model estimates. The following elements were validated in detail:
Network : link details, link length, routes and journey times;
Assignment : sector movements, screenline and link counts.
4.8 Journey time surveys using the moving car observer method were carried in March 2008 for an assessment of the effects of the opening of the Barnstaple Western Bypass. Timed runs were carried out through the day on the 27th and 28th March on clockwise and anticlockwise routes. A total of 9 timed runs were carried out in each direction on each survey day giving a total of 36 runs.
Devon County Council
Technical Note North Devon Transport Model
North Devon Model.doc Page 4
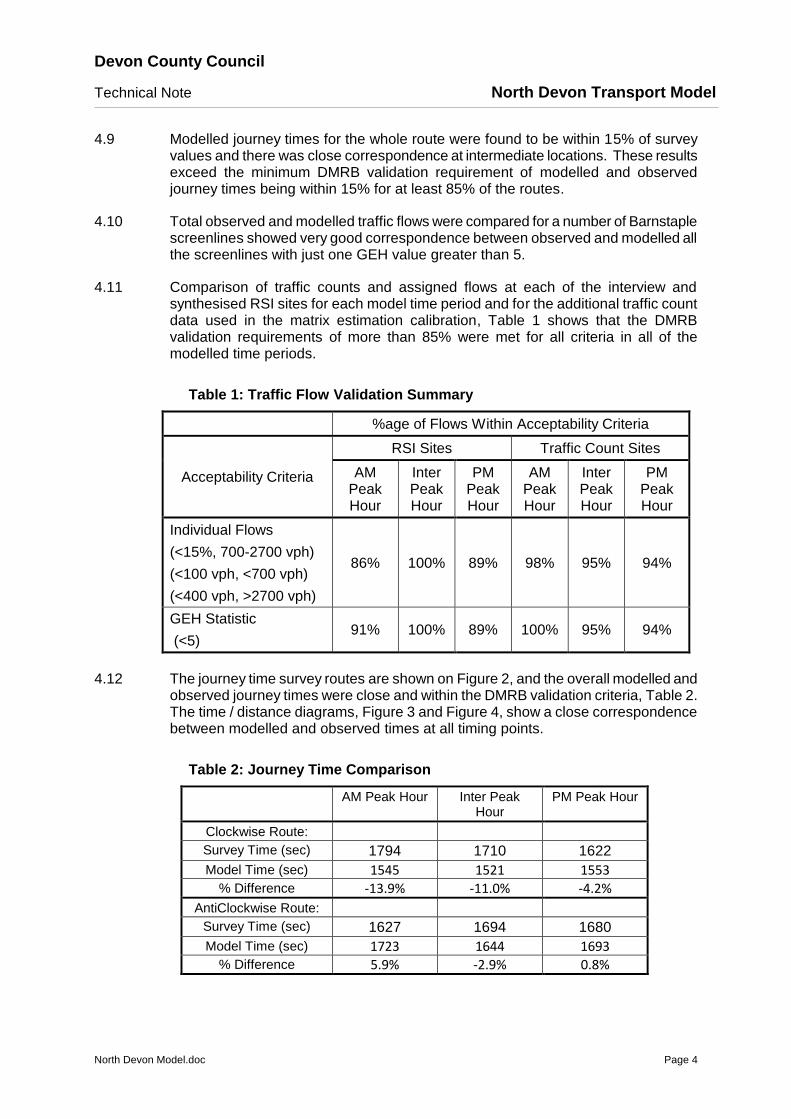
4.9 Modelled journey times for the whole route were found to be within 15% of survey values and there was close correspondence at intermediate locations. These results exceed the minimum DMRB validation requirement of modelled and observed journey times being within 15% for at least 85% of the routes.
4.10 Total observed and modelled traffic flows were compared for a number of Barnstaple screenlines showed very good correspondence between observed and modelled all the screenlines with just one GEH value greater than 5.
4.11 Comparison of traffic counts and assigned flows at each of the interview and synthesised RSI sites for each model time period and for the additional traffic count data used in the matrix estimation calibration, Table 1 shows that the DMRB validation requirements of more than 85% were met for all criteria in all of the modelled time periods.
Table 1: Traffic Flow Validation Summary
%age of Flows Within Acceptability Criteria
Acceptability Criteria
RSI Sites Traffic Count Sites
AM Peak Hour
Inter Peak Hour
PM Peak Hour
AM Peak Hour
Inter Peak Hour
PM Peak Hour
Individual Flows
(<15%, 700-2700 vph)
(<100 vph, <700 vph)
(<400 vph, >2700 vph)
86% 100% 89% 98% 95% 94%
GEH Statistic
(<5) 91% 100% 89% 100% 95% 94%
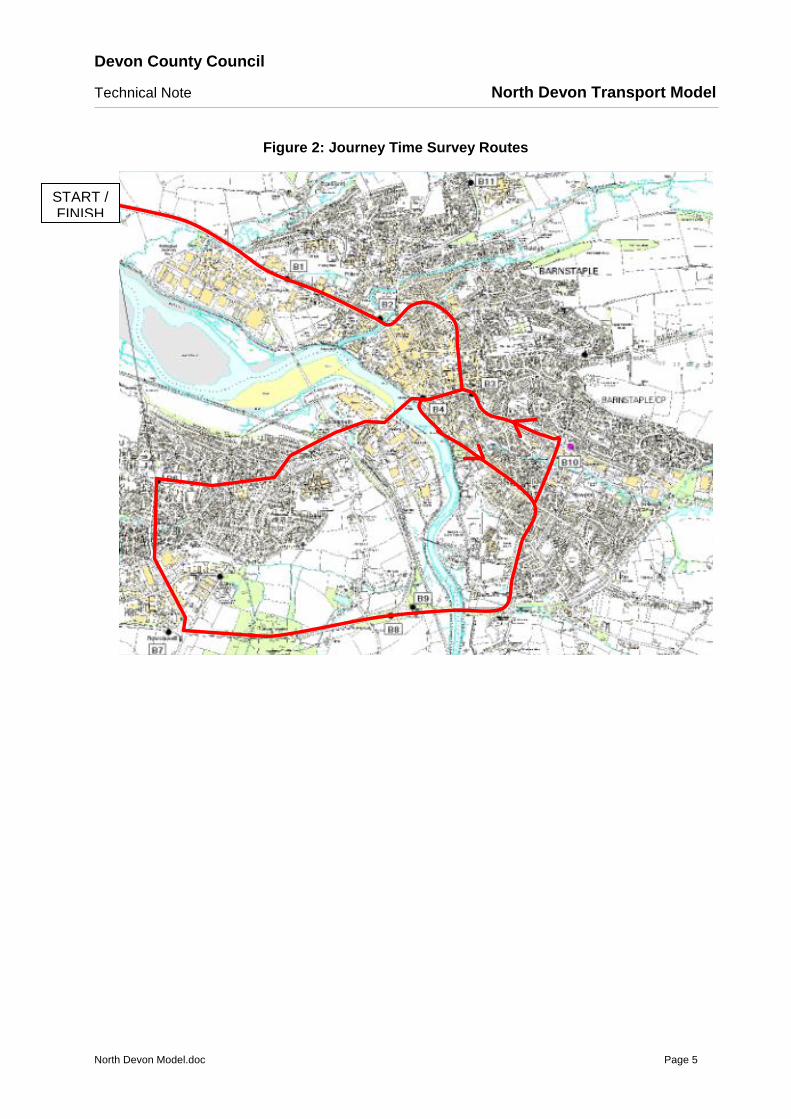
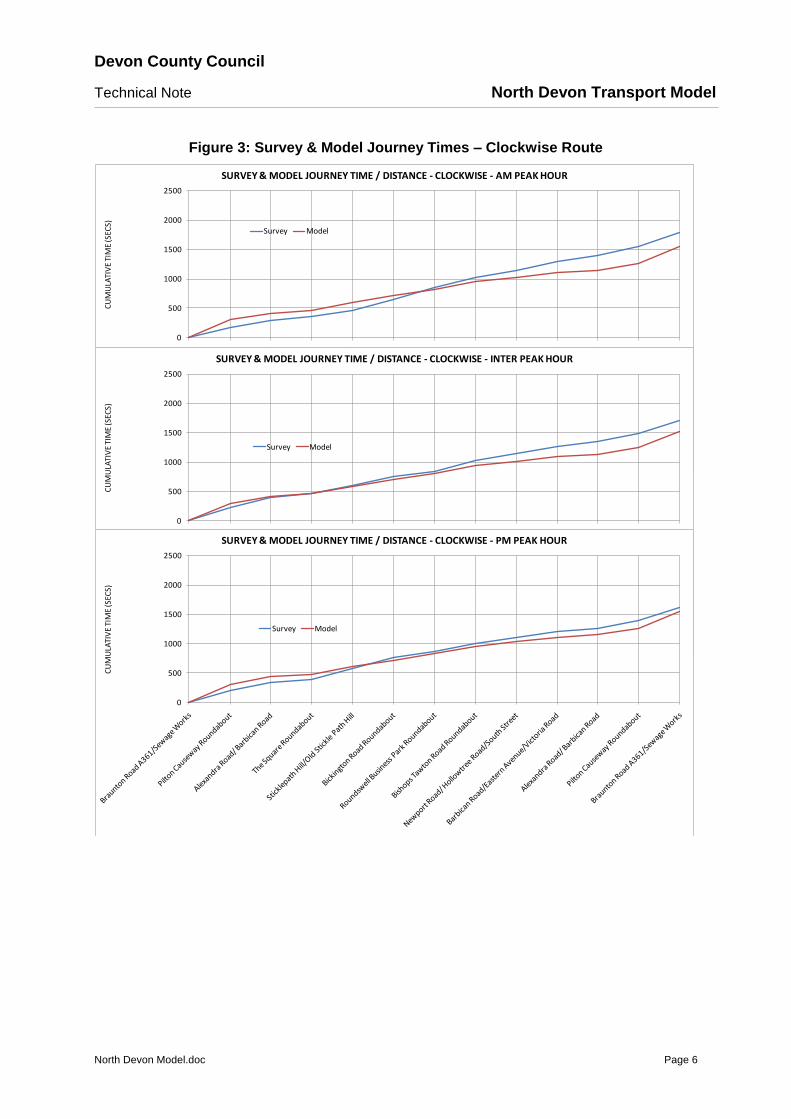
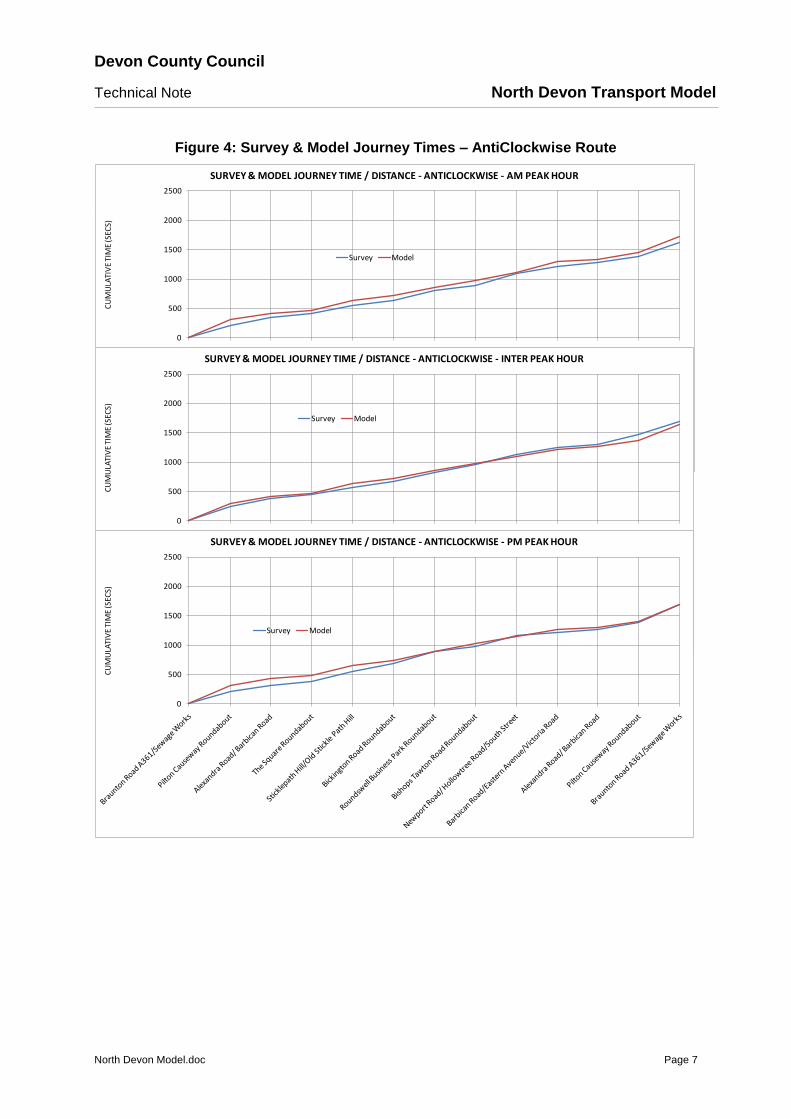
4.12 The journey time survey routes are shown on Figure 2, and the overall modelled and
observed journey times were close and within the DMRB validation criteria, Table 2. The time / distance diagrams, Figure 3 and Figure 4, show a close correspondence between modelled and observed times at all timing points.
Table 2: Journey Time Comparison
AM Peak Hour Inter Peak Hour
PM Peak Hour
Clockwise Route:
Survey Time (sec) 1794 1710 1622
Model Time (sec) 1545 1521 1553 % Difference -13.9% -11.0% -4.2%
AntiClockwise Route:
Survey Time (sec) 1627 1694 1680
Model Time (sec) 1723 1644 1693 % Difference 5.9% -2.9% 0.8%
Devon County Council
Technical Note North Devon Transport Model
North Devon Model.doc Page 5
Figure 2: Journey Time Survey Routes
START / FINISH
Devon County Council
Technical Note North Devon Transport Model
North Devon Model.doc Page 6
Figure 3: Survey & Model Journey Times – Clockwise Route
0
500
1000
1500
2000
2500
CU
MU
LATI
VE
TIM
E (S
ECS)
SURVEY & MODEL JOURNEY TIME / DISTANCE - CLOCKWISE - AM PEAK HOUR
Survey Model
0
500
1000
1500
2000
2500
CU
MU
LATI
VE
TIM
E (S
ECS)
SURVEY & MODEL JOURNEY TIME / DISTANCE - CLOCKWISE - INTER PEAK HOUR
Survey Model
0
500
1000
1500
2000
2500
CU
MU
LATI
VE
TIM
E (S
ECS)
SURVEY & MODEL JOURNEY TIME / DISTANCE - CLOCKWISE - PM PEAK HOUR
Survey Model
Devon County Council
Technical Note North Devon Transport Model
North Devon Model.doc Page 7
Figure 4: Survey & Model Journey Times – AntiClockwise Route
5.
0
500
1000
1500
2000
2500
CU
MU
LATI
VE
TIM
E (S
ECS)
SURVEY & MODEL JOURNEY TIME / DISTANCE - ANTICLOCKWISE - AM PEAK HOUR
Survey Model
0
500
1000
1500
2000
2500
CU
MU
LATI
VE
TIM
E (S
ECS)
SURVEY & MODEL JOURNEY TIME / DISTANCE - ANTICLOCKWISE - INTER PEAK HOUR
Survey Model
0
500
1000
1500
2000
2500
CU
MU
LATI
VE
TIM
E (S
ECS)
SURVEY & MODEL JOURNEY TIME / DISTANCE - ANTICLOCKWISE - PM PEAK HOUR
Survey Model