Embed Size (px)
Citation preview
DHS ANALYTICAL STUDIES 39
PREVENTING MalaRIa DURING PREGNaNcy IN SUb-SahaRaN afRIca:DETERMINaNTS of EffEcTIVE IPTp DElIVERy
SEPTEMbER 2013
This publication was produced for review by the United States Agency for International Development. It was prepared by Lia Florey of ICF International, Calverton, Maryland, USA.
MEASURE DHS assists countries worldwide in the collection and use of data to monitor and evaluate population, health, and nutrition programs. Additional information about the MEASURE DHS project can be obtained by contacting MEASURE DHS, ICF International, 11785 Beltsville Drive, Suite 300, Calverton, MD 20705 (telephone: 301-572-0200; fax: 301-572-0999; e-mail: [email protected]; internet: www.measuredhs.com).
The main objectives of the MEASURE DHS project are: • to provide decision-makers in survey countries with information useful for informed policy choices • to expand the international population and health database • to advance survey methodology and • to develop in participating countries the skills and resources necessary to conduct high-quality demographic
and health surveys
DHS Analytical Studies No. 39
Preventing Malaria during Pregnancy in Sub-Saharan Africa:
Determinants of Effective IPTp Delivery
Lia Florey
ICF International
Calverton, Maryland, USA
September 2013
Corresponding author: Lia Florey, International Health and Development, ICF International, 11785 Beltsville Drive, Calverton, Maryland 20705, USA; Phone: +1 301-572-0922; Fax: +1 301-572-099; E-mail: [email protected]
Acknowledgment: The author would like to thank Cameron Taylor for her invaluable assistance in producing maps and figures, Jessica Yi for help formatting tables, and Erin Eckert and Julie Gutman for expert advice, and guidance on methods and presentation. Rebecca Winter, Cameron Taylor, Erin Eckert and Susan Youll also provided invaluable feedback. Editor: Ward Rinehart, Jura Editorial Services Document Production: Yuan Cheng This study was carried out with support provided by the United States Agency for International Development (USAID) through the MEASURE DHS project (#GPO-C-00-08-00008-00). The views expressed are those of the authors and do not necessarily reflect the views of USAID or the United States Government. Recommended citation: Florey, Lia. 2013. Preventing Malaria during Pregnancy in Sub-Saharan Africa: Determinants of Effective IPTp Delivery. DHS Analytical Studies No. 39. Calverton, Maryland, USA: ICF International.
iii
Contents
List of Tables ............................................................................................................................................... v
List of Figures ............................................................................................................................................. vi
Preface ........................................................................................................................................................ vii
Executive Summary ................................................................................................................................... ix
Introduction ................................................................................................................................................. 1
Methods ........................................................................................................................................................ 5
Data ...................................................................................................................................................... 5
Variables ............................................................................................................................................... 7
Analyses ................................................................................................................................................ 9
Results ........................................................................................................................................................ 13
Descriptive Analyses ........................................................................................................................... 13
Descriptive Analyses—Antenatal Care ............................................................................................... 15
Descriptive Analyses—IPTp Coverage ............................................................................................... 20
Service Effectiveness Analyses ............................................................................................................ 23
Determinants of IPTp .......................................................................................................................... 25
Comparative Analyses of Lower and Higher IPTp Coverage Countries ............................................ 31
Discussion .................................................................................................................................................. 35
References .................................................................................................................................................. 39
Appendix .................................................................................................................................................... 43

v
List of Tables
Table 1. Information on populations included in analyses: survey information, national population size, sample size of target populations ......................................................................................... 5
Table 2. Basic information on variables included in analyses .................................................................... 8
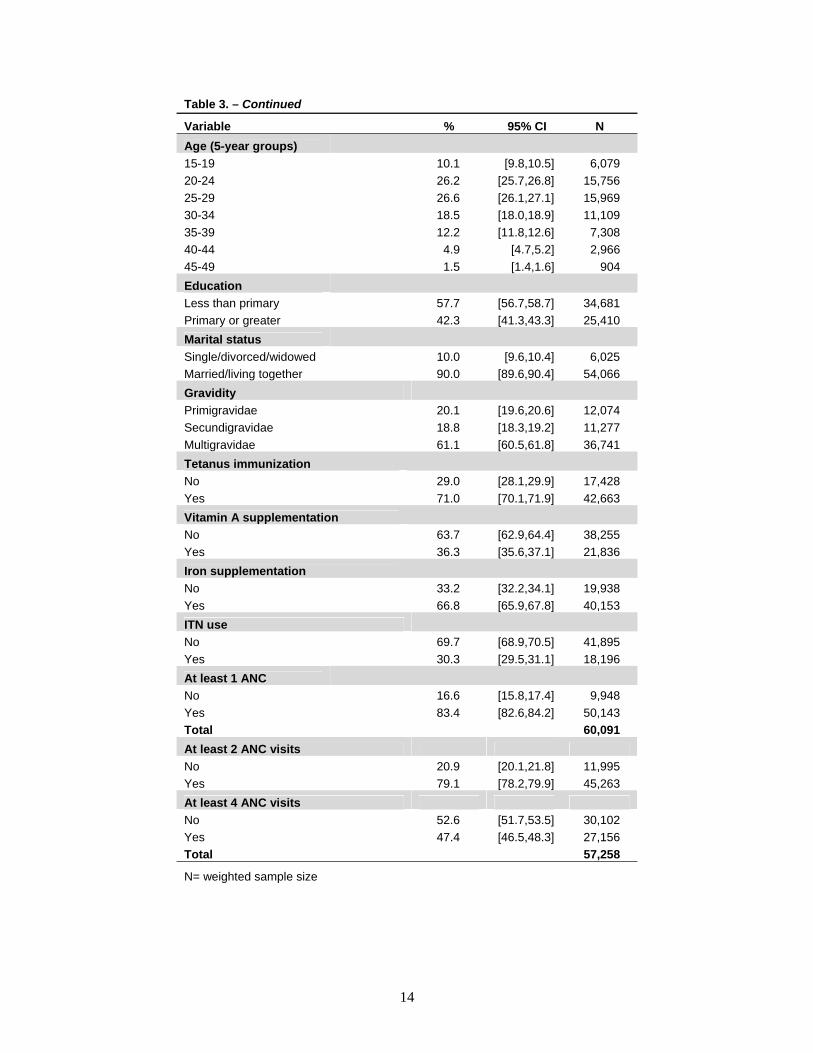
Table 3. Percent distribution of socioeconomic, demographic, and health variables in recently pregnant women age 15-49 years from multi-country, pooled survey data ............................... 13
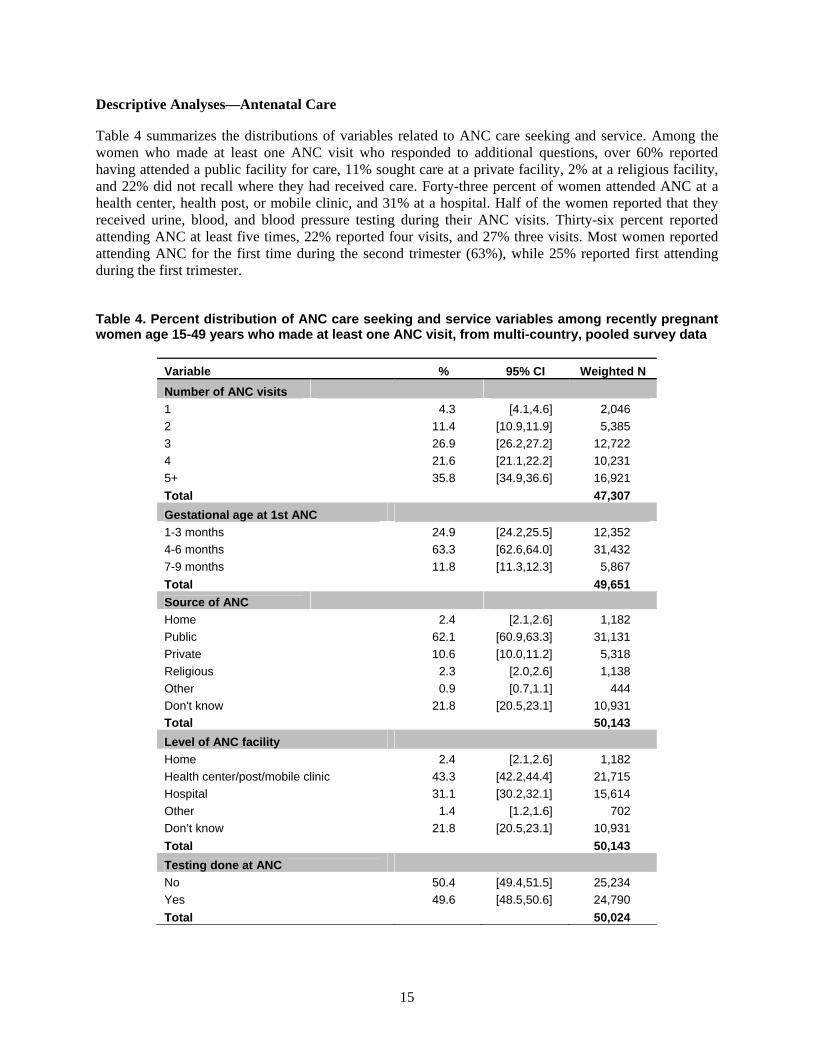
Table 4. Percent distribution of ANC care seeking and service variables among recently pregnant women age 15-49 years who made at least one ANC visit, from multi-country, pooled survey data .................................................................................................................................. 15
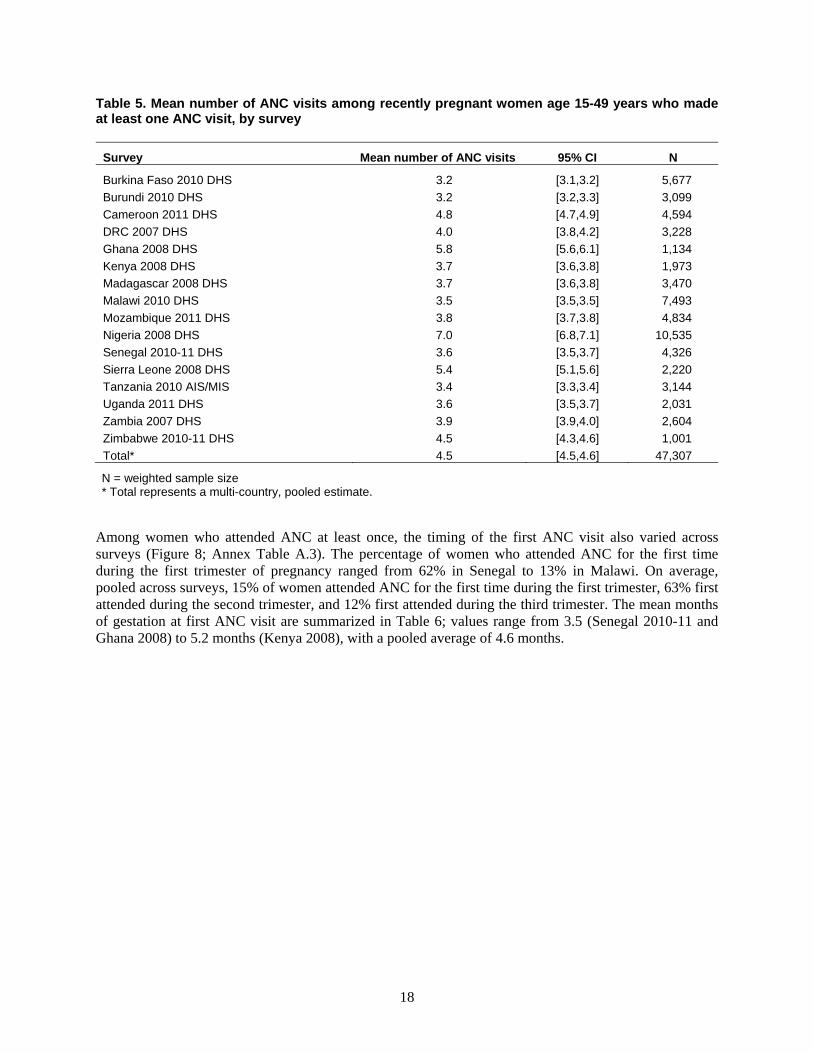
Table 5. Mean number of ANC visits among recently pregnant women age 15-49 years who made at least one ANC visit, by survey ............................................................................................... 18
Table 6. Mean months of gestation at first ANC visit among recently pregnant women age 15-49 years who made at least one ANC visit, by survey .................................................................... 19
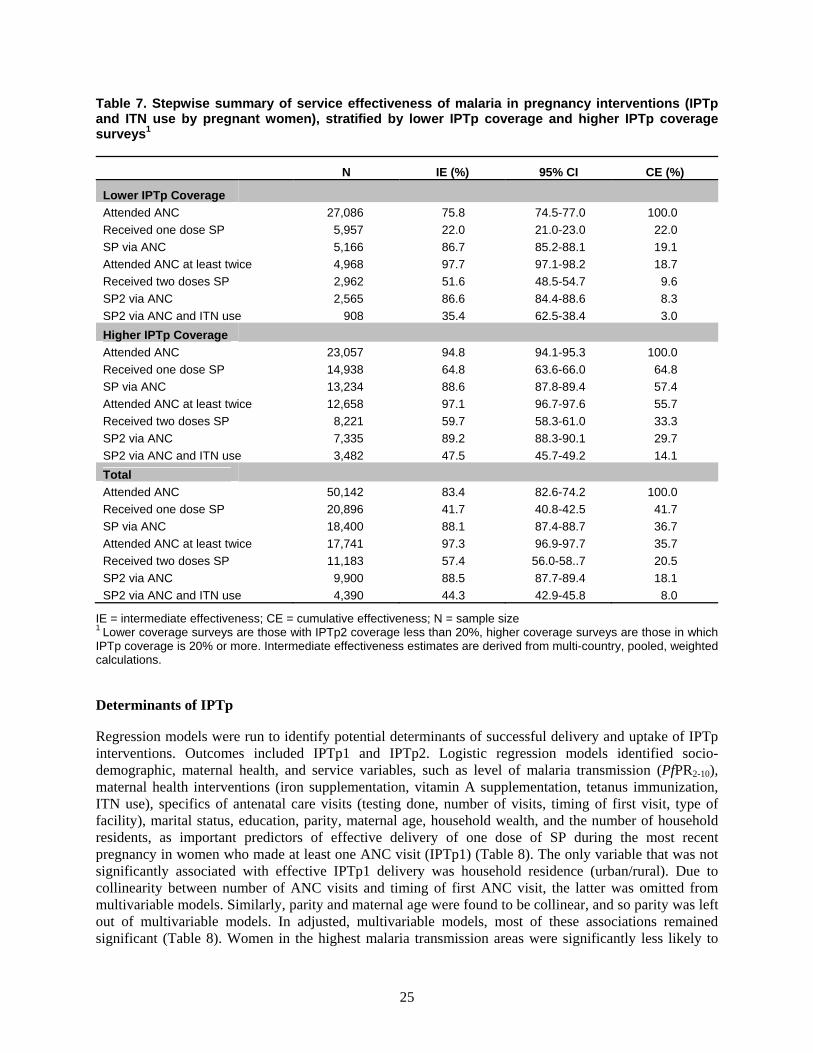
Table 7. Stepwise summary of service effectiveness of malaria in pregnancy interventions (IPTp and ITN use by pregnant women), stratified by lower IPTp coverage and higher IPTp coverage surveys ......................................................................................................................... 25
Table 8. Results of pooled, univariate and adjusted, multivariable logistic regression models of IPTp1 use among women age 15-49 years with a live birth in the past two years who made at least one ANC visit during the most recent pregnancy ........................................................... 27
Table 9. Results of pooled, univariate and adjusted, multivariable logistic regression models of IPTp2 use among women age 15-49 years with a live birth in the past two years who made at least one ANC visit during the most recent pregnancy ........................................................... 29
Table 10. Comparing groups of higher and lower IPTp coverage countries by percent distributions of health intervention and ANC service-related determinants of IPTp2 among recently pregnant women age 15-49 years who made at least one ANC visit .......................................... 32
Table A.1. Percentage of recently pregnant women age 15-49 years who made at least one, at least two, and at least four ANC visits, by survey .............................................................................. 44
Table A.2. Percentage of recently pregnant women age 15-49 years who made at least one ANC visit, by number of ANC visits and by survey ............................................................................ 45
Table A.3. Percentage of recently pregnant women age 15-49 years who made at least one ANC visit, by timing of first ANC visit and by survey........................................................................ 46
Table A.4. Percentage of recently pregnant women age 15-49 years who took SP, by dose, by survey, and by higher and lower IPTp coverage countries ......................................................... 47
vi
List of Figures
Figure 1. Service effectiveness framework for IPTp, adapted from Tanahashi, 1978 ................................. 3
Figure 2. Conceptual framework: Factors influencing effective delivery of interventions to prevent malaria in pregnancy .................................................................................................................... 4
Figure 3. Countries with survey data included in analyses .......................................................................... 6
Figure 4. Standard IPTp questions from nationally representative household surveys (DHS/MIS) .......... 10
Figure 5. Formula for calculating intermediate and cumulative effectiveness of malaria in pregnancy intervention delivery (adapted from Hill et al., 2013a) .............................................................. 11
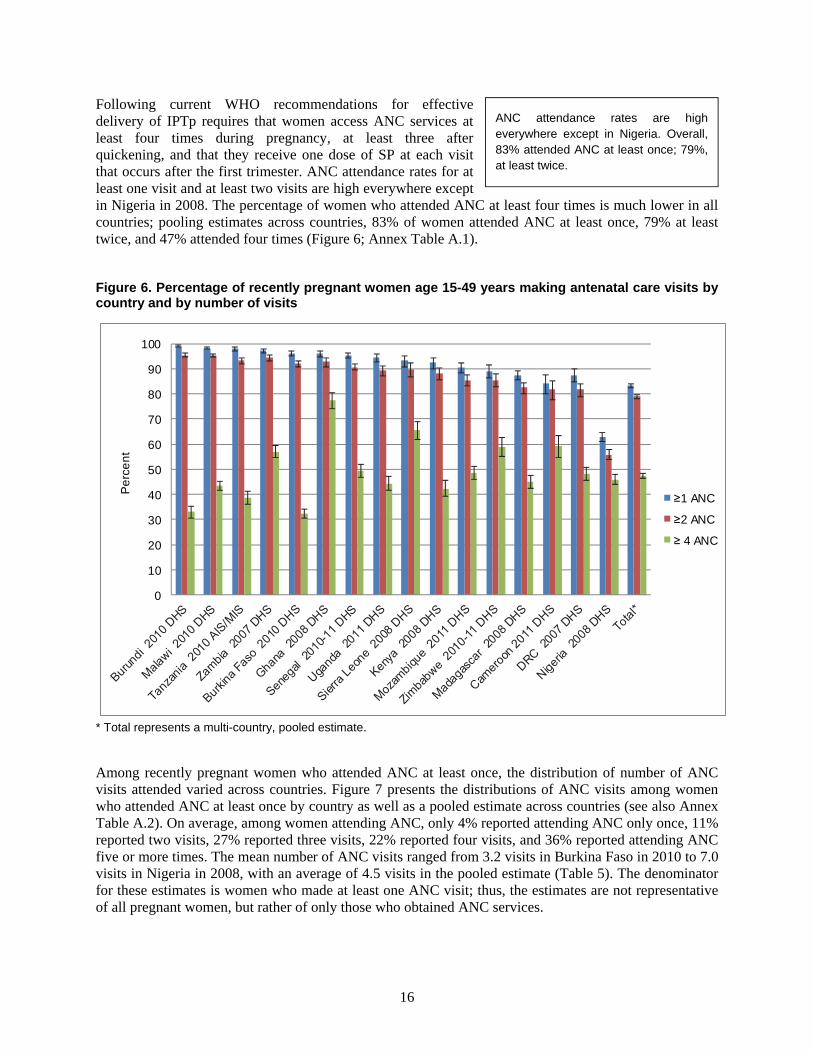
Figure 6. Percentage of recently pregnant women age 15-49 years making antenatal care visits by country and by number of visits ................................................................................................. 16
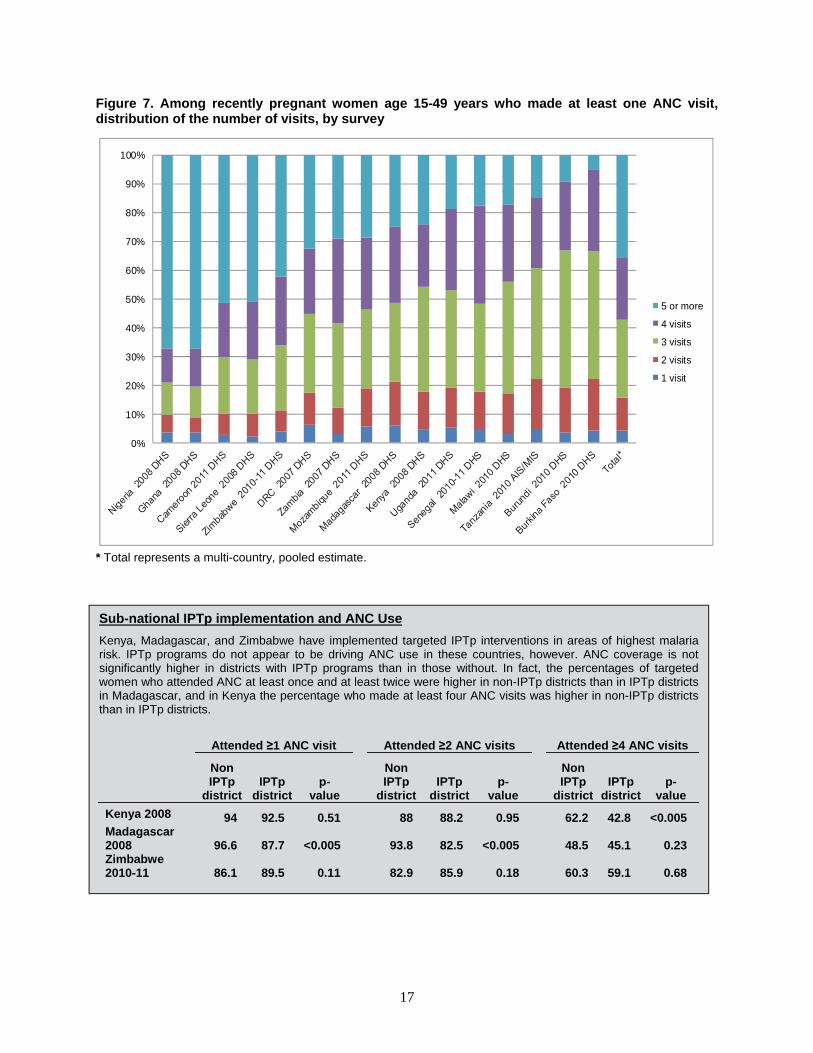
Figure 7. Among recently pregnant women age 15-49 years who made at least one ANC visit, distribution of the number of visits, by survey ........................................................................... 17
Figure 8. Distribution of timing of first ANC visits among recently pregnant women age 15-49 years who made at least one ANC visit, by survey .................................................................... 19
Figure 9. Percentage of recently pregnant women age 15-49 years receiving SP by number of doses and by survey .............................................................................................................................. 20
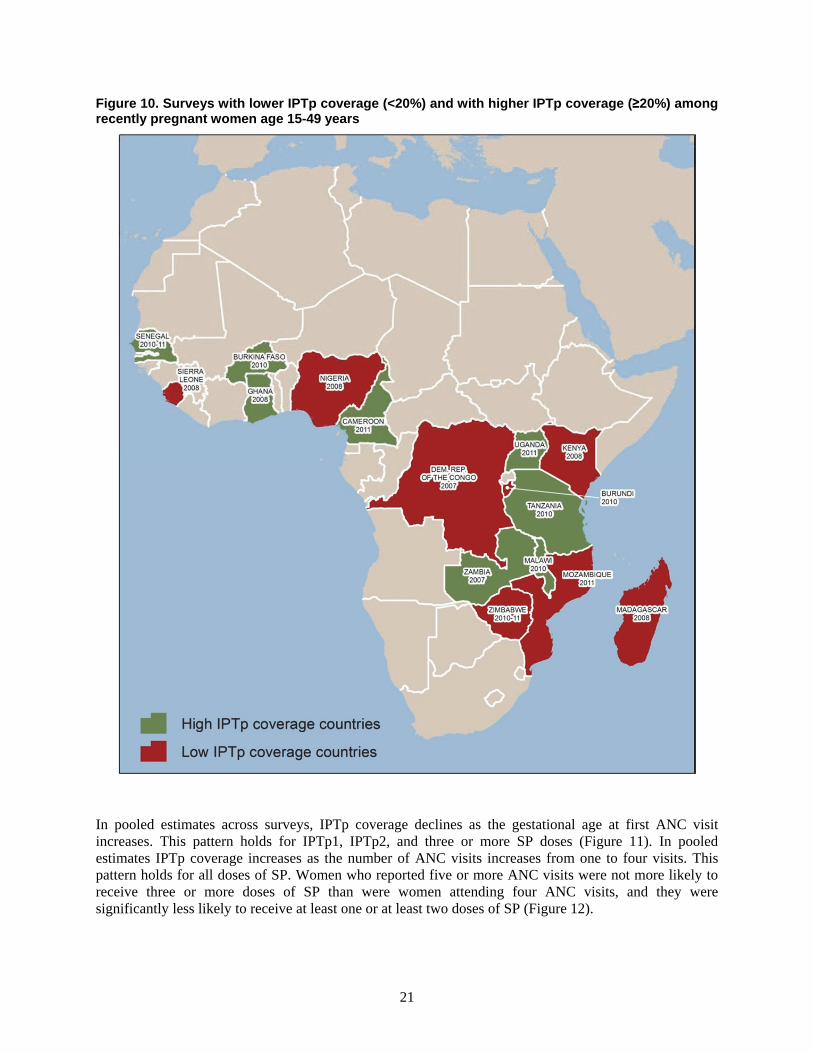
Figure 10. Surveys with lower IPTp coverage (<20%) and with higher IPTp coverage (≥20%) among recently pregnant women age 15-49 years ................................................................................. 21
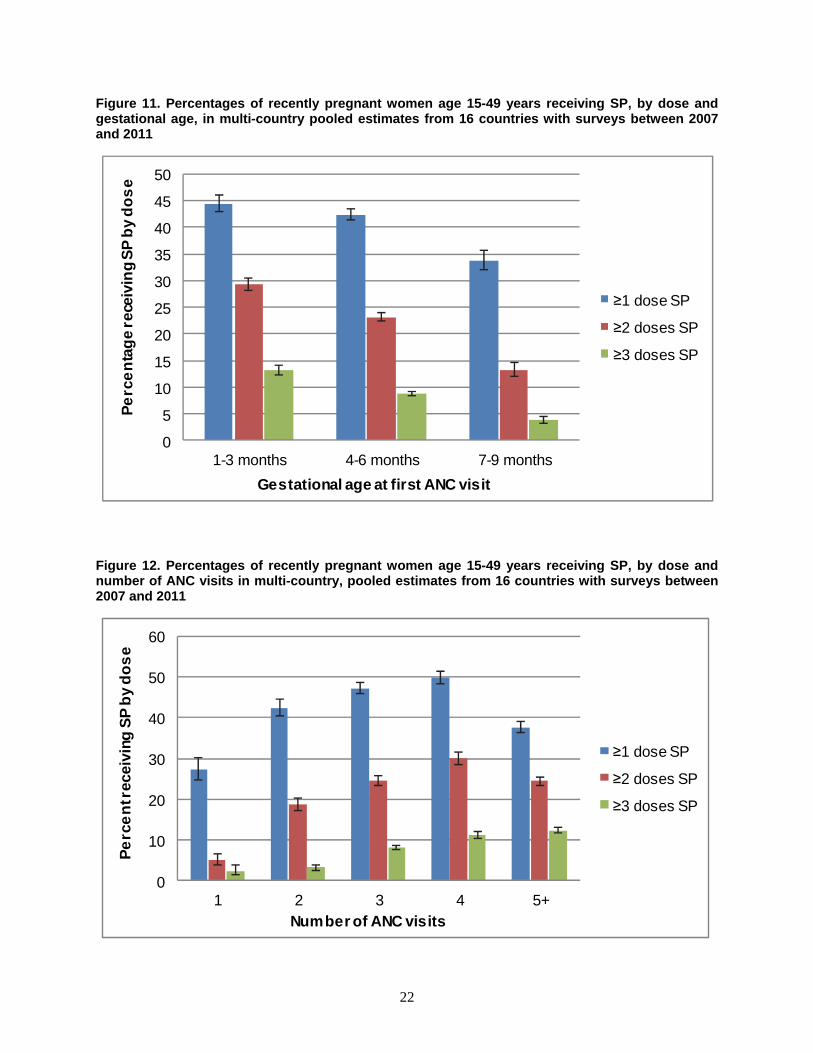
Figure 11. Percentages of recently pregnant women age 15-49 years receiving SP, by dose and gestational age, in multi-country pooled estimates from 16 countries with surveys between 2007 and 2011 ............................................................................................................................ 22
Figure 12. Percentages of recently pregnant women age 15-49 years receiving SP, by dose and number of ANC visits in multi-country, pooled estimates from 16 countries with surveys between 2007 and 2011 .............................................................................................................. 22
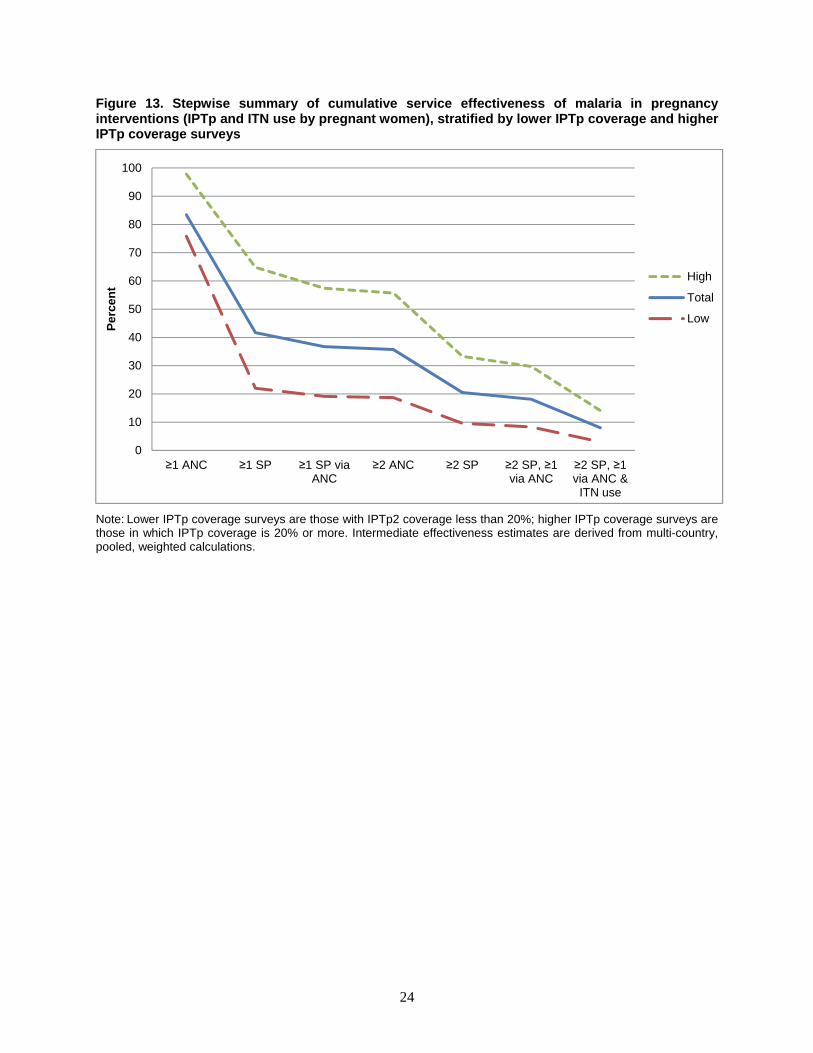
Figure 13. Stepwise summary of cumulative service effectiveness of malaria in pregnancy interventions (IPTp and ITN use by pregnant women), stratified by lower IPTp coverage and higher IPTp coverage surveys .............................................................................................. 24
Figure 14. In higher and lower IPTp coverage countries, percent distributions of determinants of IPTp2 in recently pregnant women age 15-49 years who made at least one ANC visit ............. 33
Figure A.1. IPTp intervention districts in Kenya 2008, Madagascar 2008, and Zimbabwe 2010-11 ......... 43
vii
Preface
One of the most significant contributions of the MEASURE DHS program is the creation of an internationally comparable body of data on the demographic and health characteristics of populations in developing countries.
The DHS Comparative Reports series examines these data across countries in a comparative framework. The DHS Analytical Studies series focuses on analysis of specific topics. The principal objectives of both series are to provide information for policy formulation at the international level and to examine individual country results in an international context.
While Comparative Reports are primarily descriptive, Analytical Studies provide in-depth, focused studies on a variety of substantive topics. The studies are based on a varying number of data sets, depending on the topic being examined. These studies employ a range of methodologies, including multivariate statistical techniques.
MEASURE DHS staff, in conjunction with the U.S. Agency for International Development (USAID), selects the topics covered in Analytical Studies.
It is anticipated that the DHS Analytical Studies will enhance the understanding of analysts and policymakers regarding significant issues in the fields of international population and health.
Sunita Kishor Project Director

ix
Executive Summary
Malaria infection during pregnancy leads to adverse health outcomes for both mothers and infants. Intermittent preventive treatment during pregnancy (IPTp) of at least two doses of sulphadoxine-pyrimethamine (SP), administered at antenatal care (ANC) visits, is an effective prevention intervention in malaria-endemic areas. Despite increasing investment in IPTp programs across malaria-endemic sub-Saharan African countries over the past decade, and despite high rates of attendance at ANC visits, use of IPTp remains low. Identifying factors associated with successful delivery of IPTp may help guide improvements in intervention programs. To this end, this study compares IPTp delivery processes and socio-demographic and behavioral factors related to successful delivery and use of IPTp in countries with different levels of IPTp coverage.
Objectives
This study has three objectives:
1) Assess the cumulative and intermediate effectiveness of the IPTp delivery system
2) Identify determinants of IPTp use
3) Compare determinants of IPT delivery and use in countries with lower IPTp coverage and those with higher coverage
Methods
To identify bottlenecks in IPTp delivery, service effectiveness analyses were performed on data from 16 Demographic and Health Surveys (DHS) and Malaria Indictor Surveys (MIS) conducted between 2007 and 2011 in sub-Saharan African countries with endemic malaria. Both cumulative and intermediate effectiveness were measured. Multi-country, pooled, multivariate logistic regressions were used to identify determinants of IPTp1 (that is, at least one dose of SP) and IPTp2 (at least two doses of SP). To identify any differential patterns, distributions of key determinants were compared for lower IPTp coverage countries (<20% IPTp use) and higher IPTp coverage countries (≥20% IPTp use).
Results
IPTp was effectively delivered for only 18% of targeted women. Access to ANC services was not identified as a major reason for this low rate, however. In fact, 83% attended ANC at least once and 97% of those receiving one dose of SP attended ANC twice. The main problem appears to be that levels of SP delivery to those attending ANC was low: 42% of those attending one ANC visit received one SP dose, and 57% of those attending two ANC visits received two SP doses.
Intermediate and cumulative effectiveness of IPTp delivery systems varied substantially between higher and lower IPTp coverage countries. Determinants of IPTp1 and IPTp2 use included number of ANC visits, receipt of other maternal health interventions, and malaria transmission level. Individual socio-demographic factors such as marital status, mother’s education, and mother’s age were associated with IPTp1 but were not significantly associated with IPTp2 in multivariate models. Distribution of key determinants varied significantly between women in lower IPTp coverage countries and those in higher IPTp coverage countries. Women in higher coverage countries made fewer ANC visits, attended ANC for the first time earlier in gestation, and were more likely to use ANC services at public or religious facilities than were women in lower coverage countries. Women in higher IPTp coverage countries were less likely
x
to live in areas of highest malaria risk and more likely to live in areas of intermediate risk than were women from lower IPTp coverage countries.
Conclusions
IPTp is not being effectively delivered in malaria-endemic countries of sub-Saharan Africa. Most pregnant women are obtaining ANC services at sufficient frequency and appropriate timing to permit IPTp delivery, but the intervention is not being effectively delivered in these settings. Number and timing of ANC visits as well as type of health facility are important predictors of IPTp delivery, as is malaria transmission risk. Surprisingly, women in high malaria transmission areas are less likely to use IPTp than those in low transmission areas, suggesting a need for reallocation of resources. Women in lower IPTp coverage countries attended more ANC visits than women in higher IPTp coverage countries, providing further evidence of the relative importance of behavioral or service-related factors other than ANC attendance in determining the effectiveness of IPTp delivery. Further study of interactions between women and providers at the health facilities will be necessary to design improvements in the delivery of this life-saving intervention.
1
Introduction
Although great progress has been made in the fight to reduce malaria in recent years, malaria still kills 655,000 people every year and infects as many as 219 million (World Health Organization, 2012b). Pregnant women are particularly susceptible to malaria, which elevates the risk of poor health outcomes for mothers and children alike (Brabin, 1983; Guyatt and Snow, 2004; Lindsay et al., 2000; Steketee et al., 2001). Placental parasitemia can cause maternal anemia (Guyatt and Snow, 2001a) and low birth weight (Brabin, 1983; Guyatt and Snow, 2004), both of which are risk factors for neonatal mortality (Guyatt and Snow, 2001b; Marchant et al., 2004). As millions of pregnancies occur every year in malaria-endemic countries, the scope and severity of the potential adverse health outcomes makes prevention of malaria in pregnant women an important priority. In 2007 approximately 32 million pregnancies occurred in malaria-endemic regions of sub-Saharan Africa (Dellicour et al., 2010).
The World Health Organization (WHO) recommends a three-pronged approach to malaria prevention and control in areas of stable malaria transmission in Africa, including use of insecticide-treated bednets (ITNs) and intermittent preventive treatment (IPTp) for malaria prevention as well as timely and effective management of clinical malaria and anemia (World Health Organization, 2012a). These interventions commonly are provided through existing antenatal care (ANC) programs. ITNs are also distributed through mass house-to-house campaigns. Current IPTp guidelines recommend one dose of sulphadoxine-pyrimethamine (SP) at each ANC visit after the first trimester, with at least one month between doses (World Health Organization, 2012a). Use of both ITNs and IPTp during pregnancy leads to reduced risk of disease and of adverse birth outcomes (Eisele et al., 2012; Gamble et al., 2007; Menéndez et al., 2010), and both have been shown to be cost-effective interventions (Sicuri et al., 2010; van Vugt et al., 2011).
Due to the effectiveness of these interventions and the risk associated with inaction, the Roll Back Malaria (RBM) Partnership has set goals of 100% coverage of IPTp and of ITN use by 2015 (Roll Back Malaria Partnership, 2011). Unfortunately, many countries are far from achieving that goal. A recent review of nationally representative survey data from 2009-2011 from sub-Saharan Africa reported that median coverage of interventions for malaria in pregnancy was low (21.5% for IPTp and 38.8% for use of ITNs among pregnant women) despite high use of ANC services (75.1% of women attended at least two ANC visits) (van Eijk et al., 2013).
Patterns of access to and delivery of interventions to prevent malaria in pregnancy are not homogenous. Some countries have made great progress in reaching RBM goals, while others have struggled. For example, Malawi, Zambia, and Senegal have invested in integration of reproductive health and malaria control programs to address malaria in pregnancy through focused antenatal care (FANC)1 (Sethi et al., 2011; Wallon et al., 2011; Wallon et al., 2010). In 2002 WHO recommended FANC in lieu of the high-risk approach to ANC, with an aim to provide evidence-based interventions for all women at critical times in pregnancy (Villar et al., 2002). FANC programs in these countries have contributed to increased uptake of IPTp, although coverage still lags behind RBM goals.
1 FANC is defined as the minimum package of evidence-based services to all pregnant women during ANC to promote health, detect existing diseases, prevent and detect complications of pregnancy, and encourage birth preparedness. Source: World Health Organizations (WHO). Antenatal Care Randomized Trial: Manual for the Implementation of the New Model. Geneva, WHO, 2002. http://whqlibdoc.who.int/hq/2001/WHO_RHR_01.30.pdf
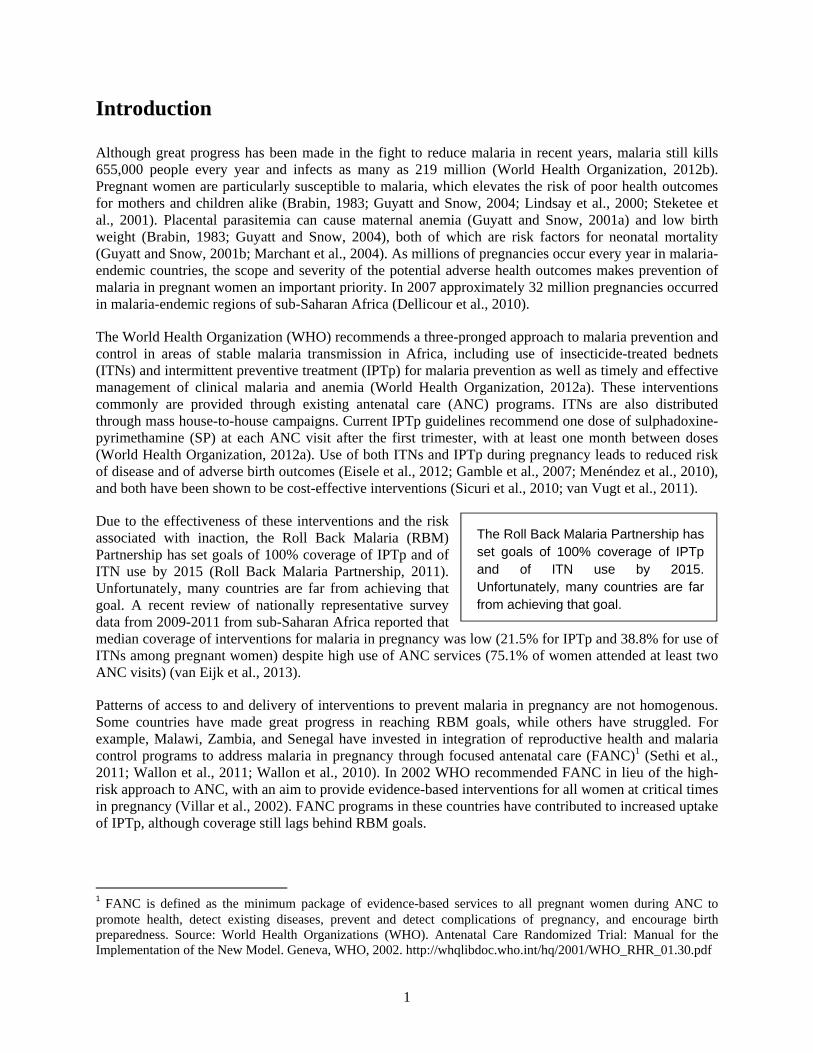
The Roll Back Malaria Partnership has set goals of 100% coverage of IPTp and of ITN use by 2015. Unfortunately, many countries are far from achieving that goal.
2
Identifying factors associated with higher IPTp coverage may help direct needed changes to intervention programs and thus lead to increases in coverage. This topic has received increasing attention in the literature of late, although most papers have been country-specific. For example, Webster and colleagues recently published several papers about IPTp in Segou region, Mali, analyzing health service effectiveness as it relates to prevention of malaria in pregnancy with IPTp (Webster et al., 2013a; Webster et al., 2013b). The authors identified gestational age, the amount of expenditure during ANC visits, and the woman’s current health status to be predictive of effective delivery of the intervention (Webster et al., 2013b). Health system factors found to discourage effective IPTp intervention included complex policy guidelines, lack of guidance on implementation, and institutional practices (Webster et al., 2013b). A similar study in Nyando District, Kenya, concluded that IPTp was not being effectively delivered and that the lack of effective delivery reduced the potential impact of the intervention by 231 low birth weight babies per 10,000 pregnant women (Hill et al., 2013a). As was found in other settings (Anders et al., 2008; Gross et al., 2011; Marchant et al., 2008; Sangaré et al., 2010), this study concluded that health care providers’ practices were more important than women’s ANC attendance in determining the effectiveness of the intervention delivery. A very recent systematic review and multi-country meta-analysis identified education, knowledge about malaria and IPTp, socioeconomic status, parity, and number and timing of ANC visits as key predictors of IPTp coverage (Hill et al., 2013b). Barriers to effective IPTp delivery included unclear IPTp policies, stockouts, user fees, poor performance of health care providers, and poor ANC attendance.
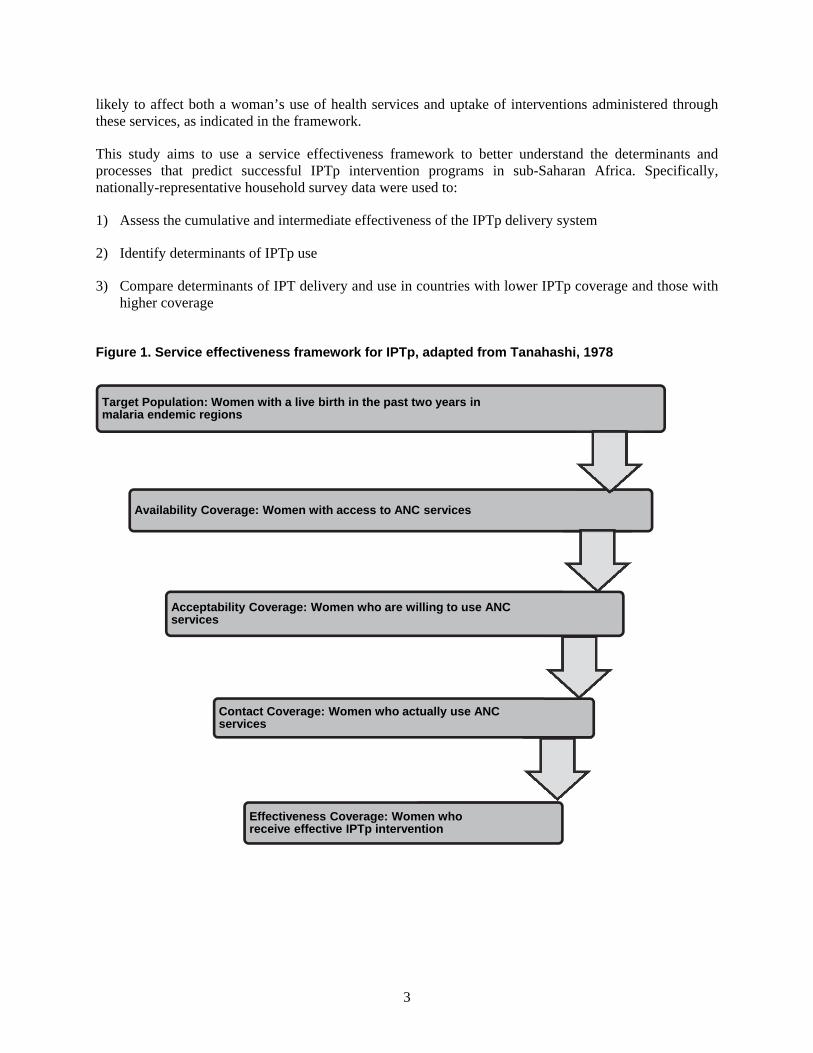
As IPTp is an intervention that is typically administered through formal health sector channels, it can be evaluated through a service effectiveness framework. Service effectiveness was described by Tanahashi as the result of interaction between a service and a target population over a range of processes beginning with resource allocation and ending in effective administration of an intervention (Tanahashi, 1978). Tanahashi conceived of this process as involving several stages, each with its own coverage measure, such that service effectiveness was ultimately a cumulative measure of the coverage of each separate stage. Examination of specific coverage for each stage allows identification of bottlenecks and permits further analyses of factors contributing to low coverage at any stage. Extensions of this framework have been developed by the malERA Consultative Group on Health Systems and Operational Research (2011) and by Webster and colleagues (Webster et al., 2010) and have been employed by other researchers to investigate the effectiveness of IPTp delivery systems (Hill et al., 2013a; Webster et al., 2013a). A variation of Tanahashi’s original framework is employed here to provide a general overview of the service delivery processes relevant to IPTp (Figure 1).
As this study uses household survey data, it is not possible to evaluate some of the steps in Tanahashi’s framework. For example, household survey data allow estimation of the target population and of the percentage of the target population that accessed ANC services (contact coverage) and the percentage of women who received effective IPTp intervention (effectiveness coverage). Survey data do not, however, allow estimation of the percentage of the target population with access to services (availability coverage) or the percentage that are willing to use services (acceptability coverage). A second, more detailed framework was developed based on Hill and colleagues’ design (Hill et al., 2013a) to home in on the specific processes that comprise the contact coverage and the effectiveness coverage in delivery of IPTp and to specify the factors likely to affect these processes (Figure 2). The framework includes factors previously mentioned that have been shown to be associated with uptake of IPTp, focusing on those that can be measured using household survey data. Unfortunately, few service-related factors are explicitly measured in standard nationally representative household surveys, and thus data used in these analyses are limited to individual characteristics of women and their households. These factors, such as maternal age, parity, use of other health interventions, household residence, level of endemic malaria risk, etc., are
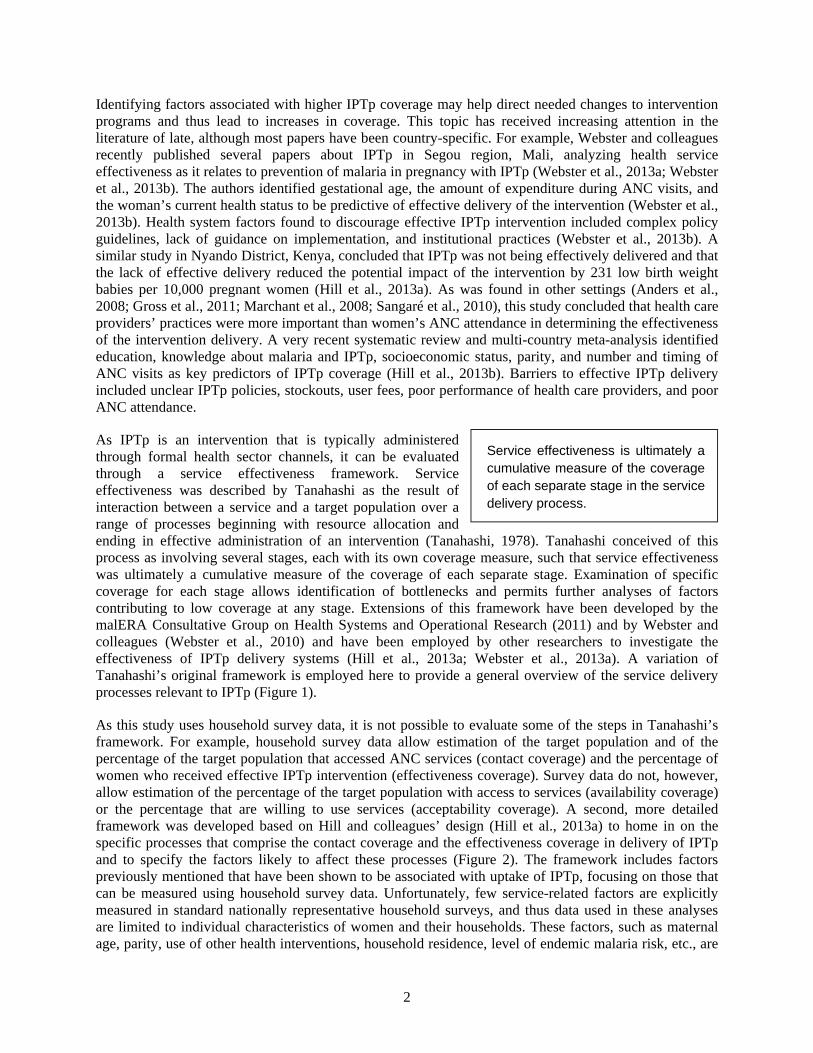
Service effectiveness is ultimately a cumulative measure of the coverage of each separate stage in the service delivery process.
3
likely to affect both a woman’s use of health services and uptake of interventions administered through these services, as indicated in the framework.
This study aims to use a service effectiveness framework to better understand the determinants and processes that predict successful IPTp intervention programs in sub-Saharan Africa. Specifically, nationally-representative household survey data were used to:
1) Assess the cumulative and intermediate effectiveness of the IPTp delivery system
2) Identify determinants of IPTp use
3) Compare determinants of IPT delivery and use in countries with lower IPTp coverage and those with higher coverage
Figure 1. Service effectiveness framework for IPTp, adapted from Tanahashi, 1978
Target Population: Women with a live birth in the past two years in malaria endemic regions
Availability Coverage: Women with access to ANC services
Acceptability Coverage: Women who are willing to use ANC services
Contact Coverage: Women who actually use ANC services
Effectiveness Coverage: Women who receive effective IPTp intervention
4
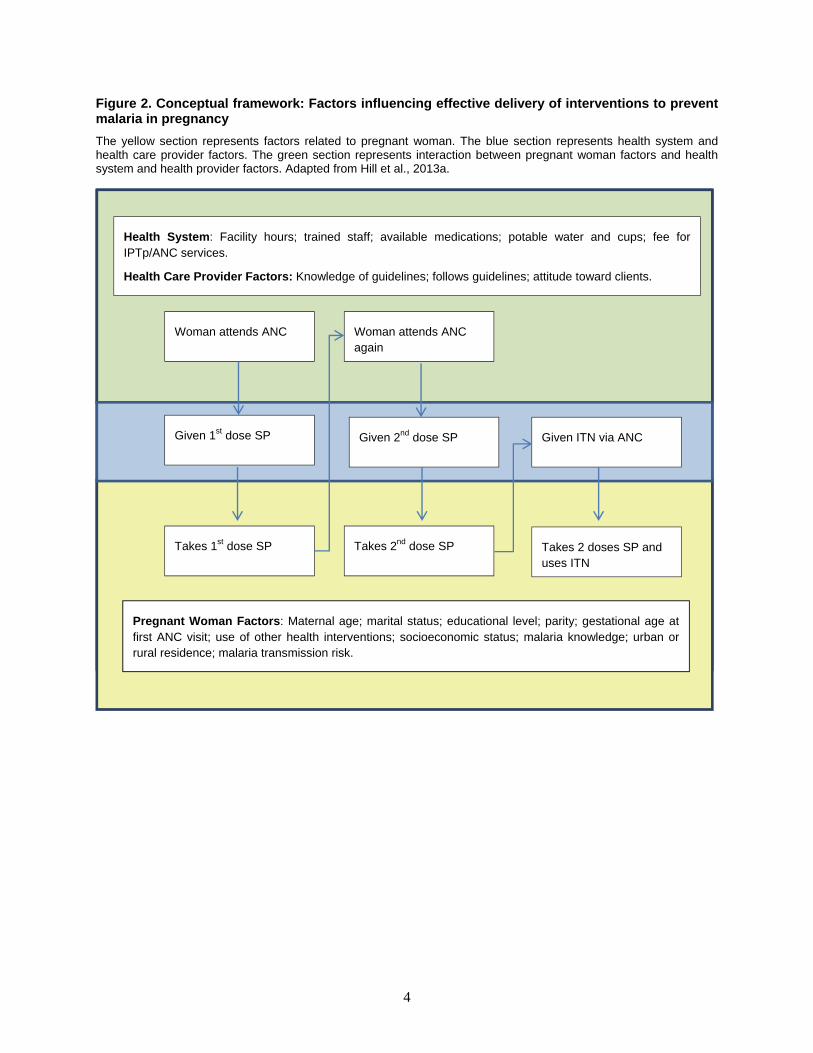
Figure 2. Conceptual framework: Factors influencing effective delivery of interventions to prevent malaria in pregnancy
The yellow section represents factors related to pregnant woman. The blue section represents health system and health care provider factors. The green section represents interaction between pregnant woman factors and health system and health provider factors. Adapted from Hill et al., 2013a.
Woman attends ANC Woman attends ANC again
Takes 1st dose SP Takes 2nd dose SP Takes 2 doses SP and uses ITN
Given 1st dose SP Given 2nd dose SP Given ITN via ANC
Health System: Facility hours; trained staff; available medications; potable water and cups; fee for IPTp/ANC services.
Health Care Provider Factors: Knowledge of guidelines; follows guidelines; attitude toward clients.
Pregnant Woman Factors: Maternal age; marital status; educational level; parity; gestational age at first ANC visit; use of other health interventions; socioeconomic status; malaria knowledge; urban or rural residence; malaria transmission risk.
5
Methods
Data
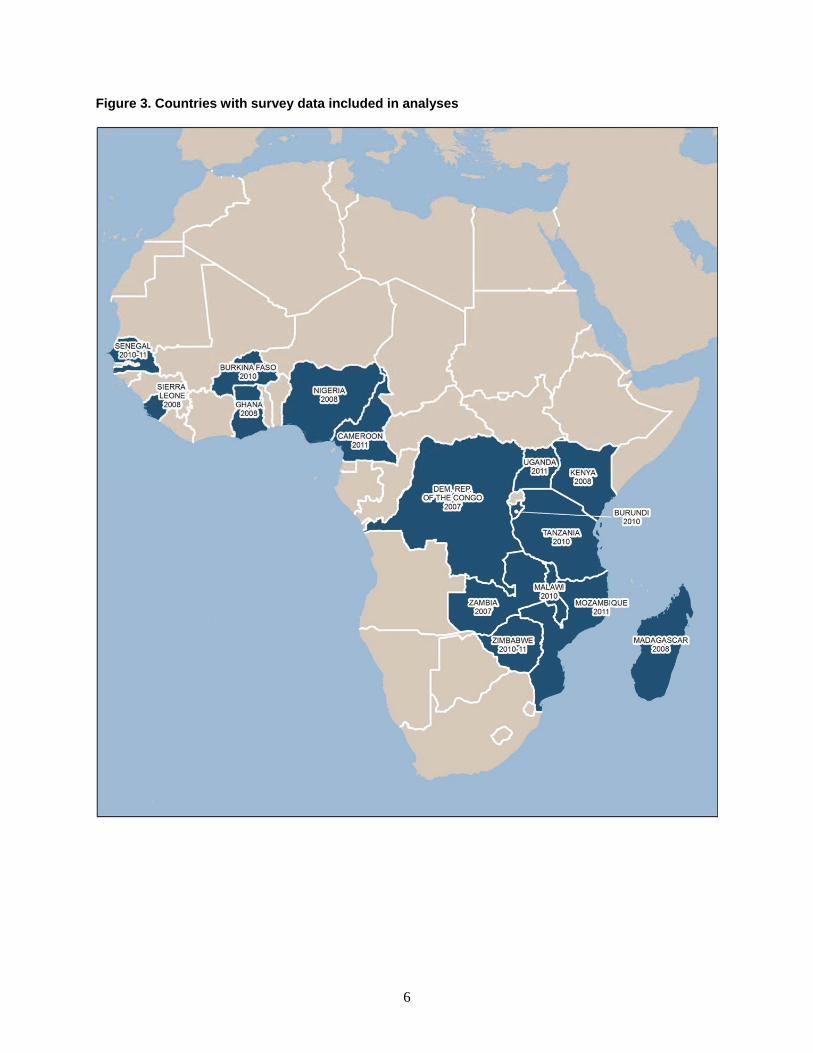
All nationally representative household surveys—Demographic and Health Surveys (DHS) and Malaria Indicator Surveys (MIS)—conducted between 2007 and 2011 for which data on IPTp and health-seeking behavior for ANC were available were included in the analyses. In cases of more than one available dataset for a country, the most recent survey was used except where the most recent dataset excluded key variables. In total, 16 surveys were included (Table 1; Figure 3). Unfortunately, most MIS do not include detailed questions on ANC visits for recently pregnant women.
In Kenya, Madagascar, and Zimbabwe, IPTp implementation programs were not national in scale at the time of the most recent survey. Thus, analyses were restricted to the IPTp implementation areas for these three countries (see Figure A.1). Kenya implemented IPTp in 63 of the 69 administrative districts from the 1999 census. Excluded are: Nairobi Province; Kiambu, Nyandarua, and Nyeri districts in Central Province; Meru Central district in Eastern Province; and Laikipia district in Rift Valley Province. In Madagascar the IPTp program was implemented in all districts in 17 regions and in some districts in the remaining 5 regions (Analmanga, Vakinankaratra, Haute Matsiatra, Amoron’i Mania, and Itasy). In Zimbabwe 33 of the 62 rural health districts fall into the moderate to high transmission zones and were therefore eligible for IPTp. More information on data collection and survey methods employed by the DHS and MIS can be found in individual survey reports and in online MEASURE DHS references (Rutstein and Rojas, 2006).
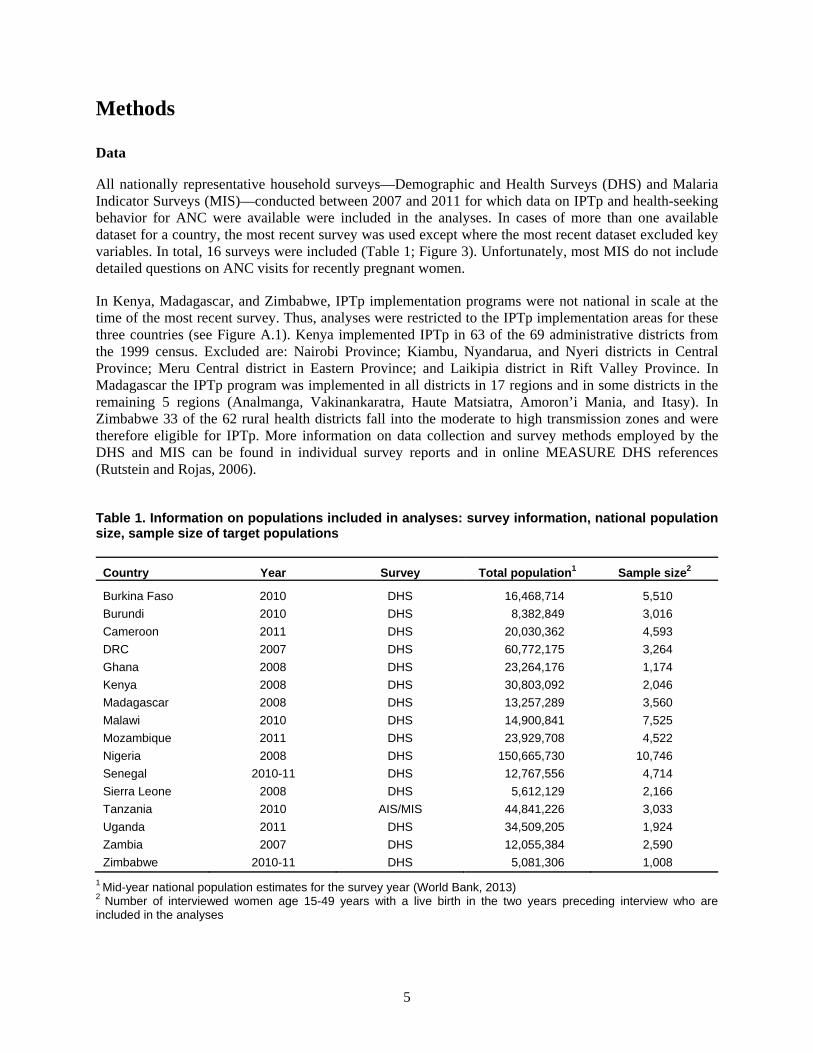
Table 1. Information on populations included in analyses: survey information, national population size, sample size of target populations
Country Year Survey Total population1 Sample size2
Burkina Faso 2010 DHS 16,468,714 5,510
Burundi 2010 DHS 8,382,849 3,016
Cameroon 2011 DHS 20,030,362 4,593
DRC 2007 DHS 60,772,175 3,264
Ghana 2008 DHS 23,264,176 1,174
Kenya 2008 DHS 30,803,092 2,046
Madagascar 2008 DHS 13,257,289 3,560
Malawi 2010 DHS 14,900,841 7,525
Mozambique 2011 DHS 23,929,708 4,522
Nigeria 2008 DHS 150,665,730 10,746
Senegal 2010-11 DHS 12,767,556 4,714
Sierra Leone 2008 DHS 5,612,129 2,166
Tanzania 2010 AIS/MIS 44,841,226 3,033
Uganda 2011 DHS 34,509,205 1,924
Zambia 2007 DHS 12,055,384 2,590
Zimbabwe 2010-11 DHS 5,081,306 1,008
1 Mid-year national population estimates for the survey year (World Bank, 2013) 2 Number of interviewed women age 15-49 years with a live birth in the two years preceding interview who are included in the analyses
6
Figure 3. Countries with survey data included in analyses
7
Variables
The outcome variable of interest is IPTp2, defined as receipt of at least two doses of SP for prevention of malaria in recently pregnant women (women with a live birth in the two years immediately preceding interview), regardless of the source of the medication. This variable is used as a proxy measure of effective delivery of IPTp. A secondary outcome variable is IPTp1, defined as receipt of at least one dose of SP for prevention of malaria in recently pregnant women. Other variables included in analyses are mother’s age (in five-year categories from 15 to 49), mother’s educational status (primary or greater versus less than primary), mother’s marital status (married/living with a partner versus single/divorced/widowed), gravidity (primigravidae, secundigravidae, multigravidae), ANC attendance for the most recent pregnancy leading to a live birth (at least one ANC visit versus none), iron supplementation for the most recent pregnancy leading to a live birth (yes/no), tetanus immunization (at least one dose given during most recent pregnancy leading to a live birth), urban/rural residence, household wealth quintile, household size (categorized as <4, 4-5, 6-7, 8-9, 10+), and malaria risk category based on 2010 data from the Malaria Atlas Project (MAP). MAP provides a spatial data layer of age-standardized PfPR2-10 , describing the estimated proportion of 2-10 year olds in the general population that are infected with P. falciparum at any one time, averaged over the 12 months of 2010 (Malaria Atlas Project, 2013). DHS and MIS data include geospatial data for the location of the centroid of each cluster, thereby permitting linkage of MAP data to survey clusters; thus, all residents of a cluster from the DHS or MIS survey data were assigned the same malaria risk value based on corresponding MAP data. Standard MAP PfPR2-10 cut-offs (<0.1%, 0.1%-5%, 5%-40%, and >40%) were used for the high and medium transmission categories, but the lowest two were combined due to small sample sizes (thus, ≤5%, 5%-40%, and >40%). Any entries with missing values for any of the key variables were excluded from analyses. For the subset of respondents who attended at least one ANC visit (the majority), additional variables included number of ANC visits attended (two or more, four or more), timing of first ANC visit (0-3, 4-6, or 7-9 months’ gestation), and components of ANC visit (blood and urine samples were taken and blood pressure was measured; yes or no). Table 2 summarizes specific information on the variables analyzed.
8
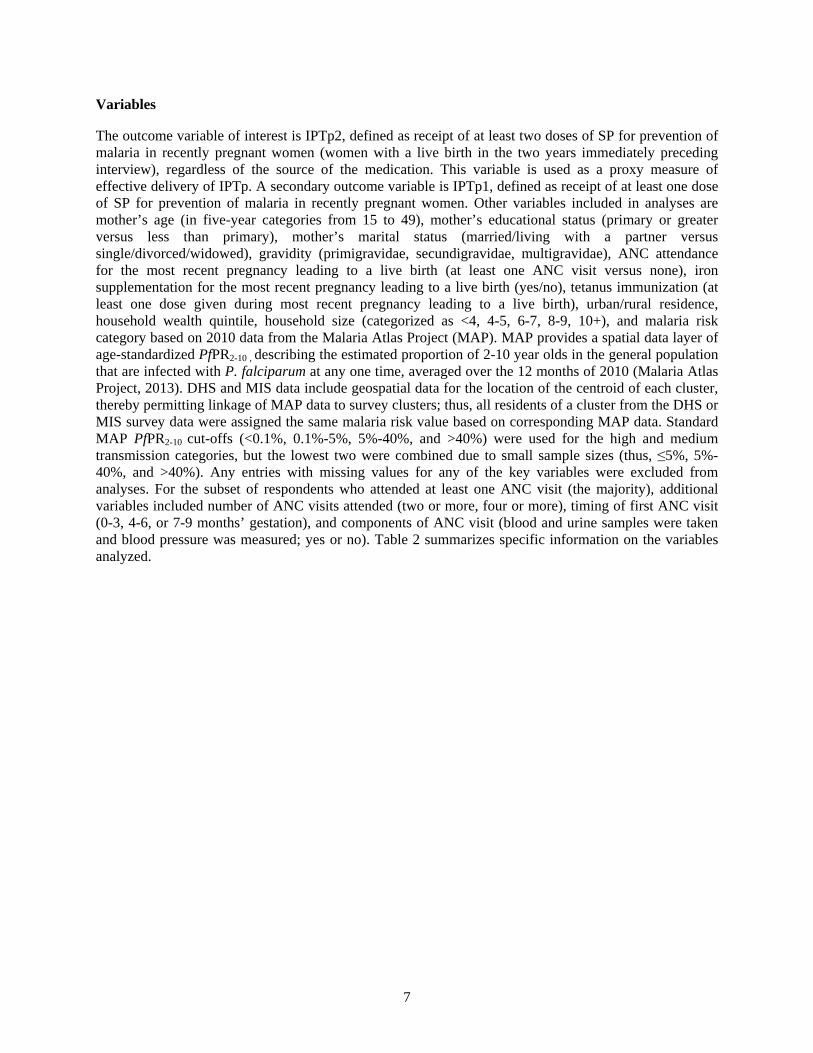
Table 2. Basic information on variables included in analyses
Variable Description
Socio-demographic variables
Residence Residence of the woman's household (urban/rural)
Household wealth Country-specific quintile of household wealth based on household assets (1-5)
Number of household residents Number of household residents, categorized as <4, 4-5, 6-7, 8-9, 10+
Malaria transmission risk Malaria transmission risk based on MAP 2010 PfPR2-10, categorized as <0.5%; 0.5-40%, 40%+
Maternal age Woman’s age, categorized as 15-19, 20-24, 25-29, 30-34, 35-39, 40-44, 45-49
Education level Woman's educational level: primary or greater, less than primary
Marital status Woman's marital status: married or living with a partner, single/divorced/widowed
Gravidity Number of births, categorized as primigravidae, secundigravidae, multigravidae
Maternal health intervention variables
Tetanus immunization status During last pregnancy in past two years ending in live birth, had at least one tetanus injection (Y/N)
Vitamin A supplementation During last pregnancy in past two years ending in live birth, received vitamin A dose in first two months after delivery (Y/N)
Iron supplementation During last pregnancy in past two years ending in live birth, received iron supplementation (Y/N)
Slept under ITN Used an ITN the night immediately preceding the survey (Y/N)
ANC variables
≥1 ANC Attended ANC at least once during most recent pregnancy in past two years leading to a live birth (Y/N)
≥2 ANC Attended ANC at least twice during most recent pregnancy in past two years leading to a live birth (Y/N)
Number of ANC visits Number of ANC visits attended during most recent pregnancy in past two years leading to a live birth, categorized as 1, 2, 3, 4, 5+
Timing of ANC visit Months’ gestation at which first ANC visit occurred during most recent pregnancy in past two years ending in live birth, categorized as 0-3, 4-6, 7-9 months
Place of ANC visit Home, public facility, private facility, religious facility, other facility
Level of facility of ANC visit Home; health center, health post, or mobile clinic; hospital; other
Components of ANC visit During ANC visit for last pregnancy in past two years ending in live birth, had blood, urine, and blood pressure tests – all three (Y/N)
Outcome variables
Any SP Received at least one dose of SP for prevention of malaria during last pregnancy in past two years leading to a live birth (Y/N)
Any SP – ANC Received at least one dose of SP for prevention of malaria during last pregnancy in past two years leading to a live birth, at least one of which was given at ANC (Y/N)
2 doses SP Received at least two doses of SP for prevention of malaria during last pregnancy in past two years leading to a live birth (Y/N)
2 doses SP – ANC Received at least two doses of SP for prevention of malaria during last pregnancy in past two years leading to a live birth, at least one of which was given at ANC (Y/N)
MAP = Malaria Atlas Project PfPR2-10 = Plasmodium falciparum prevalence rate in children age 2-10 years
9
Analyses
All analyses were conducted using STATA 11. Household survey data were adjusted for survey design, clustering, and sample weights. Any analyses that pooled data from multiple countries involved a process of weighting each survey by countries’ mid-year populations in order to have proportional representation. Population weights for Kenya, Madagascar, and Zimbabwe were adjusted for the populations in the IPTp districts.
Descriptive analyses
Descriptive trends were compiled for the proportion of women with a live birth in the past two years. Socio-demographic variables were described and compared. A series of intervention outcomes were also calculated and compared for this group of women: the proportion of women attending ANC by numbers of visits and by timing of visits; the proportion of women receiving SP for prevention of malaria, by numbers of doses; and the proportion of women reporting ITN use the night before interview. According to historical definitions of IPTp coverage, women who reporting taking two doses of SP were considered to have received IPTp, and this outcome was used to determine levels of IPTp coverage by country and overall.
Service effectiveness analyses
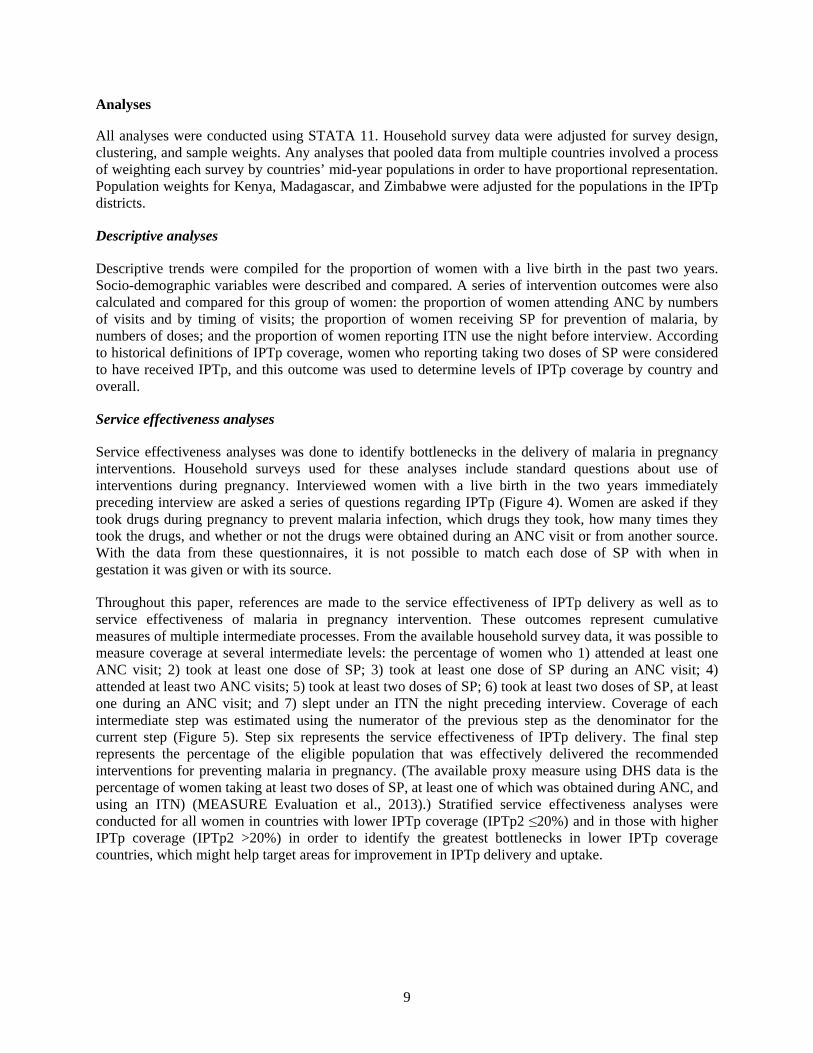
Service effectiveness analyses was done to identify bottlenecks in the delivery of malaria in pregnancy interventions. Household surveys used for these analyses include standard questions about use of interventions during pregnancy. Interviewed women with a live birth in the two years immediately preceding interview are asked a series of questions regarding IPTp (Figure 4). Women are asked if they took drugs during pregnancy to prevent malaria infection, which drugs they took, how many times they took the drugs, and whether or not the drugs were obtained during an ANC visit or from another source. With the data from these questionnaires, it is not possible to match each dose of SP with when in gestation it was given or with its source.
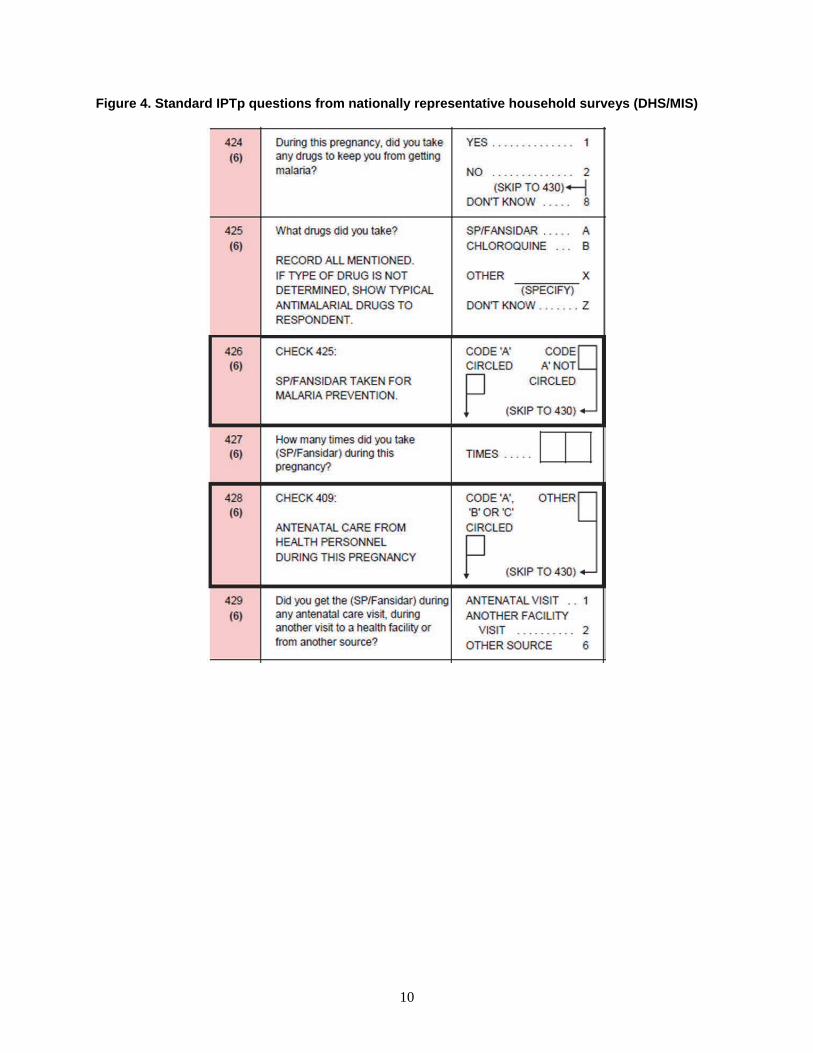
Throughout this paper, references are made to the service effectiveness of IPTp delivery as well as to service effectiveness of malaria in pregnancy intervention. These outcomes represent cumulative measures of multiple intermediate processes. From the available household survey data, it was possible to measure coverage at several intermediate levels: the percentage of women who 1) attended at least one ANC visit; 2) took at least one dose of SP; 3) took at least one dose of SP during an ANC visit; 4) attended at least two ANC visits; 5) took at least two doses of SP; 6) took at least two doses of SP, at least one during an ANC visit; and 7) slept under an ITN the night preceding interview. Coverage of each intermediate step was estimated using the numerator of the previous step as the denominator for the current step (Figure 5). Step six represents the service effectiveness of IPTp delivery. The final step represents the percentage of the eligible population that was effectively delivered the recommended interventions for preventing malaria in pregnancy. (The available proxy measure using DHS data is the percentage of women taking at least two doses of SP, at least one of which was obtained during ANC, and using an ITN) (MEASURE Evaluation et al., 2013).) Stratified service effectiveness analyses were conducted for all women in countries with lower IPTp coverage (IPTp2 ≤20%) and in those with higher IPTp coverage (IPTp2 >20%) in order to identify the greatest bottlenecks in lower IPTp coverage countries, which might help target areas for improvement in IPTp delivery and uptake.
10
Figure 4. Standard IPTp questions from nationally representative household surveys (DHS/MIS)
11
Figure 5. Formula for calculating intermediate and cumulative effectiveness of malaria in pregnancy intervention delivery (adapted from Hill et al., 2013a)
IE = intermediate effectiveness
Identifying determinants of IPTp
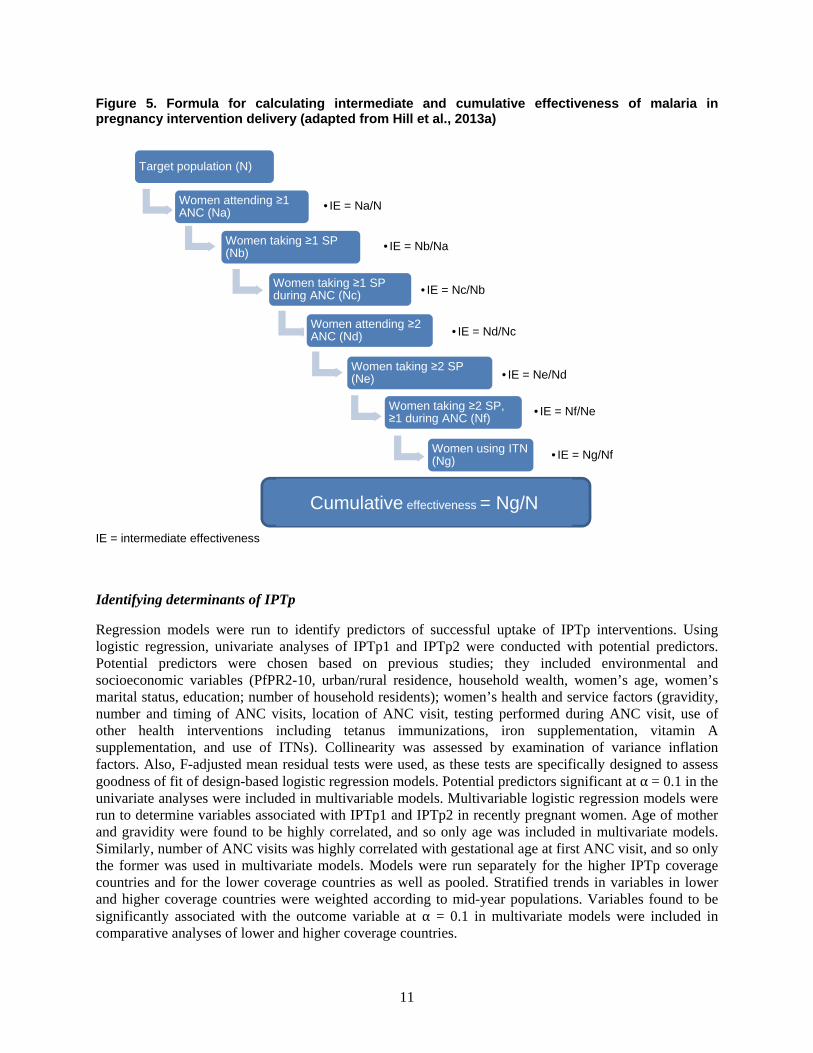
Regression models were run to identify predictors of successful uptake of IPTp interventions. Using logistic regression, univariate analyses of IPTp1 and IPTp2 were conducted with potential predictors. Potential predictors were chosen based on previous studies; they included environmental and socioeconomic variables (PfPR2-10, urban/rural residence, household wealth, women’s age, women’s marital status, education; number of household residents); women’s health and service factors (gravidity, number and timing of ANC visits, location of ANC visit, testing performed during ANC visit, use of other health interventions including tetanus immunizations, iron supplementation, vitamin A supplementation, and use of ITNs). Collinearity was assessed by examination of variance inflation factors. Also, F-adjusted mean residual tests were used, as these tests are specifically designed to assess goodness of fit of design-based logistic regression models. Potential predictors significant at α = 0.1 in the univariate analyses were included in multivariable models. Multivariable logistic regression models were run to determine variables associated with IPTp1 and IPTp2 in recently pregnant women. Age of mother and gravidity were found to be highly correlated, and so only age was included in multivariate models. Similarly, number of ANC visits was highly correlated with gestational age at first ANC visit, and so only the former was used in multivariate models. Models were run separately for the higher IPTp coverage countries and for the lower coverage countries as well as pooled. Stratified trends in variables in lower and higher coverage countries were weighted according to mid-year populations. Variables found to be significantly associated with the outcome variable at α = 0.1 in multivariate models were included in comparative analyses of lower and higher coverage countries.
Target population (N)
Women attending ≥1 ANC (Na)
• IE = Na/N
Women taking ≥1 SP (Nb)
• IE = Nb/Na
Women taking ≥1 SP during ANC (Nc) • IE = Nc/Nb
Women attending ≥2 ANC (Nd) • IE = Nd/Nc
Women taking ≥2 SP (Ne) • IE = Ne/Nd
Women taking ≥2 SP, ≥1 during ANC (Nf)
• IE = Nf/Ne
Women using ITN (Ng) • IE = Ng/Nf
Cumulative effectiveness = Ng/N

13
Results
Descriptive Analyses
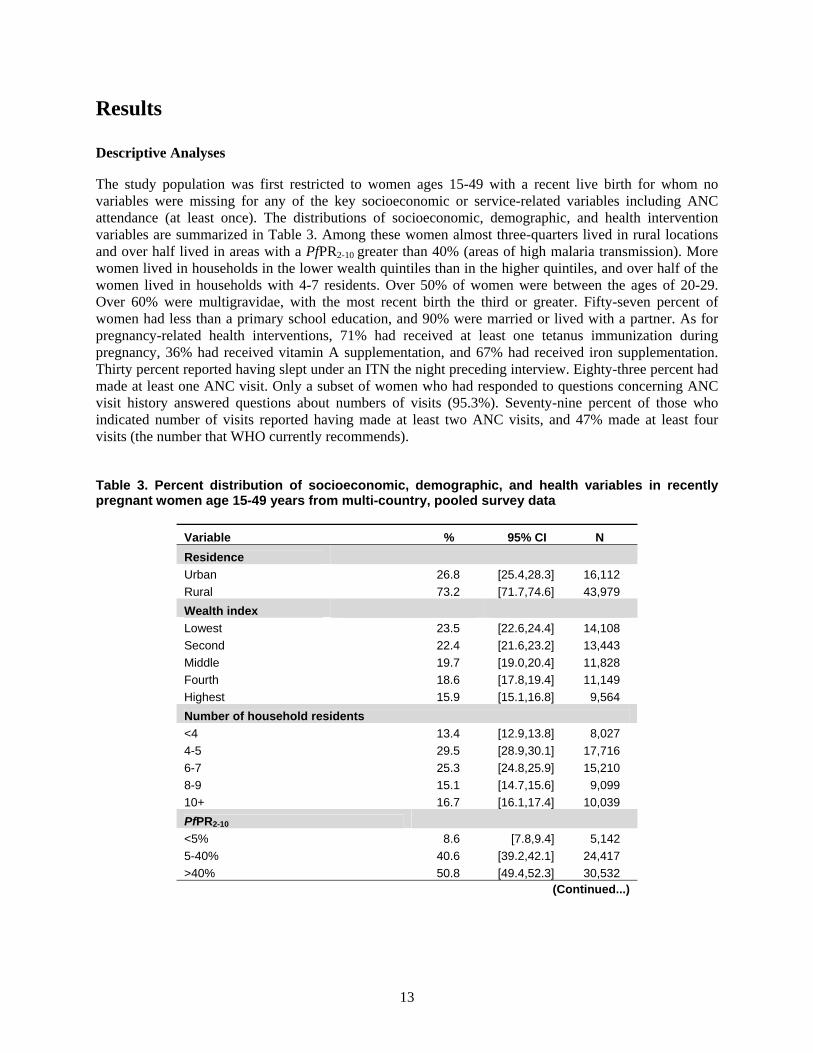
The study population was first restricted to women ages 15-49 with a recent live birth for whom no variables were missing for any of the key socioeconomic or service-related variables including ANC attendance (at least once). The distributions of socioeconomic, demographic, and health intervention variables are summarized in Table 3. Among these women almost three-quarters lived in rural locations and over half lived in areas with a PfPR2-10 greater than 40% (areas of high malaria transmission). More women lived in households in the lower wealth quintiles than in the higher quintiles, and over half of the women lived in households with 4-7 residents. Over 50% of women were between the ages of 20-29. Over 60% were multigravidae, with the most recent birth the third or greater. Fifty-seven percent of women had less than a primary school education, and 90% were married or lived with a partner. As for pregnancy-related health interventions, 71% had received at least one tetanus immunization during pregnancy, 36% had received vitamin A supplementation, and 67% had received iron supplementation. Thirty percent reported having slept under an ITN the night preceding interview. Eighty-three percent had made at least one ANC visit. Only a subset of women who had responded to questions concerning ANC visit history answered questions about numbers of visits (95.3%). Seventy-nine percent of those who indicated number of visits reported having made at least two ANC visits, and 47% made at least four visits (the number that WHO currently recommends).
Table 3. Percent distribution of socioeconomic, demographic, and health variables in recently pregnant women age 15-49 years from multi-country, pooled survey data
Variable % 95% CI N
Residence
Urban 26.8 [25.4,28.3] 16,112
Rural 73.2 [71.7,74.6] 43,979
Wealth index
Lowest 23.5 [22.6,24.4] 14,108
Second 22.4 [21.6,23.2] 13,443
Middle 19.7 [19.0,20.4] 11,828
Fourth 18.6 [17.8,19.4] 11,149
Highest 15.9 [15.1,16.8] 9,564
Number of household residents
<4 13.4 [12.9,13.8] 8,027
4-5 29.5 [28.9,30.1] 17,716
6-7 25.3 [24.8,25.9] 15,210
8-9 15.1 [14.7,15.6] 9,099
10+ 16.7 [16.1,17.4] 10,039
PfPR2-10
<5% 8.6 [7.8,9.4] 5,142
5-40% 40.6 [39.2,42.1] 24,417
>40% 50.8 [49.4,52.3] 30,532 (Continued...)
14
Table 3. – Continued
Variable % 95% CI N
Age (5-year groups)
15-19 10.1 [9.8,10.5] 6,079
20-24 26.2 [25.7,26.8] 15,756
25-29 26.6 [26.1,27.1] 15,969
30-34 18.5 [18.0,18.9] 11,109
35-39 12.2 [11.8,12.6] 7,308
40-44 4.9 [4.7,5.2] 2,966
45-49 1.5 [1.4,1.6] 904
Education
Less than primary 57.7 [56.7,58.7] 34,681
Primary or greater 42.3 [41.3,43.3] 25,410
Marital status
Single/divorced/widowed 10.0 [9.6,10.4] 6,025
Married/living together 90.0 [89.6,90.4] 54,066
Gravidity
Primigravidae 20.1 [19.6,20.6] 12,074
Secundigravidae 18.8 [18.3,19.2] 11,277
Multigravidae 61.1 [60.5,61.8] 36,741
Tetanus immunization
No 29.0 [28.1,29.9] 17,428
Yes 71.0 [70.1,71.9] 42,663
Vitamin A supplementation
No 63.7 [62.9,64.4] 38,255
Yes 36.3 [35.6,37.1] 21,836
Iron supplementation
No 33.2 [32.2,34.1] 19,938
Yes 66.8 [65.9,67.8] 40,153
ITN use
No 69.7 [68.9,70.5] 41,895
Yes 30.3 [29.5,31.1] 18,196
At least 1 ANC
No 16.6 [15.8,17.4] 9,948
Yes 83.4 [82.6,84.2] 50,143
Total 60,091
At least 2 ANC visits
No 20.9 [20.1,21.8] 11,995
Yes 79.1 [78.2,79.9] 45,263
At least 4 ANC visits
No 52.6 [51.7,53.5] 30,102
Yes 47.4 [46.5,48.3] 27,156
Total 57,258
N= weighted sample size
15
Descriptive Analyses—Antenatal Care
Table 4 summarizes the distributions of variables related to ANC care seeking and service. Among the women who made at least one ANC visit who responded to additional questions, over 60% reported having attended a public facility for care, 11% sought care at a private facility, 2% at a religious facility, and 22% did not recall where they had received care. Forty-three percent of women attended ANC at a health center, health post, or mobile clinic, and 31% at a hospital. Half of the women reported that they received urine, blood, and blood pressure testing during their ANC visits. Thirty-six percent reported attending ANC at least five times, 22% reported four visits, and 27% three visits. Most women reported attending ANC for the first time during the second trimester (63%), while 25% reported first attending during the first trimester.
Table 4. Percent distribution of ANC care seeking and service variables among recently pregnant women age 15-49 years who made at least one ANC visit, from multi-country, pooled survey data
Variable % 95% CI Weighted N
Number of ANC visits
1 4.3 [4.1,4.6] 2,046
2 11.4 [10.9,11.9] 5,385
3 26.9 [26.2,27.2] 12,722
4 21.6 [21.1,22.2] 10,231
5+ 35.8 [34.9,36.6] 16,921
Total 47,307
Gestational age at 1st ANC 1-3 months 24.9 [24.2,25.5] 12,352
4-6 months 63.3 [62.6,64.0] 31,432
7-9 months 11.8 [11.3,12.3] 5,867
Total 49,651
Source of ANC Home 2.4 [2.1,2.6] 1,182
Public 62.1 [60.9,63.3] 31,131
Private 10.6 [10.0,11.2] 5,318
Religious 2.3 [2.0,2.6] 1,138
Other 0.9 [0.7,1.1] 444
Don't know 21.8 [20.5,23.1] 10,931
Total 50,143
Level of ANC facility Home 2.4 [2.1,2.6] 1,182
Health center/post/mobile clinic 43.3 [42.2,44.4] 21,715
Hospital 31.1 [30.2,32.1] 15,614
Other 1.4 [1.2,1.6] 702
Don’t know 21.8 [20.5,23.1] 10,931
Total 50,143
Testing done at ANC No 50.4 [49.4,51.5] 25,234
Yes 49.6 [48.5,50.6] 24,790
Total 50,024
16
Following current WHO recommendations for effective delivery of IPTp requires that women access ANC services at least four times during pregnancy, at least three after quickening, and that they receive one dose of SP at each visit that occurs after the first trimester. ANC attendance rates for at least one visit and at least two visits are high everywhere except in Nigeria in 2008. The percentage of women who attended ANC at least four times is much lower in all countries; pooling estimates across countries, 83% of women attended ANC at least once, 79% at least twice, and 47% attended four times (Figure 6; Annex Table A.1).
Figure 6. Percentage of recently pregnant women age 15-49 years making antenatal care visits by country and by number of visits
0
10
20
30
40
50
60
70
80
90
100
Pe
rce
nt
≥1 ANC
≥2 ANC
≥ 4 ANC
* Total represents a multi-country, pooled estimate.
Among recently pregnant women who attended ANC at least once, the distribution of number of ANC visits attended varied across countries. Figure 7 presents the distributions of ANC visits among women who attended ANC at least once by country as well as a pooled estimate across countries (see also Annex Table A.2). On average, among women attending ANC, only 4% reported attending ANC only once, 11% reported two visits, 27% reported three visits, 22% reported four visits, and 36% reported attending ANC five or more times. The mean number of ANC visits ranged from 3.2 visits in Burkina Faso in 2010 to 7.0 visits in Nigeria in 2008, with an average of 4.5 visits in the pooled estimate (Table 5). The denominator for these estimates is women who made at least one ANC visit; thus, the estimates are not representative of all pregnant women, but rather of only those who obtained ANC services.
ANC attendance rates are high everywhere except in Nigeria. Overall, 83% attended ANC at least once; 79%, at least twice.
17
Figure 7. Among recently pregnant women age 15-49 years who made at least one ANC visit, distribution of the number of visits, by survey
0%
10%
20%
30%
40%
50%
60%
70%
80%
90%
100%
5 or more
4 visits
3 visits
2 visits
1 visit
* Total represents a multi-country, pooled estimate.
Sub-national IPTp implementation and ANC Use
Kenya, Madagascar, and Zimbabwe have implemented targeted IPTp interventions in areas of highest malaria risk. IPTp programs do not appear to be driving ANC use in these countries, however. ANC coverage is not significantly higher in districts with IPTp programs than in those without. In fact, the percentages of targeted women who attended ANC at least once and at least twice were higher in non-IPTp districts than in IPTp districts in Madagascar, and in Kenya the percentage who made at least four ANC visits was higher in non-IPTp districts than in IPTp districts.
Attended ≥1 ANC visit Attended ≥2 ANC visits Attended ≥4 ANC visits
Non IPTp
district IPTp
district p-
value
Non IPTp
district IPTp
districtp-
value
Non IPTp
district IPTp
district p-
value
Kenya 2008 94 92.5 0.51 88 88.2 0.95 62.2 42.8 <0.005 Madagascar 2008 96.6 87.7 <0.005 93.8 82.5 <0.005 48.5 45.1 0.23 Zimbabwe 2010-11 86.1 89.5 0.11 82.9 85.9 0.18 60.3 59.1 0.68
18
Table 5. Mean number of ANC visits among recently pregnant women age 15-49 years who made at least one ANC visit, by survey
Survey Mean number of ANC visits 95% CI N
Burkina Faso 2010 DHS 3.2 [3.1,3.2] 5,677
Burundi 2010 DHS 3.2 [3.2,3.3] 3,099
Cameroon 2011 DHS 4.8 [4.7,4.9] 4,594
DRC 2007 DHS 4.0 [3.8,4.2] 3,228
Ghana 2008 DHS 5.8 [5.6,6.1] 1,134
Kenya 2008 DHS 3.7 [3.6,3.8] 1,973
Madagascar 2008 DHS 3.7 [3.6,3.8] 3,470
Malawi 2010 DHS 3.5 [3.5,3.5] 7,493
Mozambique 2011 DHS 3.8 [3.7,3.8] 4,834
Nigeria 2008 DHS 7.0 [6.8,7.1] 10,535
Senegal 2010-11 DHS 3.6 [3.5,3.7] 4,326
Sierra Leone 2008 DHS 5.4 [5.1,5.6] 2,220
Tanzania 2010 AIS/MIS 3.4 [3.3,3.4] 3,144
Uganda 2011 DHS 3.6 [3.5,3.7] 2,031
Zambia 2007 DHS 3.9 [3.9,4.0] 2,604
Zimbabwe 2010-11 DHS 4.5 [4.3,4.6] 1,001
Total* 4.5 [4.5,4.6] 47,307
N = weighted sample size * Total represents a multi-country, pooled estimate.
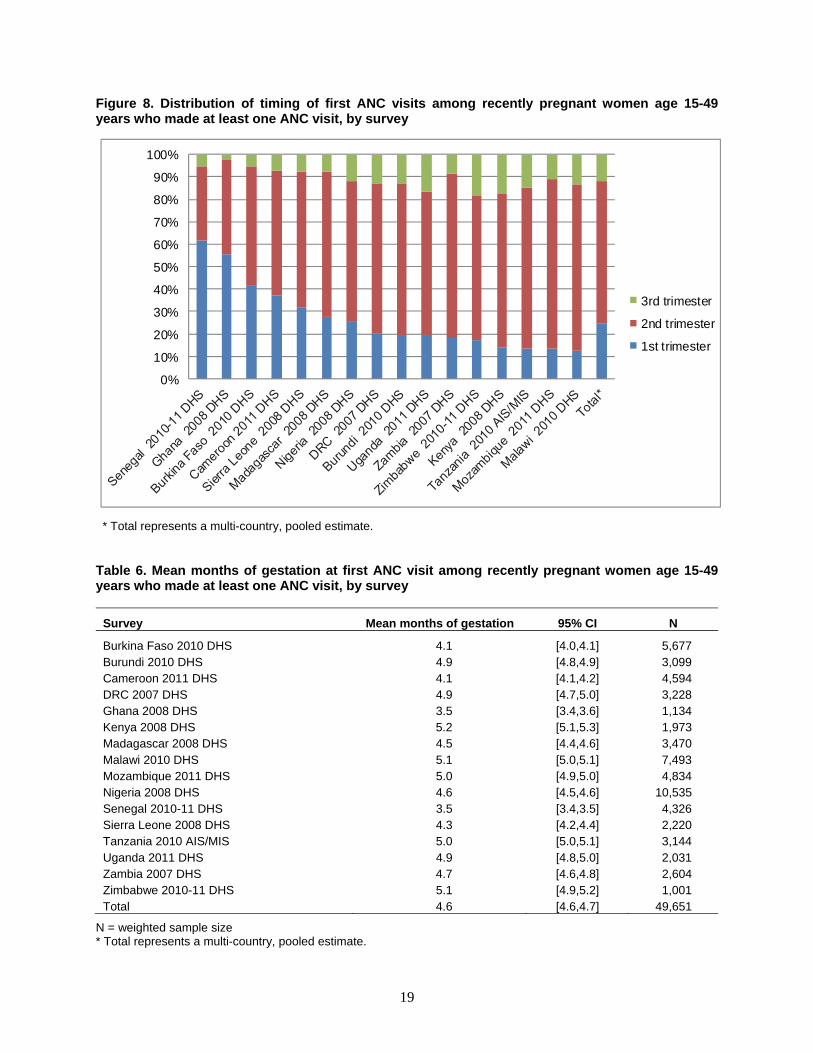
Among women who attended ANC at least once, the timing of the first ANC visit also varied across surveys (Figure 8; Annex Table A.3). The percentage of women who attended ANC for the first time during the first trimester of pregnancy ranged from 62% in Senegal to 13% in Malawi. On average, pooled across surveys, 15% of women attended ANC for the first time during the first trimester, 63% first attended during the second trimester, and 12% first attended during the third trimester. The mean months of gestation at first ANC visit are summarized in Table 6; values range from 3.5 (Senegal 2010-11 and Ghana 2008) to 5.2 months (Kenya 2008), with a pooled average of 4.6 months.
19
Figure 8. Distribution of timing of first ANC visits among recently pregnant women age 15-49 years who made at least one ANC visit, by survey
0%
10%
20%
30%
40%
50%
60%
70%
80%
90%
100%
3rd trimester
2nd trimester
1st trimester
* Total represents a multi-country, pooled estimate.
Table 6. Mean months of gestation at first ANC visit among recently pregnant women age 15-49 years who made at least one ANC visit, by survey
Survey Mean months of gestation 95% CI N
Burkina Faso 2010 DHS 4.1 [4.0,4.1] 5,677 Burundi 2010 DHS 4.9 [4.8,4.9] 3,099 Cameroon 2011 DHS 4.1 [4.1,4.2] 4,594 DRC 2007 DHS 4.9 [4.7,5.0] 3,228 Ghana 2008 DHS 3.5 [3.4,3.6] 1,134 Kenya 2008 DHS 5.2 [5.1,5.3] 1,973 Madagascar 2008 DHS 4.5 [4.4,4.6] 3,470 Malawi 2010 DHS 5.1 [5.0,5.1] 7,493 Mozambique 2011 DHS 5.0 [4.9,5.0] 4,834 Nigeria 2008 DHS 4.6 [4.5,4.6] 10,535 Senegal 2010-11 DHS 3.5 [3.4,3.5] 4,326 Sierra Leone 2008 DHS 4.3 [4.2,4.4] 2,220 Tanzania 2010 AIS/MIS 5.0 [5.0,5.1] 3,144 Uganda 2011 DHS 4.9 [4.8,5.0] 2,031 Zambia 2007 DHS 4.7 [4.6,4.8] 2,604 Zimbabwe 2010-11 DHS 5.1 [4.9,5.2] 1,001 Total 4.6 [4.6,4.7] 49,651
N = weighted sample size * Total represents a multi-country, pooled estimate.
20
Descriptive Analyses—IPTp Coverage
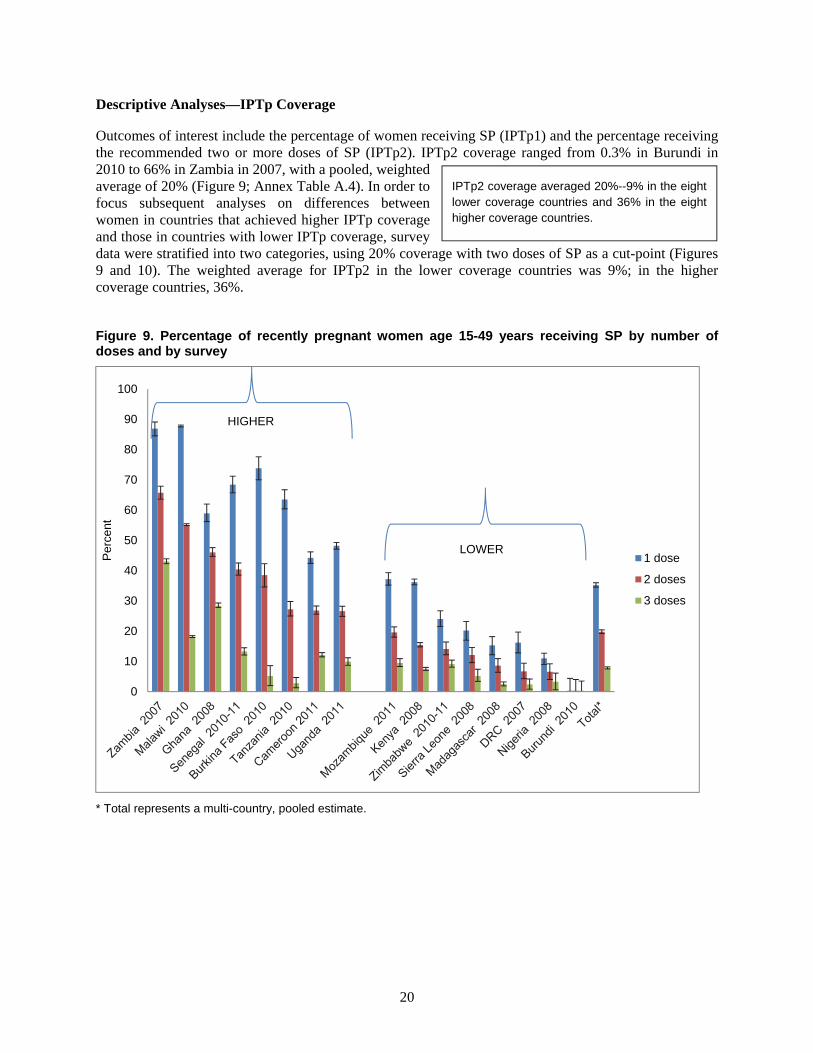
Outcomes of interest include the percentage of women receiving SP (IPTp1) and the percentage receiving the recommended two or more doses of SP (IPTp2). IPTp2 coverage ranged from 0.3% in Burundi in 2010 to 66% in Zambia in 2007, with a pooled, weighted average of 20% (Figure 9; Annex Table A.4). In order to focus subsequent analyses on differences between women in countries that achieved higher IPTp coverage and those in countries with lower IPTp coverage, survey data were stratified into two categories, using 20% coverage with two doses of SP as a cut-point (Figures 9 and 10). The weighted average for IPTp2 in the lower coverage countries was 9%; in the higher coverage countries, 36%.
Figure 9. Percentage of recently pregnant women age 15-49 years receiving SP by number of doses and by survey
* Total represents a multi-country, pooled estimate.
0
10
20
30
40
50
60
70
80
90
100
Per
cent
1 dose
2 doses
3 doses
LOWER
HIGHER
IPTp2 coverage averaged 20%--9% in the eight lower coverage countries and 36% in the eight higher coverage countries.
21
Figure 10. Surveys with lower IPTp coverage (<20%) and with higher IPTp coverage (≥20%) among recently pregnant women age 15-49 years
In pooled estimates across surveys, IPTp coverage declines as the gestational age at first ANC visit increases. This pattern holds for IPTp1, IPTp2, and three or more SP doses (Figure 11). In pooled estimates IPTp coverage increases as the number of ANC visits increases from one to four visits. This pattern holds for all doses of SP. Women who reported five or more ANC visits were not more likely to receive three or more doses of SP than were women attending four ANC visits, and they were significantly less likely to receive at least one or at least two doses of SP (Figure 12).
22
Figure 11. Percentages of recently pregnant women age 15-49 years receiving SP, by dose and gestational age, in multi-country pooled estimates from 16 countries with surveys between 2007 and 2011
0
5
10
15
20
25
30
35
40
45
50
1-3 months 4-6 months 7-9 months
Pe
rce
nta
ge
rece
ivin
g S
P b
y d
os
e
Gestational age at first ANC visit
≥1 dose SP
≥2 doses SP
≥3 doses SP
Figure 12. Percentages of recently pregnant women age 15-49 years receiving SP, by dose and number of ANC visits in multi-country, pooled estimates from 16 countries with surveys between 2007 and 2011
0
10
20
30
40
50
60
1 2 3 4 5+
Pe
rce
nt r
ecei
ving
SP
by
do
se
Number of ANC visits
≥1 dose SP
≥2 doses SP
≥3 doses SP
23
Service Effectiveness Analyses
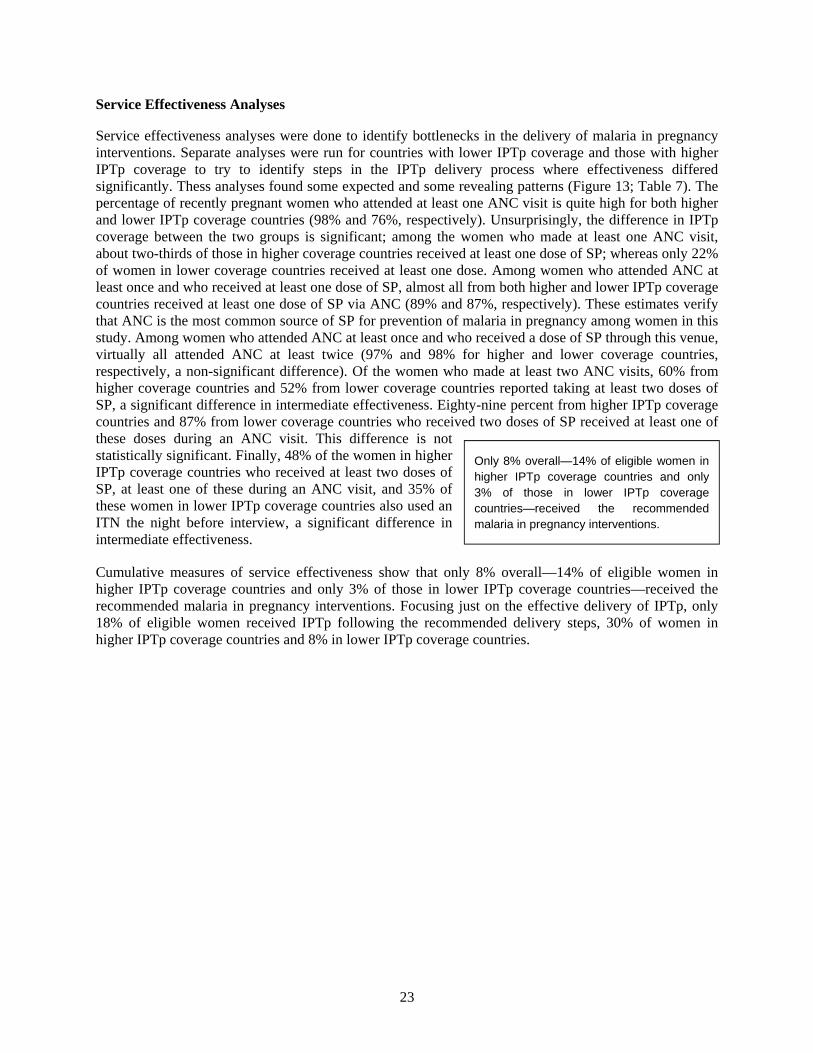
Service effectiveness analyses were done to identify bottlenecks in the delivery of malaria in pregnancy interventions. Separate analyses were run for countries with lower IPTp coverage and those with higher IPTp coverage to try to identify steps in the IPTp delivery process where effectiveness differed significantly. Thess analyses found some expected and some revealing patterns (Figure 13; Table 7). The percentage of recently pregnant women who attended at least one ANC visit is quite high for both higher and lower IPTp coverage countries (98% and 76%, respectively). Unsurprisingly, the difference in IPTp coverage between the two groups is significant; among the women who made at least one ANC visit, about two-thirds of those in higher coverage countries received at least one dose of SP; whereas only 22% of women in lower coverage countries received at least one dose. Among women who attended ANC at least once and who received at least one dose of SP, almost all from both higher and lower IPTp coverage countries received at least one dose of SP via ANC (89% and 87%, respectively). These estimates verify that ANC is the most common source of SP for prevention of malaria in pregnancy among women in this study. Among women who attended ANC at least once and who received a dose of SP through this venue, virtually all attended ANC at least twice (97% and 98% for higher and lower coverage countries, respectively, a non-significant difference). Of the women who made at least two ANC visits, 60% from higher coverage countries and 52% from lower coverage countries reported taking at least two doses of SP, a significant difference in intermediate effectiveness. Eighty-nine percent from higher IPTp coverage countries and 87% from lower coverage countries who received two doses of SP received at least one of these doses during an ANC visit. This difference is not statistically significant. Finally, 48% of the women in higher IPTp coverage countries who received at least two doses of SP, at least one of these during an ANC visit, and 35% of these women in lower IPTp coverage countries also used an ITN the night before interview, a significant difference in intermediate effectiveness.
Cumulative measures of service effectiveness show that only 8% overall—14% of eligible women in higher IPTp coverage countries and only 3% of those in lower IPTp coverage countries—received the recommended malaria in pregnancy interventions. Focusing just on the effective delivery of IPTp, only 18% of eligible women received IPTp following the recommended delivery steps, 30% of women in higher IPTp coverage countries and 8% in lower IPTp coverage countries.
Only 8% overall—14% of eligible women in higher IPTp coverage countries and only 3% of those in lower IPTp coverage countries—received the recommended malaria in pregnancy interventions.
24
Figure 13. Stepwise summary of cumulative service effectiveness of malaria in pregnancy interventions (IPTp and ITN use by pregnant women), stratified by lower IPTp coverage and higher IPTp coverage surveys
Note: Lower IPTp coverage surveys are those with IPTp2 coverage less than 20%; higher IPTp coverage surveys are those in which IPTp coverage is 20% or more. Intermediate effectiveness estimates are derived from multi-country, pooled, weighted calculations.
0
10
20
30
40
50
60
70
80
90
100
≥1 ANC ≥1 SP ≥1 SP via ANC
≥2 ANC ≥2 SP ≥2 SP, ≥1 via ANC
≥2 SP, ≥1 via ANC &
ITN use
Per
cen
t
High
Total
Low
25
Table 7. Stepwise summary of service effectiveness of malaria in pregnancy interventions (IPTp and ITN use by pregnant women), stratified by lower IPTp coverage and higher IPTp coverage surveys1
N IE (%) 95% CI CE (%)
Lower IPTp Coverage
Attended ANC 27,086 75.8 74.5-77.0 100.0
Received one dose SP 5,957 22.0 21.0-23.0 22.0
SP via ANC 5,166 86.7 85.2-88.1 19.1
Attended ANC at least twice 4,968 97.7 97.1-98.2 18.7
Received two doses SP 2,962 51.6 48.5-54.7 9.6
SP2 via ANC 2,565 86.6 84.4-88.6 8.3
SP2 via ANC and ITN use 908 35.4 62.5-38.4 3.0
Higher IPTp Coverage
Attended ANC 23,057 94.8 94.1-95.3 100.0
Received one dose SP 14,938 64.8 63.6-66.0 64.8
SP via ANC 13,234 88.6 87.8-89.4 57.4
Attended ANC at least twice 12,658 97.1 96.7-97.6 55.7
Received two doses SP 8,221 59.7 58.3-61.0 33.3
SP2 via ANC 7,335 89.2 88.3-90.1 29.7
SP2 via ANC and ITN use 3,482 47.5 45.7-49.2 14.1
Total
Attended ANC 50,142 83.4 82.6-74.2 100.0
Received one dose SP 20,896 41.7 40.8-42.5 41.7
SP via ANC 18,400 88.1 87.4-88.7 36.7
Attended ANC at least twice 17,741 97.3 96.9-97.7 35.7
Received two doses SP 11,183 57.4 56.0-58..7 20.5
SP2 via ANC 9,900 88.5 87.7-89.4 18.1
SP2 via ANC and ITN use 4,390 44.3 42.9-45.8 8.0
IE = intermediate effectiveness; CE = cumulative effectiveness; N = sample size 1 Lower coverage surveys are those with IPTp2 coverage less than 20%, higher coverage surveys are those in which IPTp coverage is 20% or more. Intermediate effectiveness estimates are derived from multi-country, pooled, weighted calculations.
Determinants of IPTp
Regression models were run to identify potential determinants of successful delivery and uptake of IPTp interventions. Outcomes included IPTp1 and IPTp2. Logistic regression models identified socio-demographic, maternal health, and service variables, such as level of malaria transmission (PfPR2-10), maternal health interventions (iron supplementation, vitamin A supplementation, tetanus immunization, ITN use), specifics of antenatal care visits (testing done, number of visits, timing of first visit, type of facility), marital status, education, parity, maternal age, household wealth, and the number of household residents, as important predictors of effective delivery of one dose of SP during the most recent pregnancy in women who made at least one ANC visit (IPTp1) (Table 8). The only variable that was not significantly associated with effective IPTp1 delivery was household residence (urban/rural). Due to collinearity between number of ANC visits and timing of first ANC visit, the latter was omitted from multivariable models. Similarly, parity and maternal age were found to be collinear, and so parity was left out of multivariable models. In adjusted, multivariable models, most of these associations remained significant (Table 8). Women in the highest malaria transmission areas were significantly less likely to
26
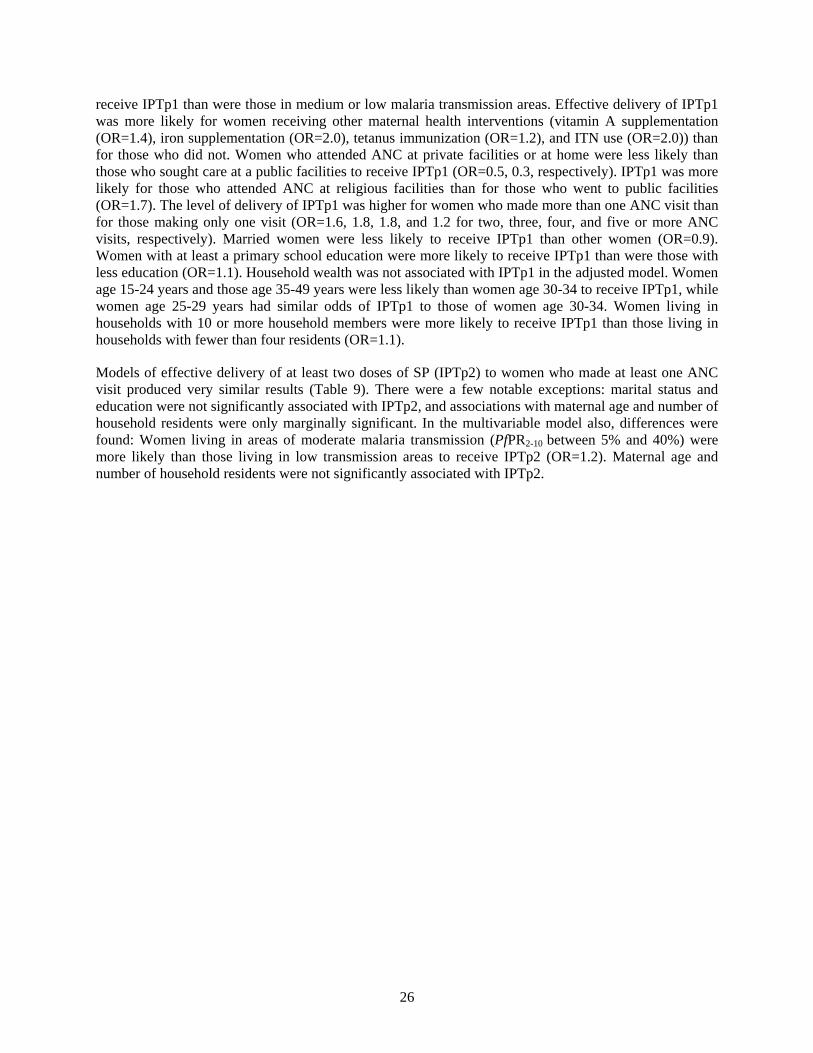
receive IPTp1 than were those in medium or low malaria transmission areas. Effective delivery of IPTp1 was more likely for women receiving other maternal health interventions (vitamin A supplementation (OR=1.4), iron supplementation (OR=2.0), tetanus immunization (OR=1.2), and ITN use (OR=2.0)) than for those who did not. Women who attended ANC at private facilities or at home were less likely than those who sought care at a public facilities to receive IPTp1 (OR=0.5, 0.3, respectively). IPTp1 was more likely for those who attended ANC at religious facilities than for those who went to public facilities (OR=1.7). The level of delivery of IPTp1 was higher for women who made more than one ANC visit than for those making only one visit (OR=1.6, 1.8, 1.8, and 1.2 for two, three, four, and five or more ANC visits, respectively). Married women were less likely to receive IPTp1 than other women (OR=0.9). Women with at least a primary school education were more likely to receive IPTp1 than were those with less education (OR=1.1). Household wealth was not associated with IPTp1 in the adjusted model. Women age 15-24 years and those age 35-49 years were less likely than women age 30-34 to receive IPTp1, while women age 25-29 years had similar odds of IPTp1 to those of women age 30-34. Women living in households with 10 or more household members were more likely to receive IPTp1 than those living in households with fewer than four residents (OR=1.1).
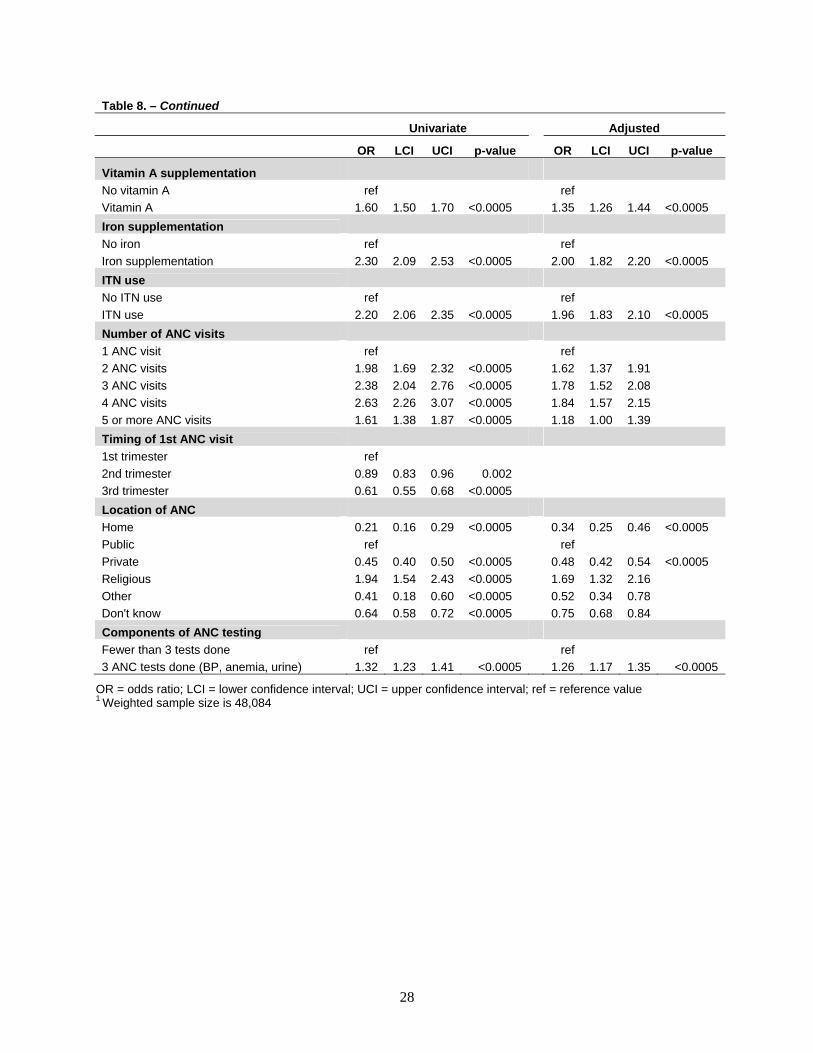
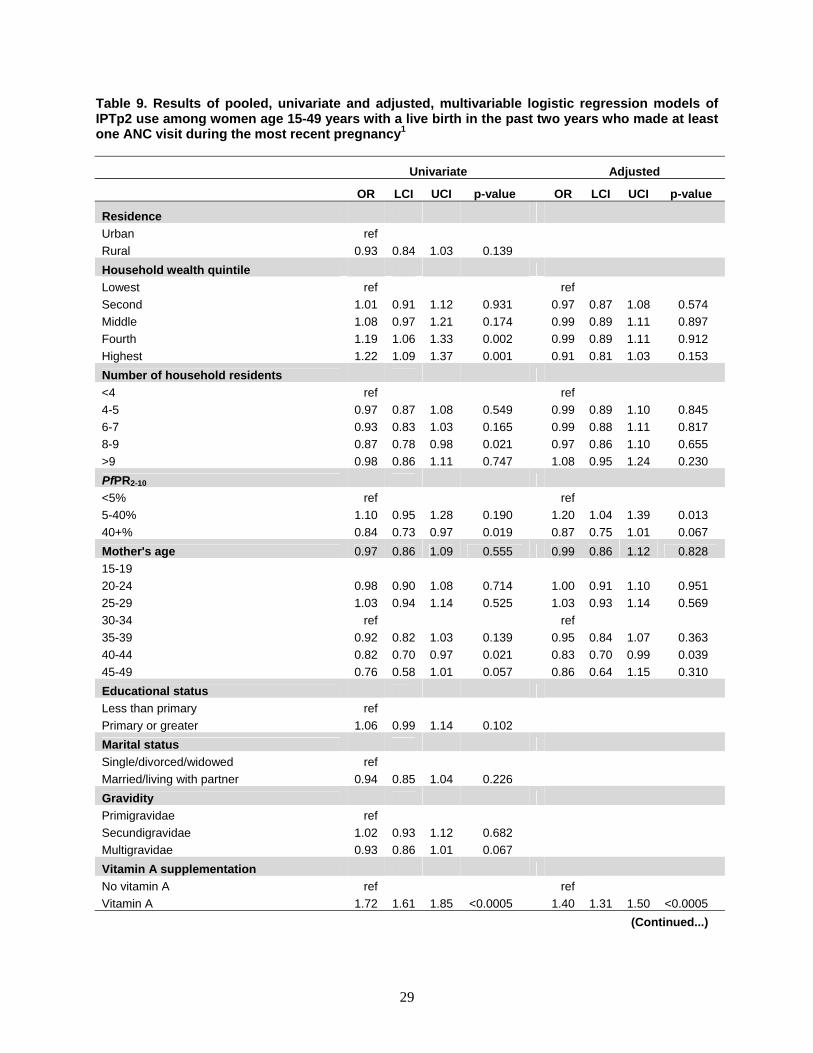
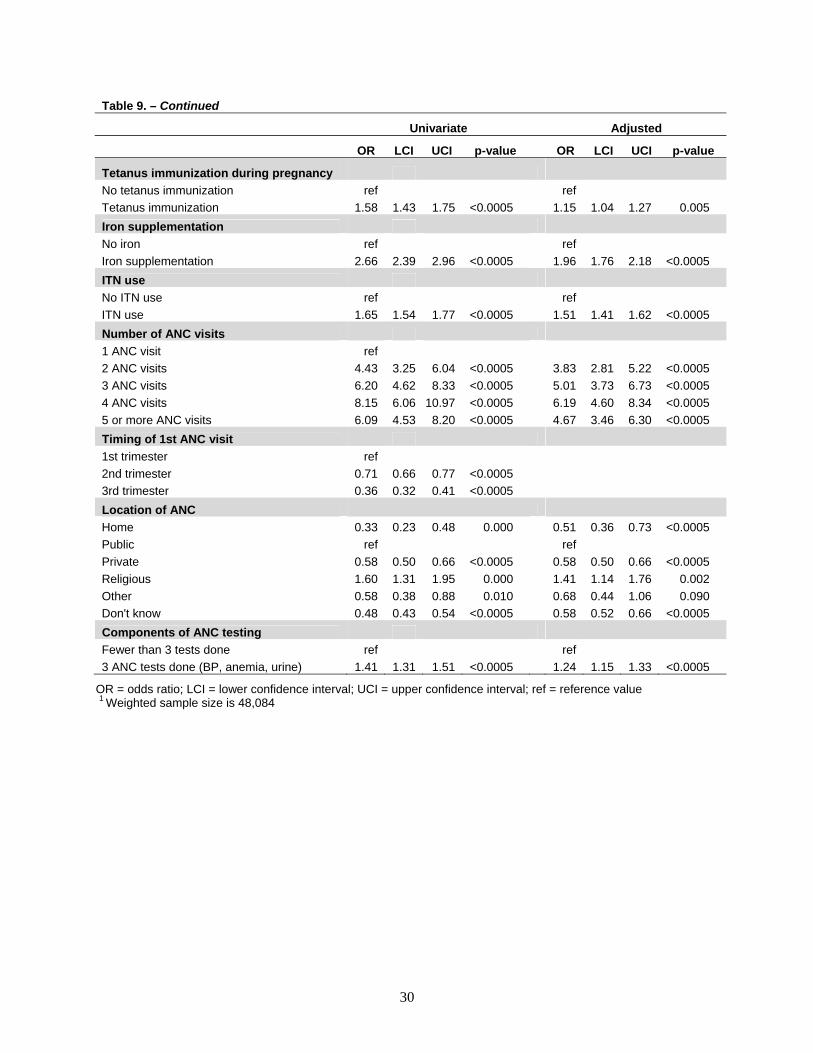
Models of effective delivery of at least two doses of SP (IPTp2) to women who made at least one ANC visit produced very similar results (Table 9). There were a few notable exceptions: marital status and education were not significantly associated with IPTp2, and associations with maternal age and number of household residents were only marginally significant. In the multivariable model also, differences were found: Women living in areas of moderate malaria transmission (PfPR2-10 between 5% and 40%) were more likely than those living in low transmission areas to receive IPTp2 (OR=1.2). Maternal age and number of household residents were not significantly associated with IPTp2.

27
Table 8. Results of pooled, univariate and adjusted, multivariable logistic regression models of IPTp1 use among women age 15-49 years with a live birth in the past two years who made at least one ANC visit during the most recent pregnancy1
Univariate Adjusted
OR LCI UCI p-value OR LCI UCI p-value
Residence
Urban ref
Rural 1.00 0.90 1.10 0.930
Household wealth quintile
Lowest ref ref
Second 1.03 0.93 1.14 0.553 1.01 0.91 1.12 0.818
Middle 1.10 0.99 1.22 0.088 1.04 0.93 1.15 0.509
Fourth 1.21 1.08 1.35 0.001 1.06 0.95 1.19 0.318
Highest 1.18 1.05 1.32 0.006 0.96 0.85 1.08 0.495
Number of household residents
<4 ref
4-5 1.03 0.93 1.13 0.592 1.02 0.92 1.13 0.720
6-7 1.01 0.92 1.11 0.887 1.02 0.92 1.14 0.665
8-9 1.02 0.92 1.13 0.769 1.07 0.95 1.20 0.249
>9 1.13 1.01 1.27 0.031 1.20 1.06 1.35 0.003
PfPR2-10
<5% ref
5-40% 0.83 0.73 0.96 0.010 0.98 0.85 1.13 0.763
40+% 0.60 0.52 0.68 <0.0005 0.71 0.61 0.81 <0.0005
Mother's age
15-19 0.85 0.77 0.95 0.004 0.82 0.72 0.92 0.001
20-24 0.92 0.85 1.00 0.050 0.91 0.83 0.99 0.03
25-29 0.94 0.86 1.02 0.142 0.94 0.85 1.02 0.146
30-34 ref
35-39 0.86 0.78 0.96 0.006 0.87 0.78 0.97 0.012
40-44 0.74 0.64 0.85 0.000 0.73 0.63 0.84 <0.0005
45-49 0.64 0.49 0.82 0.001 0.70 0.53 0.93 0.012
Educational status
Less than primary ref
Primary or greater 1.08 1.01 1.15 0.022 1.13 1.05 1.22 0.001
Marital status
Single/divorced/widowed ref
Married/living with partner 0.87 0.80 0.95 0.003 0.88 0.80 0.97 0.013
Gravidity
Primigravidae ref
Secundigravidae 1.11 1.02 1.21 0.012
Multigravidae 1.05 0.98 1.13 0.159
Tetanus immunization during pregnancy
No tetanus immunization ref ref
Tetanus immunization 1.49 1.37 1.62 <0.0005 1.19 1.09 1.29 <0.0005 (Continued...)
28
Table 8. – Continued
Univariate Adjusted
OR LCI UCI p-value OR LCI UCI p-value
Vitamin A supplementation
No vitamin A ref ref
Vitamin A 1.60 1.50 1.70 <0.0005 1.35 1.26 1.44 <0.0005
Iron supplementation
No iron ref ref
Iron supplementation 2.30 2.09 2.53 <0.0005 2.00 1.82 2.20 <0.0005
ITN use
No ITN use ref ref
ITN use 2.20 2.06 2.35 <0.0005 1.96 1.83 2.10 <0.0005
Number of ANC visits
1 ANC visit ref ref
2 ANC visits 1.98 1.69 2.32 <0.0005 1.62 1.37 1.91
3 ANC visits 2.38 2.04 2.76 <0.0005 1.78 1.52 2.08
4 ANC visits 2.63 2.26 3.07 <0.0005 1.84 1.57 2.15
5 or more ANC visits 1.61 1.38 1.87 <0.0005 1.18 1.00 1.39
Timing of 1st ANC visit
1st trimester ref
2nd trimester 0.89 0.83 0.96 0.002
3rd trimester 0.61 0.55 0.68 <0.0005
Location of ANC
Home 0.21 0.16 0.29 <0.0005 0.34 0.25 0.46 <0.0005
Public ref ref
Private 0.45 0.40 0.50 <0.0005 0.48 0.42 0.54 <0.0005
Religious 1.94 1.54 2.43 <0.0005 1.69 1.32 2.16
Other 0.41 0.18 0.60 <0.0005 0.52 0.34 0.78
Don't know 0.64 0.58 0.72 <0.0005 0.75 0.68 0.84
Components of ANC testing
Fewer than 3 tests done ref ref
3 ANC tests done (BP, anemia, urine) 1.32 1.23 1.41 <0.0005 1.26 1.17 1.35 <0.0005
OR = odds ratio; LCI = lower confidence interval; UCI = upper confidence interval; ref = reference value 1 Weighted sample size is 48,084
29
Table 9. Results of pooled, univariate and adjusted, multivariable logistic regression models of IPTp2 use among women age 15-49 years with a live birth in the past two years who made at least one ANC visit during the most recent pregnancy1
Univariate Adjusted
OR LCI UCI p-value OR LCI UCI p-value
Residence
Urban ref
Rural 0.93 0.84 1.03 0.139
Household wealth quintile
Lowest ref ref
Second 1.01 0.91 1.12 0.931 0.97 0.87 1.08 0.574
Middle 1.08 0.97 1.21 0.174 0.99 0.89 1.11 0.897
Fourth 1.19 1.06 1.33 0.002 0.99 0.89 1.11 0.912
Highest 1.22 1.09 1.37 0.001 0.91 0.81 1.03 0.153
Number of household residents
<4 ref ref
4-5 0.97 0.87 1.08 0.549 0.99 0.89 1.10 0.845
6-7 0.93 0.83 1.03 0.165 0.99 0.88 1.11 0.817
8-9 0.87 0.78 0.98 0.021 0.97 0.86 1.10 0.655
>9 0.98 0.86 1.11 0.747 1.08 0.95 1.24 0.230
PfPR2-10
<5% ref ref
5-40% 1.10 0.95 1.28 0.190 1.20 1.04 1.39 0.013
40+% 0.84 0.73 0.97 0.019 0.87 0.75 1.01 0.067
Mother's age 0.97 0.86 1.09 0.555 0.99 0.86 1.12 0.828
15-19
20-24 0.98 0.90 1.08 0.714 1.00 0.91 1.10 0.951
25-29 1.03 0.94 1.14 0.525 1.03 0.93 1.14 0.569
30-34 ref ref
35-39 0.92 0.82 1.03 0.139 0.95 0.84 1.07 0.363
40-44 0.82 0.70 0.97 0.021 0.83 0.70 0.99 0.039
45-49 0.76 0.58 1.01 0.057 0.86 0.64 1.15 0.310
Educational status
Less than primary ref
Primary or greater 1.06 0.99 1.14 0.102
Marital status
Single/divorced/widowed ref
Married/living with partner 0.94 0.85 1.04 0.226
Gravidity
Primigravidae ref
Secundigravidae 1.02 0.93 1.12 0.682
Multigravidae 0.93 0.86 1.01 0.067
Vitamin A supplementation
No vitamin A ref ref
Vitamin A 1.72 1.61 1.85 <0.0005 1.40 1.31 1.50 <0.0005
(Continued...)
30
Table 9. – Continued
Univariate Adjusted
OR LCI UCI p-value OR LCI UCI p-value
Tetanus immunization during pregnancy
No tetanus immunization ref ref
Tetanus immunization 1.58 1.43 1.75 <0.0005 1.15 1.04 1.27 0.005
Iron supplementation
No iron ref ref
Iron supplementation 2.66 2.39 2.96 <0.0005 1.96 1.76 2.18 <0.0005
ITN use
No ITN use ref ref
ITN use 1.65 1.54 1.77 <0.0005 1.51 1.41 1.62 <0.0005
Number of ANC visits
1 ANC visit ref
2 ANC visits 4.43 3.25 6.04 <0.0005 3.83 2.81 5.22 <0.0005
3 ANC visits 6.20 4.62 8.33 <0.0005 5.01 3.73 6.73 <0.0005
4 ANC visits 8.15 6.06 10.97 <0.0005 6.19 4.60 8.34 <0.0005
5 or more ANC visits 6.09 4.53 8.20 <0.0005 4.67 3.46 6.30 <0.0005
Timing of 1st ANC visit
1st trimester ref
2nd trimester 0.71 0.66 0.77 <0.0005
3rd trimester 0.36 0.32 0.41 <0.0005
Location of ANC
Home 0.33 0.23 0.48 0.000 0.51 0.36 0.73 <0.0005
Public ref ref
Private 0.58 0.50 0.66 <0.0005 0.58 0.50 0.66 <0.0005
Religious 1.60 1.31 1.95 0.000 1.41 1.14 1.76 0.002
Other 0.58 0.38 0.88 0.010 0.68 0.44 1.06 0.090
Don't know 0.48 0.43 0.54 <0.0005 0.58 0.52 0.66 <0.0005
Components of ANC testing
Fewer than 3 tests done ref ref
3 ANC tests done (BP, anemia, urine) 1.41 1.31 1.51 <0.0005 1.24 1.15 1.33 <0.0005
OR = odds ratio; LCI = lower confidence interval; UCI = upper confidence interval; ref = reference value 1 Weighted sample size is 48,084
31
Comparative Analyses of Lower and Higher IPTp Coverage Countries
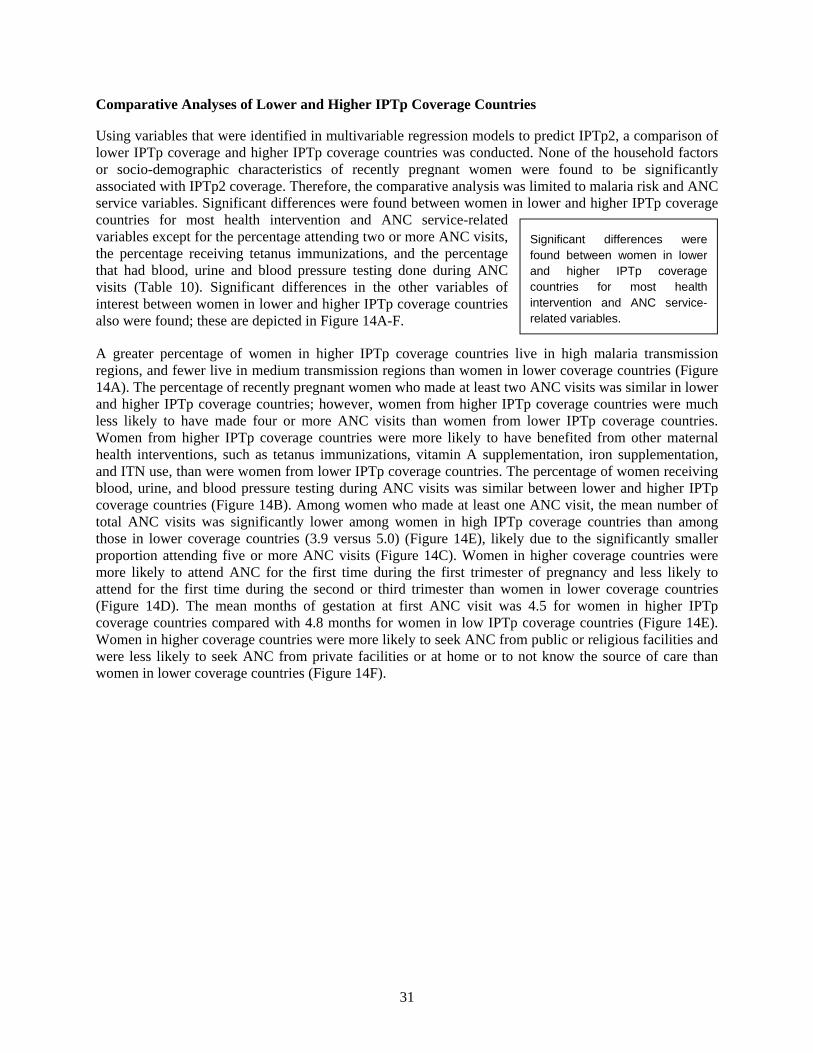
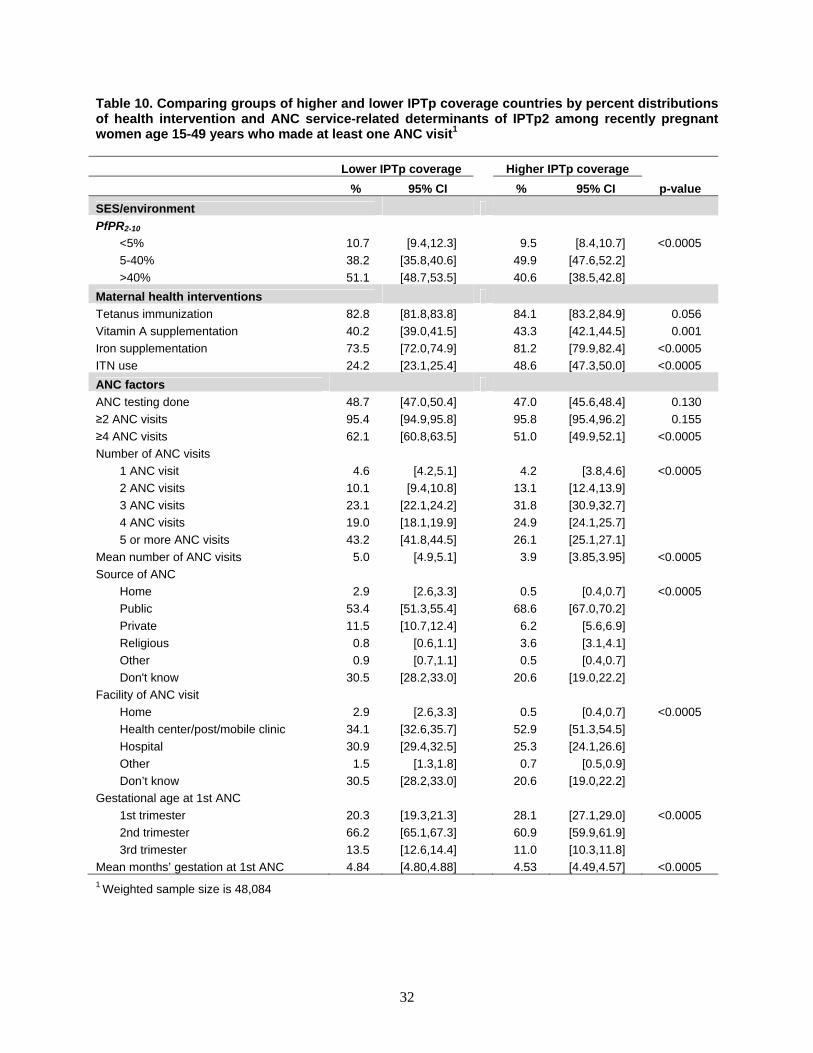
Using variables that were identified in multivariable regression models to predict IPTp2, a comparison of lower IPTp coverage and higher IPTp coverage countries was conducted. None of the household factors or socio-demographic characteristics of recently pregnant women were found to be significantly associated with IPTp2 coverage. Therefore, the comparative analysis was limited to malaria risk and ANC service variables. Significant differences were found between women in lower and higher IPTp coverage countries for most health intervention and ANC service-related variables except for the percentage attending two or more ANC visits, the percentage receiving tetanus immunizations, and the percentage that had blood, urine and blood pressure testing done during ANC visits (Table 10). Significant differences in the other variables of interest between women in lower and higher IPTp coverage countries also were found; these are depicted in Figure 14A-F.
A greater percentage of women in higher IPTp coverage countries live in high malaria transmission regions, and fewer live in medium transmission regions than women in lower coverage countries (Figure 14A). The percentage of recently pregnant women who made at least two ANC visits was similar in lower and higher IPTp coverage countries; however, women from higher IPTp coverage countries were much less likely to have made four or more ANC visits than women from lower IPTp coverage countries. Women from higher IPTp coverage countries were more likely to have benefited from other maternal health interventions, such as tetanus immunizations, vitamin A supplementation, iron supplementation, and ITN use, than were women from lower IPTp coverage countries. The percentage of women receiving blood, urine, and blood pressure testing during ANC visits was similar between lower and higher IPTp coverage countries (Figure 14B). Among women who made at least one ANC visit, the mean number of total ANC visits was significantly lower among women in high IPTp coverage countries than among those in lower coverage countries (3.9 versus 5.0) (Figure 14E), likely due to the significantly smaller proportion attending five or more ANC visits (Figure 14C). Women in higher coverage countries were more likely to attend ANC for the first time during the first trimester of pregnancy and less likely to attend for the first time during the second or third trimester than women in lower coverage countries (Figure 14D). The mean months of gestation at first ANC visit was 4.5 for women in higher IPTp coverage countries compared with 4.8 months for women in low IPTp coverage countries (Figure 14E). Women in higher coverage countries were more likely to seek ANC from public or religious facilities and were less likely to seek ANC from private facilities or at home or to not know the source of care than women in lower coverage countries (Figure 14F).
Significant differences were found between women in lower and higher IPTp coverage countries for most health intervention and ANC service-related variables.
32
Table 10. Comparing groups of higher and lower IPTp coverage countries by percent distributions of health intervention and ANC service-related determinants of IPTp2 among recently pregnant women age 15-49 years who made at least one ANC visit1
Lower IPTp coverage Higher IPTp coverage
p-value % 95% CI % 95% CI
SES/environment
PfPR2-10
<5% 10.7 [9.4,12.3] 9.5 [8.4,10.7] <0.0005
5-40% 38.2 [35.8,40.6] 49.9 [47.6,52.2]
>40% 51.1 [48.7,53.5] 40.6 [38.5,42.8]
Maternal health interventions
Tetanus immunization 82.8 [81.8,83.8] 84.1 [83.2,84.9] 0.056
Vitamin A supplementation 40.2 [39.0,41.5] 43.3 [42.1,44.5] 0.001
Iron supplementation 73.5 [72.0,74.9] 81.2 [79.9,82.4] <0.0005
ITN use 24.2 [23.1,25.4] 48.6 [47.3,50.0] <0.0005
ANC factors
ANC testing done 48.7 [47.0,50.4] 47.0 [45.6,48.4] 0.130
≥2 ANC visits 95.4 [94.9,95.8] 95.8 [95.4,96.2] 0.155
≥4 ANC visits 62.1 [60.8,63.5] 51.0 [49.9,52.1] <0.0005
Number of ANC visits
1 ANC visit 4.6 [4.2,5.1] 4.2 [3.8,4.6] <0.0005
2 ANC visits 10.1 [9.4,10.8] 13.1 [12.4,13.9]
3 ANC visits 23.1 [22.1,24.2] 31.8 [30.9,32.7]
4 ANC visits 19.0 [18.1,19.9] 24.9 [24.1,25.7]
5 or more ANC visits 43.2 [41.8,44.5] 26.1 [25.1,27.1]
Mean number of ANC visits 5.0 [4.9,5.1] 3.9 [3.85,3.95] <0.0005
Source of ANC
Home 2.9 [2.6,3.3] 0.5 [0.4,0.7] <0.0005
Public 53.4 [51.3,55.4] 68.6 [67.0,70.2]
Private 11.5 [10.7,12.4] 6.2 [5.6,6.9]
Religious 0.8 [0.6,1.1] 3.6 [3.1,4.1]
Other 0.9 [0.7,1.1] 0.5 [0.4,0.7]
Don't know 30.5 [28.2,33.0] 20.6 [19.0,22.2]
Facility of ANC visit
Home 2.9 [2.6,3.3] 0.5 [0.4,0.7] <0.0005
Health center/post/mobile clinic 34.1 [32.6,35.7] 52.9 [51.3,54.5]
Hospital 30.9 [29.4,32.5] 25.3 [24.1,26.6]
Other 1.5 [1.3,1.8] 0.7 [0.5,0.9]
Don’t know 30.5 [28.2,33.0] 20.6 [19.0,22.2]
Gestational age at 1st ANC
1st trimester 20.3 [19.3,21.3] 28.1 [27.1,29.0] <0.0005
2nd trimester 66.2 [65.1,67.3] 60.9 [59.9,61.9]
3rd trimester 13.5 [12.6,14.4] 11.0 [10.3,11.8]
Mean months’ gestation at 1st ANC 4.84 [4.80,4.88] 4.53 [4.49,4.57] <0.0005 1 Weighted sample size is 48,084
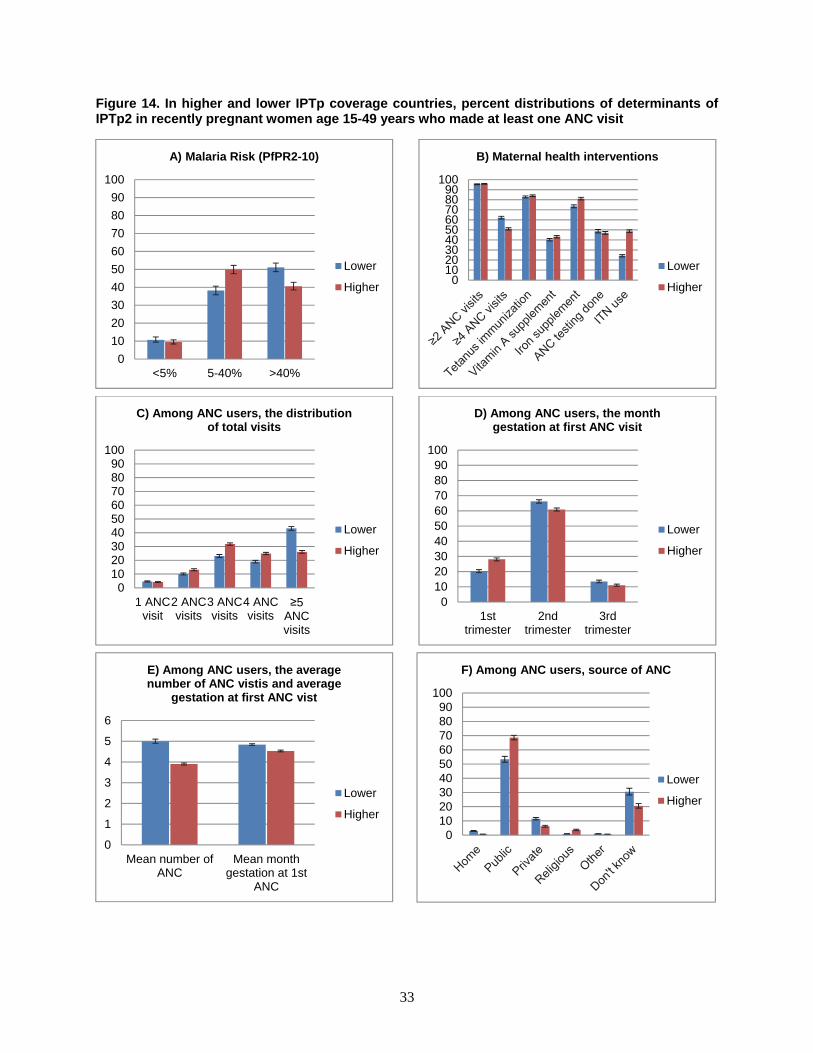
33
Figure 14. In higher and lower IPTp coverage countries, percent distributions of determinants of IPTp2 in recently pregnant women age 15-49 years who made at least one ANC visit
0
10
20
30
40
50
60
70
80
90
100
<5% 5-40% >40%
A) Malaria Risk (PfPR2-10)
Lower
Higher0
102030405060708090
100
B) Maternal health interventions
Lower
Higher
0102030405060708090
100
1 ANCvisit
2 ANCvisits
3 ANCvisits
4 ANCvisits
≥5 ANC visits
C) Among ANC users, the distribution of total visits
Lower
Higher
0102030405060708090
100
1sttrimester
2ndtrimester
3rdtrimester
D) Among ANC users, the month gestation at first ANC visit
Lower
Higher
0
1
2
3
4
5
6
Mean number ofANC
Mean monthgestation at 1st
ANC
E) Among ANC users, the average number of ANC vistis and average
gestation at first ANC vist
Lower
Higher
0102030405060708090
100
F) Among ANC users, source of ANC
Lower
Higher

35
Discussion
This study makes use of nationally representative household survey data to take a broad look at coverage of malaria in pregnancy interventions across malaria endemic countries in sub-Saharan Africa between 2007 and 2011. Use of a service effectiveness approach enabled assessment of intermediate steps in the process of delivery and uptake of malaria in pregnancy interventions, thereby identifying bottlenecks in the delivery process. Use of household survey data allowed many socio-demographic and maternal health data to be examined as potential determinants of IPTp uptake. A stratified approach to analyses was taken in order to identify bottlenecks to delivery or determinants of IPTp coverage that differed between countries with higher and lower levels of IPTp coverage. Better identification of the least effective steps in the delivery process and of individual-level factors associated with higher coverage is essential to improving targeting and delivery of malaria in pregnancy interventions.
The service effectiveness approach to assessing malaria in pregnancy interventions showed that a small fraction of the targeted population received the recommended interventions. The cumulative effectiveness of IPTp intervention, defined as two doses of SP and two ANC visits, was only 18% across the surveys included in this analysis. Cumulative effectiveness was 30% in higher IPTp coverage countries and only 8% in lower IPTp coverage countries. These findings suggest that IPTp is not being effectively delivered to eligible women and that even the most successful IPTp programs are likely underperforming.
Analyses of intermediate steps were performed to identify bottlenecks in the overall process of malaria in pregnancy intervention delivery. While this exercise was useful in highlighting problematic steps in the delivery process, the available data did not permit in-depth analyses of cause. As was shown in the conceptual framework (Figure 2), the steps in the delivery of IPTp are influenced by women’s behaviors, by health care providers’ behaviors, and by elements of the health system. Household surveys, however, are intended to collect socio-demographic information about women and their health status and behaviors; they do not typically ask about health care providers or health systems. Thus, results of the service effectiveness analyses revealed broadly that certain steps in the process of IPTp delivery were more successful than others and that coverage of some of the intermediate steps varies considerably between lower and higher IPTp coverage countries. Identification of specific causes for success or failure was not possible, however.
The first step in attaining effective IPTp coverage in most settings requires that women attend ANC. ANC attendance was not found to be a major limiting factor, however. Overall, across the surveys 83% of women with recent births attended ANC at least once during the most recent pregnancy; 79% made at least two ANC visits; the mean gestation at first ANC visit was about half way through pregnancy, at 4.6 months; and the mean number of ANC visits overall was 4.5. Thus, the majority of women attended ANC at sufficient frequency and timing to receive the recommended two or more doses of SP. Only 20% of eligible women actually received at least two doses, however. Similar results have been found in subnational studies of the effectiveness of malaria in pregnancy interventions in Nyando District, Kenya (Hill et al., 2013a) and in Segou District, Mali (Webster et al., 2013a), but this study substantiates findings at a national level, across 16 countries.
Stratified by IPTp coverage groups, ANC attendance was lower in lower IPTp coverage countries than in higher IPTp coverage countries (76% versus 95% for ≥1 ANC visit; 70% versus 91% for ≥2 ANC visits). Despite this difference, the relatively high attendance overall suggests that ANC attendance is not the driving factor behind lower IPTp coverage. Further, among women who attended ANC at least once and
IPTp is not being effectively delivered to eligible women and even the most successful IPTp programs are likely underperforming.
36
who received at least one dose of SP via ANC, almost all attended ANC a second time (97%). This finding did not differ in lower and higher IPTp coverage surveys, supporting the contention that women’s ANC care seeking behaviors are not the key barriers to effective IPTp delivery.
Despite high levels of ANC attendance, few women received SP during ANC visits. Delivery of both first and second doses of SP was identified as a clear bottleneck in the process of malaria in pregnancy intervention. Coverage of IPTp1 was only 42% among women who attended ANC at least once. Delivery of IPTp1 was much higher in higher IPTp coverage countries than in lower IPTp coverage countries (65% versus 22%). Delivery of IPTp2 among women who attended ANC at least twice was higher (57%) and did not vary as much between higher and lower IPTp coverage countries (60% versus 52%). These steps are clearly bottlenecks that could be targeted to improve coverage of the intervention.
Although the data used for these analyses do not include the information necessary to identify the causes of lower IPTp coverage, other researchers have identified health systems factors, such as complex policy guidelines or lack of implementation guidelines, as important (Webster et al., 2013a). In a study in Nigeria, IPTp coverage was 13% for one dose of SP and 7% for two doses. The main barrier to IPTp delivery was a failure of providers to offer the medications; almost all women who were offered SP during ANC visits took it (98.9% for the first dose and 96.9% for the second dose) (Onoka et al., 2012). A very recent systematic review and meta-analysis identified barriers to receiving IPTp from the perspectives of both pregnant women eligible for the intervention and of the health care providers (Hill, et al., 2013b). Many studies reviewed have reported providers’ lack of knowledge of IPTp policies and of potential side effects and potential benefits to be barriers. Other barriers identified in Hill and colleagues’ review included health care staff not offering the medication, stockouts, and lack of cups or drinking water necessary to provide SP by directly observed therapy (DOT). The review concludes that lack of clear policies and guidelines as well as insufficient training, supervision, and quality assurance at the health facility level are responsible for many of the barriers to effective delivery of IPTp. A recent qualitative review of malaria in pregnancy interventions also identified a lack of resources, including trained staff, drugs, cups, and clean water, as a barrier (Pell et al., 2011). Other barriers identified related to demand for ANC services such as cost of care and distance to facilities. Follow-up studies focusing on predictive factors for delivery of SP in the ANC setting are necessary to better inform intervention efforts.
Finally, use of ITNs is recommended as part of the standard malaria prevention package for pregnant women. Overall, the rate of ITN use was low among women who received IPTp2—44%; it was higher in higher IPTp coverage countries than in lower IPTp coverage countries (48% versus 35%).
While service effectiveness analyses allow identification of intermediate steps that may be targeted for improvements in uptake of the intervention, they do not identify specific determinants of IPTp uptake. Regression models identified factors significantly associated with IPTp1 coverage: malaria transmission levels; use of other maternal health interventions; location, frequency, and timing of antenatal care visits; marital status; education; maternal age; and number of household members. Parallel models examining the determinants of IPTp2 produced similar results except for the lack of significance of maternal age and number of household members and the greater significance of malaria transmission levels. These results support findings of Hill and colleagues’ recent meta-analysis (2013b), in which frequency and timing of ANC visits, ITN use, education, and parity were found to be important determinants of IPTp coverage. Knowledge about malaria was also an important determinant of IPTp in this meta-analysis; unfortunately, this parameter is not measured in household surveys as a matter of
Despite high levels of ANC attendance, few women received SP during ANC visits.
The finding that coverage of IPTp is lower in high malaria transmission areas than in the lowest transmission zones could argue for reconsideration of resource allocation at both the local and global levels.
37
course and thus could not be analyzed in this study. Also, source of ANC care was associated with IPTp use; women attending ANC at religious and public facilities were more likely to use IPTp than women who attended other private ANC facilities. Analyses also show that women who use other maternal health interventions such as vitamin A, iron supplementation and tetanus immunization and who use ITNs are more likely to use IPTp, even after controlling for factors such as women’s education, socioeconomic status, household residence and type of health facility. This could be due to unmeasured factors such as women’s individual health knowledge (some women may be more likely to request interventions), to factors such as provider knowledge or resource availability (some facilities may be more likely to have the resources and staff to provide multiple interventions), or to policies and practices at facilities (some facilities may provide better overall care including more and better maternal health interventions).While these findings are informative in characterizing socio-demographic and maternal health factors linked to successful IPTp uptake, they do not provide insight into the reasons that certain steps in the delivery process are ineffective. Studies focused on facilitators of or barriers to SP delivery within the ANC clinic context will be essential for improving IPTp coverage.
With an aim of identifying key differences in determinants of IPTp use between countries with lower IPTp coverage and those with higher IPTp coverage, distributions of significant determinants of IPTp use were compared. Significant differences by IPTp coverage level were seen in the distributions of most determinants with the exception of the percentage of women attending two or more ANC visits and the percentage of women receiving urine, blood, and blood pressure testing during ANC visits. Some interesting patterns emerged from these stratifications. First, although the odds of IPTp coverage increased with increasing number of ANC visits, women in lower coverage countries were more likely to attend five or more ANC visits than women in high coverage countries, even though women in lower IPTp coverage countries were less likely to attend ANC for the first time early in their pregnancies. Women from higher IPTp coverage countries were also more likely to obtain ANC at public facilities and at religious facilities than were women from lower IPTp coverage countries. As ANC care at public and religious facilities is associated with greater likelihood of IPTp use this finding argues for education campaigns to encourage use of public and religious facilities for ANC or for expansion of IPTp service delivery to more facilities in the private sector. A much greater percentage of women in lower IPTp coverage countries than in higher IPTp coverage countries lived in high malaria transmission areas, whereas women in higher IPTp coverage countries were more likely to live in medium transmission areas than were women in lower IPTp coverage countries. Targeting efforts to improve IPTp delivery and uptake to areas of high malaria transmission is likely to be cost–efficient, given the greater potential for reductions in total number of infections and in adverse outcomes.
In summary, effective delivery of IPTp appears to be driven by service delivery dynamics within health facilities more than by lack of access to ANC services. Although the type of health facility was shown to be an important factor in determining effective delivery of IPTp, identification of other important service delivery factors was not possible in these analyses due to the use of household surveys that do not include the necessary data. However, from the results of this study, it is clear, first, that focusing on ANC attendance alone is not sufficient to improve delivery of IPTp; the services and the overall health infrastructure need to be functional and effective, and women need to be informed and willing to use interventions in order for the intervention to be successful. Second, among the available household survey data, malaria transmission risk, maternal health interventions, and ANC factors were found to be the most important determinants of successful delivery of IPTp. Socio-demographic characteristics of the target population were not associated with IPTp use. These results suggest that allocating available malaria in pregnancy resources to improvements in ANC services, especially in areas of highest malaria risk, are likely to have the greatest effect on IPTp coverage. Finally, more targeted research and analyses of facility-based data are needed to identify
Effective delivery of IPTp appears to be driven by service delivery dynamics within health facilities more than by lack of access to ANC services.
38
precisely which factors are responsible for the bottlenecks in IPTp delivery within the context of ANC visits. This is necessary in order to recommend appropriate improvements to IPTp delivery, whether they include better communication with pregnant women to increase knowledge of and demand for IPTp, increased training for health care providers regarding IPTp policies and the importance and benefits of IPTp for pregnant women, improvements in commodity supply chains to ensure continual availability of SP, or any combination thereof.
Every study has limitations. The analyses presented here make use of nationally representative household survey data in which women who have had a live birth in the two years preceding interview were asked questions about their use of antenatal care services and use of medications for their most recent pregnancies. Asking women to report retrospective events introduces the potential for recall bias. Reporting bias may also occur if women feel compelled to under- or overreport intervention use. Also, IPTp coverage may be underestimated in countries with high HIV prevalence, as SP is contraindicated for HIV-positive women taking cotrimoxazole, and DHS and MIS questionnaires do not ask about use of this medication. Not all DHS surveys measure HIV prevalence and MIS rarely do. Thus, it was not possible to control for HIV infection in these analyses.
An additional limitation of these analyses lies in the content of the questionnaires—a typical MIS does not ask extensive questions on history of antenatal care (numbers of visits, gestation at first visit, components of visits). This limits the analysis pertaining to service effectiveness that could be done with these data. Adding several questions to the standard MIS about numbers and timing of ANC visits would be beneficial for programmatically useful analyses. Similarly, women are not asked about the source of each dose of SP they receive or whether or not the medication was taken under directly observed therapy (DOT). This limits the extent to which DHS/MIS can be used to measure precisely adherence to WHO recommendations for IPTp administration. Finally, the retrospective nature of data collection about behaviors during recent pregnancies, in combination with a range of survey years, means that pooled data present a somewhat dated snapshot of the IPTp coverage levels. As much funding and programmatic effort has gone into malaria in pregnancy programs in recent years, current coverage levels are likely to be higher. Until routine reporting systems can be relied on to produce timely and accurate data, however, household surveys, despite their limitations, provide invaluable data for monitoring and evaluation of malaria programs.
More targeted research and analyses of facility-based data are needed to identify precisely which factors are responsible for the bottlenecks in IPTp delivery in ANC.
39
References
Anders, K., T. Marchant, P. Chambo, P. Mapunda, and H. Reyburn. 2008. "Timing of Intermittent Preventive Treatment for Malaria during Pregnancy and the Implications of Current Policy on Early Uptake in North-East Tanzania." Malaria Journal 7: 1-7.
Brabin, B.J. 1983. "An Analysis of Malaria in Pregnancy in Africa." Bulletin of the World Health Organization 61(6): 1005-1016.
Dellicour, S., A.J. Tatem, C.A. Guerra, R.W. Snow, and F.O. ter Kuile. 2010. "Quantifying the Number of Pregnancies at Risk of Malaria in 2007: A Demographic Study." PLoS Med 7(1): e1000221.
Eisele, T.P., D.A. Larsen, P.A. Anglewicz, J. Keating, J. Yukich, A. Bennett, P. Hutchinson, and R.W. Steketee. 2012. "Malaria Prevention in Pregnancy, Birthweight, and Neonatal Mortality: A Meta-Analysis of 32 National Cross-Sectional Datasets in Africa." The Lancet Infectious Diseases 12(12): 942-949.
Gamble, C., P.J. Ekwaru, P. Garner, and F.O. ter Kuile. 2007. "Insecticide-treated Nets for the Prevention of Malaria in Pregnancy: A Systematic Review of Randomised Controlled Trials." PLoS Med 4(3): e107.
Gross, K., S. Alba, J. Schellenberg, F. Kessy, I. Mayumana, and B. Obrist. 2011. "The Combined Effect of Determinants on Coverage of Intermittent Preventive Treatment of Malaria during Pregnancy in the Kilombero Valley, Tanzania." Malaria Journal 10(1): 140.
Guyatt, H.L., and R.W. Snow. 2001a. "The Epidemiology and Burden of Plasmodium Falciparum-Related Anemia among Pregnant Women in Sub-Saharan Africa." American Journal of Tropical Medicine and Hygiene 64(1/2 Suppl.): 36-44.
Guyatt, H.L., and R.W. Snow. 2001b. "Malaria in Pregnancy as an Indirect Cause of Infant Mortality in Sub-Saharan Africa." Transactions of the Royal Society of Tropical Medicine and Hygiene 95(6): 569-576.
Guyatt, H.L., and R.W. Snow. 2004. "Impact of Malaria during Pregnancy on Low Birth Weight in Sub-Saharan Africa." Clinical Microbiology Reviews 17: 760-769.
Hill, J., S. Dellicour, J. Bruce, P. Ouma, J. Smedley, P. Otieno, M. Ombock, S. Kariuki, M Desai, M.J. Hamel, F.O. ter Kuile, and J. Webster. 2013a. "Effectiveness of Antenatal Clinics to Deliver Intermittent Preventive Treatment and Insecticide Treated Nets for the Control of Malaria in Pregnancy in Kenya." PLoS ONE 8(6): e64913.
Hill, J., J. Hoyt, A.M. van Eijk, L. D'Mello-Guyett, F.O. ter Kuile, R. Steketee, H. Smith, and J. Webster. 2013b. "Factors Affecting the Delivery, Access, and Use of Interventions to Prevent Malaria in Pregnancy in Sub-Saharan Africa: A Systematic Review and Meta-Analysis." PLoS Med 10(7): e1001488.
Lindsay, S., J. Ansell, C. Selman, V. Cox, K. Hamilton, and G. Walraven. 2000. "Effect of Pregnancy on Exposure to Malaria Mosquitoes." The Lancet 355(9219): 1972.
40
Malaria Atlas Project. 2013. The spatial distribution of Plasmodium faliciparum malaria endemicity map in 2010 globally. Available online at http://www.map.ox.ac.uk/browse-resources/endemicity /Pf_mean/world/
Marchant, T., R. Nathan, C. Jones, H. Mponda, J. Bruce, Y. Sedekia, J. Schellenberg, M. Hassan, and K. Hanson. 2008. "Individual, facility and Policy Level Influences on National Coverage Estimates for Intermittent Preventive Treatment of Malaria in Pregnancy in Tanzania." Malaria Journal 7(1): 260.
Marchant, T., J.A. Schellenberg, R. Nathan, S. Abdulla, O. Mukasa, H. Mshinda, Hassan, and C. Lengeler. 2004. "Anaemia in Pregnancy and Infant Mortality in Tanzania." Tropical Medicine & International Health 9(2): 262-266.
MEASURE Evaluation, MEASURE DHS, President's Malaria Initiative, Roll Back Malaria Partnership, UNICEF, and World Health Organization. 2013. Household Survey Indicators for Malaria Control. Calverton, Maryland, USA: Measure Evaluation.
Menéndez, C., A. Bardají, B. Sigauque, S. Sanz, J.J. Aponte, S. Mabunda, and P.L. Alonso. 2010. "Malaria Prevention with IPTp during Pregnancy Reduces Neonatal Mortality." PLoS Clinical Trials 7(2): 1-6.
Onoka, C.A., K. Hanson, and O.E. Onwujekwe. 2012. "Low Coverage of Intermittent Preventive Treatment for Malaria in Pregnancy in Nigeria: Demand-Side Influences." Malaria Journal 11(1): 82-89.
Pell, C., L. Straus, E.V.W. Andrew, A. Meñaca, and R. Pool. 2011. "Social and Cultural Factors Affecting Uptake of Interventions for Malaria in Pregnancy in Africa: A Systematic Review of the Qualitative Research." PLoS ONE 6(7): e22452.
Roll Back Malaria Partnership. 2011. Refined/Updated GMAP Objectives, Targets, Milestones and Priorities Beyond 2011. Geneva, Switzerland: RBM Partnership.
Rutstein, S.O., and G. Rojas. 2006. Guide to DHS Statistics: Demographic and Health Survey Methodology. Calverton, Maryland, USA: MEASURE DHS/ICF International/USAID.
Sangaré, L.R., A. Stergachis, P.E. Brentlinger, B.A. Richardson, S.G. Staedke, M.S. Kiwuwa, and N.S. Weiss. 2010. "Determinants of Use of Intermittent Preventive Treatment of Malaria in Pregnancy: Jinja, Uganda." PLoS ONE 5(11): e15066.
Sethi, R., K. Seck, A. Dickerson, and C. O'Malley. 2011. A Malaria in Pregnancy Case Study: Senegal's Successes and Remaining Challenges for Malaria in Pregnancy Programming. Washington DC, USA: Maternal and Child Health Integrated Program.
Sicuri, E., A. Bardají, T. Nhampossa, M. Maixenchs, A. Nhacolo, D. Nhalungo, P. Alonso, and C. Menéndez. 2010. "Cost-Effectiveness of Intermittent Preventive Treatment of Malaria in Pregnancy in Southern Mozambique." PLoS Clinical Trials 7(10): 1-10.
Steketee, R.W., B.L. Nahlen, M.E. Parise, and C. Menendez. 2001. "The Burden of Malaria in Pregnancy in Malaria-Endemic Areas." The American Journal of Tropical Medicine and Hygiene 64(1 suppl): 28-35.
41
Tanahashi, T. 1978. "Health Service Coverage and Its Evaluation." Bulletin of the World Health Organization 56(2): 295-303.
The malERA Consultative Group on Health Systems and Operational Research. 2011. "A Research Agenda for Malaria Eradication: Health Systems and Operational Research." PLoS Med 8(1): e1000397.
The World Bank. 2013. Population, Total. [Table]. Available online at http://data.worldbank.org /indicator/SP.POP.TOTL
van Eijk, A.M., J. Hill, D.A. Larsen, J. Webster, R.W. Steketee, T.P. Eisele, and F.O. ter Kuile. 2013. "Coverage of Intermittent Preventive Treatment and Insecticide-Treated Nets for the Control of Malaria during Pregnancy in Sub-Saharan Africa: A Synthesis and Meta-Analysis of National Survey Data, 2009-11." The Lancet Infectious Diseases Early Online Publication 18(September).
van Vugt, M., A. van Beest, E. Sicuri, M. van Tulder, and M.P. Grobusch. 2011. "Malaria Treatment and Prophylaxis in Endemic and Nonendemic Countries: Evidence on Strategies and Their Cost-Effectiveness." Future Microbiology 6(12): 1485-1500.
Villar, J., P. Bergso, and WHO Antenatal Care Trial Research Group. 2002. WHO Antenatal Care Randomized Trial: Manual for the Implementation of the New Model. Geneva, Switzerland: World Health Organization.
Wallon, M., S. Agarwal, E. Roman, and A. Dickersone. 2011. "A Malaria in Pregnancy Country Case Study: Malawi's Successes and Remaining Challenges for Malaria in Pregnancy Programming", In Maternal and Child Health Integrated Program, edited by USAID, Washington DC, USA: USAID.
Wallon, M., E. Roman,W. Brieger, and B. Rawlins. 2010. "A Malaria in Pregnancy Case Study: Zambia's Successes and Remaining Challenges for Malaria in Pregnancy Programming." In Maternal and Child Health Integrated Program, edited by USAID, Washington DC, USA: USAID.
Webster, J., D. Chandramohan, and K. Hanson. 2010. "Methods for Evaluating Delivery Systems for Scaling up Malaria Control Intervention." BMC Health Services Research 10(Suppl 1): S8.
Webster, J., K. Kayentao, J. Bruce, S.I. Diawara, A. Abathina, A.A. Haiballa, O.K. Doumbo, and J. Hill. 2013a. "Prevention of Malaria in Pregnancy with Intermittent Preventive Treatment and Insecticide Treated Nets in Mali: A Quantitative Health Systems Effectiveness Analysis." PLoS ONE 8(6): e67520.
Webster, J., K. Kayentao, S. Diarra, S.I. Diawara, A.A. Haiballa, O.K. Doumbo, and J. Hill. 2013b. "A Qualitative Health Systems Effectiveness Analysis of the Prevention of Malaria in Pregnancy with Intermittent Preventive Treatment and Insecticide Treated Nets in Mali." PLoS ONE 8(7): e65437.
World Health Organization. 2012a. "Intermittent Preventive Treatment of Malaria in Pregnancy Using Sulfadoxine-Pyrimethamine (IPTp-SP): Updated WHO Policy Recommendation. (October 2012)." Available online at http://www.who.int/malaria/iptp_sp_updated_policy _recommendation_en_ 102012.pdf.

42
World Health Organization. 2012b. World Malaria Report 2012. Geneva, Switzerland: World Health Organization.
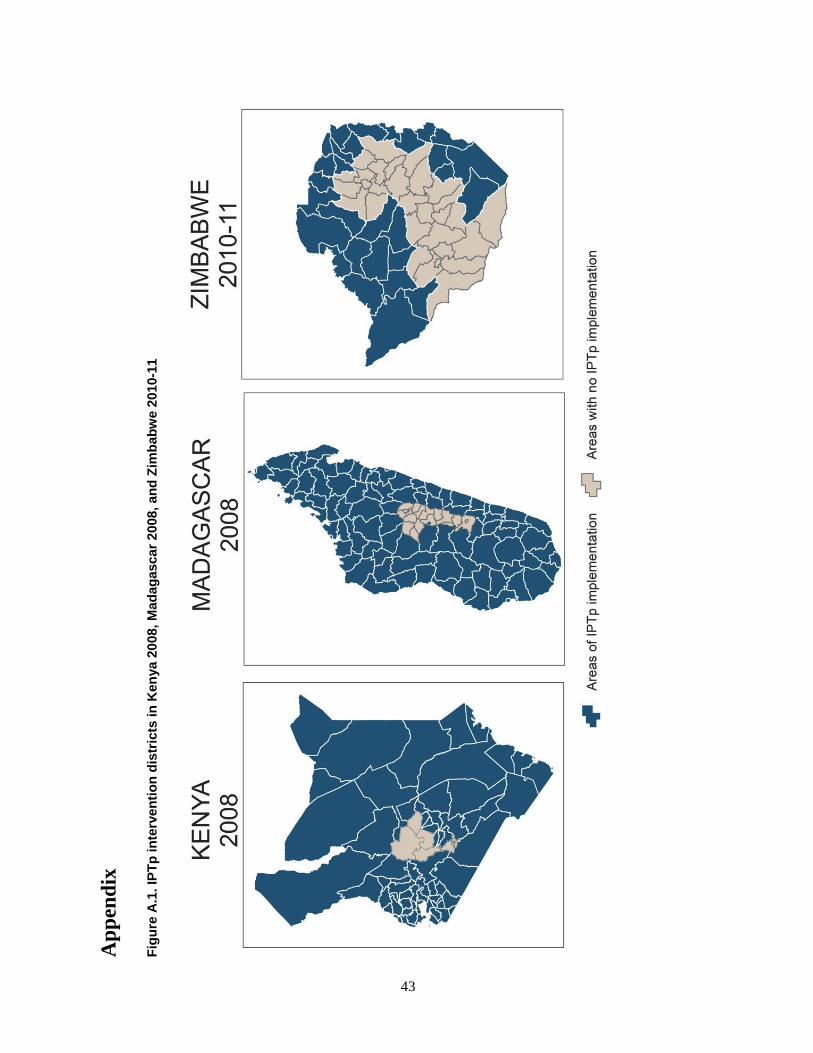
Ap
pen
dix
Fig
ure
A.1
. IP
Tp
inte
rven
tio
n d
istr
icts
in K
enya
20
08, M
adag
asca
r 20
08, a
nd
Zim
bab
we
2010
-11
43
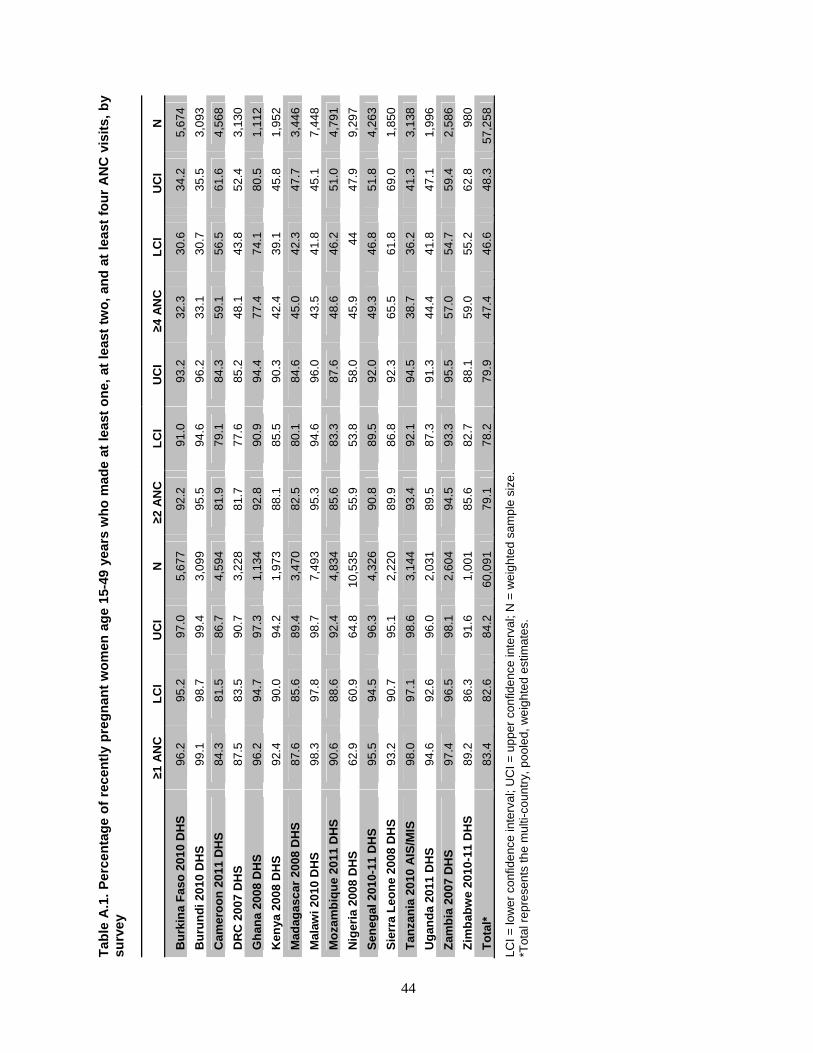
Tab
le A
.1.
Per
cen
tag
e o
f re
cen
tly
pre
gn
ant
wo
men
ag
e 15
-49
year
s w
ho
mad
e at
lea
st o
ne,
at
leas
t tw
o,
and
at
leas
t fo
ur
AN
C v
isit
s, b
y su
rve
y
≥1 A
NC
L
CI
UC
I N
≥2
AN
C
LC
I U
CI
≥4 A
NC
L
CI
UC
I N
Bu
rkin
a F
aso
201
0 D
HS
96
.2
95.2
97
.0
5,67
7
92.2
91
.0
93.2
32
.3
30.6
34
.2
5,67
4
Bu
run
di 2
010
DH
S
99.1
98
.7
99.4
3,
099
95
.5
94.6
96
.2
33.1
30
.7
35.5
3,
093
Cam
ero
on
201
1 D
HS
84
.3
81.5
86
.7
4,59
4
81.9
79
.1
84.3
59
.1
56.5
61
.6
4,56
8
DR
C 2
007
DH
S
87.5
83
.5
90.7
3,
228
81
.7
77.6
85
.2
48.1
43
.8
52.4
3,
130
Gh
ana
2008
DH
S
96.2
94
.7
97.3
1,
134
92
.8
90.9
94
.4
77.4
74
.1
80.5
1,
112
Ken
ya 2
008
DH
S
92.4
90
.0
94.2
1,
973
88
.1
85.5
90
.3
42.4
39
.1
45.8
1,
952
Mad
agas
car
200
8 D
HS
87
.6
85.6
89
.4
3,47
0
82.5
80
.1
84.6
45
.0
42.3
47
.7
3,44
6
Mal
awi 2
010
DH
S
98.3
97
.8
98.7
7,
493
95
.3
94.6
96
.0
43.5
41
.8
45.1
7,
448
Mo
zam
biq
ue
201
1 D
HS
90
.6
88.6
92
.4
4,83
4
85.6
83
.3
87.6
48
.6
46.2
51
.0
4,79
1
Nig
eria
200
8 D
HS
62
.9
60.9
64
.8
10,5
35
55
.9
53.8
58
.0
45.9
44
47
.9
9,29
7
Sen
egal
201
0-11
DH
S
95.5
94
.5
96.3
4,
326
90
.8
89.5
92
.0
49.3
46
.8
51.8
4,
263
Sie
rra
Leo
ne
200
8 D
HS
93
.2
90.7
95
.1
2,22
0
89.9
86
.8
92.3
65
.5
61.8
69
.0
1,85
0
Tan
zan
ia 2
010
AIS
/MIS
98
.0
97.1
98
.6
3,14
4
93.4
92
.1
94.5
38
.7
36.2
41
.3
3,13
8
Ug
and
a 20
11 D
HS
94
.6
92.6
96
.0
2,03
1
89.5
87
.3
91.3
44
.4
41.8
47
.1
1,99
6
Zam
bia
200
7 D
HS
97
.4
96.5
98
.1
2,60
4
94.5
93
.3
95.5
57
.0
54.7
59
.4
2,58
6
Zim
bab
we
2010
-11
DH
S
89.2
86
.3
91.6
1,
001
85
.6
82.7
88
.1
59.0
55
.2
62.8
98
0
To
tal*
83
.4
82.6
84
.2
60,0
91
79
.1
78.2
79
.9
47.4
46
.6
48.3
57
,25
8
LCI =
low
er
conf
ide
nce
inte
rval
; UC
I = u
pper
con
fide
nce
inte
rval
; N =
we
ight
ed s
amp
le s
ize.
*T
otal
rep
rese
nts
the
mul
ti-co
untr
y, p
oole
d, w
eig
hted
est
imat
es.
44
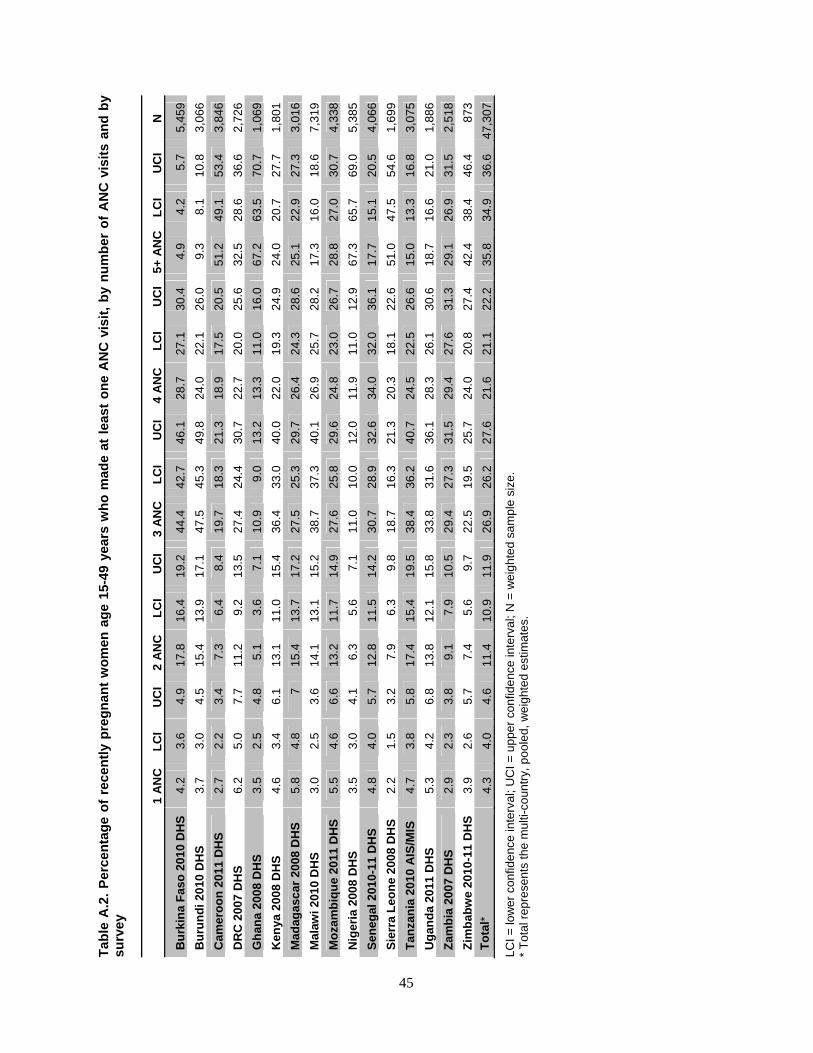
Tab
le A
.2.
Per
cen
tag
e o
f re
cen
tly
pre
gn
ant
wo
men
ag
e 15
-49
year
s w
ho
mad
e at
lea
st o
ne
AN
C v
isit
, b
y n
um
ber
of
AN
C v
isit
s an
d b
y su
rve
y
1 A
NC
L
CI
UC
I 2
AN
CL
CI
UC
I 3
AN
CL
CI
UC
I 4
AN
CL
CI
UC
I 5+
AN
CL
CI
UC
I N
Bu
rkin
a F
aso
201
0 D
HS
4.
2
3.6
4.
9
17.8
16
.4
19.2
44
.4
42.7
46
.1
28.7
27
.1
30.4
4.
9
4.2
5.
7
5,45
9
Bu
run
di 2
010
DH
S
3.7
3.
0
4.5
15
.4
13.9
17
.1
47.5
45
.3
49.8
24
.0
22.1
26
.0
9.3
8.
1
10.8
3,
066
Cam
ero
on
201
1 D
HS
2.
7
2.2
3.
4
7.3
6.
4
8.4
19
.7
18.3
21
.3
18.9
17
.5
20.5
51
.2
49.1
53
.4
3,84
6
DR
C 2
007
DH
S
6.2
5.
0
7.7
11
.2
9.2
13
.5
27.4
24
.4
30.7
22
.7
20.0
25
.6
32.5
28
.6
36.6
2,
726
Gh
ana
2008
DH
S
3.5
2.
5
4.8
5.
1
3.6
7.
1
10.9
9.
0
13.2
13
.3
11.0
16
.0
67.2
63
.5
70.7
1,
069
Ken
ya 2
008
DH
S
4.6
3.
4
6.1
13
.1
11.0
15
.4
36.4
33
.0
40.0
22
.0
19.3
24
.9
24.0
20
.7
27.7
1,
801
Mad
agas
car
200
8 D
HS
5.
8
4.8
7
15.4
13
.7
17.2
27
.5
25.3
29
.7
26.4
24
.3
28.6
25
.1
22.9
27
.3
3,01
6
Mal
awi 2
010
DH
S
3.0
2.
5
3.6
14
.1
13.1
15
.2
38.7
37
.3
40.1
26
.9
25.7
28
.2
17.3
16
.0
18.6
7,
319
Mo
zam
biq
ue
201
1 D
HS
5.
5
4.6
6.
6
13.2
11
.7
14.9
27
.6
25.8
29
.6
24.8
23
.0
26.7
28
.8
27.0
30
.7
4,33
8
Nig
eria
200
8 D
HS
3.
5
3.0
4.
1
6.3
5.
6
7.1
11
.0
10.0
12
.0
11.9
11
.0
12.9
67
.3
65.7
69
.0
5,38
5
Sen
egal
201
0-11
DH
S
4.8
4.
0
5.7
12
.8
11.5
14
.2
30.7
28
.9
32.6
34
.0
32.0
36
.1
17.7
15
.1
20.5
4,
066
Sie
rra
Leo
ne
200
8 D
HS
2.
2
1.5
3.
2
7.9
6.
3
9.8
18
.7
16.3
21
.3
20.3
18
.1
22.6
51
.0
47.5
54
.6
1,69
9
Tan
zan
ia 2
010
AIS
/MIS
4.
7
3.8
5.
8
17.4
15
.4
19.5
38
.4
36.2
40
.7
24.5
22
.5
26.6
15
.0
13.3
16
.8
3,07
5
Ug
and
a 20
11 D
HS
5.
3
4.2
6.
8
13.8
12
.1
15.8
33
.8
31.6
36
.1
28.3
26
.1
30.6
18
.7
16.6
21
.0
1,88
6
Zam
bia
200
7 D
HS
2.
9
2.3
3.
8
9.1
7.
9
10.5
29
.4
27.3
31
.5
29.4
27
.6
31.3
29
.1
26.9
31
.5
2,51
8
Zim
bab
we
2010
-11
DH
S
3.9
2.
6
5.7
7.
4
5.6
9.
7
22.5
19
.5
25.7
24
.0
20.8
27
.4
42.4
38
.4
46.4
87
3
To
tal*
4.
3
4.0
4.
6
11.4
10
.9
11.9
26
.9
26.2
27
.6
21.6
21
.1
22.2
35
.8
34.9
36
.6
47,3
07
LCI =
low
er
conf
ide
nce
inte
rval
; UC
I = u
pper
con
fide
nce
inte
rval
; N =
we
ight
ed s
amp
le s
ize.
*
Tot
al r
epre
sent
s th
e m
ulti-
coun
try,
poo
led,
we
ight
ed e
stim
ates
.
45
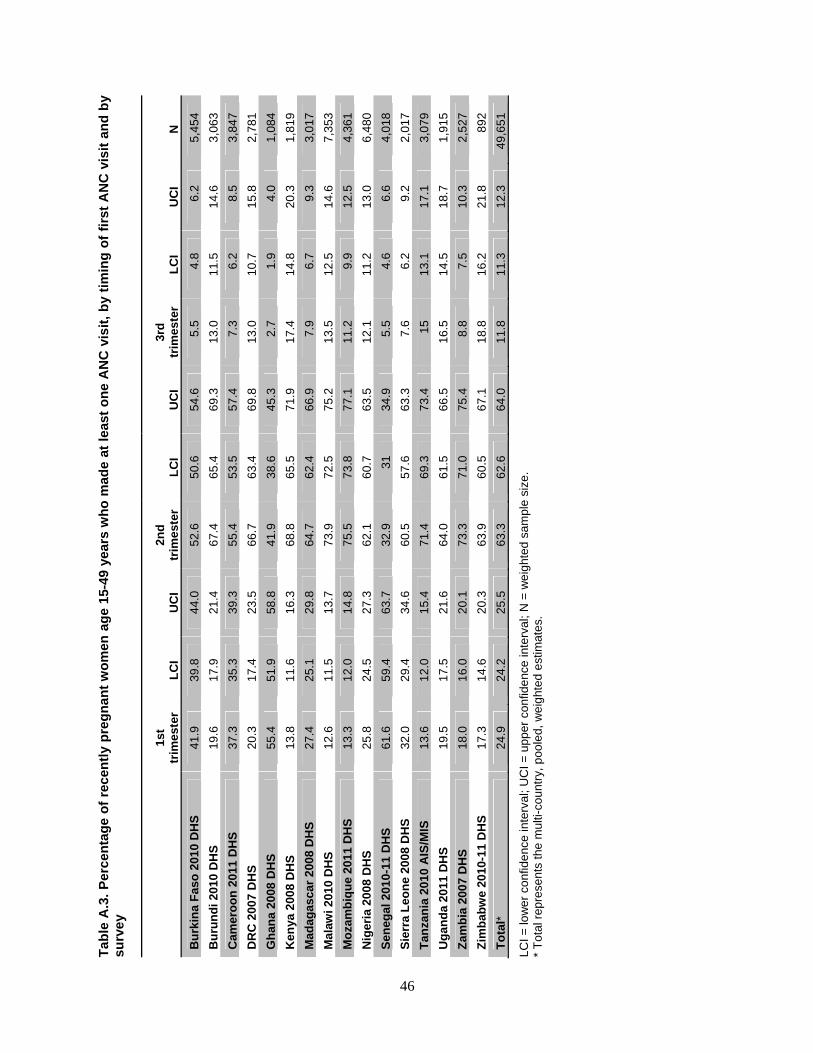
Tab
le A
.3.
Per
cen
tag
e o
f re
cen
tly
pre
gn
ant
wo
men
ag
e 15
-49
year
s w
ho
mad
e at
lea
st o
ne
AN
C v
isit
, b
y ti
min
g o
f fi
rst
AN
C v
isit
an
d b
y su
rve
y
1st
trim
este
r L
CI
UC
I 2n
d
trim
este
r L
CI
UC
I 3r
d
trim
este
r L
CI
UC
I N
Bu
rkin
a F
aso
201
0 D
HS
41
.9
39.8
44
.0
52.6
50
.6
54.6
5.
5
4.8
6.
2
5,45
4
Bu
run
di 2
010
DH
S
19.6
17
.9
21.4
67
.4
65.4
69
.3
13.0
11
.5
14.6
3,
063
Cam
ero
on
201
1 D
HS
37
.3
35.3
39
.3
55.4
53
.5
57.4
7.
3
6.2
8.
5
3,84
7
DR
C 2
007
DH
S
20.3
17
.4
23.5
66
.7
63.4
69
.8
13.0
10
.7
15.8
2,
781
Gh
ana
2008
DH
S
55.4
51
.9
58.8
41
.9
38.6
45
.3
2.7
1.
9
4.0
1,
084
Ken
ya 2
008
DH
S
13.8
11
.6
16.3
68
.8
65.5
71
.9
17.4
14
.8
20.3
1,
819
Mad
agas
car
200
8 D
HS
27
.4
25.1
29
.8
64.7
62
.4
66.9
7.
9
6.7
9.
3
3,01
7
Mal
awi 2
010
DH
S
12.6
11
.5
13.7
73
.9
72.5
75
.2
13.5
12
.5
14.6
7,
353
Mo
zam
biq
ue
201
1 D
HS
13
.3
12.0
14
.8
75.5
73
.8
77.1
11
.2
9.9
12
.5
4,36
1
Nig
eria
200
8 D
HS
25
.8
24.5
27
.3
62.1
60
.7
63.5
12
.1
11.2
13
.0
6,48
0
Sen
egal
201
0-11
DH
S
61.6
59
.4
63.7
32
.9
31
34.9
5.
5
4.6
6.
6
4,01
8
Sie
rra
Leo
ne
200
8 D
HS
32
.0
29.4
34
.6
60.5
57
.6
63.3
7.
6
6.2
9.
2
2,01
7
Tan
zan
ia 2
010
AIS
/MIS
13
.6
12.0
15
.4
71.4
69
.3
73.4
15
13
.1
17.1
3,
079
Ug
and
a 20
11 D
HS
19
.5
17.5
21
.6
64.0
61
.5
66.5
16
.5
14.5
18
.7
1,91
5
Zam
bia
200
7 D
HS
18
.0
16.0
20
.1
73.3
71
.0
75.4
8.
8
7.5
10
.3
2,52
7
Zim
bab
we
2010
-11
DH
S
17.3
14
.6
20.3
63
.9
60.5
67
.1
18.8
16
.2
21.8
89
2
To
tal*
24
.9
24.2
25
.5
63.3
62
.6
64.0
11
.8
11.3
12
.3
49,6
51
LCI =
low
er
conf
ide
nce
inte
rval
; UC
I = u
pper
con
fide
nce
inte
rval
; N =
we
ight
ed s
amp
le s
ize.
*
Tot
al r
epre
sent
s th
e m
ulti-
coun
try,
poo
led,
we
ight
ed e
stim
ates
.
46
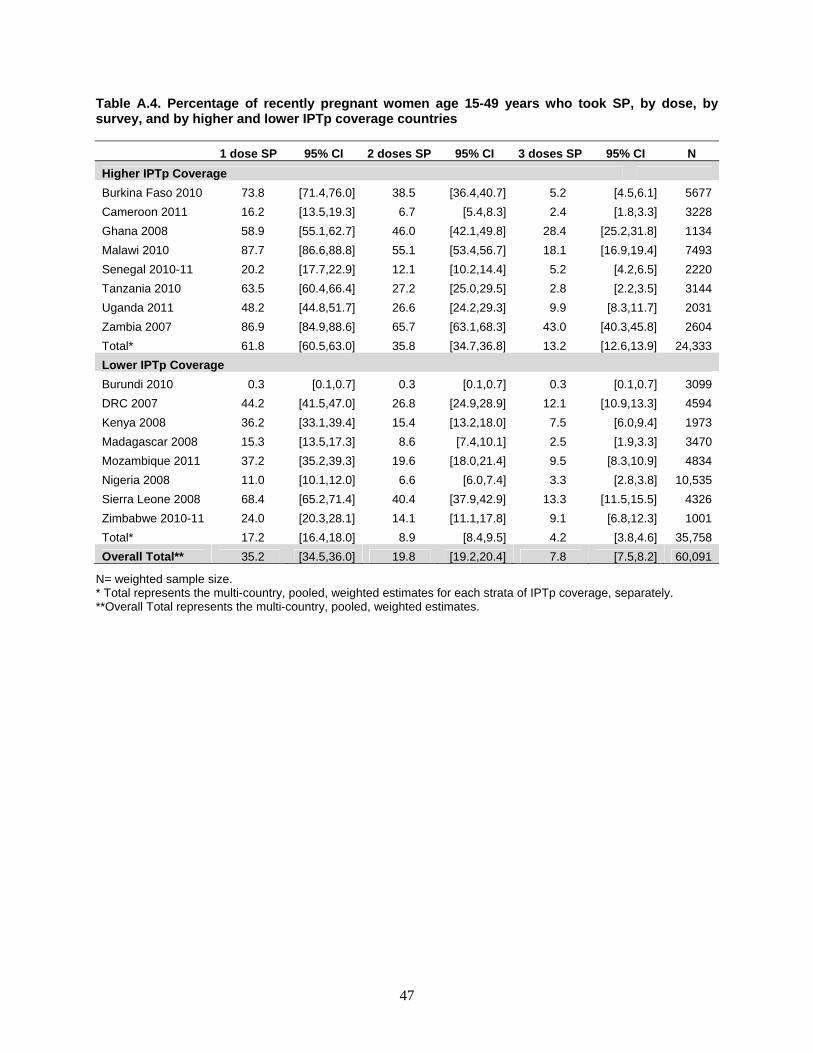
47
Table A.4. Percentage of recently pregnant women age 15-49 years who took SP, by dose, by survey, and by higher and lower IPTp coverage countries
1 dose SP 95% CI 2 doses SP 95% CI 3 doses SP 95% CI N
Higher IPTp Coverage
Burkina Faso 2010 73.8 [71.4,76.0] 38.5 [36.4,40.7] 5.2 [4.5,6.1] 5677
Cameroon 2011 16.2 [13.5,19.3] 6.7 [5.4,8.3] 2.4 [1.8,3.3] 3228
Ghana 2008 58.9 [55.1,62.7] 46.0 [42.1,49.8] 28.4 [25.2,31.8] 1134
Malawi 2010 87.7 [86.6,88.8] 55.1 [53.4,56.7] 18.1 [16.9,19.4] 7493
Senegal 2010-11 20.2 [17.7,22.9] 12.1 [10.2,14.4] 5.2 [4.2,6.5] 2220
Tanzania 2010 63.5 [60.4,66.4] 27.2 [25.0,29.5] 2.8 [2.2,3.5] 3144
Uganda 2011 48.2 [44.8,51.7] 26.6 [24.2,29.3] 9.9 [8.3,11.7] 2031
Zambia 2007 86.9 [84.9,88.6] 65.7 [63.1,68.3] 43.0 [40.3,45.8] 2604
Total* 61.8 [60.5,63.0] 35.8 [34.7,36.8] 13.2 [12.6,13.9] 24,333
Lower IPTp Coverage
Burundi 2010 0.3 [0.1,0.7] 0.3 [0.1,0.7] 0.3 [0.1,0.7] 3099
DRC 2007 44.2 [41.5,47.0] 26.8 [24.9,28.9] 12.1 [10.9,13.3] 4594
Kenya 2008 36.2 [33.1,39.4] 15.4 [13.2,18.0] 7.5 [6.0,9.4] 1973
Madagascar 2008 15.3 [13.5,17.3] 8.6 [7.4,10.1] 2.5 [1.9,3.3] 3470
Mozambique 2011 37.2 [35.2,39.3] 19.6 [18.0,21.4] 9.5 [8.3,10.9] 4834
Nigeria 2008 11.0 [10.1,12.0] 6.6 [6.0,7.4] 3.3 [2.8,3.8] 10,535
Sierra Leone 2008 68.4 [65.2,71.4] 40.4 [37.9,42.9] 13.3 [11.5,15.5] 4326
Zimbabwe 2010-11 24.0 [20.3,28.1] 14.1 [11.1,17.8] 9.1 [6.8,12.3] 1001
Total* 17.2 [16.4,18.0] 8.9 [8.4,9.5] 4.2 [3.8,4.6] 35,758
Overall Total** 35.2 [34.5,36.0] 19.8 [19.2,20.4] 7.8 [7.5,8.2] 60,091
N= weighted sample size. * Total represents the multi-country, pooled, weighted estimates for each strata of IPTp coverage, separately. **Overall Total represents the multi-country, pooled, weighted estimates.