Embed Size (px)
Citation preview
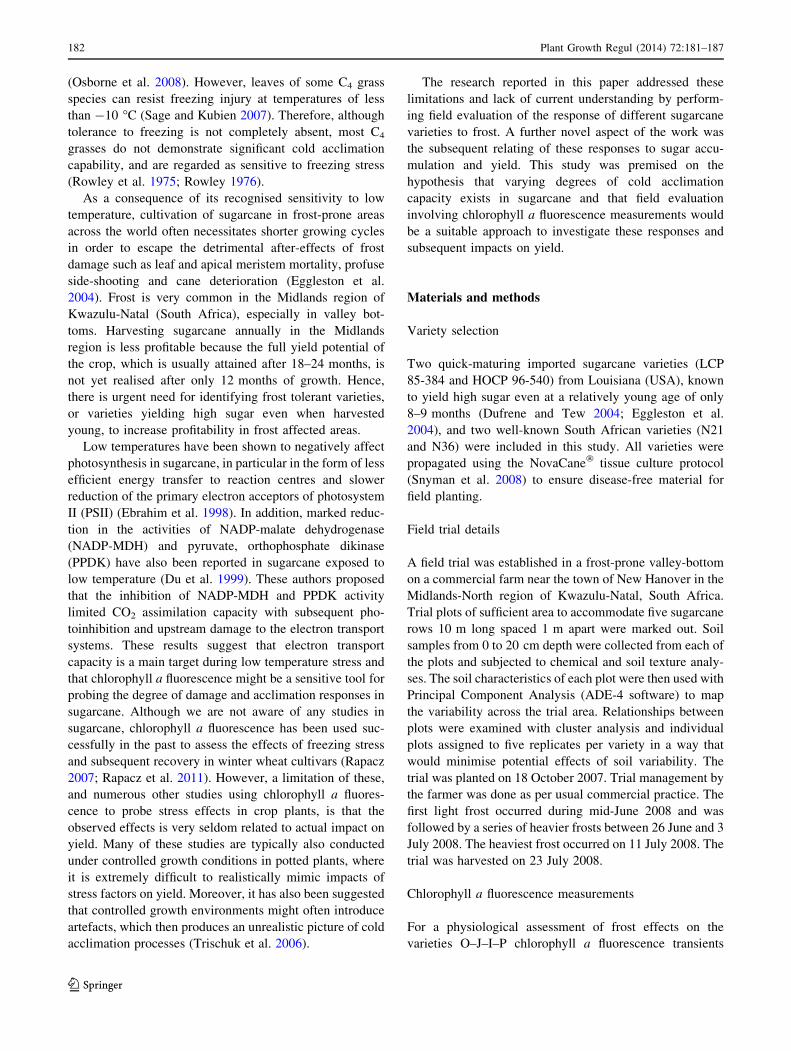
ORIGINAL PAPER
Differential acclimation capacity to frost in sugarcanevarieties grown under field conditions
Philippus D. R. van Heerden
Received: 11 June 2013 / Accepted: 24 September 2013 / Published online: 29 September 2013
� Springer Science+Business Media Dordrecht 2013
Abstract In certain sugarcane (Saccharum spp. hybrids)
production regions of the world, including South Africa,
frost frequently occurs. Great demand exists for frost tol-
erant sugarcane varieties as production in these areas could
become more profitable. Two Louisiana (USA) varieties,
known to yield high sugar even when immature (LCP
85-384 and HOCP 96-540), and two South African varie-
ties (N21 and N36) were evaluated in a field trial for frost
tolerance. O–J–I–P chlorophyll a fluorescence transients
were recorded in youngest fully-expanded leaves of these
varieties on several occasions before and following expo-
sure to frost. Analysis of these transients revealed that
varieties N36 and LCP 85-384 were capable of cold
acclimation following the first frost, while N21 and HOCP
96-540 lacked similar capability. Exposure to further frosts
altered the fluorescence transients in a variety-specific
fashion, with recovery in N36 and LCP 85-384 towards
baseline kinetics, but with further deterioration in N21 and
HOCP 96-540. Between the first frost and harvest, esti-
mated recoverable crystal (ERC) content values in cane
stalks of N36 and LCP 85-384 increased by 26 and 20 %
respectively, while in N21 and HOCP 96-540 ERC content
values only increased by 8 and 11 % respectively. Conse-
quently, N36 and LCP 85-384 ultimately achieved the
highest ERC yields (tons/hectare). The ability to maintain
high ERC accumulation capacity for longer following frost
could be an important factor determining sugarcane yield
performance in frost-prone areas. In addition, O–J–I–P
fluorescence rise kinetics show promise as a rapid screen-
ing tool for assessment of cold acclimation potential in
sugarcane.
Keywords Chlorophyll a fluorescence � Cold
acclimation � Frost tolerance � Sucrose accumulation �Sugarcane
Abbreviations
ERC Estimated recoverable crystal
NADP-MDH NADP-malate dehydrogenase
PIABS Performance index
Introduction
Due to their mostly tropical and sub-tropical distribution,
C4 plants generally are more cold-sensitive than C3 plants
(Berry and Bjorkman 1980). Cold tolerance also differs
between the three C4 subtypes, with those species
belonging to the NADP-malic enzyme (NADP-ME) sub-
type generally being the most cold-sensitive (Edwards et al.
1985). In a recent study the effects of low temperatures on
C4 and C3 sub-tropical grasses were compared in Alloter-
opsis semialata, a unique species with both C4 and C3
subspecies co-occurring in sub-tropical parts of South
Africa (Osborne et al. 2008). These authors found high
levels of freezing stress injury in leaves of both sub-species
in the unhardened state. However, a prolonged chilling
treatment introduced as a hardening treatment before the
freezing stress, reduced injury in the C3 subspecies by
50 %, but not in the C4 subspecies. It was concluded that
the C4 subtype lacked the ability for cold acclimation
P. D. R. van Heerden (&)
South African Sugarcane Research Institute,
Mount Edgecombe 4300, South Africa
e-mail: [email protected]
P. D. R. van Heerden
Department of Plant Production and Soil Science,
University of Pretoria, Pretoria 0028, South Africa
123
Plant Growth Regul (2014) 72:181–187
DOI 10.1007/s10725-013-9850-3
(Osborne et al. 2008). However, leaves of some C4 grass
species can resist freezing injury at temperatures of less
than -10 �C (Sage and Kubien 2007). Therefore, although
tolerance to freezing is not completely absent, most C4
grasses do not demonstrate significant cold acclimation
capability, and are regarded as sensitive to freezing stress
(Rowley et al. 1975; Rowley 1976).
As a consequence of its recognised sensitivity to low
temperature, cultivation of sugarcane in frost-prone areas
across the world often necessitates shorter growing cycles
in order to escape the detrimental after-effects of frost
damage such as leaf and apical meristem mortality, profuse
side-shooting and cane deterioration (Eggleston et al.
2004). Frost is very common in the Midlands region of
Kwazulu-Natal (South Africa), especially in valley bot-
toms. Harvesting sugarcane annually in the Midlands
region is less profitable because the full yield potential of
the crop, which is usually attained after 18–24 months, is
not yet realised after only 12 months of growth. Hence,
there is urgent need for identifying frost tolerant varieties,
or varieties yielding high sugar even when harvested
young, to increase profitability in frost affected areas.
Low temperatures have been shown to negatively affect
photosynthesis in sugarcane, in particular in the form of less
efficient energy transfer to reaction centres and slower
reduction of the primary electron acceptors of photosystem
II (PSII) (Ebrahim et al. 1998). In addition, marked reduc-
tion in the activities of NADP-malate dehydrogenase
(NADP-MDH) and pyruvate, orthophosphate dikinase
(PPDK) have also been reported in sugarcane exposed to
low temperature (Du et al. 1999). These authors proposed
that the inhibition of NADP-MDH and PPDK activity
limited CO2 assimilation capacity with subsequent pho-
toinhibition and upstream damage to the electron transport
systems. These results suggest that electron transport
capacity is a main target during low temperature stress and
that chlorophyll a fluorescence might be a sensitive tool for
probing the degree of damage and acclimation responses in
sugarcane. Although we are not aware of any studies in
sugarcane, chlorophyll a fluorescence has been used suc-
cessfully in the past to assess the effects of freezing stress
and subsequent recovery in winter wheat cultivars (Rapacz
2007; Rapacz et al. 2011). However, a limitation of these,
and numerous other studies using chlorophyll a fluores-
cence to probe stress effects in crop plants, is that the
observed effects is very seldom related to actual impact on
yield. Many of these studies are typically also conducted
under controlled growth conditions in potted plants, where
it is extremely difficult to realistically mimic impacts of
stress factors on yield. Moreover, it has also been suggested
that controlled growth environments might often introduce
artefacts, which then produces an unrealistic picture of cold
acclimation processes (Trischuk et al. 2006).
The research reported in this paper addressed these
limitations and lack of current understanding by perform-
ing field evaluation of the response of different sugarcane
varieties to frost. A further novel aspect of the work was
the subsequent relating of these responses to sugar accu-
mulation and yield. This study was premised on the
hypothesis that varying degrees of cold acclimation
capacity exists in sugarcane and that field evaluation
involving chlorophyll a fluorescence measurements would
be a suitable approach to investigate these responses and
subsequent impacts on yield.
Materials and methods
Variety selection
Two quick-maturing imported sugarcane varieties (LCP
85-384 and HOCP 96-540) from Louisiana (USA), known
to yield high sugar even at a relatively young age of only
8–9 months (Dufrene and Tew 2004; Eggleston et al.
2004), and two well-known South African varieties (N21
and N36) were included in this study. All varieties were
propagated using the NovaCane� tissue culture protocol
(Snyman et al. 2008) to ensure disease-free material for
field planting.
Field trial details
A field trial was established in a frost-prone valley-bottom
on a commercial farm near the town of New Hanover in the
Midlands-North region of Kwazulu-Natal, South Africa.
Trial plots of sufficient area to accommodate five sugarcane
rows 10 m long spaced 1 m apart were marked out. Soil
samples from 0 to 20 cm depth were collected from each of
the plots and subjected to chemical and soil texture analy-
ses. The soil characteristics of each plot were then used with
Principal Component Analysis (ADE-4 software) to map
the variability across the trial area. Relationships between
plots were examined with cluster analysis and individual
plots assigned to five replicates per variety in a way that
would minimise potential effects of soil variability. The
trial was planted on 18 October 2007. Trial management by
the farmer was done as per usual commercial practice. The
first light frost occurred during mid-June 2008 and was
followed by a series of heavier frosts between 26 June and 3
July 2008. The heaviest frost occurred on 11 July 2008. The
trial was harvested on 23 July 2008.
Chlorophyll a fluorescence measurements
For a physiological assessment of frost effects on the
varieties O–J–I–P chlorophyll a fluorescence transients
182 Plant Growth Regul (2014) 72:181–187
123
(Strasser and Govindjee 1992) were recorded in dark
adapted youngest fully-expanded leaves. These measure-
ments were started on 25 April 2008, approximately
6 weeks before the first frost and were continued until
shortly before harvest. Measurements were repeated
approximately every 2 weeks, which included a measure-
ment a few days before the first frost, a few days after the
first frost and also after several additional frosts. On each
occasion measurements were done on the broadest mid-
section of the youngest fully expanded leaves of four
randomly-selected plants per replicate plot. In total 20
plants per variety were measured on each occasion. Mea-
surements were conducted with a PEA fluorescence meter
(Hansatech Instruments Ltd., King’s Lynn, Norfolk, PE 30
4NE, UK). The transients were induced by a red light (peak
at 650 nm) of 3,200 lmol m-2 s-1 provided by the PEA
instrument through an array of six light-emitting diodes.
The JIP-test (Strasser and Strasser 1995) was subse-
quently employed to analyse each recorded transient. The
following data from the original measurements were used:
maximal fluorescence intensity (FM); fluorescence intensity
at 50 ls (considered as F0); fluorescence intensity at
300 ls (F300 ls) required for calculation of the initial slope
(M0) of the relative variable fluorescence (V) kinetics; the
fluorescence intensity at 2 ms (the J step) denoted as FJ. VJ
was calculated as (FJ - F0)/(FM - F0). The data was used
to calculate (Eq. 1) the Performance index (PIABS), which
is a sensitive indicator of electron transport efficiency
(Kruger et al. 1997; Strasser et al. 2000; Force et al. 2003;
Strauss et al. 2007).
PIABS ¼1� ðF0=FMÞ
M0=VJ
� FM � F0
F0
� 1� VJ
VJ
ð1Þ
Yield parameters
A 12-stalk sample was taken from each plot just prior to the
first frost to determine a range of milling quality charac-
teristics, including estimated recoverable crystal (ERC)
content, which is an estimate of the recoverable value of
sugarcane delivered to the sugar mill. The ERC content
(%) was calculated per stalk fresh weight (FW) as (Eq. 2):
ERC content %ð Þ ¼ aS� bN� cF ð2Þ
where S = sucrose content (%) per stalk FW; N = non-
sucrose content (%) per stalk FW; F = fibre content per
stalk FW and a, b, c are industry determined factors
representing the loss of each component (0.978, 0.535, and
0.018 respectively) during sucrose extraction at the mill. At
harvest, the three centre cane rows in each plot were cut
and bundled by hand and weighed using a hydraulic grab
apparatus equipped with a load cell to determine cane yield
(tons) per hectare (ha). Another 12-stalk sample was taken
from each plot for calculation of ERC content at harvest
(Eq. 2). The ERC yield (t/ha) per plot was subsequently
estimated as (Eq. 3):
ERC yield t=hað Þ ¼ ERC content� Cane yield ð3Þ
Statistical analysis
All the variables were analysed using one-way ANOVA.
Each variable was first tested for normality and homoge-
neity using the Shapiro–Wilk and Bartlett tests respectively
(Genstat v.14). The post hoc test used was the least sig-
nificant difference (LSD) (5 %) test.
Results
Effects of frost on the performance index (PIABS)
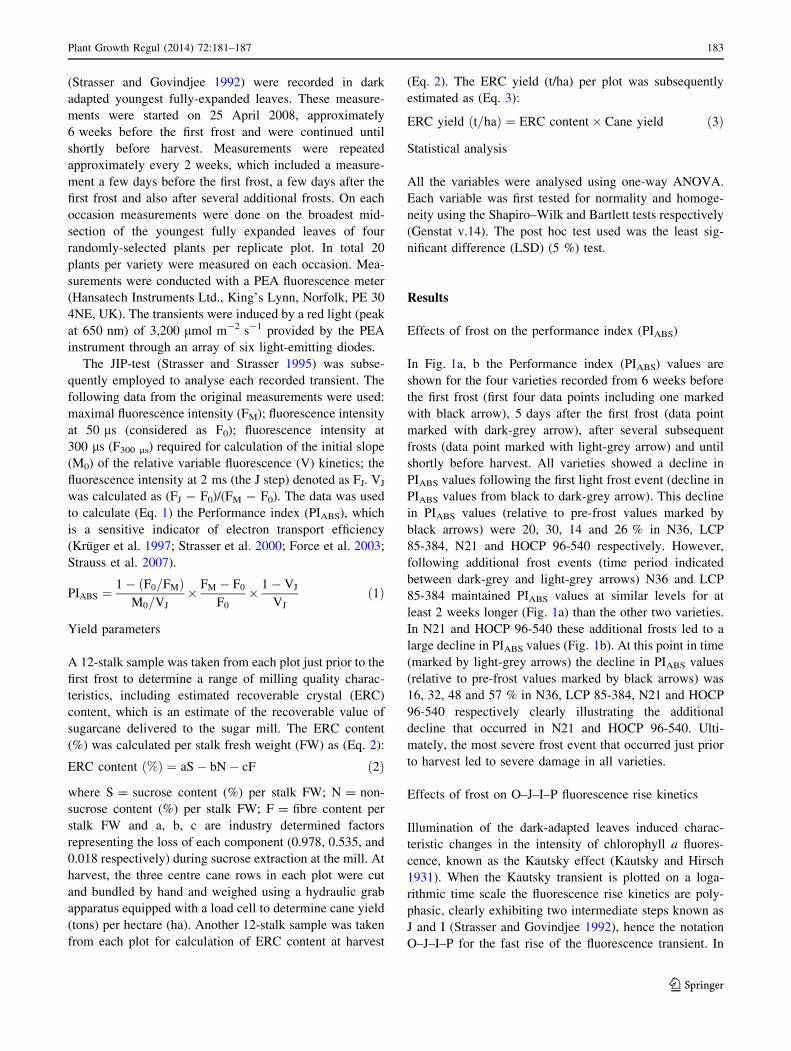
In Fig. 1a, b the Performance index (PIABS) values are
shown for the four varieties recorded from 6 weeks before
the first frost (first four data points including one marked
with black arrow), 5 days after the first frost (data point
marked with dark-grey arrow), after several subsequent
frosts (data point marked with light-grey arrow) and until
shortly before harvest. All varieties showed a decline in
PIABS values following the first light frost event (decline in
PIABS values from black to dark-grey arrow). This decline
in PIABS values (relative to pre-frost values marked by
black arrows) were 20, 30, 14 and 26 % in N36, LCP
85-384, N21 and HOCP 96-540 respectively. However,
following additional frost events (time period indicated
between dark-grey and light-grey arrows) N36 and LCP
85-384 maintained PIABS values at similar levels for at
least 2 weeks longer (Fig. 1a) than the other two varieties.
In N21 and HOCP 96-540 these additional frosts led to a
large decline in PIABS values (Fig. 1b). At this point in time
(marked by light-grey arrows) the decline in PIABS values
(relative to pre-frost values marked by black arrows) was
16, 32, 48 and 57 % in N36, LCP 85-384, N21 and HOCP
96-540 respectively clearly illustrating the additional
decline that occurred in N21 and HOCP 96-540. Ulti-
mately, the most severe frost event that occurred just prior
to harvest led to severe damage in all varieties.
Effects of frost on O–J–I–P fluorescence rise kinetics
Illumination of the dark-adapted leaves induced charac-
teristic changes in the intensity of chlorophyll a fluores-
cence, known as the Kautsky effect (Kautsky and Hirsch
1931). When the Kautsky transient is plotted on a loga-
rithmic time scale the fluorescence rise kinetics are poly-
phasic, clearly exhibiting two intermediate steps known as
J and I (Strasser and Govindjee 1992), hence the notation
O–J–I–P for the fast rise of the fluorescence transient. In
Plant Growth Regul (2014) 72:181–187 183
123
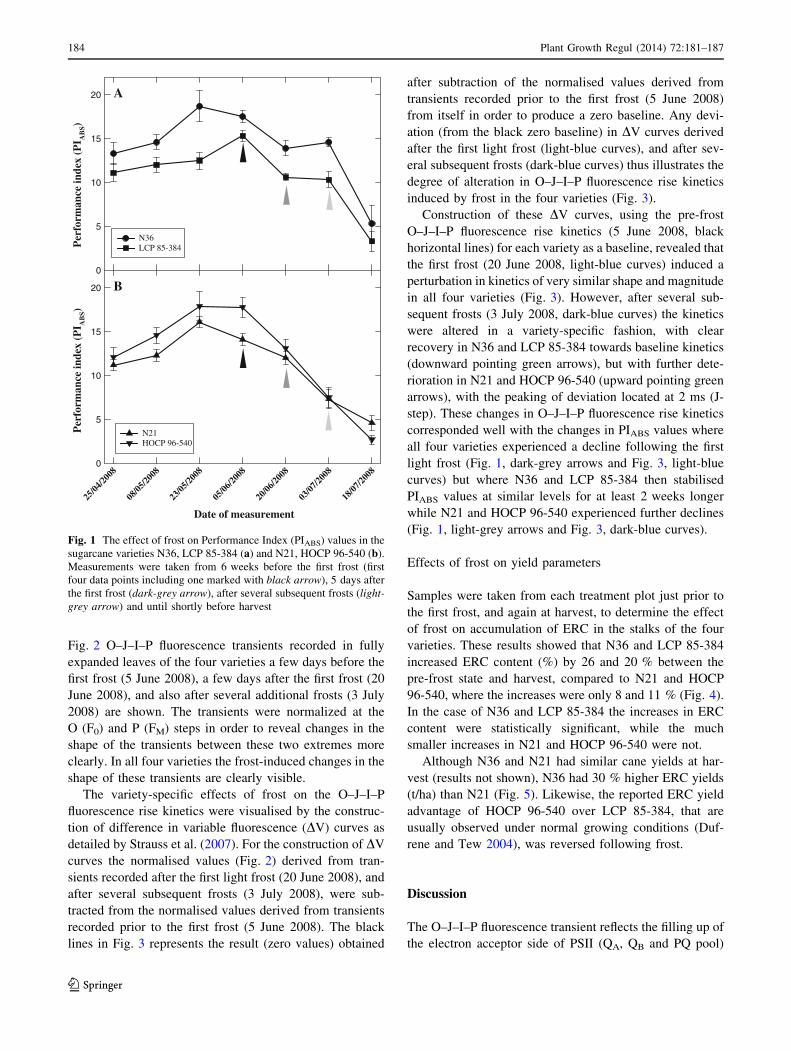
Fig. 2 O–J–I–P fluorescence transients recorded in fully
expanded leaves of the four varieties a few days before the
first frost (5 June 2008), a few days after the first frost (20
June 2008), and also after several additional frosts (3 July
2008) are shown. The transients were normalized at the
O (F0) and P (FM) steps in order to reveal changes in the
shape of the transients between these two extremes more
clearly. In all four varieties the frost-induced changes in the
shape of these transients are clearly visible.
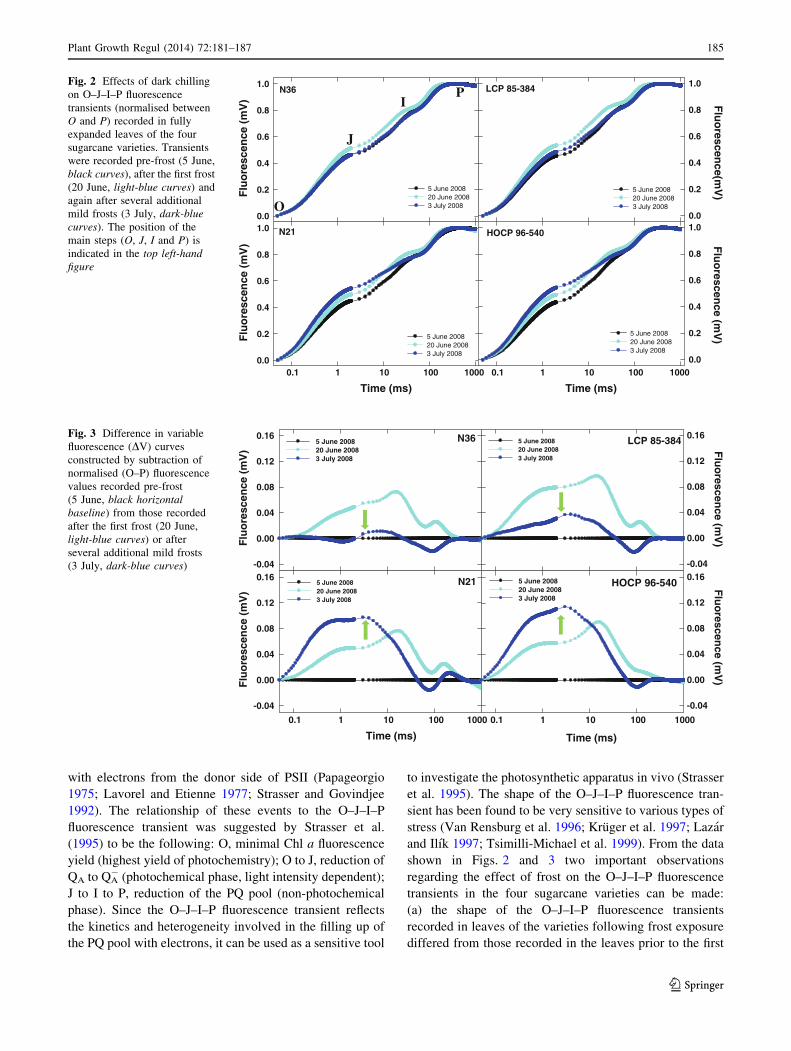
The variety-specific effects of frost on the O–J–I–P
fluorescence rise kinetics were visualised by the construc-
tion of difference in variable fluorescence (DV) curves as
detailed by Strauss et al. (2007). For the construction of DV
curves the normalised values (Fig. 2) derived from tran-
sients recorded after the first light frost (20 June 2008), and
after several subsequent frosts (3 July 2008), were sub-
tracted from the normalised values derived from transients
recorded prior to the first frost (5 June 2008). The black
lines in Fig. 3 represents the result (zero values) obtained
after subtraction of the normalised values derived from
transients recorded prior to the first frost (5 June 2008)
from itself in order to produce a zero baseline. Any devi-
ation (from the black zero baseline) in DV curves derived
after the first light frost (light-blue curves), and after sev-
eral subsequent frosts (dark-blue curves) thus illustrates the
degree of alteration in O–J–I–P fluorescence rise kinetics
induced by frost in the four varieties (Fig. 3).
Construction of these DV curves, using the pre-frost
O–J–I–P fluorescence rise kinetics (5 June 2008, black
horizontal lines) for each variety as a baseline, revealed that
the first frost (20 June 2008, light-blue curves) induced a
perturbation in kinetics of very similar shape and magnitude
in all four varieties (Fig. 3). However, after several sub-
sequent frosts (3 July 2008, dark-blue curves) the kinetics
were altered in a variety-specific fashion, with clear
recovery in N36 and LCP 85-384 towards baseline kinetics
(downward pointing green arrows), but with further dete-
rioration in N21 and HOCP 96-540 (upward pointing green
arrows), with the peaking of deviation located at 2 ms (J-
step). These changes in O–J–I–P fluorescence rise kinetics
corresponded well with the changes in PIABS values where
all four varieties experienced a decline following the first
light frost (Fig. 1, dark-grey arrows and Fig. 3, light-blue
curves) but where N36 and LCP 85-384 then stabilised
PIABS values at similar levels for at least 2 weeks longer
while N21 and HOCP 96-540 experienced further declines
(Fig. 1, light-grey arrows and Fig. 3, dark-blue curves).
Effects of frost on yield parameters
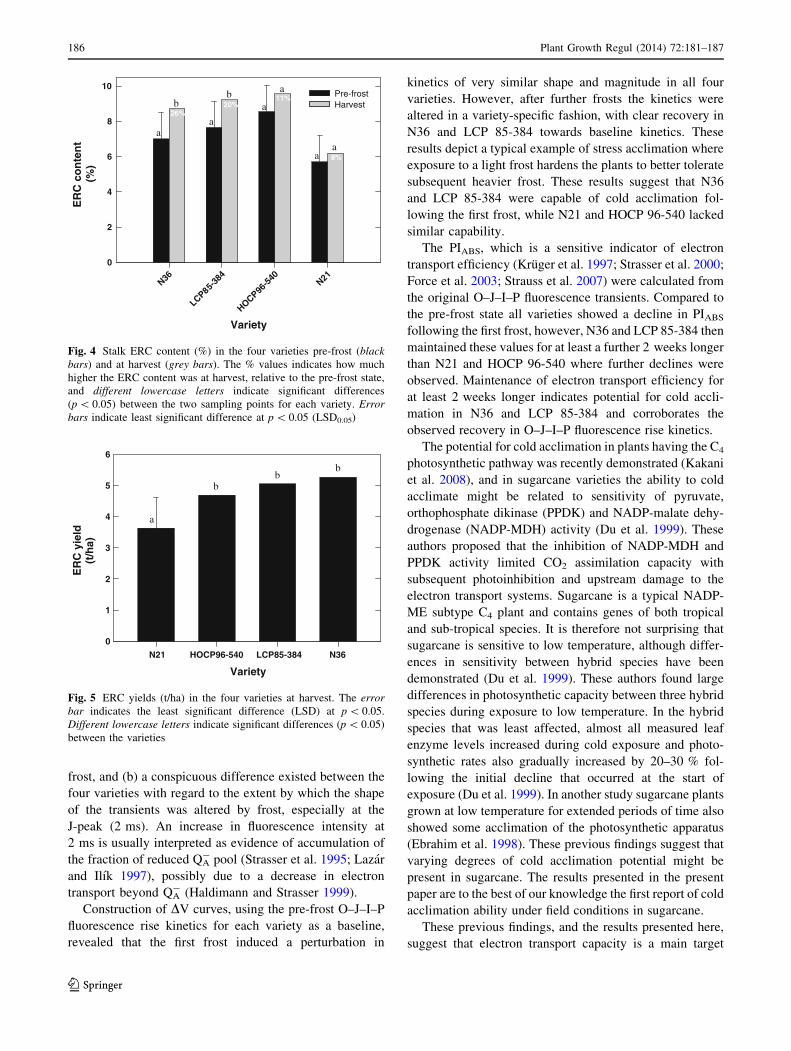
Samples were taken from each treatment plot just prior to
the first frost, and again at harvest, to determine the effect
of frost on accumulation of ERC in the stalks of the four
varieties. These results showed that N36 and LCP 85-384
increased ERC content (%) by 26 and 20 % between the
pre-frost state and harvest, compared to N21 and HOCP
96-540, where the increases were only 8 and 11 % (Fig. 4).
In the case of N36 and LCP 85-384 the increases in ERC
content were statistically significant, while the much
smaller increases in N21 and HOCP 96-540 were not.
Although N36 and N21 had similar cane yields at har-
vest (results not shown), N36 had 30 % higher ERC yields
(t/ha) than N21 (Fig. 5). Likewise, the reported ERC yield
advantage of HOCP 96-540 over LCP 85-384, that are
usually observed under normal growing conditions (Duf-
rene and Tew 2004), was reversed following frost.
Discussion
The O–J–I–P fluorescence transient reflects the filling up of
the electron acceptor side of PSII (QA, QB and PQ pool)
Per
form
ance
inde
x (P
I AB
S)
0
5
10
15
20
N36 LCP 85-384
Date of measurement
25/04
/2008
08/05
/2008
23/05
/2008
05/06
/2008
20/06
/2008
03/07
/2008
18/07
/2008
Per
form
ance
inde
x (P
I AB
S)
0
5
10
15
20
N21 HOCP 96-540
A
B
Fig. 1 The effect of frost on Performance Index (PIABS) values in the
sugarcane varieties N36, LCP 85-384 (a) and N21, HOCP 96-540 (b).
Measurements were taken from 6 weeks before the first frost (first
four data points including one marked with black arrow), 5 days after
the first frost (dark-grey arrow), after several subsequent frosts (light-
grey arrow) and until shortly before harvest
184 Plant Growth Regul (2014) 72:181–187
123
with electrons from the donor side of PSII (Papageorgio
1975; Lavorel and Etienne 1977; Strasser and Govindjee
1992). The relationship of these events to the O–J–I–P
fluorescence transient was suggested by Strasser et al.
(1995) to be the following: O, minimal Chl a fluorescence
yield (highest yield of photochemistry); O to J, reduction of
QA to QA- (photochemical phase, light intensity dependent);
J to I to P, reduction of the PQ pool (non-photochemical
phase). Since the O–J–I–P fluorescence transient reflects
the kinetics and heterogeneity involved in the filling up of
the PQ pool with electrons, it can be used as a sensitive tool
to investigate the photosynthetic apparatus in vivo (Strasser
et al. 1995). The shape of the O–J–I–P fluorescence tran-
sient has been found to be very sensitive to various types of
stress (Van Rensburg et al. 1996; Kruger et al. 1997; Lazar
and Ilık 1997; Tsimilli-Michael et al. 1999). From the data
shown in Figs. 2 and 3 two important observations
regarding the effect of frost on the O–J–I–P fluorescence
transients in the four sugarcane varieties can be made:
(a) the shape of the O–J–I–P fluorescence transients
recorded in leaves of the varieties following frost exposure
differed from those recorded in the leaves prior to the first
N36
Flu
ore
scen
ce (
mV
)
0.0
0.2
0.4
0.6
0.8
1.0
5 June 2008 20 June 2008 3 July 2008
LCP 85-384
Flu
orescen
ce(mV
)
0.0
0.2
0.4
0.6
0.8
1.0
5 June 2008 20 June 2008 3 July 2008
N21
Time (ms)
0.1 1 10
Flu
ore
scen
ce (
mV
)
0.0
0.2
0.4
0.6
0.8
1.0
5 June 2008 20 June 2008 3 July 2008
HOCP 96-540
Time (ms)
0.1 1 10100 1000 100 1000
Flu
orescen
ce (mV
)
0.0
0.2
0.4
0.6
0.8
1.0
5 June 2008 20 June 2008 3 July 2008
O
J
IP
Fig. 2 Effects of dark chilling
on O–J–I–P fluorescence
transients (normalised between
O and P) recorded in fully
expanded leaves of the four
sugarcane varieties. Transients
were recorded pre-frost (5 June,
black curves), after the first frost
(20 June, light-blue curves) and
again after several additional
mild frosts (3 July, dark-blue
curves). The position of the
main steps (O, J, I and P) is
indicated in the top left-hand
figure
N36
Flu
ore
scen
ce (
mV
)
-0.04
0.00
0.04
0.08
0.12
0.165 June 200820 June 20083 July 2008
LCP 85-384
Flu
orescen
ce (mV
)
-0.04
0.00
0.04
0.08
0.12
0.165 June 200820 June 20083 July 2008
N21
Time (ms)
0.1 1 10 100 1000
Flu
ore
scen
ce (
mV
)
-0.04
0.00
0.04
0.08
0.12
0.165 June 200820 June 20083 July 2008
HOCP 96-540
Time (ms)
0.1 1 10 100 1000
Flu
orescen
ce (mV
)
-0.04
0.00
0.04
0.08
0.12
0.165 June 200820 June 20083 July 2008
Fig. 3 Difference in variable
fluorescence (DV) curves
constructed by subtraction of
normalised (O–P) fluorescence
values recorded pre-frost
(5 June, black horizontal
baseline) from those recorded
after the first frost (20 June,
light-blue curves) or after
several additional mild frosts
(3 July, dark-blue curves)
Plant Growth Regul (2014) 72:181–187 185
123
frost, and (b) a conspicuous difference existed between the
four varieties with regard to the extent by which the shape
of the transients was altered by frost, especially at the
J-peak (2 ms). An increase in fluorescence intensity at
2 ms is usually interpreted as evidence of accumulation of
the fraction of reduced QA- pool (Strasser et al. 1995; Lazar
and Ilık 1997), possibly due to a decrease in electron
transport beyond QA- (Haldimann and Strasser 1999).
Construction of DV curves, using the pre-frost O–J–I–P
fluorescence rise kinetics for each variety as a baseline,
revealed that the first frost induced a perturbation in
kinetics of very similar shape and magnitude in all four
varieties. However, after further frosts the kinetics were
altered in a variety-specific fashion, with clear recovery in
N36 and LCP 85-384 towards baseline kinetics. These
results depict a typical example of stress acclimation where
exposure to a light frost hardens the plants to better tolerate
subsequent heavier frost. These results suggest that N36
and LCP 85-384 were capable of cold acclimation fol-
lowing the first frost, while N21 and HOCP 96-540 lacked
similar capability.
The PIABS, which is a sensitive indicator of electron
transport efficiency (Kruger et al. 1997; Strasser et al. 2000;
Force et al. 2003; Strauss et al. 2007) were calculated from
the original O–J–I–P fluorescence transients. Compared to
the pre-frost state all varieties showed a decline in PIABS
following the first frost, however, N36 and LCP 85-384 then
maintained these values for at least a further 2 weeks longer
than N21 and HOCP 96-540 where further declines were
observed. Maintenance of electron transport efficiency for
at least 2 weeks longer indicates potential for cold accli-
mation in N36 and LCP 85-384 and corroborates the
observed recovery in O–J–I–P fluorescence rise kinetics.
The potential for cold acclimation in plants having the C4
photosynthetic pathway was recently demonstrated (Kakani
et al. 2008), and in sugarcane varieties the ability to cold
acclimate might be related to sensitivity of pyruvate,
orthophosphate dikinase (PPDK) and NADP-malate dehy-
drogenase (NADP-MDH) activity (Du et al. 1999). These
authors proposed that the inhibition of NADP-MDH and
PPDK activity limited CO2 assimilation capacity with
subsequent photoinhibition and upstream damage to the
electron transport systems. Sugarcane is a typical NADP-
ME subtype C4 plant and contains genes of both tropical
and sub-tropical species. It is therefore not surprising that
sugarcane is sensitive to low temperature, although differ-
ences in sensitivity between hybrid species have been
demonstrated (Du et al. 1999). These authors found large
differences in photosynthetic capacity between three hybrid
species during exposure to low temperature. In the hybrid
species that was least affected, almost all measured leaf
enzyme levels increased during cold exposure and photo-
synthetic rates also gradually increased by 20–30 % fol-
lowing the initial decline that occurred at the start of
exposure (Du et al. 1999). In another study sugarcane plants
grown at low temperature for extended periods of time also
showed some acclimation of the photosynthetic apparatus
(Ebrahim et al. 1998). These previous findings suggest that
varying degrees of cold acclimation potential might be
present in sugarcane. The results presented in the present
paper are to the best of our knowledge the first report of cold
acclimation ability under field conditions in sugarcane.
These previous findings, and the results presented here,
suggest that electron transport capacity is a main target
Variety
N36
LCP85-38
4
HOCP96-5
40 N21
ER
C c
on
ten
t(%
)
0
2
4
6
8
10Pre-frostHarvest
26% 20%
11%
8%
a
b
a
b
a
a
a a
Fig. 4 Stalk ERC content (%) in the four varieties pre-frost (black
bars) and at harvest (grey bars). The % values indicates how much
higher the ERC content was at harvest, relative to the pre-frost state,
and different lowercase letters indicate significant differences
(p \ 0.05) between the two sampling points for each variety. Error
bars indicate least significant difference at p \ 0.05 (LSD0.05)
Variety
N21 HOCP96-540 LCP85-384 N36
ER
C y
ield
(t/h
a)
0
1
2
3
4
5
6
a
bb
b
Fig. 5 ERC yields (t/ha) in the four varieties at harvest. The error
bar indicates the least significant difference (LSD) at p \ 0.05.
Different lowercase letters indicate significant differences (p \ 0.05)
between the varieties
186 Plant Growth Regul (2014) 72:181–187
123
during low temperature stress in sugarcane and that chlo-
rophyll a fluorescence is a sensitive tool for probing the
degree of damage and acclimation responses in sugarcane.
The observed cold acclimation in N36 and LCP 85-384
would have enabled maintenance of higher photosynthetic
efficiency (as indicated by the PIABS values), and thus also
ERC accumulation in the stalks for longer following the
first frost event. The results that showed that N36 and LCP
85-384 increased ERC content (%) by 26 and 20 %
between the pre-frost state and harvest, compared to N21
and HOCP 96-540 where the increase were only 8 and
11 %, supports this suggestion. This would have contrib-
uted towards N36 having a 30 % higher ERC yield (t/ha)
than N21 as well as the known yield advantage of HOCP
96-540 over LCP 85-384 (Dufrene and Tew 2004) being
reversed following frost.
In conclusion, the ability to maintain high ERC accu-
mulation capacity for longer following frost due to cold
acclimation could be an important factor determining
sugarcane yield performance in frost-prone areas. In
addition, O–J–I–P fluorescence rise kinetics show promise
as a rapid screening tool for assessment of cold acclimation
potential and frost tolerance in sugarcane.
Acknowledgments The author acknowledges Mr. Rudolph Koch
for provision of land and managing of the field trial on his farm Green
Hill (Kwazulu-Natal, South Africa).
References
Berry J, Bjorkman O (1980) Photosynthetic response and adaptation to
temperature in higher plants. Ann Rev Plant Physiol 31:491–543
Du YC, Nose A, Wasano K (1999) Effects of chilling temperature on
photosynthetic rates, photosynthetic enzyme activities and
metabolite levels in leaves of three sugarcane species. Plant,
Cell Environ 22:317–324
Dufrene EO, Tew TL (2004) HOCP 96-540, a chip off the old block?
Am Soc Sugar Cane Technol 24:82
Ebrahim MKH, Vogg G, Osman MNEH, Komor E (1998) Photo-
synthetic performance and adaptation of sugarcane at suboptimal
temperatures. J Plant Physiol 153:587–592
Edwards GE, Nakamoto H, Burnell JN, Hatch MD (1985) Pyruvate,
Pi dikinase and NADP-malate dehydrogenase in C4 photosyn-
thesis: properties and mechanism of light/dark regulation. Ann
Rev Plant Physiol 36:255–286
Eggleston G, Legendre B, Tew T (2004) Indicators of freeze-damaged
sugarcane varieties which can predict processing problems. Food
Chem 87:119–133
Force L, Critchley C, Van Rensen JJS (2003) New fluorescence parameters
for monitoring photosynthesis in plants. Photosynth Res 78:17–33
Haldimann P, Strasser RJ (1999) Effects of anaerobiosis as probed by
the polyphasic chlorophyll a fluorescence rise kinetic in pea
(Pisum sativum L.). Photosynth Res 62:67–83
Kakani VG, Boote KJ, Reddy KR, Lang DJ (2008) Response of
bahiagrass carbon assimilation and photosystem activity to
below optimum temperatures. Funct Plant Biol 35:1243–1254
Kautsky H, Hirsch A (1931) Neue versuche zur kohlensaure
assimilation. Naturwissenschaften 19:964
Kruger GHJ, Tsimilli-Michael M, Strasser RJ (1997) Light stress
provokes plastic and elastic modifications in structure and
function of photosystem II in camellia leaves. Physiol Plant
101:265–277
Lavorel J, Etienne AL (1977) In vivo chlorophyll fluorescence. Top
Photosynth 2:203–268
Lazar D, Ilık P (1997) High-temperature induced chlorophyll
fluorescence changes in barley leaves: comparison of the critical
temperatures determined from fluorescence induction and from
fluorescence temperature curve. Plant Sci 124:159–164
Osborne CP, Wythe EJ, Ibrahim DG, Gilbert ME, Ripley BS (2008)
Low temperature effects on leaf physiology and survivorship in
the C3 and C4 subspecies of Alloteropsis semialata. J Exp Bot
59:1743–1754
Papageorgio J (1975) Chlorophyll fluorescence: an intrinsic probe of
photosynthesis. In: Govindjee (ed) Bioenergetics of photosyn-
thesis. Academic Press, New York, pp 319–371
Rapacz M (2007) Chlorophyll a fluorescence transient during freezing
and recovery in winter wheat. Photosynthetica 45:409–418
Rapacz M, Sasal M, Gut M (2011) Chlorophyll fluorescence-based
studies of frost damage and the tolerance for cold-induced
photoinhibition in freezing tolerance analysis of Triticale
(9 Triticosecale Wittmack). J Agron Crop Sci 197:378–389
Rowley JA (1976) Development of freezing tolerance in leaves of C4
grasses. Aust J Plant Physiol 3:597–603
Rowley JA, Tunnicliffe CG, Taylor AO (1975) Freezing sensitivity of
leaf tissue of C4 grasses. Aust J Plant Physiol 2:447–451
Sage RF, Kubien DS (2007) The temperature response of C3 and C4
photosynthesis. Plant, Cell Environ 30:1086–1106
Snyman SJ, Meyer GM, Banasiak M, Nicholson TL, van Antwerpen
T, Naidoo P, Erasmus JD (2008) Micropropagation of sugarcane
via NovaCane�: preliminary steps in commercial application.
Proc S Afr Sugar Technol Assoc 81:513–516
Strasser RJ, Govindjee (1992) The F0 and the O–J–I–P fluorescence
rise in higher plants and algae. In: Argyroudi-Akoyunoglou JH
(ed) Regulation of chloroplast biogenesis. Plenum Press,
New York, USA, pp 423–426
Strasser BJ, Strasser RJ (1995) Measuring fast fluorescence transients
to address environmental questions: the JIP-test. In: Mathis P
(ed) Photosynthesis: from light to biosphere, vol V. Kluwer
Academic Publishers, The Netherlands, pp 977–980
Strasser RJ, Srivastava A, Govindjee (1995) Polyphasic chlorophyll
a fluorescence transient in plants and cyanobacteria. Photochem
Photobiol 61:32–42
Strasser RJ, Srivastava A, Tsimilli-Michael M (2000) The fluorescent
transient as a tool to characterise and screen photosynthesic
samples. In: Yunus M, Pathre U, Mohanty P (eds) Probing
photosynthesis: mechanisms, regulation and adaptation. Taylor
and Francis, London, pp 445–483
Strauss AJ, Kruger GHJ, Strasser RJ, Van Heerden PDR (2007) The
role of low soil temperature in the inhibition of growth and PSII
function during dark chilling in soybean genotypes of contrasting
tolerance. Physiol Plant 131:89–105
Trischuk RG, Schilling BS, Wisniewski M, Gusta LV (2006) Freezing
stress: systems biology to study cold tolerance. In: Madhava Rao
KV, Raghavendra AS, Janardhan Reddy K (eds) Physiology and
molecular biology of stress tolerance in plants. Springer,
Dordrecht, pp 131–155
Tsimilli-Michael M, Pecheux M, Strasser RJ (1999) Light and heat
stress adaptation of the symbionts of coral reef and temperate
foraminifers probed in hospite by the chlorophyll a fluorescence
kinetics O–J–I–P. Naturforsch 54C:671–680
Van Rensburg L, Kruger GHJ, Eggenberg P, Strasser RJ (1996) Can
screening criteria for drought resistance in Nicotiana tabacum L.
be derived from the polyphasic rise of the chlorophyll a fluores-
cence transient (OJIP)? S Afr J Bot 62:337–341
Plant Growth Regul (2014) 72:181–187 187
123