Embed Size (px)
Citation preview

�������� ����� ��
Differentiating Alzheimer Disease-Associated Aggregates with Small Mole-cules
Nicolette S. Honson, Ronald L. Johnson, Wenwei Huang, James In-glese, Christopher P. Austin, Jeff Kuret
PII: S0969-9961(07)00164-7DOI: doi: 10.1016/j.nbd.2007.07.018Reference: YNBDI 1532
To appear in: Neurobiology of Disease
Received date: 2 July 2007Accepted date: 11 July 2007
Please cite this article as: Honson, Nicolette S., Johnson, Ronald L., Huang, Wen-wei, Inglese, James, Austin, Christopher P., Kuret, Jeff, Differentiating AlzheimerDisease-Associated Aggregates with Small Molecules, Neurobiology of Disease (2007), doi:10.1016/j.nbd.2007.07.018
This is a PDF file of an unedited manuscript that has been accepted for publication.As a service to our customers we are providing this early version of the manuscript.The manuscript will undergo copyediting, typesetting, and review of the resulting proofbefore it is published in its final form. Please note that during the production processerrors may be discovered which could affect the content, and all legal disclaimers thatapply to the journal pertain.

ACC
EPTE
D M
ANU
SCR
IPT
ACCEPTED MANUSCRIPT
1
Differentiating Alzheimer Disease-Associated Aggregateswith Small Molecules
Nicolette S. Honsona, Ronald L. Johnsonb, Wenwei Huangb, James Ingleseb,Christopher P. Austinb, and Jeff Kureta,*
aCenter for Molecular Neurobiology, The Ohio State University, Columbus, OH 43210bNIH Chemical Genomics Center, Rockville, MD 20850
*Corresponding Author:
Jeff Kuret, Ph.D.Center for Molecular Neurobiology1060 Carmack Rd.Columbus, OH [email protected]: (614) 688-5899Fax: (614) 292-5379
Article type: Regular article

ACC
EPTE
D M
ANU
SCR
IPT
ACCEPTED MANUSCRIPT
2
ABSTRACT
Alzheimer disease is diagnosed postmortem by the density and spatial distribution of β-amyloid
plaques and tau-bearing neurofibrillary tangles. The major protein component of each lesion
adopts cross-β-sheet conformation capable of binding small molecules with submicromolar
affinity. In many cases, however, Alzheimer pathology overlaps with Lewy body disease,
characterized by the accumulation of a third cross-β-sheet forming protein, α-synuclein. To
determine the feasibility of distinguishing tau aggregates from β-amyloid and α-synuclein
aggregates with small molecule probes, a library containing 71,975 small molecules was
screened for antagonists of tau-aggregate mediated changes in Thioflavin S fluorescence,
followed by secondary screens to distinguish the relative affinity for each substrate protein.
Results showed that >10-fold binding selectivity among substrates could be achieved, with
molecules selective for tau aggregates containing at least three aromatic or rigid moieties
connected by two rotatable bonds.
Key words: Alzheimer disease, tau, neurofibrillary tangle, contrast agents, diagnosis

ACC
EPTE
D M
ANU
SCR
IPT
ACCEPTED MANUSCRIPT
3
INTRODUCTION
Alzheimer disease (AD) is the most common cause of dementia in the elderly population
(Hebert et al., 2003). It is defined and definitively diagnosed by the appearance of extracellular
β-amyloid (Aβ) plaques and intracellular neurofibrillary lesions in the brain (Hyman, 1997).
Because AD progresses hierarchically, the density and spatial distribution of lesions also yield
information on disease stage. However, all lesions are not equivalent in this regard, as total
plaque density correlates poorly with cognitive decline and neurodegeneration (Braak and Braak,
1991; Terry et al., 1991). For example, substantial numbers of diffuse plaques have been found
in cognitively normal elderly individuals (Hashimoto and Masliah, 1999). In contrast,
neurofibrillary lesion formation correlates more closely with disease progression (Braak and
Braak, 1991). These lesions consist of neurofibrillary tangles in neuronal cell bodies, neuropil
threads within neuronal processes, and dystrophic neurites associated with neuritic plaques, each
of which contains filamentous aggregates composed of the microtubule-associated protein tau
(Buee et al., 2000). Longitudinal studies have shown that tau lesions develop according to a
common spatiotemporal pattern reflecting the sequence, type and severity of cognitive decline
and neuronal loss (Ghoshal et al., 2002; Royall et al., 2002). Most importantly, tau pathology
appears in certain areas (such as deep temporal lobe) decades before neocortical Aβ deposition
and signs of dementia can be detected (Duyckaerts and Hauw, 1997; Morsch et al., 1999), and so
can serve a prognostic function. Together these data suggest that the spatial distribution and
density of neuritic lesions alone can contribute to the differential diagnosis and staging of AD.
Both tau and Aβ filaments consist of parallel, in register β-sheets aligned perpendicular to the
fibril axis, resulting in a cross-β-sheet structure (Petkova et al., 2006). The parallel orientation of
β-sheets generates channels extending along the length of the filament (Krebs et al., 2005) to
ACC
EPTE
D M
ANU
SCR
IPT
ACCEPTED MANUSCRIPT
4
which aromatic molecules can bind via π−π interactions (Gazit, 2002). Small molecules with
these binding properties, including the benzothiazole aniline Pittsburgh Compound B (Klunk et
al., 2004; Klunk et al., 2005), bis-styryl benzene derivatives (Kung et al., 2003), and substituted
naphthalenes (Agdeppa et al., 2003), have been developed as contrast agents for use in various
modalities of whole brain imaging to capture the spatial distribution of amyloid lesions in situ
(Klunk et al., 2004). Most of these ligands bind cross-β-sheet structure common to both tau and
β-amyloid bearing lesions (Berriman et al., 2003; Petkova et al., 2006), suggesting that the
staging information associated with neuritic lesions will be confounded by crossreactivity with
amyloid plaques. Thus, while a promising approach for following total amyloid burden, it is
suboptimal as an AD diagnostic. Moreover, because α-synuclein adopts a cross-β-sheet
conformation in Parkinson’s disease and Lewy body disease, both of which overlap with AD in
many cases (Jellinger, 2004; Kotzbauer et al., 2001), nonselective contrast agents may also
detect lesions unrelated to neurofibrillary and amyloid pathology. It is likely, therefore, that
contrast agents with selectivity for neurofibrillary lesions relative to Lewy bodies and Aβ
plaques will have the greatest utility for staging AD and distinguishing it from other
neurodegenerative diseases.
Ideally, tau-selective binding agents should interact with aggregates composed of full-length
tau protein, which appear early in lesion formation and precede the formation of insoluble
proteolytic products (Guillozet-Bongaarts et al., 2005). Although monomeric full-length tau
proteins normally behave as random coils with limited tertiary structure (Schweers et al., 1994),
they do not aggregate over experimentally tractable time periods when incubated in vitro under
near physiological conditions of temperature, pH, ionic strength, and reducing environment
(Necula and Kuret, 2004). The barrier to aggregation can be overcome by the addition of anionic

ACC
EPTE
D M
ANU
SCR
IPT
ACCEPTED MANUSCRIPT
5
inducers such as alkyl sulfate detergents and fatty acids (Chirita et al., 2003; Wilson and Binder,
1997). Full-length tau proteins incubated in the presence of anionic surfactant inducers yield
products that react with commonly used fluorescent probes for cross-β-sheet conformation such
as Thioflavin S (ThS) and T (ThT) (Chirita et al., 2005). The reaction supports aggregation at
low micromolar bulk tau concentrations, which facilitates screening for high affinity ligands.
Although both Aβ and α-synuclein aggregate spontaneously without exogenous agents, the
presence of anionic surfactant speeds aggregation rate and lowers bulk protein levels required for
fibrillization (Necula et al., 2003; Wilson and Binder, 1997). As a result, it is possible to
compare ligand binding to all three major AD/Lewy body disease associated protein targets
under identical conditions.
To identify tau-binding agents, a ~72,000-member library of small molecules was screened
using a concentration-response method termed quantitative high throughput screening (qHTS)
(Inglese et al., 2006). Chosen actives were then tested in parallel assays to find selective
compounds for tau, α-synuclein, and Aβ1-42 filaments. The results show the feasibility of
identifying ligands with at least an order of magnitude binding selectivity for tau relative to Aβ1-
42 and α-synuclein.

ACC
EPTE
D M
ANU
SCR
IPT
ACCEPTED MANUSCRIPT
6
MATERIALS AND METHODS
Reagents. ThS, Type II-A mixed histones, dithiothreitol, 3,3′-Diethyl-9-methylthiacarbocyanine
iodide, and arachidonic acid were purchased from Sigma-Aldrich (St Louis, MO). Octadecyl
sodium sulfate (ODS) was acquired from Research Plus (Manasquan, NJ), DMSO (certified
A.C.S. grade) from Fisher Scientific (Pittsburgh, PA), Thiazine red R (1a; Chemical Abstract
Service registry number 2150-33-6) from ICN Biomedicals Inc. (Irvine, CA), 1d from
Chembridge (San Diego, CA), and HEPES from Mediatech (Herndon, VA).
Stock solutions of ODS and arachidonic acid were prepared just prior to use in 1:1
isopropanol/ddH2O or ethanol, respectively, whereas the fluorescence reporter ThS was prepared
in ddH2O. All library compounds were prepared as 10 mM stock solutions in DMSO and stored
frozen at -20ºC until used.
Recombinant His6-htau40 and His6-α-synuclein were prepared and stored as described
previously (Carmel et al., 1996; Necula et al., 2003). Solutions of human Aβ1-42 (American
Peptide Co., Sunnyvale, CA) were prepared by established methods (Stine et al., 2003). Briefly,
the peptide was resuspended in hexafluoroisopropanol (by vortexing in a glass vial) to a final
concentration of 1 mM. The solvent was then completely evaporated under a slow stream of
argon. The remaining residue was dissolved in DMSO to a final concentration of 2.5 mM, then
sonicated for 10 min using setting 3 (model 100, Fisher Scientific).
Compound library. The 71,975 member library was collected from several sources: 1280
compounds from Sigma-Aldrich (LOPAC1280), 1120 compounds from Prestwick Chemical Inc.
(Washington, DC), 280 purified natural products from TimTec (Newark, DE), three 1000-
member combinatorial libraries from Pharmacopeia (Cranbury, NJ), 1106 compounds from
Tocris (Ellisville, MO), 59,688 compounds from the NIH Molecular Libraries Small Molecule

ACC
EPTE
D M
ANU
SCR
IPT
ACCEPTED MANUSCRIPT
7
Repository (San Francisco, CA), 1980 compounds from the National Cancer Institute (Bethesda,
MD), and 1121 compounds from Boston University Center for Chemical Methodology and
Library Development. Libraries were prepared as described (Inglese et al., 2006).
Fluorescence assays. ThS is a fluorescent probe which undergoes excitation and emission
Stokes shifts upon binding neurofibrillary lesions in thin sections and tau aggregates in vitro
(Friedhoff et al., 1998; King et al., 1999). Tau-dependent ThS fluorescence was measured as
described previously (Chirita et al., 2005; King et al., 1999) with the following modifications.
For qHTS, His6-htau40 (1 μM final concentration) or mixed histones (50 nM final concentration)
in reagent buffer (10 mM HEPES, pH 7.4, 100 mM NaCl, 5 mM dithiothreitol, 10 μM ThS) was
dispensed (2 μL/well) into Grenier solid black 1536-well plates using a solenoid-based
dispenser. Compounds (23 nL) were then transferred to the assay plate by a pin tool containing
10 nL slotted pins. Following transfer, ODS (30 μM final concentration) in reagent buffer was
dispensed (2 μL/well) for a final assay volume of 4 μL /well. Following incubation (15 h at
37ºC), fluorescence (λex = 450/8 nm; λem = 510/23 nm) was detected by an EnVision Multilabel
Plate Reader (Perkin Elmer, Wellesley, MA). The screen was performed using a fully integrated
Kalypsys robotic system containing one RX-130 and two RX-90 Staübli anthropomorphic
robotic arms.
For determination of ThS binding affinity and secondary assays conducted in 96-well format
(round bottom opaque plates, VWR, West Chester, PA), His6-htau40, His6-α-synuclein, or Aβ1-42
was diluted to 5 μM in assembly buffer (10 mM HEPES, pH 7.4, 100 mM NaCl, 5 mM
dithiothreitol) containing 50 μM arachidonic acid inducer. ThS probe was then added to a final
concentration of 0-30 μM for ThS binding affinity determinations. Secondary assays held ThS
concentrations constant at 10 μM, with library compounds selected on the basis of the qHTS
ACC
EPTE
D M
ANU
SCR
IPT
ACCEPTED MANUSCRIPT
8
present at final concentrations of 1.52 nM to 10 μM. Each compound was tested at least twice in
separate assays. Controls without protein or without compound were included on each plate.
After shaking 2 min to promote mixing, plates were covered with self-adhesive aluminum foil
and incubated overnight at 37ºC. Fluorescence (λex = 440 nm; λem = 485 nm) was measured
after brief shaking (10 s) in a FlexStation plate reader (Molecular Devices, Sunnyvale, CA)
operated at sensitivity 10, automatic PMT.
Data analysis. qHTS data were corrected and normalized using Assay Analyzer (GeneData) as
described (Inglese et al., 2006). Percent activity was calculated by normalization to the median
values of the histone negative control and tau positive control present on each plate (Chirita and
Kuret, 2004). For each library compound, a titration response series was generated, curve-fit,
and classified as described (Inglese et al., 2006). SAR analysis was performed as described
(Inglese et al., 2006).
For determination of ThS binding affinity to each substrate protein, net fluorescence was
calculated by subtracting the fluorescence of the wells without protein from the fluorescence of
wells containing protein. Dissociation constants (KD) were then determined after fitting data to a
rectangular hyperbola:
xKxF
F+
=D
max (eq 1)
where F represents the net ThS fluorescence at x concentration of ThS, and Fmax is the net
fluorescence at infinite ThS concentration. For secondary screens in 96-well format, net
fluorescence was calculated by subtracting the fluorescence of the wells without protein from the
fluorescence of wells containing both protein and compound. Percent activity was calculated by
dividing net fluorescence values of treated wells with control wells containing protein but no test
compound. Data were then fit to the sigmoidal function:

ACC
EPTE
D M
ANU
SCR
IPT
ACCEPTED MANUSCRIPT
9
nxAC
FFFF )(log
minmaxmin 50101 −+
−+= (eq 2)
where F and Fmax are blank-adjusted ThS fluorescence in the presence and absence of inhibitor
(at concentration x), respectively, Fmin represents fluorescence at infinite ligand concentration,
logAC50 is the log of the compound concentration producing 50% inhibition of the ThS
fluorescence, and n is the Hill coefficient. Resultant AC50 values were converted to apparent Ki
values by the Cheng-Prusoff equation (Cheng and Prusoff, 1973):
D
50i /1 Kx
ACK
+= (eq 3)
All parameters estimated by nonlinear regression are reported ± standard error of the estimate.
Fibrillization assay. Aggregation of His6-htau40 (5 μM final concentration) in assembly buffer
was induced with arachidonic acid (50 μM final concentration) in the presence or absence of
selected library compounds. After incubation (18 h at 37°C) reactions were diluted 5-fold in
ddH20, and assayed by transmission electron microscopy as described previously (Necula and
Kuret, 2004).

ACC
EPTE
D M
ANU
SCR
IPT
ACCEPTED MANUSCRIPT
10
RESULTS
Initial qHTS. Thioflavin S (ThS) fluorescence was used to monitor tau conformation. ThS-
reactive tau was prepared with octadecyl sulfate (ODS), an alkyl sulfate inducer of tau
conformational change and aggregation (Chirita et al., 2003). Full-length tau was used as
substrate because it aggregates in early stage AD and precedes the formation of aggregated
truncation products (Guillozet-Bongaarts et al., 2005). Full-length tau aggregates therefore
represent an early marker for AD progression. ODS was used as inducer because it efficiently
drives conformational changes at low concentrations of full-length tau (low micromolar) over
short time periods (≤24 h) under reducing conditions (Chirita et al., 2003). Low substrate
concentrations maximize the likelihood of detecting high affinity ligands (Copeland, 2005).
Mixed histones replaced tau protein in some assays to control for nonspecific alkyl-sulfate
mediated effects on ThS (Chirita et al., 2005; Friedhoff et al., 1998). Histones drive
micellization of anionic surfactants much like tau protein, but do not form filaments or other
ThS-reactive species (Chirita and Kuret, 2004). Therefore, the final assay quantified net tau-
dependent changes in ThS fluorescence.
To identify ligands capable of interfering with this signal, a 71,795-member library was
screened at seven or more concentrations. The 448 plate run resulted in a mean signal to
background ratio of 3.0 ± 0.2 and a mean Z’ value of 0.68 ± 0.12. The concentration-response
data for each compound were processed as described in Experimental Procedures, then grouped
according to curve-fit and efficacy criteria (Inglese et al., 2006). Compounds with inhibitory
curves having either both upper and lower asymptotes with ≥30% efficacy, or only an upper
asymptote with ≥80% efficacy, were studied for structure-activity relationships. From this initial
characterization, 45 compounds representing 35 active and 10 structurally-related inactive

ACC
EPTE
D M
ANU
SCR
IPT
ACCEPTED MANUSCRIPT
11
analogs were chosen for follow-up study.
Secondary screen. To exclude nonspecific alkyl-sulfate mediated effects on ThS fluorescence,
the inducer arachidonic acid replaced ODS (which was used in the initial qHTS) in a secondary
screen. In addition, tau concentration was raised to 5 μM to facilitate subsequent comparison
with substrates α-synuclein and Aβ1-42. Of the 35 actives identified in the qHTS, all but eight
showed similar dose-response curves and half-maximal activity concentration (AC50) values in
the presence of arachidonic acid (data shown below). These eight inactive compounds were
eliminated from further testing, whereas compounds 1a and 1d were added to the library because
of their established binding affinity for protein aggregates. Compound 1a (Thiazine red R)
selectively binds neurofibrillary lesions in AD tissue (Mena et al., 1995), whereas 1d binds Aβ
aggregates in vitro (Caprathe et al., 1999). The final test set contained 39 compounds, of which
29 showed AC50 < 10 μM (including nine with submicromolar AC50) and 10 were inactive
analogs (AC50 >> 10 μM).
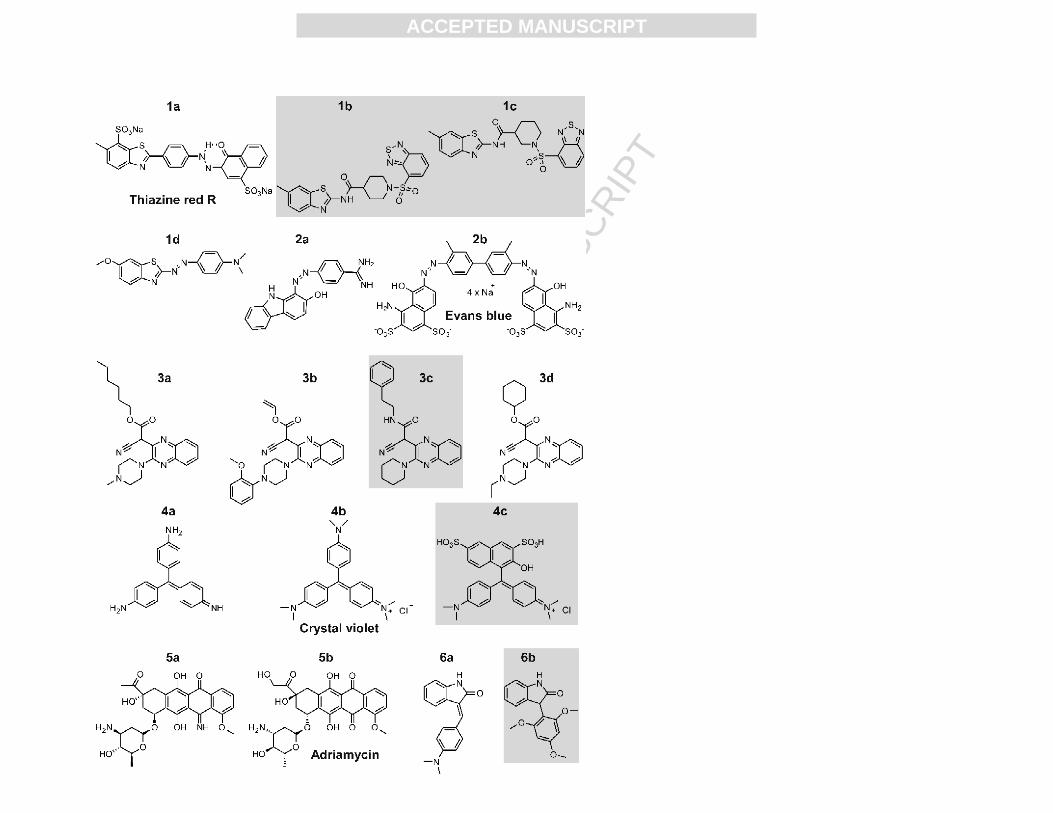
Structures of compounds identified from the screens and characterized below, including
structurally-related inactive analogs, are shown in Fig. 1. These were loosely grouped into six
scaffold classes: benzothiazoles (1a, 1b, 1c, 1d), phenylazenes (2a, 2b), quinoxaline nitriles (3a,
3b, 3c, 3d), anilines (4a, 4b, 4c), anthraquinones (5a, 5b), and indolinones (6a, 6b).
Concentration-effect curves for selective compounds identified from the secondary screen are
shown in Fig. 2, with resultant AC50 values summarized in Table 1.
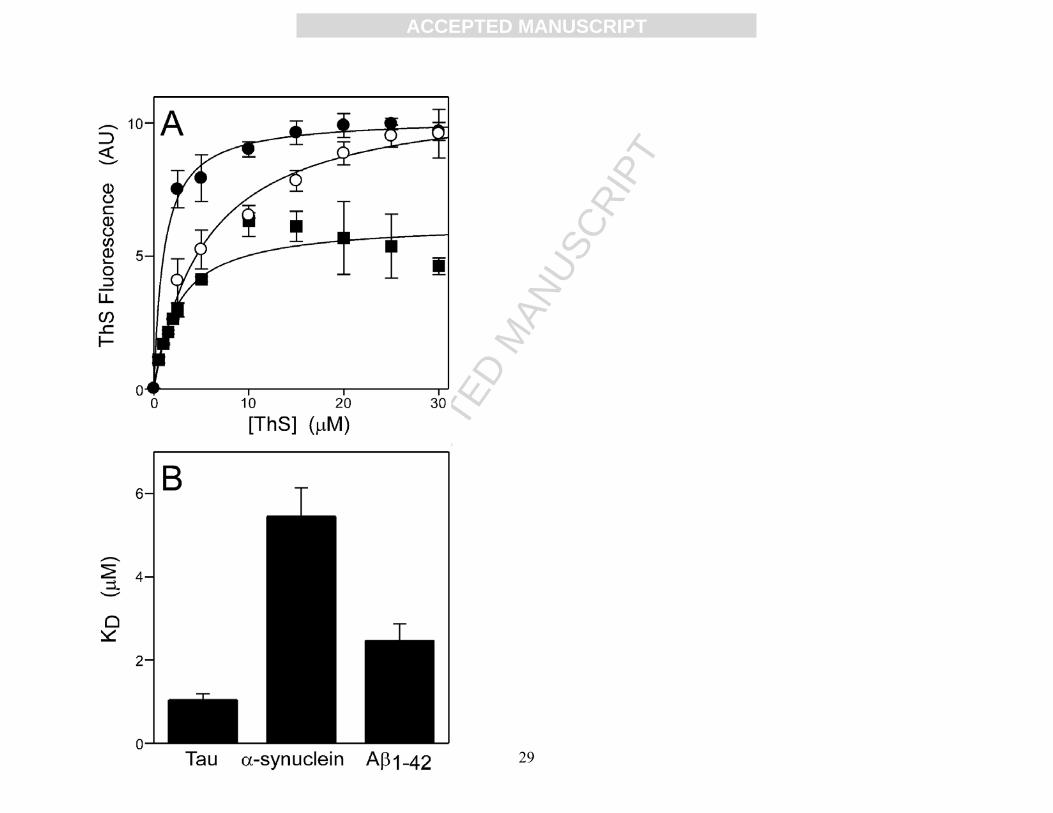
Identification of compounds with binding selectivity. After the primary and secondary screens
identified compounds with binding affinity for tau, a selectivity screen was employed to assess
their relative affinity for tau, α-synuclein, and Aβ1-42. First, the affinity of ThS probe for each
substrate was estimated from the ThS concentration dependence of fluorescent signal at constant
ACC
EPTE
D M
ANU
SCR
IPT
ACCEPTED MANUSCRIPT
12
bulk protein concentration (5 μM). The resultant concentration effect curves were fit to
retangular hyperbolas yielding apparent KD estimates of 1.0 ± 0.1, 5.5 ± 0.7, 2.5 ± 0.4 μM for
tau, α-synuclein, and Aβ1-42, respectively (Fig. 3). Second, the selectivity of the test set for tau
protein was determined by identical ThS-based fluorescence assays conducted in parallel with
fibrillar α-synuclein and Aβ1-42 as substrate. AC50 values were then converted to apparent Ki
values via the Cheng-Prusoff equation for competitive inhibition (eq 3) using KD values for ThS
binding determined above. Differences in potency were quantified as “fold selectivity”, defined
as the ratio of Ki values for a given compound obtained for the lower potency substrate target
divided by that of the higher potency substrate target. Thus, larger “fold selectivity” values
reflected greater discrimination among the substrate proteins. Attention was focused on
compounds with fold selectivities that were either statistically significant at p < 0.05 (for data
derived from complete concentration response curves) or that were ≥10-fold in magnitude (for
data derived from incomplete concentration response curves). Calculated Ki values and fold
selectivities are summarized in Table 1. Relative selectivity is depicted graphically in Fig. 4.
Several compounds displayed statistically significant (p < 0.05) fold selectivity for tau
relative to at least one other substrate. Evans blue (2b), and the aniline Crystal violet (4b) were
exclusively selective for tau against both α-synuclein and Aβ1-42 (Table 1, Fig. 4). A third
compound, Thiazine red R (1a), was the most selective ligand in the test set, with >17-fold
selectivity for tau relative to α-synuclein and was >10-fold selective against Aβ1-42 (Table 1,
Fig. 4). Estimates for this ligand were only approximate because concentration effect curves
against non-selective substrates α-synuclein and Aβ1-42 did not reach AC50 at the highest
concentration tested (10 μM). Although Evans blue (2b) was less selective for tau than Thiazine
red R (1a), it was ~10-fold more potent in all assays. Crystal violet (4b) showed only subtle

ACC
EPTE
D M
ANU
SCR
IPT
ACCEPTED MANUSCRIPT
13
selectivity, but was among the most potent compounds tested, regardless of substrate.
In contrast to these ligands, the benzothiazole 1d, the aniline 4a, the anthraquinone 5a, and
the indolinone 6a were all selective for both tau and Aβ1-42 relative to α-synuclein (Table 1, Fig.
4). Benzothiazole 1d was highly potent (low nanomolar Ki), and the only compound to show
partial ThS-binding antagonist activity. No compounds in the test set were exclusively selective
for either α-synuclein or Aβ1-42.
Identification of high affinity ligands. Molecules which bound at least one substrate protein
with submicromolar AC50 were identified from the test set (Fig. 2, Table 1). These included the
benzothiazole 1d, phenylazenes 2a and 2b, quinoxaline nitriles 3a and 3b, anilines 4a and 4b,
the anthraquinone 5a, and the indolinone 6a. Thiazine red R (1a) and Adriamycin (5b) exhibited
substoichiometric binding only for tau and Aβ1-42, respectively, while the quinoxaline nitrile 3d
showed substoichiometric binding to all three substrate proteins (Table 1). Five structurally
related analogs of active scaffolds did not antagonize ThS fluorescence of any substrate protein
at concentrations up to 10 μM (Table 1). These data revealed quinoxaline nitriles to be a novel
class of protein aggregate binders.
Antagonists act primarily through probe displacement. Ligand-induced decreases in ThS
fluorescence could result from displacement or ThS binding or through reduction in the
concentration of binding target owing to antagonism of fibrillization. To discriminate between
these possibilities, tau aggregation was induced with arachidonic acid in the presence of selective
compounds and analyzed by transmission electron microscopy. Typically, ~50% of tau protomer
is incorporated into filaments under these conditions (Chirita et al., 2003). Seven test set
compounds were assayed including three tau selective compounds (1a, 2b, and 4b) as well as the
four tau and Aβ1-42 selective compounds (1d, 4a, 5a, and 6a). In the presence of DMSO vehicle
ACC
EPTE
D M
ANU
SCR
IPT
ACCEPTED MANUSCRIPT
14
alone, tau aggregated to form large numbers of filaments (images not shown). However, the
presence of the anilines 4a and 4b, as well as the indolinone 6a, produced concentration
dependant decreases in filament lengths. Fibrillization antagonist potencies were ~4-fold weaker
than AC50 values determined by the fluorescence assay (Fig. 5). In contrast, levels of
aggregation in the presence of the tau selective compound Thiazine red R 1a were not
statistically different from the control reaction at p < 0.05 (Fig. 5). These data confirmed that
only a subset of compounds were inhibitors of tau aggregation, and suggest that the majority act
as ThS displacement agents in the low concentration regime.

ACC
EPTE
D M
ANU
SCR
IPT
ACCEPTED MANUSCRIPT
15
DISCUSSIONAs expected from their shared structural organization, aggregates composed of tau, α-
synuclein, and Aβ1-42 display an overlapping continuum of small-molecule binding affinities.
The general binding trends of the six scaffold classes identified in this study (Fig. 4) showed tau
aggregates to be the most discriminating substrate tested with the strongest binding affinities,
whereas α-synuclein fibrils were the least discriminating and exhibited weaker overall affinity
for the compounds tested. Ligand selectivity and binding affinity for Aβ1-42 aggregates were
intermediate between those of tau and α-synuclein. This spectrum of behavior can be leveraged
to identify selective binding ligands. We found that the benzothiazole 1a and the phenylazene
2b were exclusively selective for tau. A structural feature shared between 1a and 2b is the
presence of at least three aromatic or rigid moieties connected by two rotatable bonds. This
organization separates the rings at defined distances while allowing certain geometries that may
be important for selectivity. For efficient tau binding, this geometry has been proposed to be
completely planar (Wischik et al., 2004). Another commonality is the presence of a hydroxyl
group ortho to an azo linker, which has been postulated to favor the hydrazone over the azo
tautomer (Antonov et al., 1998). The hydrazone tautomer can form a six-membered ring via
hydrogen bonding (the distal azene nitrogen being the hydrogen bond acceptor; Fig. 1). The
resultant rigidity introduced by this third ring may be important for selective interaction with tau
filaments. Benzothiazoles that could not form this ring or that did not have at least three rigid
moieties, such as 1d, did not bind tau filaments selectively. Similarly, compounds predicted to
favor the hydrazone tautomer but that possess only two of the three aromatic or rigid units, such
as 2a, did not discriminate between tau and Aβ1-42 filament. Perhaps the morphology of tau
filaments allows for accommodation of this third ring, while its presence is less tolerated for Aβ1-
ACC
EPTE
D M
ANU
SCR
IPT
ACCEPTED MANUSCRIPT
16
42 and α-synuclein fibrils. Benzothiazoles with a different arrangement of aromatic and rigid
moieties, such as 1b and 1c, were incapable of binding any of the three substrates tested.
Recently, 2,3-di(furan-2yl)-quinoxalines were identified as tau fibrillization inhbitors via a
sedimentation assay and subsequent EM analysis (Crowe et al., 2007). We found the
quinoxaline containing nitrile derivatives 3a, 3b, and 3d to represent a novel class of filament
binding molecules, which bind all three protein substrates substoichiometrically with respect to
bulk protein concentration. The quinoxaline nitrile analog 3c was inactive possibly due to a
stereo-electronic effect. Here, an amide replaced the ester seen in 3a, 3b, and 3d. The nitrogen
from this amide allows for better electron back donation due to increased orbital overlap with the
amide carbonyl. This results in reduced flexibility and a possible increased steric effect due to
the presence of the bulky phenyl, which subsequently may prevent 3c from accessing fibril
channels. A similar steric effect was observed with anilines 4a, 4b, and 4c, although
interpretation of this series may be complicated by the tau aggregation antagonist activities of 4a
and 4b. Crystal violet (4b) interacted with high affinity regardless of substrate whereas analog
4c was inactive, again perhaps owing to steric effects. Differences in symmetry could also
contribute to differences in potency. For example both 4a and 4b possess pseudo C3 symmetry
(assuming 4a is capable of tautomerization under assay conditions), and so their effective
concentrations could be significantly higher than that of 4c if binding were mediated
predominantly by only a portion of each molecule. Crystal violet (4b) was also found to be
subtly selective for tau filaments, suggesting the bulky dimethylamino groups may be less
tolerated by α-synuclein and Aβ1-42 aggregates.
Comparison with previous studies. Three candidate compounds, including one benzimidazole
derivative (BF-126) and two quinoline derivatives (BF-158 and BF-170), are selective for tau
ACC
EPTE
D M
ANU
SCR
IPT
ACCEPTED MANUSCRIPT
17
over Aβ1-42 aggregates in vitro (Okamura et al., 2005). Although only 2-3-fold selectivity was
demonstrated, tissue staining patterns strongly favored neurofibrillary lesions over Aβ plaques in
AD hippocampal brain sections (Okamura et al., 2005). These data suggest that compounds
exhibiting even subtle selectivity may have utility for contrast agent development. The
observations may stem from the higher bulk tau levels (~150-300 pmol/mg wet tissue; (Khatoon
et al., 1992)) relative to Aβ peptide concentrations (~9 pmol/mg wet tissue; (Jellinger, 2004;
Wang et al., 1999)) in late stage AD frontal and temporal cortices. Alternatively, selective
staining could arise from differences in binding stoichiometry. In the case of Aβ filaments,
multiple partially overlapping binding sites with differing binding affinities have been
demonstrated along the length of the fibril (Lockhart et al., 2005). These differ in density from
1:300 to 1:4 ligand:Aβ molar stoichiometry (Lockhart et al., 2005). The demonstration of partial
antagonism of ThS-tau interaction by high affinity ligand 1d suggests that tau aggregates may
also contain multiple binding sites, with 1d binding to only a subset of those labeled by ThS
(Fig. 2B). Nonetheless, it is also possible that the selective lesion staining observed in tissue
resulted from binding kinetics, since ligands were presented to both neurofibrillary and Aβ
lesions at saturating concentrations for a time (10 min) which may be inadequate for reaching
equilibrium.
Anthraquinones including Daunorubicin (a structural analog of 5a) and Adriamycin
(presented in this study as 5b) have previously been explored as inhibitors of tau fibrillization
under non-reducing conditions (Pickhardt et al., 2005). While both compounds were active in
the tau ThS displacement assay, no antagonistic effects were observed under the fibrillization
conditions used here for the tau and Aβ1-42 selective compound 5a. Tau concentration, redox
conditions, and incubation times may be the major variables contributing to this discrepancy.

ACC
EPTE
D M
ANU
SCR
IPT
ACCEPTED MANUSCRIPT
18
Finally, the indolinone 6a was an effective binder of all filamentous substrates tested and
antagonized tau fibrillization while 6b, which contains a bulky 1, 3, 5-methoxy tri-substituted
aromatic ring situated closer to the indolinone ring system, did not bind any aggregates tested.
Structurally related hydroxyindoles have previously been identified as Aβ1-40 and Aβ1-42
fibrillization inhibitors (Cohen et al., 2006).
Future challenges. The search for selective binding agents is further complicated by two
factors. First, different filament morphologies in disease may reflect polymorphisms at the
protofilament level (Petkova et al., 2005). For example, the degree of stagger (defined as the
displacement of β-sheets along the long fibril axis (Petkova et al., 2006)) may result in changes
in channel dimension. This may restrict ligand access to certain morphologies. Second, the
existence of multiple tau isoforms may complicate detection of mixed tau aggregates. For
example, high affinity binding sites on human Aβ1-42 filaments are disrupted in filaments made
from mouse/human Aβ1-42 mixtures (Klunk et al., 2005; Ye et al., 2006). Similar
microheterogeneity may affect high-affinity ligand binding to tau filaments composed of isoform
mixtures.
In summary, parallel screening of the three major protein aggregates found in AD and Lewy
body disease brain revealed the feasibility of selectively binding tau aggregates relative to
aggregates composed of α-synuclein or Aβ1-42. Structural analysis of the screened compounds
suggested that a specific arrangement of aromatic or rigid moieties may impart tau aggregate
binding selectivity. Selective compounds may serve as starting points for the synthesis of
chemical analogs that, when appropriately labeled, could serve as premortem contrast agents
capable of distinguishing the early stages of neurodegenerative diseases through whole brain
imaging methods.

ACC
EPTE
D M
ANU
SCR
IPT
ACCEPTED MANUSCRIPT
19
ACKNOWLEDGMENTS
We thank L. Crissman for assisting in the production of tau and α-synuclein, R. Batra for
help with the transmission electron microscopy, S. Michael and C. Klumpp for assistance with
automated screening, and A. Jadhav for the informatics analysis. This research was supported by
grants from the National Institutes of Health (AG14452 and MH077621) and the Alzheimer
Association (to J.K.), the Molecular Libraries Initiative of the NIH Roadmap for Medical
Research, and the Intramural Research Program of the National Human Genome Research
Institute. Data for the qHTS were deposited in Pubchem (ID 596).

ACC
EPTE
D M
ANU
SCR
IPT
ACCEPTED MANUSCRIPT
20
REFERENCES
Agdeppa, E. D., et al., 2003. 2-Dialkylamino-6-acylmalononitrile substituted naphthalenes(DDNP analogs): novel diagnostic and therapeutic tools in Alzheimer's disease. Mol.Imaging Biol. 5, 404-417.
Antonov, L., et al., 1998. Theoretical investigations on the tautomerism of 1-phenylazo-4-naphthol and its isomers. Dyes Pigment. 38, 157-164.
Berriman, J., et al., 2003. Tau filaments from human brain and from in vitro assembly ofrecombinant protein show cross-beta structure. Proc. Natl. Acad. Sci. U.S.A. 100, 9034-9038.
Braak, H., Braak, E., 1991. Neuropathological stageing of Alzheimer-related changes. ActaNeuropathol. (Berl.). 82, 239-259.
Buee, L., et al., 2000. Tau protein isoforms, phosphorylation and role in neurodegenerativedisorders. Brain Res. Brain Res. Rev. 33, 95-130.
Caprathe, B. W., et al., 1999. Method of imaging amyloid deposits. U.S. Patent 6,001,331.Carmel, G., et al., 1996. The structural basis of monoclonal antibody Alz50's selectivity for
Alzheimer's disease pathology. J. Biol. Chem. 271, 32789-32795.Cheng, Y., Prusoff, W. H., 1973. Relationship between the inhibition constant (KI) and the
concentration of inhibitor which causes 50 per cent inhibition (I50) of an enzymatic reaction.Biochem. Pharmacol. 22, 3099-3108.
Chirita, C. N., et al., 2005. Triggers of full-length tau aggregation: a role for partially foldedintermediates. Biochemistry. 44, 5862-5872.
Chirita, C. N., Kuret, J., 2004. Evidence for an intermediate in tau filament formation.Biochemistry. 43, 1704-1714.
Chirita, C. N., et al., 2003. Anionic micelles and vesicles induce tau fibrillization in vitro. J. Biol.Chem. 278, 25644-25650.
Cohen, T., et al., 2006. Inhibition of amyloid fibril formation and cytotoxicity by hydroxyindolederivatives. Biochemistry. 45, 4727-35.
Conway, K. A., et al., 2001. Kinetic stabilization of the alpha-synuclein protofibril by adopamine-alpha-synuclein adduct. Science. 294, 1346-9.
Copeland, R. A., 2005. Evaluation of enzyme inhibitors in drug discovery : a guide for medicinalchemists and pharmacologists. Wiley, Hoboken, N.J.
Crowe, A., et al., 2007. High throughput screening for small molecule inhibitors of heparin-induced tau fibril formation. Biochem. Biophys. Res. Comm. 358, 1-6.
Duyckaerts, C., Hauw, J. J., 1997. Prevalence, incidence and duration of Braak's stages in thegeneral population: can we know? Neurobiol. Aging. 18, 362-369.
Friedhoff, P., et al., 1998. Rapid assembly of Alzheimer-like paired helical filaments frommicrotubule-associated protein tau monitored by fluorescence in solution. Biochemistry. 37,10223-10230.
Gazit, E., 2002. A possible role for pi-stacking in the self-assembly of amyloid fibrils. FASEB J.16, 77-83.
Ghoshal, N., et al., 2002. Tau conformational changes correspond to impairments of episodicmemory in mild cognitive impairment and Alzheimer's disease. Exp. Neurol. 177, 475-493.
Guillozet-Bongaarts, A. L., et al., 2005. Tau truncation during neurofibrillary tangle evolution inAlzheimer's disease. Neurobiol. Aging. 26, 1015-1022.
ACC
EPTE
D M
ANU
SCR
IPT
ACCEPTED MANUSCRIPT
21
Hashimoto, M., Masliah, E., 1999. Alpha-synuclein in Lewy body disease and Alzheimer'sdisease. Brain Pathol. 9, 707-720.
Hebert, L. E., et al., 2003. Alzheimer disease in the US population: prevalence estimates usingthe 2000 census. Arch. Neurol. 60, 1119-1122.
Hyman, B. T., 1997. The neuropathological diagnosis of Alzheimer's disease: clinical-pathological studies. Neurobiol. Aging. 18, S27-32.
Inglese, J., et al., 2006. Quantitative high-throughput screening: a titration-based approach thatefficiently identifies biological activities in large chemical libraries. Proc. Natl. Acad. Sci.U.S.A. 103, 11473-11478.
Jellinger, K. A., 2004. Lewy body-related alpha-synucleinopathy in the aged human brain. J.Neural. Transm. 111, 1219-1235.
Khatoon, S., et al., 1992. Brain levels of microtubule-associated protein tau are elevated inAlzheimer's disease: a radioimmuno-slot-blot assay for nanograms of the protein. J.Neurochem. 59, 750-753.
King, M. E., et al., 1999. Ligand-dependent tau filament formation: implications for Alzheimer'sdisease progression. Biochemistry. 38, 14851-14859.
Klunk, W. E., et al., 2004. Imaging brain amyloid in Alzheimer's disease with PittsburghCompound-B. Ann. Neurol. 55, 306-319.
Klunk, W. E., et al., 2005. Binding of the positron emission tomography tracer Pittsburghcompound-B reflects the amount of amyloid-beta in Alzheimer's disease brain but not intransgenic mouse brain. J. Neurosci. 25, 10598-10606.
Kotzbauer, P. T., et al., 2001. Lewy body pathology in Alzheimer's disease. J Mol Neurosci. 17,225-32.
Krebs, M. R., et al., 2005. The binding of thioflavin-T to amyloid fibrils: localisation andimplications. J. Struct. Biol. 149, 30-37.
Kung, M. P., et al., 2003. Detection of amyloid plaques by radioligands for Aβ40 and Aβ42:potential imaging agents in Alzheimer's patients. J. Mol. Neurosci. 20, 15-24.
Lockhart, A., et al., 2005. Evidence for the presence of three distinct binding sites for thethioflavin T class of Alzheimer's disease PET imaging agents on beta-amyloid peptidefibrils. J. Biol. Chem. 280, 7677-7684.
Mena, R., et al., 1995. Monitoring pathological assembly of tau and beta-amyloid proteins inAlzheimer's disease. Acta Neuropathol. (Berl.). 89, 50-56.
Morsch, R., et al., 1999. Neurons may live for decades with neurofibrillary tangles. J.Neuropathol. Exp. Neurol. 58, 188-197.
Necula, M., et al., 2003. Rapid anionic micelle-mediated α-synuclein fibrillization in vitro. J.Biol. Chem. 278, 46674-46680.
Necula, M., Kuret, J., 2004. Electron microscopy as a quantitative method for investigating taufibrillization. Anal. Biochem. 329, 238-246.
Okamura, N., et al., 2005. Quinoline and benzimidazole derivatives: candidate probes for in vivoimaging of tau pathology in Alzheimer's disease. J. Neurosci. 25, 10857-10862.
Petkova, A. T., et al., 2005. Self-propagating, molecular-level polymorphism in Alzheimer'sbeta-amyloid fibrils. Science. 307, 262-5.
Petkova, A. T., et al., 2006. Experimental constraints on quaternary structure in Alzheimer'sbeta-amyloid fibrils. Biochemistry. 45, 498-512.
Pickhardt, M., et al., 2005. Anthraquinones inhibit tau aggregation and dissolve alzheimer pairedhelical filaments in vitro and in cells. J. Biol. Chem. 280, 3628-3635.
ACC
EPTE
D M
ANU
SCR
IPT
ACCEPTED MANUSCRIPT
22
Royall, D. R., et al., 2002. Pathological determinants of the transition to clinical dementia inAlzheimer's disease. Exp. Aging Res. 28, 143-162.
Schweers, O., et al., 1994. Structural studies of tau protein and Alzheimer paired helicalfilaments show no evidence for beta-structure. J. Biol. Chem. 269, 24290-24297.
Stine, W. B., Jr., et al., 2003. In vitro characterization of conditions for amyloid-beta peptideoligomerization and fibrillogenesis. J. Biol. Chem. 278, 11612-11622.
Terry, R. D., et al., 1991. Physical basis of cognitive alterations in Alzheimer's disease: synapseloss is the major correlate of cognitive impairment. Ann. Neurol. 30, 572-580.
Wang, J., et al., 1999. The levels of soluble versus insoluble brain Abeta distinguish Alzheimer'sdisease from normal and pathologic aging. Exp. Neurol. 158, 328-337.
Wilson, D. M., Binder, L. I., 1997. Free fatty acids stimulate the polymerization of tau andamyloid beta peptides. In vitro evidence for a common effector of pathogenesis inAlzheimer's disease. Am. J. Pathol. 150, 2181-2195.
Wischik, C. M., et al., 2004. Neurofibrillary labels. U.S. Patent Application 0213736 A1.Ye, L., et al., 2006. Characterisation of the binding of amyloid imaging tracers to rodent Abeta
fibrils and rodent-human Abeta co-polymers. Biochem. Biophys. Res. Comm. 347, 669-677.Zhu, M., et al., 2004. The flavonoid baicalein inhibits fibrillation of α-synuclein and
disaggregates existing fibrils. J. Biol. Chem. 279, 26846-26857.
ACC
EPTE
D M
ANU
SCR
IPT
ACCEPTED MANUSCRIPT
23
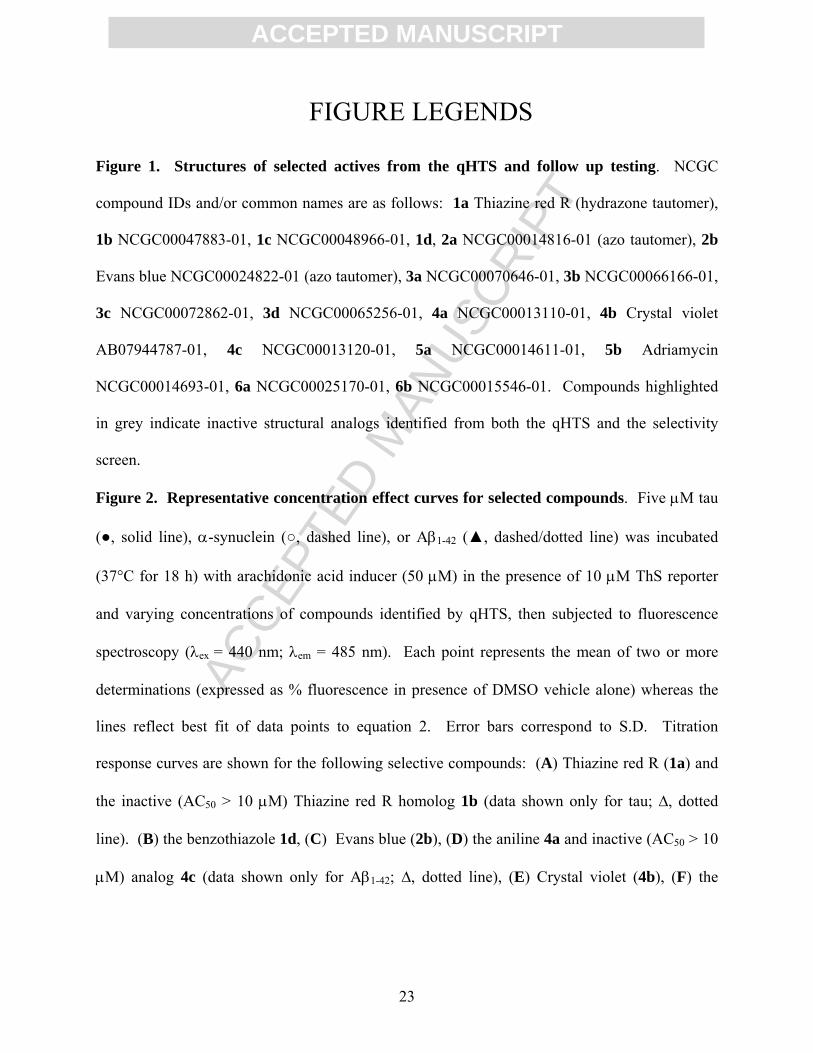
FIGURE LEGENDS
Figure 1. Structures of selected actives from the qHTS and follow up testing. NCGC
compound IDs and/or common names are as follows: 1a Thiazine red R (hydrazone tautomer),
1b NCGC00047883-01, 1c NCGC00048966-01, 1d, 2a NCGC00014816-01 (azo tautomer), 2b
Evans blue NCGC00024822-01 (azo tautomer), 3a NCGC00070646-01, 3b NCGC00066166-01,
3c NCGC00072862-01, 3d NCGC00065256-01, 4a NCGC00013110-01, 4b Crystal violet
AB07944787-01, 4c NCGC00013120-01, 5a NCGC00014611-01, 5b Adriamycin
NCGC00014693-01, 6a NCGC00025170-01, 6b NCGC00015546-01. Compounds highlighted
in grey indicate inactive structural analogs identified from both the qHTS and the selectivity
screen.
Figure 2. Representative concentration effect curves for selected compounds. Five μM tau
(●, solid line), α-synuclein (○, dashed line), or Aβ1-42 (▲, dashed/dotted line) was incubated
(37°C for 18 h) with arachidonic acid inducer (50 μM) in the presence of 10 μM ThS reporter
and varying concentrations of compounds identified by qHTS, then subjected to fluorescence
spectroscopy (λex = 440 nm; λem = 485 nm). Each point represents the mean of two or more
determinations (expressed as % fluorescence in presence of DMSO vehicle alone) whereas the
lines reflect best fit of data points to equation 2. Error bars correspond to S.D. Titration
response curves are shown for the following selective compounds: (A) Thiazine red R (1a) and
the inactive (AC50 > 10 μM) Thiazine red R homolog 1b (data shown only for tau; ∆, dotted
line). (B) the benzothiazole 1d, (C) Evans blue (2b), (D) the aniline 4a and inactive (AC50 > 10
μM) analog 4c (data shown only for Aβ1-42; ∆, dotted line), (E) Crystal violet (4b), (F) the

ACC
EPTE
D M
ANU
SCR
IPT
ACCEPTED MANUSCRIPT
24
anthraquinone 5a, and (G) the indolinone 6a and inactive (AC50 > 10 μM) analog 6b (data
shown only for tau; ∆, dotted line).
Figure 3. Comparison of ThS binding affinities for each substrate protein. ThS-based
fluorescence assays were conducted in parallel with tau (●), α-synuclein (○), or Aβ1-42 (■) as
substrate. (A) Tau, α-synuclein, and Aβ1-42 (each at 5 μM) were incubated (37°C for 18 h) with
arachidonic acid inducer (50 μM) in the presence of 0-30 μM ThS reporter, then subjected to
fluorescence spectroscopy (λex = 440 nm; λem = 485 nm). Each point represents the mean of
duplicate determinations (expressed as net fluorescence), whereas the lines reflect best fit of data
points to equation 1. (B) Bar graph of the relative affinity of ThS for each substrate as estimated
from the fitted curves in (A). Error bars represent the standard error of the estimate determined
from fit of data points to equation 1.
Figure 4. Identification of selective binders of tau, α-synuclein, and Aβ1-42. Molecules
shown in Fig. 1 and their associated Ki values (from Table 1) are depicted for tau (red), Aβ1-42
(green), and α-synuclein (blue). The distance from the origin of the plot corresponds to the
magnitude of the Ki value. Compounds selective for tau or Aβ1-42 are marked with a red circle or
a green triangle, respectively. Strongest selectivity for tau was obtained from scaffolds 1 and 2.
Figure 5. Identification of tau aggregation antagonists. Tau (5 μM) was incubated (37°C for
18 h) with arachidonic acid inducer (50 μM) in the presence of varying concentrations of
selective compounds Thiazine red R (1a), the aniline 4a, Crystal violet (4b), and the indolinone
6a. Each compound was tested at AC50 and four times the AC50 values as determined by the
fluorescence assay, and then examined for tau fibrillization by electron microscopy. The lowest
concentrations (black bars) of 1a, 4a, 4b, and 6a were 2.1 μM, 1.6 μM, 0.18 μM, and 1.0 μM,
respectively. Highest concentrations (white bars) of 1a, 4a, 4b, and 6a were 8.4 μM, 6.4 μM,

ACC
EPTE
D M
ANU
SCR
IPT
ACCEPTED MANUSCRIPT
25
0.72 μM, and 4.0 μM, respectively. Filament length (Γf) is reported as the percent filament
length observed in the presence of DMSO vehicle alone (labeled as C, hatched bar), which is
defined as 100%. Error bars indicate S.D. Statistical significance of differences in total filament
length was assessed by Student’s t test (*, p < 0.05).

ACC
EPTE
D M
ANU
SCR
IPT
ACCEPTED MANUSCRIPT
26
Table 1: Compounds exhibiting selectivity and submicromolar binding affinity.
tau α-synuclein Aβ1-42 Fold SelectivityCpd AC50
(μM)Ki
(nM)AC50
(μM)Ki
(nM)AC50
(μM)Ki
(nM)tau/
α-syn.tau/
Aβ1-42
Aβ1-42/α-syn.
1a 2.1 ± 0.6 200 ± 65 >10 >3500 >10 >2000 >17 >10 n/a
1b >10 >940 >10 >3500 >10 >2000 n/a n/a n/a
1c >10 >940 >10 >3500 >10 >2000 n/a n/a n/a
1d 0.083 ± 0.004 7.8 ± 1.0 >10 >3500 0.067 ± 0.006 13 ± 2 >440 1.7 ± 0.4 >260
2a 0.78 ± 0.25 74 ± 26 2.6 ± 1.5 930 ± 520 1.0 ± 0.54 200 ± 110 13 ± 8.3 2.8 ± 1.8 4.5 ± 3.5
2b 0.19 ± 0.03 18 ± 3 0.75 ± 0.08 260 ± 35 0.90 ± 0.28 180 ± 59 15 ± 3** 10 ± 4* 1.5 ± 0.5
3a 2.8 ± 0.7 260 ± 77 1.7 ± 0.3 580 ± 120 0.76 ± 0.28 150 ± 59 2.2 ± 0.8 0.6 ± 0.3 3.9 ± 1.7
3b 4.0 ± 2.3 379 ± 220 1.2 ± 0.4 440 ± 160 0.96 ± 0.15 190 ± 39 1.2 ± 0.8 0.5 ± 0.3 2.3 ± 1.0
3c >10 >940 >10 >3500 >10 >2000 n/a n/a n/a
3d 2.7 ± 1.2 260 ± 110 1.8 ± 0.5 620 ± 180 3.6 ± 1.4 720 ± 290 2.4 ± 1.3 2.8 ± 1.7 0.9 ± 0.4
4a 1.6 ± 0.3 150 ± 35 2.0 ± 0.4 700 ± 160 0.56 ± 0.09 110 ± 23 4.6 ± 1.5* 0.7 ± 0.2 6.4 ± 2.0**
4b 0.18 ± 0.01 17 ± 2 0.15 ± 0.02 53 ± 8 0.15 ± 0.01 29 ± 4 3.1 ± 0.6** 1.7 ± 0.3* 1.8 ± 0.4
4c >10 >940 >10 >3500 >10 >2000 n/a n/a n/a
5a 2.1 ± 0.2 190 ± 30 2.1 ± 0.3 750 ± 120 0.55 ± 0.10 110 ± 24 3.9 ± 0.9** 0.6 ± 0.2 6.9 ± 1.9**
5b 9.6 ± 7.6 910 ± 730 >10 >3500 1.6 ± 0.8 320 ± 160 >3 0.4 ± 0.3 >10
6a 1.0 ± 0.1 95 ± 17 1.4 ± 0.3 490 ± 120 0.72 ± 0.07 140 ± 23 5.1 ± 1.6* 1.5 ± 0.4 3.4 ± 1.0*
6b >10 >940 >10 >3500 >10 >2000 n/a n/a n/aUnderlined values indicate compounds with AC50 values <1.0 μM. Values highlighted in bold indicate compounds selective for either tau or Aβ1-42
relative to α-synuclein. Statistical significance of fold selectivity was assessed by comparison of Ki values by Student’s t test (**, p < 0.01; *, p <0.05). All errors = SEE.
ACC
EPTE
D M
ANU
SCR
IPT
ACCEPTED MANUSCRIPT
27

ACC
EPTE
D M
ANU
SCR
IPT
ACCEPTED MANUSCRIPT
28
ACC
EPTE
D M
ANU
SCR
IPT
ACCEPTED MANUSCRIPT
29

ACC
EPTE
D M
ANU
SCR
IPT
ACCEPTED MANUSCRIPT
30

ACC
EPTE
D M
ANU
SCR
IPT
ACCEPTED MANUSCRIPT
31

![Enfermedad de Alzheimer - COC3000 · La enfermedad de Alzheimer (EA), también denominada mal de Alzheimer, o demencia senil de tipo Alzheimer (DSTA) o simplemente alzhéimer[10]](https://img.pdfslide.net/doc/110x75/5f0f53777e708231d4439b0b/enfermedad-de-alzheimer-coc3000-la-enfermedad-de-alzheimer-ea-tambin-denominada.jpg)