Embed Size (px)
Citation preview
DIFFUSE-SCATTERING IR SPECTROSCOPY AND ITS NEW APPLICATIONS
IN STUDYING CHEMISORBED SPECIES AND SURFACE STRUCTURE
OF OXIDE CATALYSTS
V. B. Kazanskii UDC 543.422.4:541.183 -541.128
Spectroscopic methods came into use rather early in the study of mechanisms of hetero- geneous catalysis. Historically, IR spectroscopy was the first to be applied, and it then became the most widely used method, as it did not require any reworking of the standard spec- trophotometers, and a broad group of objects could be studied. Practically the only version of IR spectroscopy that is being used today is the study of transmission spectra. In the case of oxides, powdered samples are pressed into the form of very thin, semitransparent tab- lets; in the case of metals, vacuum-deposited semitransparent films are used, or diluted samples supported on oxide substrates may be used in pressing semitransparent plates [i, 2].
Along with the obvious ad[antage of simplicity, transmission spectroscopy has a number of shortcomings. Here we should mention first of all its very limited spectral range, from about 1200 to 4000 cm -~. The upper limit is determined by the characteristics of the commer- cially manufactured spectrophotometers and also by the intense scattering of light by these specimens at higher wave numbers. The lower limit of measurement depends on the adsorption of light by vibrations of the metal--oxygen bonds in the lattice of one oxide or another.
Even though most of the fundamental frequencies of stretching vibrations of a great vari- ety of chemical bonds fall into this range, it does not include vibrational transitions or composite frequencies of several vibrations and their overtones. For such objects, therefore, the vibrations of one bond or another are usually characterized by a single frequency. This may introduce ambiguity into the interpretation of the results; moreover, it leads to a situa- tion in which IR spectroscopy is used in the overwhelming majority of studies as a purely analytical method for "fingerprinting." The assignment of frequencies is performed by analogy with the IR spectra of the liquid. Therefore, in the best case, the results can only indicate whether one compound or another is present on the surface. From the observed spectroscopic data (a single fundamental frequency of the stretching vibrations), it is not possible to ob- tain any information, at a more significant level, on the geometry of the adsorbed molecules or on the character of their perturbations when they interact with the active centers. All this limits the possibilities of transmission spectroscopy.
Another serious shortcoming is the comparatively low sensitivity (10~e-10 ~9 particles per gram of adsorbent, depending on the extinction coefficient of one grouping or another). Certain new possibilities for improving the sensitivity (by approximately an order of magni- tude) have been opened up by the use of modern Fourier transform IR spectrophotometers. Another way to reach this goal and at the same time to expand quite significantly the spec- tral range of measurements in the near-IR, involves the use of diffuse light scattering in- stead of transmission, analogous to what is done in the visible and UV regions. In this article we will discuss critically the new possibilities that have been opened up by this ap- proach and the results that have already been obtained.
EXPERIMENTAL PRINCIPLES OFTHE USE OF DIFFUSE REFLECTION METHODS IN THE NEAR-INFRARED REGION
In the near-IR region of the optical spectrum (4000-12,000 cm -~) we find the frequen- cies of the first and second overtones of stretching vibrations of OH, N--H bonds, and also the composite frequencies of stretching and deformation vibrations of OH groups. Also found in this region are the overtones of vibrations in such simple molecules as H2 and N2.
N. D. Zelinskii Institute of Organic Chemistry, Academy of Sciences of the USSR, Moscow. Translated from Izvestiya Akademii Nauk SSSR, Seriya Khimicheskaya, No. i, pp. 40-51, January, 1984. Original article submitted July 14, 1983.
0568-5230~84~3301-0033508.50 �9 1984 Plenum Publishing Corporation 33

Measurements in this spectral range do not involve any difficulties in principle, if we exclude from consideration the lower intensity of the absorption bands, since transitions from the zero level directly to the second vibrational level and combinations of several vi- brations are forbidden in the harmonic oscillator by the selection rule. They become possible only when there is significant anharmonicity of the vibrations; however, the intensity of the bands in this case is 20-30 times lower than for the fundamental transitions.
The most important methodological complication that arises in measurements in the near- IR is the strong scattering of light by powdered specimens. Therefore, even very thin plates pressed from powders become completely nontransparent. This circumstance has led us to the use of diffuse reflection in place of transmission, as the advantages of the reflection spec- troscopy increase in proportion to the scattering power of the specimen.
Our measurements were performed in a high-resolution instrument, the Beckmann Akta M-7, which covers the spectral range from the UV to 3 ~m. Powdered specimens were poured into a thin- walled vacuum cuvette made of quartz, which is transparent in the IR region. For the measurements in the fundamental region of the IR spectrum, the cuvettes were equipped with windows made of CaF2 or other material that is transparent in the appropriate spectral range. The ampul with the specimen, either vacuum-baked or with molecules of the particular substance adsorbed on its surface, was placed in front of the entrance slit of the spectrophotometer and illuminated with light from an external source, a KGM-24-150 quartz halogen lamp, focused by means of a spherical mirror. The flux of diffuse-reflected light form the specimen onto the detector of the instrument was approximately 5% of the comparison beam, which was further attenuated by means of special diaphragms or screens in order to improve the conditions of measurement.
Using this technique, the position of the first overtone of stretching vibrations of OH groups could be measured for powders, even those with a small surface area. In the case of high-dispersity specimens, the position of the second overtone could be measured without any particular difficulty, and sometimes the third overtone as well. This is explained by the great length of the optical path of light scattered by the specimen, in comparison with the transmission method, as a result of multiple reflection of the light by the sample grains. Therefore, in the near-IR region, the use of diffuse scattering spectra gives a much better sensitivity than the traditional transmission method using thin, semitransparent plates pressed from powders.
2O
Z
a
30
~0
3O
0 "m
zo
e,e 10
~0 ~
// / 0,1
~-7-~ i ~ Z 3 irnax,%
Transmission
Fig. 1 Fig. 2.
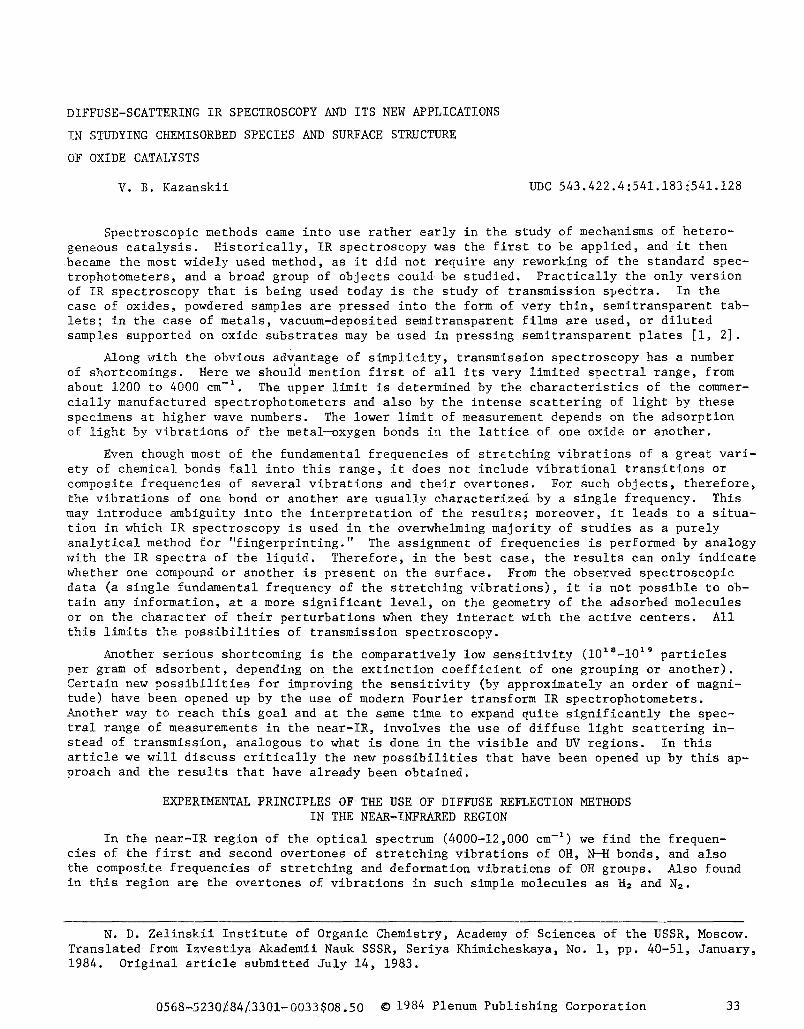
Fig. 1. Comparison of reflection spectrum (a) and transmission spectrum (b) of partially decationized NaX zeolite in mixture with Aerosil (i:I).
Fig. 2. Theoretical comparison of reflection and transmission methods for various values of reflectance of catalyst powder.
34
f~
5 I/I ...
h ~ 575f ~ 3
.up Vv+ 5 } o-~ I vV+v VO. z vZp~S vo-. z
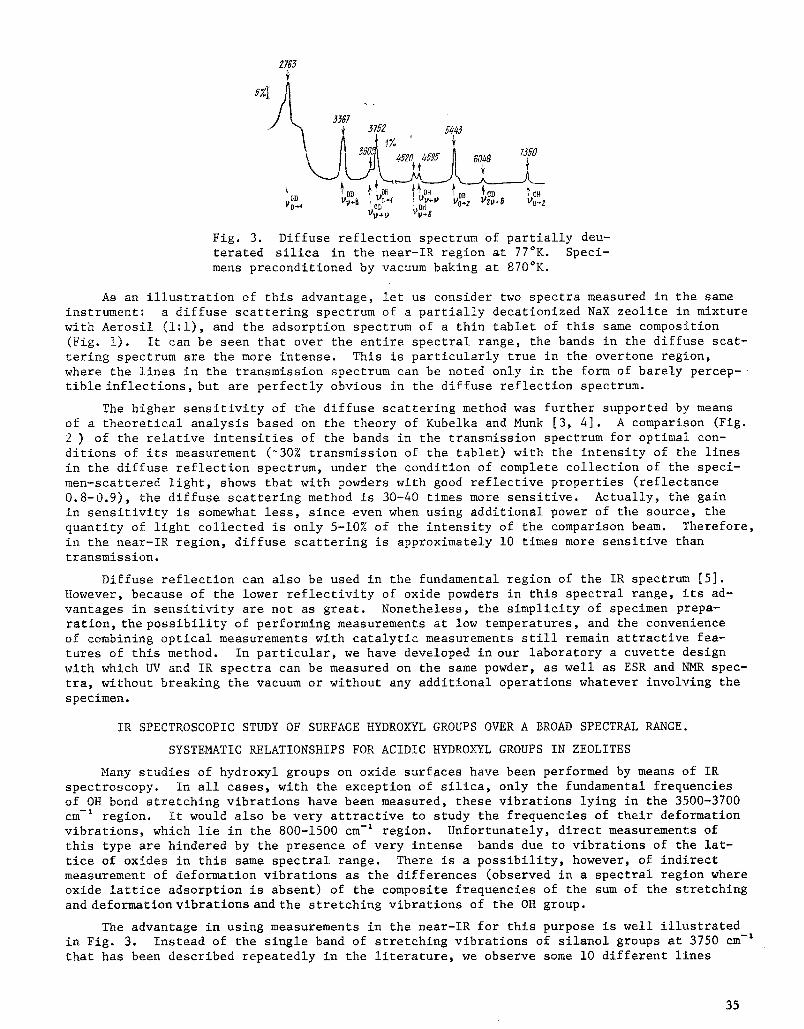
Fig. 3. D i f f u s e r e f l e c t i o n spectrum of p a r t i a l l y deu- terated silica in the near-IR region at 77~ Speci- mens preconditioned by vacuum baking at 870~
As an illustration of this advantage, let us consider two spectra measured in the same instrument: a diffuse scattering spectrum of a partially decationized NaX zeolite in mixture with Aerosil (i:i), and the adsorption spectrum of a thin tablet of this same composition (Fig. i). It can be seen that over the entire spectral range, the bands in the diffuse scat- tering spectrum are the more intense. This is particularly true in the overtone region, where the lines in the transmission spectrum can be noted only in the form of barely percep- tible inflections, but are perfectly obvious in the diffuse reflection spectrum.
The higher sensitivity of the diffuse scattering method was further supported by means of a theoretical analysis based on the theory of Kubelka and Munk [3, 4]. A comparison (Fig. 2 ) of the relative intensities of the bands in the transmission spectrum for optimal con- ditions of its measurement (~30% transmission of the tablet) with the intensity of the lines in the diffuse reflection spectrum, under the condition of complete collection of the speci- men-scattered light, shows that with powders with good reflective properties (reflectance 0.8-0.9), the diffuse scattering method is 30-40 times more sensitive. Actually, the gain in sensitivity is somewhat less, since even when using additional power of the source, the quantity of light collected is only 5-10% of the intensity of the comparison beam. Therefore, in the near-IR region, diffuse scattering is approximately I0 times more sensitive than
transmission.
Diffuse reflection can also be used in the fundamental region of the IR spectrum [5]. However, because of the lower reflectivity of oxide powders in this spectral range, its ad- vantages in sensitivity are not as great. Nonetheless, the simplicity of specimen prepa- ration, the possibility of performing measurements at low temperatures, and the convenience of combining optical measurements with catalytic measurements still remain attractive fea- tures of this method. In particular, we have developed in our laboratory a cuvette design with which UV and IR spectra can be measured on the same powder, as well as ESR and NMR spec- tra, without breaking the vacuum or without any additional operations whatever involving the
specimen.
IR SPECTROSCOPIC STUDY OF SURFACE HYDROXYL GROUPS OVER A BROAD SPECTRAL RANGE.
SYSTEMATIC RELATIONSHIPS FOR ACIDIC HYDROXYL GROUPS IN ZEOLITES
Many studies of hydroxyl groups on oxide surfaces have been performed by means of IR spectroscopy. In all cases, with the exception of silica, only the fundamental frequencies of OH bond stretching vibrations have been measured, these vibrations lying in the 3500-3700
--1 om region. It would also be very attractive to study the frequencies of their deformation vibrations, which lie in the 800-1500 cm -x region. Unfortunately, direct measurements of this type are hindered by the presence of very intense bands due to vibrations of the lat- tice of oxides in this same spectral range. There is a possibility, however, of indirect measurement of deformation vibrations as the differences (observed in a spectral region where oxide lattice adsorption is absent) of the composite frequencies of the sum of the stretching and deformation vibrations and the stretching vibrations of the OH group.
The advantage in using measurements in the near-IR for this purpose is well illustrated in Fig. 3. Instead of the single band of stretching vibrations of silanol groups at 3750 cm -x that has been described repeatedly in the literature, we observe some l0 different lines
35
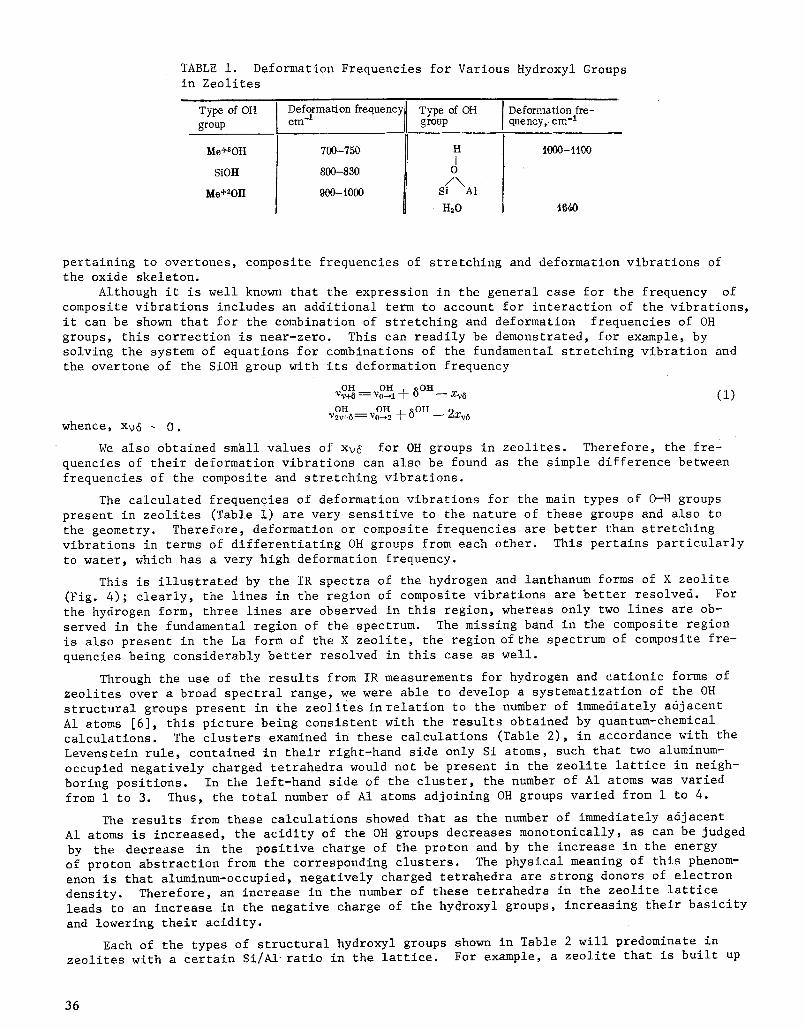
TABLE i. Deformation Frequencies for Various Hydroxyl Groups in Zeolites
Type of OH group
Me+~OH
SiOH
Me+20H
Deformation frequency am -t
700-750
800-830
900-1000
Type of OH group
H I
0
S ( \ A 1
H~O
Deformation fre- quency,, cm "1
1000-1100
~B40
pertaining to overtones, composite frequencies of stretching and deformation vibrations of the oxide skeleton.
Although it is well known that the expression in the general case for the frequency of composite vibrations includes an additional term to account for interaction of the vibrations, it can be shown that for the combination of stretching and deformation frequencies of OH groups, this correction is near-zero. This can readily be demonstrated, for example, by solving the system of equations for combinations of the fundamental stretching vibration and the overtone of the SiOH group with its deformation frequency
OH OH ~+~ = ~0~1 + ~OH -- X~6 ( i ) OH oH 6o~ v~v+6=vo~2 § --2xv6
whence, xv5 ~ 0.
We also obtained smhll values of xv~ for OH groups in zeolites. Therefore, the fre' quencies of their deformation vibrations can also be found as the simple difference between frequencies of the composite and stretching vibrations.
The calculated frequencies of deformation vibrations for the main types of O--H groups present in zeolites (Table I) are very sensitive to the nature of these groups and also to the geometry. Therefore, deformation or composite frequencies are better than stretching vibrations in terms of differentiating OH groups from each other. This pertains particularly to water, which has a very high deformation frequency.
This is illustrated by the IR spectra of the hydrogen and lanthanum forms of X zeolite (Fig. 4); clearly, the lines in the region of composite vibrations are better resolved. For the hydrogen form, three lines are observed in this region, whereas only two lines are ob- served in the fundamental region of the spectrum. The missing band in the composite region is also present in the La form of the X zeolite, the region of the spectrum of composite fre- quencies being considerably better resolved in this case as well.
Through the use of the results from IR measurements for hydrogen and cationic forms of zeolites over a broad spectral range, we were able to develop a systematization of the OH structural groups present in the zeolites in relation to the number of immediately adjacent A1 atoms [6], this picture being consistent with the results obtained by quantum-chemical calculations. The clusters examined in these calculations (Table 2), in accordance with the Levenstein rule, contained in their right-hand side only Si atoms, such that two aluminum- occupied negatively charged tetrahedra would not be present in the zeolite lattice in neigh- boring positions. In the left-hand side of the cluster, the number of A1 atoms was varied from 1 to 3. Thus, the total number of A1 atoms adjoining OH groups varied from 1 to 4.
The results from these calculations showed that as the number of immediately adjacent A1 atoms is increased, the acidity of the OH groups decreases monotonically, as can be judged by the decrease in the positive charge of the proton and by the increase in the energy of proton abstraction from the corresponding clusters. The physical meaning of this phenom- enon is that aluminum-occupied, negatively charged tetrahedra are strong donors of electron density. Therefore, an increase in the number of these tetrahedra in the zeolite lattice leads to an increase in the negative charge of the hydroxyl groups, increasing their basicity
and lowering their acidity.
Each of the types of structural hydroxyl groups shown in Table 2 will predominate in zeolites with a certain Si/Al. ratio in the lattice. For example, a zeolite that is built up
36
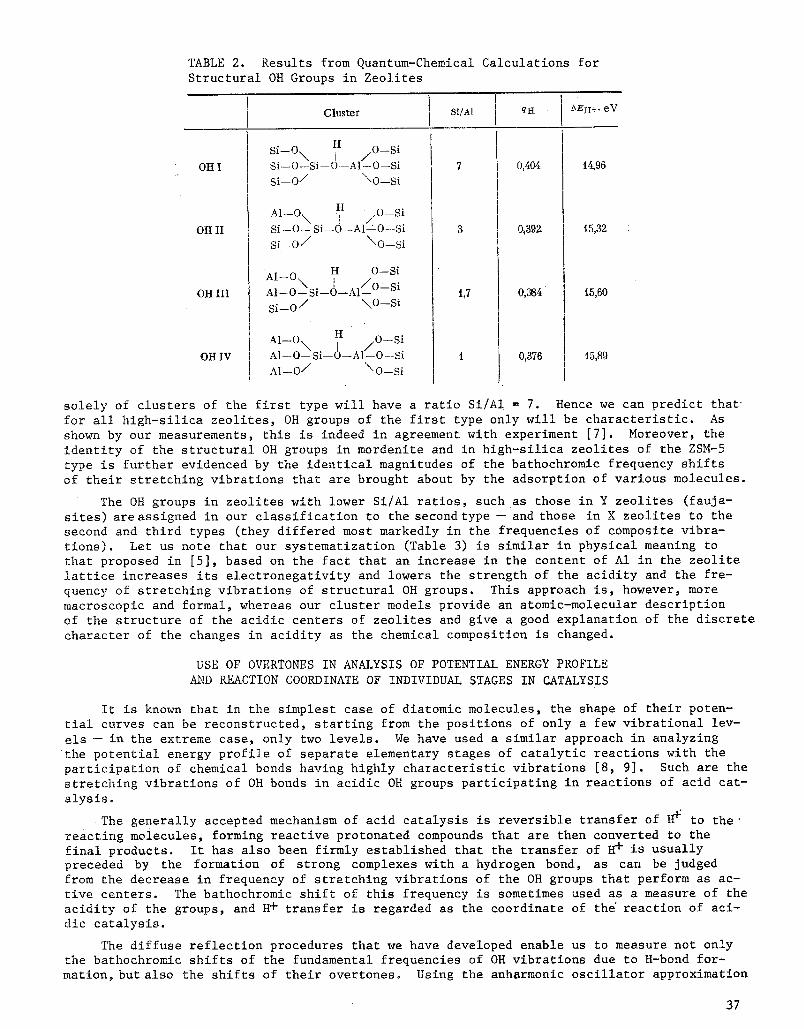
TABLE 2. Results from Quantum-Chemical Calculations for Structural OH Groups in Zeolites
OH I
OH II
OH III
OH IV
Cluster Si/Al qYI AEH+, eV
s i - o \ HI /O--Si Si--O--Si--O--AI--O--Si
Si--O / \\0--Si
al-o\ ,~, -/o-si Si--0-- Si--0--Al~O--Si s i - o / \ o - - s i
' H O - - S i AI--O\ I / A1--0-- Si--O--A1 -O'Si s i _ o / \o-si
H AI--O\ l /O--Si AI--O-- Si--O--A 1--O--Si AI--O/" \O--Si
t,7
0,404
0,392
0,384
0,376
i4,96
t5,32 "
15,60
i5,89
solely of clusters of the first type will have a ratio Si/A! = 7. Hence we can predict that for all high-silica zeolites, OH groups of the first type only will be characteristic. As shown by our measurements, this is indeed in agreement with experiment [7]. Moreover, the identity of the structural OH groups in mordenite and in high-silica zeolites of the ZSM-5 type is further evidenced by the identical magnitudes of the bathochromic frequency shifts of their stretching vibrations that are brought about by the adsorption of various molecules.
The OH groups in zeolites with lower Si/AI ratios, such as those in Y zeolites (fauja- sites) are assigned in our classification to the second type -- and those in X zeolites to the second and third types (they differed most markedly in the frequencies of composite vibra- tions). Let us note that our systematization (Table 3) is similar in physical meaning to that proposed in [5], based on the fact that an increase in the content of A1 in the zeolite lattice increases its electronegativity and lowers the strength of the acidity and the fre- quency of stretching vibrations of structural OH groups. This approach is, however, more macroscopic and formal, whereas our cluster models provide an atomic-molecular description of the structure of the acidic centers of zeolites and give a good explanation of the discrete character of the changes in acidity as the chemical composition is changed.
USE OF OVERTONES IN ANALYSIS OF POTENTIAL ENERGY PROFILE
AND REACTION COORDINATE OF INDIVIDUAL STAGES IN CATALYSIS
It is known that in the simplest case of diatomic molecules, the shape of their poten- tial curves can be reconstructed, starting from the positions of only a few vibrational lev- els -- in the extreme case, only two levels. We have used a similar approach in analyzing :the potential energy profile of separate elementary stages of catalytic reactions with the participation of chemical bonds having highly characteristic vibrations [8, 9]. Such are the stretching vibrations of OH bonds in acidic OH groups participating in reactions of acid cat-
a!ysis.
The generally accepted mechanism of acid catalysis is reversible transfer of H ~ to the' reacting molecules, forming reactive protonated compounds that are then converted to the final products. It has also been firmly established that the transfer of H + is usually preceded by the formation of strong complexes with a hydrogen bond, as can be judged from the decrease in frequency of stretching vibrations of the OH groups that perform as ac- tive centers. The bathochromic shift of this frequency is sometimes used as a measure of the acidity of the groups, and H + transfer is regarded as the coordinate of the' reaction of aci- dic catalysis.
The diffuse reflection procedures that we have developed enable us to measure not only the bathochromic shifts of the fundamental frequencies of OH vibrations due to H-bond for- mation, but also the shifts of their overtones~ Using the anharmonic oscillator approximation
37
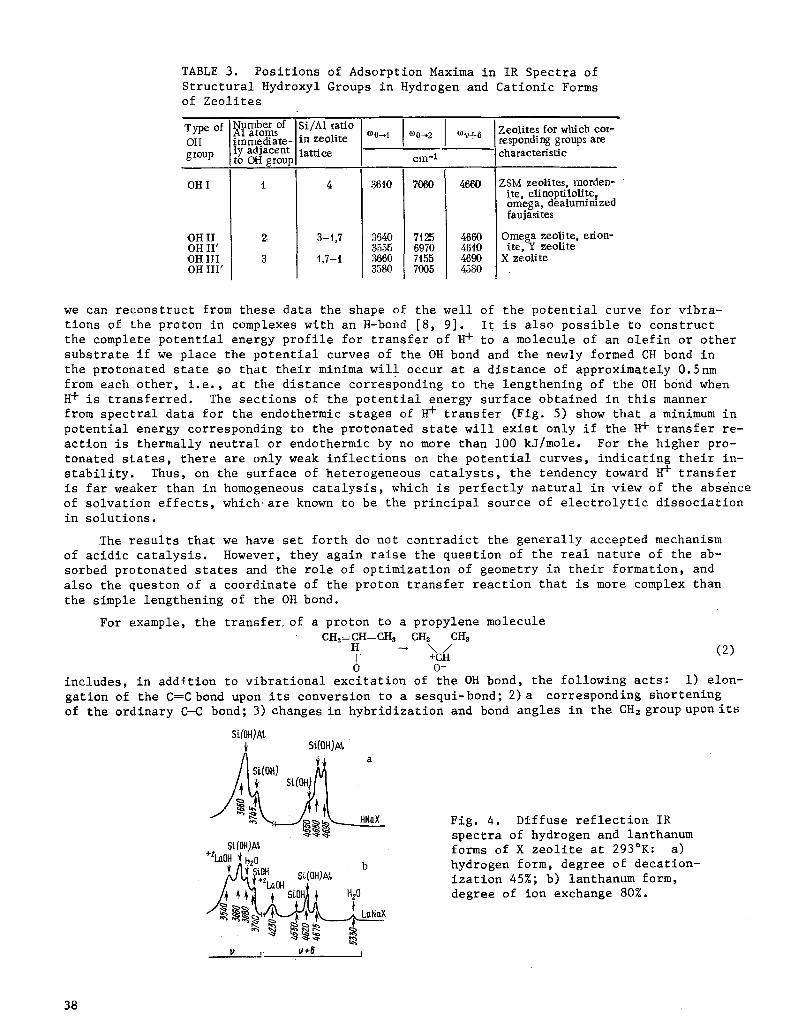
TABLE 3. Positions of Adsorption Maxima in IR Spectra of Structural Hydroxyl Groups in Hydrogen and Cationic Forms of Zeolites
Type of i~pmber of m x~ l atoms
OH I immediate- group IlY adjacent
I tO OH group
OH I I
OH II OH II ' OH III 3 OH l I I '
Si/A1 ratio in zeolite lattice
3-t;7
t ,7-1
c~ [ ~ 0-~2
cm-I
3611) 7060
3640 7125 35515 6970 3660 7t55 3580 7005
Zeolites for which eor- ~ I responding groups are
[ characteristic
4660
4660 46t0 4990 4580
ZSM zeolites, morden- " ite, clinoptilolit% Omega, dealumimzed faujasites
Omega zeolite, erion- ite, Y zeolite
X zeolite
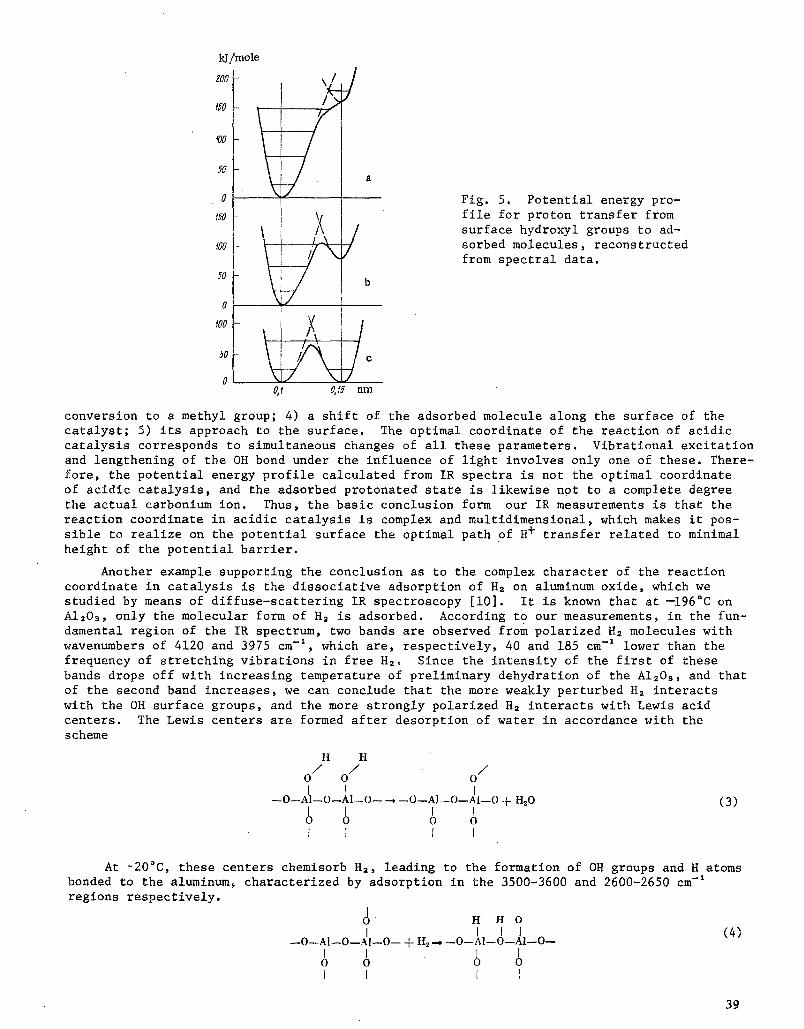
we can reconstruct from these data the shape of the well of the potential curve for vibra- tions of the proton in complexes with an H-bond [8, 9]. It is also possible to construct the complete potential energy profile for transfer of H + to a molecule of an olefin or other substrate if we place the potential curves of the OH bond and the newly formed CH bond in the protonated state so that their minima will occur at a distance of approximately 0.5nm from each other, i.e., at the distance corresponding to the lengthening of the OH bond when H + is transferred. The sections of the potential energy surface obtained in this manner from spectral data for the endothermic stages of H + transfer (Fig. 5) show that a minimum in potential energy corresponding to the protonated state will exist only if the H + transfer re- action is thermally neutral or endothermic by no more than I00 kJ/mole. For the higher pro- tonated states, there are only weak inflections on the potential curves, indicatin~ their in- stability. Thus, on the surface of heterogeneous catalysts, the tendency toward H ~ transfer is far weaker than in homogeneous catalysis, which is perfectly natural in view of the absence of solvation effects, which:are known to be the principal source of electrolytic dissociation in solutions.
The results that we have set forth do not contradict the generally accepted mechanism of acidic catalysis. However, they again raise the question of the real nature of the ab- sorbed protonated states and the role of optimization of geometry in their formation, and also the queston of a coordinate of the proton transfer reaction that is more complex than the simple lengthening of the OH bond.
For example, the transfer of a proton to a propylene molecule CH2:CH--CH3 CHa CH3
H ~ \ / ( 2 ) I' +CH 0 O-
includes, in addition to vibrational excitation of the OH bond, the following acts: i) elon- gation of the C=C bond upon its conversion to a sesqui-bond; 2) a corresponding shortening of the ordinary C--C bond; 3) changes in hybridization and bond angles in the CH= group upon its
SE(OH.)At + St(OH)At
st(oH a
,.,.y~ ~,,..._ HNaX
SHOH)A~ +zLaOH ~ HzO
�9 " " " - - , kJ ~ ' , s ~ H Si,(OH)A; b
/ , ),,~"='LaOH
LoNaX
Fig. 4. Diffuse reflection IR spectra of hydrogen and lanthanum forms of X zeolite at 293~ a) hydrogen form, degree of decation- ization 45%; b) lanthanum form, degree of ion exchange 80%.
38
l~/mole
zoo
/5o
cod
5o
o
t00
5o
o
too
5o
o
r
0,~ O,g n m
Fig. 5. Potential energy pro- file for proton transfer from surface hydroxyl groups to ad- sorbed molecules, reconstructed from spectral data.
conversion to a methyl group; 4) a shift of the adsorbed molecule along the surface of the catalyst; 5) its approach to the surface. The optimal coordinate of the reaction of acidic catalysis corresponds to simultaneous changes of all these parameters. Vibrational excitation and lengthening of the OH bond under the influence of light involves only one of these. There-- fore, the potential energy profile calculated from IR spectra is not the optimal coordinate of acidic catalysis, and the adsorbed protonated state is likewise not to a complete degree the actual carbonium ion. Thus, the basic conclusion form our IR measurements is that the reaction coordinate in acidiccatalysis is complex and multidimensional, which makes it pos- sible to realize on the potential surface the optimal path of H + transfer related to minimal height of the potential barrier.
Another example supporting the conclusion as to the complex character of the reaction coordinate in catalysis is the dissociative adsorption of H2 on aluminum oxide, which we studied by means of diffuse-scattering IR spectroscopy [i0]. It is known that at --196~ on AI2Os, only the molecular form of H2 is adsorbed. According to our measurements, in the fun- damental region of the IR spectrum, two bands are observed from polarized H2 molecules with wavenumbers of 4120 and 3975 cm -t, which are, respectively, 40 and 185 cm -t lower than the frequency of stretching vibrations in free H2. Since the intensity of the first of these bands drops off with increasing temperature of preliminary dehydration of the AI2Os, and that of the second band increases, we can conclude that the more weakly perturbed H2 interacts with the OH surface groups, and the more strongly polarized H2 interacts with Lewis acid centers. The Lewis centers are formed after desorption of water in accordance with the scheme
H H
/ / o / o o
--O--AI--O--AI--O-- ~ --O--AI--O--AI--O + tt~O (3) r I i I o O O o I l I I
At ~20~ these centers chemisorb H2, leading to the formation of OH groups and H atoms bonded to the aluminum, characterized by adsorption in the 3500-3600 and 2600-2650 cm-* regions respectively.
i 0 H H 0 | J I I (4)
- -O - -A I - -O - -A I - -O - - + H~.... - - 0 - - A I - - O - - A I - - O - - I I 1 l
0 0 0 0 I r I I
39
F |
d~
~035 / , - - I ~ ! ~z5
Y iAk
- ( ,~ I C y , , - ' - < ~ _ .
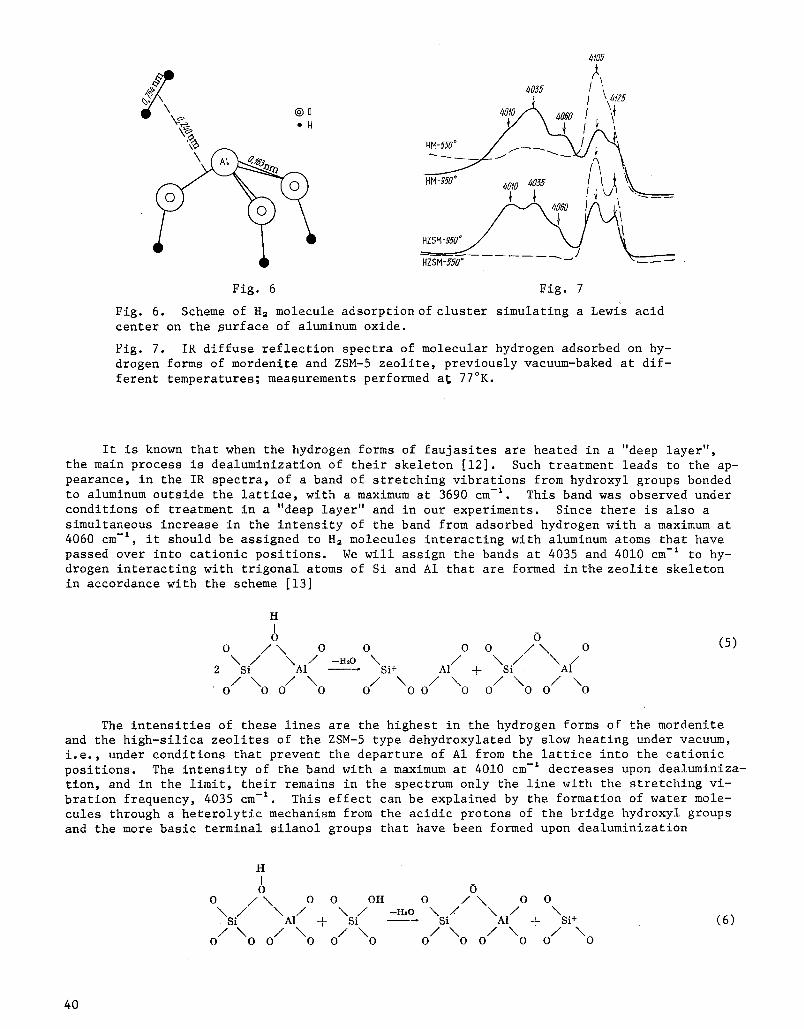
Fig. 6 Fig. 7
Fig. 6. Scheme of H= molecule adsorption of cluster simulating a Lewis acid center on the ~urface of aluminum oxide.
Fig. 7. IR diffuse reflection spectra of molecular hydrogen adsorbed on hy- drogen forms of mordenite and ZSM-5 zeolite, previously vacuum-baked at dif- ferent temperatures; measurements performed at 77~
It is known that when the hydrogen forms of faujasites are heated in a "deep layer", the main process is dealuminization of their skeleton [12]. Such treatment leads to the ap- pearance, in the IR spectra, of a band of stretching vibrations from hydroxyl groups bonded to aluminum outside the lattice, with a maximum at 3690 cm-:. This band was observed under conditions of treatment in a "deep layer" and in our experiments. Since there is also a simultaneous increase in the intensity of the band from adsorbed hydrogen with a maximum at 4060 cm -~, it should be assigned to H2 molecules interacting with aluminum atoms that have passed over into cationic positions. We will assign the bands at 4035 and 4010 cm -: to hy- drogen interacting with trigonal atoms of Si and AI that are formed in the zeolite skeleton in accordance with the scheme [13]
H I 0
0 / \ 0 0 0
\ S i / \ a l / - ~ , o \ / -* Si + A1 +
/ \ 0 / \ 0 / \ / "" 0 0 0 0 0 0
0 0 / \ 0
\ / \ / Si AI
/ " o / " o o o
(5)
The intensities of these lines are the highest in the hydrogen forms of the mordenite and the high-silica zeolites of the ZSM-5 type dehydroxylated by slow heating under vacuum, i.e., under conditions that prevent the departure of AI from the lattice into the cationic positions. The intensity of the band with a maximum at 4010 cm-: decreases upon dealuminiza- tion, and in the limit, their remains in the spectrum only the line with the stretching vi- bration frequency, 4035 cm -t. This effect can be explained by the formation of water mole- cules through a heterolytic mechanism from the acidic protons of the bridge hydroxyl groups and the more basic terminal silanol groups that have been formed upon dealuminization
H 1 0 0
o / \ 0 0 OH 0 / \ 0 0 \ / \ / \ / --H,O \ / \ / \ �9 Si A1 + Si Si AI + Si +
/ \ 0 / \ 0 / \ 0 / \ 0 / \ / "" 0 0 0 0 0 0 0 0
(6)
40
For H2 interacting with Lewis acid centers, not only the frequency of the fundamental stretching vibrations with ~o§ = 3975 cm -I has been observed, but also the overtone with mo+2 = 7725 cm-1; therefore, we evaluated the degree of perturbation of the ~ molecules
due to adsorption. It can readily be demonstrated that the parameters of the potential curve of ~he H--H bond change very little upon adsorption. The magnitude of ~o in this case drops only from 4417 to 4200 cm-:, and the anharmonicity factor from 2.97-10 -2 to 2~.67.10 -2. And this is more or less characteristic for molecules with a more highly ionic bond, and there- fore is in accord with the assumption of polarization of adsorbed H2. The dissociation en- ergy calculated from these values, however, not only does not decrease, but even increases slightly, from 430 to 440 kJ/mole. Therefore, the simple stretching vibration of the H--H bond, obviously, the same as in the case of OH groups, is not the coordinate of dissociative adsorption of H2.
This conclusion is also consistent with results obtained from a quantum-chemical calcu- lation performed in our laboratory by the ab initio STO-3G method, according to which the H2 molecule is adsorbed on the Lewis acid centers of AI20~ at two points, one of the H atoms being bonded to the 0 and the other to the A1 (Fig. 6). With a reasonable value for the heat of adsorption, 20.2 kJ/mole, attention is drawn to the large equilibrium AI--H distance in this complex and the very slight lengthening of the H--H bond, from 0.0740 to 0.0754 nm. The calculation also shows that the coordinate of the reaction of dissociative adsorption is the subsequent approach of the adsorbed H2 molecule to the surface, combined with a simultaneous lengthening of the h~ bond.
APPLICATION OF LOW-TEMPERATURE ADSORPTION OF MOLECULAR HYDROGEN
IN STUDYING LEWIS ACID CENTERS ON ZEOLITES
One of the most common techniques for studying Lewis acid centers on the surface of ox- ides is the use of test molecules, the IR spectra of which are perturbed when they interact with low-coordinated cations that act as electron acceptor centers. This technique usually involves the adsorption of CO, Py, NHs, acetone, or other simple molecules [ll]. The results discussed previously on the adsorption of H2 on AI20~ show that low-temperature adsorption of dihydrogen is also very attractive for this purpose, as it has the following advantages: a) Physically adsorbed H2 is optically inactive, and so it is not manifested in the IR spectrum and does not create any background to interfere with the interpretation of the spectral data; b) the interaction of H~ molecules with Lewis acid centers is characterized by large batho- chromic shifts, amounting to as much as 100-150 cm-~; c) the change in frequency of st~etchin~ vibrations of the simplest molecule (H2) due to adsorption can be interpreted quantatively on the basis of the quantum-chemical calculations; d) H2 molecules are adsorbed on Lewis acid centers at two points, so that it is possible to characterize not only the low-coordination cations that enter into the composition of the Lewis centers, but also their basic oxygen ion environment.
Thus, low-temperature adsorption of H2 is not so much a test of Lewis acidity as of the polarizing properties of the acid--base pairs. From our point of view, such a characterizatior is far more informative, since it provides a basis for a better judgement of the tendency toward reactions ofheterolyticdissociation, which is usually postulated as the typical ele- mentary stage in catalysis with the participation of Lewis acid centers on oxide surfaces.
Let us now examine certain results obtained in a study of Lewis acid centers on decat- ionized zeolites, using low-temperature adsorption of H2 as the test. The IR spectra of H2 adsorbed on decationized mordenite and ZSM-5 zeolite at 77~K consists of five bands with max- ima at 4125, 4105, 4060, 4035, and 4010 cm -I.
Since the intensities of the high-frequency bands at 4125 and 4105 cm -I are lowered by high-temperature dehydroxylation, they should be assigned to H= molecules interacting with OH groups. In contrast, the intensities of the low-frequency bands at 4060, 4035, and 4010 cm-lincrease when the samples are vacuum-baked; we have assigned these bands to H2 inter- acting with Lewis acid centers that have been formed after removal of the structural OH groups. We have made a more precise assignment of each of these bands to defects of a par- ticular type by comparing the IR spectra of H2 adsorbed on specimens with different contents of A1 in the lattice, and also specimens that had been subjected to different degrees of vacuum-baking.
41
Therefore, we ascribe the4035 ~m-~band toH2 molecules interacting with trigonally coor- dinated Si + ions, and the 4010 cm-~ band to hydrogen interacting with trigonal A1 atoms.
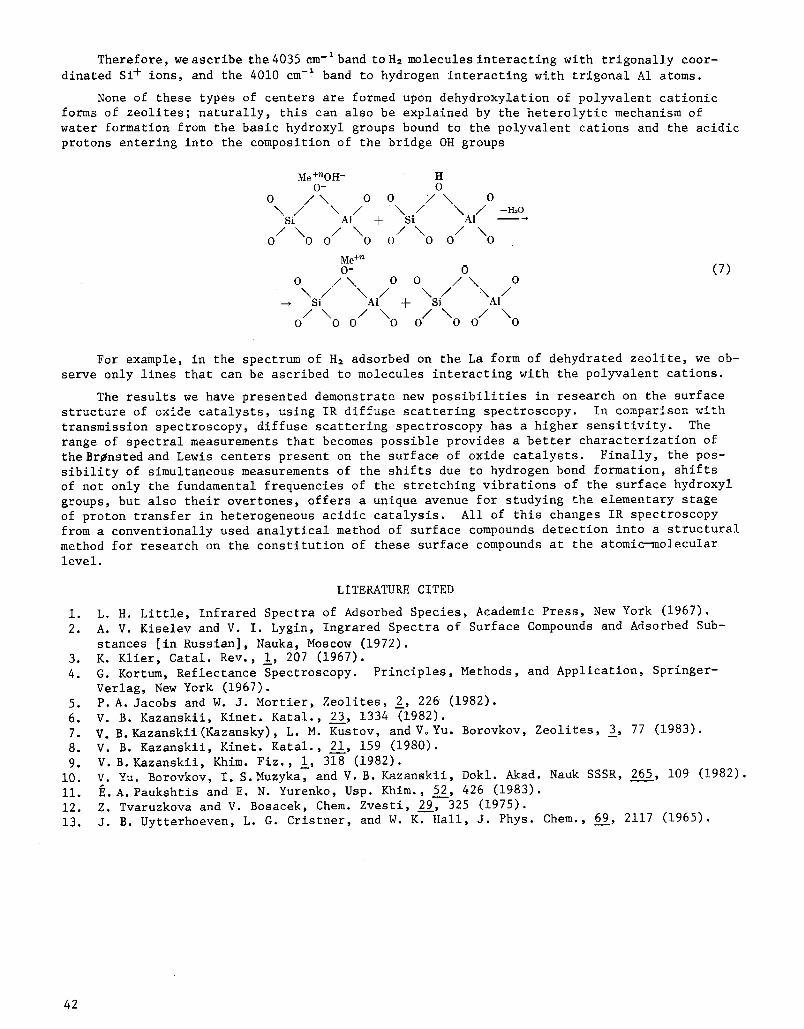
None of these types of centers are formed upon dehydroxylation of polyvalent cationic forms of zeolites; naturally, this can also be explained by the heterolytic mechanism of water formation from the basic hydroxyl groups bound to the polyvalent cations and the acidic protons entering into the composition of the bridge OH groups
Me +nOH- H O- 0
o / \ o o ; / \ o / \ / \ / ~,AI / --H20 " " S t hl + Si
/\0 / \ /\ / \ 0 0 0 0 0 0 0
Me +n O- 0
o / \ o o / \ o
_., \ S i / \ h l / + \ S i / 'XA1 /
/ \ / \ o / \ / \ o o o o o o o
(7)
For example, in the spectrum of H2 adsorbed on the La form of dehydrated zeolite, we ob- serve only lines that can be ascribed to molecules interacting with the polyvalent cations.
The results we have presented demonstrate new possibilities in research on the surface structure of oxide catalysts, using IR diffuse scattering spectroscopy. In comparison with transmission spectroscopy, diffuse scattering spectroscopy has a higher sensitivity. The range of spectral measurements that becomes possible provides a better characterization of the Br~nsted and Lewis centers present on the surface of oxide catalysts. Finally, the pos- sibility of simultaneous measurements of the shifts due to hydrogen bond formation, shifts of not only the fundamental frequencies of the stretching vibrations of the surface hydroxyl groups, but also their overtones, offers a unique avenue for studying the elementary stage of proton transfer in heterogeneous acidic catalysis. All of this changes IR spectroscopy from a conventionally used analytical method of surface compounds detection into a structural method for research on the constitution of these surface compounds at the atomic-molecular
level.
LITERATURE CITED
i. L. H. Little, Infrared Spectra of Adsorbed Species, Academic Press, New York (1967). 2. A. V. Kiselev and V. I. Lygin, Ingrared Spectra of Surface Compounds and Adsorbed Sub-
stances [in Russian], Nauka, Moscow (1972). K. Klier, Catal. Rev., ~, 207 (1967). G. Kortum, Reflectance Spectroscopy. Principles, Methods, and Application, Springer- Verlag, New York (1967).
5. P.A. Jacobs and W. J. Mortier, Zeolites, ~, 226 (1982). 6. V. B. Kazanskii, Kinet. Katal., 23, 1334 (1982). 7. V.B. Kazanskii(Kazansky), L. M. Kustov, and VoYu. Borovkov, Zeolites, ~, 77 (1983). 8. V. B. Kazanskii, Kinet. Katal., 21, 159 (1980).
V. B. Kazanskii, Khim. Fiz., ~, 318 (1982). V. Yu. Borovkov, I. S. Muzyka, and V. B. Kazanskii, Dokl. Akad. Nauk SSSR, 265, 109 (1982). E. A. Paukshtis and E. N. Yurenko, Usp. Khim., 52, 426 (1983). Z. Tvaruzkova and V. Bosacek, Chem. Zvesti, 29, 325 (1975). J. B. Uytterhoeven, L. G. Cristner, and W. K. Hall, J. Phys. Chem., 69, 2117 (1965).
.
4.
,
i0. ii. 12. 13.
42