Embed Size (px)
Citation preview
DIGESTER FOAMINGCAUSES AND SOLUTIONSCAUSES AND SOLUTIONS
CWEA Math Operations andCWEA Math, Operations, and Maintenance for Biosolids Systems
SeminarSeminarSeptember 13, 2011
Steve WalkerSenior Operations Specialist
sw51
0s1.
pptx
/1
LEARNING OBJECTIVESCauses• Process control
• Operational
• Process – digester internal
Control methods• Process control
• Operational awareness
• Process monitoringProcess monitoring
Physical improvements• Installed improvements
sw51
0s1.
pptx
/2
Installed improvements
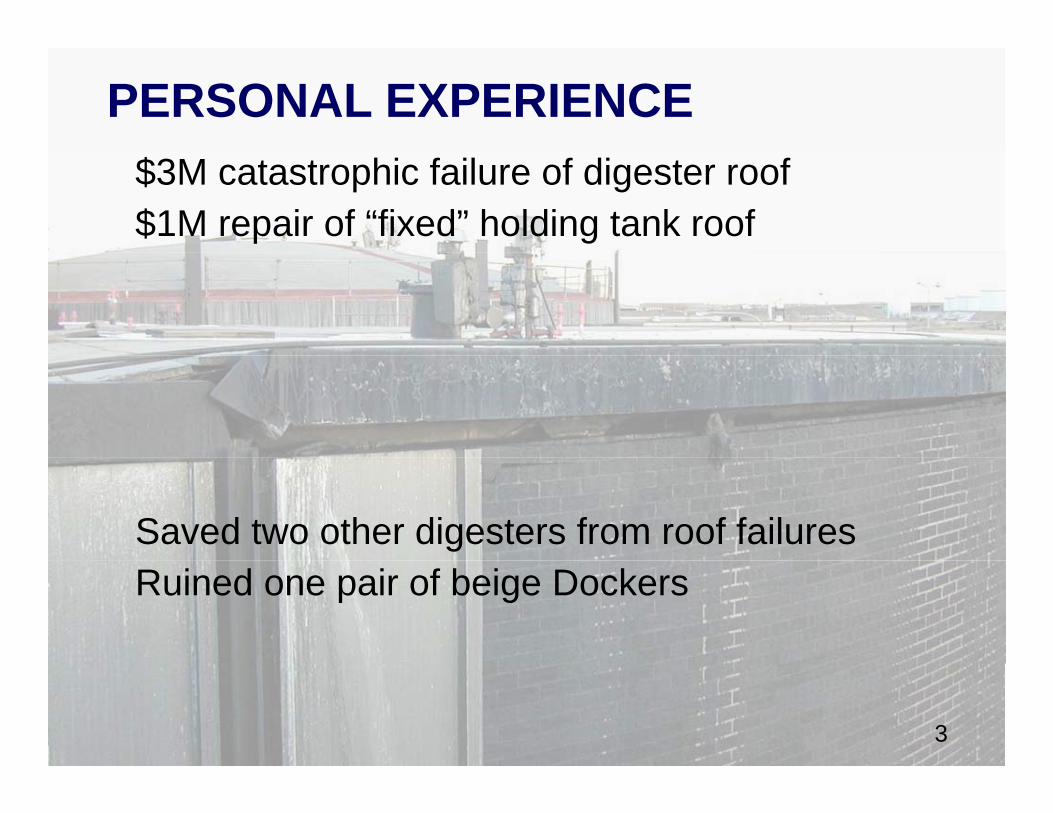
PERSONAL EXPERIENCE$3M catastrophic failure of digester roof$1M repair of “fixed” holding tank roof
Saved two other digesters from roof failuresRuined one pair of beige Dockers
sw51
0s1.
pptx
/3
3
WHAT CAUSED FAILURE• Over-wasted secondary
– FilamentsM h l d t i– Much more volume compared to primary
• Gas mixing system piping approach
• Plugged flame arrestors – from foam
L l i di t• Level indicator wrong– From foam entrained in contents
• Didn’t shut off mixer soon enough
• After first failure, reduced active volume created
sw51
0s1.
pptx
/4
,organic overload of other units in service (i/s)
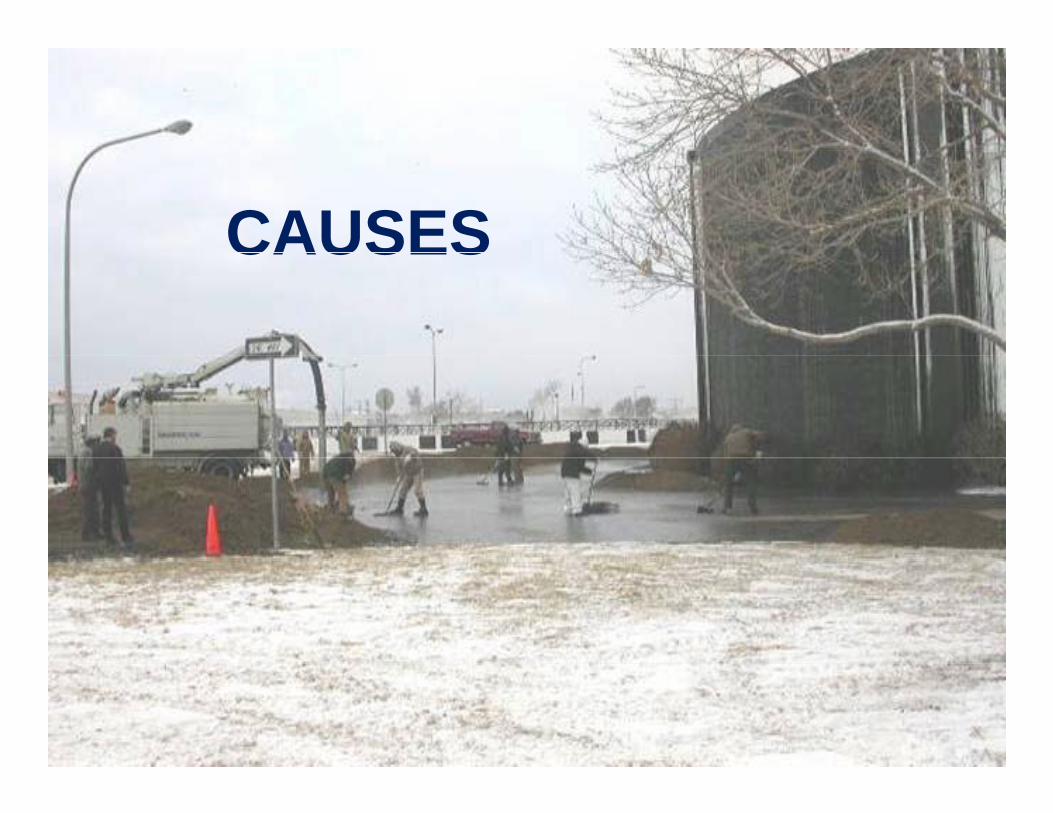
CAUSESCAUSES
sw51
0s1.
pptx
/5
PROCESS CONTROL CAUSES
• The blend of primary sludge to secondary sludgeThe more primary sludge the better– The more primary sludge, the better
– Measured as pound to pound, not gallon to gallon
• Excessive filaments in the secondary sludge– Nocardia and microthrix parvicella add bulk and p
structure to foam
• Feed fluctuationsFeed fluctuations– Both solids loading and volume
sw51
0s1.
pptx
/6
OPERATIONAL CAUSES
• Inadequate or inconsistent mixing– Rapid changes create unpredictable resultsRapid changes create unpredictable results
– Gas binding of pump used to mixing
• Excessive and/or fine bubble mixing – Can change the specific gravity and “fluff” the contents
• Rapid change in internal pressure– Cogeneration demandsCoge e at o de a ds
– Moisture in gas handling system
sw51
0s1.
pptx
/7
OPERATIONAL CAUSES • Insufficient volume
– Liquid level too low
– Processing volume taken up by grit or scum “raft”
U it t f i f i t t ti– Units out of service for maintenance or construction
– Results in solids loading rates greater than design
• Temperature fluctuations– Created by heating or feed disruptionsCreated by heating or feed disruptions
• Rapid change in liquid level
sw51
0s1.
pptx
/8
INTERNAL CAUSES
• Microorganisms competing for food– Acid formers vs. methane (alkalinity) formers
• Surfactants– Oil and greaseg
– Overdosed polymer in thickening or dewatering processes p
There are usually multiple contributors
sw51
0s1.
pptx
/9
POTENTIAL CONTROLPOTENTIAL CONTROL METHODS
sw51
0s1.
pptx
/10
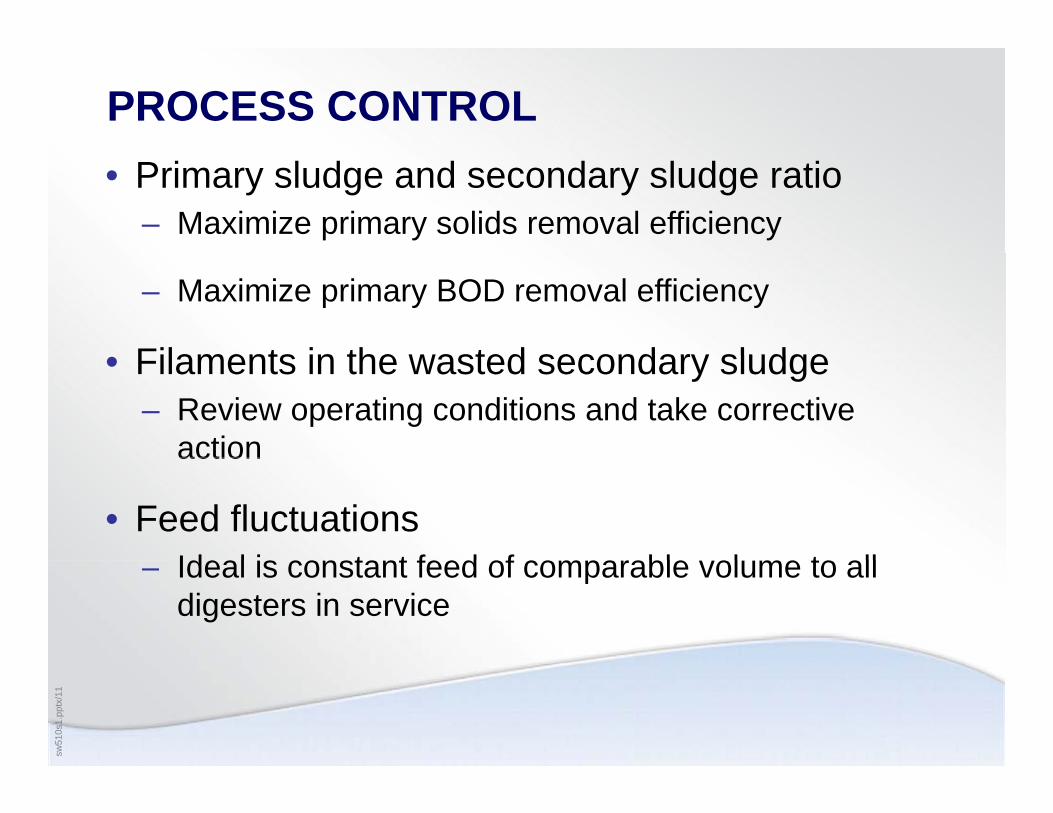
PROCESS CONTROL• Primary sludge and secondary sludge ratio
– Maximize primary solids removal efficiency
– Maximize primary BOD removal efficiency
Filaments in the wasted secondary sludge• Filaments in the wasted secondary sludge– Review operating conditions and take corrective
actionaction
• Feed fluctuationsIdeal is constant feed of comparable ol me to all– Ideal is constant feed of comparable volume to all digesters in service
sw51
0s1.
pptx
/11
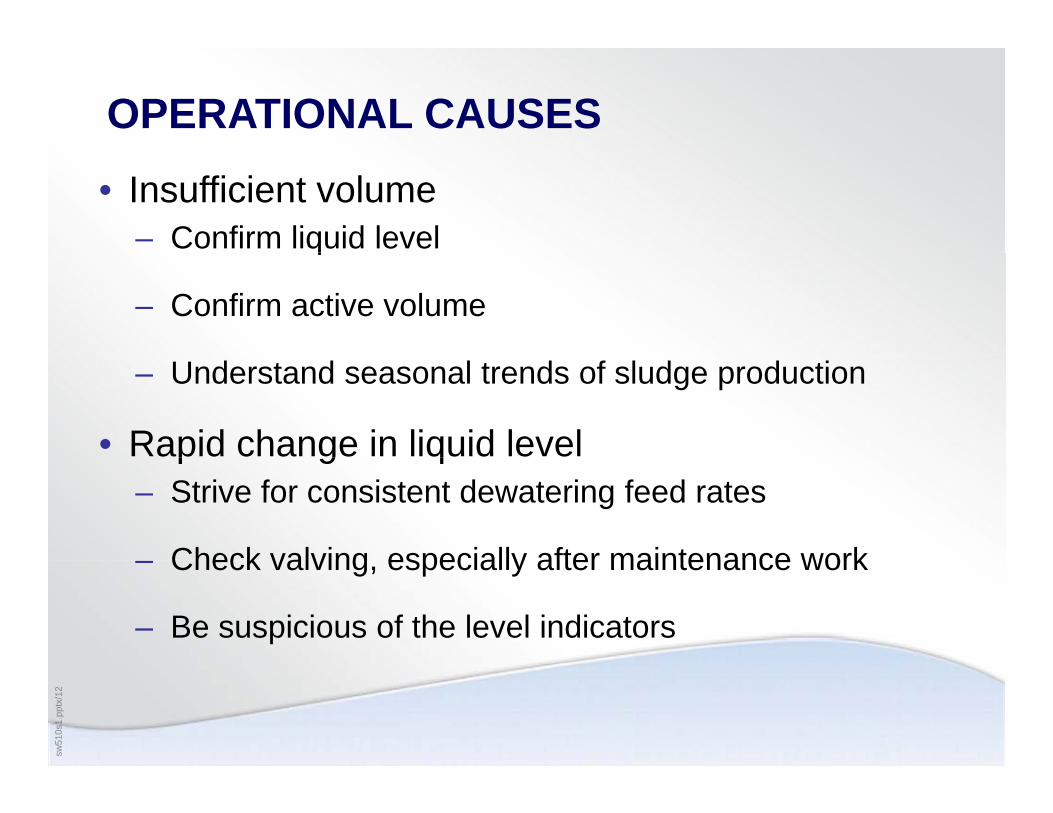
OPERATIONAL CAUSES
• Insufficient volume– Confirm liquid levelq
– Confirm active volume
– Understand seasonal trends of sludge production
• Rapid change in liquid level p g q– Strive for consistent dewatering feed rates
Check valving especially after maintenance work– Check valving, especially after maintenance work
– Be suspicious of the level indicators
sw51
0s1.
pptx
/12
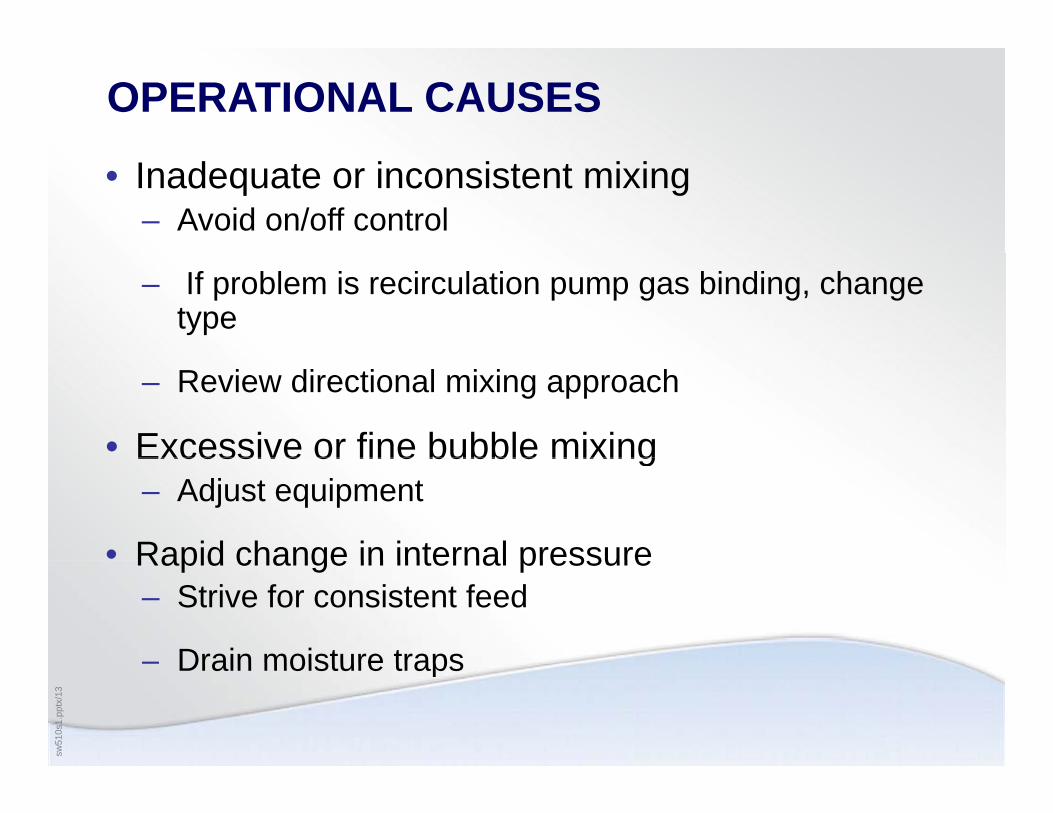
OPERATIONAL CAUSES
• Inadequate or inconsistent mixing– Avoid on/off control
– If problem is recirculation pump gas binding, change type
– Review directional mixing approach
• Excessive or fine bubble mixingExcessive or fine bubble mixing – Adjust equipment
• Rapid change in internal pressureRapid change in internal pressure– Strive for consistent feed
– Drain moisture traps
sw51
0s1.
pptx
/13
– Drain moisture traps
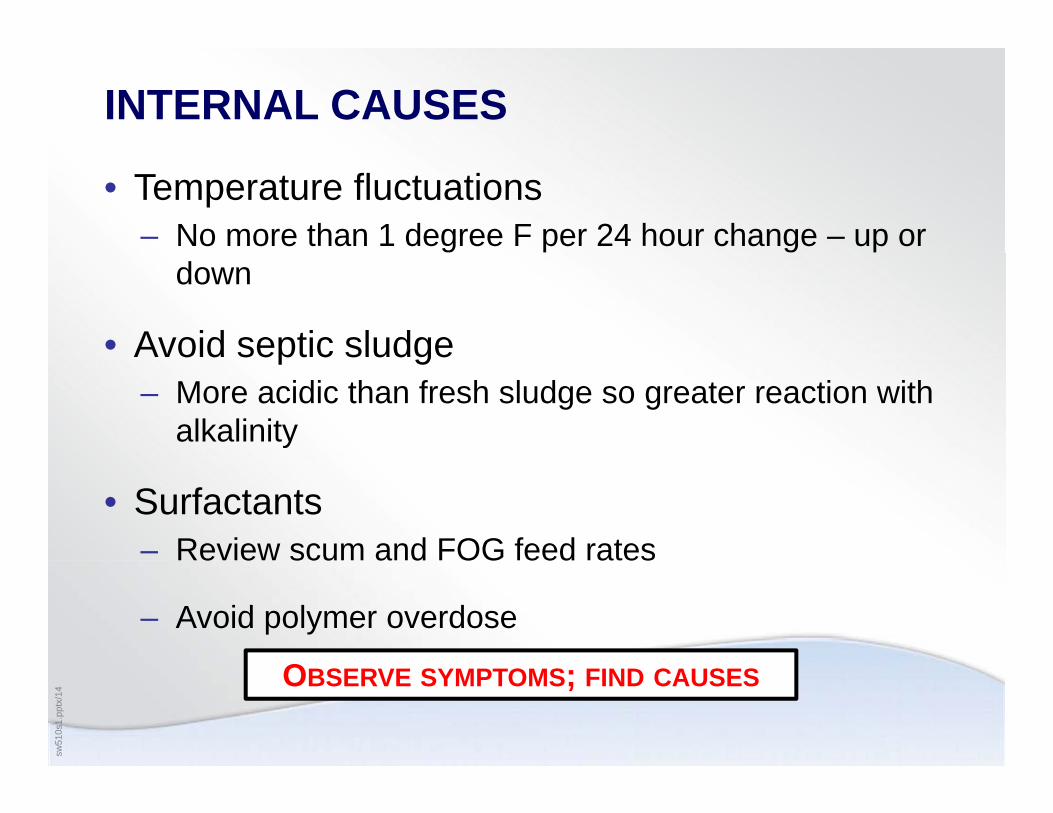
INTERNAL CAUSES
• Temperature fluctuations– No more than 1 degree F per 24 hour change – up or
down
• Avoid septic sludgeAvoid septic sludge– More acidic than fresh sludge so greater reaction with
alkalinity
• Surfactants– Review scum and FOG feed ratese e scu a d OG eed a es
– Avoid polymer overdose
O
sw51
0s1.
pptx
/14 OBSERVE SYMPTOMS; FIND CAUSES
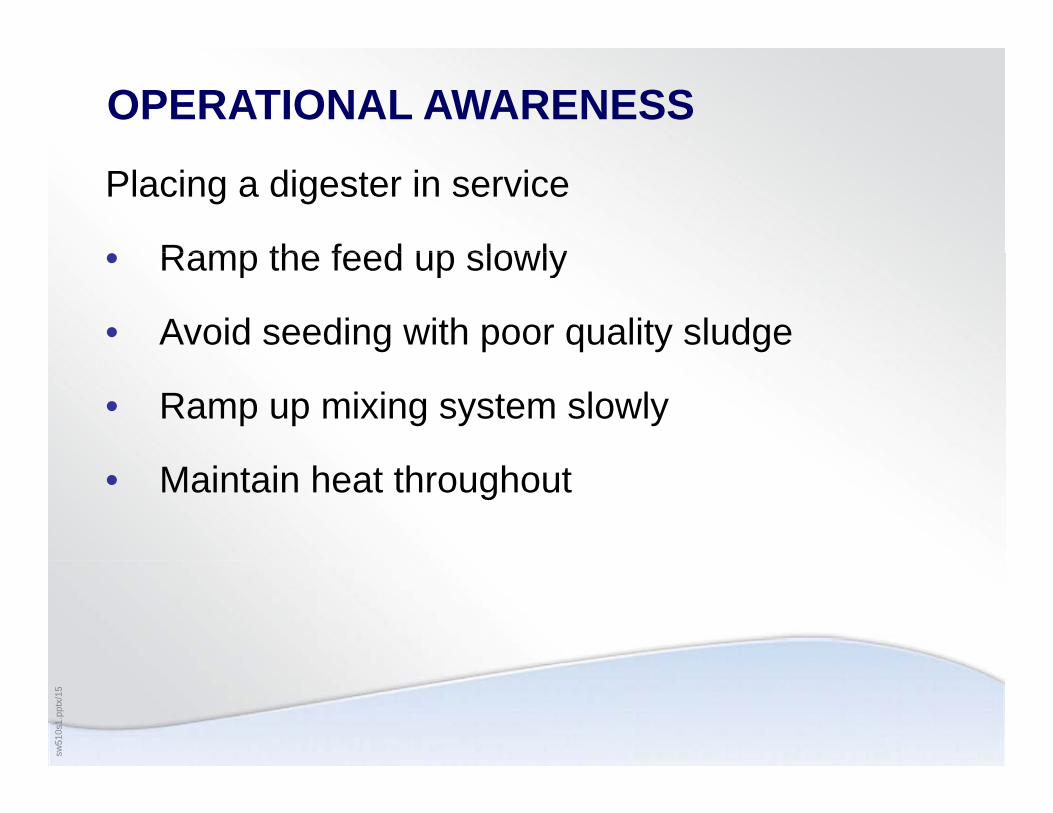
OPERATIONAL AWARENESS
Placing a digester in service
• Ramp the feed up slowly• Ramp the feed up slowly
• Avoid seeding with poor quality sludge
• Ramp up mixing system slowly
• Maintain heat throughout
sw51
0s1.
pptx
/15
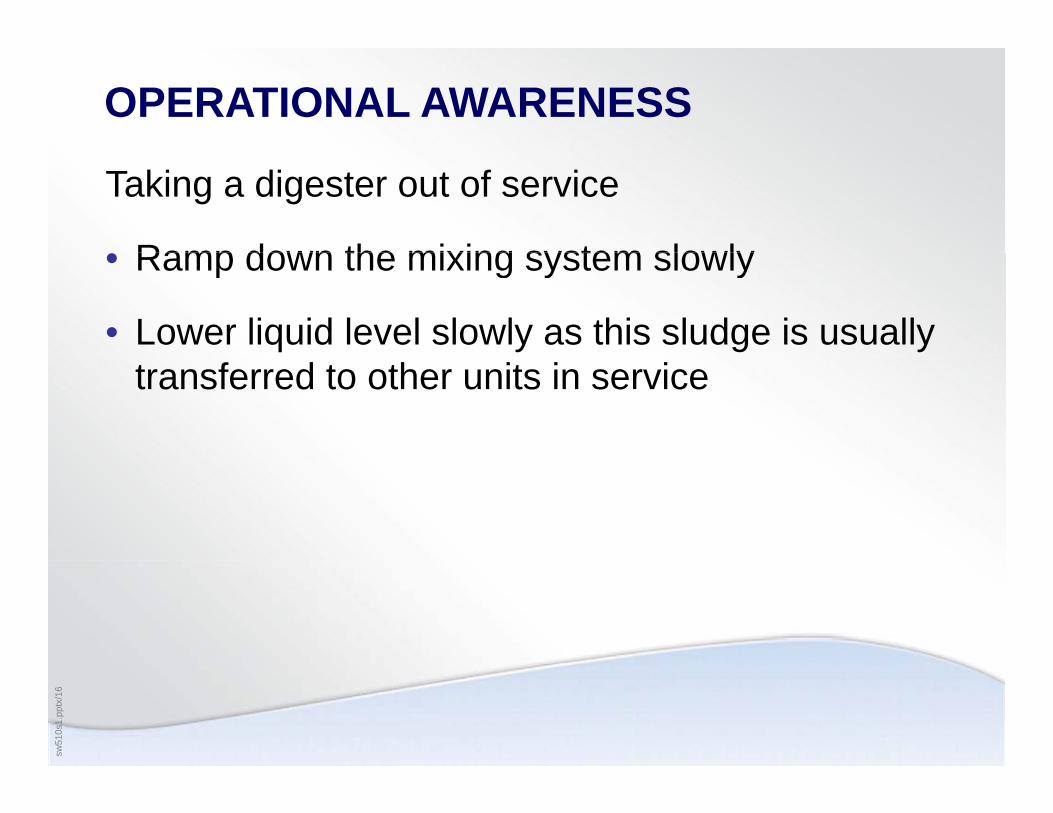
OPERATIONAL AWARENESS
Taking a digester out of service
• Ramp down the mixing system slowly• Ramp down the mixing system slowly
• Lower liquid level slowly as this sludge is usually transferred to other units in service
sw51
0s1.
pptx
/16
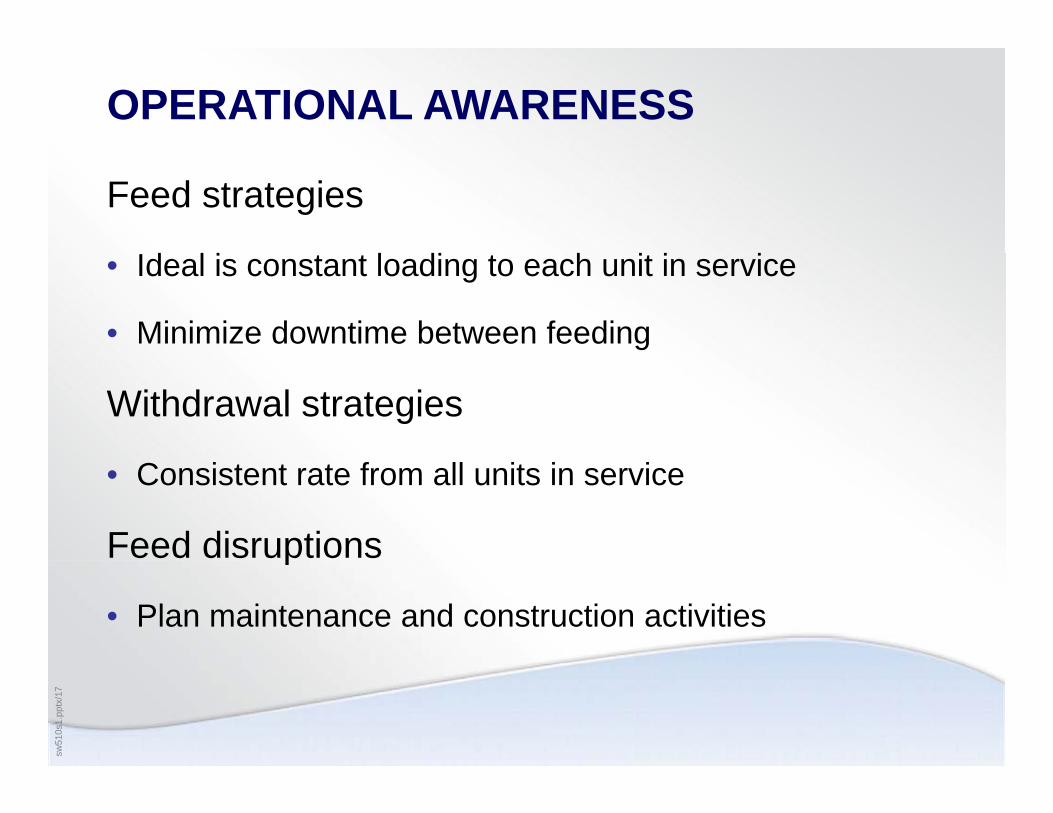
OPERATIONAL AWARENESS
Feed strategies
• Ideal is constant loading to each unit in service
• Minimize downtime between feeding
Withdrawal strategies
• Consistent rate from all units in service
Feed disruptionsp
• Plan maintenance and construction activities
sw51
0s1.
pptx
/17
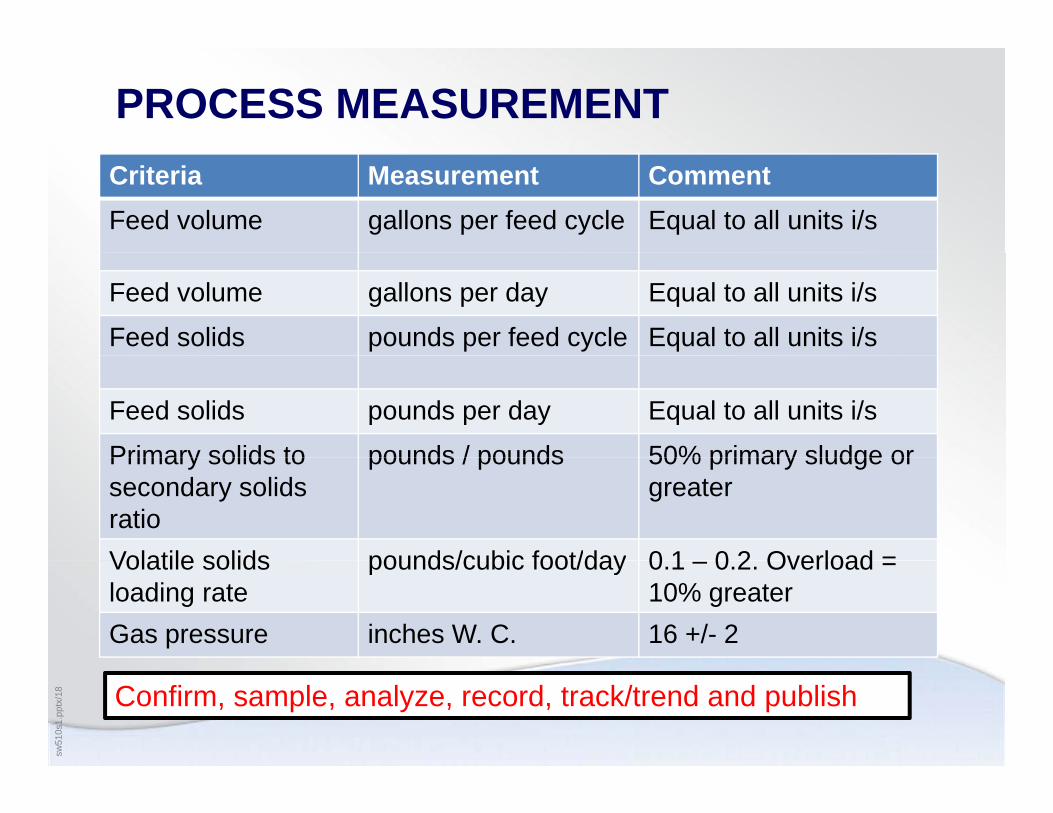
PROCESS MEASUREMENTCriteria Measurement CommentFeed volume gallons per feed cycle Equal to all units i/s
Feed volume gallons per day Equal to all units i/s
Feed solids pounds per feed cycle Equal to all units i/s
Feed solids pounds per day Equal to all units i/s
Primary solids to pounds / pounds 50% primary sludge orPrimary solids to secondary solids ratio
pounds / pounds 50% primary sludge or greater
Volatile solids pounds/cubic foot/day 0 1 0 2 Overload =Volatile solids loading rate
pounds/cubic foot/day 0.1 – 0.2. Overload = 10% greater
Gas pressure inches W. C. 16 +/- 2
sw51
0s1.
pptx
/18 Confirm, sample, analyze, record, track/trend and publish
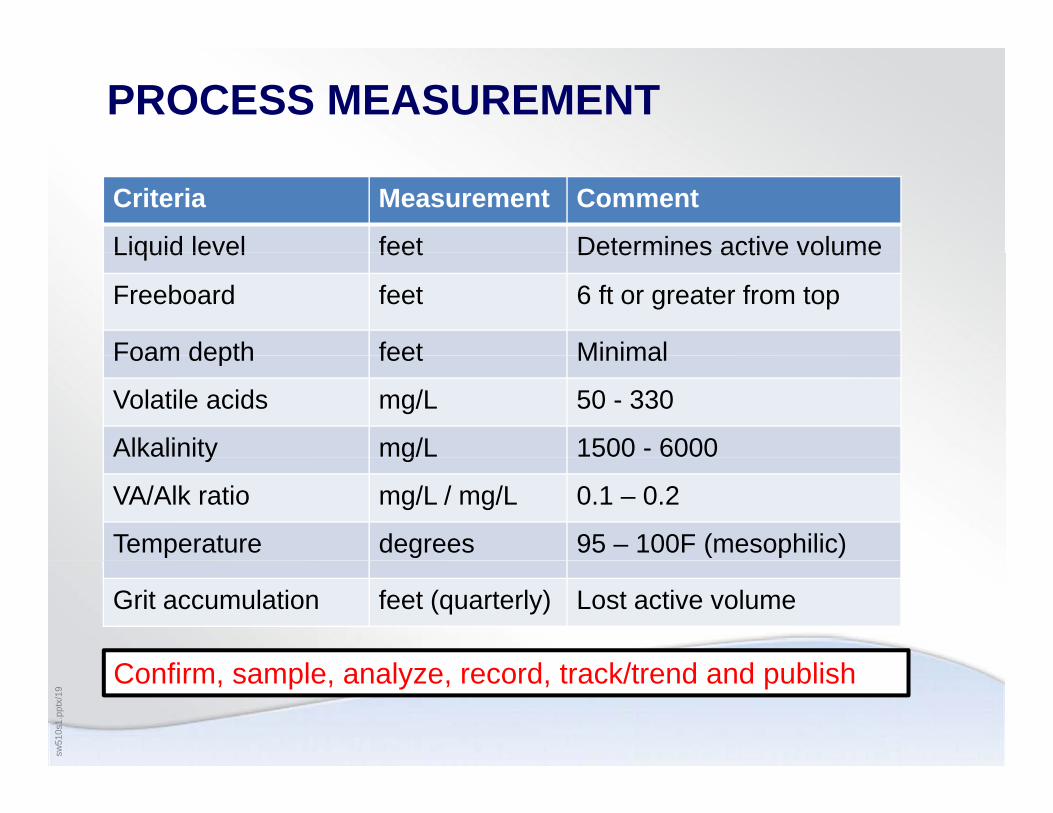
PROCESS MEASUREMENT
Criteria Measurement Comment
Liquid level feet Determines active volumeLiquid level feet Determines active volume
Freeboard feet 6 ft or greater from top
Foam depth feet MinimalFoam depth feet Minimal
Volatile acids mg/L 50 - 330
Alkalinity mg/L 1500 - 6000y g
VA/Alk ratio mg/L / mg/L 0.1 – 0.2
Temperature degrees 95 – 100F (mesophilic)
C fi l l d t k/t d d bli h
Grit accumulation feet (quarterly) Lost active volume
sw51
0s1.
pptx
/19
Confirm, sample, analyze, record, track/trend and publish
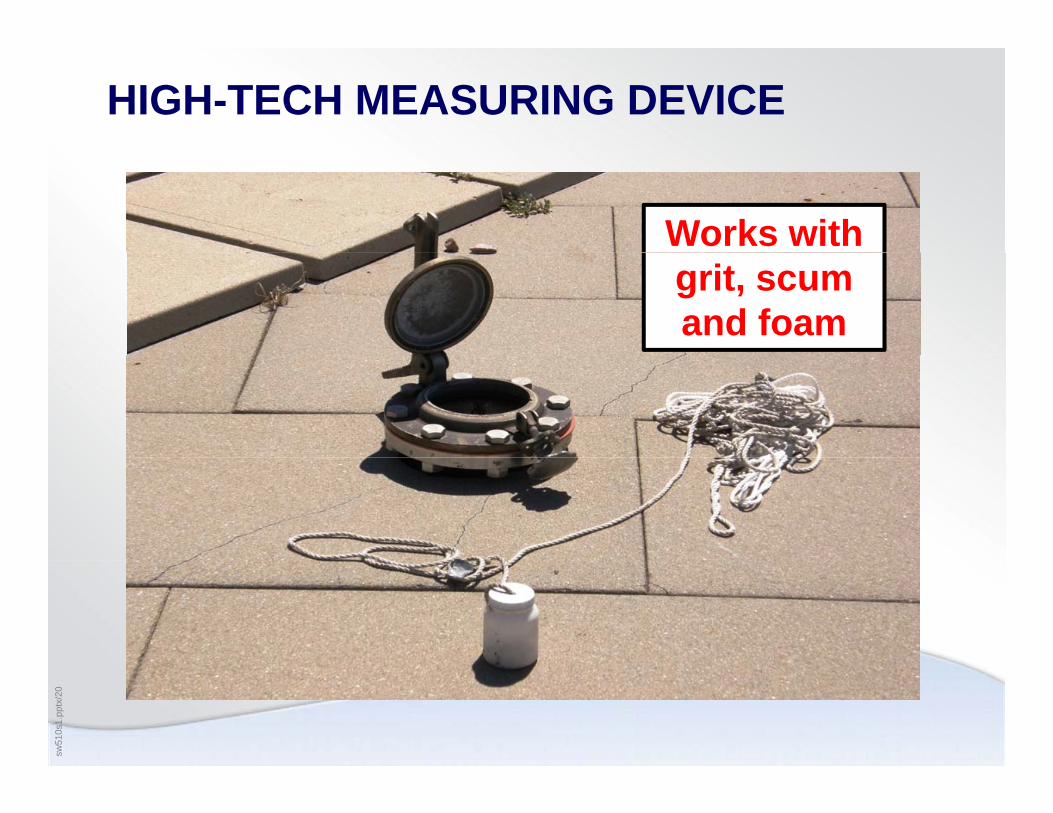
HIGH-TECH MEASURING DEVICE
Works with grit, scum and foam
sw51
0s1.
pptx
/20
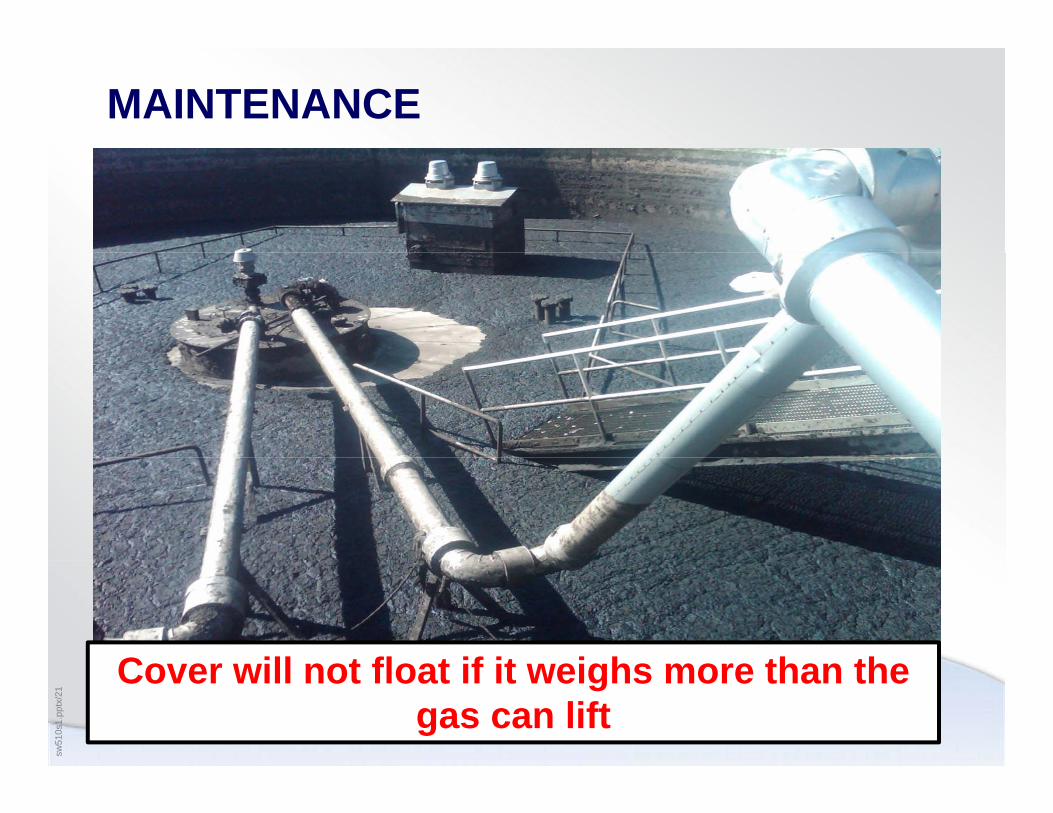
MAINTENANCE
C ill t fl t if it i h th th
sw51
0s1.
pptx
/21
Cover will not float if it weighs more than the gas can lift
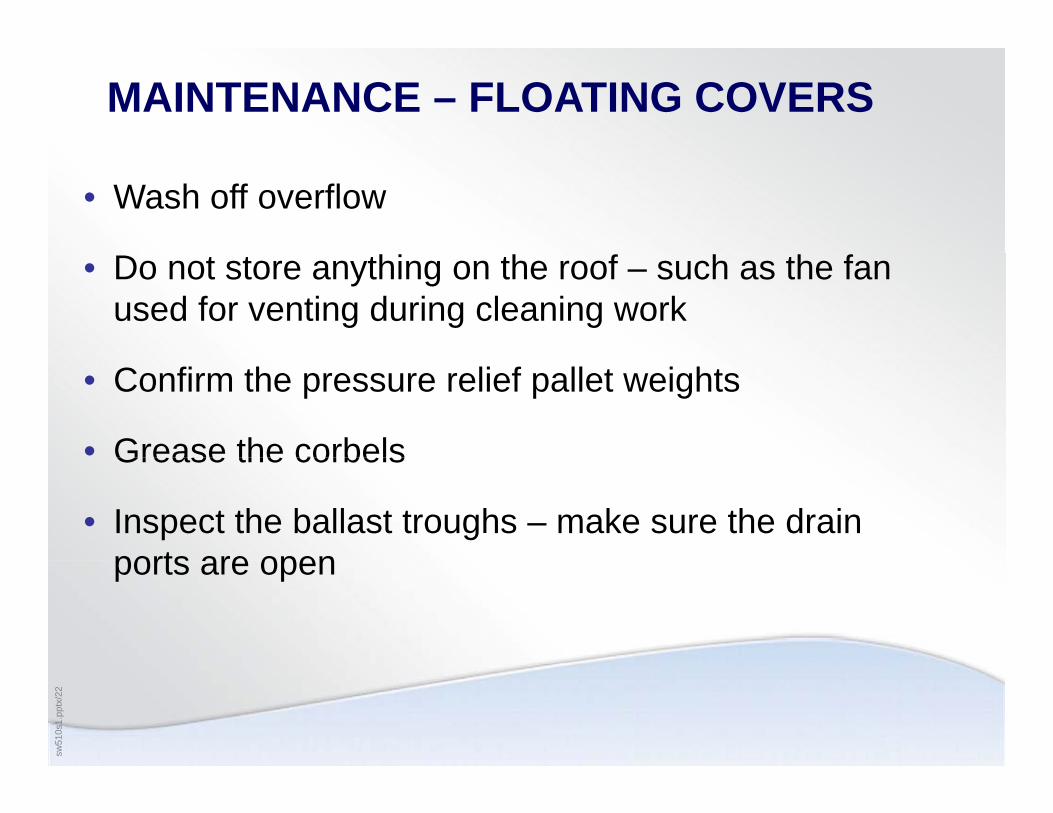
MAINTENANCE – FLOATING COVERS
• Wash off overflow
• Do not store anything on the roof – such as the fan used for venting during cleaning work
• Confirm the pressure relief pallet weights
• Grease the corbelsGrease the corbels
• Inspect the ballast troughs – make sure the drain ports are openports are open
sw51
0s1.
pptx
/22
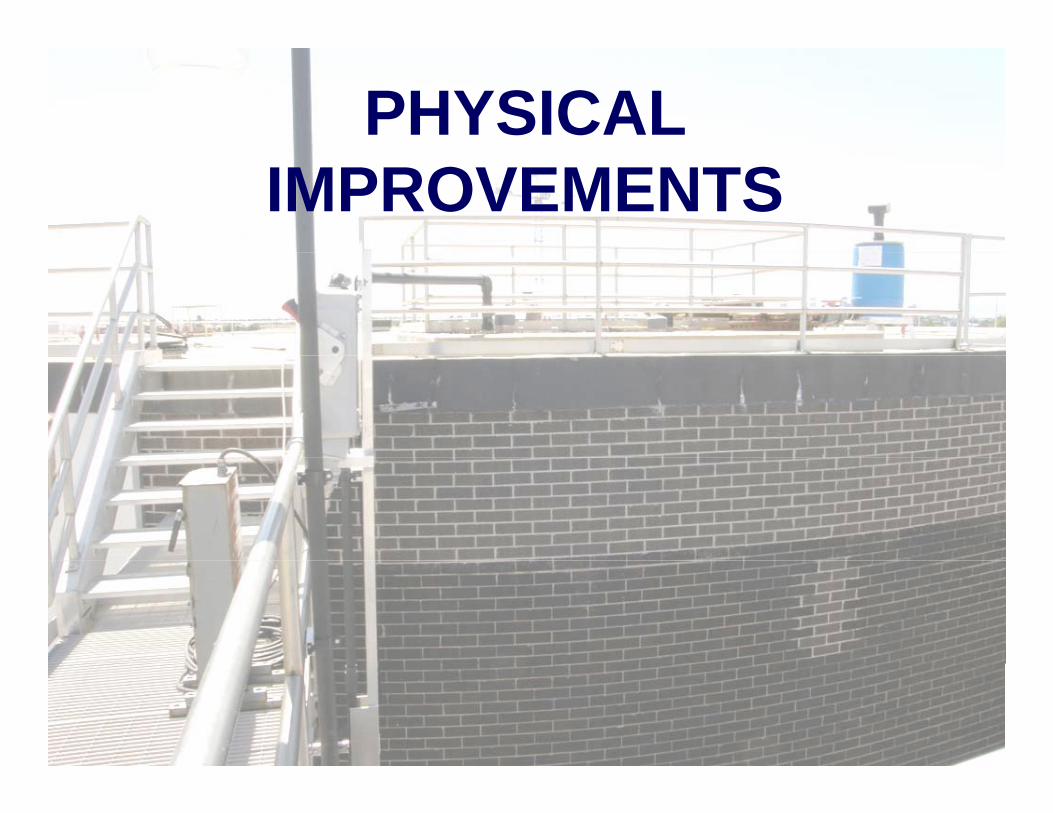
PHYSICAL IMPROVEMENTS
sw51
0s1.
pptx
/23
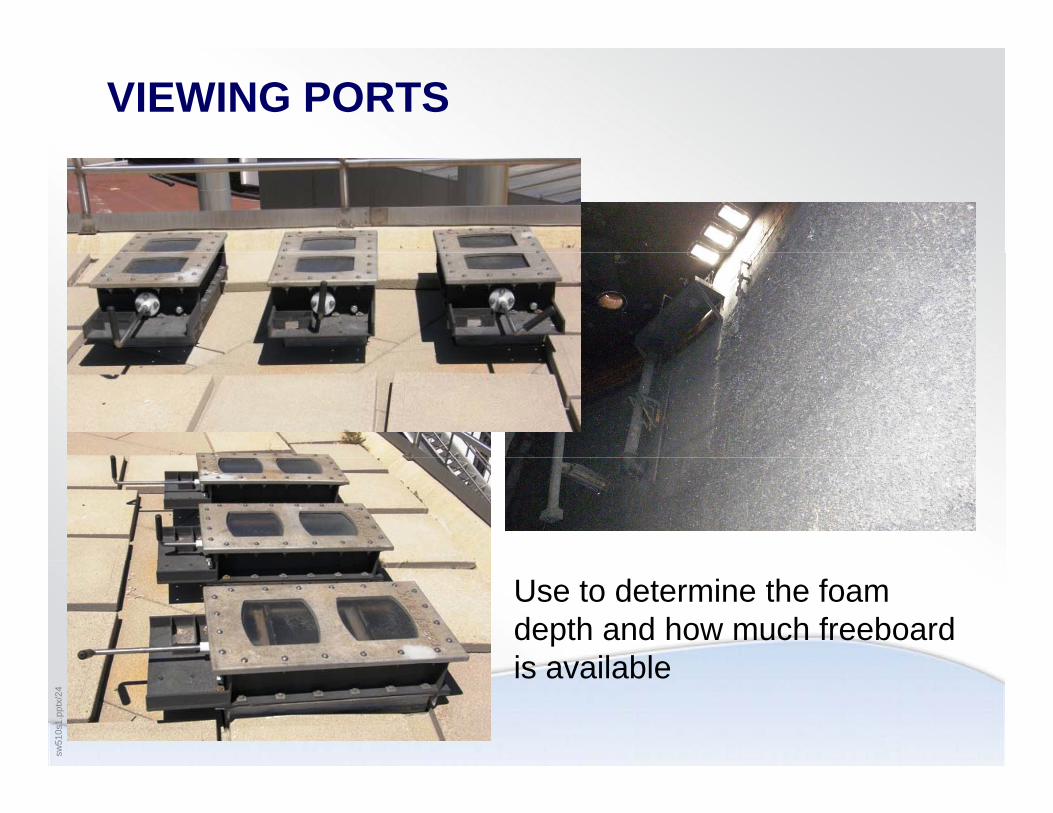
VIEWING PORTS
Use to determine the foam depth and how much freeboard is available
sw51
0s1.
pptx
/24
is available
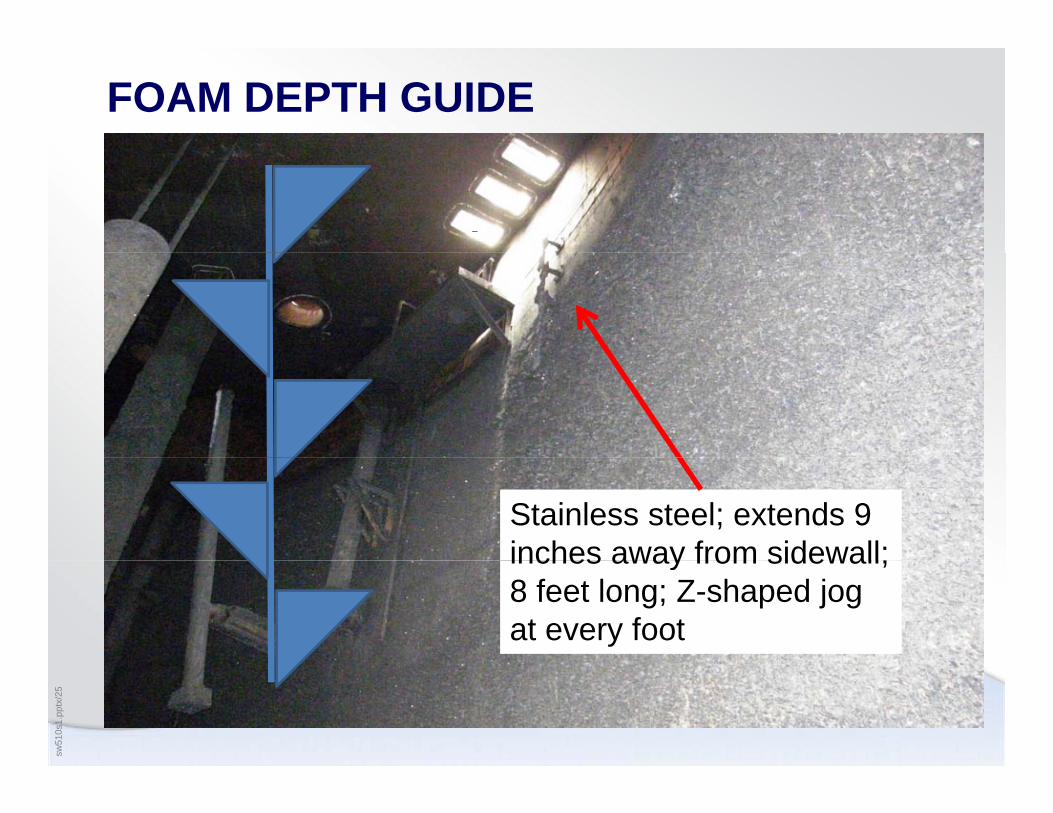
FOAM DEPTH GUIDE
Stainless steel; extends 9 inches away from sidewall;inches away from sidewall; 8 feet long; Z-shaped jog at every foot
sw51
0s1.
pptx
/25
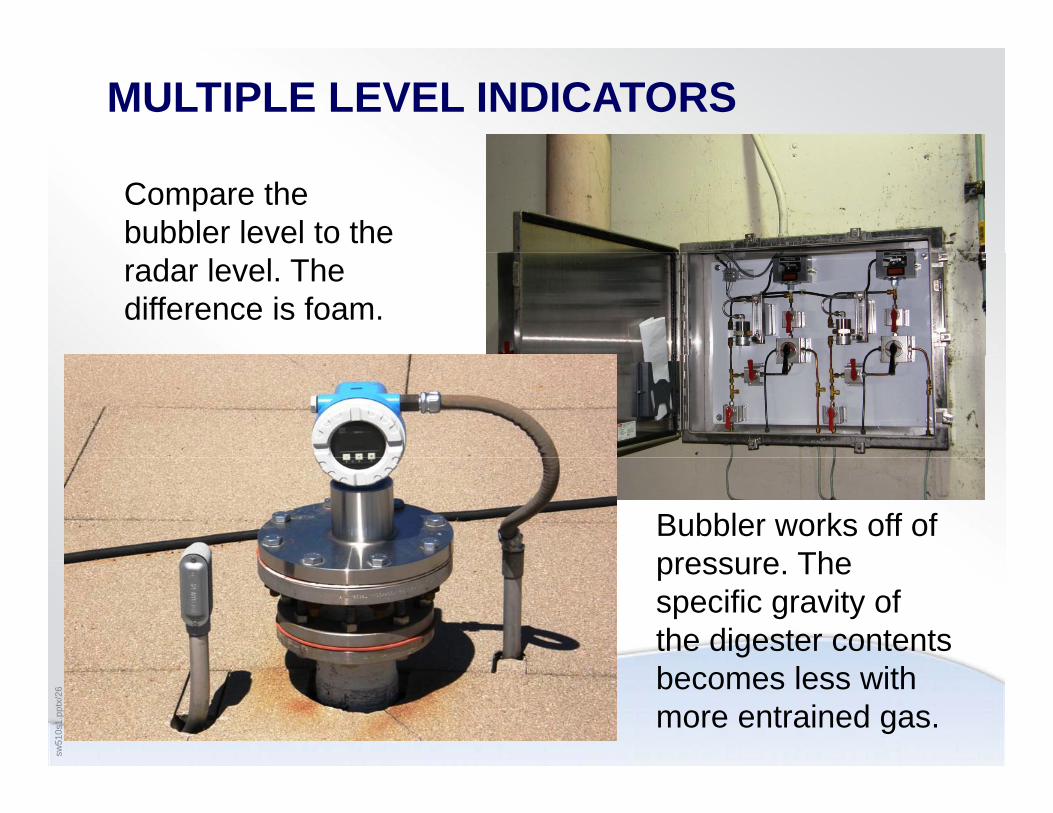
MULTIPLE LEVEL INDICATORS
Compare the bubbler level to the radar level. The difference is foam.
Bubbler works off of pressure Thepressure. The specific gravity of the digester contents
sw51
0s1.
pptx
/26 becomes less with
more entrained gas.
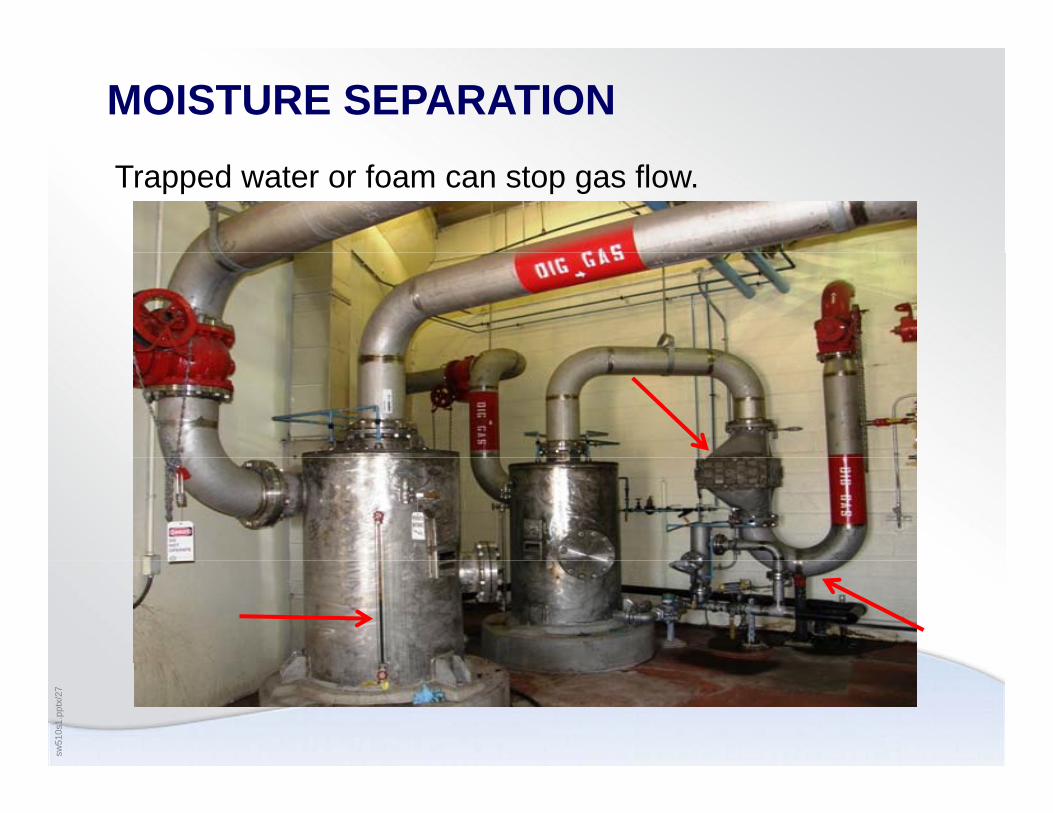
MOISTURE SEPARATIONTrapped water or foam can stop gas flow.
sw51
0s1.
pptx
/27
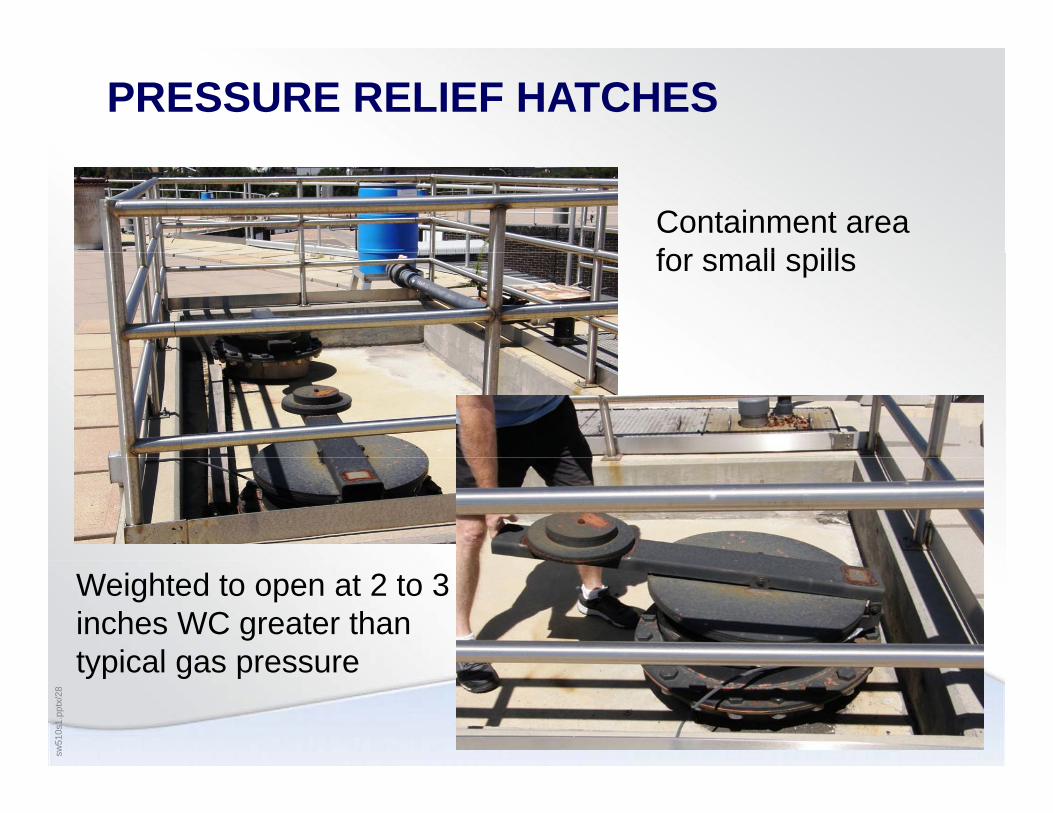
PRESSURE RELIEF HATCHES
Containment area f ll illfor small spills
Weighted to open at 2 to 3 inches WC greater than typical gas pressure
sw51
0s1.
pptx
/28
typical gas pressure
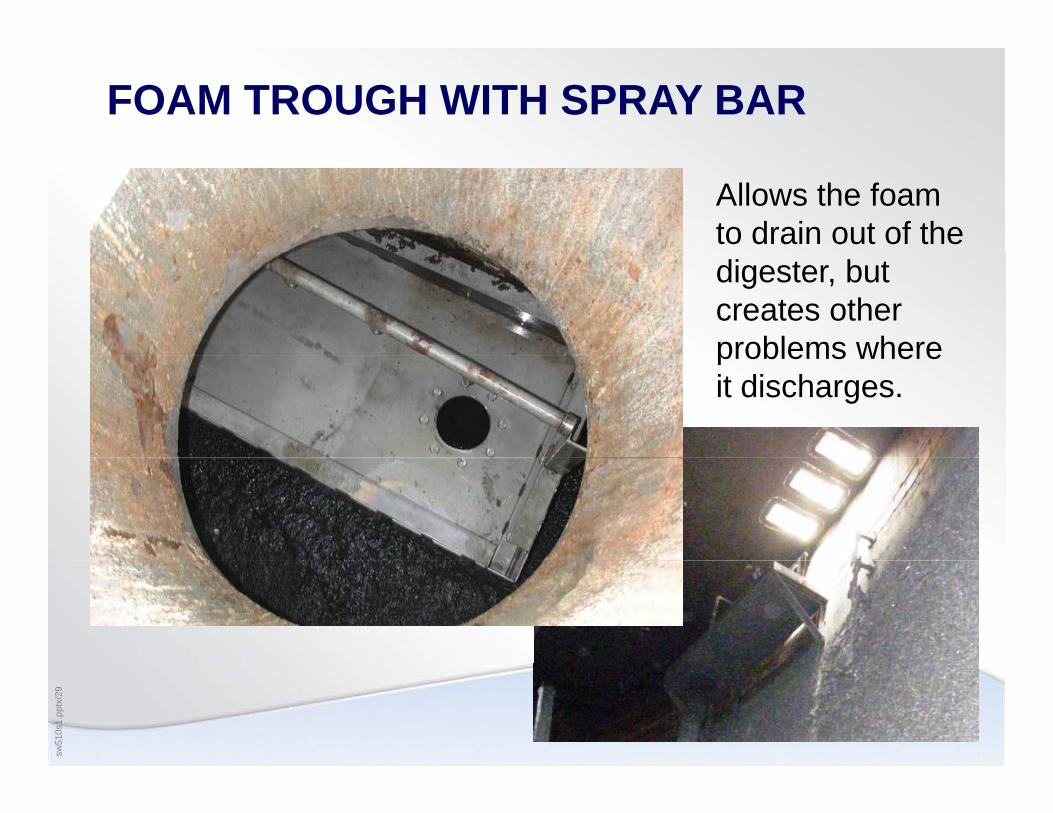
FOAM TROUGH WITH SPRAY BAR
Allows the foam to drain out of the digester, but creates other problems whereproblems where it discharges.
sw51
0s1.
pptx
/29
WHAT WAS DISCUSSEDCauses• Process control
• Operational
• Process - internal
Control methods• Process control
• Operational awareness
• Process monitoringProcess monitoring
Physical improvements• Installed improvements
sw51
0s1.
pptx
/30
Installed improvements

DIGESTER FOAMINGDIGESTER FOAMINGCAUSES AND SOLUTIONS
Thank you for being a wastewater treatment professional. Be proud of your contributions.
sw51
0s1.
pptx
/31
professional. Be proud of your contributions.