Embed Size (px)
Citation preview
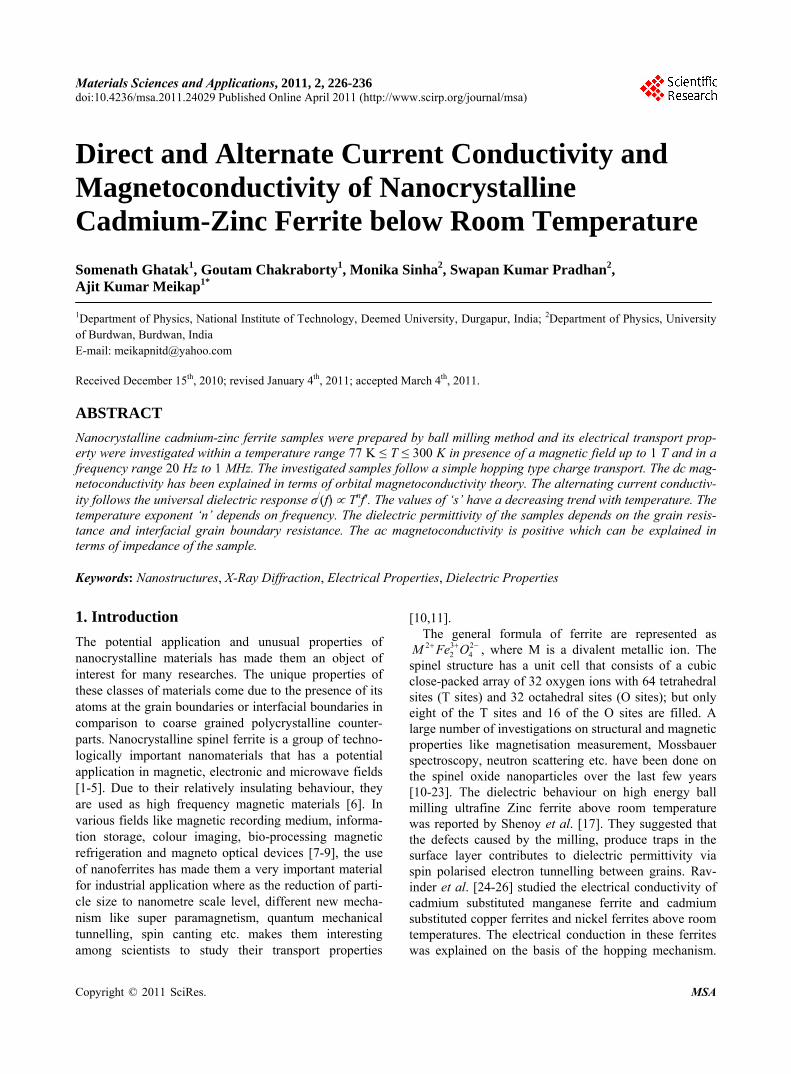
Materials Sciences and Applications, 2011, 2, 226-236 doi:10.4236/msa.2011.24029 Published Online April 2011 (http://www.scirp.org/journal/msa)
Copyright © 2011 SciRes. MSA
Direct and Alternate Current Conductivity and Magnetoconductivity of Nanocrystalline Cadmium-Zinc Ferrite below Room Temperature
Somenath Ghatak1, Goutam Chakraborty1, Monika Sinha2, Swapan Kumar Pradhan2, Ajit Kumar Meikap1* 1Department of Physics, National Institute of Technology, Deemed University, Durgapur, India; 2Department of Physics, University of Burdwan, Burdwan, India E-mail: [email protected] Received December 15th, 2010; revised January 4th, 2011; accepted March 4th, 2011.
ABSTRACT
Nanocrystalline cadmium-zinc ferrite samples were prepared by ball milling method and its electrical transport prop-erty were investigated within a temperature range 77 K ≤ T ≤ 300 K in presence of a magnetic field up to 1 T and in a frequency range 20 Hz to 1 MHz. The investigated samples follow a simple hopping type charge transport. The dc mag-netoconductivity has been explained in terms of orbital magnetoconductivity theory. The alternating current conductiv-ity follows the universal dielectric response σ/(f) Tnfs. The values of ‘s’ have a decreasing trend with temperature. The temperature exponent ‘n’ depends on frequency. The dielectric permittivity of the samples depends on the grain resis-tance and interfacial grain boundary resistance. The ac magnetoconductivity is positive which can be explained in terms of impedance of the sample. Keywords: Nanostructures, X-Ray Diffraction, Electrical Properties, Dielectric Properties
1. Introduction
The potential application and unusual properties of nanocrystalline materials has made them an object of interest for many researches. The unique properties of these classes of materials come due to the presence of its atoms at the grain boundaries or interfacial boundaries in comparison to coarse grained polycrystalline counter-parts. Nanocrystalline spinel ferrite is a group of techno-logically important nanomaterials that has a potential application in magnetic, electronic and microwave fields [1-5]. Due to their relatively insulating behaviour, they are used as high frequency magnetic materials [6]. In various fields like magnetic recording medium, informa-tion storage, colour imaging, bio-processing magnetic refrigeration and magneto optical devices [7-9], the use of nanoferrites has made them a very important material for industrial application where as the reduction of parti-cle size to nanometre scale level, different new mecha-nism like super paramagnetism, quantum mechanical tunnelling, spin canting etc. makes them interesting among scientists to study their transport properties
[10,11]. The general formula of ferrite are represented as 2 3 2
2 4 M Fe O , where M is a divalent metallic ion. The
spinel structure has a unit cell that consists of a cubic close-packed array of 32 oxygen ions with 64 tetrahedral sites (T sites) and 32 octahedral sites (O sites); but only eight of the T sites and 16 of the O sites are filled. A large number of investigations on structural and magnetic properties like magnetisation measurement, Mossbauer spectroscopy, neutron scattering etc. have been done on the spinel oxide nanoparticles over the last few years [10-23]. The dielectric behaviour on high energy ball milling ultrafine Zinc ferrite above room temperature was reported by Shenoy et al. [17]. They suggested that the defects caused by the milling, produce traps in the surface layer contributes to dielectric permittivity via spin polarised electron tunnelling between grains. Rav-inder et al. [24-26] studied the electrical conductivity of cadmium substituted manganese ferrite and cadmium substituted copper ferrites and nickel ferrites above room temperatures. The electrical conduction in these ferrites was explained on the basis of the hopping mechanism.
Direct and Alternate Current Conductivity and Magnetoconductivity of Nanocrystalline Cadmium-Zinc Ferrite 227below Room Temperature
They show a transition near the Curie temperature in the conductivity versus temperature curve and also suggested the activation energy in the ferromagnetic region is in general less than that in the paramagnetic region. But a systematic analysis on the electron transport mechanism of cadmium substituted zinc ferrite below room tem-perature is still lacking.
Thus, the detailed electrical transport properties like ac and dc conductivity, ac and dc magnetoconductivity and dielectric properties of nanocrystalline Cd-Zn ferities re- ported within a temperature range 77 to 300 K and a fre-quency range 20 Hz to 1 MHz in presence as well as ab-sence of a magnetic field up to 1 T.
2. Experimental
Accurately weighed starting powders of CdO (M/S Merck, 98% purity), ZnO (M/S Merck, 99% purity) and α-Fe2O3 (M/S Glaxo, 99% purity) taken in 0.5:0.5:1 mol% were hand-ground by an agate mortar pestle in a doubly distilled acetone medium for more than 5 h. The dried homogeneous powder mixture was then termed as un-milled (0 h) stoichiometric homogeneous powder mix-ture. A part of this mixture was ball milled for 3 h, 8 h, 20 h and 25 h duration at room temperature in air in a planetary ball mill (Model P5, M/S Fritsch, GmbH, Germany), keeping the disk rotation speed = 300 rpm and that of the vials~450 rpm respectively. Milling was done in hardened chrome steel vial of volume 80 ml us-ing 30 hardened chrome steel ball of 10 mm dia, at ball to powder mass ratio 40:1.
The X-ray powder diffraction profiles of unmilled and all ball milled samples were recorded (step size = 0.02˚ (2), counting time = 5 s, angular range = 15˚ - 80˚ 2) using Ni-filtered CuKα radiation from a highly stabilized and automated Philips generator (PW1830) operated at 40 kV and 20 mA. The generator is coupled with a Phil-ips X-ray powder diffractometer consisting of a PW 3710 mpd controller, PW1050/37 goniometer and a propor-tional counter.
The Rietveld’s analysis based on structure and micro-structure refinement method [27-31] has been employed which is considered to be the best method for micro-structure characterization and quantitative estimations of multiphase nanocrystalline material containing several number of overlapping reflections of ferrite phase for both the unmilled and ball milled powder sample.
The electrical conductivity of the samples was meas-ured by a standard four probe method by using 81/2-digit Agilent 3458 multimeter and 6514 Keithley Electrometer. The ac measurement was carried out with a 4284A “Agilent Impedance” analyzer up to the frequency 1 MHz at different temperatures. Liquid nitrogen cryostat
was used to study the temperature dependent conductiv-ity by the ITC 502S Oxford temperature controller. To measure the ac response, samples were prepared as 1cm dia pellets by pressing the powder under a hydraulic pressure of 500 MPa. Fine copper wires were used as the connecting wire and silver paint was used as coating ma-terials. The experimental density of the pressed pellets has been calculated from the relation ρexp = m/r2h, where, m, r and h are mass, radius and thickness of the pellet respectively. The measured density lies in the range 5.12 g/cc to 6.38 g/cc. The percentage of error in determining the density is very small (0.21%). On the other hand density has been calculated from X-ray data by using the relation ρtheo = 8M/NAVcell, where, M is the molar mass of the sample, NA is the Avogadro’s number and Vcell is the unit cell volume. It is observed that the dexp is 80% to 84% of dtheo for the investigated samples. The capacitance (CP) and the dissipation factor (D) were measured at various frequencies and temperatures. The real part of ac conductivity, real and imaginary part of dielectric permittivity have been calculated using the relations σ/(f) = 2fε0ε
//(f), ε/(f) = CPd/ε0A and ε//(f) = ε/(f)D respectively, where ε0 = 8.854 10–12 F/m, A and d are the area and thickness of the sample respectively. CP is the capacitance measured in Farad; f is the fre-quency in Hz. The magnetoconductivity was measured in the same manner varying the transverse magnetic field B 1 T by using an electromagnet.
3. Results and Discussion
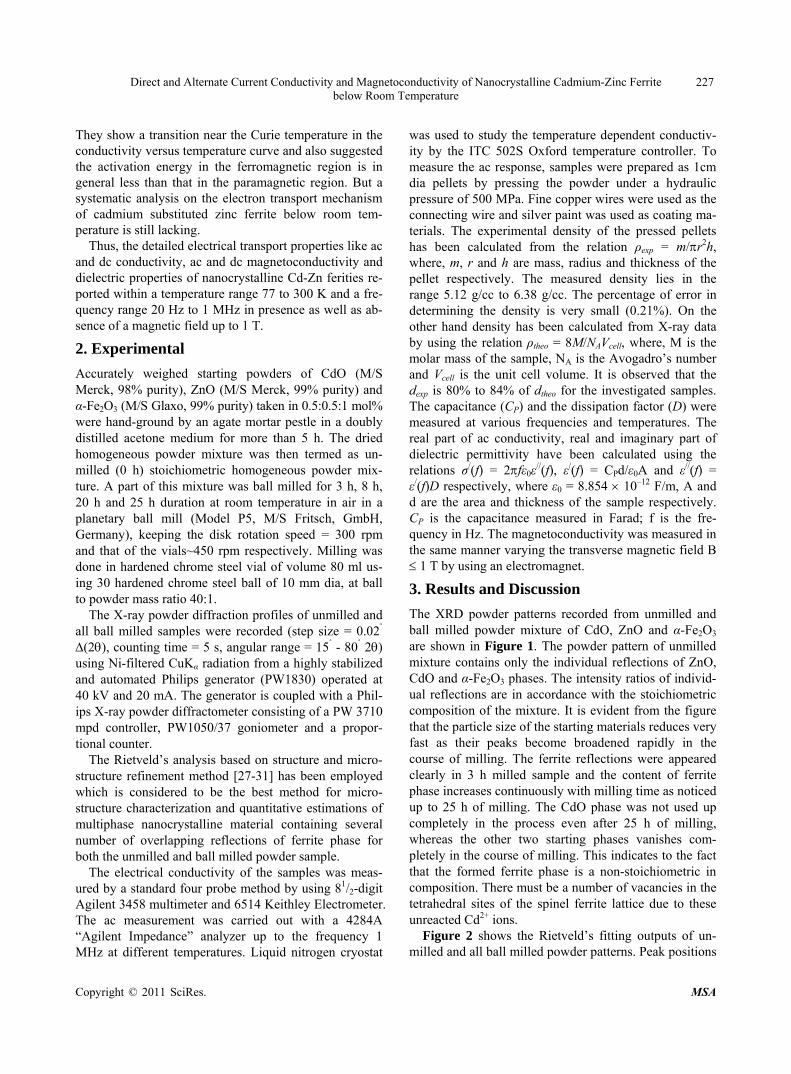
The XRD powder patterns recorded from unmilled and ball milled powder mixture of CdO, ZnO and α-Fe2O3 are shown in Figure 1. The powder pattern of unmilled mixture contains only the individual reflections of ZnO, CdO and α-Fe2O3 phases. The intensity ratios of individ-ual reflections are in accordance with the stoichiometric composition of the mixture. It is evident from the figure that the particle size of the starting materials reduces very fast as their peaks become broadened rapidly in the course of milling. The ferrite reflections were appeared clearly in 3 h milled sample and the content of ferrite phase increases continuously with milling time as noticed up to 25 h of milling. The CdO phase was not used up completely in the process even after 25 h of milling, whereas the other two starting phases vanishes com-pletely in the course of milling. This indicates to the fact that the formed ferrite phase is a non-stoichiometric in composition. There must be a number of vacancies in the tetrahedral sites of the spinel ferrite lattice due to these unreacted Cd2+ ions.
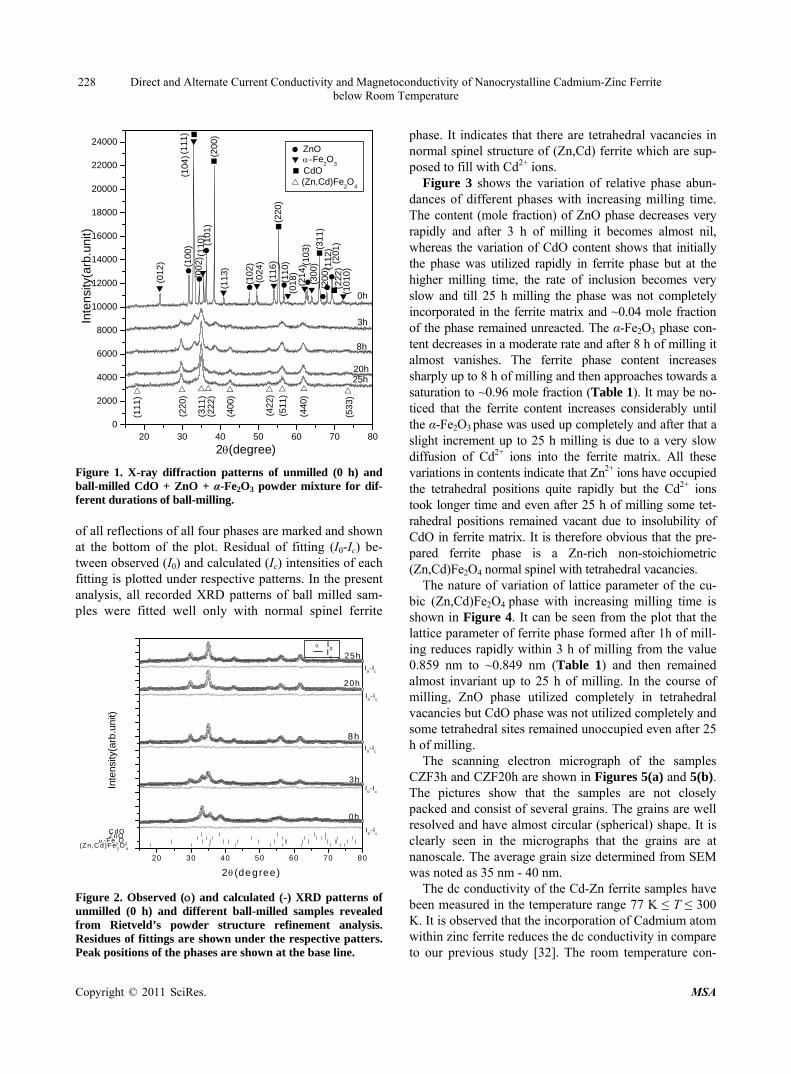
Figure 2 shows the Rietveld’s fitting outputs of un-milled and all ball milled powder patterns. Peak positions
Copyright © 2011 SciRes. MSA
Direct and Alternate Current Conductivity and Magnetoconductivity of Nanocrystalline Cadmium-Zinc Ferrite 228 below Room Temperature
20 30 40 50 60 70 800
2000
4000
6000
8000
10000
12000
14000
16000
18000
20000
22000
24000
(222
)
(533
)
(440
)
(511
)
(422
)
(400
)
(311
)
(220
)
(111
)
(101
0)(2
01)
(222
)(112
)(2
00)
(311
)(3
00)(1
03)
(214
)(0
18)
(110
)(2
20)
(116
)
(024
)(1
02)
(113
)(2
00)
(101
)(1
10)
(002
)
(104
)(11
1)(1
00)
(012
)
(Zn,Cd)Fe2O
4
CdO
ZnOFe
2O
3
25h
0h
3h
8h
20h
Inte
nsity
(arb
.uni
t)
2(degree)
Figure 1. X-ray diffraction patterns of unmilled (0 h) and ball-milled CdO + ZnO + α-Fe2O3 powder mixture for dif-ferent durations of ball-milling. of all reflections of all four phases are marked and shown at the bottom of the plot. Residual of fitting (I0-Ic) be-tween observed (I0) and calculated (Ic) intensities of each fitting is plotted under respective patterns. In the present analysis, all recorded XRD patterns of ball milled sam-ples were fitted well only with normal spinel ferrite
20 30 40 50 60 70 80
I
c
I0
I0-I
c
I0-I
c
I0-I
c
I0-I
c
I0-I
c
(Zn ,C d)Fe2O
4
-Fe2O
3
ZnOC dO
8h
25h
20h
3h
0h
Inte
nsity
(arb
.uni
t)
2 (degree)
Figure 2. Observed () and calculated (-) XRD patterns of unmilled (0 h) and different ball-milled samples revealed from Rietveld’s powder structure refinement analysis. Residues of fittings are shown under the respective patters. Peak positions of the phases are shown at the base line.
phase. It indicates that there are tetrahedral vacancies in normal spinel structure of (Zn,Cd) ferrite which are sup-posed to fill with Cd2+ ions.
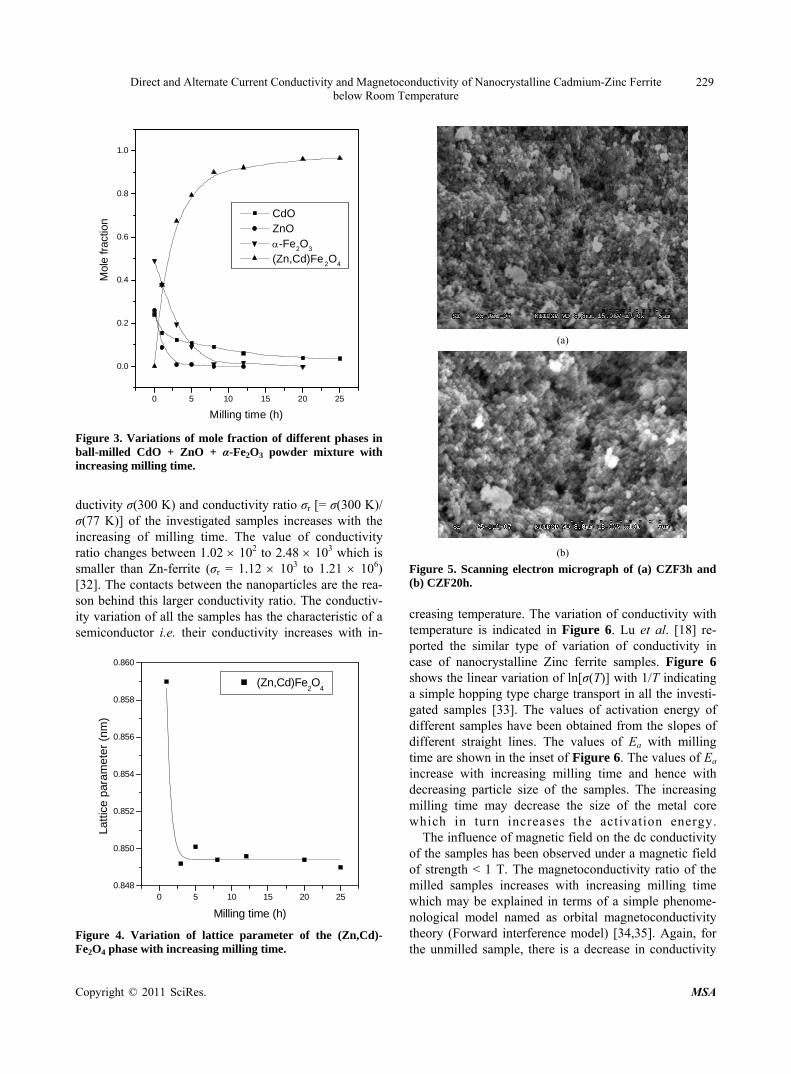
Figure 3 shows the variation of relative phase abun-dances of different phases with increasing milling time. The content (mole fraction) of ZnO phase decreases very rapidly and after 3 h of milling it becomes almost nil, whereas the variation of CdO content shows that initially the phase was utilized rapidly in ferrite phase but at the higher milling time, the rate of inclusion becomes very slow and till 25 h milling the phase was not completely incorporated in the ferrite matrix and ~0.04 mole fraction of the phase remained unreacted. The α-Fe2O3 phase con-tent decreases in a moderate rate and after 8 h of milling it almost vanishes. The ferrite phase content increases sharply up to 8 h of milling and then approaches towards a saturation to ~0.96 mole fraction (Table 1). It may be no-ticed that the ferrite content increases considerably until the α-Fe2O3 phase was used up completely and after that a slight increment up to 25 h milling is due to a very slow diffusion of Cd2+ ions into the ferrite matrix. All these variations in contents indicate that Zn2+ ions have occupied the tetrahedral positions quite rapidly but the Cd2+ ions took longer time and even after 25 h of milling some tet-rahedral positions remained vacant due to insolubility of CdO in ferrite matrix. It is therefore obvious that the pre-pared ferrite phase is a Zn-rich non-stoichiometric (Zn,Cd)Fe2O4 normal spinel with tetrahedral vacancies.
The nature of variation of lattice parameter of the cu-bic (Zn,Cd)Fe2O4 phase with increasing milling time is shown in Figure 4. It can be seen from the plot that the lattice parameter of ferrite phase formed after 1h of mill-ing reduces rapidly within 3 h of milling from the value 0.859 nm to ~0.849 nm (Table 1) and then remained almost invariant up to 25 h of milling. In the course of milling, ZnO phase utilized completely in tetrahedral vacancies but CdO phase was not utilized completely and some tetrahedral sites remained unoccupied even after 25 h of milling.
The scanning electron micrograph of the samples CZF3h and CZF20h are shown in Figures 5(a) and 5(b). The pictures show that the samples are not closely packed and consist of several grains. The grains are well resolved and have almost circular (spherical) shape. It is clearly seen in the micrographs that the grains are at nanoscale. The average grain size determined from SEM was noted as 35 nm - 40 nm.
The dc conductivity of the Cd-Zn ferrite samples have been measured in the temperature range 77 K ≤ T ≤ 300 K. It is observed that the incorporation of Cadmium atom within zinc ferrite reduces the dc conductivity in compare to our previous study [32]. The room temperature con-
Copyright © 2011 SciRes. MSA
Direct and Alternate Current Conductivity and Magnetoconductivity of Nanocrystalline Cadmium-Zinc Ferrite 229below Room Temperature
0 5 10 15 20 25
0.0
0.2
0.4
0.6
0.8
1.0
CdO ZnO -Fe2O3
(Zn,Cd)Fe2O
4
Mol
e fr
actio
n
Milling time (h)
Figure 3. Variations of mole fraction of different phases in ball-milled CdO + ZnO + α-Fe2O3 powder mixture with increasing milling time.
ductivity σ(300 K) and conductivity ratio σr [= σ(300 K)/ σ(77 K)] of the investigated samples increases with the increasing of milling time. The value of conductivity ratio changes between 1.02 102 to 2.48 103 which is smaller than Zn-ferrite (σr = 1.12 103 to 1.21 106) [32]. The contacts between the nanoparticles are the rea-son behind this larger conductivity ratio. The conductiv-ity variation of all the samples has the characteristic of a semiconductor i.e. their conductivity increases with in-
0 5 10 15 20 250.848
0.850
0.852
0.854
0.856
0.858
0.860
(Zn,Cd)Fe2O
4
Latt
ice
para
met
er (
nm)
Milling time (h)
Figure 4. Variation of lattice parameter of the (Zn,Cd)- Fe2O4 phase with increasing milling time.
(a)
(b)
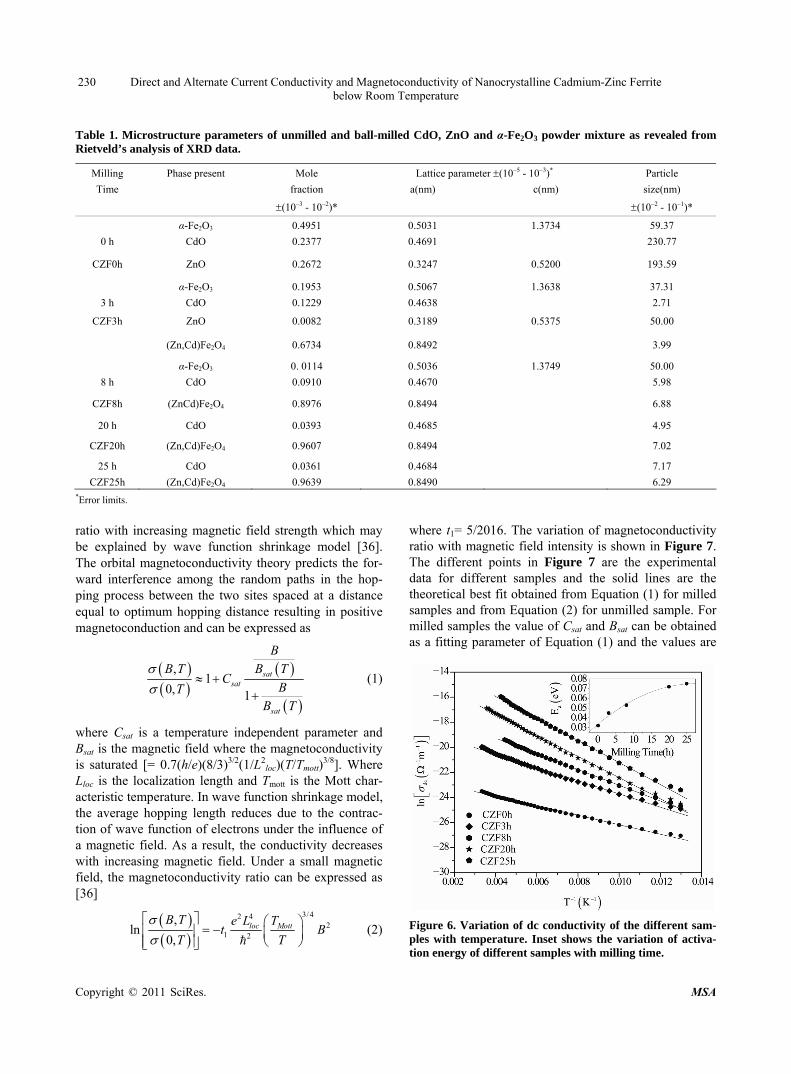
Figure 5. Scanning electron micrograph of (a) CZF3h and (b) CZF20h. creasing temperature. The variation of conductivity with temperature is indicated in Figure 6. Lu et al. [18] re-ported the similar type of variation of conductivity in case of nanocrystalline Zinc ferrite samples. Figure 6 shows the linear variation of ln[σ(T)] with 1/T indicating a simple hopping type charge transport in all the investi-gated samples [33]. The values of activation energy of different samples have been obtained from the slopes of different straight lines. The values of Ea with milling time are shown in the inset of Figure 6. The values of Ea increase with increasing milling time and hence with decreasing particle size of the samples. The increasing milling time may decrease the size of the metal core which in turn increases the activation energy.
The influence of magnetic field on the dc conductivity of the samples has been observed under a magnetic field of strength < 1 T. The magnetoconductivity ratio of the milled samples increases with increasing milling time which may be explained in terms of a simple phenome-nological model named as orbital magnetoconductivity theory (Forward interference model) [34,35]. Again, for the unmilled sample, there is a decrease in conductivity
Copyright © 2011 SciRes. MSA
Direct and Alternate Current Conductivity and Magnetoconductivity of Nanocrystalline Cadmium-Zinc Ferrite below Room Temperature
Copyright © 2011 SciRes. MSA
230
Table 1. Microstructure parameters of unmilled and ball-milled CdO, ZnO and α-Fe2O3 powder mixture as revealed from Rietveld’s analysis of XRD data.
Milling Phase present Mole Lattice parameter (10–5 - 10–3)* Particle
Time fraction a(nm) c(nm) size(nm)
(10–3 - 10–2)* (10–2 - 10–1)*
α-Fe2O3 0.4951 0.5031 1.3734 59.37
0 h CdO 0.2377 0.4691 230.77
CZF0h ZnO 0.2672 0.3247 0.5200 193.59
α-Fe2O3 0.1953 0.5067 1.3638 37.31
3 h CdO 0.1229 0.4638 2.71
CZF3h ZnO 0.0082 0.3189 0.5375 50.00
(Zn,Cd)Fe2O4 0.6734 0.8492 3.99
α-Fe2O3 0. 0114 0.5036 1.3749 50.00
8 h CdO 0.0910 0.4670 5.98
CZF8h (ZnCd)Fe2O4 0.8976 0.8494 6.88
20 h CdO 0.0393 0.4685 4.95
CZF20h (Zn,Cd)Fe2O4 0.9607 0.8494 7.02
25 h CdO 0.0361 0.4684 7.17
CZF25h (Zn,Cd)Fe2O4 0.9639 0.8490 6.29 *Error limits.
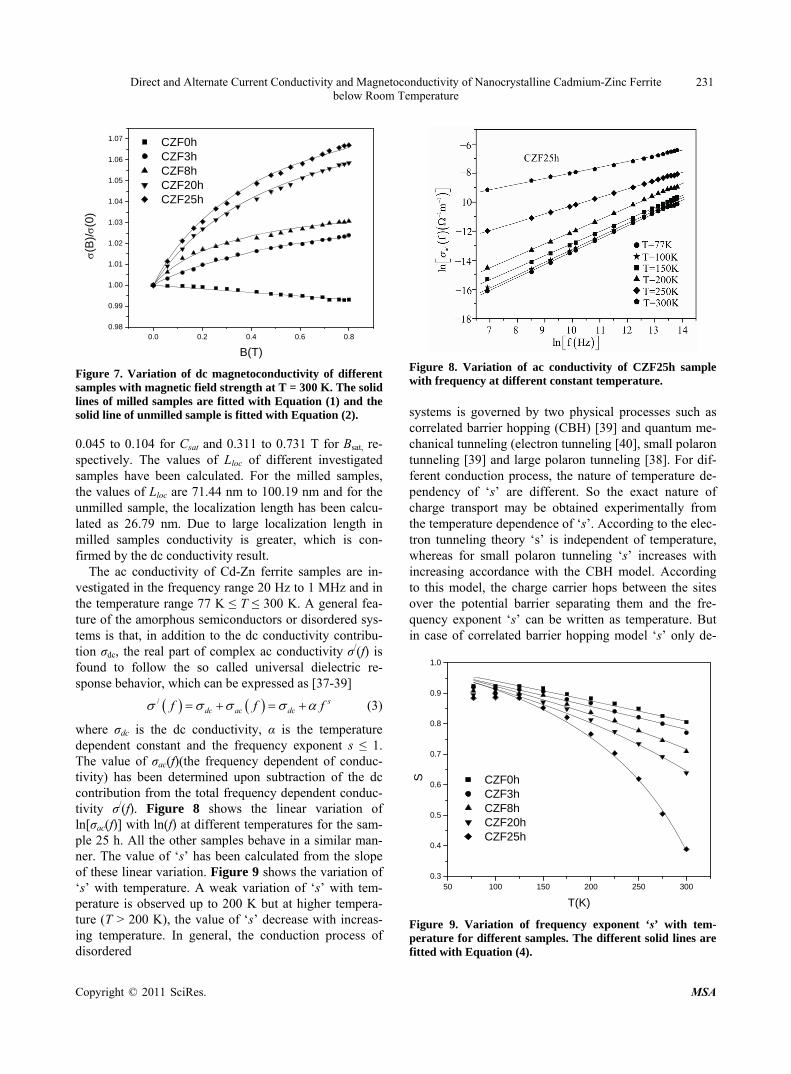
where t1= 5/2016. The variation of magnetoconductivity ratio with magnetic field intensity is shown in Figure 7. The different points in Figure 7 are the experimental data for different samples and the solid lines are the theoretical best fit obtained from Equation (1) for milled samples and from Equation (2) for unmilled sample. For milled samples the value of Csat and Bsat can be obtained as a fitting parameter of Equation (1) and the values are
ratio with increasing magnetic field strength which may be explained by wave function shrinkage model [36]. The orbital magnetoconductivity theory predicts the for-ward interference among the random paths in the hop-ping process between the two sites spaced at a distance equal to optimum hopping distance resulting in positive magnetoconduction and can be expressed as
,1
0, 1
satsat
sat
B
B T B TC
BTB T
(1)
where Csat is a temperature independent parameter and Bsat is the magnetic field where the magnetoconductivity is saturated [= 0.7(h/e)(8/3)3/2(1/L2
loc)(T/Tmott)3/8]. Where
Lloc is the localization length and Tmott is the Mott char-acteristic temperature. In wave function shrinkage model, the average hopping length reduces due to the contrac-tion of wave function of electrons under the influence of a magnetic field. As a result, the conductivity decreases with increasing magnetic field. Under a small magnetic field, the magnetoconductivity ratio can be expressed as [36]
3/42 42
1 2
,ln
0,
loc MottB T e L Tt
T T
B (2) Figure 6. Variation of dc conductivity of the different sam-ples with temperature. Inset shows the variation of activa-tion energy of different samples with milling time.
Direct and Alternate Current Conductivity and Magnetoconductivity of Nanocrystalline Cadmium-Zinc Ferrite 231below Room Temperature
0.0 0.2 0.4 0.6 0.80.98
0.99
1.00
1.01
1.02
1.03
1.04
1.05
1.06
1.07
(B
)/(
0)
B(T)
CZF0h CZF3h CZF8h CZF20h CZF25h
Figure 7. Variation of dc magnetoconductivity of different samples with magnetic field strength at T = 300 K. The solid lines of milled samples are fitted with Equation (1) and the solid line of unmilled sample is fitted with Equation (2). 0.045 to 0.104 for Csat and 0.311 to 0.731 T for Bsat, re-spectively. The values of Lloc of different investigated samples have been calculated. For the milled samples, the values of Lloc are 71.44 nm to 100.19 nm and for the unmilled sample, the localization length has been calcu-lated as 26.79 nm. Due to large localization length in milled samples conductivity is greater, which is con-firmed by the dc conductivity result.
The ac conductivity of Cd-Zn ferrite samples are in-vestigated in the frequency range 20 Hz to 1 MHz and in the temperature range 77 K ≤ T ≤ 300 K. A general fea-ture of the amorphous semiconductors or disordered sys-tems is that, in addition to the dc conductivity contribu-tion σdc, the real part of complex ac conductivity σ/(f) is found to follow the so called universal dielectric re-sponse behavior, which can be expressed as [37-39]
/ sdc ac dcf f f (3)
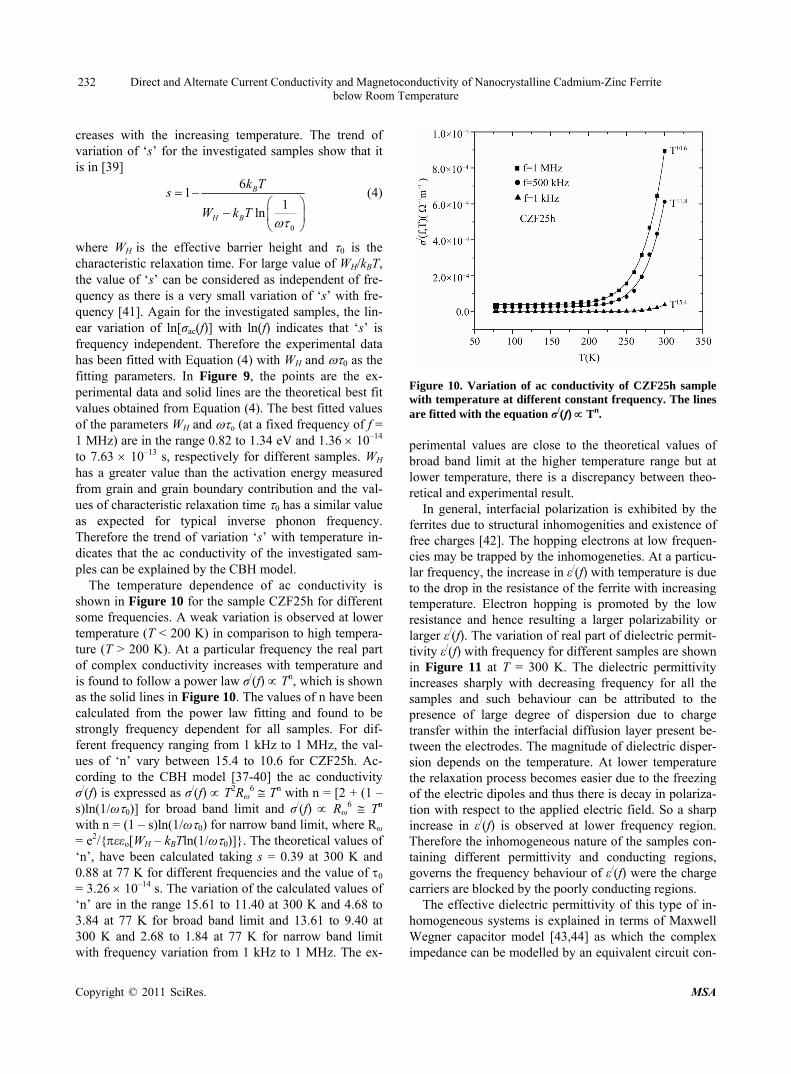
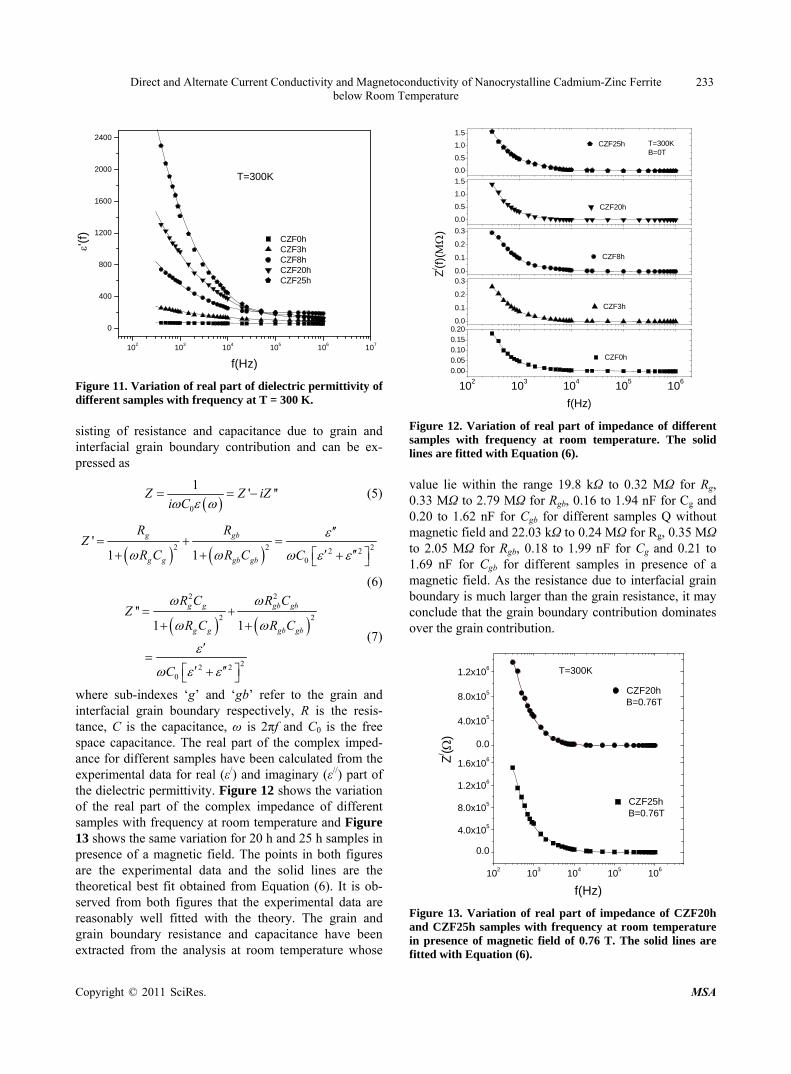
where σdc is the dc conductivity, α is the temperature dependent constant and the frequency exponent s ≤ 1. The value of σac(f)(the frequency dependent of conduc-tivity) has been determined upon subtraction of the dc contribution from the total frequency dependent conduc-tivity σ/(f). Figure 8 shows the linear variation of ln[σac(f)] with ln(f) at different temperatures for the sam-ple 25 h. All the other samples behave in a similar man-ner. The value of ‘s’ has been calculated from the slope of these linear variation. Figure 9 shows the variation of ‘s’ with temperature. A weak variation of ‘s’ with tem-perature is observed up to 200 K but at higher tempera-ture (T > 200 K), the value of ‘s’ decrease with increas-ing temperature. In general, the conduction process of disordered
Figure 8. Variation of ac conductivity of CZF25h sample with frequency at different constant temperature. systems is governed by two physical processes such as correlated barrier hopping (CBH) [39] and quantum me-chanical tunneling (electron tunneling [40], small polaron tunneling [39] and large polaron tunneling [38]. For dif-ferent conduction process, the nature of temperature de-pendency of ‘s’ are different. So the exact nature of charge transport may be obtained experimentally from the temperature dependence of ‘s’. According to the elec-tron tunneling theory ‘s’ is independent of temperature, whereas for small polaron tunneling ‘s’ increases with increasing accordance with the CBH model. According to this model, the charge carrier hops between the sites over the potential barrier separating them and the fre-quency exponent ‘s’ can be written as temperature. But in case of correlated barrier hopping model ‘s’ only de-
50 100 150 200 250 3000.3
0.4
0.5
0.6
0.7
0.8
0.9
1.0
S
T(K)
CZF0h CZF3h CZF8h CZF20h CZF25h
Figure 9. Variation of frequency exponent ‘s’ with tem-perature for different samples. The different solid lines are fitted with Equation (4).
Copyright © 2011 SciRes. MSA
Direct and Alternate Current Conductivity and Magnetoconductivity of Nanocrystalline Cadmium-Zinc Ferrite 232 below Room Temperature
creases with the increasing temperature. The trend of variation of ‘s’ for the investigated samples show that it is in [39]
0
61
1ln
B
H B
k Ts
W k T
(4)
where WH is the effective barrier height and 0 is the characteristic relaxation time. For large value of WH/kBT, the value of ‘s’ can be considered as independent of fre-quency as there is a very small variation of ‘s’ with fre-quency [41]. Again for the investigated samples, the lin-ear variation of ln[σac(f)] with ln(f) indicates that ‘s’ is frequency independent. Therefore the experimental data has been fitted with Equation (4) with WH and 0 as the fitting parameters. In Figure 9, the points are the ex-perimental data and solid lines are the theoretical best fit values obtained from Equation (4). The best fitted values of the parameters WH and o (at a fixed frequency of f = 1 MHz) are in the range 0.82 to 1.34 eV and 1.36 10–14 to 7.63 10–13 s, respectively for different samples. WH has a greater value than the activation energy measured from grain and grain boundary contribution and the val-ues of characteristic relaxation time 0 has a similar value as expected for typical inverse phonon frequency. Therefore the trend of variation ‘s’ with temperature in-dicates that the ac conductivity of the investigated sam-ples can be explained by the CBH model.
The temperature dependence of ac conductivity is shown in Figure 10 for the sample CZF25h for different some frequencies. A weak variation is observed at lower temperature (T < 200 K) in comparison to high tempera-ture (T > 200 K). At a particular frequency the real part of complex conductivity increases with temperature and is found to follow a power law σ/(f) Tn, which is shown as the solid lines in Figure 10. The values of n have been calculated from the power law fitting and found to be strongly frequency dependent for all samples. For dif-ferent frequency ranging from 1 kHz to 1 MHz, the val-ues of ‘n’ vary between 15.4 to 10.6 for CZF25h. Ac-cording to the CBH model [37-40] the ac conductivity σ/(f) is expressed as σ/(f) T2Rω
6 Tn with n = [2 + (1 – s)ln(1/ω0)] for broad band limit and σ/(f) Rω
6 Tn with n = (1 – s)ln(1/ω0) for narrow band limit, where Rω = e2/εεo[WH – kBTln(1/ω0)]. The theoretical values of ‘n’, have been calculated taking s = 0.39 at 300 K and 0.88 at 77 K for different frequencies and the value of 0 = 3.26 10–14 s. The variation of the calculated values of ‘n’ are in the range 15.61 to 11.40 at 300 K and 4.68 to 3.84 at 77 K for broad band limit and 13.61 to 9.40 at 300 K and 2.68 to 1.84 at 77 K for narrow band limit with frequency variation from 1 kHz to 1 MHz. The ex-
Figure 10. Variation of ac conductivity of CZF25h sample with temperature at different constant frequency. The lines are fitted with the equation σ/(f) Tn. perimental values are close to the theoretical values of broad band limit at the higher temperature range but at lower temperature, there is a discrepancy between theo-retical and experimental result.
In general, interfacial polarization is exhibited by the ferrites due to structural inhomogenities and existence of free charges [42]. The hopping electrons at low frequen-cies may be trapped by the inhomogeneties. At a particu-lar frequency, the increase in ε/(f) with temperature is due to the drop in the resistance of the ferrite with increasing temperature. Electron hopping is promoted by the low resistance and hence resulting a larger polarizability or larger ε/(f). The variation of real part of dielectric permit-tivity ε/(f) with frequency for different samples are shown in Figure 11 at T = 300 K. The dielectric permittivity increases sharply with decreasing frequency for all the samples and such behaviour can be attributed to the presence of large degree of dispersion due to charge transfer within the interfacial diffusion layer present be-tween the electrodes. The magnitude of dielectric disper-sion depends on the temperature. At lower temperature the relaxation process becomes easier due to the freezing of the electric dipoles and thus there is decay in polariza-tion with respect to the applied electric field. So a sharp increase in ε/(f) is observed at lower frequency region. Therefore the inhomogeneous nature of the samples con-taining different permittivity and conducting regions, governs the frequency behaviour of ε/(f) were the charge carriers are blocked by the poorly conducting regions.
The effective dielectric permittivity of this type of in-homogeneous systems is explained in terms of Maxwell Wegner capacitor model [43,44] as which the complex impedance can be modelled by an equivalent circuit con-
Copyright © 2011 SciRes. MSA
Direct and Alternate Current Conductivity and Magnetoconductivity of Nanocrystalline Cadmium-Zinc Ferrite 233below Room Temperature
102 103 104 105 106 107
0
400
800
1200
1600
2000
2400
T=300K
'(f
)
f(Hz)
CZF0h CZF3h CZF8h CZF20h CZF25h
Figure 11. Variation of real part of dielectric permittivity of different samples with frequency at T = 300 K. sisting of resistance and capacitance due to grain and interfacial grain boundary contribution and can be ex-pressed as
0
1' ''Z Z iZ
i C (5)
2 2 2 20
'1 1
g gb
g g gb gb
R RZ
R C R C C
2
(6)
2 2
2 2
22 20
''1 1
g g gb gb
g g gb gb
R C R CZ
R C R C
C
(7)
where sub-indexes ‘g’ and ‘gb’ refer to the grain and interfacial grain boundary respectively, R is the resis-tance, C is the capacitance, ω is 2πf and C0 is the free space capacitance. The real part of the complex imped-ance for different samples have been calculated from the experimental data for real (ε/) and imaginary (ε//) part of the dielectric permittivity. Figure 12 shows the variation of the real part of the complex impedance of different samples with frequency at room temperature and Figure 13 shows the same variation for 20 h and 25 h samples in presence of a magnetic field. The points in both figures are the experimental data and the solid lines are the theoretical best fit obtained from Equation (6). It is ob-served from both figures that the experimental data are reasonably well fitted with the theory. The grain and grain boundary resistance and capacitance have been extracted from the analysis at room temperature whose
0.0
0.1
0.2
0.30.0
0.1
0.2
0.3
0.0
0.5
1.0
1.5
0.0
0.5
1.0
1.5
102 103 104 105 106
0.000.050.100.150.20
CZF3h
Z/ (f
)(
)
CZF8h
CZF20h
T=300KB=0T
CZF25h
f(Hz)
CZF0h
Figure 12. Variation of real part of impedance of different samples with frequency at room temperature. The solid lines are fitted with Equation (6). value lie within the range 19.8 kΩ to 0.32 MΩ for Rg, 0.33 MΩ to 2.79 MΩ for Rgb, 0.16 to 1.94 nF for Cg and 0.20 to 1.62 nF for Cgb for different samples Q without magnetic field and 22.03 kΩ to 0.24 MΩ for Rg, 0.35 MΩ to 2.05 MΩ for Rgb, 0.18 to 1.99 nF for Cg and 0.21 to 1.69 nF for Cgb for different samples in presence of a magnetic field. As the resistance due to interfacial grain boundary is much larger than the grain resistance, it may conclude that the grain boundary contribution dominates over the grain contribution.
102 103 104 105 106
0.0
4.0x10⁵
8.0x10⁵
1.2x10⁶
1.6x10⁶
0.0
4.0x10⁵
8.0x10⁵
1.2x10⁶
f(Hz)
CZF25h B=0.76T
T=300K
Z/ (
)
CZF20h B=0.76T
Figure 13. Variation of real part of impedance of CZF20h and CZF25h samples with frequency at room temperature in presence of magnetic field of 0.76 T. The solid lines are fitted with Equation (6).
Copyright © 2011 SciRes. MSA
Direct and Alternate Current Conductivity and Magnetoconductivity of Nanocrystalline Cadmium-Zinc Ferrite 234 below Room Temperature
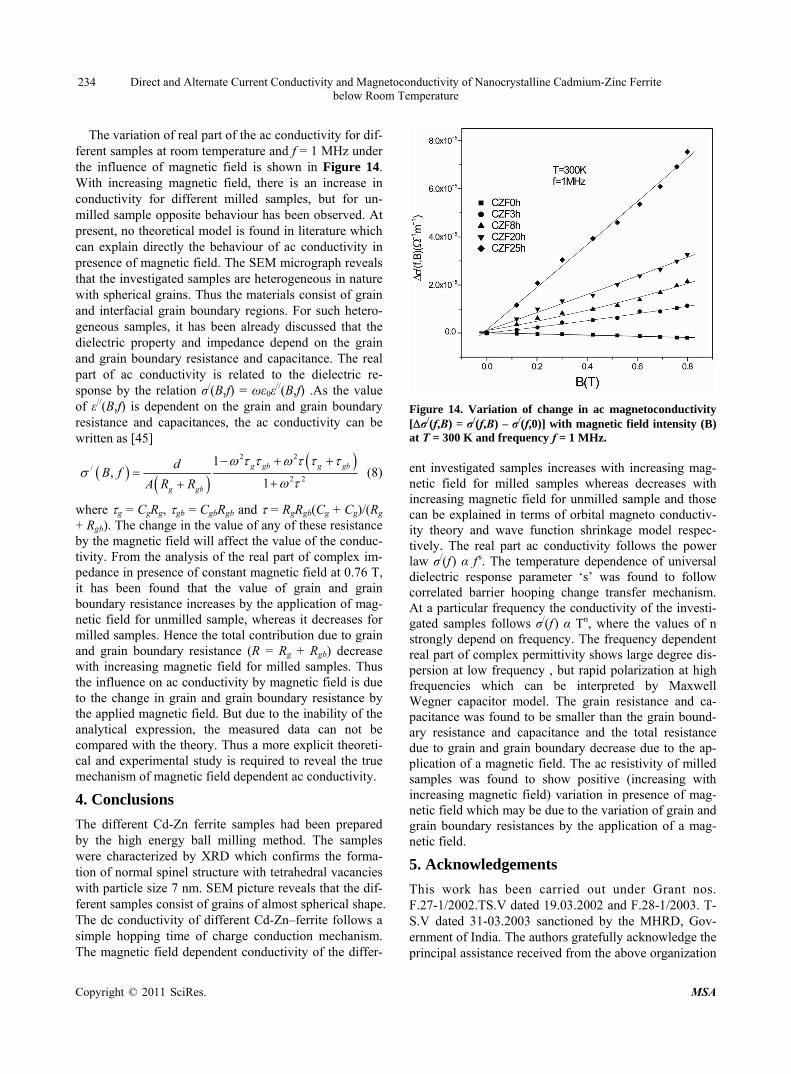
The variation of real part of the ac conductivity for dif-ferent samples at room temperature and f = 1 MHz under the influence of magnetic field is shown in Figure 14. With increasing magnetic field, there is an increase in conductivity for different milled samples, but for un-milled sample opposite behaviour has been observed. At present, no theoretical model is found in literature which can explain directly the behaviour of ac conductivity in presence of magnetic field. The SEM micrograph reveals that the investigated samples are heterogeneous in nature with spherical grains. Thus the materials consist of grain and interfacial grain boundary regions. For such hetero-geneous samples, it has been already discussed that the dielectric property and impedance depend on the grain and grain boundary resistance and capacitance. The real part of ac conductivity is related to the dielectric re-sponse by the relation σ/(B,f) = ωε0ε
//(B,f) .As the value of ε//(B,f) is dependent on the grain and grain boundary resistance and capacitances, the ac conductivity can be written as [45]
2 2
/2 2
1,
1
g gb g gb
g gb
dB f
A R R
(8)
where g = CgRg, gb = CgbRgb and = RgRgb(Cg + Cg)/(Rg + Rgb). The change in the value of any of these resistance by the magnetic field will affect the value of the conduc-tivity. From the analysis of the real part of complex im-pedance in presence of constant magnetic field at 0.76 T, it has been found that the value of grain and grain boundary resistance increases by the application of mag-netic field for unmilled sample, whereas it decreases for milled samples. Hence the total contribution due to grain and grain boundary resistance (R = Rg + Rgb) decrease with increasing magnetic field for milled samples. Thus the influence on ac conductivity by magnetic field is due to the change in grain and grain boundary resistance by the applied magnetic field. But due to the inability of the analytical expression, the measured data can not be compared with the theory. Thus a more explicit theoreti-cal and experimental study is required to reveal the true mechanism of magnetic field dependent ac conductivity.
4. Conclusions
The different Cd-Zn ferrite samples had been prepared by the high energy ball milling method. The samples were characterized by XRD which confirms the forma-tion of normal spinel structure with tetrahedral vacancies with particle size 7 nm. SEM picture reveals that the dif- ferent samples consist of grains of almost spherical shape. The dc conductivity of different Cd-Zn–ferrite follows a simple hopping time of charge conduction mechanism. The magnetic field dependent conductivity of the differ-
Figure 14. Variation of change in ac magnetoconductivity [σ/(f,B) = σ/(f,B) – σ/(f,0)] with magnetic field intensity (B) at T = 300 K and frequency f = 1 MHz. ent investigated samples increases with increasing mag-netic field for milled samples whereas decreases with increasing magnetic field for unmilled sample and those can be explained in terms of orbital magneto conductiv-ity theory and wave function shrinkage model respec-tively. The real part ac conductivity follows the power law σ/(f ) α f
s. The temperature dependence of universal dielectric response parameter ‘s’ was found to follow correlated barrier hooping change transfer mechanism. At a particular frequency the conductivity of the investi-gated samples follows σ/(f ) α Tn, where the values of n strongly depend on frequency. The frequency dependent real part of complex permittivity shows large degree dis-persion at low frequency , but rapid polarization at high frequencies which can be interpreted by Maxwell Wegner capacitor model. The grain resistance and ca-pacitance was found to be smaller than the grain bound-ary resistance and capacitance and the total resistance due to grain and grain boundary decrease due to the ap-plication of a magnetic field. The ac resistivity of milled samples was found to show positive (increasing with increasing magnetic field) variation in presence of mag-netic field which may be due to the variation of grain and grain boundary resistances by the application of a mag-netic field.
5. Acknowledgements
This work has been carried out under Grant nos. F.27-1/2002.TS.V dated 19.03.2002 and F.28-1/2003. T- S.V dated 31-03.2003 sanctioned by the MHRD, Gov-ernment of India. The authors gratefully acknowledge the principal assistance received from the above organization
Copyright © 2011 SciRes. MSA
Direct and Alternate Current Conductivity and Magnetoconductivity of Nanocrystalline Cadmium-Zinc Ferrite 235below Room Temperature
during this work.
REFERENCES
[1] B. M. Berskovsky, V. F. Medvcdcv and M. S. Krakov, “Magnetic Fluids: Engineering Applications,” Oxford University Press, Oxford, 1993.
[2] R. E. Ayala and D. W. Marsh, “Characterization and Long-Range Reactivity of Zinc Ferrite in High-Tempera-ture Desulfurization Processes,” Industrial & Engineering. Chemistry Research, Vol. 30, No. 1, January 1991, pp. 55-60. doi:10.1021/ie00049a009
[3] L. A. Bissett and L. D. Strickland, “Analysis of a Fixed- Bed Gasfier IGCC Configuration,” Industrial & Engi-neering. Chemistry Research, Vol. 30, No. 1, January 1991, pp. 170-176.
[4] M. Sugimoto, “The Past, Present and Future of Ferrites,” Journal of the American Ceramic Society, Vol. 82, No. 2, February 1999, pp. 269-280. doi:10.1111/j.1551-2916.1999.tb20058.x
[5] I. Safarik and M. Sararikova, “Nanostructured Materials, Magnetic Nanoparticles and Biosciences,” Springer, Wien, 2002, p. 1.
[6] S. Son, M. Taheri, E. Carpenter, V. G. Harris and M. E. Mctterny, “Synthesis of Ferrite and Nickel Ferrite Nano- Particles Using Radio-Frequency Thermal Plasma Torch,” Journal of Applied Physics,Vol. 91, No. 10, 2002, pp. 7589-7591. doi:10.1063/1.1452705
[7] I. Anton, I. de Sabata and L. Vekas, ”Application Ori-ented Researches on Magnetic Fluids,” Journal of Mag-netism and Magnetic Materials, Vol. 85, No. 1-3, April 1990, pp. 219-226. doi:10.1016/0304-8853(90)90056-V
[8] R. D. McMickael, R. D. Shull, L. J. Swartzendruber, L. H. Bennett and R. E. Watson, ”Magnetocaloric Effect in Su-perparamagnets,” Journal of Magnetism and Magnetic Materials,” Vol. 111, No. 1-2, June 1992, pp. 29-33. doi:10.1016/0304-8853(92)91049-Y
[9] D. L. Leslie-Pelecky and R. D. Rieke, “Magnetic Proper-ties of Nanostructured Materials,” Chemistry of Materials, Vol. 8, No. 8, August 1996, pp. 1770-1783. doi:10.1021/cm960077f
[10] R. H. Kodama, A. E. Berkowitz, E. J. McNiff and S. Foner, “Surface Spin Disorder in Ferrite Nanoparticles (Invited),” Journal of Applied Physics, Vol. 81, No. 8, 1997, pp. 5552-5557.
[11] S. A. Oliver, H. H. Handeh and J. C. Ho, “Localized Spin Canting in Partially Inverted ZnFe2O4 Fine Powders,” Physical Review B, Vol. 60, 1999, pp. 3400-3405. doi:10.1103/PhysRevB.60.3400
[12] S. Bid and S. K. Pradhan, “Preparation of Zinc Ferrite by High-Energy Ball Milling and Microstructure Charac-terization by Rietveld’s Analysis,” Materials Chemistry and Physics, Vol. 82, No. 1, September 2003, pp. 27-37. doi:10.1016/S0254-0584(03)00169-X
[13] S. K. Pradhan, S. Bid, M. Gateshki and V. Petkov, “Mi-crostructure Characterization and Cation Distribution of
Nanocrystalline Magnesium Ferrite Prepared by Ball Milling,” Materials Chemistry and Physics, Vol. 93, No. 1, September 2005, pp. 224-230. doi:10.1016/j.matchemphys.2005.03.017
[14] H. H. Hamdeh, J. C. Ho, S. A. Oliver, R. J. Willey, G. Oliveri and G. Busca, “Magnetic Properties of Par-tially-Inverted Zinc Ferrite Aerogel Powders,” Journal of Applied Physics, Vol. 81, No. 4, 1997, pp. 1851-1857.
[15] P. Chen, D. Y. Xing, Y. W. Du, J. M. Zhu and D. Feng, “Giant Room—Temperature Magnetoresistance in Poly-crystalline Zn0.41Fe2.59O4 with α-Fe2O3 Grain Bounda-ries,” Physical Review Letters, Vol. 87, No. 10, 2001, pp. 107202 (4).
[16] M. Hofmann, S. J. Campbell, H. Ehrhardt and R. Feyer-herm, “The Magnetic Behaviour of Nanostructured Zinc Ferrites,” Journal of Material Science, Vol. 39, No. 16-17, 2004, pp. 5057-5065. doi:10.1023/B:JMSC.0000039185.80910.59
[17] S. D. Shenoy, P. A. Joy and M. R. Anantharaman, “Effect of Mechanical Milling on the Structural, Magnetic and Dielectric Properties of Coprecipitated Ultrafine Zinc Ferrite,” Journal of Magnetism and Magnetic Materials, Vol. 269, No. 2, February 2004, pp. 217-226. doi:10.1016/S0304-8853(03)00596-1
[18] Z. L. Lu, L. Y. Lv, J. M. Zhu, S. D. Li, X. C. Liu, W. Q. Zou, F. M. Zhang and Y. W. Du, “Magnetic and Trans-port Property Studies of Nanocrystalline ZnxFe3-xO4,” Solid State Communications, Vol. 137, No. 10, March 2006, pp. 528-532. doi:10.1016/j.ssc.2006.01.014
[19] Y. F. Tian, S. S. Yan, Y. P. Zhang, H. Q. Song, G. Ji, G. L. Liu, Y. X. Chen, L. M. Mei, J. P. Liu, B. Altuncevahir and V. Chakka, “Transformation of Electrical Transport from Variable Range Hopping to Hard Gap Resistance in ZnxFe3-xO1-,” Journal of Applied Physics, Vol. 100, No. 10, 2006, pp. 103901 (6).
[20] L. D. Tung, V. Kolesnichenko, G. Caruntu, D. Caruntu, Y. Remond, V. O. Golub, C. J. O’Connor and L. Spinu, “An-nealing Effects on the Magnetic Properties of Nanocrystal-line Zinc Ferrite,” Physica B, Vol. 319, No. 1-4, July 2002, pp. 116-121. doi:10.1016/S0921-4526(02)01114-6
[21] P. M. G. Nambissan, C. Upadhyay and H. C. Verma, “Position, Lifetime Spectroscopic Studies of Nanocrystal-line ZnFe2O4,” Journal of Applied Physics, Vol. 93, No. 10, 2003, pp. 6320-6326. doi:10.1063/1.1569973
[22] C. N. Chinnasamy, A. Narayanasamy, N. Ponpandian, K. Chattopadhyay, H. Guerault and J. M. Greneche, “Mag-netic Properties of Nanostructured Ferimagnetic Zinc Fer-rite,” Journal of Physics: Condensed Matter, Vol. 12, No. 35, September 2000, pp. 7795. doi:10.1088/0953-8984/12/35/314
[23] H. Ehrhardt, S. J. Capbell and M. Hofmann, “Structural Evolution of Ball Milled ZnFe2O4,” Journal of Alloys and Compounds, Vol. 339, No. 1-2, June 2002, pp. 255-260. doi:10.1016/S0925-8388(01)02011-4
[24] D. Ravinder, “Thermoelectric Power and Electrical Re-sistivity of Cadmium-Substituted Manganese Ferrite,”
Copyright © 2011 SciRes. MSA
Direct and Alternate Current Conductivity and Magnetoconductivity of Nanocrystalline Cadmium-Zinc Ferrite below Room Temperature
Copyright © 2011 SciRes. MSA
236
Materials Letters, Vol. 44, No. 3-4, June 2000, pp. 130- 138. doi:10.1016/S0167-577X(00)00015-X
[25] D. Ravinder, “Electrical Transport Properties of Cad-mium Substituted Copper Ferrite,” Materials Letters, Vol. 43, No. 3, April 2000, pp. 129-138. doi:10.1016/S0167-577X(99)00245-1
[26] D. Ravinder, S. S. Rao and P. Shalini, “Room Tempera-ture Electric Properties of Cadmium-Substituted Nickel Ferrites,” Materials Letters, Vol. 57, No. 24-25, August 2003, pp. 4040-4042. doi:10.1016/S0167-577X(03)00089-2
[27] H. M. Rietveld, “Line Profile of Neutron Powder Diffrac-tion Peaks for Structure Refinement,” Acta Crystal-lographica, Vol. 22, 1967, pp. 151-152. doi:10.1107/S0365110X67000234
[28] H. M. Rietveld, “A Profile Refinement Method for Nu-clear and Magnetic Structures,” Journal of Applied Crys-tallography, Vol. 2, 1969, pp. 65-71. doi:10.1107/S0021889869006558
[29] R. A. Young, “The Rietveld Method,” Oxford University Press, Oxford, 1996.
[30] L. Lutterotti, P. Scardi and P. Maistrelli, “LSI-a Com-puter Program for Simultaneous Refinement of Material Structure and Microstructure,” Journal of Applied Crys-tallography, Vol. 25, No. 3, 1992, pp. 459-462. doi:10.1107/S0021889892001122
[31] L. Lutterotti, “MAUD Version 2.046.,” http://www.ing.unitn.it/~luttero/maud.
[32] S. Ghatak, M. Sinha, A. K. Meikap and S. K. Pradhan, “Electrical Transport Properties of Nanocrystalline Zinc Ferrite,” Physica E, Vol. 40, January 2008, pp. 2686- 2693. doi:10.1016/j.physe.2007.12.030
[33] C. A. Neugebauer and M. B. Webb, “Electrical Conduc-tion Mechanism in Ultrathin Evaporated Metal Films,” Journal of Applied. Physics, Vol. 33, No. 1, 1962, pp. 74-83.
[34] V. L. Nguyen, B. Z. Spivak and B. I. Shklovskii, “Tunnel Hops in Disordered Systems,” Soviet Physics-JETP, Vol. 62, 1985, p. 1021.
[35] U. Sivan, O. Entin-Wohiman and Y. Imry, “Orbital Mag-netoconductance in the Variable Range Hopping Regime,” Physical Review Letters, Vol. 60, No. 15, 1988, pp. 1566- 1569. doi:10.1103/PhysRevLett.60.1566
[36] B. I. Shklovskii, “Positive Magnetoresistance in the Variable Range Hopping Conduction Regimes,” Soviet Physics Semiconductors, Vol. 17, 1983, p. 1311.
[37] N. F. Mott and E. Davis, “Electronic Process in Noncrys-talline Materials,” 2nd Edition, Oxford University Press, New York, 1997.
[38] A. R. Long, “Frequency-Dependent Lossin Amorphous Semi-Conductors,” Advances in Physics, Vol. 31, No. 5, 1982, pp. 553-637. doi:10.1080/00018738200101418
[39] S. R. Elliott,” A.c. Conduction in Amorphous Chalco-genide and Pnictide Semiconductors,” Advances in Phys-ics, Vol. 36, No. 2, 1987, pp. 135-217. doi:10.1080/00018738700101971
[40] A. L. Efros, “On the Theory of A.c. Conduction in Amor-phous Semiconductors and Chalcogenide Glasses,” Phi-losophical Magazine B, Vol. 43, No. 5, 1981, pp. 829-838. doi:10.1080/01418638108222349
[41] B. G. Soares, M. E. Leyva, G. M. O. Barra and D. Khast-gir, “Dielectric Behaviour of Polyaniline Synthesized by Different Techniques,” European Polymer Journal, Vol. 42, No. 3, 2006, pp. 676-686. doi:10.1016/j.eurpolymj.2005.08.013
[42] S. S. Suryavanshi, S. R. Patil, S. A. Patil and S. R. Sa-want, “D.C. Resistivity and Dielectric Behaviour of Ti4+ Substituted Mg-Zn Ferrite,” Journal of the Less-Common Metals, Vol. 168, No. 2, March 1991, pp. 169-174. doi:10.1016/0022-5088(91)90298-I
[43] J. C. Maxwell, “A Treatise on Electricity and Magnet-ism,” Oxford University Press, Oxford, 1988.
[44] V. Hippel, “Dielectrics and Waves,” Wiley, New York, 1954.
[45] G. Catalan, “Magnetocapacitance without Magnetoelec-tric Coupling,” Applied Physics Letters, Vol. 88, No. 10, 2006, pp. 102902-102905. doi:10.1063/1.2177543