Embed Size (px)
Citation preview
DISABILITY, LONG TERM CONDITIONS AND POVERTY
Tom MacInnes, Adam Tinson (New Policy Institute), Declan Gaffney (independent policy consultant),
Goretti Horgan (University of Ulster) and Ben Baumberg (University of Kent)
A report for the Joseph Rowntree Foundation
Published July 2014
DISABILITY, LONG TERM CONDITIONS AND POVERTY
One-page Summary 3
Executive Summary 4
1. Methodology 7
2. Understanding poverty among disabled people 9 The extra needs and costs of disability 10 Measuring costs 12 Disability cost benefits 14 Disability poverty, adjusted for extra costs 16
3. Further unpacking disability and poverty 21 Disability, family type and the lifecourse 21 Poverty and mental ill-health 24 International comparisons of disability poverty 25
4. Disability and paid work 31 Disability, poverty, and work 31 The disability employment penalty 32 Outcomes for specific groups: mental health & learning difficulties 36 International comparisons 39
5. ‘What works’ in helping disabled people into work 40 Preventing impairment in the workplace 41 The role of social security systems 43 Specialist programmes to help disabled people into work 48 The role of employers 50
6. A strategy for reducing disability poverty 57 Issue 1: Material resources and employment 57 Issue 2: The extra costs of disability 58 Overarching themes 60
Bibliography 61
ONE-PAGE SUMMARY
Most studies underestimate levels of poverty among disabled people. This study shows the size of these underestimates, and explores the difficulty in escaping poverty through paid work – and how policymakers might tackle this.
Key points
Poverty among disabled people is consistently underestimated. This study uses two different adjustments, each finding at least a ‘missing million’ of people in poverty in households with a disabled person.
Making society less disabling will reduce poverty among disabled people. Possible ways of doing this include improving affordability and accessibility of transport and housing, developing standards for consumer devices, stopping legal discrimination, better use of technology, and making markets for assistive technologies work more effectively.
Disabled people are less likely to be working and more likely to be low paid. There are four main ways that this could be tackled:
o The benefits system: simply removing people from benefits cannot be seen as a sign of success. Rather, changes are needed so that the system doesn’t stop people from being able to work; including flexible, portable benefits are needed that allow people to move to areas where there are more (and more suitable) jobs.
o Specialist programmes can help people return-to-work when they include personalisation rather than sharp targets. Intensive in-work support with employer subsidies can make a difference.
o Early intervention can help, including better workplace practices and responsive health systems, as well as a healthy psychosocial work environment.
o Finally, employers are critical – many disabled people simply face limited opportunities. There are some good managers, yet a common perception that employing disabled people involves extra costs, and a limit to ‘reasonable’ adjustments. Stronger actions may therefore be necessary, including regulation and incentives.
Finally, disabled people stressed that work is not always the solution; that all the policies above should resist the temptation to simplify the diversity of disability; and that it may be necessary to change the current public debate. The idea that ‘work is the best route out of poverty’ clearly cannot apply to all disabled people, and reducing the aim of poverty reduction to simply improved access to employment would be counterproductive.
EXECUTIVE SUMMARY
Background
Most studies underestimate the levels of poverty among people with disabilities. This study shows the likely size of these underestimates, and explores the difficulty in escaping poverty through paid work. It concludes with a series of recommendations – based on a workshop with disabled people themselves – as to how poverty among disabled people can be reduced.
Disability and poverty
Disability is a huge part of the poverty picture in the UK. On the standard measure, one in three people in poverty live in a household with a disabled person. The headline poverty rate for disabled individuals is 23% - only just higher than the rate of non-disabled individuals of 21%.
However, poverty is about whether someone’s material resources are sufficient to meet their needs. Disabled people’s needs are often greater – some estimates put this at £1500pw. This is due to both ‘enhanced costs’ (things everyone needs but which are more expensive for disabled people) and ‘special costs’ (things that only disabled people need).
Unfortunately it is impossible to precisely adjust for these extra costs – they just differ too much between different disabled people. However, the study does provide two estimates that adjust for this in different ways:
1. Excluding certain disability benefits from income: nearly 7m people live in a household where someone receives a benefit (Disability Living Allowance or Attendance Allowance) to meet some of the extra costs of disability. This is conventionally treated as ‘income’, even though a disabled person with £100 extra income and £100 extra needs is as poor as someone without a disability. When this study excludes these benefits from income an extra 1m people are found to be in poverty.
2. Estimating extra costs as a percentage of income: one study (Zaidi & Burchardt 2003) found that the average disabled person had extra costs amounting to 24-35% of their income (depending on household composition). Using these figures, the poverty rate among households with a disabled member rises from 25% to 30-32%, amounting to an extra 1.3m-1.8m people in poverty.
While these estimates are imprecise, we can reasonably say that the official poverty statistics cover up a ‘missing million’ of people in poverty, in households with a disabled person – and possibly the figure is even higher.
Reducing disability poverty by reducing the extra costs of disability
It is self-evident that making society less disabling will reduce poverty among disabled people. While there is little direct evidence on how to go about this, the literature and our policy workshop with disabled people suggested the following:
- Greater levels of suitable housing could be provided, whether by changing policies in social housing, improving the standards of new-build homes, or helping disabled people own (and adapt) their own home.
- There could be greater enforcement of the ‘reasonable adjustment’ obligation in public transport, and for private transport, the Motability scheme could be made more widely available.
- Disabled people are discriminated against in certain markets, such as insurance and other financial products. Government can better enforce existing legislation to end such discrimination.
- Standards for consumer devices (and Government standards in contracts) could build in accessibility, without the need for separate markets specifically for disabled people.
- Technology could be used to reduce costs. Prizes could be set up to get entrepreneurs to think of innovative ways of reducing costs, and Government investment could be increased.
- The markets for assistive technologies could be made to work more efficiently through e.g. bulk-buying and an online portal. There is also an argument for extending Government support from ‘Access to Work’ to a new ‘Access to Life’ scheme.
Reducing disability poverty through paid work
Disabled people are less likely to be working and more likely to be low paid than those without disabilities (even those with the same level of qualifications). The evidence review suggested four main areas for policy: benefits, return-to-work, prevention, and focusing on employers.
Despite an intense policy focus on reforming disability benefit systems over recent decades, improvements in employment for disabled people have often failed to materialise. There is no evidence at the country-level that disability employment rates are improved by either reducing benefit generosity/tighter eligibility or stepping up activation policies (although these policies might reduce disability benefit caseloads). Disabled people themselves highlighted that the benefits system needs to allow people to move to areas whether there are more jobs, and to create a system with fair criteria and processes.
Specialist programmes can also help people return-to-work – although the evidence mainly covers common physical health problems. Effective programmes include longer-term engagement and personalisation, and avoiding sharp work-focused targets that lead to ‘cream-skimming’ and ‘parking. Some specialist programmes seem more effective but only work with limited numbers of people. Supported employment that combines intensive long-term in-work support and employer subsidies – and in particular, the ‘Individual Placement and Support model’ – is one of the best ways of helping people with severe mental health conditions into sustained employment. However, this type of intervention needs to be properly resourced. Disabled people also highlighted that people may need help to reskill, where there is a mismatch between the jobs they are qualified/experienced to do as opposed to the jobs that their health or disability allows them to do.
Early intervention can stop people leaving work to begin with. Long term worklessness due to mental health conditions and musculoskeletal disorders can be reduced through better workplace practices, while responsive health systems can reduce the risk of developing severe mental ill health. Once sick leaves starts to be taken, early healthcare and workplace interventions can help people with common health conditions to retain their jobs. Maintaining a healthy working environment is also crucial.
However, disabled people stressed that they often face limited opportunities in the labour market: it is also crucial to ask ‘what should employers do differently?’ Individual managers can make a difference, and a radical improvement in advice and training to employers could help. Yet there is a common perception that employing disabled people involves greater ‘cost’ (which can be true in some circumstances). Workplace adjustments could help more people to work, but while it is a legal obligation for employers to make ‘reasonable’ adjustments, the overwhelming majority of people whose job does not interfere with their disability do not have a particular job adjustment – they just happen to be in a suitable job. Employers are also often reluctant to make adjustments as they can induce resentment among colleagues, or because they can involve additional costs, even if these are lower with hindsight than in anticipation.
Disabled people therefore suggested some stronger actions, including regulation (supporting disabled people to assert their existing employment rights) and incentives (targeted help to small companies, expanded access to work, personal budgets for employment support). A number of countries impose stricter job protection for sick or disabled workers. This reduces the risk of loss of employment for workers, but it also potentially creates incentives for employers to avoid hiring disabled workers in order to maintain staffing flexibility.
Further recommendations from disabled people
The disabled people at our policy workshop also stressed three further points:
1. There is a need to challenge the assumption that ‘paid work’ is the solution to poverty among disabled people. Some disabled people cannot work, nor is work what everybody wants when they have just found out about a serious health condition.
2. ‘Disability’ and ‘sickness’ are diverse and complex. We should resist the temptation to make policies that falsely simplify the issues. Nor should policies be seen as a series of disconnected levers to be pulled – it is instead about creating a system that works as a whole.
3. The current policy debate often seems to deny the legitimacy of social security benefits, and to deny that some people are simply not able to work. It will be hard to tackle poverty among sick and disabled people without fundamentally changing the debate.
On the participants’ behalf, the report’s authors request to JRF that they send the participants a note on how they have reflected their views in their final anti-poverty strategy.
About the project
This study drew on (i) new data analyses using the Households Below Average Income (HBAI) data, supplemented by other surveys such as the Health Survey for England, and international data from the OECD and Eurostat; (ii) reviews of published literature on ‘what works’; and (iii) a policy workshop organised by Disability Rights UK in October 2013. The study team included Tom Macinnes and Adam Tinson (New Policy Institute), Declan Gaffney (independent policy consultant), Goretti Horgan (University of Ulster) and Ben Baumberg (University of Kent).
1. METHODOLOGY
The evidence in this report is drawn from both primary analysis of official datasets and from published literature. Chapters 2-4 mainly draw on data from Households Below Average Income (HBAI). This is supplemented with other evidence where HBAI sample sizes limit the analysis, such as literature on the links between poverty and having a disabled child. We also analyse other datasets where required, particularly in Chapter 4, such as using the General Health Survey to examine links between mental health and employment.
Households below Average Income (HBAI) data
Different datasets use slightly different definitions of disability. This is something we look at in more detail in Chapter 4, as the differences impact on the findings. In Chapters 2 and 3, the main source used is the Family Resources Survey (or its derived dataset, Households Below Average Income). The definition of disability, given by the Office for Disability Issues (ODI) in its own analysis of the dataset, is as follows:
“Disabled people are defined as respondents who report a limiting long standing illness, disability or infirmity. Everyone in this group is likely to meet the definition of disability in the Equality Act 2010 (and the Disability Discrimination Act which was in force at the time of the survey)” 1
Poverty is measured using household income after taxes and housing costs have been paid. A household is considered to be in poverty if its income is below 60% of the national median for that year. Adjustments are made for the size and composition of the household, though a process called equivalisation.
The Material Deprivation measure also comes from the Family Resources Survey. In that survey, families are asked if they can afford a range of everyday goods and services such as school trips, sports equipment and enough bedrooms for each child. A Material Deprivation score is then constructed based on the weighted total of items a family say they cannot afford. More commonly afforded items are given a greater weight. The score is indexed between 0 and 100, with anything over 25 counting as material deprivation.
1 Source: ODI website, accessed 27/01/2014 http://odi.dwp.gov.uk/disability-statistics-and-
research/disability-equality-indicators.php
Other Sources
At various points we also compare data from the UK to the rest of Europe. There is no internationally used measure of disability which corresponds precisely to the definitions used in HBAI. We therefore focus on a measure from the EU-SILC survey that seems slightly more likely to be comparable between countries than other available measures: whether people are ‘strongly limited in their daily activities’.2 It should be noted that this is a narrower measure of disability than that used in HBAI. Moreover, this is a self-reported measure of disability, and there is a lot of variation between European countries in self-reported prevalence. At least some of this variation is due to differences in how people report disability between countries, associated with economic, social and cultural differences between nations. For example, more disability is typically reported in wealthier countries, and there is also a tendency for southern countries to report less disability. In order to reduce the influence of reporting differences, we concentrate on a group of fifteen northern and western nations with mature welfare state institutions. These are also the wealthiest countries in Europe, all of which are above the EU average for GDP per capita.
Finally, we reviewed literature on ‘what works’ in reducing poverty among disabled people. The literature reviewed was collected in a range of ways:
The identification of useful papers through social sciences databases using searches terms starting with disab* and: income; work; employ*; depriv*; support; as well as poverty; needs; resources; security; rehabilitation; return-to-work; and UK.
Searches to identify grey literature, such as reports published by NGOs, disabled people’s organisations and government.
A call for evidence was issued through the Social Policy and Disability JISC mailing lists; unfortunately for this project, most of the responses were from low-income countries.
Over 2,000 abstracts were examined and approximately 250 articles and reports read and analysed for evidence of approaches that can help to reduce poverty levels for disabled people at every stage of the life course.
2 This is because the UK EU-SILC questions in about activity limitations are only asked of people who
responded positively to the question about long-term health problems, while in countries the question is asked of all respondents. This is likely to reduce the estimated prevalence on this variable in the UK. However, we assume that people who report being strongly limited in their daily activities are likely to report having a long-term health condition, so the UK figures should be more comparable with those for other countries.
2. UNDERSTANDING POVERTY AMONG DISABLED PEOPLE
HEADLINE POVERTY RATE AMONG DISABLED PEOPLE
Using 2011/12 data, the poverty rate for disabled individuals is 23% compared to a poverty rate for non-disabled individuals of 21%. Disaggregating this for different age groups, the poverty rate for disabled and non-disabled children is the same (27%), and approximately the same for disabled and non-disabled pensioners (13% and 14% respectively) – but it is higher for disabled than non-disabled working-age adults (31% in poverty, compared to 20% of non-disabled working-age adults).
As poverty is measured at the household level, we are also interested in those who live in a family with a disabled person. The analysis in this section is predominantly carried out at this level. Within these 4.4 million people in poverty in families with at least one disabled person, 2.7 million or 61% were themselves disabled.
In 2011-12, people in families with at least one disabled member made up 33% of those in poverty. Figure 2.1 puts this in a historical context. As a share of all those in poverty, this has not been lower for over a decade. In fact, ten years ago, 36% of those in poverty lived in a family with a disabled person.
As well as showing the “share” of poverty that is found among disabled people and their families, Figure 2.1 also shows the risk of poverty for those families. Over the last fifteen or so years, the proportion of people living in households with a disabled person who were in poverty has fallen from around 30% to just under 25%. The overall poverty rate for the rest of the population has not fallen as much. This means that, while people in households that have a disabled adult are still more likely to be in poverty than other people, the gap is now much smaller than it was – in the region of a five percentage points, compared to ten percentage points when the gap was at its largest.
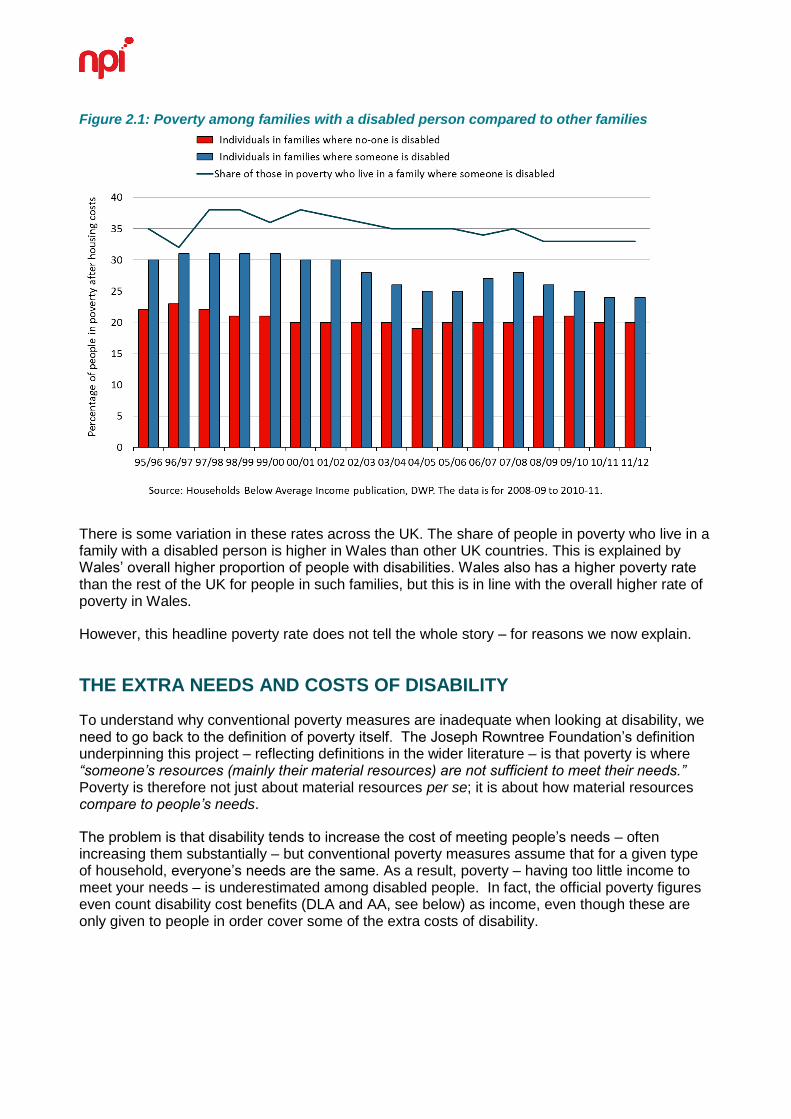
Figure 2.1: Poverty among families with a disabled person compared to other families
There is some variation in these rates across the UK. The share of people in poverty who live in a family with a disabled person is higher in Wales than other UK countries. This is explained by Wales’ overall higher proportion of people with disabilities. Wales also has a higher poverty rate than the rest of the UK for people in such families, but this is in line with the overall higher rate of poverty in Wales.
However, this headline poverty rate does not tell the whole story – for reasons we now explain.
THE EXTRA NEEDS AND COSTS OF DISABILITY
To understand why conventional poverty measures are inadequate when looking at disability, we need to go back to the definition of poverty itself. The Joseph Rowntree Foundation’s definition underpinning this project – reflecting definitions in the wider literature – is that poverty is where “someone’s resources (mainly their material resources) are not sufficient to meet their needs.” Poverty is therefore not just about material resources per se; it is about how material resources compare to people’s needs.
The problem is that disability tends to increase the cost of meeting people’s needs – often increasing them substantially – but conventional poverty measures assume that for a given type of household, everyone’s needs are the same. As a result, poverty – having too little income to meet your needs – is underestimated among disabled people. In fact, the official poverty figures even count disability cost benefits (DLA and AA, see below) as income, even though these are only given to people in order cover some of the extra costs of disability.
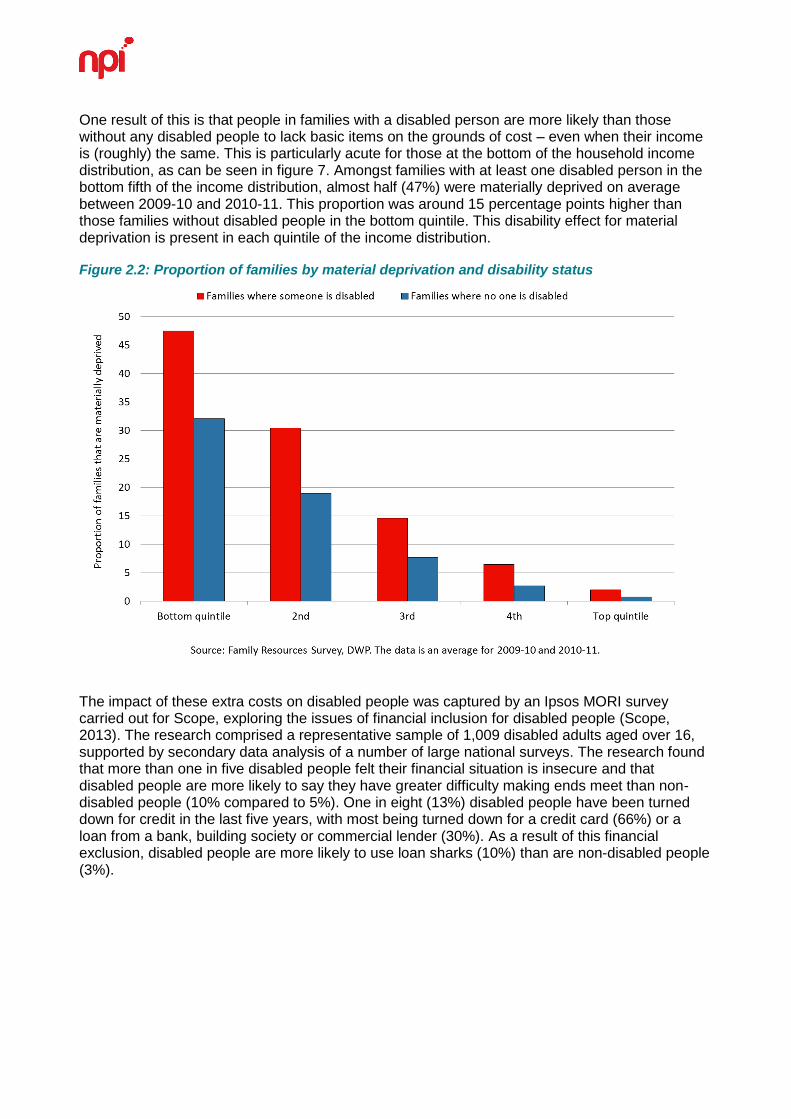
One result of this is that people in families with a disabled person are more likely than those without any disabled people to lack basic items on the grounds of cost – even when their income is (roughly) the same. This is particularly acute for those at the bottom of the household income distribution, as can be seen in figure 7. Amongst families with at least one disabled person in the bottom fifth of the income distribution, almost half (47%) were materially deprived on average between 2009-10 and 2010-11. This proportion was around 15 percentage points higher than those families without disabled people in the bottom quintile. This disability effect for material deprivation is present in each quintile of the income distribution.
Figure 2.2: Proportion of families by material deprivation and disability status
The impact of these extra costs on disabled people was captured by an Ipsos MORI survey carried out for Scope, exploring the issues of financial inclusion for disabled people (Scope, 2013). The research comprised a representative sample of 1,009 disabled adults aged over 16, supported by secondary data analysis of a number of large national surveys. The research found that more than one in five disabled people felt their financial situation is insecure and that disabled people are more likely to say they have greater difficulty making ends meet than non-disabled people (10% compared to 5%). One in eight (13%) disabled people have been turned down for credit in the last five years, with most being turned down for a credit card (66%) or a loan from a bank, building society or commercial lender (30%). As a result of this financial exclusion, disabled people are more likely to use loan sharks (10%) than are non-disabled people (3%).
Thinking about what these extra costs consist of, Tibble (2005) defines extra costs and needs for disabled people into two broad categories: special and enhanced. Special costs are those that are as a result of impairment, such as the cost of a wheelchair or a stair lift. Enhanced costs are those that both disabled and non-disabled people experience, but which are higher for disabled people. Examples of these might be laundry costs or transport. These categories can be further refined, for instance, into recurring and one-off costs. A further important distinction is between realised costs (that people actually spend) and potential costs (the hypothetical cost of meeting all needs – some of which are not actually met in real life). In the remainder of this chapter, we explore ways of estimating the nature of these additional costs of meeting basic needs among disabled people.
MEASURING COSTS
There are several different approaches to measuring costs. Each has some form of drawback, e.g. subjectivity, or budget constraints which mean that only realised costs are considered.
Subjective approach
This approach is predicated on disabled people or experts estimating the additional costs of disability. Respondents are asked to assess what their additional expenditure is or would be to meet their needs.
These are likely to be underestimates as estimations of current additional costs are budget constrained: a lack of income may mean many additional costs are not actually being met.
The advantage of this approach is that it allows disabled people to comment on what they would need to actually meet their costs. On the other hand, respondents are effectively being asked to assess their costs where they not disabled.
Comparative approach
This approach is mostly limited to assessing differences in spending patterns between disabled and non-disabled people.
As it is based on expenditure, it cannot assess potential costs of disability.
Standard of living approach
This approach is based on the idea that a disabled person needs a higher level of income to reach the same standard of living as a non-disabled person.
Indicators are used to assess the standard of living at a given income level for disabled and non-disabled people, with the difference representing the costs of disability.
Budget standards approach
This approach involves disabled people develop a list of items that are considered necessary for a reasonable standard of living, which are then costed.
What are the estimates of costs?
The table below is adapted from Demos (2010) and lists studies and their estimates of costs, all converted into 2012 prices:
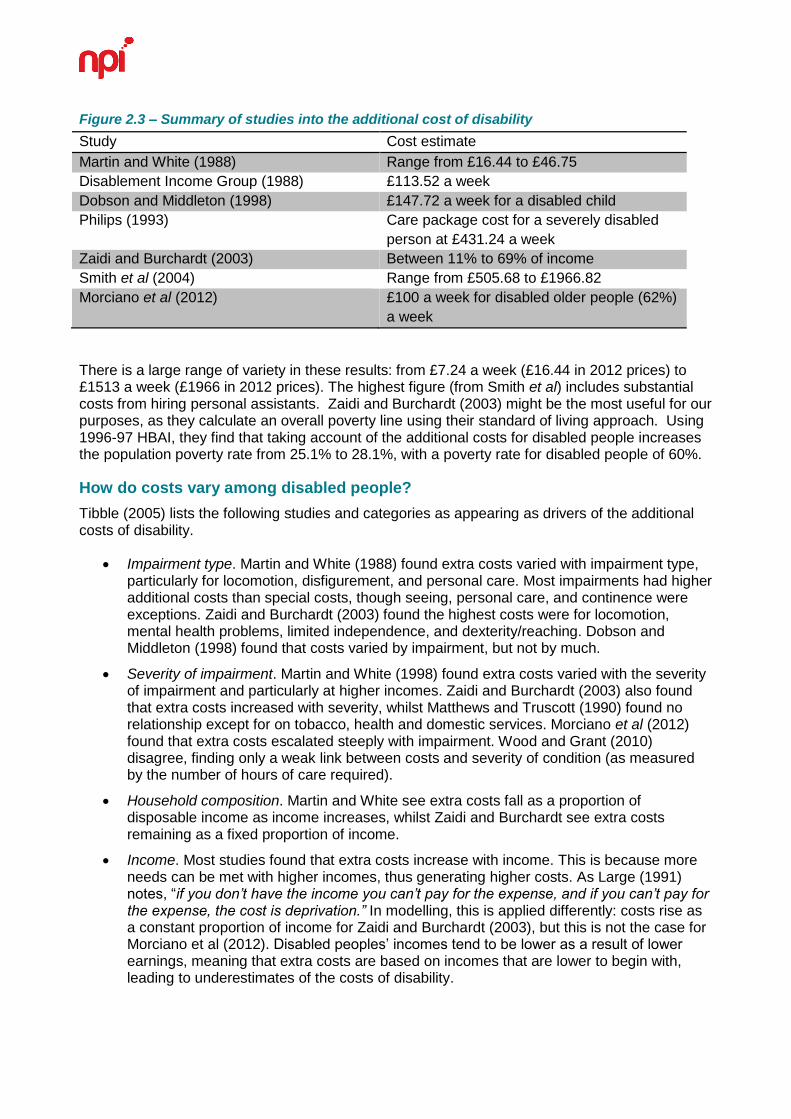
Figure 2.3 – Summary of studies into the additional cost of disability
Study Cost estimate
Martin and White (1988) Range from £16.44 to £46.75
Disablement Income Group (1988) £113.52 a week
Dobson and Middleton (1998) £147.72 a week for a disabled child
Philips (1993) Care package cost for a severely disabled
person at £431.24 a week
Zaidi and Burchardt (2003) Between 11% to 69% of income
Smith et al (2004) Range from £505.68 to £1966.82
Morciano et al (2012) £100 a week for disabled older people (62%)
a week
There is a large range of variety in these results: from £7.24 a week (£16.44 in 2012 prices) to £1513 a week (£1966 in 2012 prices). The highest figure (from Smith et al) includes substantial costs from hiring personal assistants. Zaidi and Burchardt (2003) might be the most useful for our purposes, as they calculate an overall poverty line using their standard of living approach. Using 1996-97 HBAI, they find that taking account of the additional costs for disabled people increases the population poverty rate from 25.1% to 28.1%, with a poverty rate for disabled people of 60%.
How do costs vary among disabled people?
Tibble (2005) lists the following studies and categories as appearing as drivers of the additional costs of disability.
Impairment type. Martin and White (1988) found extra costs varied with impairment type, particularly for locomotion, disfigurement, and personal care. Most impairments had higher additional costs than special costs, though seeing, personal care, and continence were exceptions. Zaidi and Burchardt (2003) found the highest costs were for locomotion, mental health problems, limited independence, and dexterity/reaching. Dobson and Middleton (1998) found that costs varied by impairment, but not by much.
Severity of impairment. Martin and White (1998) found extra costs varied with the severity of impairment and particularly at higher incomes. Zaidi and Burchardt (2003) also found that extra costs increased with severity, whilst Matthews and Truscott (1990) found no relationship except for on tobacco, health and domestic services. Morciano et al (2012) found that extra costs escalated steeply with impairment. Wood and Grant (2010) disagree, finding only a weak link between costs and severity of condition (as measured by the number of hours of care required).
Household composition. Martin and White see extra costs fall as a proportion of disposable income as income increases, whilst Zaidi and Burchardt see extra costs remaining as a fixed proportion of income.
Income. Most studies found that extra costs increase with income. This is because more needs can be met with higher incomes, thus generating higher costs. As Large (1991) notes, “if you don’t have the income you can’t pay for the expense, and if you can’t pay for the expense, the cost is deprivation.” In modelling, this is applied differently: costs rise as a constant proportion of income for Zaidi and Burchardt (2003), but this is not the case for Morciano et al (2012). Disabled peoples’ incomes tend to be lower as a result of lower earnings, meaning that extra costs are based on incomes that are lower to begin with, leading to underestimates of the costs of disability.
Other factors. The Demos (2010) study finds that issues such as the suitability of accommodation, whether in employment or not, and issues around transport are important for driving cost.
For these reasons, combined with the very different figures obtained from the different studies, the expert group3 that we convened at the start of the project felt that it would not be possible to precisely adjust for the extra costs of disability when measuring disability poverty. However, some experts felt that in the long-term, it might be useful to include disability and caring in studies of Minimum Income Standards (a step that we understand is currently being undertaken by the charity Leonard Cheshire).
DISABILITY COST BENEFITS
Whilst easily confused, it is important to separate out the two main types of benefits for disabled people in the UK. There are income-replacement benefits for non-working disabled people, primarily Employment and Support Allowance (ESA) – although formally the Department for Work and Pensions has often referred to these as ‘incapacity benefits’.
This is to be distinguished from ‘disability costs benefits’ that are designed to compensate disabled people for the additional costs they face; these benefits are called Attendance Allowance (‘AA’, for pensioners) and Disability Living Allowance (‘DLA’, primarily for people who are not pensioners when they start claiming). In this section we are focusing on the extra costs of disability, and therefore focus on this second type of disability benefits.
Who receives disability costs benefits?
On average between 2008-09 and 2010-11, there were 5.5 million people living in households where at least one person was in receipt of a component of DLA. Of these, 3 million were working age adults, 1.5 million were pensioners, and around 1 million were children. In addition, a further 1.5 million people lived in households were at least one member was in receipt of AA (1.3 million of these were pensioners). Around 140,000 people lived in households in receipt of both DLA and AA.
People in families in households where someone receives DLA are less likely to be in employment than the general population. The type of employment also differs – people in these households tend to be in part working families rather than full working ones. In households were someone receives DLA, 46% of working age adults and 52% of children are in working families within that household. By contrast, 82% of working age adults and 83% of children are in working families across the whole population.
3 This group met on 30
th May 2013 and included Saghir Alam OBE (human rights lawyer, chair of ADD
international, patron of Include Me Too, member of the Equality and Human Rights Commission disability committee); Leo Capella (disability rights campaigner); Prof Eric Emerson (Professor of Disability & Health Research, Centre for Disability Research, Lancaster University); Tracey Lazard (Chief Executive, Inclusion London); Steve McIntosh (Policy and Public Affairs Manager, Carers UK); Neil McIvor (Deputy Director, Statistical Services Division and Deputy Head of Profession for Statistics, Department for Work and Pensions); Dr Jenny Morris (author of ‘Rethinking Disability Policy’); Liz Sayce OBE (Chief Executive, Disability Rights UK (chair)); Grahame Whitfield (social policy analyst and researcher); and representing the research team, Ben Baumberg and Tom MacInnes.
People in working families in households where someone is receiving DLA are also more likely to be part working – that is, only working part time, or one member working part time and the other not working. 52% of working age adults in this situation are in part working families, and 38% are in full working families (the rest are self-employed). For the general population, the figures are 25% and 62% respectively.
Uptake of disability costs benefits
Many families experience additional costs at the onset of disability and ill-health but do not yet claim the financial support there are entitled to (although exact take-up rates for disability benefits are not published by the DWP). Thomas and Griffiths (2010) in a survey of DLA claimants found that ‘most had waited until faced with financial crisis before applying, or until told by a doctor that they were unlikely to return to work.’ Some had persevered in employment despite significant health conditions; they “made considerable efforts to adapt and mould their work situations around the demands and limitations of their disabilities and health conditions” but “had ultimately left their employment because they could no longer cope”. However, they saw DLA as an out-of-work benefit, rather than as a potential support to retaining their job in the face of new disability and health issues. An early award of DLA (or PIP) could perhaps allow newly diagnosed people to feel confident about the financial risk of taking on a less stressful role or of working fewer hours.
Non-take-up could be reduced if financial / benefits advisors were located alongside hospital social workers or in GP surgeries, who could also work to ensure that debt is avoided (Macmillan, 2013), according to pilot studies. Two reviews of evidence in 2002 (Greasley and Small, 2002) and 2006 (Wiggin and Talbot, 2006) concluded that targeted welfare rights advice, available in primary care settings, improves the financial position of a majority of those who receive it and can also lead to improvements in wellbeing and mental health, although there is no evidence of improvements in physical health.
A more recent study of a similar Citizen’s Advice Bureau Health Outreach (CABHO) initiative confirmed the perception among primary care staff that their workload had been reduced by the initiative and found a statistically significant reduction in the number of GP appointments and prescriptions for hypnotics and anti-anxiety drugs during the six months after referral to CABHO compared with six months before (Krska et al, 2013). In particular, there is evidence that some ‘hard to reach’ groups, including those with the most severe mental ill-health and those from minority ethnic groups, who might most need help in completing benefit forms, are happy to accept welfare rights advice provided in their GP surgery but would not go to a welfare rights office (Wiggin and Talbot, 2006).
There may also be the potential to improve take-up through relatively strong versions of information campaigns. For example, in the late 2000s the DWP tried to encourage applications to Pension Credit, a means-tested benefit for older people on a low income; around 3.3 million people get Pension Credit and the DWP estimates that at least a further million people could be entitled to it but do not claim it. DWP used the customer information it holds to determine who might be eligible for Pension Credit and tried paying the benefit automatically for 12 weeks to those individuals, followed by a letter asking them to claim the benefit.
The official evaluation (Maplethorpe et al, 2010) found that people appreciated being told about entitlements they may not have known about, but most did not then go on to make a claim. They found a number barriers to claiming Pension Credit after the study including: misunderstanding the rationale for the study; feeling that they did not need or were not entitled to Pension Credit; negative experiences of claiming Pension Credit or other benefits in the past; concerns about the claims process and personal circumstances at the time. The Northern Ireland administration took on board these and developed the “Make The Call” initiative which indirectly targets older people, encouraging them to telephone a dedicated helpline for a benefit check and providing assistance in completing forms for Pension Credit, Attendance Allowance and Disability Living Allowance if benefits are unclaimed. This led to some 4,000 over 60 year olds sharing in the receipt of £3.3 million of extra income in 2012/13 (DSD, 2013)
DISABILITY POVERTY, ADJUSTED FOR EXTRA COSTS
Adjustment #1: Excluding disability costs benefits from income
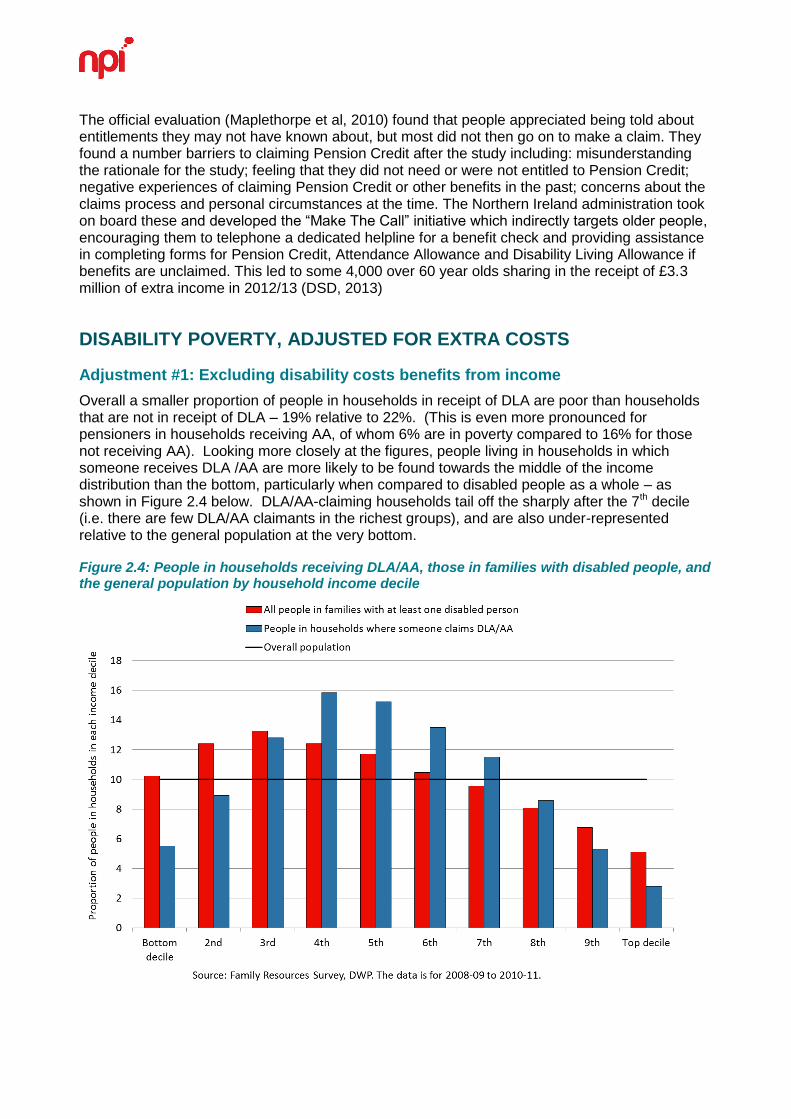
Overall a smaller proportion of people in households in receipt of DLA are poor than households that are not in receipt of DLA – 19% relative to 22%. (This is even more pronounced for pensioners in households receiving AA, of whom 6% are in poverty compared to 16% for those not receiving AA). Looking more closely at the figures, people living in households in which someone receives DLA /AA are more likely to be found towards the middle of the income distribution than the bottom, particularly when compared to disabled people as a whole – as shown in Figure 2.4 below. DLA/AA-claiming households tail off the sharply after the 7th decile (i.e. there are few DLA/AA claimants in the richest groups), and are also under-represented relative to the general population at the very bottom.
Figure 2.4: People in households receiving DLA/AA, those in families with disabled people, and the general population by household income decile
However, this makes an assumption that is difficult to justify: it includes benefits that are given to disabled people on the grounds that these people have extra costs in meeting their needs (DLA/AA), even though these extra costs are not adjusted for in the analysis. So for example, someone who has extra costs amounting to £135/wk and receiving £135/wk in DLA would appear to be £135 better-off than a separate non-disabled person without these costs or this benefit – even though their actual standard of living would be the same.
It therefore makes sense to produce figures that exclude DLA/AA from income, as these do not represent additional resources compared to needs. In doing this, we need to also change the poverty line: given on average between 2008-09 and 2010-11 around 6.9 million people were in households receiving DLA, AA or both, and given their distribution across household income deciles, these benefits shift the poverty line upwards. If we remove DLA and AA, the median income is reduced on average by around £11 a week across the three years, so the poverty line (at 60% of median income) is reduced by around £7/wk.
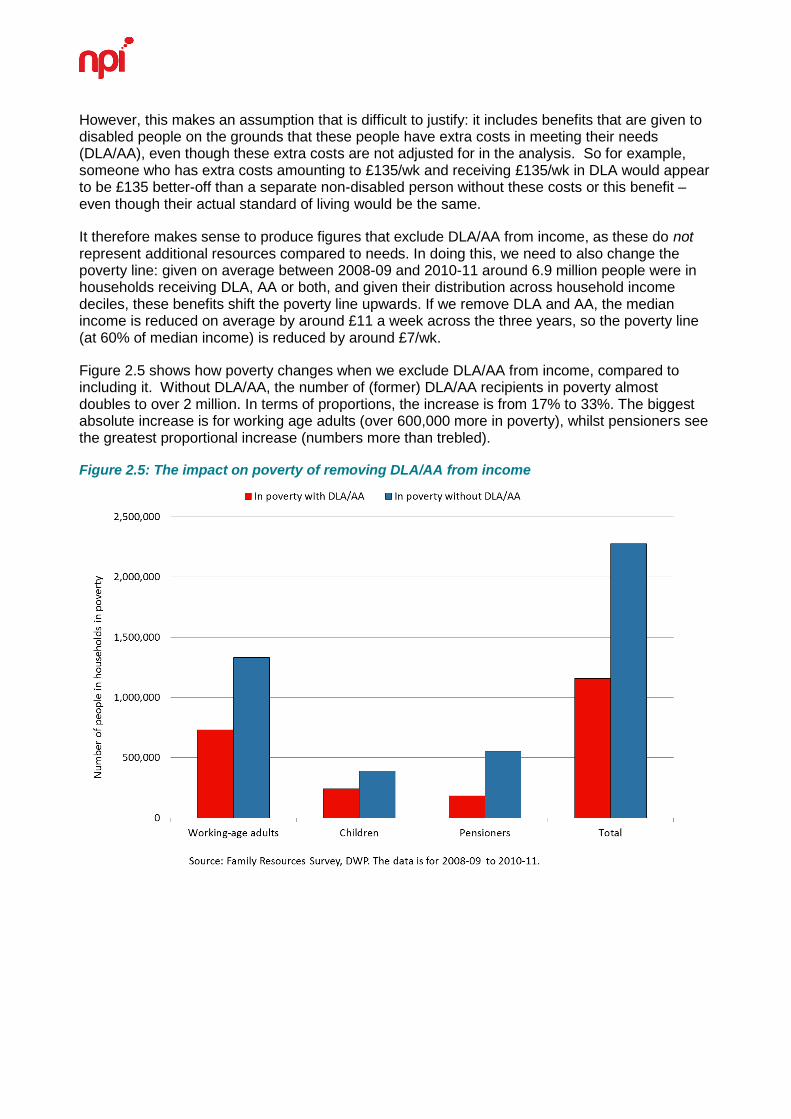
Figure 2.5 shows how poverty changes when we exclude DLA/AA from income, compared to including it. Without DLA/AA, the number of (former) DLA/AA recipients in poverty almost doubles to over 2 million. In terms of proportions, the increase is from 17% to 33%. The biggest absolute increase is for working age adults (over 600,000 more in poverty), whilst pensioners see the greatest proportional increase (numbers more than trebled).
Figure 2.5: The impact on poverty of removing DLA/AA from income
Among those receiving DLA, 42% would have incomes below the poverty line if DLA is excluded (38% for children, 39% for working-age adults, and 51% of pensioners in households where someone is claiming DLA). Around 39% overall are above the poverty line even without DLA, and 19% were in poverty even with DLA included as income. The receipt of AA likewise has a large impact on a household’s standing relative to the poverty line. Around a third of households where someone receives AA are above the poverty line due to receiving AA. Only 7% were in poverty despite receiving AA, whilst the majority (60%) were not in poverty either way.
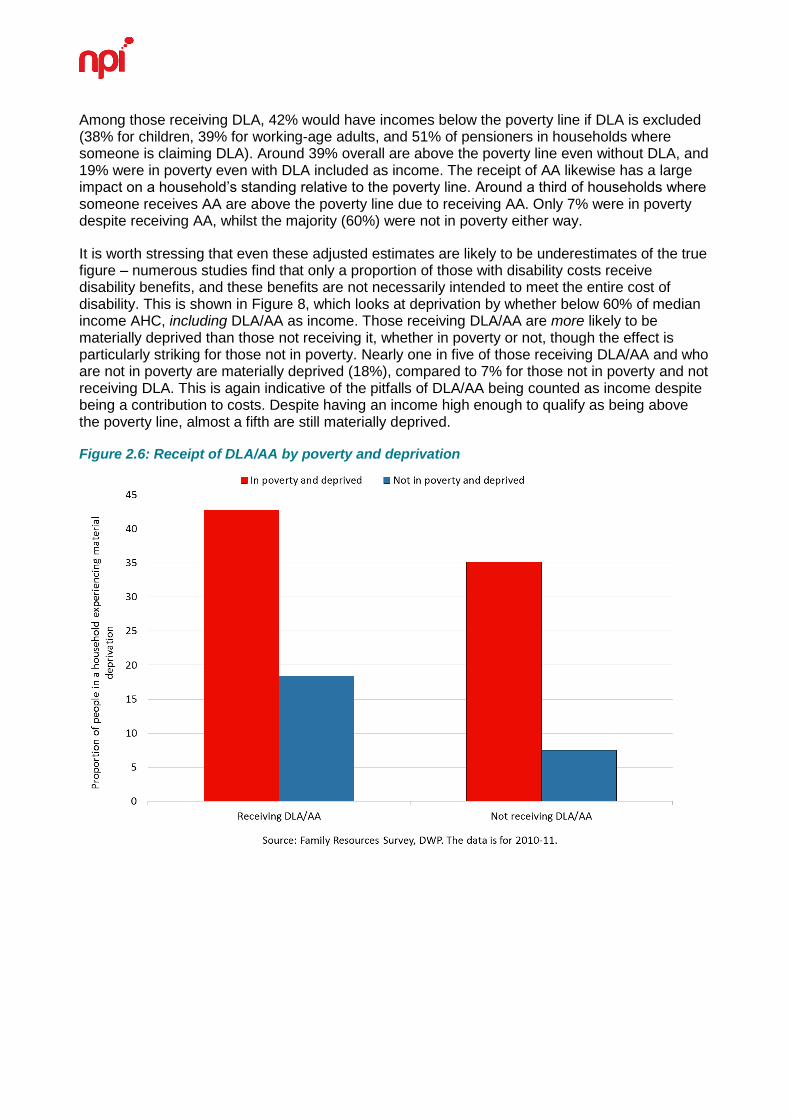
It is worth stressing that even these adjusted estimates are likely to be underestimates of the true figure – numerous studies find that only a proportion of those with disability costs receive disability benefits, and these benefits are not necessarily intended to meet the entire cost of disability. This is shown in Figure 8, which looks at deprivation by whether below 60% of median income AHC, including DLA/AA as income. Those receiving DLA/AA are more likely to be materially deprived than those not receiving it, whether in poverty or not, though the effect is particularly striking for those not in poverty. Nearly one in five of those receiving DLA/AA and who are not in poverty are materially deprived (18%), compared to 7% for those not in poverty and not receiving DLA. This is again indicative of the pitfalls of DLA/AA being counted as income despite being a contribution to costs. Despite having an income high enough to qualify as being above the poverty line, almost a fifth are still materially deprived.
Figure 2.6: Receipt of DLA/AA by poverty and deprivation
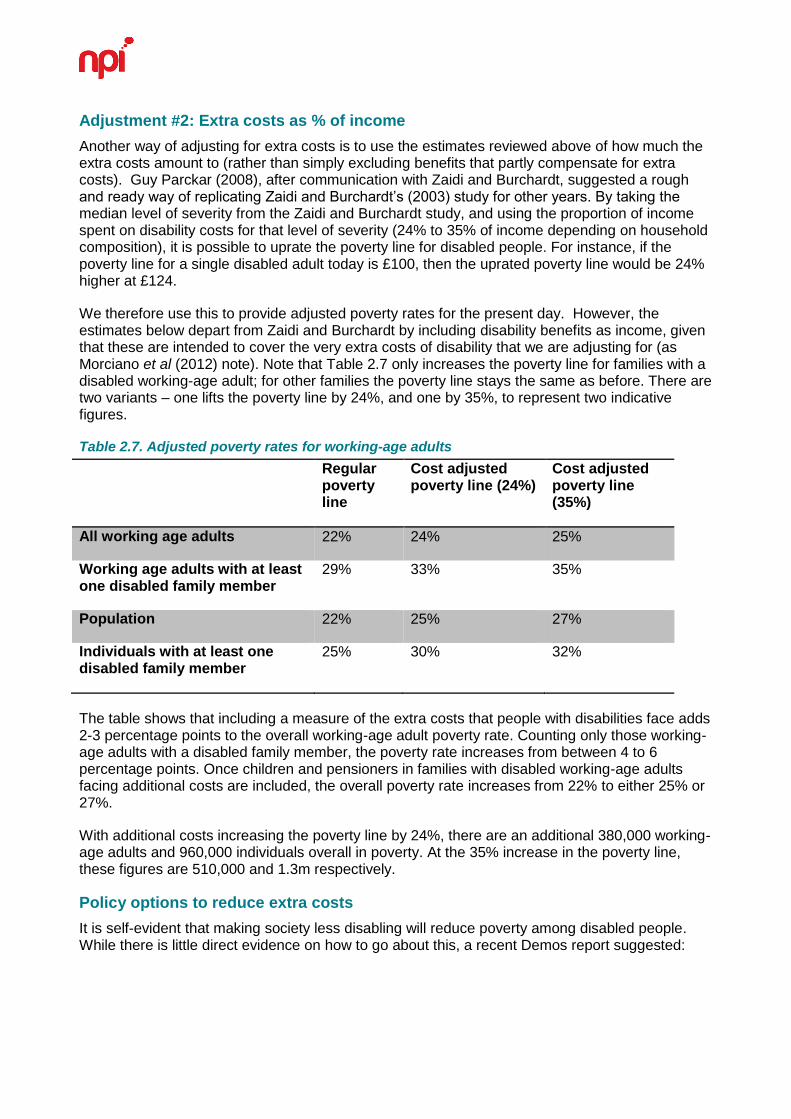
Adjustment #2: Extra costs as % of income
Another way of adjusting for extra costs is to use the estimates reviewed above of how much the extra costs amount to (rather than simply excluding benefits that partly compensate for extra costs). Guy Parckar (2008), after communication with Zaidi and Burchardt, suggested a rough and ready way of replicating Zaidi and Burchardt’s (2003) study for other years. By taking the median level of severity from the Zaidi and Burchardt study, and using the proportion of income spent on disability costs for that level of severity (24% to 35% of income depending on household composition), it is possible to uprate the poverty line for disabled people. For instance, if the poverty line for a single disabled adult today is £100, then the uprated poverty line would be 24% higher at £124.
We therefore use this to provide adjusted poverty rates for the present day. However, the estimates below depart from Zaidi and Burchardt by including disability benefits as income, given that these are intended to cover the very extra costs of disability that we are adjusting for (as Morciano et al (2012) note). Note that Table 2.7 only increases the poverty line for families with a disabled working-age adult; for other families the poverty line stays the same as before. There are two variants – one lifts the poverty line by 24%, and one by 35%, to represent two indicative figures.
Table 2.7. Adjusted poverty rates for working-age adults
Regular poverty line
Cost adjusted poverty line (24%)
Cost adjusted poverty line (35%)
All working age adults 22% 24% 25%
Working age adults with at least one disabled family member
29% 33% 35%
Population 22% 25% 27%
Individuals with at least one disabled family member
25% 30% 32%
The table shows that including a measure of the extra costs that people with disabilities face adds 2-3 percentage points to the overall working-age adult poverty rate. Counting only those working-age adults with a disabled family member, the poverty rate increases from between 4 to 6 percentage points. Once children and pensioners in families with disabled working-age adults facing additional costs are included, the overall poverty rate increases from 22% to either 25% or 27%.
With additional costs increasing the poverty line by 24%, there are an additional 380,000 working-age adults and 960,000 individuals overall in poverty. At the 35% increase in the poverty line, these figures are 510,000 and 1.3m respectively.
Policy options to reduce extra costs
It is self-evident that making society less disabling will reduce poverty among disabled people. While there is little direct evidence on how to go about this, a recent Demos report suggested:
Greater levels of suitable housing could be provided, whether by changing policies in social housing, improving the standards of new-build homes, or helping disabled people own (and adapt) their own home.
There could be greater enforcement of the ‘reasonable adjustment’ obligation in public transport. For private transport, the Motability scheme could be made more widely available (rather than being restricted under PIP).
The private markets for specialist equipment, clothing, food and non-prescription medicines could be made to work better, reducing costs for disabled people.
Some of these adaptations, particularly for housing, could prove expensive if applied t all homes, so the emphasis would be on new builds. These ideas form part of a broader approach towards housing “sustainability”, and the idea that housing should be flexible and usable for different types of people – old and young, disabled or not, with or without children and so forth.
The policy workshop we held with disabled people (facilitated by Disability Right UK) made a series of recommendations on these issues – see Chapter 7.
Conclusion
The calculations above are largely indicative. Using the first method of adjustment, there are over 1 million extra people in households with a person claiming DLA/AA in poverty; using the second method of adjustment, there are 1.3-1.8m extra people in households with a disabled person in poverty. While a precise adjustment for the extra costs of disability is impossible, these estimates show that the headline poverty rate substantially underestimates poverty among disabled people.
21
3. FURTHER UNPACKING DISABILITY AND POVERTY
The previous chapter has focused on the headline disability poverty rate, and the way in which this is affected by accounting for the extra costs of disability. In this chapter we focus on further analyses of disability and poverty: (i) disability benefits and how to properly measure disability poverty; (ii) disability poverty over the lifecourse and among different family types; (iii) the link of mental health to poverty, and (iv) international comparisons of the poverty rate.
DISABILITY, FAMILY TYPE AND THE LIFECOURSE
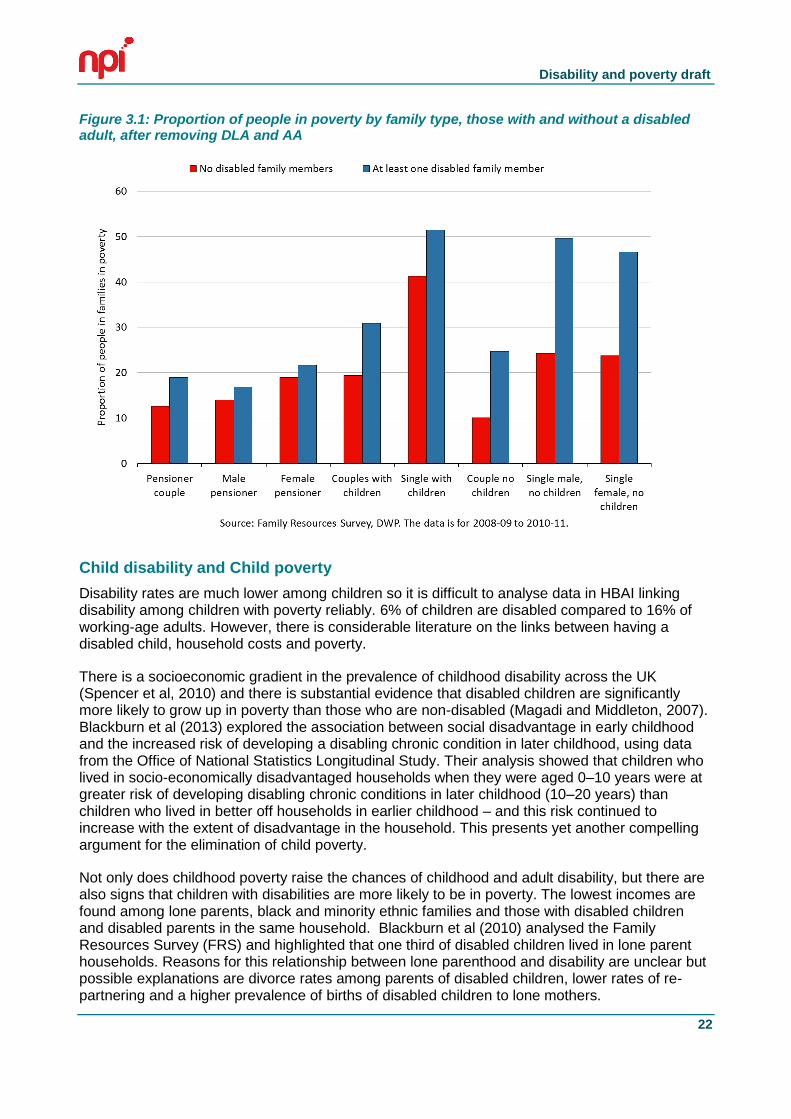
The risk of poverty varies by family type, both for those families with and without a disabled adult. The graph below shows, for the years 2008/09 to 2010/11, the proportion of people living in poverty broken down by type of family – single or couple, with or without children, working age or pensioner – for families with and without a disabled adult. Following the analysis in the previous chapter, the poverty threshold is measured after DLA and AA have been removed from income.
For both families with and without a disabled person, the highest risk of poverty is among lone parent families. Just over half of those in lone parent families with a disabled person live in poverty, as do 40% of those in families with no disabled person.
The biggest gap between families with and without disabled members is for single, working age adults – that is, disabled adults living alone. Almost half of disabled women and men living alone are in poverty, compared to around one quarter of non-disabled single adults. This two –to –one increase in the risk of poverty is also true for working age couples without children, albeit at a lower level of risk. Around 25% of working age couples without children where one or both are disabled live in poverty, compared to 10% of such couples with no disabled person.
Disability and poverty draft
22
Figure 3.1: Proportion of people in poverty by family type, those with and without a disabled adult, after removing DLA and AA
Child disability and Child poverty
Disability rates are much lower among children so it is difficult to analyse data in HBAI linking disability among children with poverty reliably. 6% of children are disabled compared to 16% of working-age adults. However, there is considerable literature on the links between having a disabled child, household costs and poverty.
There is a socioeconomic gradient in the prevalence of childhood disability across the UK (Spencer et al, 2010) and there is substantial evidence that disabled children are significantly more likely to grow up in poverty than those who are non-disabled (Magadi and Middleton, 2007). Blackburn et al (2013) explored the association between social disadvantage in early childhood and the increased risk of developing a disabling chronic condition in later childhood, using data from the Office of National Statistics Longitudinal Study. Their analysis showed that children who lived in socio-economically disadvantaged households when they were aged 0–10 years were at greater risk of developing disabling chronic conditions in later childhood (10–20 years) than children who lived in better off households in earlier childhood – and this risk continued to increase with the extent of disadvantage in the household. This presents yet another compelling argument for the elimination of child poverty.
Not only does childhood poverty raise the chances of childhood and adult disability, but there are also signs that children with disabilities are more likely to be in poverty. The lowest incomes are found among lone parents, black and minority ethnic families and those with disabled children and disabled parents in the same household. Blackburn et al (2010) analysed the Family Resources Survey (FRS) and highlighted that one third of disabled children lived in lone parent households. Reasons for this relationship between lone parenthood and disability are unclear but possible explanations are divorce rates among parents of disabled children, lower rates of re-partnering and a higher prevalence of births of disabled children to lone mothers.
Disability and poverty draft
23
There is also evidence of a clustering of child and adult disability in the same household (Blackburn et al, 2010). Disabled children were more likely to live with disabled siblings and other disabled children than non-disabled children. One quarter of children with a DDA defined disability lived with one or more siblings who also had a DDA-defined disability. This clustering may help to explain the high levels of material deprivation in which disabled children live. Families with disabled children are more likely to be in debt. In Blackburn et al’s (2010) analysis of the FRS, they found the highest proportion reporting debts was among families with both disabled children and disabled adults. Being behind with payments for council tax, water rates and telephone bills were the most commonly reported sources of debt. But households with a disabled child were also more likely to have child-related deprivation such as lacking leisure equipment, having a friend around for tea or a snack once a fortnight and having an outdoor space or facilities nearby where s/he can play.
This is not the only reason that disabled children are more likely to be in poverty. Qualitative studies of parents of children with complex disabilities suggest that, because parents will often stay with a child who is undergoing tests or treatment in the hospital, it can be a very expensive time for families (Dobson and Middleton, 1998; Monteith et al, 2009). Additional costs include: organising and paying for other children to be looked after, buying a dressing gown, slippers and treats for the child who will in hospital, transport to and from home, paying for food while in the hospital. One report found that the largest proportion of the minimum essential budget for disabled children goes on transport costs (Contact-a-Family, 2012).
Other research found that a third of families with a severely disabled child had to seek grants to cover their transport related costs. For families forced to travel hundreds of miles per year to access specialist services for their disabled children, the cost implications are particularly stark. In a study carried out for Scope, some families not only had to travel to these services but because of the distance from home had to stay overnight. These travel requirements and costs are cumulative, for families accessing one or more of the services the study explored. It found that the average distance travelled by these families is nearly 4,000 miles a year which would cost around £360 in petrol. The average time spent travelling to services is 219 hours per year. The worst-case scenario was one family travelling nearly 18,000 miles a year (345 miles a week) or nearly 700 hours per year to access the various services their child needed (Brawn and Rogers, 2012).
In addition, the ‘inverse care law’ may also be in play, further disadvantaging the poorest children. We have known for some time that among families with disabled children, the poorest 20 per cent tend to receive fewer services than better off families (Gordon et al, 2000). A more recent study for the Department for Education found inequality in access to short breaks, with poorer families tending to receive less support than those who were better off (Welch and others, 2010).
Older disabled people and poverty
Hill et al (2012) found that nearly one in ten older people admit to be either “finding it difficult” or “really struggling” to manage on their income - and an estimated 4.5 million (a third of older people) can only just afford to buy the basics. Barnes (2012) analysed data from the English Longitudinal Study of Ageing (ELSA), which collected information from pensioners in 2008 and grouped pensioners according to the forms of poverty they experienced. This produced five groups:
Avoid poverty (49 per cent)
Low vulnerability (27 per cent)
Financial poverty (17 per cent)
Low wealth and assets (4 per cent)
Wide-ranging disadvantage (3 per cent)
Disability and poverty draft
24
The first group, which is able to avoid poverty altogether, is likely to have no health problems and have a private pension as their main source of income. The ‘low vulnerability’ group is likely to have claimed health benefits in the last year, while the poorest old people had both physical and mental health problems.
Health was a major issue, increasing pensioners’ expenditure and restricted their ability to save money, according to Hill et al (2012). Having poor health and mobility meant older people had to increase the amount they spent on transport and getting around; they had to for help at home and additional aids, spend more on heating and water and were less likely to be able to shop cheaply.
Several participants in Hill et al’s study referred to difficulty getting to and from bus stops and/or being unable physically to access buses and, as a result, being unable to take advantage of their free bus pass. Those who have to use taxis worried about the amount of money this could involve, particularly if travelling to hospitals or GPs some distance away, with those living in rural locations being particularly disadvantaged.
Older people who had health problems had also spent money on other mobility aids, such as a ‘riser’ chair, special telephone systems or handsets, and shower aids. Some people who needed these aids did not receive any health benefits. Similarly, some older people who needed personal care had to pay themselves for that care; for some this meant paying social services’ charges, for others paying directly. Those who needed such help were in no doubt that they could not manage without it and therefore had no choice but to pay for it. This was the case even when there was family nearby.
As with younger disabled people, older people with poor health or mobility issues told Hill et al (2012) that disability or ill-health often made additional heat necessary. Many with such conditions felt that they would have liked to have the heating on more often and for longer than they actually did. Water charges were an issue for some, especially if illness or incontinence required bedding and clothing to be washed more frequently, thus incurring greater costs. Again, this is an issue also faced in households where there are younger disabled people.
POVERTY AND MENTAL ILL-HEALTH
The link between depression and living on low incomes has been well established by a series of large-scale quantitative studies (Dohrenwend et al, 1999; Harris, 2001). A comprehensive meta-analysis by Lorant et al (2003) concluded that both studies of who has depression and of who becomes depressed show that people living in poverty (and with lower levels of educational qualifications) are at a higher risk of depression. This is not just about poverty however; Mangalore et al (2007) found wider income-related inequalities in mental health (using the 2000 Psychiatric Morbidity Survey), which were steeper for more severe problems, and were strongest of all for psychosis.
Disability and poverty draft
25
The direction of causality in this association is likely to run in both directions, with mental health leading to poverty, and poverty leading to worse mental health. The Royal College of Psychiatrists Scoping Group on Social Exclusion and Mental Health (as reported in Boardman 2011) emphasises that worklessness, financial problems and debt, housing problems, relationship conflict and breakdown and ill health due to stress are interlinked and contribute to difficulties with education and employment. Such inequalities are cumulative over an individual's lifetime and may affect the next generation through the impact of persistent poverty on children. Methodological limitations in existing longitudinal studies made it difficult for Fitch et al (2011) to demonstrate definitively whether indebtedness causes, or temporally precedes, poorer mental health. However, their systematic review of evidence for a relationship between personal debt and mental health found that “sufficient plausible quantitative data exist which indicate that indebtedness may contribute to the development of mental health problems, as well as mediate accepted relationships between poverty and mental disorder”, and this data is supported by qualitative data highlighting the lived experience of coping with both financial and mental health problems.
People with mental health problems are the fastest growing group of claimants of disability-related benefits and are more likely not to be in paid work than people with other types of health problems. Yet, under current rules for claiming the main income-replacement disability benefit ESA (Employment and Support Allowance), many are considered ‘fit to work’ and so have or will have their benefit incomes cut, while the move from DLA to PIP involves a further tightening of eligibility criteria.
While the earlier literature related poverty and depression to unemployment, there is now a body of literature indicating that low quality work contributes to the development of psychological ill-health or exacerbates existing mental health problems. Mitchie and Williams’ (2003) systematic review found that key work factors associated with psychological ill health and sickness absence in staff were long hours worked, work overload and pressure, and the effects of these on personal lives; lack of control over work; lack of participation in decision making; poor social support; unclear management and work role; interpersonal conflict; and conflict between work and family demands. Long hours were found to be associated with depression in women, but not in men. Employment in occupations involving potential exposure to work related threats and violence has also been shown to be a risk factor for psychiatrically diagnosed affective and stress related disorders in both sexes (Wieclaw et al, 2006). As we will see below, a positive psychosocial environment in the workplace is an important determinant of whether mental distress becomes mental ill-health, with the accompanying risk of falling into poverty.
INTERNATIONAL COMPARISONS OF DISABILITY POVERTY
International comparisons of disability itself
As described in Chapter 2, we used EU-SILC data to compare the situation of disabled people across the UK and 14 similar European countries, based on a measure of whether people report being ‘strongly limited in their daily activities’. Before comparing disability poverty rates, however, it is important to understand the differences in self-reported disability per se between countries.
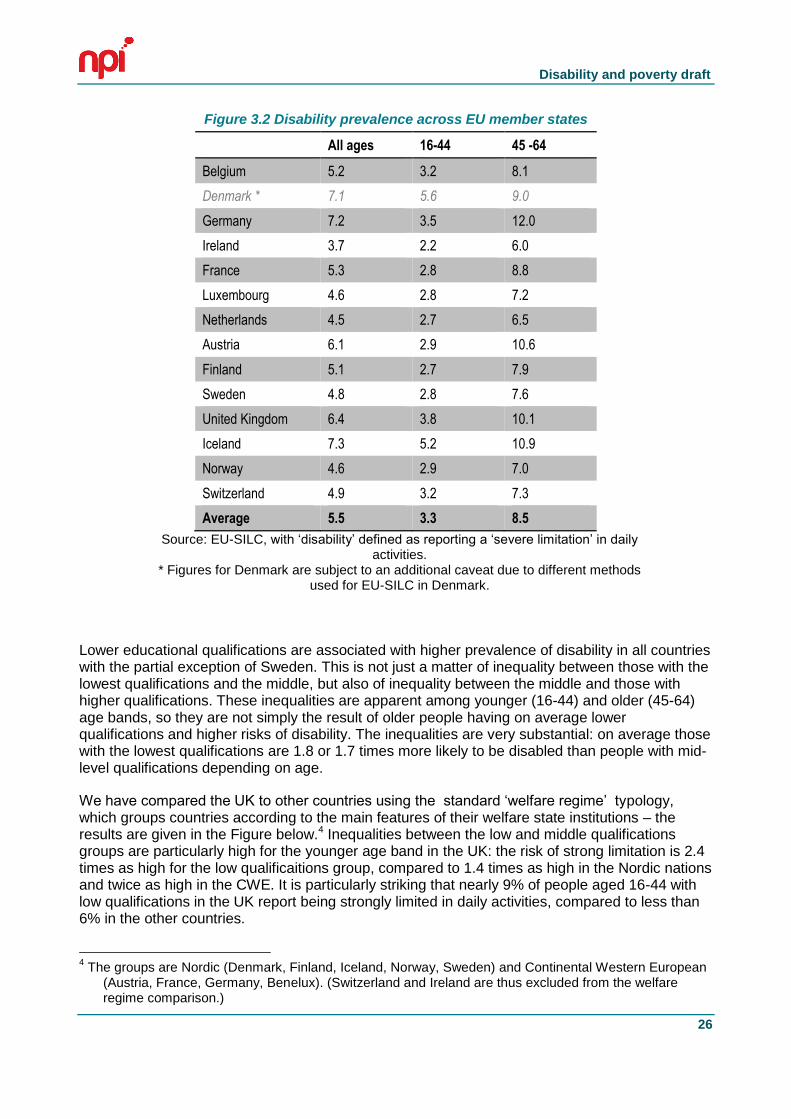
On average across these countries, 5.5% of people aged 16-64 report being strongly limited in daily activities. The UK is above the average at 6.4%, similar to Austria but lower than Germany or Iceland. Rates of disability tend to increase with age, with 3.3% of people age 16-44 reporting strong limitation in this group of countries compared to 8.5% of people age 45-64. The UK is slightly above the average for the younger age group and more so for the older group.
Disability and poverty draft
26
Figure 3.2 Disability prevalence across EU member states
All ages 16-44 45 -64
Belgium 5.2 3.2 8.1
Denmark * 7.1 5.6 9.0
Germany 7.2 3.5 12.0
Ireland 3.7 2.2 6.0
France 5.3 2.8 8.8
Luxembourg 4.6 2.8 7.2
Netherlands 4.5 2.7 6.5
Austria 6.1 2.9 10.6
Finland 5.1 2.7 7.9
Sweden 4.8 2.8 7.6
United Kingdom 6.4 3.8 10.1
Iceland 7.3 5.2 10.9
Norway 4.6 2.9 7.0
Switzerland 4.9 3.2 7.3
Average 5.5 3.3 8.5
Source: EU-SILC, with ‘disability’ defined as reporting a ‘severe limitation’ in daily activities.
* Figures for Denmark are subject to an additional caveat due to different methods used for EU-SILC in Denmark.
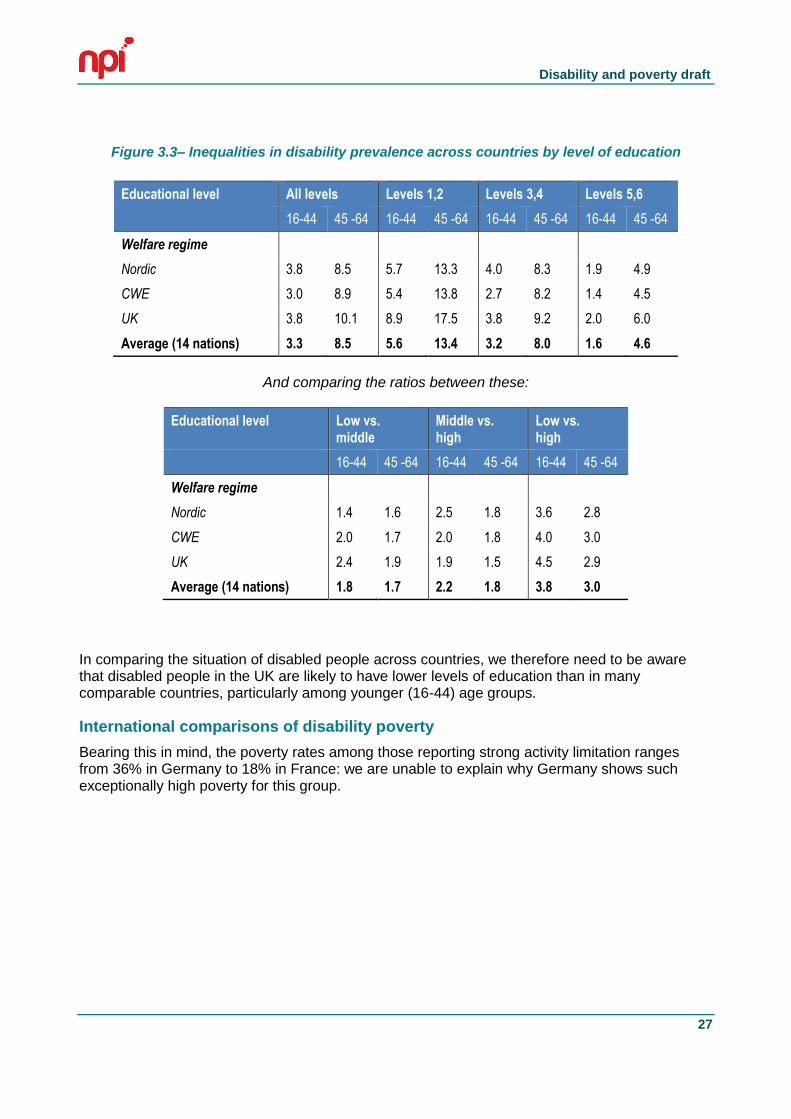
Lower educational qualifications are associated with higher prevalence of disability in all countries with the partial exception of Sweden. This is not just a matter of inequality between those with the lowest qualifications and the middle, but also of inequality between the middle and those with higher qualifications. These inequalities are apparent among younger (16-44) and older (45-64) age bands, so they are not simply the result of older people having on average lower qualifications and higher risks of disability. The inequalities are very substantial: on average those with the lowest qualifications are 1.8 or 1.7 times more likely to be disabled than people with mid-level qualifications depending on age.
We have compared the UK to other countries using the standard ‘welfare regime’ typology, which groups countries according to the main features of their welfare state institutions – the results are given in the Figure below.4 Inequalities between the low and middle qualifications groups are particularly high for the younger age band in the UK: the risk of strong limitation is 2.4 times as high for the low qualificaitions group, compared to 1.4 times as high in the Nordic nations and twice as high in the CWE. It is particularly striking that nearly 9% of people aged 16-44 with low qualifications in the UK report being strongly limited in daily activities, compared to less than 6% in the other countries.
4 The groups are Nordic (Denmark, Finland, Iceland, Norway, Sweden) and Continental Western European
(Austria, France, Germany, Benelux). (Switzerland and Ireland are thus excluded from the welfare regime comparison.)
Disability and poverty draft
27
Figure 3.3– Inequalities in disability prevalence across countries by level of education
Educational level All levels Levels 1,2 Levels 3,4 Levels 5,6
16-44 45 -64 16-44 45 -64 16-44 45 -64 16-44 45 -64
Welfare regime
Nordic 3.8 8.5 5.7 13.3 4.0 8.3 1.9 4.9
CWE 3.0 8.9 5.4 13.8 2.7 8.2 1.4 4.5
UK 3.8 10.1 8.9 17.5 3.8 9.2 2.0 6.0
Average (14 nations) 3.3 8.5 5.6 13.4 3.2 8.0 1.6 4.6
And comparing the ratios between these:
Educational level Low vs. middle
Middle vs. high
Low vs. high
16-44 45 -64 16-44 45 -64 16-44 45 -64
Welfare regime
Nordic 1.4 1.6 2.5 1.8 3.6 2.8
CWE 2.0 1.7 2.0 1.8 4.0 3.0
UK 2.4 1.9 1.9 1.5 4.5 2.9
Average (14 nations) 1.8 1.7 2.2 1.8 3.8 3.0
In comparing the situation of disabled people across countries, we therefore need to be aware that disabled people in the UK are likely to have lower levels of education than in many comparable countries, particularly among younger (16-44) age groups.
International comparisons of disability poverty
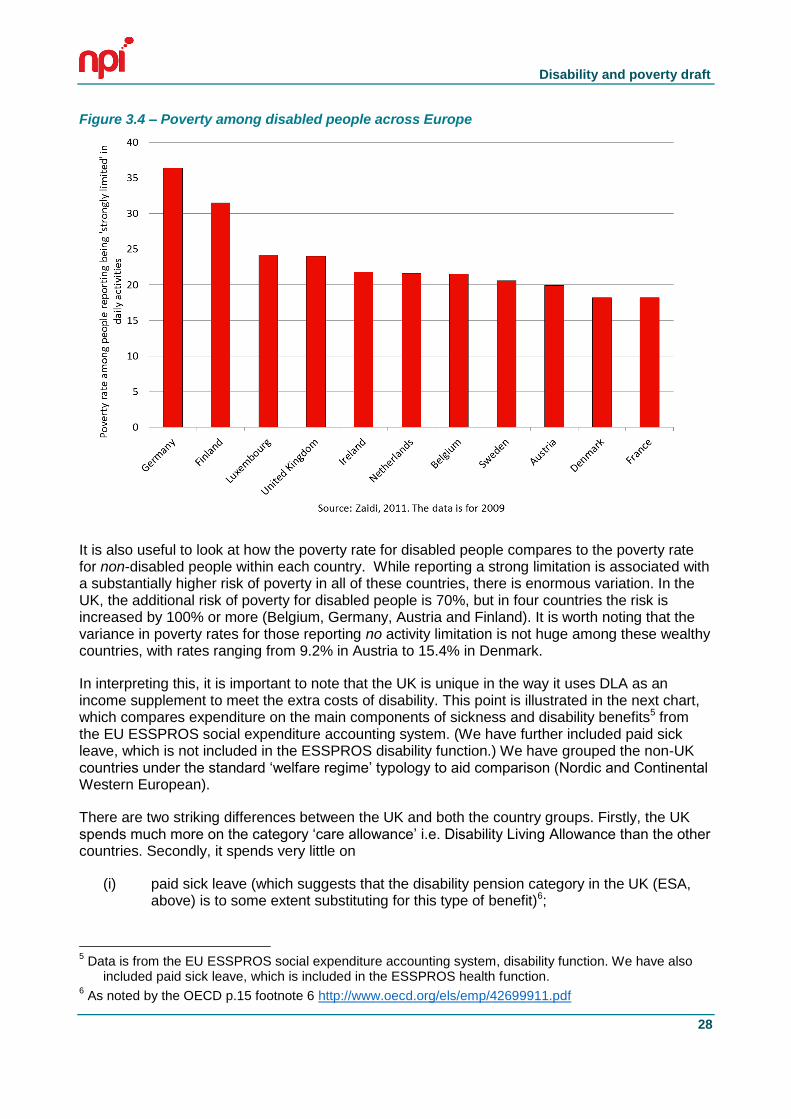
Bearing this in mind, the poverty rates among those reporting strong activity limitation ranges from 36% in Germany to 18% in France: we are unable to explain why Germany shows such exceptionally high poverty for this group.
Disability and poverty draft
28
Figure 3.4 – Poverty among disabled people across Europe
It is also useful to look at how the poverty rate for disabled people compares to the poverty rate for non-disabled people within each country. While reporting a strong limitation is associated with a substantially higher risk of poverty in all of these countries, there is enormous variation. In the UK, the additional risk of poverty for disabled people is 70%, but in four countries the risk is increased by 100% or more (Belgium, Germany, Austria and Finland). It is worth noting that the variance in poverty rates for those reporting no activity limitation is not huge among these wealthy countries, with rates ranging from 9.2% in Austria to 15.4% in Denmark.
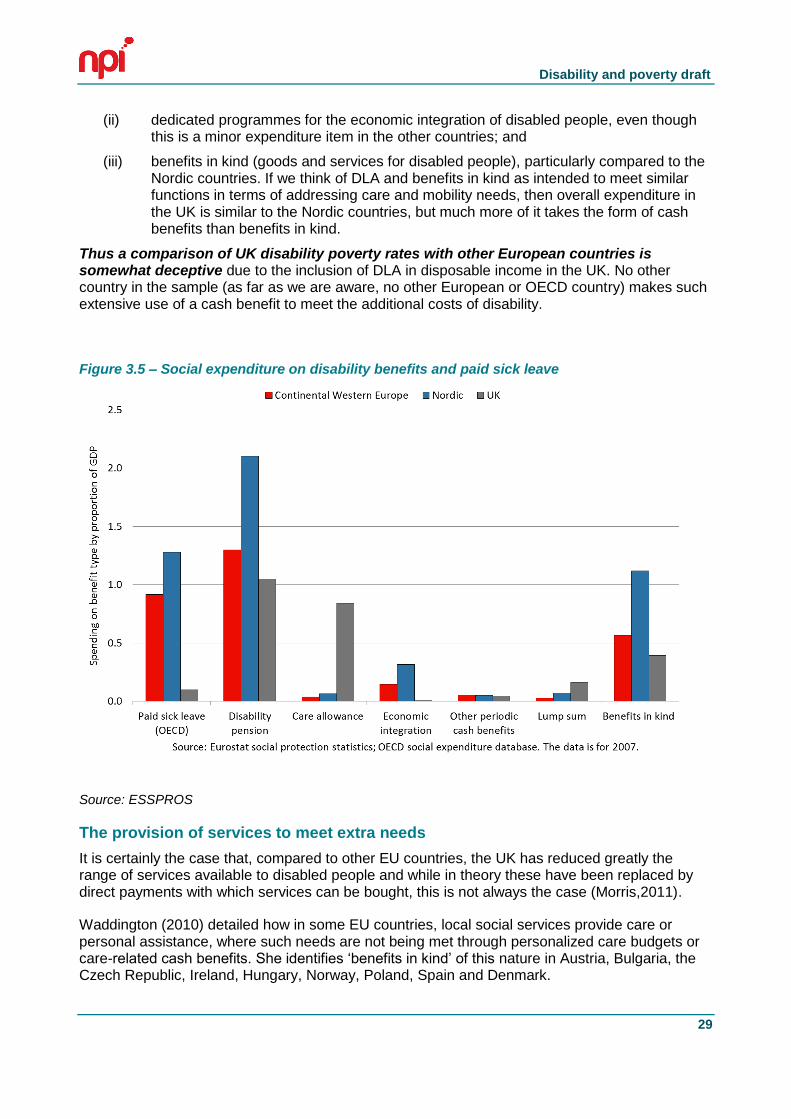
In interpreting this, it is important to note that the UK is unique in the way it uses DLA as an income supplement to meet the extra costs of disability. This point is illustrated in the next chart, which compares expenditure on the main components of sickness and disability benefits5 from the EU ESSPROS social expenditure accounting system. (We have further included paid sick leave, which is not included in the ESSPROS disability function.) We have grouped the non-UK countries under the standard ‘welfare regime’ typology to aid comparison (Nordic and Continental Western European).
There are two striking differences between the UK and both the country groups. Firstly, the UK spends much more on the category ‘care allowance’ i.e. Disability Living Allowance than the other countries. Secondly, it spends very little on
(i) paid sick leave (which suggests that the disability pension category in the UK (ESA, above) is to some extent substituting for this type of benefit)6;
5 Data is from the EU ESSPROS social expenditure accounting system, disability function. We have also
included paid sick leave, which is included in the ESSPROS health function. 6 As noted by the OECD p.15 footnote 6 http://www.oecd.org/els/emp/42699911.pdf
Disability and poverty draft
29
(ii) dedicated programmes for the economic integration of disabled people, even though this is a minor expenditure item in the other countries; and
(iii) benefits in kind (goods and services for disabled people), particularly compared to the Nordic countries. If we think of DLA and benefits in kind as intended to meet similar functions in terms of addressing care and mobility needs, then overall expenditure in the UK is similar to the Nordic countries, but much more of it takes the form of cash benefits than benefits in kind.
Thus a comparison of UK disability poverty rates with other European countries is somewhat deceptive due to the inclusion of DLA in disposable income in the UK. No other country in the sample (as far as we are aware, no other European or OECD country) makes such extensive use of a cash benefit to meet the additional costs of disability.
Figure 3.5 – Social expenditure on disability benefits and paid sick leave
Source: ESSPROS
The provision of services to meet extra needs
It is certainly the case that, compared to other EU countries, the UK has reduced greatly the range of services available to disabled people and while in theory these have been replaced by direct payments with which services can be bought, this is not always the case (Morris,2011).
Waddington (2010) detailed how in some EU countries, local social services provide care or personal assistance, where such needs are not being met through personalized care budgets or care-related cash benefits. She identifies ‘benefits in kind’ of this nature in Austria, Bulgaria, the Czech Republic, Ireland, Hungary, Norway, Poland, Spain and Denmark.
Disability and poverty draft
30
In Bulgaria, some municipalities and non-governmental organisations have projects that target unemployed people, including family members, who train to become personal assistants to disabled people. The disabled clients are selected on the basis of their daily needs, and can receive up to 4 hours of personal assistance a day.
In the Czech Republic, disabled people can access services including personal assistance, guidance and reading services, sign-language interpretation, access to day care centres and therapeutic services, as well as supported and sheltered accommodation.
A scheme that aims to meet the social rather than care needs of an individual is available in Denmark, where disabled people can benefit from up to 15 hours of companionship or escort per month.
In Ireland the Personal Assistance Service is funded by the Health Service Executive, but administered by voluntary or community organizations. It provides personal assistants to enable individuals with physical or sensory impairments to live independently in the community. The assistant can provide personal care, domestic support, or support in accessing employment or education, in accordance with the needs of the disabled individual. It ought to be noted that disabled people’s organisations report that this service has suffered in austerity-related cuts, resulting in a long waiting list for those who wish to avail of the service.
In Norway local municipalities provide disabled people with personal assistants. In both Ireland and Norway, the disabled individual is not the PA’s employer, but is is the PA’s ’line manager’ and therefore involved in the recruitment process, and directs his or her work (Murphy et al, 2006).
In the Netherlands, municipalities provide a range of practical assistance to facilitate participation in the local community, including personal assistance, transport, and transport related equipment for which recipients have to pay an income-related contribution. In Austria, people with mobility impairments can receive a “Eurokey”, which can be used to gain access to accessible toilets and some lifts in public places and can also be used in Germany, Switzerland and Italy.
Welfare states vary in the ways in which they enable disabled people to access services. The UK is distinctive in its reliance on cash benefits which disabled people can use as they see fit. While in principle this should give disabled people greater autonomy the outcomes depend on the availability and cost of services. Ironically, the use of cash benefits can distort poverty rates, making comparisons between the UK and other countries difficult and understating poverty among disabled people in the UK. Where services are accessed through benefits in kind (either direct/subsidised provision or cash benefits tied to specific functions) this does not necessarily mean that clients have no choice.
31
4.DISABILITY AND PAID WORK
This chapter focuses on how disabled people can be assisted to access employment as a possible route out of poverty. But it is important to acknowledge that the way in which work is organised at present excludes many disabled people. For example, there is considerable evidence that for people with a range of conditions which fluctuate, both physical and mental, it is difficult to sustain most jobs; for others, their condition may require a lot of work to manage, thereby leaving little time or energy for paid work.
People with significant learning disability/intellectual impairments and those with complex or multiple impairments are almost totally excluded from the world of work, except through supported schemes.
We return to the issue of how schemes can help disabled people into work in the next chapter. This chapter begins by looking at the links between work, poverty and disability using analysis of HBAI. It then looks in particular at employment barriers for those with a mental health problem.
DISABILITY, POVERTY, AND WORK
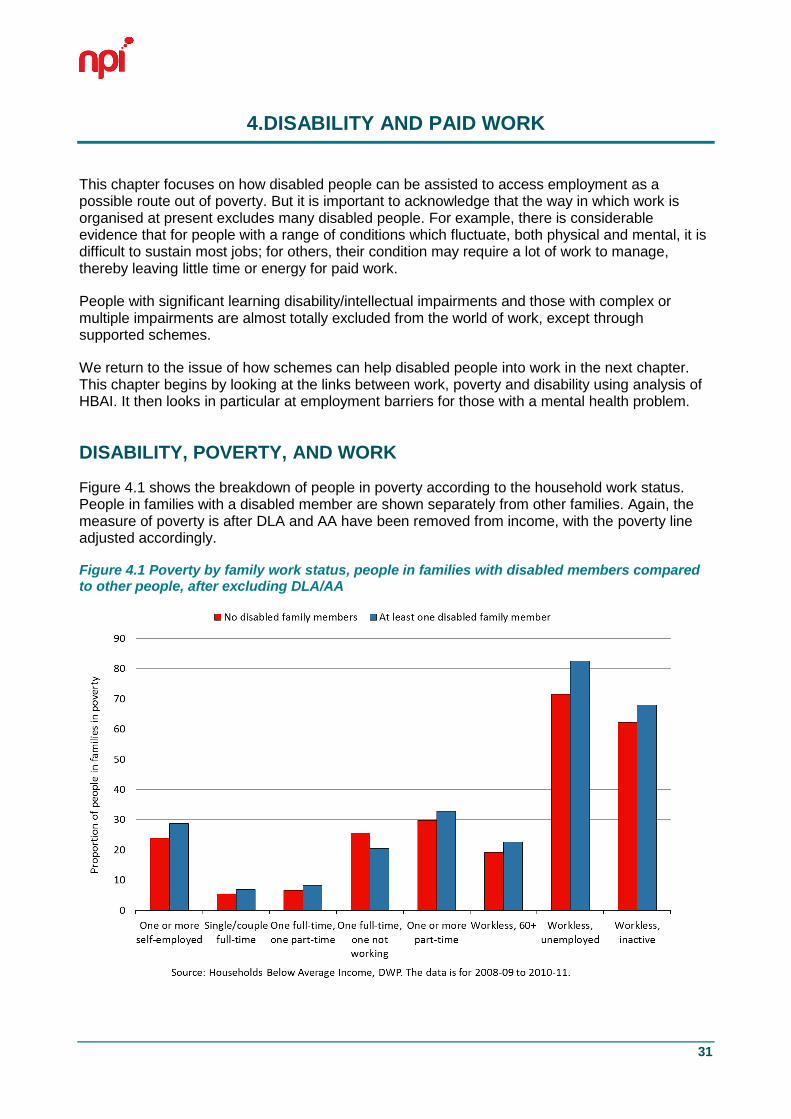
Figure 4.1 shows the breakdown of people in poverty according to the household work status. People in families with a disabled member are shown separately from other families. Again, the measure of poverty is after DLA and AA have been removed from income, with the poverty line adjusted accordingly.
Figure 4.1 Poverty by family work status, people in families with disabled members compared to other people, after excluding DLA/AA
Disability and poverty draft
32
For almost all family work statuses, the risk of poverty for people living in a family with a disabled member is higher than for those in other families. The only exception is among families with one working and one non-working adult, though the reason for this is unclear. The biggest difference in percentage point terms is in unemployed families, where those in families with a disabled member are around 10 percentage points more likely to be in poverty. This is, though, a small group, regardless of the disability status of family members.
THE DISABILITY EMPLOYMENT PENALTY
Disability at the level of the individual is correlated with poorer outcomes in the labour market, even once controls such as the level of qualification have been added.
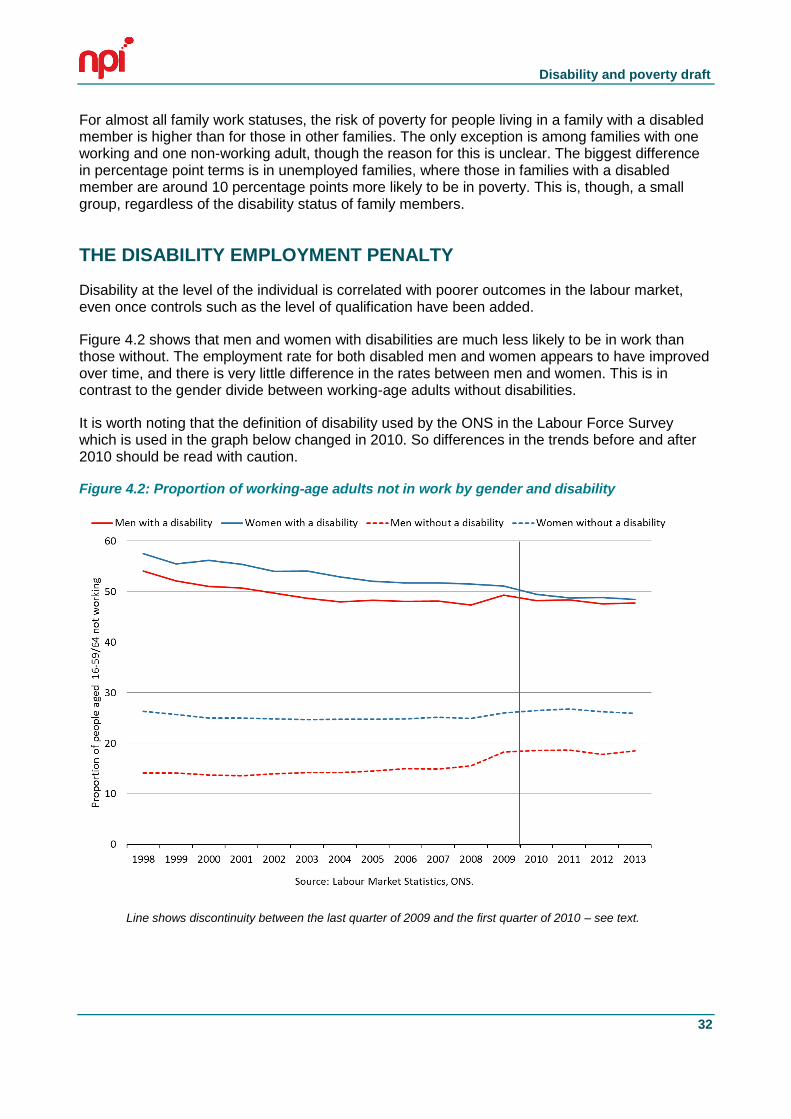
Figure 4.2 shows that men and women with disabilities are much less likely to be in work than those without. The employment rate for both disabled men and women appears to have improved over time, and there is very little difference in the rates between men and women. This is in contrast to the gender divide between working-age adults without disabilities.
It is worth noting that the definition of disability used by the ONS in the Labour Force Survey which is used in the graph below changed in 2010. So differences in the trends before and after 2010 should be read with caution.
Figure 4.2: Proportion of working-age adults not in work by gender and disability
Line shows discontinuity between the last quarter of 2009 and the first quarter of 2010 – see text.
Disability and poverty draft
33
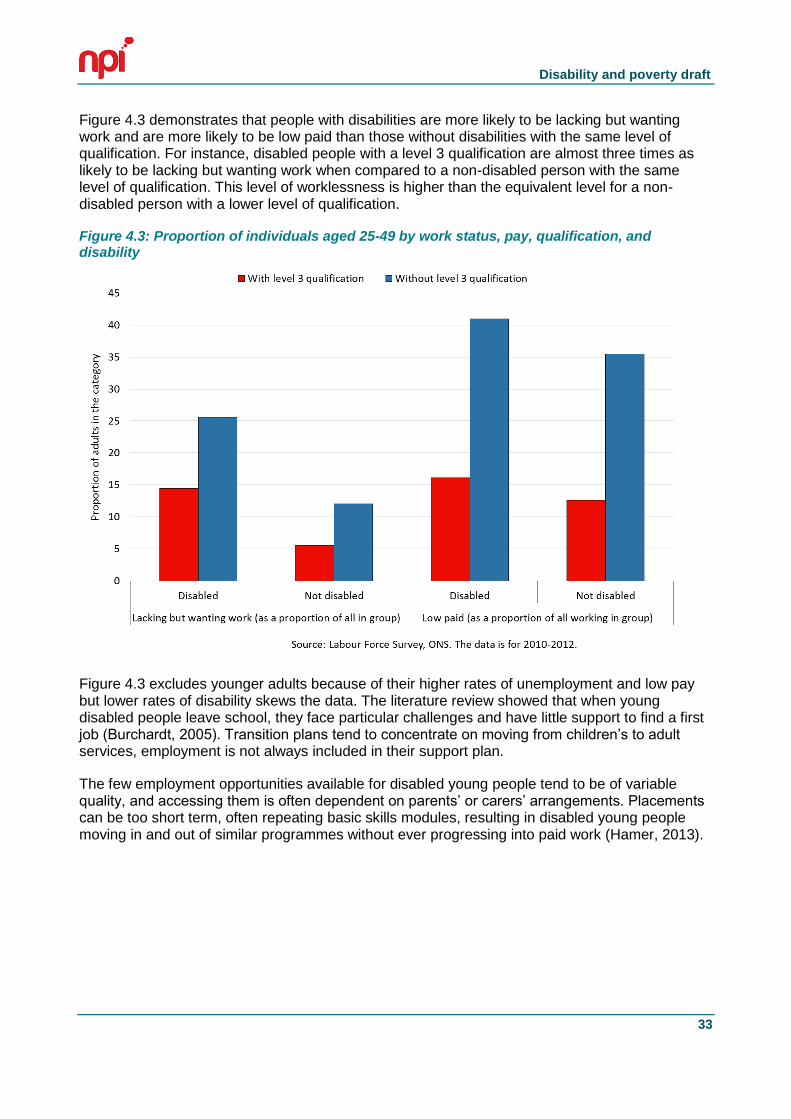
Figure 4.3 demonstrates that people with disabilities are more likely to be lacking but wanting work and are more likely to be low paid than those without disabilities with the same level of qualification. For instance, disabled people with a level 3 qualification are almost three times as likely to be lacking but wanting work when compared to a non-disabled person with the same level of qualification. This level of worklessness is higher than the equivalent level for a non-disabled person with a lower level of qualification.
Figure 4.3: Proportion of individuals aged 25-49 by work status, pay, qualification, and disability
Figure 4.3 excludes younger adults because of their higher rates of unemployment and low pay but lower rates of disability skews the data. The literature review showed that when young disabled people leave school, they face particular challenges and have little support to find a first job (Burchardt, 2005). Transition plans tend to concentrate on moving from children’s to adult services, employment is not always included in their support plan.
The few employment opportunities available for disabled young people tend to be of variable quality, and accessing them is often dependent on parents’ or carers’ arrangements. Placements can be too short term, often repeating basic skills modules, resulting in disabled young people moving in and out of similar programmes without ever progressing into paid work (Hamer, 2013).
Disability and poverty draft
34
Different measures, different trends
Figure 4.2 above shows the disability employment penalty reducing in recent years, and this is the conventional wisdom (for example, Dame Carol Black’s review (2008:32), or the Office of Disability Issue’s disability equality indicator B17). However, on closer inspection these results seem to be sensitive to the particular measure of disability and the particular survey data that were being used – in other words, the conventional belief might be wrong.
Here, we focus on one crucial difference shown in Baumberg (2011); the difference between two key measures of disability (Wass, Jones and Baumberg are extending these analyses later in 2014). These measures both follow an initial screening question on having a longstanding health problem/disability:
- Work-Limiting Disability (WLD): this is based on people responding yes to either of two questions, “Does this health problem affect the kind of paid work that you might do?...or the AMOUNT of paid work that you might do?”
- Limiting Longstanding Illness (LLSI): this is based on responses to the question, “Does this health problem or disability substantially limit your ability to carry out normal day to day activities?”
This analysis focuses on the Labour Force Survey (LFS), the primary source of data about the labour market, and the survey that has previously been used to suggest that there has been a decline in the disability employment penalty in recent years.8 The trends since 1998 are shown below. Note that we do not include the data from 2010-2012 due to a change that makes the later disability data incomparable to earlier data.
7 See http://odi.dwp.gov.uk/disability-statistics-and-research/disability-equality-indicators.php
8 To make the datasets comparable over time, we focus on the working-age population (as historically
defined as men aged 18-64 and women aged 18-59) and make a number of other technical adjustments. We do not use survey weights for the present analysis, pending further investigation of the changing basis of weighting over time. See Baumberg 2011 for further details; the analysis his simply extends this into more recent time periods.
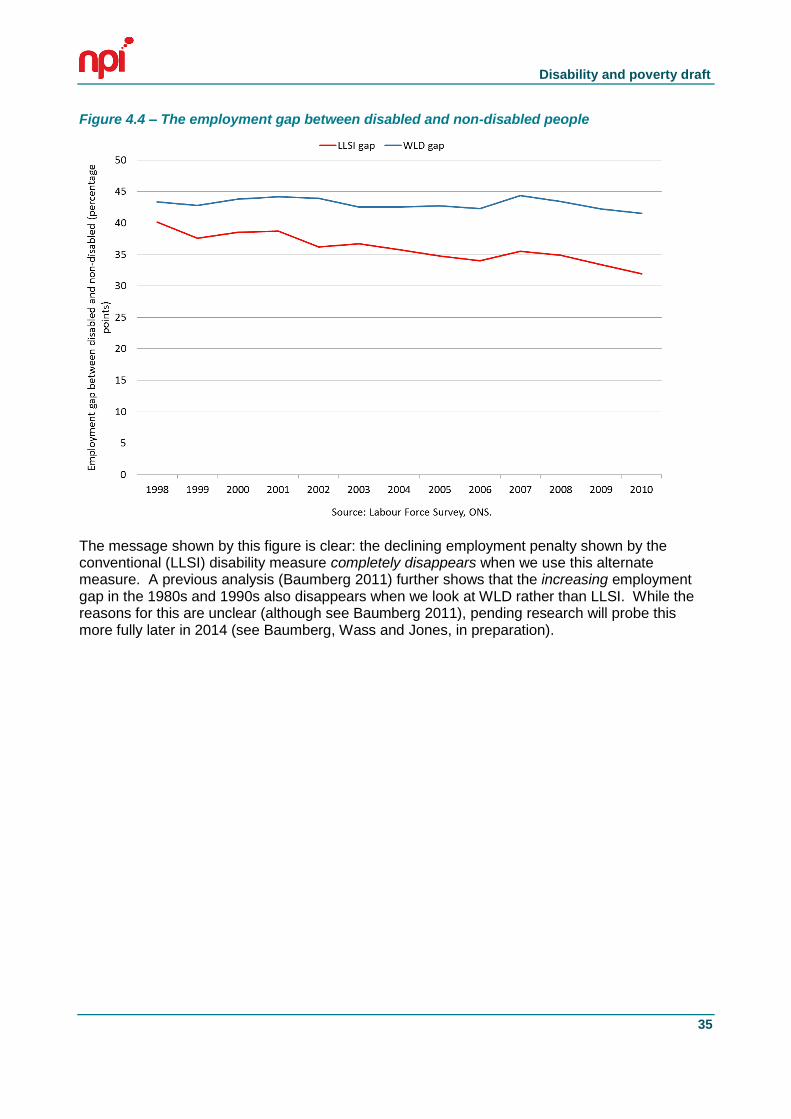
Disability and poverty draft
35
Figure 4.4 – The employment gap between disabled and non-disabled people
The message shown by this figure is clear: the declining employment penalty shown by the conventional (LLSI) disability measure completely disappears when we use this alternate measure. A previous analysis (Baumberg 2011) further shows that the increasing employment gap in the 1980s and 1990s also disappears when we look at WLD rather than LLSI. While the reasons for this are unclear (although see Baumberg 2011), pending research will probe this more fully later in 2014 (see Baumberg, Wass and Jones, in preparation).
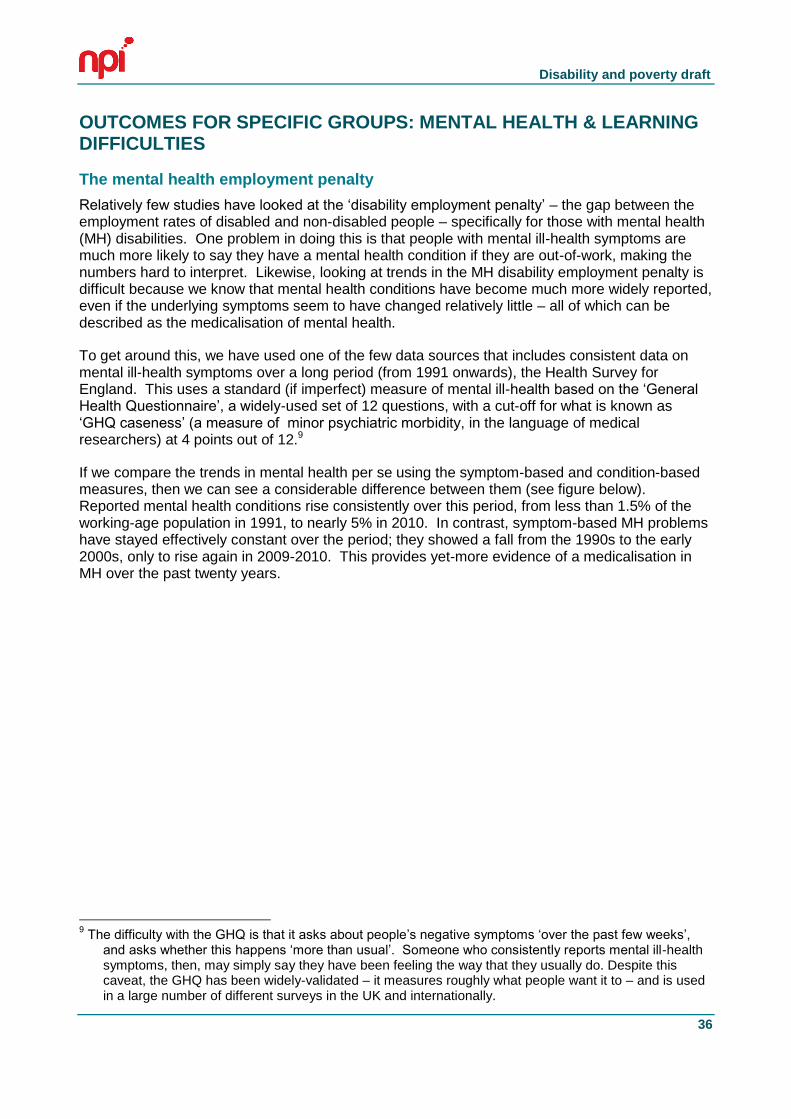
Disability and poverty draft
36
OUTCOMES FOR SPECIFIC GROUPS: MENTAL HEALTH & LEARNING DIFFICULTIES
The mental health employment penalty
Relatively few studies have looked at the ‘disability employment penalty’ – the gap between the employment rates of disabled and non-disabled people – specifically for those with mental health (MH) disabilities. One problem in doing this is that people with mental ill-health symptoms are much more likely to say they have a mental health condition if they are out-of-work, making the numbers hard to interpret. Likewise, looking at trends in the MH disability employment penalty is difficult because we know that mental health conditions have become much more widely reported, even if the underlying symptoms seem to have changed relatively little – all of which can be described as the medicalisation of mental health.
To get around this, we have used one of the few data sources that includes consistent data on mental ill-health symptoms over a long period (from 1991 onwards), the Health Survey for England. This uses a standard (if imperfect) measure of mental ill-health based on the ‘General Health Questionnaire’, a widely-used set of 12 questions, with a cut-off for what is known as ‘GHQ caseness’ (a measure of minor psychiatric morbidity, in the language of medical researchers) at 4 points out of 12.9
If we compare the trends in mental health per se using the symptom-based and condition-based measures, then we can see a considerable difference between them (see figure below). Reported mental health conditions rise consistently over this period, from less than 1.5% of the working-age population in 1991, to nearly 5% in 2010. In contrast, symptom-based MH problems have stayed effectively constant over the period; they showed a fall from the 1990s to the early 2000s, only to rise again in 2009-2010. This provides yet-more evidence of a medicalisation in MH over the past twenty years.
9 The difficulty with the GHQ is that it asks about people’s negative symptoms ‘over the past few weeks’,
and asks whether this happens ‘more than usual’. Someone who consistently reports mental ill-health symptoms, then, may simply say they have been feeling the way that they usually do. Despite this caveat, the GHQ has been widely-validated – it measures roughly what people want it to – and is used in a large number of different surveys in the UK and internationally.
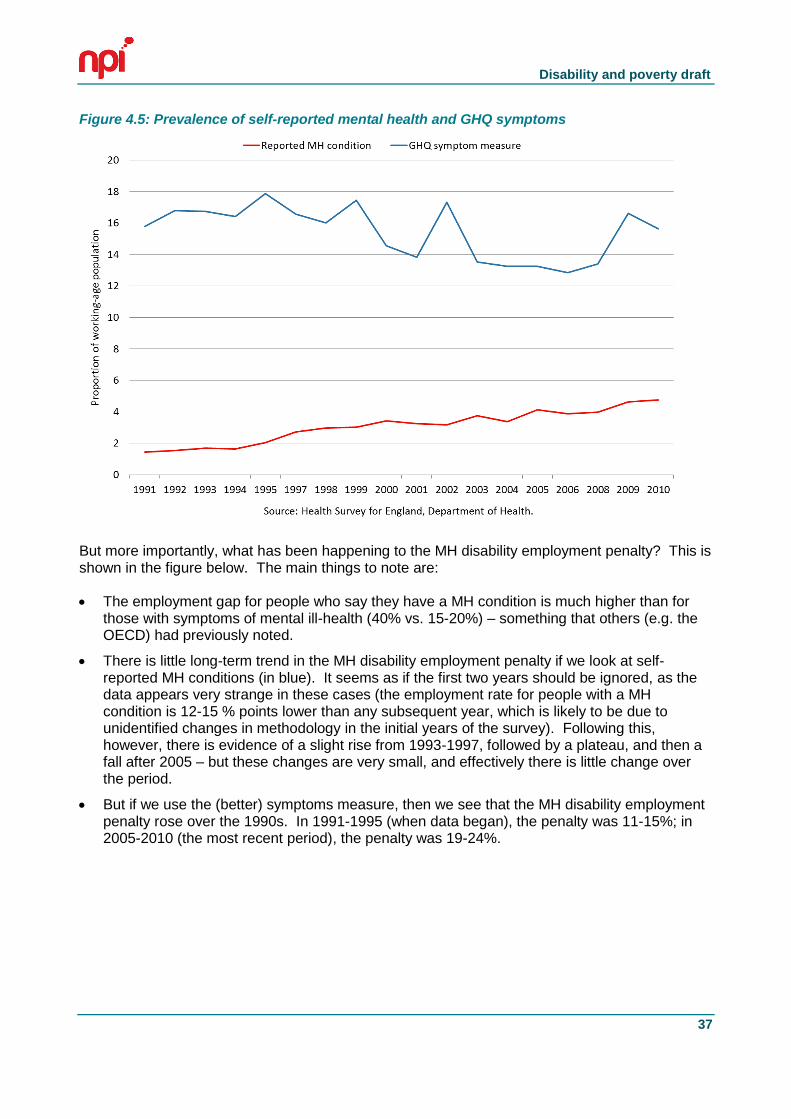
Disability and poverty draft
37
Figure 4.5: Prevalence of self-reported mental health and GHQ symptoms
But more importantly, what has been happening to the MH disability employment penalty? This is shown in the figure below. The main things to note are:
The employment gap for people who say they have a MH condition is much higher than for those with symptoms of mental ill-health (40% vs. 15-20%) – something that others (e.g. the OECD) had previously noted.
There is little long-term trend in the MH disability employment penalty if we look at self-reported MH conditions (in blue). It seems as if the first two years should be ignored, as the data appears very strange in these cases (the employment rate for people with a MH condition is 12-15 % points lower than any subsequent year, which is likely to be due to unidentified changes in methodology in the initial years of the survey). Following this, however, there is evidence of a slight rise from 1993-1997, followed by a plateau, and then a fall after 2005 – but these changes are very small, and effectively there is little change over the period.
But if we use the (better) symptoms measure, then we see that the MH disability employment penalty rose over the 1990s. In 1991-1995 (when data began), the penalty was 11-15%; in 2005-2010 (the most recent period), the penalty was 19-24%.
Disability and poverty draft
38
Figure 4.6: Disability employment gap for mental health
In other words, it is not just that the mental health disability employment penalty has not improved in recent years – but it even seems to have got worse. While needing further investigation (for example: it could be the case that the mental health of people claiming benefits has deteriorated alongside changes in the benefits system), this provides some important and worrying context for the discussions in the wider review.
The learning disability employment penalty
While there are gaps in knowledge about the lives of many disabled people, the lack of evidence about the lives of people with learning disabilities, the extent of poverty they experience, their participation in employment or in society generally is particularly striking (Forrester-Jones et al, 2010). There is some information about people with learning disabilities in England because of the work of the Learning Disabilities Observatory, which is collaboration between Public Health England, the Centre for Disability Research at the University of Lancaster and the National Development Team for Inclusion. This team has published what data are available about people with learning disabilities in England. They report that in 2009/10, 6.4% of people with learning disabilities in England were recorded as being in some sort of regular work, paid or unpaid; this was down from closer to 9% in 2005.
The vast majority of people with learning disabilities in a paid job were working between less than 30 hours a week. In 2008/09, 4,560 people with learning disabilities were doing unpaid voluntary work which, according to Emerson et al (2011) meant that the number of people with learning disabilities engaged in unpaid work was more than the total number of people in paid employment for the same year. Across England, they report large variations in the proportion of people with learning disabilities in employment across local authorities, varying from 0% to 36%, with the South East recorded as the region with the highest percentage (9.7%) of people in some form of work.
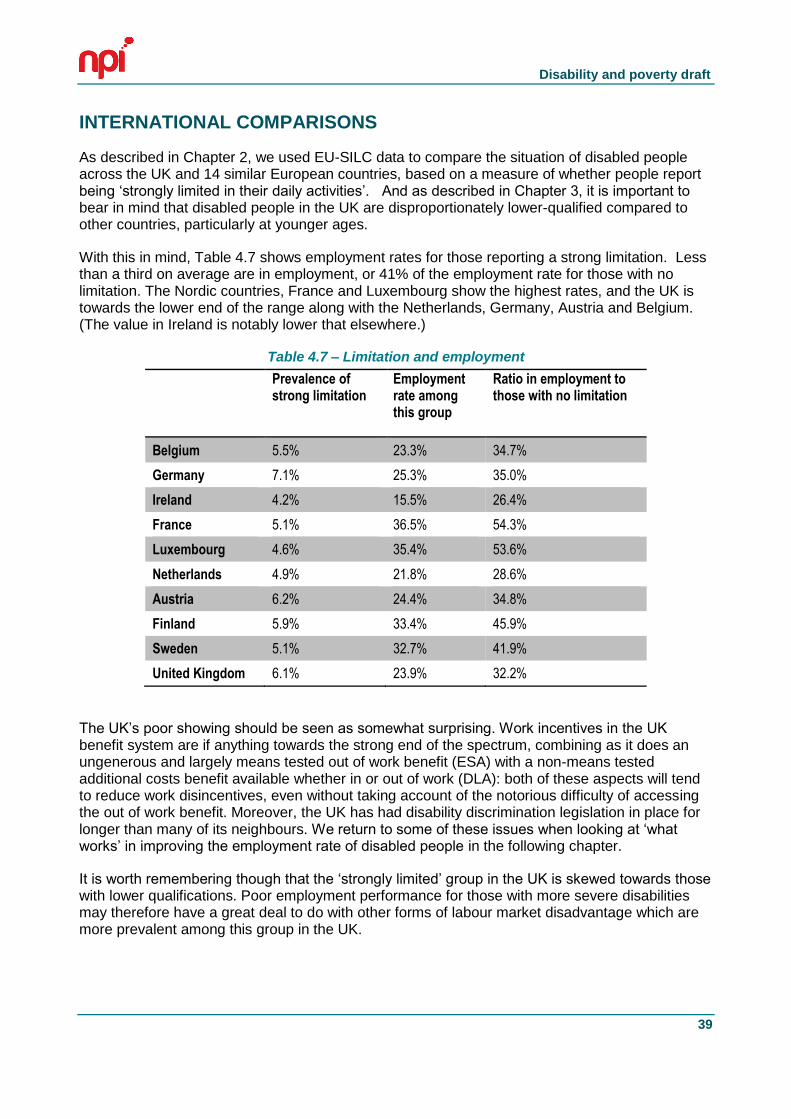
Disability and poverty draft
39
INTERNATIONAL COMPARISONS
As described in Chapter 2, we used EU-SILC data to compare the situation of disabled people across the UK and 14 similar European countries, based on a measure of whether people report being ‘strongly limited in their daily activities’. And as described in Chapter 3, it is important to bear in mind that disabled people in the UK are disproportionately lower-qualified compared to other countries, particularly at younger ages.
With this in mind, Table 4.7 shows employment rates for those reporting a strong limitation. Less than a third on average are in employment, or 41% of the employment rate for those with no limitation. The Nordic countries, France and Luxembourg show the highest rates, and the UK is towards the lower end of the range along with the Netherlands, Germany, Austria and Belgium. (The value in Ireland is notably lower that elsewhere.)
Table 4.7 – Limitation and employment
Prevalence of strong limitation
Employment rate among this group
Ratio in employment to those with no limitation
Belgium 5.5% 23.3% 34.7%
Germany 7.1% 25.3% 35.0%
Ireland 4.2% 15.5% 26.4%
France 5.1% 36.5% 54.3%
Luxembourg 4.6% 35.4% 53.6%
Netherlands 4.9% 21.8% 28.6%
Austria 6.2% 24.4% 34.8%
Finland 5.9% 33.4% 45.9%
Sweden 5.1% 32.7% 41.9%
United Kingdom 6.1% 23.9% 32.2%
The UK’s poor showing should be seen as somewhat surprising. Work incentives in the UK benefit system are if anything towards the strong end of the spectrum, combining as it does an ungenerous and largely means tested out of work benefit (ESA) with a non-means tested additional costs benefit available whether in or out of work (DLA): both of these aspects will tend to reduce work disincentives, even without taking account of the notorious difficulty of accessing the out of work benefit. Moreover, the UK has had disability discrimination legislation in place for longer than many of its neighbours. We return to some of these issues when looking at ‘what works’ in improving the employment rate of disabled people in the following chapter.
It is worth remembering though that the ‘strongly limited’ group in the UK is skewed towards those with lower qualifications. Poor employment performance for those with more severe disabilities may therefore have a great deal to do with other forms of labour market disadvantage which are more prevalent among this group in the UK.
40
5. ‘WHAT WORKS’ IN HELPING DISABLED PEOPLE INTO WORK
Most disabled people are either working or want to work (Aldridge et al, 2012). Participants in a qualitative study for the EHRC stressed the value of work to them and ‘unanimously stated a desire to be in work’, pointing to the importance of work for their quality of life as being about more than financial reward. Being out of work had caused further ill-health for many: some had left work because an acquired physical impairment could not be accommodated but being out of work had then led them to develop mental health conditions such as depression and anxiety (Adams & Oldfield, 2012). There is no magic bullet, no single intervention that can get most ill and disabled people back to work. However, there are some ideas from the literature about how to improve the current situation, including wide ranging reviews of the evidence on effectiveness of different approaches to promoting return to work such as Clayton et al (2012) and Waddell et al (2008).
Unfortunately, though, there is very little information about what works for people with severe impairments and long term limiting illness who may need high levels of support in order to access paid employment (with the literature instead focusing on interventions aimed at speeding return to work within a relatively short period after the onset of illness or impairment). Those with more severe and long-term impairments are promised support because they ‘can’t work’, but are the group whose additional costs of disability are not met by the benefits system and who may have to struggle to ensure they receive enough services and income to establish and maintain their independence. Even for those studies that do exist, studies looking at long term outcomes are the exception. The conclusion from one systematic review on return to work interventions seems about right: ‘Most trials followed participants for 12 months or less. No trial assessed permanent disability’ (Schandelmaier et al 2012).
Another aspect of the existing literature worth noting is that there has been far more research on physical disabilities/conditions and employment than on mental health.10 The skew in the literature towards short-term and less severe conditions and physical impairments means that caution is needed in drawing more general inferences, for example as to the potential effectiveness of interventions for those with longer term impairment/non-employment and mental health conditions. It is sometimes argued, and more often assumed, that by speeding the return to work of people on short-term sickness benefits, the prevalence of long-term disability benefit receipt can be reduced. If however overall benefit recipiency is driven more by longer-term, more severe conditions, this is far from obvious.
In this chapter we look in turn at: (i) benefits; (ii) interventions for people who are out-of-work (iii) preventing impairment in the workplace;; and (iv) the role of employers.
10
For example, a PubMed search for systematic reviews of evidence on return to work after back pain yields 145 results: a similar search for mental health conditions yields 29.
Disability and poverty draft
41
PREVENTING IMPAIRMENT IN THE WORKPLACE
Stopping people from developing health problems
The possibilities for intervention start while people are still in employment, by working to prevent the physical and mental health impact of some jobs and by intervening quickly to reduce the injuries becoming worse. Preventing the acquisition of impairment will become an imperative as the UK population ages: at present, over 40 percent of the population will have acquired a disability by the time they reach 65. Much acquired disability is a result of work and the evidence linking health inequalities with work-related injuries stretches back to the 1980 Black Report. In the past, dangerous physical working conditions were a major cause of disability and ill-health but today, in high-income countries, it is the psychosocial work environment – factors such as employee’s autonomy, psychological stress and job insecurity- that has been found to be a determinant of health (Black, 2008; Bambra et al, 2009a). As with the physical work environment in the past, many aspects of the psychosocial work environment exhibit a strong socio-economic gradient, contributing to social inequalities in health (Marmot, 1999; Boardman, 2003).
A 2013 report from the International Labour Organisation reports an increased risk for negative health outcomes including mental ill health and work-related musculoskeletal disorders among remaining staff after an organisation restructures. The report found evidence that the downsizing effects of the recession increases exposure to both physical and psychosocial work risk factors and, according to the literature it reviewed, may also have increased the incidence of mental stress and work-related musculoskeletal disorders at work across all sectors (ILO 2013). This research confirms earlier UK and EU studies that indicate reduced health and safety and increased risk of injury at work since 2008 (Stuckler et al, 2009; Houdmont et al, 2012).
A range of studies suggest that prevention and early intervention to minimise the impact of acquired impairments are key to keeping people in employment (Hill et al, 2007). The two main causes of sick leave and for claiming Incapacity Benefit/Employment and Support Allowance are mental health conditions (MHCs) and musculoskeletal conditions (MSDs) (including arthritis, rheumatism as well as neck and back injuries). The evidence is clear that the incidence of both kinds of conditions can be reduced through better workplace practices. Hill et al (2007) examined the evidence for preventing both. They found a general consensus in the literature that exercise is effective in preventing MSDs, and in reducing absence and that the evidence suggested that exercise is even more effective at prevention when combined with job-specific and individualised or small group education and training. In relation to preventing mental ill-health, interventions such as Cognitive Behavioural Therapy were shown to be more effective for those employees who have a high degree of control over how they work (Hill et al, 2007). There is a range of evidence linking poor quality work, crucially work with low levels of control, with mental ill-health (Waddell and Burton, 2006). This will be discussed in greater detail in the section on “Good Work” below.
Disability and poverty draft
42
Stopping initial problems developing into more severe problems
Whatever the context, there is some evidence to suggest it should be possible to reduce the risk of psychosocial distress or work-related stress developing into severe mental ill-health. A Glasgow University research team explored data from the British Household Panel Survey and Scottish Health Surveys, as well as carrying out a survey with a representative sample of Scottish GPs; the study found that those likely to end up on long-term sickness benefits for reasons of mental ill-health can be predicted three years before they start to claim such benefits (Whittaker et al, 2010). This suggests that if the psycho-social and emotional distress with which they first present could be addressed, they need not have developed disabling mental illness. In interviews with researchers, GPs were aware of their role in relation to ‘sick certification’. They could recognise people who are at high risk of becoming dependent on benefits but they also thought that a short period off work may help people with emotional or mental distress. The GPs were also clear that it is better to avoid long term incapacity as it can be difficult to get back to work. Most said they would discuss work with people at risk of becoming dependent on benefits at an early stage but felt that employers need to be prepared to make necessary allowances and adaptations to facilitate a return to work (Whittaker et al, 2010). This suggests that GPs need to be more aware that they need to flag up those who are at risk of developing a long-term limiting illness and having the NHS be more responsive to those who are at such risk, rather than rationing services only to those who are already very ill. Partnerships between GPs and employers might also help in preventing long-term illness. Black and Frost (2011) suggest that “expenditure by employers targeted at keeping sick employees in work (or speeding their return to work), such as medical treatments or vocational rehabilitation” could attract tax relief.
As with mental ill-health, so with musculoskeletal disorders (MSDs), the other main cause of people being absent from work; there is also considerable evidence that this can be prevented, or greatly reduced. There is a range of studies detailing preventative programmes which reduce the number and levels of muscular-skeletal injuries in some workplaces. Health and social care staff have been a particular focus of study, since MSDs are the main reason why nursing staff are absent from work or have to take early retirement on grounds of disability (Yassi, 2001; Gilworth et al, 2007). Hill et al (2007) in their review of what workplace interventions work to prevent and manage common health problems conclude that exercise is the only consistently recommended approach for both primary and secondary prevention of lower back pain (LBP) and other MSDs. Hoe et al (2012) in a Cochrane review of upper body MSD which have become very common due to repetitive strain from working at computers concluded that “the use of arm support together with an alternative mouse may prevent work-related musculoskeletal disorders of the neck and shoulder but not those of the right upper limb. The use of arm support alone or alternative mouse alone is not effective…This review was not able to determine the effectiveness of other ergonomic interventions for preventing musculoskeletal disorder of the upper limb and neck” (p.2). It should be noted that all the above reviews note that workplace stress impacts on the likelihood of physical injury and emphasise the importance of the psychosocial work environment in preventing MSDs.
Stopping sick leave becoming long-term incapacity
Once sick leaves starts to be taken, evidence from a range of countries suggests that early intervention can in some cases ensure that it does not become long-term leave. Waddell et al. (2008) which found that early healthcare and workplace interventions could help people with common health conditions to retain their jobs and prevent them from moving onto incapacity benefits, and on work by Campbell et al. (2007) which indicated the need for early intervention after sickness absence.
Disability and poverty draft
43
Waddell et al (2008) carried out a review of the evidence base for policy development on vocational rehabilitation and the effectiveness and cost-effectiveness of interventions. The review also sought to develop practical suggestions on what interventions are likely to work, for whom, and when. Vocational rehabilitation was defined as whatever helps someone with a health problem to stay at, return to and remain in work:
The evidence examined in the review suggested that healthcare must place greater emphasis on what happens in relation to employment, as well as its traditional role of medical treatment. The role of the workplace was found to be crucial, particularly in maintaining contact and providing transitional work arrangements to facilitate a phased return to work. Good communication between healthcare professionals, the worker, and the workplace is essential. Early implementation of these principles should mean that fewer individuals will require more structured (and more costly) interventions.
There is consensus across a range of reviews and studies that organisation-level interventions such as improved communication, early contact with absent worker, an agreed rehabilitation plan, flexibility in work organisation and return to work arrangements are applicable to mental health problems but limited evidence that they improve work outcomes (Egan et al, 2007; Waddell et al, 2008). This is mainly because there is a general lack of focus on work outcomes throughout the literature on treatments for mental health problems.
Underwood et al (2007) in an evidence review for NICE, concluded that improvements in mental health are associated with better employment outcomes and that better implementation and adherence to NICE guidelines on interventions to improve mental health can help improve employment outcomes. All the reviews emphasised the importance of the psychosocial work environment and the importance of a flexible approach by employer as well as employee.
THE ROLE OF SOCIAL SECURITY SYSTEMS
In Chapters 3 and 4, we saw the role of benefits in directly reducing poverty among disabled people (this is the flip-side of showing how many more disabled people would be in poverty if DLA/AA are not counted as additional income). In this section, we focus on the role of the benefits system in improving employment outcomes among disabled people.
Reducing benefit claims as a way of improving employment outcomes?
Over recent decades there has been an enormous focus, both in terms of research and policy, on the question of reducing sickness and disability benefit caseloads. This has been promoted largely in terms of increasing employment for disabled people (e.g. OECD 2010), suggesting a win-win, as the increase in employment will presumably benefit both disabled people (through higher incomes and greater integration) and the non-disabled (through lower benefit expenditure). However, reducing disability benefit caseloads is not the same thing as increasing employment. Not all disabled people who are not working are in receipt of a disability benefit. Some people receive benefits while working. Increasing employment might in fact be a very expensive way of reducing benefit caseloads compared to administrative measures such as changing entitlements or tightening assessments. There should be no assumption that the aims of reducing caseloads and increasing employment for disabled people always converge.
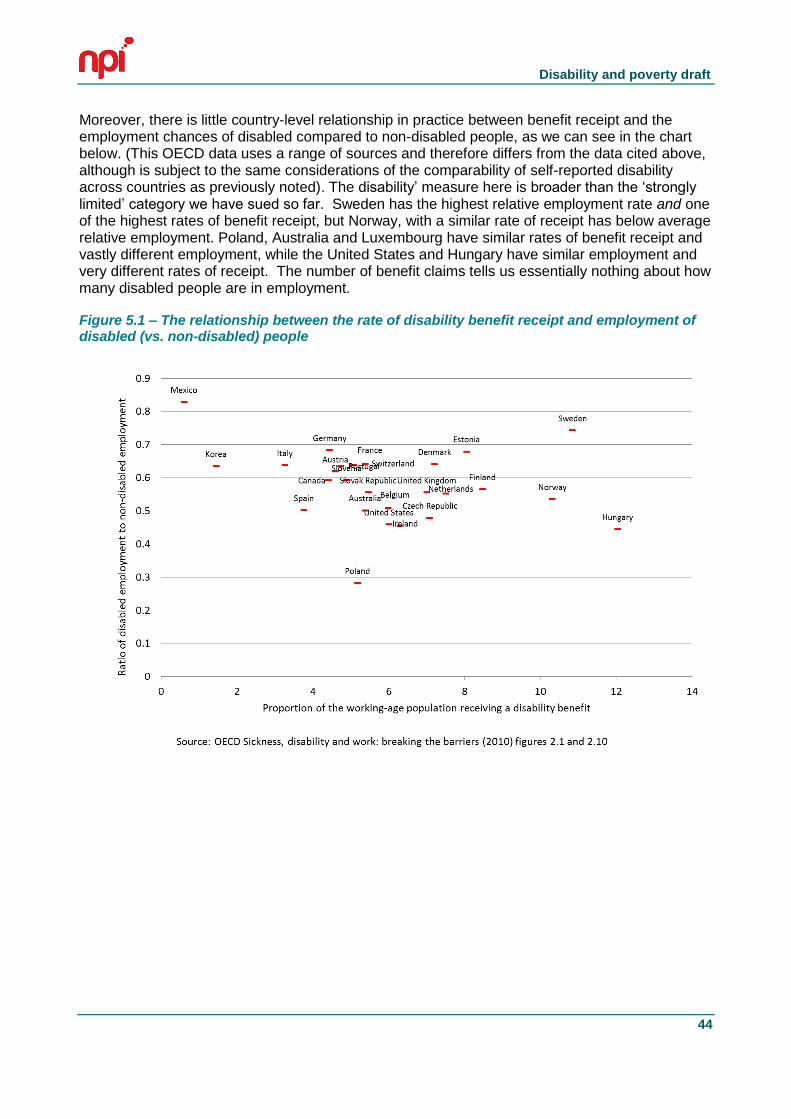
Disability and poverty draft
44
Moreover, there is little country-level relationship in practice between benefit receipt and the employment chances of disabled compared to non-disabled people, as we can see in the chart below. (This OECD data uses a range of sources and therefore differs from the data cited above, although is subject to the same considerations of the comparability of self-reported disability across countries as previously noted). The disability’ measure here is broader than the ‘strongly limited’ category we have sued so far. Sweden has the highest relative employment rate and one of the highest rates of benefit receipt, but Norway, with a similar rate of receipt has below average relative employment. Poland, Australia and Luxembourg have similar rates of benefit receipt and vastly different employment, while the United States and Hungary have similar employment and very different rates of receipt. The number of benefit claims tells us essentially nothing about how many disabled people are in employment.
Figure 5.1 – The relationship between the rate of disability benefit receipt and employment of disabled (vs. non-disabled) people
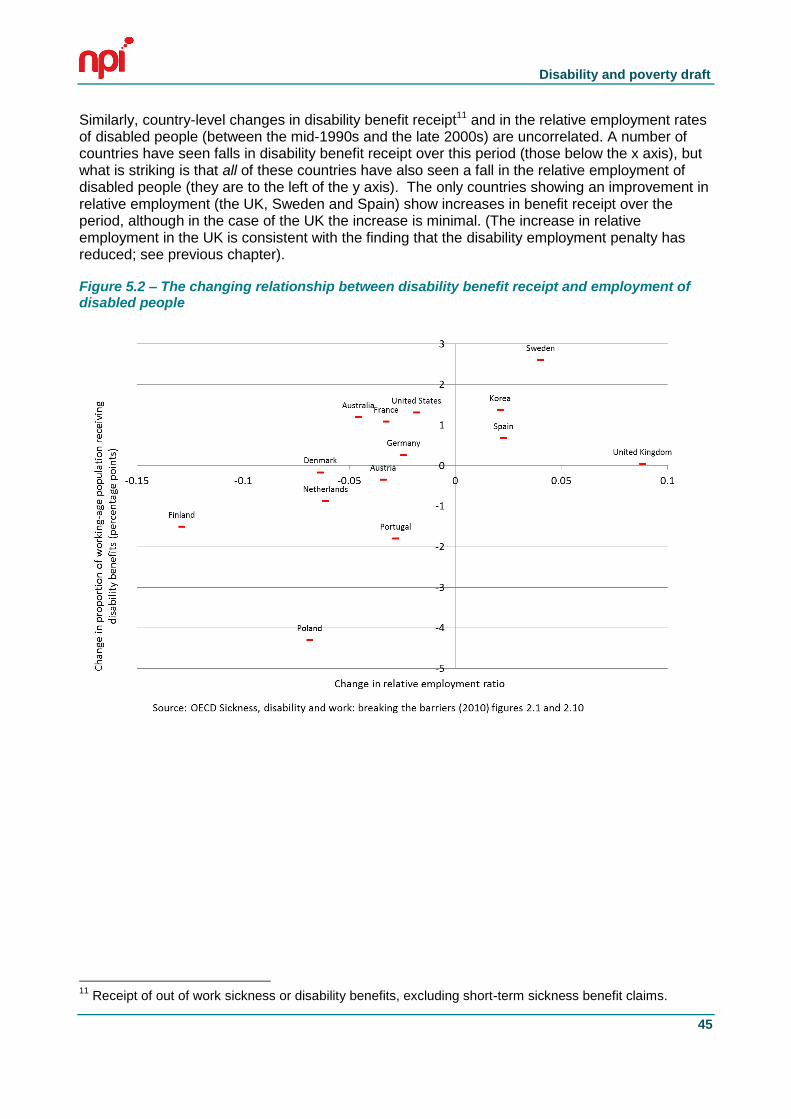
Disability and poverty draft
45
Similarly, country-level changes in disability benefit receipt11 and in the relative employment rates of disabled people (between the mid-1990s and the late 2000s) are uncorrelated. A number of countries have seen falls in disability benefit receipt over this period (those below the x axis), but what is striking is that all of these countries have also seen a fall in the relative employment of disabled people (they are to the left of the y axis). The only countries showing an improvement in relative employment (the UK, Sweden and Spain) show increases in benefit receipt over the period, although in the case of the UK the increase is minimal. (The increase in relative employment in the UK is consistent with the finding that the disability employment penalty has reduced; see previous chapter).
Figure 5.2 – The changing relationship between disability benefit receipt and employment of disabled people
11
Receipt of out of work sickness or disability benefits, excluding short-term sickness benefit claims.
Disability and poverty draft
46
The pattern of change in relative employment is the more surprising in that policy change has in theory been concerned not just with tightening access to benefits but with the ‘activation’ of disabled claimants The OECD has developed a measure of policy focus which distinguishes between ‘integration’ (such as active labour market policies) and ‘compensation’ (such as ease of aces to and generosity of benefits) to create a single index of ‘integration’ (the extent to which the system prioritises employment). The OECD found increases in integration across all different welfare regimes, which we might expect to be associated with higher employment. Not so: increases in scores on the integration dimension are uncorrelated with employment increases over time,12If social security systems are much more geared to activation now than in the past, the obvious question is why this has not translated into generally higher relative employment? The OECD (2010) argues that ‘implementation has lagged behind intentions’ and ‘low or uneven policy implementation on the ground is very hard to assess’. This may be true, but it is hard to see how it could be evidenced.
An alternative interpretation is that caseload-reducing policy changes did not generally affect the majority of the population experiencing work-limiting disability. It is uncontroversial that sickness and disability benefits have over time served a variety of functions as an explicit or covert aim of government policy, including acting as a route to early retirement during the industrial dislocations of the 1980s and early 1990s and as a means for taking people with low employment prospects out of the labour market. Some of the reforms undertaken to reduce caseloads may have simply represented attempts to reverse these earlier approaches to labour market problems- helped by the movement into retirement of earlier cohorts of non-employed workers and the general improvement in employment from the mid-1990s.
By way of example, Koning and Van Vuren (2006) find a dramatic reduction in estimated ‘hidden unemployment’ in Dutch disability insurance on-flows between the early 1990s and the 1999-2003. ‘In 1994, almost 40% of the Disability Insurance enrolment rate is estimated to consist of hidden unemployment, whereas for 1999-2003 this percentage was only 2 to 4%.’ This is a flow rather than a caseload measure, but it nonetheless indicates substantial change in the pattern of use of disability benefits over a relatively short period. Gaffney (2011) has argued that beneath the apparent stability of UK disability benefit receipt from the late 1990s lay a major shift in patterns of receipt towards more severe conditions, driven by improved labour market conditions, tighter access conditions and the retirement of earlier cohorts which had experienced ‘hidden unemployment’. So the lack of impact on employment for disabled people may be partly explained by the fact that some of the caseload reduction involved claims by people who might not (in questions on social surveys) always describe themselves as disabled. But another factor may be that people who lost disability benefit entitlement did not find work. A 2001 study of former Incapacity Benefit claimants who had been moved onto Jobseeker’s Allowance found that only 27% were in work (Ashworth et al 2001). Of claimants who lost benefit entitlement following reassessment of existing claims in the Netherlands in the 2000s; only 30% of those not in employment at time of reassessment were in work after 18 months.
Reducing benefit caseloads is not therefore the same thing as improving employment for disabled people. The evidence suggests that more governments have been successful in the former than the latter.
12
In the 1990s there was a strong relationship between this policy dimension and employment outcomes (correlation coefficient .54, N =17). In the mid and late 2000s the correlation was far weaker (mid 2000s .39, N=20; late 2000s .24, N = .22).
Disability and poverty draft
47
Access and generosity
As we have seen, the OECD distinguishes between the ‘compensation’ and ‘integration’ aspects of social security policy. The ‘compensation’ dimension covers such aspects as the generosity of benefits and the ease with which they can be accessed’13.Consistency with the consensus of economics studies of sickness and disability benefits , higher scores on the compensation dimension might be expected to increase benefit receipt and labour market participation. (Bell and Smith 2004:26; Faggio and Nickell 2005; McVicar 2006). However, given that we have already seen that claim rates do not simply match onto the disability employment penalty (particularly when comparing countries), this still leaves the question as to whether less generous benefit systems have higher employment rates for people with disabilities.
In fact higher scores on the compensation dimension are if anything positively associated with employment, although the relationship is very weak. Nor is there any relationship over time between this variable and employment, even though scores for most countries have reduced.
This is not the only evidence against any assumption that tightening access and reducing generosity automatically lead to improved employment outcomes. Anema et al. (2009) studied sustainable return to work (=in employment after two years) for people with chronic back pain in six wealthy countries. They found that two compensation policy variables are positively associated with sustainable return to work: ‘no late timing of entitlement ([3 months after onset claim) to a long-term disability benefit’ and ‘no high minimum (50% or less) degree of work incapacity needed for a long-term partial disability benefit’. They conclude that ‘cross-country differences in eligibility criteria for entitlement to long-term and/or partial disability benefits contributed to the observed differences in sustainable RTW rates: less strict criteria are more effective.’ The Anema et al study is particularly interesting from our perspective as it looks at outcomes after two years and is thus relevant to the issue of longer-term work disability, in contrast to other studies which are focussed on shorter time periods.
Similarly Vikaari-Juntura (2012) and Hogelund and Holm (2011) find that the option of ‘partial sick-listing’ (part-time return to work while retaining benefit entitlement) improves outcomes for claimants with physical disabilities (but as Hogelund and Holm show, not for those with mental health problems). Vikari-Juntura et al. (2012) using randomised assignment find a 20% reduction in sickness absence over a 12 month period for the treatment group leading to a 6% reduction in long-term benefit receipt.
The implication of these studies is that restricting eligibility to benefits to those with the highest levels of impairment may be counter-productive. This is only evidenced for physical disabilities, and the evidence at this stage is suggestive rather than definitive. Nonetheless the evidence does show that there is no necessity to tie income maintenance benefit entitlements to a simple dichotomy of can/can’t work. That dichotomy is the basis on which Employment Support Allowance is paid in the UK, much as there is a distinction between the conditions of payment of ESA between those in the Support Group and those in the Work-Related Activity Group, and there is also in-work income maintenance through tax credits. It is therefore worth considering whether this division between out-of-work and in-work support is the best way to enable early return to work for people who may still face reduced work capacity.
13
The compensation variable is constructed from ten variables covering such aspects as population coverage, minimum impairment levels to qualify for benefits, generosity (replacement ratios and maximum benefit level) and duration of sickness and disability benefits.
Disability and poverty draft
48
SPECIALIST PROGRAMMES TO HELP DISABLED PEOPLE INTO WORK
The UK literature broadly agrees that it is not easy to identify good quality, cost-effective strategies of helping disabled people into employment within the UK and that longitudinal data is needed that establishes whether any employment placements are sustained. For example, Hayday et al (2008) undertook a Review of the Effectiveness and Cost Effectiveness of Interventions, Strategies, Programmes and Policies to Help Recipients of Incapacity Benefits Return to Employment (Paid and Unpaid) as part of a National Institute for Clinical Excellence project to develop guidance for primary care services and employers on the management of long‐term sickness and incapacity. They carried out two linked systematic reviews of the literature on the effectiveness and the cost effectiveness of interventions to move incapacity benefit recipients
into employment. In the course of these reviews, just three effectiveness articles and no cost‐effectiveness articles passed their full paper screen. They concluded that “Overall, this review has identified a paucity of evidence in relation to the effectiveness of interventions and a complete lack of evidence for the cost effectiveness of interventions that met the requirements of the research question and the inclusion and exclusion criteria (eg UK studies based on an RCT or longitudinal methodology).” (Hayday et al, 2008, p.44)
Nevertheless, evaluations of a range of initiatives aimed at helping disabled people into employment – including the ONE Advisory Service, the New Deal for Disabled People and the Pathways to Work programme and Condition Management Programme – all conclude that reintegrating claimants furthest from the labour market (those with more complex needs) requires longer-term and personal engagement with individuals (Clayton et al, 2011). For example, Condition Management Programmes (CMP) work with people who have long-term limiting conditions to develop a better understanding of their health condition and to explore strategies for dealing with it. CMP partnerships, especially those with NHS partners, were seen to work well by most participants as they mobilised the expertise of the NHS but in a de-medicalised way somewhat more in tune with the social model (Kellett et al, 2011), Health professionals were also able to ‘protect’ participants from some of the most punitive conditionality.
Work-focused targets, particularly those related to payments, can lead to ‘cream-skimming’ of those claimants closest to the labour market and to ‘parking’ those with the greatest support needs (Clayton et al, 2011). So for example, those ill and disabled people who need the highest levels of support are unlikely to be helped by the Work Programme (the main current system that provides support to benefit claimants in finding work). Indeed, early results from evaluations of the Work Programme suggest, “at face value, a degree of creaming and parking; for example, many providers openly reported seeing their most job-ready participants more frequently than those with more severe barriers to work” (DWP, 2013). This may be inevitable since, as the Disability Charities Consortium 2013 report Work in Progress points out, evidence from the Work and Pensions Committee indicates that front-line advisers have typical workloads of 120-180 clients each, making the promised personalisation approach “largely procedural in nature, focusing on adviser relationships” (p.13). Given that CMPs are now ‘integrated’ into the Work Programme, whether participants will get the longer-term engagement that was previously available depends on the contractor to which they are referred.
Disability and poverty draft
49
Some specialist programmes, like Work Choice in Britain, and Workable in Northern Ireland, are more likely to support ill and disabled people into employment, but there are restrictions on the number of people they deal with. Work in Progress (Disability Charities Consortium 2013) raises some serious concerns about Work Choice being used as a more general programme rather than, as it was intended, to support those with more significant disabilities. The report cites DWP statistics that only 42 percent of referrals are for DLA claimants, although only disabled people ought to be referred to Work Choice, as well as citing other constraints, particularly the rule whereby Work Choice participants must be able to work 16 hours after six months on the programme.
The Work in Progress report (Disability Charities Consortium 2013), like this evidence review, raised concerns about the over-emphasis of government policy on ‘supply-side’ issues in relation to the workforce – such as individual disabled people’s skills and motivations – rather than ‘demand-side’ issues such as a lack of suitable vacancies or work with employers to accommodate the needs of disabled workers. We discuss the role of employers in more detail below.
Supported employment for people with severe mental health conditions
There is an increasing body of evidence to support a “place, support and train” approach14, which involves long-term in-work support as the best model to help disabled people into employment that they are able to sustain – a different model to that used in the Work Programme. As well as a high level of in-work support, such on-the-job training presupposes some subsidy to the employer, particularly to smaller employers. This is a form of Supported Employment, which is defined as ‘paid work that takes place in normal work settings with provision for ongoing support services’ (Crowther et al (2001)).
In general terms, supported employed showed better employment outcomes for people with severe mental health problems than other approaches (pre-vocational training, standard community care and hospital care), according to a Cochrane review of five randomised control trials in 2001 (Crowther et al (2001)). Within this, particular attention in recent years has been focused on the Individual Placement and Support (IPS) approach, which is a form of supported employment specifically developed for people with mental health conditions. This model was first developed in the United States and has since been trialled in a number of other settings, including the UK. IPS is underpinned by seven evidence-based principles that are important in determining success in helping people to gain and retain employment:
“competitive employment is the goal, the job search occurs rapidly, eligibility is based on client choice, job choice follows client preference, support is ongoing and is based on client need, employment and mental health services are integrated, and personalized welfare benefits advice and guidance is provided. IPS is a direct, individualized search for competitive employment that avoids lengthy pre-employment preparation or training and does not screen people for work ‘readiness’ or ‘employability’. IPS does not exclude people on the basis of diagnosis, symptoms, or substance misuse” (Rinaldi et al, 2010, p.164)
14
In “place, support and train” approaches, the job comes first and then the person is trained in the job, with support in training and in sustaining the job. This contrasts with “train, place and (perhaps) support” approaches, which are not focussed on particular jobs; instead, the person is “trained” for an abstract job.
Disability and poverty draft
50
Over 16 randomised control trails have indicated that the IPS supported employment approach can increase the competitive employment rate of people with longer term mental health conditions in comparison to other variations of assisting people into employment. In a review of IPS trials, Bond and colleagues (2008) showed the average competitive employment rate for IPS was 61% compared to 23% for traditional “train and place” approaches. A later Cochrane review of 14 randomised control trials (13 of which were IPS interventions) similarly found binary employment outcomes (and to a lesser extent number of days in employment in the following year) were consistently higher in supported employment vs. other vocational approaches (Kinoshita et al.2013)
Some caveats should be noted here that the evidence is often ‘of very poor quality’ (Kinoshita et al). Moreover, as Bond et al (2012) note, ‘undue influence of model developers on evaluations of their own model has been criticized as introducing the bias of therapeutic allegiance’ in other words, those evaluating these interventions may be biased in favour of identifying good outcomes, a risk perhaps common to many innovative approaches). A final caveat is that the one UK trial reviewed by Bond et al showed no significant improvement over the control group. However, as Latimer (2012) argues, the resources directed to the trial in the UK were very low compared to an earlier US trial, and – strikingly – contact between the support workers and the clients was on average only about once a month.
Overall, however, there is strong evidence that supported employment – and particularly IPS for people with severe mental health problems, an area that other interventions often struggle with – can have stronger impacts on employment than other interventions. However the experience of the UK trial of IPS suggests that this type of intervention needs to be properly resourced: ‘support’ means support. Rinaldi et al (2010) report that, following reviews of the research evidence, national clinical guidelines from the National Institute for Health and Clinical Excellence in England have recommended supported employment for those with severe mental health problems. The NICE guidelines on interventions in the treatment of schizophrenia and bi-polar disorder each suggest the IPS approach should be provided for those who wish to return to work or gain employment.
THE ROLE OF EMPLOYERS
Employer discrimination
There is a common perception among employers that employing disabled people involves greater ‘cost’, or is somehow more problematic than employing nondisabled people.15 But many employers say they do not have or find it hard to obtain reliable information on costs and risks of employing disabled people (Davidson, 2011; Hasluck 2006, Meager and Goldstone 2002). Employers have more positive attitudes towards retaining existing employees who become disabled, are more willing to make adjustments for them and will pay more for adjustments than they are willing to hire or make/pay for adjustments for a “new” disabled employee. As a result, Daone and Scott (2003) found that disabled people made many more job applications than non-disabled people (an average of 2.5 times more), but received fewer offers of work.
15
Meagher and Higgins (2011) in a report for the UK Commission for Employment and Skills point out however that there are limitations to the survey evidence about employers’ views on disabled people (due to lack of comparability).
Disability and poverty draft
51
Perceptions of cost and difficulty of making adjustments are lower with hindsight, than in anticipation. There is also evidence that employers with experience of employing disabled people see the extra costs of employing disabled people as smaller (or non-existent), and have more positive attitudes to employing disabled people, than do those without experience (Meager 2006).
Small employers are less likely to employ disabled people, less likely to have disability policies in place; and more likely to have concerns about the costs and difficulties of employing disabled people (Roberts et al, 2004). On the other hand, some case-study evidence shows that small employers, particularly where the owner-proprietor has personal or family experience of disability, can be more flexible than larger organisations in overcoming barriers to employing disabled people ((Hasluck 2006; Meager and Goldstone 2002; Stevens, 2002). Kelly et al. (2005), investigating small employers’ awareness and responses the October 2004 DDA duties, found that, overall, awareness of DDA legislation had increased and negative attitudes to disabled people had declined, though with residual prejudice still in place.
Social clauses in government procurement are being used as a way of overcoming employer reluctance to employ long term unemployed people generally. The Public Services (Social Value) Act 2012 in England and Wales, which came into force on 31 January 2013, places a requirement on commissioners to consider the social, economic and environmental benefits of their approach to procurement before they start the process. A similar bill is under consideration in Scotland. Both provide an opportunity to ensure that more disabled people are offered the opportunity to take up paid work. The European Commission argues that all procurement exercises should aim to include some “Socially Responsible Public Procurement” practices including providing employment opportunities for long-term unemployed, older and disabled workers, ending workplace discrimination and supporting social inclusion.
Job adjustments
There is good evidence that explicit employer-sanctioned adjustments to jobs are effective in enabling disabled people to stay in work (Franche, et al. 2005). There is also some evidence that some of the differences in the disability employment rate between countries is linked to the availability of job adjustments – at least for low back pain. In one of the few studies to compare outcomes in different countries over extended time periods, Anema et al show that return to work after low back pain-related sickness absence varies considerably, with sick-listed workers in the Netherlands returning more quickly than in other countries and with employment after two years ranging from 62% in the Netherlands to 22% in Germany. Variation in return to work was associated with availability of work interventions such as workplace adaptation and hours adjustments (alongside other factors such as the stringency of benefit entitlement; see above). The UK was not included in this study however.
It is a legal obligation in many countries for employers to make ‘reasonable’ adjustments like this, including in the UK (firstly from the Disability Discrimination Act 1995, more recently in the Equalities Act). UK court judgements in relation to reasonable adjustments have indicated that the full extent of the duty to make reasonable adjustments “goes beyond placing individuals on an even playing field and involves a duty to give disabled employees more favourable treatment in certain circumstances” (Mann and Martyn, 2006). A series of judgements suggest that the duty to make reasonable adjustments applies to every stage of employment, is not limited to physical adjustments or changes to working hours and extends to the conduct of grievance procedures, disciplinary procedures, training and consultation about an individual's health. A reasonable adjustment could include making a new role available for an individual or promoting them to a different role (Mann and Martyn, 2006).
Disability and poverty draft
52
Yet it is increasingly difficult for staff to get the adjustments they require. While this may be understandable in some small, private sector employers, a 2011 report to the Civil Service Task Force on Disability suggests that disabled people face huge obstacles to remaining in employment even when their employer has exemplary supportive policy:
The report detailed the results of research with over 800 civil servants and 30 focus groups with disabled civil servants across the UK. The research was commissioned following the People Survey (2009) which found that disabled Civil Servants were three times more likely than others to report bullying, harassment or discrimination and that the overall level of engagement of disabled people was significantly lower than that of Civil Servants as a whole.
The study found that, despite excellent policy guidance, there were inconsistencies in practice, depending on individual line managers. There was no uniformity across the civil service on disability leave - some Departments allow it; others do not. Different interpretations by line managers led to some staff being given time off for hospital appointments and others having to take annual or sick leave to go to medical and disability-related appointments.
Where there is disability leave allowance there is often pressure from managers upon the staff member to reduce it, particularly in departments that are target-driven where “there is no flexibility in delivery models or role requirements to accommodate the needs of staff with disabilities.”
The report also found that the majority of participants had insufficient advice on, and poor experiences in the delivery of, reasonable adjustments. Participants reported “having a real fight to get any adjustments in place even when the cost is small and impact high. An example of a person being on 18 months gardening leave waiting to have a £15 - £30 mouse approved, tested and placed onto their computer.”
These findings are not very different to much smaller scale studies of other employers, (Kelly et al, 2005;Jacoby et al, 2005; Kitching, 2006; Newton et al,2007). One explanation for this is that the exceptional nature of adjustments can induce resentment amongst colleagues, which the ‘engaged employers’ in Sainsbury et al (2008:89) said was the biggest barrier they faced in making adjustments. Disabled people seem to fare much better in the retail sector, where several of the larger chain stores have programmes that ensure that adjustments are made to meet the needs of disabled employees and disabled people make up 6 percent of the workforce in some (Jones and Schmidt, 2004) – although we must bear in mind that retail sector employment is low paid and unlikely to help lift disabled people out of poverty.
Yet, as the Civil Service report points out, refusing or dragging heels on provision of reasonable adjustments is counter-productive and ultimately far more expensive than a speedy provision of relatively inexpensive adjustments. Disabled workers are forced into a confrontational process such as a grievance procedure, with all the additional stress that accompanies this. As the Civil Service report points out, Disability Discrimination Employment Tribunals have given awards up to £388k and the average award is £27k. These figures exclude legal costs and loss of time and compare with the average cost of a physical reasonable adjustment – which is just £300.
There seems to be a lack of awareness of just how strong the duty to provide reasonable adjustments is, on the part of both employers and trade unions. More awareness training by employer representative bodies and trade unions might help to improve the situation.
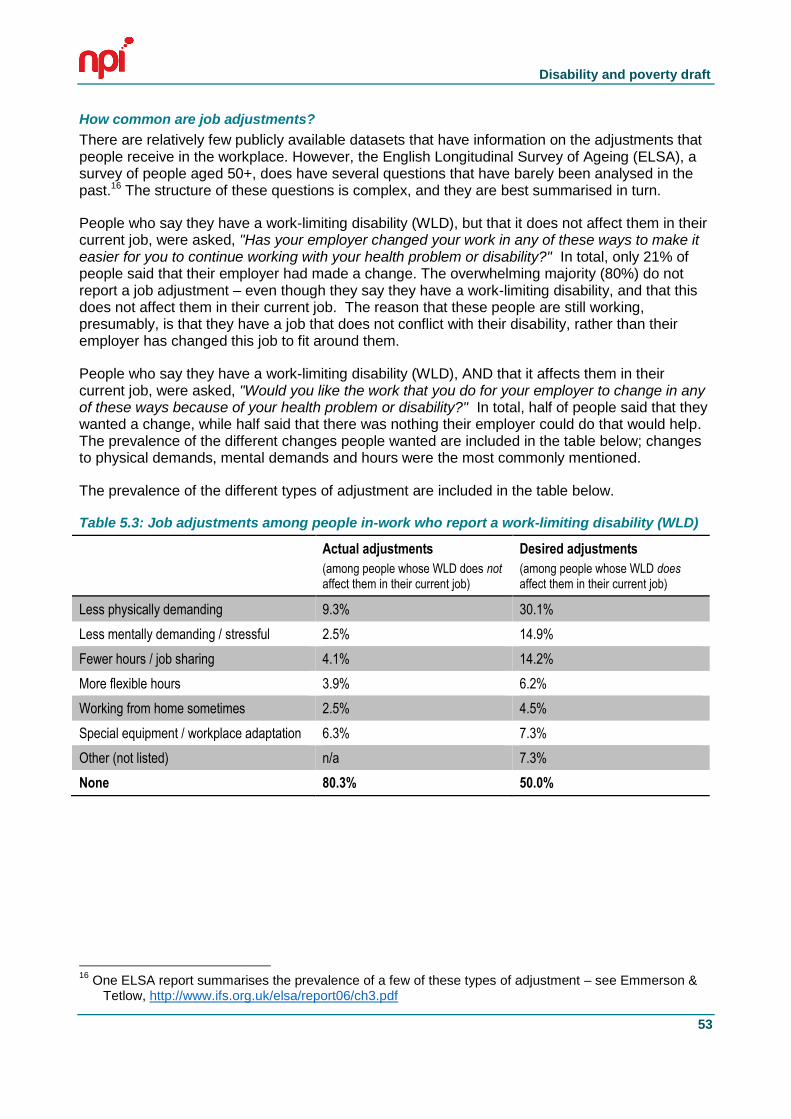
Disability and poverty draft
53
How common are job adjustments?
There are relatively few publicly available datasets that have information on the adjustments that people receive in the workplace. However, the English Longitudinal Survey of Ageing (ELSA), a survey of people aged 50+, does have several questions that have barely been analysed in the past.16 The structure of these questions is complex, and they are best summarised in turn.
People who say they have a work-limiting disability (WLD), but that it does not affect them in their current job, were asked, "Has your employer changed your work in any of these ways to make it easier for you to continue working with your health problem or disability?" In total, only 21% of people said that their employer had made a change. The overwhelming majority (80%) do not report a job adjustment – even though they say they have a work-limiting disability, and that this does not affect them in their current job. The reason that these people are still working, presumably, is that they have a job that does not conflict with their disability, rather than their employer has changed this job to fit around them.
People who say they have a work-limiting disability (WLD), AND that it affects them in their current job, were asked, "Would you like the work that you do for your employer to change in any of these ways because of your health problem or disability?" In total, half of people said that they wanted a change, while half said that there was nothing their employer could do that would help. The prevalence of the different changes people wanted are included in the table below; changes to physical demands, mental demands and hours were the most commonly mentioned.
The prevalence of the different types of adjustment are included in the table below.
Table 5.3: Job adjustments among people in-work who report a work-limiting disability (WLD)
Actual adjustments
(among people whose WLD does not affect them in their current job)
Desired adjustments
(among people whose WLD does affect them in their current job)
Less physically demanding 9.3% 30.1%
Less mentally demanding / stressful 2.5% 14.9%
Fewer hours / job sharing 4.1% 14.2%
More flexible hours 3.9% 6.2%
Working from home sometimes 2.5% 4.5%
Special equipment / workplace adaptation 6.3% 7.3%
Other (not listed) n/a 7.3%
None 80.3% 50.0%
16
One ELSA report summarises the prevalence of a few of these types of adjustment – see Emmerson & Tetlow, http://www.ifs.org.uk/elsa/report06/ch3.pdf
Disability and poverty draft
54
But are these adjustments equally available to everyone? If we compare lower-educated and higher-educated people, and bearing in mind some challenges in making this comparison,17 job adjustments are more likely among those with lower education (in this select group of people with a WLD and a job, where their WLD does not affect their current job). This is particularly the case for changes to the physical demands of work – partly reflecting that physical demands are less common at work among those with greater education.18 In terms of the adjustments desired by working people whose WLD does affect their current job, those with lower education are likewise more likely to want less physical demands or special equipment, while those with more education are more likely to want less mental demands, fewer hours, fewer hours, more flexible hours or home-working. But the more striking finding is that roughly the same proportions of lower-educated and higher-educated workers want a change to their job due to their health condition/disability.
Finally, people who have changed job or stopped working due to ‘own health or disability’ or ‘job was too tiring/stressful’ were asked, ‘If [your] work had been changed in any of these ways, would [you] have been able to continue working [for that employer / in that job]?’ As shown in the table below, the majority of those changing jobs for health/stress reasons say that changes to that job would have enabled them to stay (over 60%) – particularly around mental demands and (to a lesser extent) physical demands and fewer hours. In contrast, relatively few of those leaving employment for health/stress reasons say that any changes to their previous job would have helped (30%).
17
Education here is split in two roughly equal groups, of A-levels or above (higher education) or O-levels and below (lower education); more detailed splits are not available due to the small numbers of people answering questions about job adjustments. However, interpreting some of these figures is difficult as they were only asked to people who said that their WLD does not affect them in their current job. This is heavily skewed by education:
- WLD reporting: 23% of people with higher education report a WLD, compared to 38% of those with lower education.
- Employment rates among those with a WLD: among those with a WLD at all, far more people with higher education are working (22%) than the proportion of lower educated people with a WLD (10%).
- WLD limitations in current job: however, roughly the same proportion of those with a WLD +working say it limits them in their current job among both educational groups.
18 This may partly reflect the fact lower-educated people with a WLD are less likely to be in work, which
may be because they it is harder for them to continue in work without a change to their job.
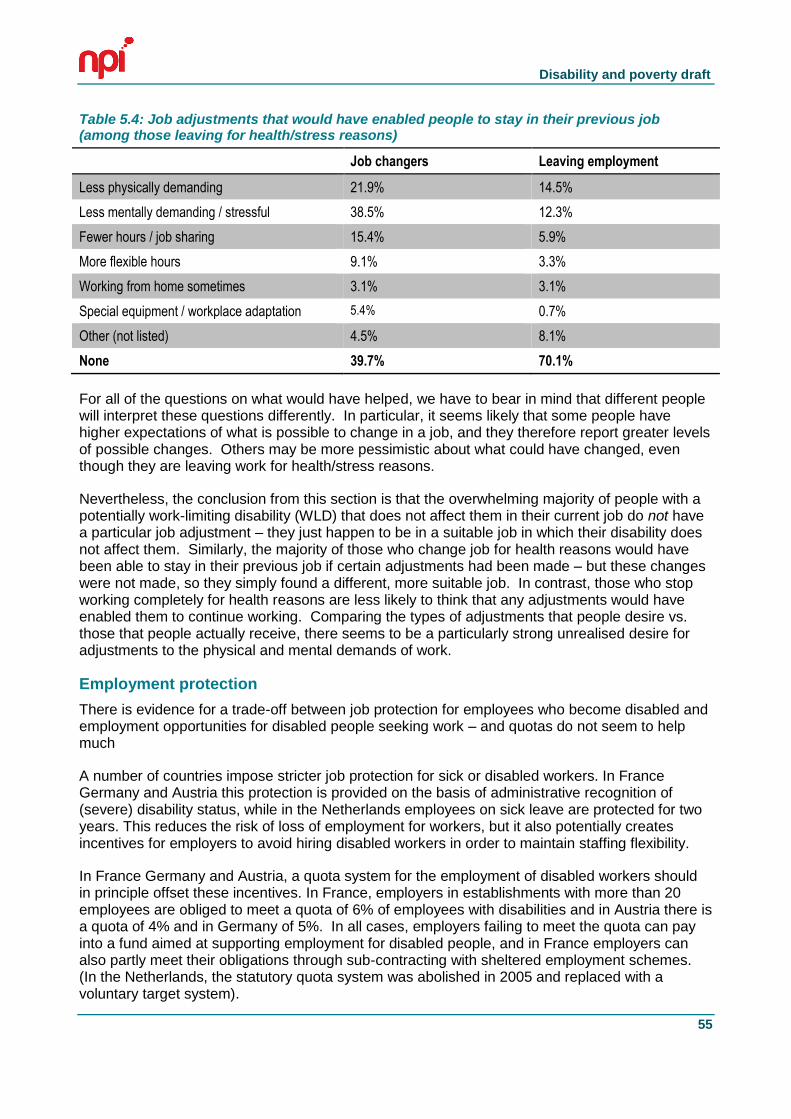
Disability and poverty draft
55
Table 5.4: Job adjustments that would have enabled people to stay in their previous job (among those leaving for health/stress reasons)
Job changers Leaving employment
Less physically demanding 21.9% 14.5%
Less mentally demanding / stressful 38.5% 12.3%
Fewer hours / job sharing 15.4% 5.9%
More flexible hours 9.1% 3.3%
Working from home sometimes 3.1% 3.1%
Special equipment / workplace adaptation 5.4% 0.7%
Other (not listed) 4.5% 8.1%
None 39.7% 70.1%
For all of the questions on what would have helped, we have to bear in mind that different people will interpret these questions differently. In particular, it seems likely that some people have higher expectations of what is possible to change in a job, and they therefore report greater levels of possible changes. Others may be more pessimistic about what could have changed, even though they are leaving work for health/stress reasons.
Nevertheless, the conclusion from this section is that the overwhelming majority of people with a potentially work-limiting disability (WLD) that does not affect them in their current job do not have a particular job adjustment – they just happen to be in a suitable job in which their disability does not affect them. Similarly, the majority of those who change job for health reasons would have been able to stay in their previous job if certain adjustments had been made – but these changes were not made, so they simply found a different, more suitable job. In contrast, those who stop working completely for health reasons are less likely to think that any adjustments would have enabled them to continue working. Comparing the types of adjustments that people desire vs. those that people actually receive, there seems to be a particularly strong unrealised desire for adjustments to the physical and mental demands of work.
Employment protection
There is evidence for a trade-off between job protection for employees who become disabled and employment opportunities for disabled people seeking work – and quotas do not seem to help much
A number of countries impose stricter job protection for sick or disabled workers. In France Germany and Austria this protection is provided on the basis of administrative recognition of (severe) disability status, while in the Netherlands employees on sick leave are protected for two years. This reduces the risk of loss of employment for workers, but it also potentially creates incentives for employers to avoid hiring disabled workers in order to maintain staffing flexibility.
In France Germany and Austria, a quota system for the employment of disabled workers should in principle offset these incentives. In France, employers in establishments with more than 20 employees are obliged to meet a quota of 6% of employees with disabilities and in Austria there is a quota of 4% and in Germany of 5%. In all cases, employers failing to meet the quota can pay into a fund aimed at supporting employment for disabled people, and in France employers can also partly meet their obligations through sub-contracting with sheltered employment schemes. (In the Netherlands, the statutory quota system was abolished in 2005 and replaced with a voluntary target system).
Disability and poverty draft
56
Despite these potential offsets to employer incentives to avoid hiring disabled workers, the evidence from Austria is that employment protection has the predicted effect of disadvantaging disabled people who are not in employment. Humer et al (2007) show that the award of severe disability (SD) status increases subsequent employment for those who are in employment at the time of award by 10% while reducing employment for those out of work by 29%. ‘We find that individuals who hold a job at SD-entry enjoy strong employment gains whereas for individuals who do not have a job at SD- entry employment prospects are dramatically reduced. This is in line with the hypothesis that employment protection legislation with respect to disabled individuals have a strong impact on hiring decisions of firms.’
Hogelund 2003 compares employment outcomes in Denmark where employment protection has been liberalised and the Netherlands, where employers’ ability to lay off sick and disabled workers is much more limited. Dismissal rates are indeed much lower in the Netherlands but workers who are dismissed are much more likely to return to work in Denmark than in the Netherlands. This effect remains significant and strong when a range of other factors influencing return to work are taken into account. Hogelund concludes: ‘The strict Dutch job-protection legislation makes it difficult for employers to get rid of sick-listed workers. As a consequence employers who cannot lay off sick-listed workers have strong incentives to facilitate their return to work, even though the work capacity of these workers may be considerably reduced. At the same time this explanation indicates why the chance of returning to work is low when the sick-listed worker is dismissed. These people are forced to find work with a new employer who will be reluctant to offer them a job because their extensive sick leave record indicates that they have a potentially high future risk of disability.’
The Netherlands, Austria and Germany show relatively low employment rates for people reporting strong limitation. It would seem that the use of a quota system in Austria and Germany fails to compensate for the negative impact on out-of-work disabled people of an insider/outsider model of employment protection. However France which uses high employment protection and a quota system shows much better outcomes for the strongly limited group – albeit, given the caveats about the comparability of disability employment rates across countries that we have previously noted.
57
6. A STRATEGY FOR REDUCING DISABILITY POVERTY
This chapter summarises the views of disabled people at a policy workshop facilitated by Disability Rights UK on behalf of the research team on 10th October 2013.19 Participants were given a (written and verbal) briefing based on an interim summary of the evidence described above. We have sought to reflect the full variety of participants’ views rather than artificially creating a ‘consensus’ – all of the comments should be read as the views of some people (but not everyone) unless we specify that there was unanimous agreement.
ISSUE 1: MATERIAL RESOURCES AND EMPLOYMENT
In this part of the meeting, we asked people to focus on the support that disabled people should receive to get and keep paid employment, the changes needed among employers, and how income should be provided to disabled people who are not working.
In terms of support given to disabled people, skills and education were seen to be crucial, particularly given the disability skills gap. We need to help people reskill if there is a mismatch between the jobs their disability allows them to do vs. the jobs they have done in the past. And we also need to help people progress when they are in work, including with further skills training. It was noted that people unfairly talk about ‘employment’ for disabled people, but ‘careers’ for non-disabled people.
Personalisation was stressed by many people, as there are a huge range of experiences that go under the terms of ‘disability’ and ‘sickness’, and people need support that is tailored to their particular needs. People are experts on their own situations, but sometimes professionals can be valuable in helping them discover what they are capable of, as well as providing knowledge of the local labour market to match them to suitable jobs – in much the same way as careers advisors provide valuable expertise.20 However, the existing system was widely seen to be failing to provide this. The Work Programme was seen as formulaic, depersonalised, and lacking the resources to provide the support that was required.
Several other types of support were also seen to be important, including a mental health system that helps people gain work rather than emphasising ‘recovery’.
Beyond this, the role of employers was seen as crucial. Recent governments have tended to ask ‘what should disabled people do differently’ rather than ‘what should employers do differently’, and the JRF should make sure they avoid doing this in their anti-poverty strategy. Adjustments and more flexible working practices (e.g. annualised hours, home-working) could help more people to work, as could more positive attitudes among employers, educators, and more widely in society.
19
Participants at the workshop include: Roger Berry, Sue Bott, Leo Capella, Neil Crowther, Marije Davidson, Karen Earl, Kaliyah Franklin, Eileen Gifford, Cheryl Gowar, Aisha Khan, Jenny Morris, Liz Sayce, Rachael Wallach, Bill Whillock, Jane Young, and the research team (Ben Baumberg, Declan Gaffney, Goretti Horgan, Tom Macinnes, and Adam Tinson).
20 An example from the TV programme ‘Benefits Britain 1949’ was given, where someone did a work trial in
a garden centre, realised that it wasn’t suitable, and were then moved to a call centre that worked much better – trying things out and learning were seen as important.
Disability and poverty draft
58
Changing employer practices was seen as difficult however. Different individual managers can be more or less helpful, and a radical improvement in advice and training to employers (perhaps linked to a more proactive Access to Work) could help improve practice. But people realised that there are limits to this, particularly where there are additional costs (e.g. cover for people with fluctuating conditions) to small businesses who are struggling to survive.
Many suggestions therefore involved stronger actions. Sometimes this was through regulation (supporting disabled people to assert their existing employment rights). Sometimes this was through incentives (targeted help to small companies, expanded access to work, personal budgets for employment support21). And at the present time, a general lack of jobs is also a major problem.
In terms of the benefits system, changes are needed so that the system doesn’t stop people from being able to work. Portability of locally-allocated benefits is important, so that people can move to areas where there are more (and more suitable) jobs – following on from the introduction of a right to portability of social care in 2013.22 And we need a radical change so that people with fluctuating conditions can work when they are able to, and receive benefits when they cannot – a change that in theory may be partly met by the new Universal Credit system, if the challenges of delivering this system can be met.
The role of benefits in providing security outside of work was also discussed. Work is not necessarily what people want when they have just found out about a serious disability/health condition, and the system should respect this. Many people also felt that the Work Capability Assessment should be scrapped, or at least, substantially changed.
More widely, there is a need to challenge the way that ‘work’ is usually defined as ‘paid employment’, to instead consider caring, housework and volunteering as ‘work’. It was felt that disabled people are more likely to have caring responsibilities compared to other people, so the status of caring in particular is important for a strategy on disability and poverty.
ISSUE 2: THE EXTRA COSTS OF DISABILITY
In this part of the meeting, we asked people to focus on how far extra costs should be provided with a special payment (like DLA) or through service provision, and what could be done more widely to reduce extra costs.
It was widely felt that these questions were more difficult than the ones in the first part of the meeting. Still, participants came up with both some useful principles and a number of valuable, more specific suggestions.
In terms of principles, Disability Living Allowance was described as a ‘great benefit’ that directly responds to the extra costs of disability, and which has a low rate of fraud. A number of issues connected to this were discussed:
21
Some people suggested that these could be partly held by the employer; others disagreed as they felt this should be fully under the control of the disabled person themselves.
22 See http://www.disabilityrightsuk.org/news/2013/october/social-care-portability-now-accepted-right and
http://disabilitynewsservice.com/2013/10/care-bill-campaigners-make-a-little-history-with-lords-portability-victory/
Disability and poverty draft
59
Providing services directly could sometimes be more effective than personalised individual budgets – but generally costs are seen to be so wide-ranging and variable across people (as well as across local areas) that extra costs need to be met more flexibly through payments. Even then, DLA does not map perfectly onto costs (some people who do not claim have significant costs), but people generally accepted that some arbitrariness was hard to avoid.
There was also discussion about integrating DLA/PIP with social care, healthcare et al into a single ‘extra costs payment’ (still with an assessment of eligibility and different levels of payment). However, others saw a number of risks and problems in this, including cuts (if controlled by local authorities), means-testing, local variation etc., and particularly levels of control and empowerment. There was no overall consensus about whether integration should be pursued.
Given market failures that make assistive technologies very expensive (see below), it seems unfair that only disabled people in work can buy certain important goods through Access to Work. There is an argument for extending this more widely, in a new ‘Access to Life’ scheme.
Irrespective of these broad issues, there is a need to make the operation of the system in practice work much better. For example, there are significant problems with the claims process for PIP (even ignoring the delays involved), with badly-designed fraud prevention processes preventing some claimants from accessing the support they need in completing the application forms, and with the opinion of medical professionals marginalised in practice (if not in theory) due to a poorly designed system for obtaining and incorporating their opinion in decision-making. Too often processes are designed by non-users, with overly narrow criteria and a lack of a proper appeals system – all of which should be changed.
In terms of specific ways of reducing extra costs, people suggested:
Technology could be used to reduce costs. Prizes could be set up to get entrepreneurs to think of innovative ways of reducing costs (as happens more commonly in the US), massively up scaling the existing activities on this in the UK. There is a rationale for the Government to invest in this, as it meets social goals while encouraging growth. Open source software could also help make technologies more widely accessible (e.g. free dictation software).
Standards for consumer devices (e.g. baby alarms) could build in accessibility, without the need for separate markets specifically for disabled people. Government could lead in this by building accessibility into its contracts and commissioning, as the US Government has done previously – but this is missing from the current consultation on standards for new-build homes.
The markets for assistive technologies could be improved. Bulk-buying could be done by co-operatives or the Government (as was previously done for hearing aids), although this must be of a high-quality and adequately reflect diversity among disabled people. And simple changes like a website linking to different providers and with cost comparison tools could make the existing market work more efficiently.
Disabled people are legally discriminated against in certain markets, such as insurance, where companies are able to argue that there is an ‘objective justification’ (i.e. that the risk being covered is higher). Government could legislate to make this discrimination illegal, reducing cost to disabled people.
People also drew attention to the critical importance of housing and transport costs; if housing and transport were more accessible for disabled people then these costs would be reduced. Many people also discussed the problems of the ‘bedroom tax’, and felt that this policy should be reversed.
Disability and poverty draft
60
OVERARCHING THEMES
Several more overarching themes came through many of the discussions:
People stressed that ‘disability’ and ‘sickness’ are diverse and complex. Policymakers should resist the temptation to make policies that falsely simplify the issues, and instead deal with the real-life variety that exists among disabled people.
People felt that policies should not be seen as a series of disconnected levers to be pulled – it’s about changing many things at the same time, to create a system that works for disabled people as a whole.
People felt that disabled people are often treated in a way that would not be considered acceptable to other groups. For example, inaccuracies and inefficiencies in the benefits system further contribute to poverty among disabled people – and this would not be tolerated if it was repeated in the tax system.
Connected to this, people felt that there is a need to address the way that the entire debate is currently framed. The current policy debate often seems to deny the legitimacy of social security benefits (e.g. categorising claiming per se as an undesirable sign of ‘dependency’ that should be tackled), and to deny that some people are simply not able to work. It will be hard to tackle poverty among sick and disabled people without fundamentally changing the debate.
We (this report’s authors) have committed to the workshop participants that we will ask JRF to send the participants a note on how they have reflected your views in their final anti-poverty strategy.
61
BIBLIOGRAPHY
Adams, L. and Oldfield, K. (2012). Opening up work: The views of disabled people and people with long-term health conditions: Research Report 77. London: Equality and Human Rights Commission.
Andren, D. (2011) ‘Is part-time sick-leave helping the unemployed?’ Swedish Business School, Orebro University Working Paper 5.
Anema J.R., Schellart, A.J.M., Cassidy, J.D., Loisel, P., Veerman, T.J. and van der Beek, A.J. (2009) ‘Can cross country differences in return-to-work after chronic occupational back pain be explained? An exploratory analysis on disability policies in a six country cohort study’, Journal of Occupational Rehabilitation,19 (4), pp.419-26.
Autor, D.H. and Duggan M.G. (2003) ‘The rise in disability rolls and the decline in unemployment’, Quarterly Journal of Economics, 118 (1), pp.157-206.
Bambra, C., Whitehead, M. and Hamilton, V. (2009) Does ‘welfare to work’ work? A systematic review of the effectiveness of the UK’s ‘welfare to work’ programs for people with a disability or chronic illness. Social science and medicine, 60 (9), pp.1905-1918.
Barnes, C. and Mercer, G. (2005) ‘Disability, work and welfare: challenging the social exclusion of disabled people’, Work, Employment and Society, 19 (3), pp.527-545.
Baumberg, B. (2011) 'Self-reported fitness-for-work in Britain: trends and implications', in Vickerstaff, S., Phillipson, C. and Wilkie, R. (eds.), Work, Health and Well-being: The challenges of managing health at work, Bristol: Policy Press.
Bell, B. and Smith, J. (2004) Health, disability insurance and labour force participation. Bank of England Working Paper No. 218.
Benitez-Silva. H., Buchinsky, M., Chan, M.H, Cheidvasser, S., and Rush, J. (2004) ‘How large is the bias in self-reported disability?’, Journal of Applied Econometrics, 19 (6), pp.649-670.
Black, C. (2008) Working for a healthier tomorrow: Dame Carol Black's review of the health of Britain's working age population. London: TSO.
Black, C. and Frost, D. (2011) Health at Work: an independent review of sickness absence. London: TSO.
Blackburn, C.M., Spencer, N.J. and Read, J.M. (2013) ‘Is the Onset of Disabling Chronic Conditions in Later Childhood Associated With Exposure To Social Disadvantage In Earlier Childhood? A Prospective Cohort Study Using the ONS Longitudinal Study For England And Wales’, BMC Pediatrics, 13 (1), p.101.
Blackburn, C.M., Spencer, N.J., and Read, J.M. (2010) ‘Prevalence of childhood disability and the characteristics and circumstances of disabled children in the UK: secondary analysis of the Family Resources Survey’, BMC Pediatrics, 10, 21.
Boardman J. (2003) ‘Work, employment and psychiatric disability’, Advances in Psychiatric Treatment, 9, pp. 327-334.
Boardman, J. (2011) ‘Social exclusion and mental health - how people with mental health problems are disadvantaged: an overview’, Mental Health and Social Inclusion, 15 (3), pp.112-121.
Disability and poverty draft
62
Bond, G.R., Drake, R.E. and Becker, D.R. (2012) ‘Generalizability of the Individual Placement and Support (IPS) model of supported employment outside the US’, World Psychiatry, 11(1), pp.32–39.
Borsch-Supan, A. (2008) ‘Changes in health status and work disability’ in Borsch-Supan, A., Brugiavani, A., Jurges, H., Kapteyn, A., Mackenbach, J., Siegrist, J., (eds.), First Results from the Survey of Health, Ageing and Retirement in Europe (2004-2007) Starting the Longitudinal Dimension. Mannheum: Mannheim Research Institute for the Economics of Ageing.
Brawn, E. and Rogers, C. (2012) Keep us close: Ensuring good, inclusive and accessible local services for disabled children and their families. London: Scope.
Campbell, J., Wright, C., Mosley, A., Chilvers, R., Richards, S. and Stabb, L. (2007). Avoiding long-term incapacity for work: Developing an early intervention in primary care. London: Department for Work and Pensions.
Cimera, R.E. (2012), ‘The economics of supported employment: What new data tell us’, Journal of Vocational Rehabilitation, 37 (2), pp. 109–117.
Clayton, S., Bambra, C., Gosling, R., Povalls, S., Misso, K., and Whitehead, M. (2011) ‘Assembling the evidence jigsaw: insights from a systematic review of UK studies of individual focused return to work initiatives for disabled and long-term ill people’, BMC Public Health, pp. 11-170.
Clayton, S., Barr, B., Nylen, L., Burström, B., Thielen, K., Diderichsen, F., Dahl, E. and Whitehead, M. (2012), 'Effectiveness of return-to-work interventions for disabled people: a systematic review of government initiatives focused on changing the behaviour of employers', European Journal of Public Health, 22 (3), pp.434-439.
Contact a Family (2012), Counting the Costs: the financial reality for families with disabled children across the UK. London: Contact a Family.
Crowther, R., Marshall, M., Bond, G., and Huxley, P. (2001) ‘Vocational rehabilitation for people with severe mental illness’, Cochrane Database of Systematic Reviews, 2.
Daone, L. & Scott, R. (2003) Ready, willing and disabled. London: Scope.
Davidson, J. (2011) A qualitative study exploring employers’ recruitment behaviour and decisions: small and medium enterprises, London: DWP Research Report No 754.
De Walque, D. (2003) ‘Long-term disability insurance in the Netherlands: a problem of hidden unemployment?’ Cuadernos de Economía, 40 (1), pp.485-494.
Disability Charities Consortium (2013), Work in Progress: rethinking employment support for disabled people. London: Disability Charities Consortium.
Disablement Income Group (1988) Not the OPCS survey: Being disabled costs more than they said. London: DIG.
Dobson, B. and Middleton, S. (1998). Paying to Care: The cost of childhood disability. York: Joseph Rowntree Foundation.
Dohrenwend, B.P., Levav, I. and Shrout, P. (1992) ‘Socioeconomic status and psychiatric disorders: the causation-selection issue’, Science, 255 (5047), pp. 946–52.
Egan, M., Bambra, C., Thomas, S., Petticrew, M., Whitehead, M. and Thomson, H. (2007) ‘The Psychosocial And Health Effects Of Workplace Reorganisation. 1. A Systematic Review Of Organisational‐Level Interventions That Aim To Increase Employee Control, J. Epidemiol Community Health, 61 (11), pp. 945-954.
Faggio, G. and Nickell, S. (2005) Inactivity among prime age men in the UK. CEP Discussion Paper No. 673. London: Centre for Economic Performance.
Disability and poverty draft
63
Falk, J., Bruce, D., Burstrom, B., Thielen, K., Whitehead, M. and Nylen, L. (2013) ‘Trends in poverty risks among people with and without limiting-longstanding illness by employment status in Sweden, Denmark, and the United Kingdom during the current economic recession – a comparative study’, BMC Public Health, 13 (1), pp.925-934.
Fitch, C., Hamilton, S., Bassett, P., Davey, R. (2011) ‘The relationship between personal debt and mental health: a systematic review’, The Mental Health Review 16 (4), pp.153-166.
Forrester-Jones, R., Gore, N. and Melling, K. (2010) ‘How many people with intellectual disability are employed in the UK?’, Tizard Learning Disability Review 15 (1),pp.56-58.
Franche, R.L., Cullen, K., Clarke, J., Irvin, E., Sinclair, S., Frank, J. and The Institute for Work & Health (IWH) Workplace-Based RTW Intervention Literature Review Research Team (2005) 'Workplace-Based Return-to-Work Interventions: A Systematic Review of the Quantitative Literature', Journal of Occupational Rehabilitation 15(4), pp.607-631.
Gaffney, D. (2011) ‘‘Dependency’ and disability: how to misread the evidence on social security’, Soundings, 49, pp.58-72.
Geve, B. (2009). The labour market situation of disabled people in European countries and implementation of employment policies: a summary of evidence from country reports and research studies. ANED/University of Leeds.
Gilworth G.G., Bhakta, B., Eyres, S., Carey, A., Chamberlain, M.A. and Tennant, A. (2007) ‘Keeping nurses working: development and psychometric testing of the Nurse-Work Instability Scale (Nurse-WIS)’. Journal of Advanced Nursing, 57(5), pp.543–551.
Goldstone, C. and Meager, N. (2002) Barriers to employment for disabled people, DWP In-house Research Report No. 95, London: DWP.
Gordon, D., Parker, R. and Loughran, F. (2000) Disabled children in Britain: a re-analysis of the OPCS disability surveys. London: The Stationery Office.
Greasley, P. and Small, N. (2002) Welfare Advice in Primary Care, Nuffield Portfolio Programme Report No. 17. Leeds: Nuffield Institute of Health.
Harris, T. (2001) ‘Recent developments in understanding the psychosocial aspects of depression’, British Medical Bulletin, 57 (1), pp.17–32.
Hayday, S., Rick, J., Carroll, C., Jagger, N. and Hillage, J. (2008), Review of the Effectiveness and Cost Effectiveness of Interventions, Strategies, Programmes and Policies to Help Recipients of Incapacity Benefits Return to Employment (Paid and Unpaid). Institute for Employment Studies: Brighton.
Hill, D., Lucy, D., Tyers, C. and James, L. (2007). What works at work? Review of evidence assessing the effectiveness of workplace interventions to prevent and manage common health problems. London: HMSO.
Hills D., Child, C., Blackburn, V. and Youll, P. (2001) Evaluation of the New Deal for Disabled People Innovative Schemes pilots DWP Research Report 143. London: Department for Work and Pensions.
Hoe, V.C.W., Urquhart, D.M., Kelsall, H.L. and Sim, M.R. (2012) ‘Ergonomic design and training for preventing work-related musculoskeletal disorders of the upper limb and neck in adults (Review)’, The Cochrane Library 2012, 8.
Hogelund, J. (2003) In Search of Effective Disability Policy: Comparing the developments and outcomes of Dutch and Danish disability policies. Amsterdam: Amsterdam University Press.
Disability and poverty draft
64
Hogelund, J. and Holm, A. (2011) ‘The effect of part-time sick leave for employees with mental disorders’ Danish National Centre for Social Research, Department of Employment and integration, Working Paper 01:2011.
Houdmont, J., Kerr, R. and Addley, K. (2012) ‘Psychosocial factors and economic recession: the Stormont Study’, Occupational Medicine, Vol 62 (2), pp 98-104.
Humer, B., Wuellrich, J.-P. and Zweimüller, J. (2007) Integrating Severely Disabled Individuals into the Labour Market: The Austrian Case, IZA DP No. 2649.
ILO (2013) Protecting Workplace Safety and Health in Difficult Economic Times. The Effect of the Financial Crisis and Economic Recession on Occupational Safety and Health. Geneva: International Labour Organisation.
Ipsos MORI (2013) Disabled People and Financial Wellbeing. London: Scope.
Jacoby, A., Gorry, J., and Baker, G.A. (2005) ‘Employers' attitudes to employment of people with epilepsy: still the same old story?’, Epilepsia, 46 (12), pp.1978-1987.
Jesus, Luciana, Almeida, Manuela and Almeida, Antonio (2008), Methodology to assess the cost-effectiveness of sustainable measures in buildings, Proceedings of the 2008 World Sustainable Building Congress. (Volume 1):1307-1314
Jones, M.K. and Latreille, P.L. (2007) Disability, health, caring and the labour market: evidence from the Welsh Health Survey. Swansea: University of Wales.
Jones, P. and Schmidt, R.A. (2004) Retail employment and disability, International Journal of Retail and Distribution Management, 32 (9), pp.426-429.
Jönsson, L., Palme, M. and Svensson, I. (2011) Disability Insurance, Population Health and Employment in Sweden. NBER Working Paper No. 17054. Cambridge, MA: National Bureau of Economic Research.
Kapteyn, A., Smith, J.P. and van Soest, A. (2009) Work Disability, Work, and Justification Bias in Europe and the U.S. NBER Working paper No. 15245. Cambridge, MA: National Bureau of Economic Research.
Kellett, S., Bickerstaffe, D., Purdie, F., Dyke, A., Filer, S., Lomax, V. and Tomlinson, H. (2011) ‘The clinical and occupational effectiveness of condition management for Incapacity Benefit recipients’, British Journal of Clinical Psychology, 50 (2), pp.164–177.
Kelly, G., Lam, P., Thomas, A. and Turley, C. (2005). Disability in the Workplace: Small Employers’ Awareness and Response to the Disability Discrimination Act (1995) and the October (2004) Duties. Leeds: HMSO.
Kinoshita, Y., Furukawa, T.A., Kinoshita, K., Honyashiki, M., Omori, I.M., Marshall, M., Bond, G.R., Huxley, P., Amano, N. and Kingdon, D. (2013) ‘Supported employment for adults with severe mental illness’, Cochrane Systematic Review, 9.
Kitching, J. (2006) ‘Can small businesses help reduce employment exclusion?’, Environment and Planning C: Government & Policy, 24 (6), pp.869-884.
Knapp, M., McDaid, D. and Parsonage, M. (2011), Mental health promotion and mental illness prevention: The economic case. London: Department of Health.
Krska, J., Palmer, S., Dalzell-Brown, A., Nicholl, P. (2013) ‘Evaluation of welfare advice in primary care: effect on practice workload and prescribing for mental health’, Primary health care research & development, 14 (3), pp. 307-314.
Lamb, S.E., Lall, R., Hansen, Z., Castelnuovo, E., Withers, E.J., Nichols, V., Griffiths, F., Potter, R., Szczepura, A., Underwood, M. and BeST trial group (2010) ‘A multicentred randomised
Disability and poverty draft
65
controlled trial of a primary care-based cognitive behavioural programme for low back pain. The Back Skills Training (BeST) trial’, Health Technology Assessment, 14(41), pp.1-253.
Latimer, E. (2010) ‘An effective intervention delivered at sub-therapeutic dose becomes an ineffective intervention’, British Journal of Psychiatry, 196 (5), pp. 341-342.
Lindeboom, M. and Kerkhofs, M. (2002) Health and Work of the Elderly Subjective Health Measures, Reporting Errors and the Endogenous Relationship between Health and Work. IZA Discussion Paper No. 457.Bonn: IZA.
Macmillan (2013). Cancer’s Hidden price Tag; revealing the costs behind the illness. London: Macmillan.
Magadi, M. and Middleton, S. (2007) Severe Child Poverty in the UK. London: Save the Children Fund.
Mangalore, R., Knapp, M. and Jenkins, R. (2007) ‘Income-related inequality in mental health in Britain: the concentration index approach’, Psychological Medicine, 37(7), pp.1037-1045.
Martin, J. and White, A. (1988) The Financial Circumstances of Disabled Adults Living in Private Households. London: HMSO.
Matthews, A. and Truscott, P. (1990) Disability, Household Income, and Expenditure: A follow-up survey of disabled adults in the Family Expenditure Survey. London: HMSO.
McVicar, D. (2006) 'Why do disability benefit rolls vary between regions? A review of the evidence from the USA and the UK ', Regional Studies, 40(5), pp.519-533.
Meager, N. and Hill, D. (2006). UK National Public Policy Initiatives and Regulations Affecting Disabled People’s Labour Market Participation. Working Paper WP2. Brighton: Institute for Employment Studies.
Michie, S. and Williams, S. (2003) ‘Reducing work related psychological ill health and sickness absence: a systematic literature review’, Occup. Environ. Med., 60 (1), pp. 3-9.
Mont, D. (2007) Measuring disability prevalence. Washington D.C.: World Bank.
Monteith, M., Casement, E., Lloyd, K. and McKee, P. (2009).Taking a Closer Look: Child Poverty and Disability. Belfast: Family Fund and Save the Children.
Morciano, M., Hancock, R. and Pudney, S. (2012) Disability costs and equivalence scales in the older population. ISER Working Paper 2012-09. Colchester: Institute for Social and Economic Research.
Morris, J. (2011), Rethinking Disability Policy. York: Joseph Rowntree Foundation.
Newton, R., Ormerod, M. and Thomas, P. (2007) ‘Disabled people’s experiences in the workplace environment in England’, Equal Opportunities International, 26 (6), pp. 610-623.
OECD (2003)Transforming Disability into Ability: Policies to promote work and income security for disabled people. Paris: OECD.
OECD (2009) Pathways on to (and off) disability benefits: assessing the role of policy and individual circumstances. Paris: OECD.
OECD (2010) Sickness, disability and work: Improving social and labour-market integration of people with disability. Paris: OECD.
OECD (2011) Sick on the Job? Myths and Realities about Mental Health and Work. Paris: OECD.
Packar, G. (2008) Disability poverty in the UK. London: Leonard Cheshire Disability.
Disability and poverty draft
66
Riddell, S., Edwards, S., Weedon, E. and Ahlgren, L. (2010). Disability, Skills and Employment: A review of recent statistics and literature on policy and initiatives: Research Report 59. London: Equality and Human Rights Commission.
Rinaldi, M., Miller, L. and Perkins, R. (2010) ‘Implementing the individual placement and support (IPS) approach for people with mental health conditions in England’, International Review of Psychiatry, 22 (2), pp.163-172.
Roberts, S., Heaver, C. and Hill, K. (2004) Disability in the workplace: employers’ and service providers’ responses to the Disability Discrimination Act in 2003 and preparation for 2004 changes. DWP research report 202. London: Department for Work and Pensions.
Sainsbury, R., Irvine, A., Aston, J., Wilson, S., Williams, C. and Sinclair, A. (2008),'Mental health and employment. Department for Work and Pensions Research Report No 513. London: Department for Work and Pensions.
Sainsbury, R., Irvine, A., Aston, J., Wilson, S., Williams, C. and Sinclair, A. (2008) Mental health and employment. Department for Work and Pensions Research Report No 513. London: Department for Work and Pensions.
Schandelmaier, S., Ebrahim, S., Burkhardt, S., de Boer, W., Zumbrunn, T., Guyatt, G., Busse, J. and Kunz, R. (2012) 'Return to work coordination programmes for work disability: a meta-analysis of randomised controlled trials', PLoS One, 7(11), e49760.
Scheil-Adlung, X. and Sandler, L. (2010) Paid sick leave: Incidence, patterns and expenditure in times of crises. ESS paper No.27. Geneva: International Labour Organisation.
Scoonheim, J. (2009) Report on employment of disabled people in European countries. ANED.
Shima, I., Zolyomi, E. and Zaidi, A. (2008) The Labour Market Situation of People with Disabilities in EU25. Brussels: European Centre for Social Welfare Policy and Research.
Sissons, P., Barnes, H. and Stevens, H. (2011) Routes onto Employment Support Allowance. DWP Research Report No. 774. London: Department for Work and Pensions.
Smith, N., Middleton, S., Ashton-Brooks, K., Cox, L., Dobson, B., and Reith, L. (2004) Disabled People’s Costs of Living: More than you think. York: Joseph Rowntree Foundation.
Spencer, N.J., Blackburn, C.M., Read, J.M. (2010) ‘Prevalence And Social Patterning Of Limiting Long-Term Illness/Disability In Children And Young People Under The Age Of 20 Years In 2001: Uk Census-Based Cross-Sectional Study’, Child Care Health Dev., 36(4), pp.566-73.
Stevens, G.R. (2002) “Employers’ perceptions and practice in the employability of disabled people: a survey of companies in south east UK”, Disability & Society, 17 (7), pp.779-796.
Stuckler, D., Basu, S., Suhrcke, M., Coutts, A., and McKee, M. (2009) ‘The public health effect of the economic crises and alternative policy responses in Europe: An empirical analysis’, The Lancet, 374 (9686), pp. 315–323.
Thomas, A. and Griffiths, R. (2010) Disability Living Allowance and work: Exploratory research and evidence review. Department for Work and Pensions Research Report No 648. London: Department for Work and Pensions.
Tibble, M. (2005) Review of the Existing Research on the Extra Costs of Disability. Department for Work and Pensions Working Paper 21. London: Department for Work and Pensions.
Van Agt, H., Stronks, K. and Mackenbach, J.P. (2000) ‘Chronic illness and poverty in The Netherlands’, European Journal of Public Health, 10 (3), pp.197-200.
Van der Burg, C. and Rienk, P. (2010) ‘Employment instead of benefit receipt? process and outcomes of reassessment of Dutch disability benefit recipients’ ,European Journal of Social Security, 12 (2), pp.144-155.
Disability and poverty draft
67
Van Oorschot, W. and Boos, K. (2000) ‘The battle against numbers: disability policy in the Netherlands’, European Journal of Social Security, 2(4), pp.343-361.
Van Sonsbeek, J-M. and Gradus, R. (2011) Estimating the Effects of Recent Disability Reforms in the Netherlands. Tinbergen Institute Discussion Paper No. 11-121/3. Amsterdam: Tinbergen Institute.
Viikari-Juntura, E., Kausto, J., Shiri, R., Kaila-Kangas, L., Takala, E-P., Karppinen, J., Miranda, H., Luukkonen, R. and Martimo, K-P. (2012) ‘Return to work after early part-time sick leave due to musculoskeletal disorders: a randomized controlled trial’, Scandinavian Journal of Work, Environment and Health, 38(2), pp.134-143.
Waddell, G. and Burton, A. K. (2006) Is Work Good for Your Health and Wellbeing? London: The Stationary Office.
Waddell, G., Burton, A.K. and Kendall, N. A.S. (2008) Vocational rehabilitation – what works, for whom, and when? Report for the Vocational Rehabilitation Task Group. TSO, London.
Waddington, L. (2010), Disability Benefits and Entitlements in European Countries: Mutual Recognition and Exportability of Benefits: A synthesis of evidence provided by ANED country reports and additional sources, Academic Network of European Disability experts (ANED) – VT/2007/005, Leeds University and Maastricht University.
Welch, V., Hatton, C., Wells, E., Collins, M., Langer, S., Robertson, J. and Emerson, E. (2010) The impact of short breaks on families with a disabled child: report one of the quantitative phase. Research Report DFE-RR063. London: Department of Education.
Whittaker, W., Sutton, M., Maxwell, M., Munoz-Arroyo, R., MacDonald, S., Power, A., Smith, M., Wilson, P. and Morrison, J. (2010) ‘Predicting which people with psychosocial distress are at risk of becoming dependent on state benefits’. British Medical Journal, 341 (3838).
Wieclaw, J., Agerbo, E., Mortensen, P.B., Burr, H., Tüchsen, F., and Bonde, J.P. (2006) ‘Work related violence and threats and the risk of depression and stress disorders’, Community Health, 60 (9), pp. 771-775.
Wiggan, J. and Talbot, C. (2006) The benefits of welfare rights advice: a review of the literature. National Association of Welfare Rights Advisers.
Wood, C. and Grant, W. (2010) Counting the Cost. London: Demos.
WRC Social and Economic Consultants (2008) Research report on acquired disability and employment. Dublin: Department of Enterprise Trade and Employment.
Yassi, A., Cooper, J.E., Tate, R.B., Gerlach, S., Muir, M. and Trottier, J. (2001) ‘A randomized controlled trial to prevent patient lift and transfer injuries of health care workers’, Spine, 26 (16), pp.1739–1746.
Zaidi, A. (2011) The situation of working-age people with disabilities across the EU. Living Conditions and Income Distribution Research Note 5/2011. Brussels: European Commission Social Situation Observatory
Zaidi, A. and Burchardt, T. (2003) Comparing incomes when needs differ: Equivalisation for the extra costs of disability in the UK. CASE paper 64. London: CASE.
Zold, Andras and Parti, Monika (2010) Sustainable housing for all, respecting disabilities, Proceedings SB10 Portugal: Sustainable Building Affordable to All. "Low Cost Sustainable Solutions", held in March 2010, Algarve, Portugal. p. 841-848


![Disability and Poverty[1]](https://img.pdfslide.net/doc/110x75/53fcc47fdab5ca94038b48fc/disability-and-poverty1.jpg)