Embed Size (px)
Citation preview
DISASTER-RELATED DISPLACEMENT RISK: MEASURING THE RISK AND ADDRESSING ITS DRIVERS
REPORTThis report was written by Justin Ginnetti based on research and analysis co-produced by Chris Lavell and Travis Franck
DISASTERS CLIMATE CHANGE AND
DISPLACEMENT EVIDENCE FOR ACTION
NRC NORWEGIANREFUGEE COUNCIL

ACKNOWLEDGEMENTS
This report was written by Justin Ginnetti (Senior Advisor, Research Methodologies and Evidence, Internal Displacement Monitoring Centre) based on research and analysis co-produced by Chris Lavell (independent consultant) and Travis Franck (Program Director at Climate Interactive).
IDMC is grateful for insights and comments on drafts provided by: Allan Lavell (FLACSO), Nina Birkeland and Lena Brenn (NRC), Hannah Entwisle Chapuisat (Nansen Initiative Secretariat) and Alexandra Bilak and Michelle Yonetani (IDMC). IDMC would also like to thank the dozens of people who commented on the drafts of the five sub-regional reports that served as the foundation for this study.
Thanks to Tim Morris for editorial assistance.
Published by the Internal Displacement Monitoring Centre, Norwegian Refugee Council Chemin de Balexert 7-9 CH-1219 Châtelaine (Geneva) Switzerland
Tel: +41 22 799 0700 / Fax: +41 22 799 0701 www.internal-displacement.org
This publication was printed on paper from sustainably managed forests.
This publication has been produced with the assistance of the European Union. The contents of this publication are the sole responsibility of the Internal Displacement Monitoring Centre and should in no way be taken to reflect the views of the EU.
The European Union is made up of 27 Member States who have decided to gradually link together their know-how, resources and destinies. Together, during a period of enlargement of 50 years, they have built a zone of stability, democracy and sustainable development whilst maintaining cultural diversity, tolerance and individual freedoms. The European Union is committed to sharing its achievements and its values with countries and peoples beyond its borders.
Federal Department of Foreign A�airs FDFA
The project is funded by the European Union with the support of Norway and Switzerland
NRC NORWEGIANREFUGEE COUNCIL

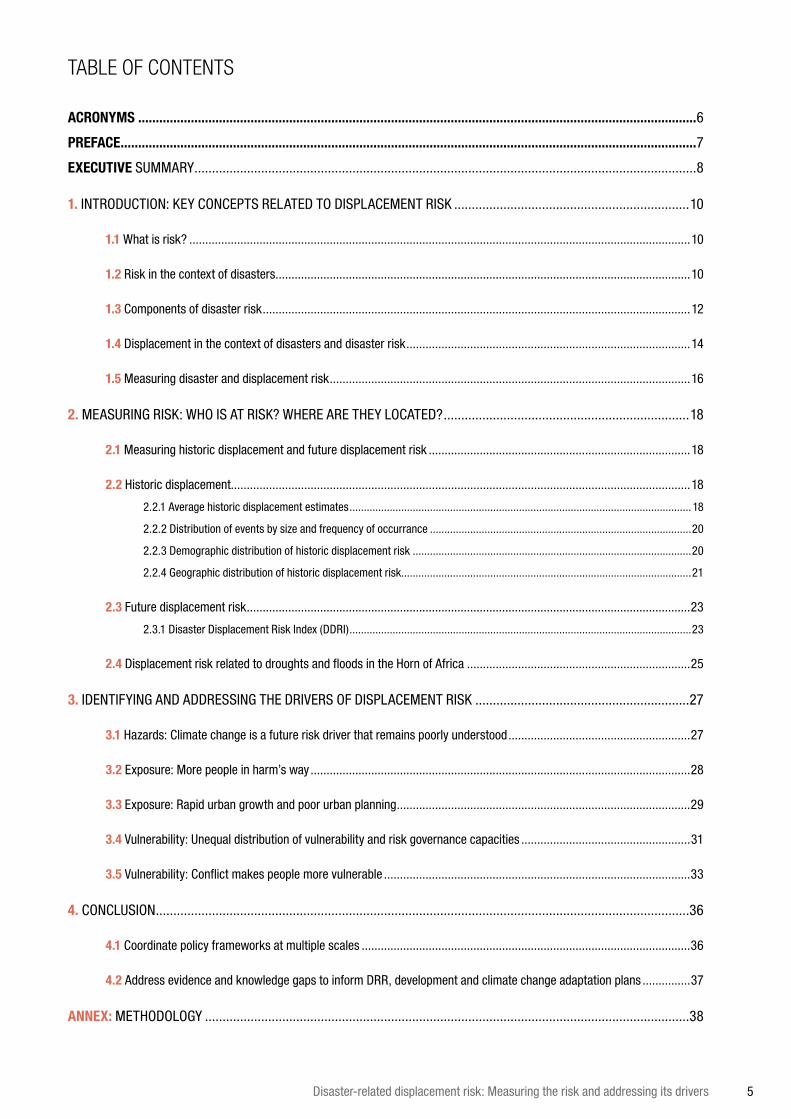
TABLE OF CONTENTS
ACRONYMS ...............................................................................................................................................................6
PREFACE ....................................................................................................................................................................7
EXECUTIVE SUMMARY ...............................................................................................................................................8
1. INTRODUCTION: KEY CONCEPTS RELATED TO DISPLACEMENT RISK ...................................................................10
1.1 What is risk? .............................................................................................................................................................10
1.2 Risk in the context of disasters ..................................................................................................................................10
1.3 Components of disaster risk ......................................................................................................................................12
1.4 Displacement in the context of disasters and disaster risk .........................................................................................14
1.5 Measuring disaster and displacement risk .................................................................................................................16
2. MEASURING RISK: WHO IS AT RISK? WHERE ARE THEY LOCATED? ......................................................................18
2.1 Measuring historic displacement and future displacement risk ..................................................................................18
2.2 Historic displacement................................................................................................................................................18
2.2.1 Average historic displacement estimates ....................................................................................................................... 18
2.2.2 Distribution of events by size and frequency of occurrance ...........................................................................................20
2.2.3 Demographic distribution of historic displacement risk .................................................................................................20
2.2.4 Geographic distribution of historic displacement risk.....................................................................................................21
2.3 Future displacement risk ...........................................................................................................................................23
2.3.1 Disaster Displacement Risk Index (DDRI) .......................................................................................................................23
2.4 Displacement risk related to droughts and floods in the Horn of Africa ......................................................................25
3. IDENTIFYING AND ADDRESSING THE DRIVERS OF DISPLACEMENT RISK .............................................................27
3.1 Hazards: Climate change is a future risk driver that remains poorly understood .........................................................27
3.2 Exposure: More people in harm’s way .......................................................................................................................28
3.3 Exposure: Rapid urban growth and poor urban planning ............................................................................................29
3.4 Vulnerability: Unequal distribution of vulnerability and risk governance capacities .....................................................31
3.5 Vulnerability: Conflict makes people more vulnerable ................................................................................................33
4. CONCLUSION ........................................................................................................................................................36
4.1 Coordinate policy frameworks at multiple scales .......................................................................................................36
4.2 Address evidence and knowledge gaps to inform DRR, development and climate change adaptation plans ...............37
ANNEX: METHODOLOGY ..........................................................................................................................................38
Disaster-related displacement risk: Measuring the risk and addressing its drivers 5
ACRONYMS
AAL Average Annual Loss
CAPRA Probabilistic Risk Assessment Initiative (of ERN-AL)
CCA Climate Change Adaptation
CRED Centre for Research on the Epidemiology of Disasters
DARA Development Assistance Research Associates
DESINVENTAR Disaster Inventory Management System
DiDD Disaster-induced Displacement Database (of IDMC)
DDRI Disaster Displacement Risk Index (of IDMC)
DRM Disaster Risk Management
DRR Disaster Risk Reduction
EM-DAT Emergency Events Database (of CRED)
ERN-AL Evaluación de Riesgos Naturales–América Latina
GAR Global Assessment Report (of UNISDR)
GFDRR Global Facility for Disaster Reduction and Recovery
GRID Global Resource Information Database (of UNEP)
HFA Hyogo Framework for Action
ICCRR Indicator of Conditions and Capacities for Risk Reduction
IDNDR International Decade of Natural Disaster Reduction
IDMC Internal Displacement Monitoring Centre
IPCC Intergovernmental Panel on Climate Change
IRR Indicator of Conditions and Capacities for Risk Reduction (of DARA)
PML Probable Maximum Loss
PREVIEW UNEP/GRID Project for Risk Evaluation, Information and Early Warning (Commonly known as ‘Global Risk Data Platform’)
UNEP United Nations Environment Programme
UNISDR United Nations Office for Disaster Risk Reduction (formerly the International Strategy for Disaster Reduction)
UN OCHA United Nations Office for the Coordination of Humanitarian Affairs
WCDRR World Conference on Disaster Risk Reduction
6 REPORT
PREFACE
From 14 – 18 March 2015, United Nations’ Member States will meet in Sendai, Japan, to finalise a new global agreement to reduce disaster risks. This World Conference on Disaster Risk Reduction (WCDRR) will start four years and four days after the Great Tōhoku Earthquake and Tsunami ravaged this densely inhabited coastal prefecture and triggered one of the largest nuclear disasters in history.
The WCDRR marks the second occasion in which the world’s governments will have met in Japan on the anniversary of a major disaster to adopt a plan to reduce disaster risks. In 2005, ten years after the Kobe Earthquake, they convened in Kobe, Hyogo Prefecture, where they agreed to the Hyogo Framework for Action (HFA) 2005-2015: Building the Resil-ience of Nations and Communities to Disasters.
The HFA did not address the risk of being displaced by a disaster, nor did it outline specific measures to reduce this risk or to improve the disaster response for those who had been displaced. Since the HFA was adopted, this risk has been more widely recognised and there is now an increased will to address it. During the preparatory process leading up to the WCDRR, the UN, governments, researchers and civil society organisations have all stressed the need to consider disaster-related displacement in the HFA’s successor agreement.
The purpose of this report is to consolidate the best available evidence about disaster-related displacement risk, includ-ing its magnitude and its drivers. It builds upon data and findings from IDMC’s Global Estimates reports as well as five regional analyses of displacement risk which were produced in support of the Nansen Initiative – a state-led process that brings together representatives from governments, international organisations, civil society, think tanks and other key actors to develop a protection agenda for people displaced across state borders by disasters and the effects of climate change.
Looking beyond the WCDRR in March, this report is aimed at a broad array of stakeholders that will consider the issue of disaster- and climate change-induced displacement in different policy forums later in 2015. These include the United Nations Framework Convention on Climate Change, the Sustainable Development Goals, the Nansen Initiative’s global consultation as well as the preparation for the World Humanitarian Summit in 2016.
Disaster-related displacement risk: Measuring the risk and addressing its drivers 7
EXECUTIVE SUMMARY
This report applies the concept of risk to disaster-related displacement and quantifies human displacement risk around the world. It brings together data from several sources – notably the Global Assessment Reports (GARs), international and national disaster loss databases (EM-DAT and DesInventar) and the Internal Displacement Mon-itoring Centre’s (IDMC) Global Estimates and Disaster-induced Displacement Database (DiDD).
Applying the concept of risk to disasters and displacement
This study reflects an awareness of the need to see disasters as primarily social, rather than natural, phenomena. This view acknowledges the fact that humans can act and take decisions to reduce the likelihood of a disaster occurring or, at the very least, to reduce their impacts and the levels of loss and damage associated with them. Disasters are thus no longer being perceived as ‘natural’ or ‘acts of God’ but instead as something over which humans exert influence and can therefore prevent.
This reconceptualisation of disasters signifies a shift from a retrospective, post-disaster approach to an anticipatory way of thinking about and confronting disasters. This conceptual development was reflected in a public policy ob-jective: disaster risk reduction (DRR). Strengthening DRR became a global priority in the 1990s, the United Nations’ International Decade of Natural Disaster Reduction. Following the 2004 Indian Ocean Tsunami, UN Member States adopted the 2005 Hyogo Framework for Action (HFA), a ten-year plan endorsed by the UN General Assembly which aims to reduce the risk of disasters globally. The objectives codified in the HFA will be renewed at a global conference in March 2015 in Sendai, Japan, at which Member States will reaffirm their commitment to DRR. One important out-come of the HFA process is awareness that without the ability to measure disaster risk it is not possible to know if it has been reduced.
In the context of disasters, displacement includes all forced population movements resulting from the immediate threat or actual impacts of a disaster situation regardless of the length of time displaced, distance moved from place of origin and subsequent patterns of movement, including back in the place of origin or re-settlement elsewhere. Based upon existing information, and notwithstanding some notable exceptions, the vast majority of people displaced by disasters are assumed to remain within their country of residence, rather than to cross internationally recognised borders to find refuge.
Displacement is a disaster impact that is determined by the underlying vulnerability of people who are exposed to shocks or stresses. It is this combination of vulnerability and exposure to hazards that compels them to leave their homes and livelihoods just to survive. While this report focuses on the human displacement component of disasters, this is a somewhat artificial distinction – the displacement is one of several factors that combined to transform a hazard event into a disaster.
Key findings
Displacement risk trends:
• Disaster-related displacement risk has quadrupled since the 1970s.
• Displacement risk has increased at twice the rate of population growth, meaning that people are twice as likely to be displaced now than they were in the 1970s.
• The number of mega-events that displace more than 3 million people has been increasing. These mega-events are responsible for the overall increase in displacement risk.
• In absolute terms, countries in Asia have the highest risk of being displaced. This is due to the fact that there are a large number of vulnerable people in Asia exposed to multiple natural hazards.
• When population size is accounted for small island states face disproportionately high levels of displacement risk, with Antigua and Barbuda, Haiti and Cuba being among the twenty most at-risk countries.
• Approximately 30 per cent of the pastoralists in northern Kenya, southern Ethiopia and south-central Somalia are at risk of becoming permanently displaced from their way of life between now and 2040, even if climate change does not make droughts more frequent or severe.
8 REPORT
Displacement risk drivers:
• Displacement risk is measured in the following way: Risk = Hazard x Exposure x Vulnerability. The quadrupling of risk since the 1970s is due to the fact that exposure has increased much more quickly than vulnerability has been reduced whereas the occurrence of hazards has remained largely unchanged.
• Climate change may increase displacement risk in the future in at least two ways: first, by increasing the frequency and intensity of some weather-related hazards; and second by increasing certain communities’ vulnerability and reducing thresholds at which point people become displaced.
• The primary driver of increased in exposure since the 1970s has been rapid, unplanned development in hazard-prone areas in developing countries. This rapid urbanisation concentrates large numbers of vulnerable people in dangerous locations.
• Weak or corrupt governance structures can further exacerbate this dangerous process by creating incentives for peo-ple to move into hazard-prone areas – or forcing them to live there.
• Conflict and generalised violence affects several of the most at-risk countries, further increasing the vulnerability of communities, undermining their ability to resist and cope with natural hazards.
The way forward:
• A disaster is not defined by the number of fatalities, the amount of economic losses or the number of people dis-placed. It is all of these things – and other impacts – together.
• The drivers of disaster-related displacement risk in particular are the same as the drivers of disaster risk in gener-al. Thus most measures taken to reduce disaster risk – such as the adoption and enforcement of land use plans and stronger building codes, diversifying and strengthening the livelihoods of the rural and urban poor – will also reduce displacement risk.
• As the world’s governments convene in 2015 and 2016 to agree on global disaster risk reduction, climate change ad-aptation and sustainable development goals, they have a unique opportunity to address displacement risk and several other objectives simultaneously.
• Coordinated and coherent international policy agreements and plans between these different forums are critical for addressing displacement risk. Otherwise, governments risk artificially splintering one problem into multiple concep-tual, operational and policy silos.
Disaster-related displacement risk: Measuring the risk and addressing its drivers 9
1. INTRODUCTION: KEY CONCEPTS RELATED TO DISPLACEMENT RISK
1.1 WHAT IS RISK?
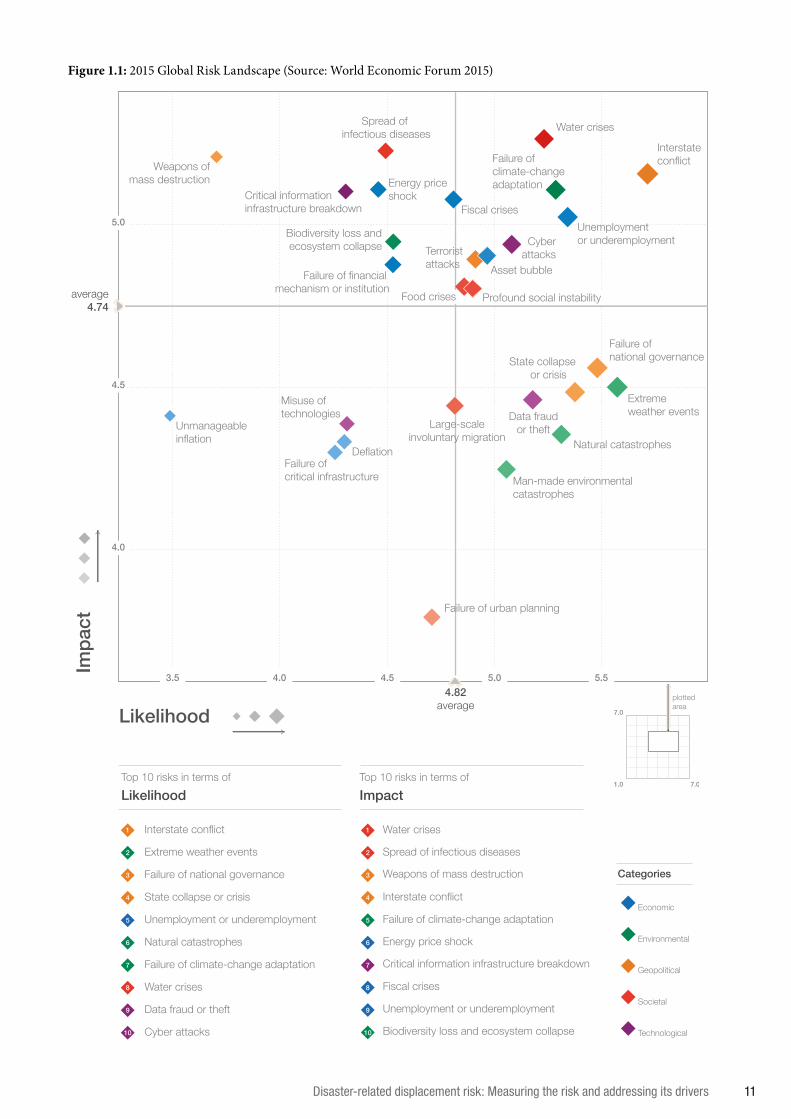
In 2014 alone, the word risk appeared in global head-lines in relation to public health issues (epidemics, side effects of medication), environmental concerns (species extinction, loss of biodiversity), national security (ter-rorist attacks, nuclear proliferation, breakdown of cease-fire agreements) and potential political, economic and financial crises (exchange rates, sovereign debt default, European Union membership). These are but a few of dozens of different contexts in which the word risk was used. For example, ahead of the World Economic Forum (WEF) in Davos in January 2015, the WEF published the tenth edition of its annual Global Risks report. It exam-ines 28 risks across five different categories (economic, environmental, geopolitical, societal and technological) (Figure 1.1).1
What is common to each is the possibility that some-thing undesirable may occur at some point in the future. Inherent to the concept of risk are two important features:
1 the likelihood or probability that something will occur; and
2 the anticipatory focus of thought and attention on the future.
If one’s home has just been destroyed in an earthquake, that risk has already been realised. The goal, therefore, is to take stock of these risks and to then mitigate them or, when that is not possible, to prepare for them.
The examples above demonstrate that risks are an inevitable part of life. Some of them cannot be avoided: foreign currency exchange rates fluctuate, but the use of currency itself is unavoidable. For policymakers, it is
crucial to know which risks can be effectively reduced and which cannot. Risks they cannot or do not have the means to reduce must be managed through contingency plans or transferred via mechanisms such as insurance.
1.2 RISK IN THE CONTEXT OF DISASTERS
The concept of risk has been applied to disasters for centuries. In 1598, the Netherlands established the Chamber of Insurance and Average which by 1603 had ruled on approximately 89 cases.2 Merchants such as the Dutch East India Company soon adopted an approach of risk reduction and risk management to address poten-tial losses due to piracy or bad weather or shipwrecks. Merchants reduced risks associated with piracy by equipping ships with guns and sailing in convoy. They managed weather-related and navigational risks by split-ting assets among different vessels; and they transferred risks by insuring their vessels and cargo against losses.3 Even if Dutch merchants and insurers regarded a storm at sea as an ‘act of God’ they, nevertheless, recognised that it was in their power to do something about it.
The 1755 Lisbon Earthquake (and its associated tsu-nami) provoked an intellectual debate that informed both the European Enlightenment in general as well as Europeans’ understanding of disasters in particular. The Lisbon Earthquake has been referred to as the first ‘modern’ disaster due to the fact that Voltaire’s and Rousseau’s analyses of it emphasised natural and social – rather than supernatural – causes.4
Two decades later, Diderot and Adam Smith similarly attributed at least some of the blame for the 1769 – 1770 Bengal famine, which killed an estimated ten million
1 World Economic Forum, 2015, Global Risks 2015 (http://goo.gl/tplpP4), Geneva, Switzerland.2 Go, S. 2009. Marine Insurance in the Netherlands 1600-1870: A Comparative Institutional Approach. Amsterdam University Press.3 Ibid.4 Dynes, R.R. 2000. “The Dialogue between Voltaire and Rousseau on the Lisbon Earthquake: The Emergence of a Social Science View.”
International Journal of Mass Emergencies and Disasters 18 (1), pp.97–115.
10 REPORT
4.54.03.5 5.0 5.5
4.0
4.5
5.0
4.82average
average 4.74
Likelihood
Impa
ct
Top 10 risks in terms of Likelihood
Categories
Interstate conflict
Extreme weather events
Failure of national governance
State collapse or crisis
Unemployment or underemployment
Natural catastrophes
Failure of climate-change adaptation
Water crises
Data fraud or theft
Cyber attacks
Top 10 risks in terms of Impact
Water crises
Weapons of mass destruction
Interstate conflict
Energy price shock
Failure of climate-change adaptation
Fiscal crises
Unemployment or underemployment
Biodiversity loss and ecosystem collapse
Spread of infectious diseases
Critical information infrastructure breakdown
1
2
3
4
5
6
7
8
9
10
1
2
3
4
5
6
7
8
9
10
7.0
1.0 7.0
plottedarea
Economic
Geopolitical
Environmental
Societal
Technological
Misuse oftechnologies Data fraud
or theft
Cyberattacks
Critical informationinfrastructure breakdown
Water crisesSpread of infectious diseases
Profound social instability
Large-scaleinvoluntary migration
Food crises
Failure of urban planning
Weapons ofmass destruction
Terrorist attacks
State collapseor crisis
Interstateconflict
Failure of national governance
Natural catastrophes
Man-made environmental catastrophes
Failure of climate-change adaptation
Biodiversity loss andecosystem collapse
Unmanageableinflation
Unemploymentor underemployment
Fiscal crises
Failure ofcritical infrastructure
Energy price shock
Deflation
Asset bubble
Extreme weather events
Failure of financial mechanism or institution
Figure 1.1: 2015 Global Risk Landscape (Source: World Economic Forum 2015)
Disaster-related displacement risk: Measuring the risk and addressing its drivers 11
Indians,5 to the mismanagement of the situation by the British colonial authorities.6
The drought in Bengal, a few years ago, might probably have occasioned a very great dearth. Some improper regulations, some injudicious restraints imposed by the servants of the East India Company upon the rice trade, contributed, perhaps, to turn that dearth into a famine.7
By 1868, the idea that human decisions influenced the outcome of the Bengal famine disaster was widely accepted, including by W.W. Hunter, the colonial Indian civil servant and historian of India:
The question as to who was responsible for their death, is the first idea that suggests itself to an Englishman of the present day. . . . The loss of life was accepted as a natural and logical consequence of the loss of the crop. [A]n Englishman reading that tragical story at the pres-ent day cannot rest content with this [explanation].8
In Hunter’s view the famine was the result of a failure to believe and respond to warnings of impending crop fail-ures and to adequately respond once the crops did fail.
It took centuries for governments to adopt the European Enlightenment’s view of disasters. Under the League of Nations, the International Union for the Relief of Disasters, focused on disaster response and espoused a pre-Enlightenment view of disasters, “class[ing]” events such as “earthquakes, eruptions, floods, cyclones, tidal waves, famines & conflagrations . . . as ‘Acts of God.’”9
The reorientation from disaster response to disaster pre-vention and preparedness did not come about until the 1990s, when the UN launched the International Decade of Natural Disaster Reduction (IDNDR). In 2005 the Hyogo Framework for Action (HFA) declared an am-bition by 2015 to achieve “the substantial reduction of disaster losses, in lives and in the social, economic and environmental assets of communities and countries.”10
The HFA focuses on disaster risk reduction (DRR) since it would be impossible to prevent all future disasters from occurring. By 2015, the aim of reducing future disaster impacts through DRR has been enshrined in national laws and policies, and incorporated in other policy areas such as the United Nations Framework Convention on Climate Change and the Sustainable De-velopment Goals. DRR is often indistinguishable from climate change adaptation (CCA): both aim to mini-mise the impacts of weather-related hazards on future generations.
1.3 COMPONENTS OF DISASTER RISK
“Noteverywindstorm,earth-tremor,orrushofwaterisacatastrophe....Solongastheshipridesoutthestorm,solongasthecityresiststheearth-shocks,solongastheleveeshold,thereisnodisaster.”11
L.J. Carr
Political support for the IDNDR, as well as the HFA, was supported by evidence that revealed how economic de-velopment policies, urbanisation patterns, poverty, weak governance and environmental degradation influence disaster outcomes. The IDNDR and the HFA consolidat-ed this wide body of research into a conceptual model of disaster risk (Figure 1.2).
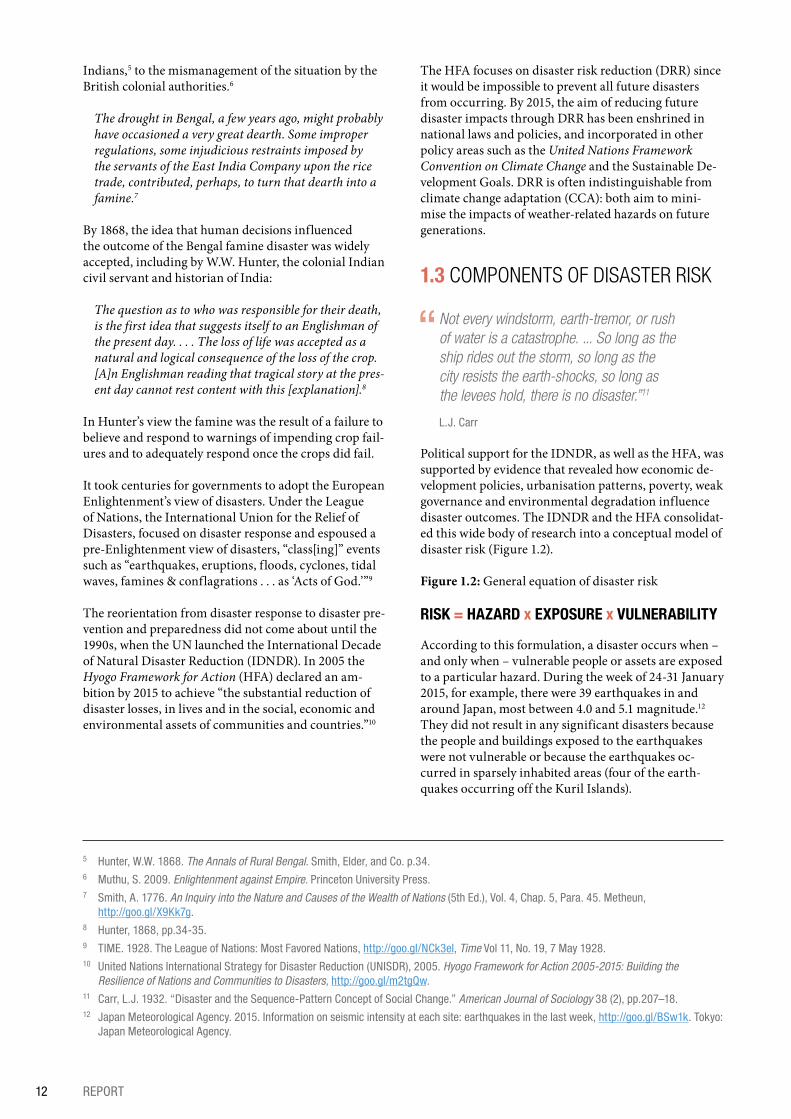
Figure 1.2: General equation of disaster risk
RISK = HAZARD x EXPOSURE x VULNERABILITY
According to this formulation, a disaster occurs when – and only when – vulnerable people or assets are exposed to a particular hazard. During the week of 24-31 January 2015, for example, there were 39 earthquakes in and around Japan, most between 4.0 and 5.1 magnitude.12 They did not result in any significant disasters because the people and buildings exposed to the earthquakes were not vulnerable or because the earthquakes oc-curred in sparsely inhabited areas (four of the earth-quakes occurring off the Kuril Islands).
5 Hunter, W.W. 1868. The Annals of Rural Bengal. Smith, Elder, and Co. p.34.6 Muthu, S. 2009. Enlightenment against Empire. Princeton University Press.7 Smith, A. 1776. An Inquiry into the Nature and Causes of the Wealth of Nations (5th Ed.), Vol. 4, Chap. 5, Para. 45. Metheun,
http://goo.gl/X9Kk7g.8 Hunter, 1868, pp.34-35.9 TIME. 1928. The League of Nations: Most Favored Nations, http://goo.gl/NCk3el, Time Vol 11, No. 19, 7 May 1928.10 United Nations International Strategy for Disaster Reduction (UNISDR), 2005. Hyogo Framework for Action 2005-2015: Building the
Resilience of Nations and Communities to Disasters, http://goo.gl/m2tgQw. 11 Carr, L.J. 1932. “Disaster and the Sequence-Pattern Concept of Social Change.” American Journal of Sociology 38 (2), pp.207–18.12 Japan Meteorological Agency. 2015. Information on seismic intensity at each site: earthquakes in the last week, http://goo.gl/BSw1k. Tokyo:
Japan Meteorological Agency.
12 REPORT
In terms of how disasters are understood, one paradigm shift occurred when European Enlightenment thinkers reframed disasters as a mixture of natural hazards and human factors. Another occurred during the twentieth century when researchers detected a human influence on all three elements of disaster risk, including the behaviour of ‘natural’ hazards.
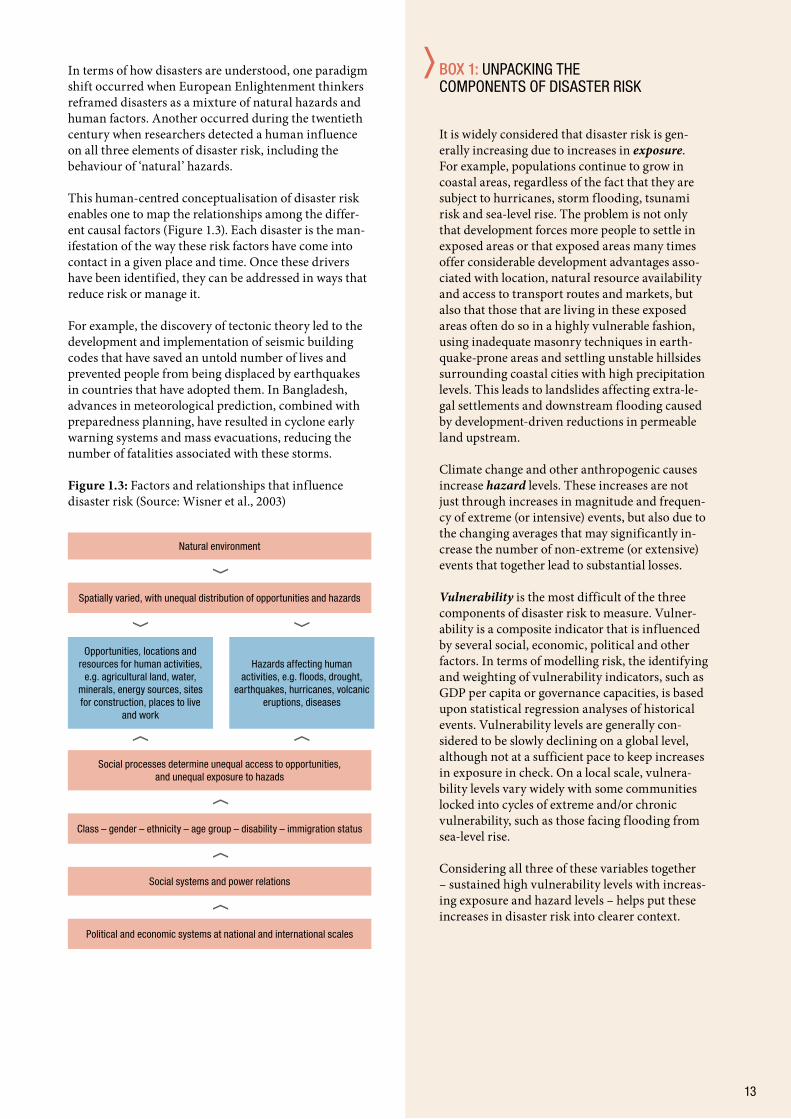
This human-centred conceptualisation of disaster risk enables one to map the relationships among the differ-ent causal factors (Figure 1.3). Each disaster is the man-ifestation of the way these risk factors have come into contact in a given place and time. Once these drivers have been identified, they can be addressed in ways that reduce risk or manage it.
For example, the discovery of tectonic theory led to the development and implementation of seismic building codes that have saved an untold number of lives and prevented people from being displaced by earthquakes in countries that have adopted them. In Bangladesh, advances in meteorological prediction, combined with preparedness planning, have resulted in cyclone early warning systems and mass evacuations, reducing the number of fatalities associated with these storms.
Figure 1.3: Factors and relationships that influence disaster risk (Source: Wisner et al., 2003)
BOX 1: UNPACKING THE COMPONENTS OF DISASTER RISK
It is widely considered that disaster risk is gen-erally increasing due to increases in exposure. For example, populations continue to grow in coastal areas, regardless of the fact that they are subject to hurricanes, storm flooding, tsunami risk and sea-level rise. The problem is not only that development forces more people to settle in exposed areas or that exposed areas many times offer considerable development advantages asso-ciated with location, natural resource availability and access to transport routes and markets, but also that those that are living in these exposed areas often do so in a highly vulnerable fashion, using inadequate masonry techniques in earth-quake-prone areas and settling unstable hillsides surrounding coastal cities with high precipitation levels. This leads to landslides affecting extra-le-gal settlements and downstream flooding caused by development-driven reductions in permeable land upstream.
Climate change and other anthropogenic causes increase hazard levels. These increases are not just through increases in magnitude and frequen-cy of extreme (or intensive) events, but also due to the changing averages that may significantly in-crease the number of non-extreme (or extensive) events that together lead to substantial losses.
Vulnerability is the most difficult of the three components of disaster risk to measure. Vulner-ability is a composite indicator that is influenced by several social, economic, political and other factors. In terms of modelling risk, the identifying and weighting of vulnerability indicators, such as GDP per capita or governance capacities, is based upon statistical regression analyses of historical events. Vulnerability levels are generally con-sidered to be slowly declining on a global level, although not at a sufficient pace to keep increases in exposure in check. On a local scale, vulnera-bility levels vary widely with some communities locked into cycles of extreme and/or chronic vulnerability, such as those facing flooding from sea-level rise.
Considering all three of these variables together – sustained high vulnerability levels with increas-ing exposure and hazard levels – helps put these increases in disaster risk into clearer context.
Natural environment
Spatially varied, with unequal distribution of opportunities and hazards
Opportunities, locations and resources for human activities,
e.g. agricultural land, water, minerals, energy sources, sites for construction, places to live
and work
Hazards affecting human activities, e.g. floods, drought,
earthquakes, hurricanes, volcanic eruptions, diseases
Social processes determine unequal access to opportunities, and unequal exposure to hazads
Class – gender – ethnicity – age group – disability – immigration status
Social systems and power relations
Political and economic systems at national and international scales
13
1.4 DISPLACEMENT IN THE CONTEXT OF DISASTERS AND DISASTER RISK
“Socialchangeindisasteriscatastrophe,plusculturalcollapse,plusreorganization–itisnooneofthesealone,butallofthemtogether.”
L.J. Carr14
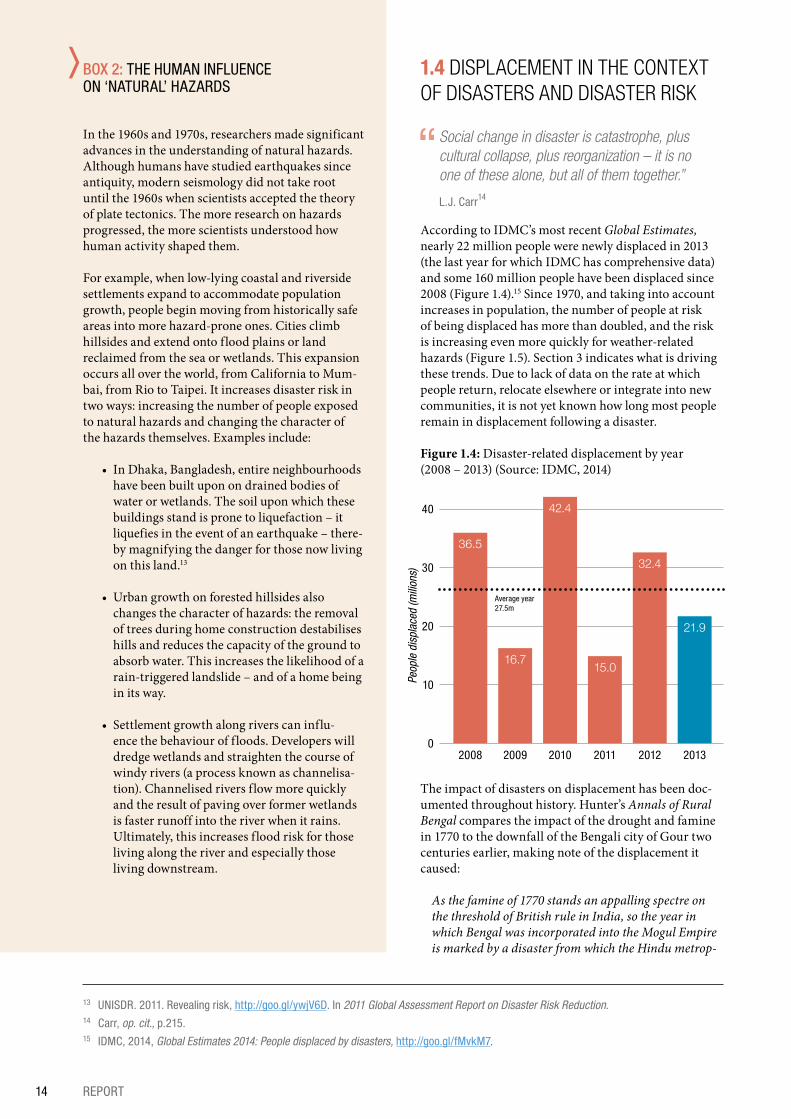
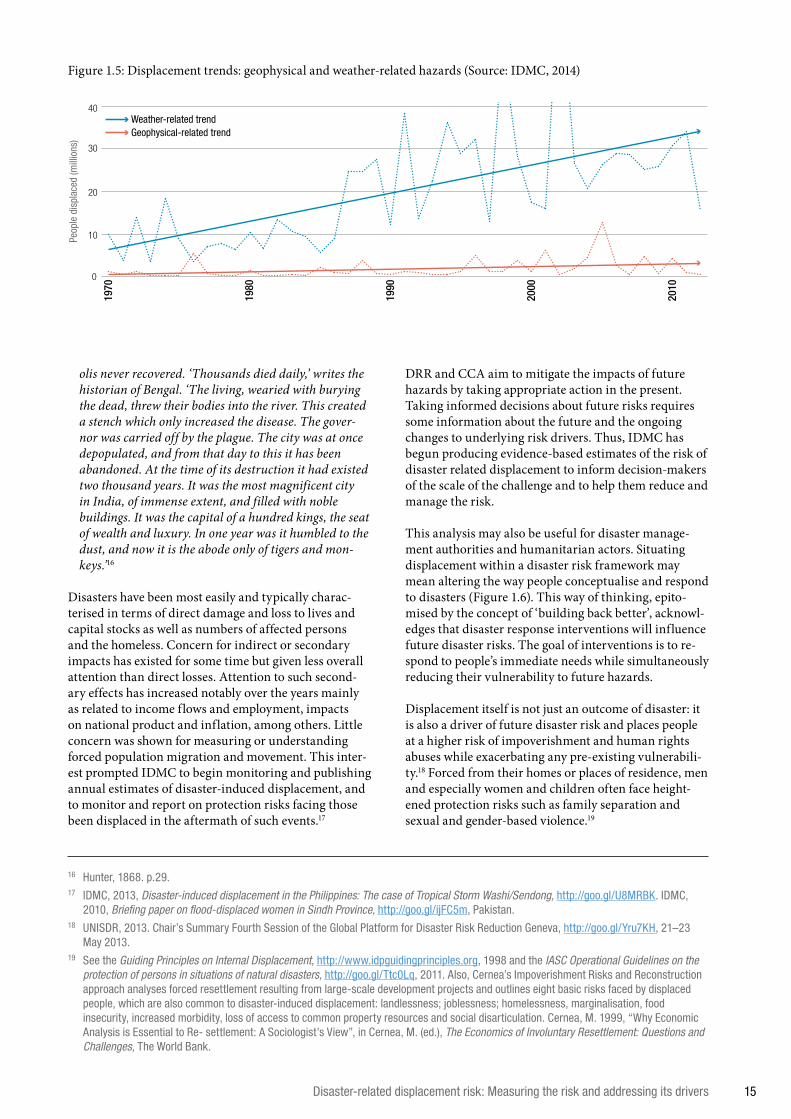
According to IDMC’s most recent Global Estimates, nearly 22 million people were newly displaced in 2013 (the last year for which IDMC has comprehensive data) and some 160 million people have been displaced since 2008 (Figure 1.4).15 Since 1970, and taking into account increases in population, the number of people at risk of being displaced has more than doubled, and the risk is increasing even more quickly for weather-related hazards (Figure 1.5). Section 3 indicates what is driving these trends. Due to lack of data on the rate at which people return, relocate elsewhere or integrate into new communities, it is not yet known how long most people remain in displacement following a disaster.
Figure 1.4: Disaster-related displacement by year (2008 – 2013) (Source: IDMC, 2014)
BOX 2: THE HUMAN INFLUENCE ON ‘NATURAL’ HAZARDS
In the 1960s and 1970s, researchers made significant advances in the understanding of natural hazards. Although humans have studied earthquakes since antiquity, modern seismology did not take root until the 1960s when scientists accepted the theory of plate tectonics. The more research on hazards progressed, the more scientists understood how human activity shaped them.
For example, when low-lying coastal and riverside settlements expand to accommodate population growth, people begin moving from historically safe areas into more hazard-prone ones. Cities climb hillsides and extend onto flood plains or land reclaimed from the sea or wetlands. This expansion occurs all over the world, from California to Mum-bai, from Rio to Taipei. It increases disaster risk in two ways: increasing the number of people exposed to natural hazards and changing the character of the hazards themselves. Examples include:
• In Dhaka, Bangladesh, entire neighbourhoods have been built upon on drained bodies of water or wetlands. The soil upon which these buildings stand is prone to liquefaction – it liquefies in the event of an earthquake – there-by magnifying the danger for those now living on this land.13
• Urban growth on forested hillsides also changes the character of hazards: the removal of trees during home construction destabilises hills and reduces the capacity of the ground to absorb water. This increases the likelihood of a rain-triggered landslide – and of a home being in its way.
• Settlement growth along rivers can influ-ence the behaviour of floods. Developers will dredge wetlands and straighten the course of windy rivers (a process known as channelisa-tion). Channelised rivers flow more quickly and the result of paving over former wetlands is faster runoff into the river when it rains. Ultimately, this increases flood risk for those living along the river and especially those living downstream.
0
10
20
30
40
2008
36.5
2009
16.7
2010
42.4
2011
15.0
2012
32.4
2013
21.9
Average year 27.5m
Peop
le d
ispl
aced
(mili
ons)
13 UNISDR. 2011. Revealing risk, http://goo.gl/ywjV6D. In 2011 Global Assessment Report on Disaster Risk Reduction. 14 Carr, op. cit., p.215.15 IDMC, 2014, Global Estimates 2014: People displaced by disasters, http://goo.gl/fMvkM7.
The impact of disasters on displacement has been doc-umented throughout history. Hunter’s Annals of Rural Bengal compares the impact of the drought and famine in 1770 to the downfall of the Bengali city of Gour two centuries earlier, making note of the displacement it caused:
As the famine of 1770 stands an appalling spectre on the threshold of British rule in India, so the year in which Bengal was incorporated into the Mogul Empire is marked by a disaster from which the Hindu metrop-
14 REPORT
olis never recovered. ‘Thousands died daily,’ writes the historian of Bengal. ‘The living, wearied with burying the dead, threw their bodies into the river. This created a stench which only increased the disease. The gover-nor was carried off by the plague. The city was at once depopulated, and from that day to this it has been abandoned. At the time of its destruction it had existed two thousand years. It was the most magnificent city in India, of immense extent, and filled with noble buildings. It was the capital of a hundred kings, the seat of wealth and luxury. In one year was it humbled to the dust, and now it is the abode only of tigers and mon-keys.’16
Disasters have been most easily and typically charac-terised in terms of direct damage and loss to lives and capital stocks as well as numbers of affected persons and the homeless. Concern for indirect or secondary impacts has existed for some time but given less overall attention than direct losses. Attention to such second-ary effects has increased notably over the years mainly as related to income flows and employment, impacts on national product and inflation, among others. Little concern was shown for measuring or understanding forced population migration and movement. This inter-est prompted IDMC to begin monitoring and publishing annual estimates of disaster-induced displacement, and to monitor and report on protection risks facing those been displaced in the aftermath of such events.17
DRR and CCA aim to mitigate the impacts of future hazards by taking appropriate action in the present. Taking informed decisions about future risks requires some information about the future and the ongoing changes to underlying risk drivers. Thus, IDMC has begun producing evidence-based estimates of the risk of disaster related displacement to inform decision-makers of the scale of the challenge and to help them reduce and manage the risk.
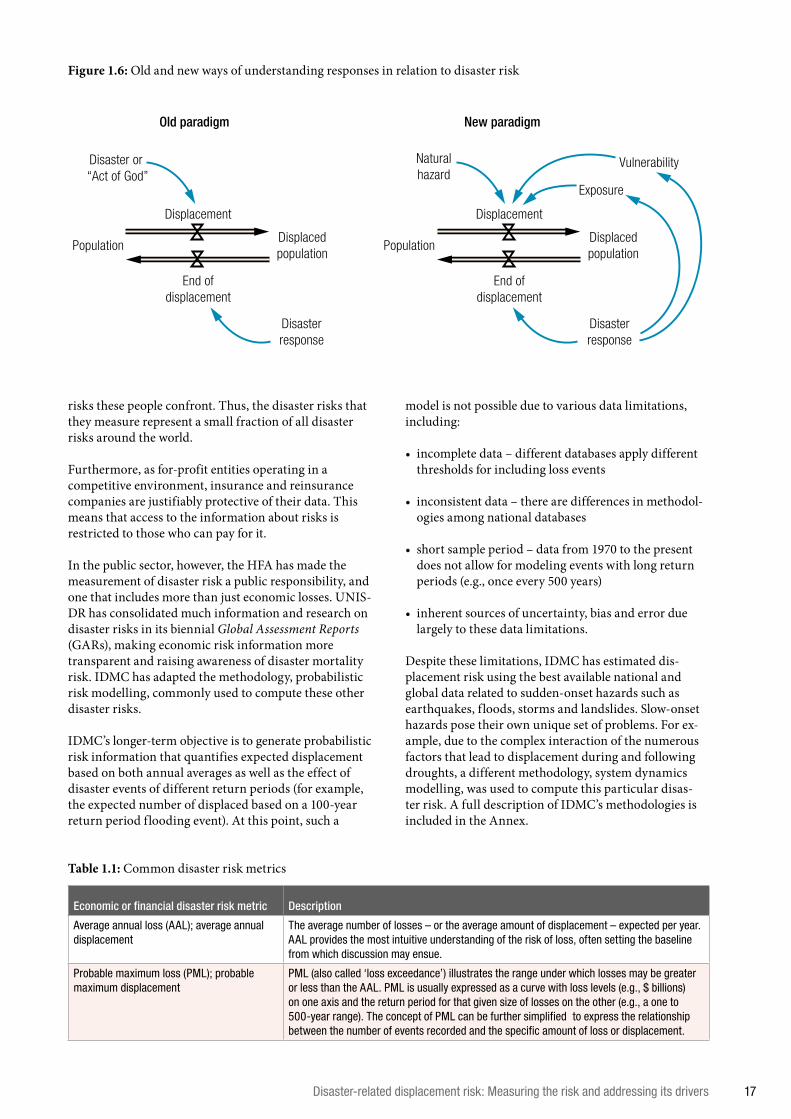
This analysis may also be useful for disaster manage-ment authorities and humanitarian actors. Situating displacement within a disaster risk framework may mean altering the way people conceptualise and respond to disasters (Figure 1.6). This way of thinking, epito-mised by the concept of ‘building back better’, acknowl-edges that disaster response interventions will influence future disaster risks. The goal of interventions is to re-spond to people’s immediate needs while simultaneously reducing their vulnerability to future hazards.
Displacement itself is not just an outcome of disaster: it is also a driver of future disaster risk and places people at a higher risk of impoverishment and human rights abuses while exacerbating any pre-existing vulnerabili-ty.18 Forced from their homes or places of residence, men and especially women and children often face height-ened protection risks such as family separation and sexual and gender-based violence.19
0
10
20
30
4019
70
1980
1990
2000
2010
Geophysical-related trendWeather-related trend
Peop
le d
ispl
aced
(mill
ions
)
16 Hunter, 1868. p.29.17 IDMC, 2013, Disaster-induced displacement in the Philippines: The case of Tropical Storm Washi/Sendong, http://goo.gl/U8MRBK. IDMC,
2010, Briefing paper on flood-displaced women in Sindh Province, http://goo.gl/ijFC5m, Pakistan. 18 UNISDR, 2013. Chair’s Summary Fourth Session of the Global Platform for Disaster Risk Reduction Geneva, http://goo.gl/Yru7KH, 21–23
May 2013. 19 See the Guiding Principles on Internal Displacement, http://www.idpguidingprinciples.org, 1998 and the IASC Operational Guidelines on the
protection of persons in situations of natural disasters, http://goo.gl/Ttc0Lq, 2011. Also, Cernea’s Impoverishment Risks and Reconstruction approach analyses forced resettlement resulting from large-scale development projects and outlines eight basic risks faced by displaced people, which are also common to disaster-induced displacement: landlessness; joblessness; homelessness, marginalisation, food insecurity, increased morbidity, loss of access to common property resources and social disarticulation. Cernea, M. 1999, “Why Economic Analysis is Essential to Re- settlement: A Sociologist’s View”, in Cernea, M. (ed.), The Economics of Involuntary Resettlement: Questions and Challenges, The World Bank.
Figure 1.5: Displacement trends: geophysical and weather-related hazards (Source: IDMC, 2014)
Disaster-related displacement risk: Measuring the risk and addressing its drivers 15
1.5 MEASURING DISASTER AND DISPLACEMENT RISK
“Accesstoinformationiscriticaltosuccess-fuldisasterriskmanagement.Youcannotmanagewhatyoucannotmeasure.”24
Margareta Wahlström, Special Representative of the Secretary-General for Disaster Risk Reduction
In this era of innovation, ‘big data’ and it is easy to find evidence and examples of human and economic devel-opment, such as GDP growth, longer life expectancies and rapid diffusion of new technologies, even to the poor. However, the potentially negative consequences of these development processes, such as increased disaster risk, are seldom acknowledged or measured. In order to measure disaster risk (be it displacement, economic loss or mortality), one needs relatively complete information about past events and a credible means of projecting this information into the future.
[T]wo different conceptions of logic become necessary – one for the facts or things that have happened, and one for the events that are likely to happen in the future. Thus, the historiographic logic of facts has to be supplemented with a logic of probability.25
Measuring disaster risk (especially the risk of economic losses) is the core business of insurance and reinsurance companies. What risks are measured and to whom this information is available, is limited. To generate profit and recoup the cost of expensive risk models, insurers target potential customers who can afford the insurance premiums. Knowing that poorer people and commu-nities are unlikely to be able to afford the premiums, insurance companies have less incentive to measure the
BOX 3: KEY TERMS
Climate change is a change in the climate that can be identified (e.g., by using statistical tests) by changes in the mean and/or the variability of its properties and that persists for an extended period, typically decades or longer. Climate change may be due to natural internal processes or external pres-sures, or to persistent anthropogenic changes in the composition of the atmosphere or in land use.20
Disaster is “a serious disruption of the functioning of a community or a society causing widespread human, material, economic or environmental losses which exceed the ability of the affected commu-nity or society to cope using its own resources.”21 Disasters result from a combination of risk factors: the exposure of people and critical assets to single or multiple hazards, together with existing conditions of vulnerability, including insufficient capacity or measures to reduce or cope with potential negative consequences.
Disaster risk is normally expressed as the proba-bility of an outcome (e.g., the loss of life, injury or destroyed or damaged capital stock) resulting from the occurrence of a damaging physical event during a given period of time. In this study, the disaster outcome in question is displacement. Disaster risk is considered to be a function of hazard, exposure and vulnerability.
The United Nations’ Guiding Principles on Inter-nal Displacement observes that displacement may occur as a result of, or in order to avoid the effects of, disasters.22 Displacement includes all forced movements regardless of length of time displaced, distance moved from place of origin and subsequent patterns of movement, including back to place of origin or re-settlement elsewhere. This definition also encompasses anticipatory evacuations.
Exposure refers to the location and number of peo-ple, critical infrastructure, homes and other assets in hazard-prone areas.
‘Natural’ hazards are events or conditions originat-ing in the natural environment that may affect peo-ple and critical assets located in exposed areas. The character of these hazards is often strongly influ-enced by human actions, including urban develop-ment, deforestation, dam-building, release of flood waters and high carbon emissions that contribute to long-term changes in the global climate. Thus, their causes are often less than ‘natural’.
Vulnerability is the propensity or predisposition to be adversely affected by a hazard.23
20 Adapted from Intergovernmental Panel on Climate Change (IPCC), 2012. Managing the Risks of Extreme Events and disasters to Advance Climate Change Adaptation, Special Report of the Intergovernmental Panel on Climate Change, http://goo.gl/DDXAg, Cambridge University Press, p.557.
21 UNISDR, 2009, UNISDR Terminology on Disaster Risk Reduction, http://goo.gl/JD7HHz.
22 United Nations, 1998, Guiding Principles on Internal Displacement, http://goo.gl/vBd9dr.
23 Intergovernmental Panel on Climate Change (IPCC), 2012, Glossary of terms. In Managing the Risks of Extreme Events and Disasters to Advance Climate Change Adaptation, http://goo.gl/WszLzM, A Special Report of Working Groups I and II of the IPCC, pp.555-564.
24 UNISDR, 2012, Governments must recognize their stock of risk - MDG Report, http://www.unisdr.org/archive/28569.
25 Dombrowsky, W.R. 1995. “Again and Again: Is a Disaster What We Call ‘Disaster’?: Some Conceptual Notes on Conceptualizing the Object of Disaster Sociology”, http://www.ijmed.org/articles/325/. International Journal of Mass Emergencies and Disasters 13 (3), pp.241–54.
16 REPORT
risks these people confront. Thus, the disaster risks that they measure represent a small fraction of all disaster risks around the world.
Furthermore, as for-profit entities operating in a competitive environment, insurance and reinsurance companies are justifiably protective of their data. This means that access to the information about risks is restricted to those who can pay for it.
In the public sector, however, the HFA has made the measurement of disaster risk a public responsibility, and one that includes more than just economic losses. UNIS-DR has consolidated much information and research on disaster risks in its biennial Global Assessment Reports (GARs), making economic risk information more transparent and raising awareness of disaster mortality risk. IDMC has adapted the methodology, probabilistic risk modelling, commonly used to compute these other disaster risks.
IDMC’s longer-term objective is to generate probabilistic risk information that quantifies expected displacement based on both annual averages as well as the effect of disaster events of different return periods (for example, the expected number of displaced based on a 100-year return period flooding event). At this point, such a
model is not possible due to various data limitations, including:
• incomplete data – different databases apply different thresholds for including loss events
• inconsistent data – there are differences in methodol-ogies among national databases
• short sample period – data from 1970 to the present does not allow for modeling events with long return periods (e.g., once every 500 years)
• inherent sources of uncertainty, bias and error due largely to these data limitations.
Despite these limitations, IDMC has estimated dis-placement risk using the best available national and global data related to sudden-onset hazards such as earthquakes, floods, storms and landslides. Slow-onset hazards pose their own unique set of problems. For ex-ample, due to the complex interaction of the numerous factors that lead to displacement during and following droughts, a different methodology, system dynamics modelling, was used to compute this particular disas-ter risk. A full description of IDMC’s methodologies is included in the Annex.
Figure 1.6: Old and new ways of understanding responses in relation to disaster risk
Disaster or “Act of God”
PopulationDisplacedpopulation
Displacedpopulation
Disasterresponse
Displacement
End ofdisplacement
Old paradigm New paradigm
Naturalhazard
Vulnerability
Exposure
Disasterresponse
Population
Displacement
End ofdisplacement
Table 1.1: Common disaster risk metrics
Economic or financial disaster risk metric Description
Average annual loss (AAL); average annual displacement
The average number of losses – or the average amount of displacement – expected per year. AAL provides the most intuitive understanding of the risk of loss, often setting the baseline from which discussion may ensue.
Probable maximum loss (PML); probable maximum displacement
PML (also called ‘loss exceedance’) illustrates the range under which losses may be greater or less than the AAL. PML is usually expressed as a curve with loss levels (e.g., $ billions) on one axis and the return period for that given size of losses on the other (e.g., a one to 500-year range). The concept of PML can be further simplifiedto express the relationship between the number of events recorded and the specific amount of loss or displacement.
Disaster-related displacement risk: Measuring the risk and addressing its drivers 17
2. MEASURING RISK: WHO IS AT RISK? WHERE ARE THEY LOCATED?
2.1 MEASURING HISTORIC DISPLACEMENT AND FUTURE DISPLACEMENT RISK
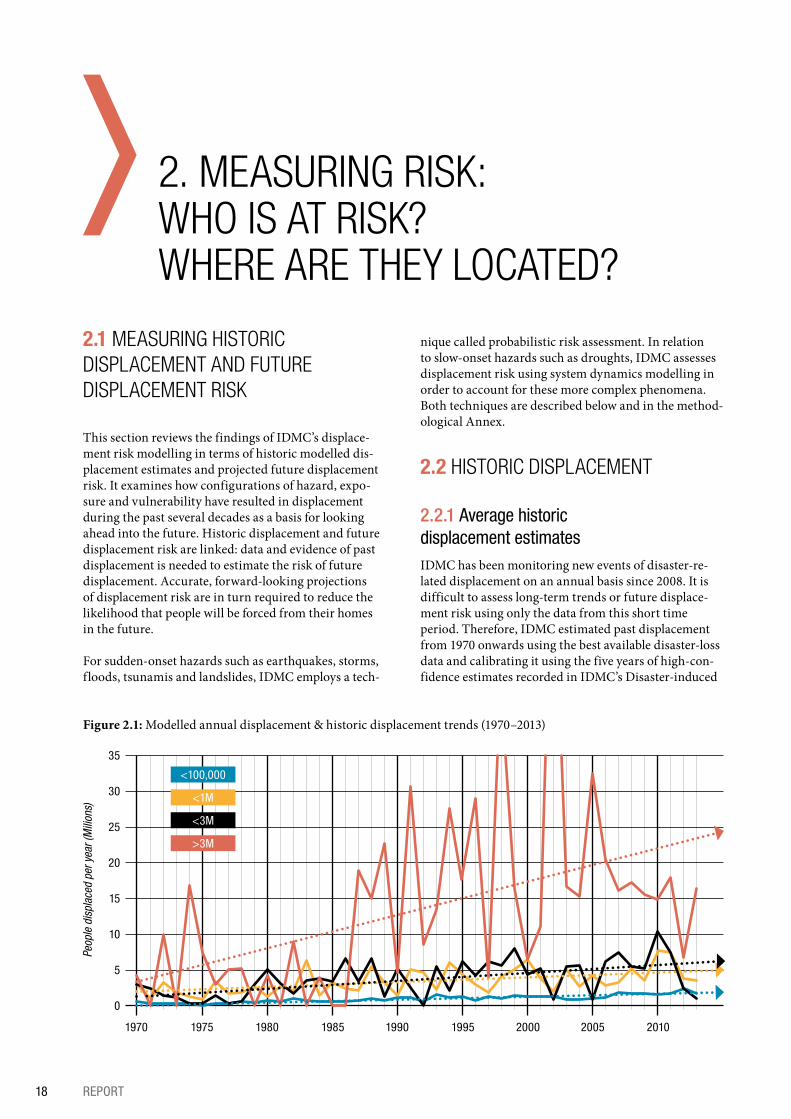
This section reviews the findings of IDMC’s displace-ment risk modelling in terms of historic modelled dis-placement estimates and projected future displacement risk. It examines how configurations of hazard, expo-sure and vulnerability have resulted in displacement during the past several decades as a basis for looking ahead into the future. Historic displacement and future displacement risk are linked: data and evidence of past displacement is needed to estimate the risk of future displacement. Accurate, forward-looking projections of displacement risk are in turn required to reduce the likelihood that people will be forced from their homes in the future.
For sudden-onset hazards such as earthquakes, storms, floods, tsunamis and landslides, IDMC employs a tech-
nique called probabilistic risk assessment. In relation to slow-onset hazards such as droughts, IDMC assesses displacement risk using system dynamics modelling in order to account for these more complex phenomena. Both techniques are described below and in the method-ological Annex.
2.2 HISTORIC DISPLACEMENT
2.2.1 Average historic displacement estimatesIDMC has been monitoring new events of disaster-re-lated displacement on an annual basis since 2008. It is difficult to assess long-term trends or future displace-ment risk using only the data from this short time period. Therefore, IDMC estimated past displacement from 1970 onwards using the best available disaster-loss data and calibrating it using the five years of high-con-fidence estimates recorded in IDMC’s Disaster-induced
Figure 2.1: Modelled annual displacement & historic displacement trends (1970–2013)
0
5
10
15
20
25
30
35
1970 1975 1980 1985 1990 1995 2000 2005 2010
Peop
le d
ispl
aced
per
yea
r (M
ilion
s)
<100,000
<1M
<3M
>3M
18 REPORT
1
2
3
4
5
6
7
8
9
10
Displacement Database (DiDD).26 The result is a model of 44 annual global estimates of disaster-induced dis-placement associated with recorded historical events (Figure 2.1).
IDMC’s historical displacement model indicates that several things:• in absolute terms, annual global displacement figures
(also called ‘realised risk’) have quadrupled over the past four decades
• this increase is mostly driven by the more frequent occurrence of mega-events since the mid-1980s
• the magnitude of displacement varies widely from year to year due to the occurrence of large, very large or mega-events.
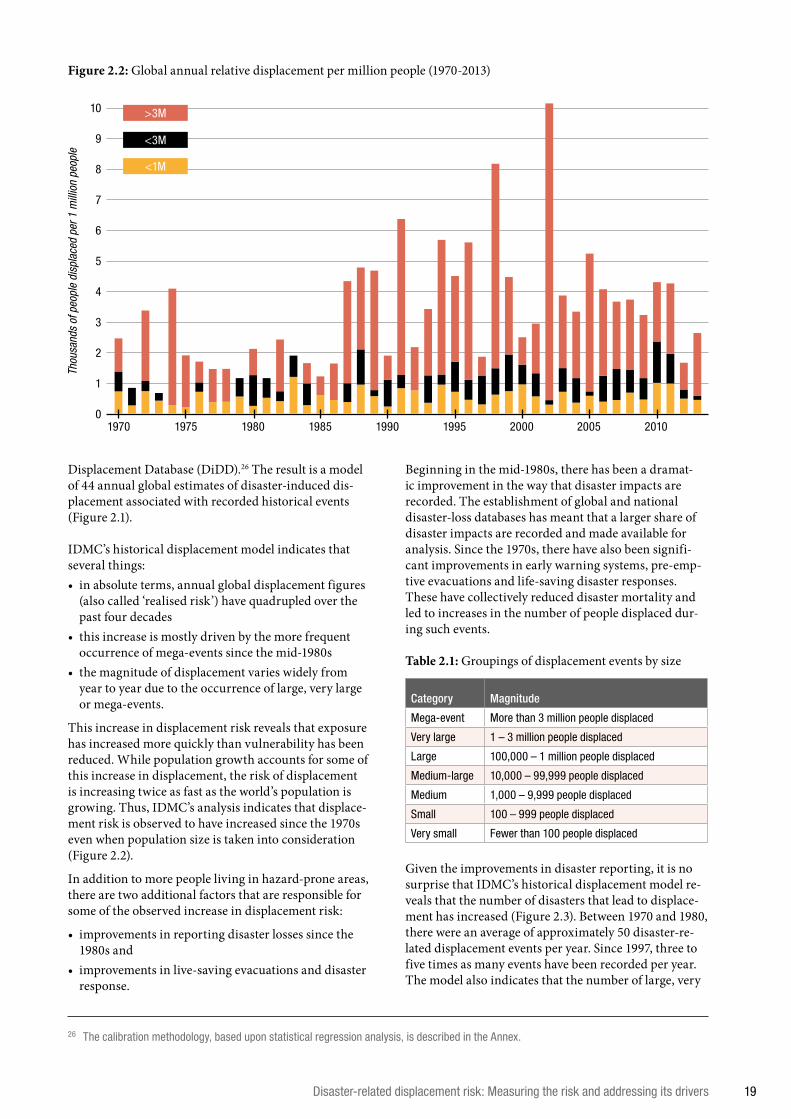
This increase in displacement risk reveals that exposure has increased more quickly than vulnerability has been reduced. While population growth accounts for some of this increase in displacement, the risk of displacement is increasing twice as fast as the world’s population is growing. Thus, IDMC’s analysis indicates that displace-ment risk is observed to have increased since the 1970s even when population size is taken into consideration (Figure 2.2).
In addition to more people living in hazard-prone areas, there are two additional factors that are responsible for some of the observed increase in displacement risk:
• improvements in reporting disaster losses since the 1980s and
• improvements in live-saving evacuations and disaster response.
Beginning in the mid-1980s, there has been a dramat-ic improvement in the way that disaster impacts are recorded. The establishment of global and national disaster-loss databases has meant that a larger share of disaster impacts are recorded and made available for analysis. Since the 1970s, there have also been signifi-cant improvements in early warning systems, pre-emp-tive evacuations and life-saving disaster responses. These have collectively reduced disaster mortality and led to increases in the number of people displaced dur-ing such events.
Table 2.1: Groupings of displacement events by size
Category Magnitude
Mega-event More than 3 million people displaced
Very large 1 – 3 million people displaced
Large 100,000 – 1 million people displaced
Medium-large 10,000 – 99,999 people displaced
Medium 1,000 – 9,999 people displaced
Small 100 – 999 people displaced
Very small Fewer than 100 people displaced
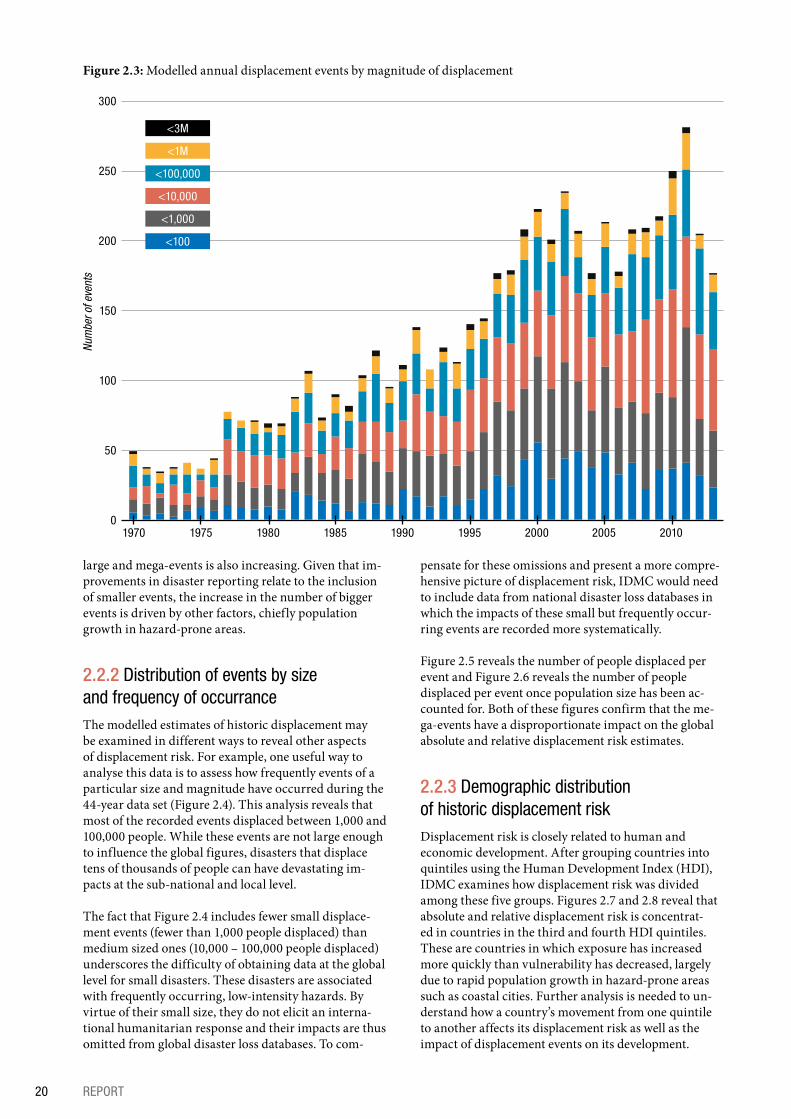
Given the improvements in disaster reporting, it is no surprise that IDMC’s historical displacement model re-veals that the number of disasters that lead to displace-ment has increased (Figure 2.3). Between 1970 and 1980, there were an average of approximately 50 disaster-re-lated displacement events per year. Since 1997, three to five times as many events have been recorded per year. The model also indicates that the number of large, very
Figure 2.2: Global annual relative displacement per million people (1970-2013)
26 The calibration methodology, based upon statistical regression analysis, is described in the Annex.
1970 1975 1980 1985 1990 1995 2000 2005 2010
Thou
sand
s of
peo
ple
disp
lace
d pe
r 1 m
illio
n pe
ople
<1M
<3M
>3M
0
Disaster-related displacement risk: Measuring the risk and addressing its drivers 19
50
100
150
200
250
300
large and mega-events is also increasing. Given that im-provements in disaster reporting relate to the inclusion of smaller events, the increase in the number of bigger events is driven by other factors, chiefly population growth in hazard-prone areas.
2.2.2 Distribution of events by size and frequency of occurranceThe modelled estimates of historic displacement may be examined in different ways to reveal other aspects of displacement risk. For example, one useful way to analyse this data is to assess how frequently events of a particular size and magnitude have occurred during the 44-year data set (Figure 2.4). This analysis reveals that most of the recorded events displaced between 1,000 and 100,000 people. While these events are not large enough to influence the global figures, disasters that displace tens of thousands of people can have devastating im-pacts at the sub-national and local level.
The fact that Figure 2.4 includes fewer small displace-ment events (fewer than 1,000 people displaced) than medium sized ones (10,000 – 100,000 people displaced) underscores the difficulty of obtaining data at the global level for small disasters. These disasters are associated with frequently occurring, low-intensity hazards. By virtue of their small size, they do not elicit an interna-tional humanitarian response and their impacts are thus omitted from global disaster loss databases. To com-
Figure 2.3: Modelled annual displacement events by magnitude of displacement
pensate for these omissions and present a more compre-hensive picture of displacement risk, IDMC would need to include data from national disaster loss databases in which the impacts of these small but frequently occur-ring events are recorded more systematically.
Figure 2.5 reveals the number of people displaced per event and Figure 2.6 reveals the number of people displaced per event once population size has been ac-counted for. Both of these figures confirm that the me-ga-events have a disproportionate impact on the global absolute and relative displacement risk estimates.
2.2.3 Demographic distribution of historic displacement riskDisplacement risk is closely related to human and economic development. After grouping countries into quintiles using the Human Development Index (HDI), IDMC examines how displacement risk was divided among these five groups. Figures 2.7 and 2.8 reveal that absolute and relative displacement risk is concentrat-ed in countries in the third and fourth HDI quintiles. These are countries in which exposure has increased more quickly than vulnerability has decreased, largely due to rapid population growth in hazard-prone areas such as coastal cities. Further analysis is needed to un-derstand how a country’s movement from one quintile to another affects its displacement risk as well as the impact of displacement events on its development.
<100,000
<10,000
<1,000
<100
<1M
<3M
1970 1975 1980 1985 1990 1995 2000 2005 2010
Num
ber o
f eve
nts
0
20 REPORT
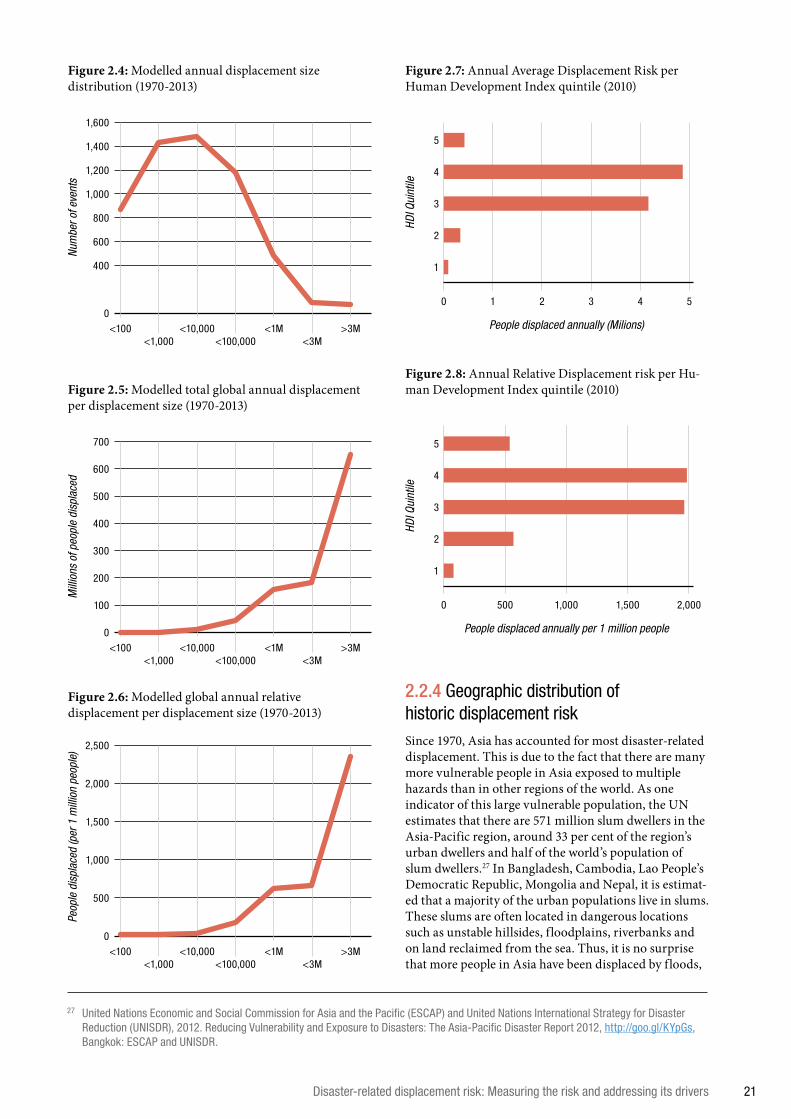
Figure 2.4: Modelled annual displacement size distribution (1970-2013)
Figure 2.8: Annual Relative Displacement risk per Hu-man Development Index quintile (2010)Figure 2.5: Modelled total global annual displacement
per displacement size (1970-2013)
Figure 2.6: Modelled global annual relative displacement per displacement size (1970-2013)
Figure 2.7: Annual Average Displacement Risk per Human Development Index quintile (2010)
2.2.4 Geographic distribution of historic displacement riskSince 1970, Asia has accounted for most disaster-related displacement. This is due to the fact that there are many more vulnerable people in Asia exposed to multiple hazards than in other regions of the world. As one indicator of this large vulnerable population, the UN estimates that there are 571 million slum dwellers in the Asia-Pacific region, around 33 per cent of the region’s urban dwellers and half of the world’s population of slum dwellers.27 In Bangladesh, Cambodia, Lao People’s Democratic Republic, Mongolia and Nepal, it is estimat-ed that a majority of the urban populations live in slums. These slums are often located in dangerous locations such as unstable hillsides, floodplains, riverbanks and on land reclaimed from the sea. Thus, it is no surprise that more people in Asia have been displaced by floods,
27 United Nations Economic and Social Commission for Asia and the Pacific (ESCAP) and United Nations International Strategy for Disaster Reduction (UNISDR), 2012. Reducing Vulnerability and Exposure to Disasters: The Asia-Pacific Disaster Report 2012, http://goo.gl/KYpGs, Bangkok: ESCAP and UNISDR.
Num
ber o
f eve
nts
HDI Q
uint
ileHD
I Qui
ntile
People displaced annually (Milions)
People displaced annually per 1 million people
Mill
ions
of p
eopl
e di
spla
ced
Peop
le d
ispl
aced
(per
1 m
illio
n pe
ople
)
1,600
700
600
500
400
300
200
100
2,500
2,000
1,500
1,000
500
1,400
1,200
1,000
800
600
400
0<100
0
0
1
500
2
1,000
3
1,500
4
2,000
5
<1M<1,000
<10,000 >3M<100,000 <3M
0<100 <1M
<1,000<10,000 >3M
<100,000 <3M
0<100 <1M
<1,000<10,000 >3M
<100,000 <3M
1
1
2
2
3
3
4
4
5
5
Disaster-related displacement risk: Measuring the risk and addressing its drivers 21
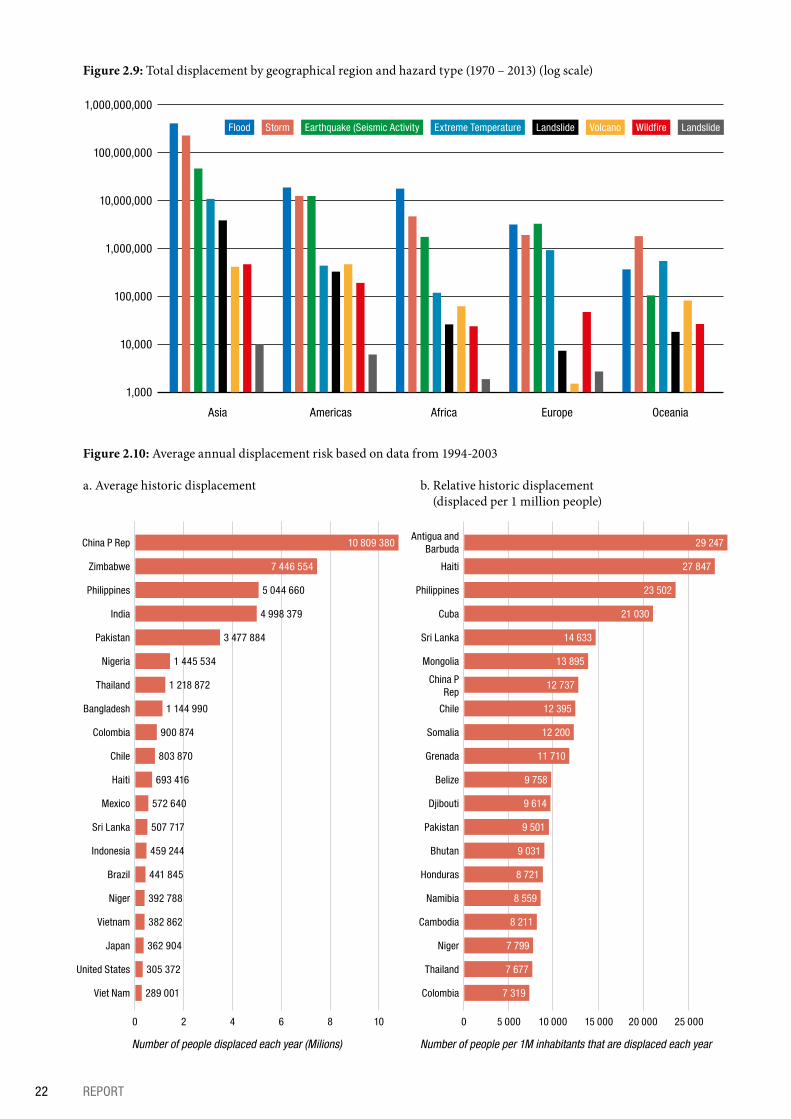
Figure 2.9: Total displacement by geographical region and hazard type (1970 – 2013) (log scale)
Figure 2.10: Average annual displacement risk based on data from 1994-2003
a. Average historic displacement b. Relative historic displacement (displaced per 1 million people)
1,000
10,000
100,000
1,000,000
10,000,000
100,000,000
1,000,000,000
Extreme TemperatureStorm WildfireEarthquake (Seismic Activity LandslideFlood VolcanoLandslide
Asia Americas Africa Europe Oceania
Number of people displaced each year (Milions) Number of people per 1M inhabitants that are displaced each year
0 02 5 0004 10 0006 15 0008 20 00010 25 000
Viet Nam Colombia 7 319289 001
United States Thailand 7 677305 372
Japan Niger 7 799362 904
Vietnam Cambodia 8 211382 862
Niger Namibia 8 559392 788
Brazil Honduras 8 721441 845
Indonesia Bhutan 9 031459 244
Sri Lanka Pakistan 9 501507 717
Mexico Djibouti 9 614572 640
Haiti Belize 9 758693 416
Chile Grenada 11 710803 870
Colombia Somalia 12 200900 874
Bangladesh Chile 12 3951 144 990
Thailand China P Rep
12 7371 218 872
Nigeria Mongolia 13 8951 445 534
Pakistan Sri Lanka 14 6333 477 884
India Cuba 21 0304 998 379
Philippines Philippines 23 5025 044 660
Zimbabwe Haiti7 446 554 27 847
China P RepAntigua and
Barbuda10 809 380 29 247
22 REPORT
storms, earthquakes, extreme temperatures, wet and dry landslides and wildfires (Figure 2.9) than people in any other region. Ten times as many people have been displaced in Asian than in the regions that rank second in terms of the number of people displaced per type of hazard.28
Over the past 20 years, the countries with the highest absolute displacement risk have all been located in Asia. This also reflects the very large exposed and vulnerable populations within the region (Figure 2.10a). When population size is taken into consideration, however, the data tell a slightly different story. Asian countries are still well represented but a number of smaller countries, including small island states, appear on the list (Figure 2.10b).
The relative displacement risk figure estimates under-score the particular vulnerability of small island states in which a large proportion of the country’s population may be exposed to the same hazard. Such states effec-tively concentrate displacement risk due to their size, location and topography. Thus, when a disaster occurs it has the potential to affect most or all of a country. An-tigua and Barbuda, Haiti and Cuba are all small island states with populations regularly exposed to hazards.
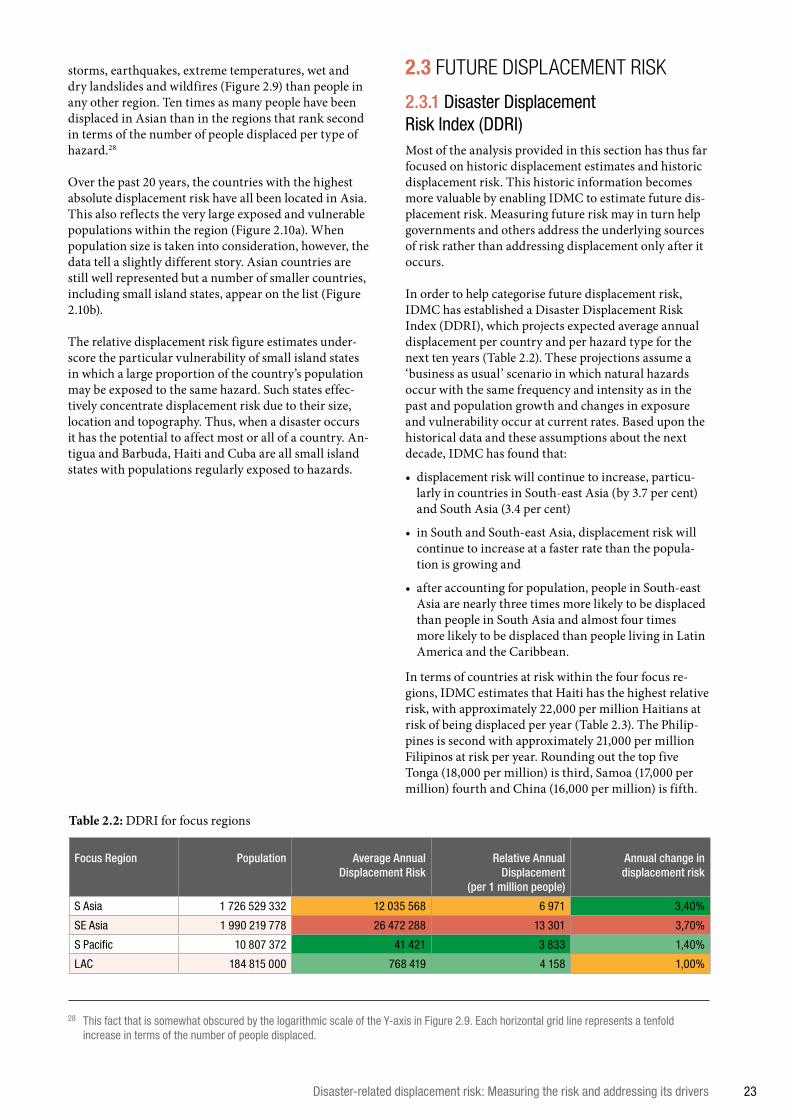
2.3 FUTURE DISPLACEMENT RISK
2.3.1 Disaster Displacement Risk Index (DDRI)Most of the analysis provided in this section has thus far focused on historic displacement estimates and historic displacement risk. This historic information becomes more valuable by enabling IDMC to estimate future dis-placement risk. Measuring future risk may in turn help governments and others address the underlying sources of risk rather than addressing displacement only after it occurs.
In order to help categorise future displacement risk, IDMC has established a Disaster Displacement Risk Index (DDRI), which projects expected average annual displacement per country and per hazard type for the next ten years (Table 2.2). These projections assume a ‘business as usual’ scenario in which natural hazards occur with the same frequency and intensity as in the past and population growth and changes in exposure and vulnerability occur at current rates. Based upon the historical data and these assumptions about the next decade, IDMC has found that:
• displacement risk will continue to increase, particu-larly in countries in South-east Asia (by 3.7 per cent) and South Asia (3.4 per cent)
• in South and South-east Asia, displacement risk will continue to increase at a faster rate than the popula-tion is growing and
• after accounting for population, people in South-east Asia are nearly three times more likely to be displaced than people in South Asia and almost four times more likely to be displaced than people living in Latin America and the Caribbean.
In terms of countries at risk within the four focus re-gions, IDMC estimates that Haiti has the highest relative risk, with approximately 22,000 per million Haitians at risk of being displaced per year (Table 2.3). The Philip-pines is second with approximately 21,000 per million Filipinos at risk per year. Rounding out the top five Tonga (18,000 per million) is third, Samoa (17,000 per million) fourth and China (16,000 per million) is fifth.
Table 2.2: DDRI for focus regions
Focus Region Population Average Annual Displacement Risk
Relative Annual Displacement
(per 1 million people)
Annual change in displacement risk
S Asia 1 726 529 332 12 035 568 6 971 3,40%
SE Asia 1 990 219 778 26 472 288 13 301 3,70%
S Pacific 10 807 372 41 421 3 833 1,40%
LAC 184 815 000 768 419 4 158 1,00%
28 This fact that is somewhat obscured by the logarithmic scale of the Y-axis in Figure 2.9. Each horizontal grid line represents a tenfold increase in terms of the number of people displaced.
Disaster-related displacement risk: Measuring the risk and addressing its drivers 23
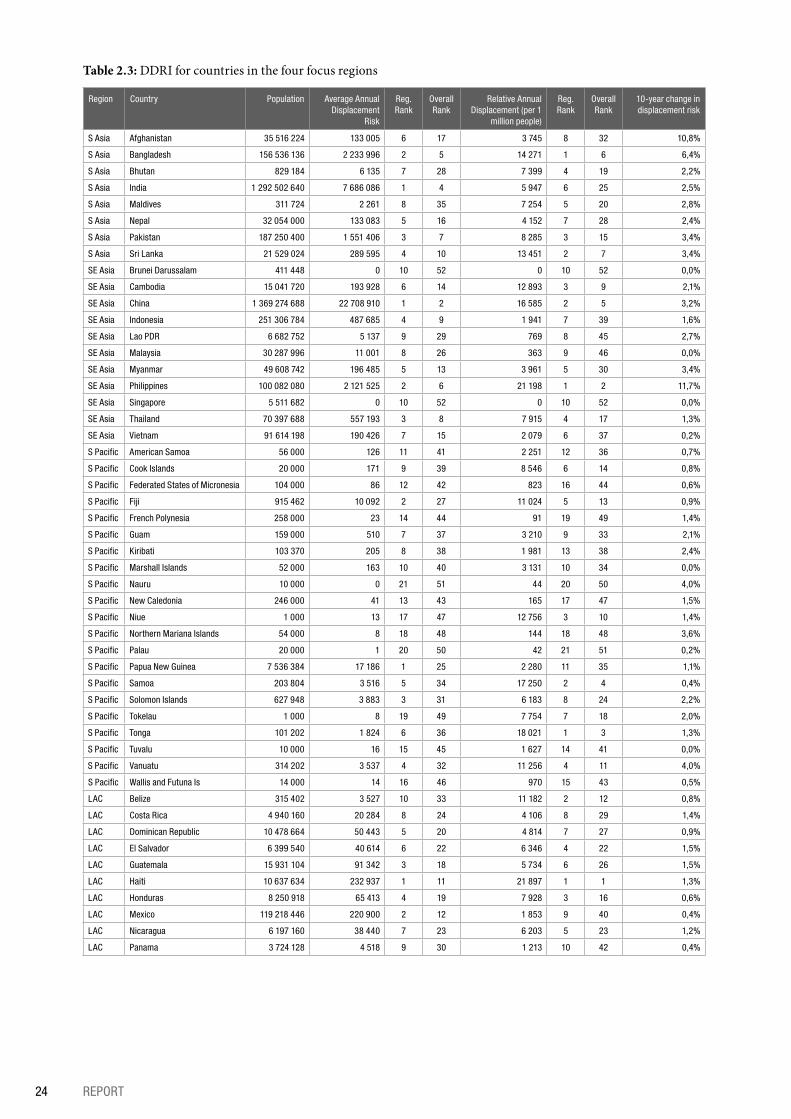
Table 2.3: DDRI for countries in the four focus regions
Region Country Population Average Annual Displacement
Risk
Reg. Rank
Overall Rank
Relative Annual Displacement (per 1
million people)
Reg. Rank
Overall Rank
10-year change in displacement risk
S Asia Afghanistan 35 516 224 133 005 6 17 3 745 8 32 10,8%
S Asia Bangladesh 156 536 136 2 233 996 2 5 14 271 1 6 6,4%
S Asia Bhutan 829 184 6 135 7 28 7 399 4 19 2,2%
S Asia India 1 292 502 640 7 686 086 1 4 5 947 6 25 2,5%
S Asia Maldives 311 724 2 261 8 35 7 254 5 20 2,8%
S Asia Nepal 32 054 000 133 083 5 16 4 152 7 28 2,4%
S Asia Pakistan 187 250 400 1 551 406 3 7 8 285 3 15 3,4%
S Asia Sri Lanka 21 529 024 289 595 4 10 13 451 2 7 3,4%
SE Asia Brunei Darussalam 411 448 0 10 52 0 10 52 0,0%
SE Asia Cambodia 15 041 720 193 928 6 14 12 893 3 9 2,1%
SE Asia China 1 369 274 688 22 708 910 1 2 16 585 2 5 3,2%
SE Asia Indonesia 251 306 784 487 685 4 9 1 941 7 39 1,6%
SE Asia Lao PDR 6 682 752 5 137 9 29 769 8 45 2,7%
SE Asia Malaysia 30 287 996 11 001 8 26 363 9 46 0,0%
SE Asia Myanmar 49 608 742 196 485 5 13 3 961 5 30 3,4%
SE Asia Philippines 100 082 080 2 121 525 2 6 21 198 1 2 11,7%
SE Asia Singapore 5 511 682 0 10 52 0 10 52 0,0%
SE Asia Thailand 70 397 688 557 193 3 8 7 915 4 17 1,3%
SE Asia Vietnam 91 614 198 190 426 7 15 2 079 6 37 0,2%
S Pacific American Samoa 56 000 126 11 41 2 251 12 36 0,7%
S Pacific Cook Islands 20 000 171 9 39 8 546 6 14 0,8%
S Pacific Federated States of Micronesia 104 000 86 12 42 823 16 44 0,6%
S Pacific Fiji 915 462 10 092 2 27 11 024 5 13 0,9%
S Pacific French Polynesia 258 000 23 14 44 91 19 49 1,4%
S Pacific Guam 159 000 510 7 37 3 210 9 33 2,1%
S Pacific Kiribati 103 370 205 8 38 1 981 13 38 2,4%
S Pacific Marshall Islands 52 000 163 10 40 3 131 10 34 0,0%
S Pacific Nauru 10 000 0 21 51 44 20 50 4,0%
S Pacific New Caledonia 246 000 41 13 43 165 17 47 1,5%
S Pacific Niue 1 000 13 17 47 12 756 3 10 1,4%
S Pacific Northern Mariana Islands 54 000 8 18 48 144 18 48 3,6%
S Pacific Palau 20 000 1 20 50 42 21 51 0,2%
S Pacific Papua New Guinea 7 536 384 17 186 1 25 2 280 11 35 1,1%
S Pacific Samoa 203 804 3 516 5 34 17 250 2 4 0,4%
S Pacific Solomon Islands 627 948 3 883 3 31 6 183 8 24 2,2%
S Pacific Tokelau 1 000 8 19 49 7 754 7 18 2,0%
S Pacific Tonga 101 202 1 824 6 36 18 021 1 3 1,3%
S Pacific Tuvalu 10 000 16 15 45 1 627 14 41 0,0%
S Pacific Vanuatu 314 202 3 537 4 32 11 256 4 11 4,0%
S Pacific Wallis and Futuna Is 14 000 14 16 46 970 15 43 0,5%
LAC Belize 315 402 3 527 10 33 11 182 2 12 0,8%
LAC Costa Rica 4 940 160 20 284 8 24 4 106 8 29 1,4%
LAC Dominican Republic 10 478 664 50 443 5 20 4 814 7 27 0,9%
LAC El Salvador 6 399 540 40 614 6 22 6 346 4 22 1,5%
LAC Guatemala 15 931 104 91 342 3 18 5 734 6 26 1,5%
LAC Haiti 10 637 634 232 937 1 11 21 897 1 1 1,3%
LAC Honduras 8 250 918 65 413 4 19 7 928 3 16 0,6%
LAC Mexico 119 218 446 220 900 2 12 1 853 9 40 0,4%
LAC Nicaragua 6 197 160 38 440 7 23 6 203 5 23 1,2%
LAC Panama 3 724 128 4 518 9 30 1 213 10 42 0,4%
24 REPORT
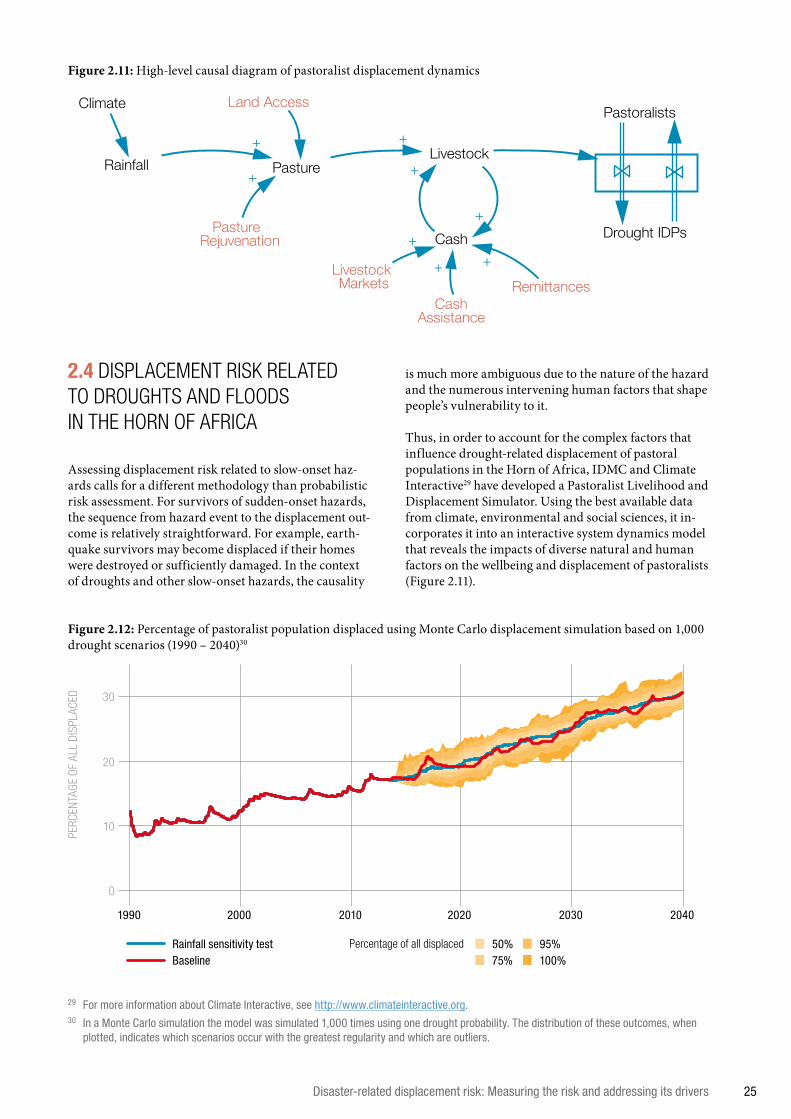
2.4 DISPLACEMENT RISK RELATED TO DROUGHTS AND FLOODS IN THE HORN OF AFRICA
Assessing displacement risk related to slow-onset haz-ards calls for a different methodology than probabilistic risk assessment. For survivors of sudden-onset hazards, the sequence from hazard event to the displacement out-come is relatively straightforward. For example, earth-quake survivors may become displaced if their homes were destroyed or sufficiently damaged. In the context of droughts and other slow-onset hazards, the causality
is much more ambiguous due to the nature of the hazard and the numerous intervening human factors that shape people’s vulnerability to it.
Thus, in order to account for the complex factors that influence drought-related displacement of pastoral populations in the Horn of Africa, IDMC and Climate Interactive29 have developed a Pastoralist Livelihood and Displacement Simulator. Using the best available data from climate, environmental and social sciences, it in-corporates it into an interactive system dynamics model that reveals the impacts of diverse natural and human factors on the wellbeing and displacement of pastoralists (Figure 2.11).
Land Access
PastureLivestock
Pastoralists
Drought IDPsCash
Rainfall
Climate
PastureRejuvenation
CashAssistance
Remittances++
+
+
+
+
+
LivestockMarkets
+
Figure 2.11: High-level causal diagram of pastoralist displacement dynamics
Figure 2.12: Percentage of pastoralist population displaced using Monte Carlo displacement simulation based on 1,000 drought scenarios (1990 – 2040)30
2000 2010 2020 2030 20401990
Rainfall sensitivity testBaseline
50% 95%75% 100%
Percentage of all displaced
PERC
ENTA
GE O
F AL
L DI
SPLA
CED 30
20
10
0
29 For more information about Climate Interactive, see http://www.climateinteractive.org.30 In a Monte Carlo simulation the model was simulated 1,000 times using one drought probability. The distribution of these outcomes, when
plotted, indicates which scenarios occur with the greatest regularity and which are outliers.
Disaster-related displacement risk: Measuring the risk and addressing its drivers 25
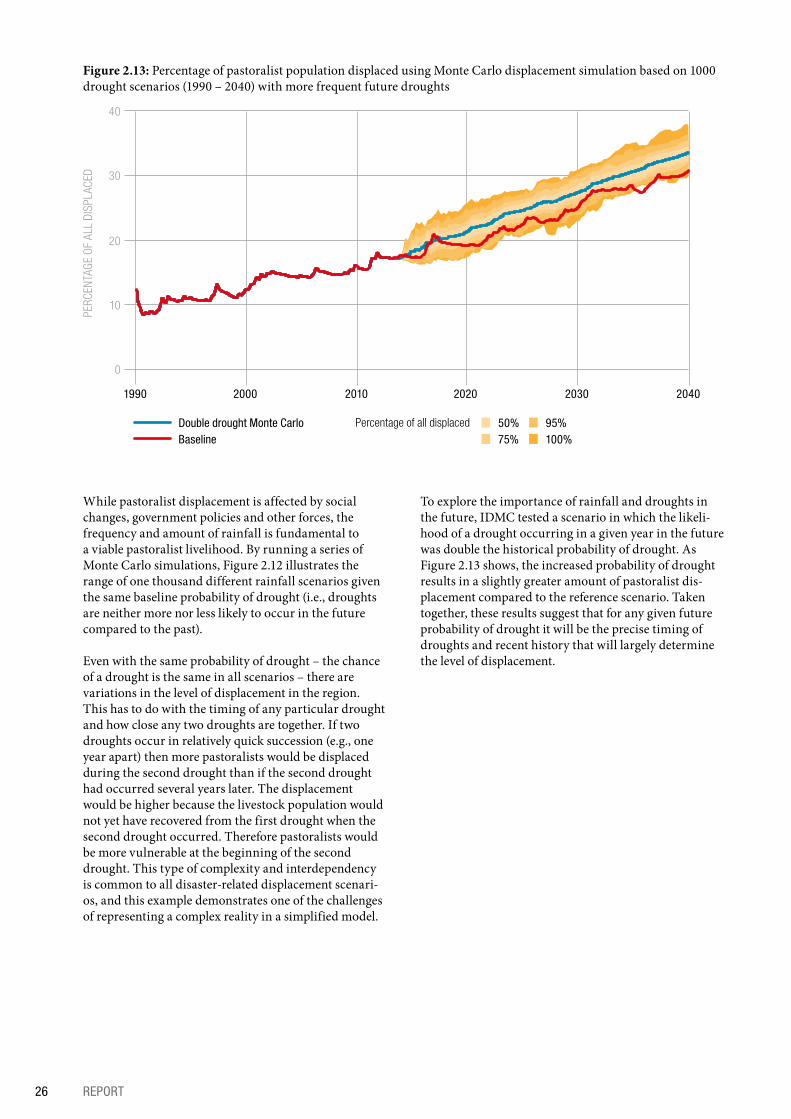
While pastoralist displacement is affected by social changes, government policies and other forces, the frequency and amount of rainfall is fundamental to a viable pastoralist livelihood. By running a series of Monte Carlo simulations, Figure 2.12 illustrates the range of one thousand different rainfall scenarios given the same baseline probability of drought (i.e., droughts are neither more nor less likely to occur in the future compared to the past).
Even with the same probability of drought – the chance of a drought is the same in all scenarios – there are variations in the level of displacement in the region. This has to do with the timing of any particular drought and how close any two droughts are together. If two droughts occur in relatively quick succession (e.g., one year apart) then more pastoralists would be displaced during the second drought than if the second drought had occurred several years later. The displacement would be higher because the livestock population would not yet have recovered from the first drought when the second drought occurred. Therefore pastoralists would be more vulnerable at the beginning of the second drought. This type of complexity and interdependency is common to all disaster-related displacement scenari-os, and this example demonstrates one of the challenges of representing a complex reality in a simplified model.
To explore the importance of rainfall and droughts in the future, IDMC tested a scenario in which the likeli-hood of a drought occurring in a given year in the future was double the historical probability of drought. As Figure 2.13 shows, the increased probability of drought results in a slightly greater amount of pastoralist dis-placement compared to the reference scenario. Taken together, these results suggest that for any given future probability of drought it will be the precise timing of droughts and recent history that will largely determine the level of displacement.
Figure 2.13: Percentage of pastoralist population displaced using Monte Carlo displacement simulation based on 1000 drought scenarios (1990 – 2040) with more frequent future droughts
2000 2010 2020 2030 20401990
Double drought Monte CarloBaseline
50% 95%75% 100%
Percentage of all displaced
40
PERC
ENTA
GE O
F AL
L DI
SPLA
CED 30
20
10
0
26 REPORT
3. IDENTIFYING AND ADDRESSING THE DRIVERS OF DISPLACEMENT RISK
es, migration and displacement could become perma-nent.”31 More recently, the IPCC noted that “[m]ajor ex-treme weather events have in the past led to significant population displacement, and changes in the incidence of extreme events will amplify the challenges and risks of such displacement.”32
As with existing disaster-related displacement risk, urban dwellers face elevated risks associated with the impacts of climate change. Rising sea levels and storm surges, extreme precipitation, inland and coastal flood-ing, landslides, will pose an increased threat to people, their livelihoods and assets, as well as the ecosystems that protect them. Furthermore, “[t]hese risks are am-plified for those who live in informal settlements and in hazardous areas and either lack essential infrastructure and services or where there is inadequate provision for adaptation.”33
Climate change will influence the character of familiar hazards, and it will increase the risk of relatively un-common hazards. Glacial lake outburst floods (GLOFs) are relatively rare phenomena, and outside of the Himalayas and Andes they are typically associated with volcanic eruptions.34 Due to the fact that climate change is increasing the rate at which glaciers are melting, the risk of GLOFS is expected to increase in the future.35 For example, a recent analysis of three of Nepal’s 21 “poten-tially dangerous” glacial lakes found that at least 3,300 people currently reside inside the flood zones (Table 3.1).36
This section of the report examines different risk drivers as they relate to the three principal components of disaster risk – hazard, exposure and vulnerability. Impervious to human actions, natural hazards are typ-ically treated as an exogenous component of risk. This assumes that earthquakes, storms and floods of varying magnitude and intensity will occur at different intervals regardless of human actions, although human-induced climate change has forced researchers to revisit this assumption. The other risk drivers discussed in this section of the report relate to factors that are increasing people’s exposure to hazards and inhibiting efforts to reduce their vulnerability to these hazards.
3.1 HAZARDS: CLIMATE CHANGE IS A FUTURE RISK DRIVER THAT REMAINS POORLY UNDERSTOOD
Climate change has not been a significant driver of displacement to the present. However, it is expected to become increasingly influential in the coming decades. In its special report on disasters and extreme events, the Intergovernmental Panel on Climate Change (IPCC) found that “Disasters associated with climate extremes influence population mobility. . . . If disasters occur more frequently and/or with greater magnitude, some local areas will become increasingly marginal as places to live or in which to maintain livelihoods. In such cas-
31 IPCC, 2012, p.16.32 Adger, W.N., J.M. Pulhin, J. Barnett, G.D. Dabelko, G.K. Hovelsrud, M. Levy, Ú. Oswald Spring, and C.H. Vogel, 2014, Chapter 12: Human
security, http://goo.gl/FzPAQb. In Climate Change 2014: Impacts, Adaptation, and Vulnerability. Part A: Global and Sectoral Aspects. Contribution of Working Group II to the Fifth Assessment Report of the Intergovernmental Panel on Climate Change [Field, C.B., V.R. Barros, D.J. Dokken, K.J. Mach, M.D. Mastrandrea, T.E. Bilir, M. Chatterjee, K.L. Ebi, Y.O. Estrada, R.C. Genova, B. Girma, E.S. Kissel, A.N. Levy, S. MacCracken, P.R. Mastrandrea, and L.L.White (eds.)]. Cambridge, UK and New York, NY: Cambridge University Press, p. 758.
33 Revi, A., D.E. Satterthwaite, F. Aragón-Durand, J. Corfee-Morlot, R.B.R. Kiunsi, M. Pelling, D.C. Roberts, and W. Solecki, 2014. Chapter 8: Urban areas, http://goo.gl/vlHjRC. In Climate Change 2014: Impacts, Adaptation, and Vulnerability. Part A: Global and Sectoral Aspects. Contribution of Working Group II to the Fifth Assessment Report of the Intergovernmental Panel on Climate Change, p. 538.
34 These volcano-induced floods known by their Icelandic name, jökulhlaup.35 Dasgupta, P., J.F. Morton, D. Dodman, B. Karapinar, F. Meza, M.G. Rivera-Ferre, A. Toure Sarr, and K.E. Vincent. 2014: Chapter 9:
Rural areas, http://goo.gl/Q5cHUr. In: Climate Change 2014: Impacts, Adaptation, and Vulnerability. Part A: Global and Sectoral Aspects. Contribution of Working Group II to the Fifth Assessment Report of the Intergovernmental Panel on Climate Change, pp. 623 and 636.
36 International Centre for Integrated Mountain Development (ICIMOD). 2011. Glacial Lakes and Glacial Lake Outburst Floods in Nepal, http://goo.gl/uR1UcM. Kathmandu, Nepal: ICIMOD.
Disaster-related displacement risk: Measuring the risk and addressing its drivers 27
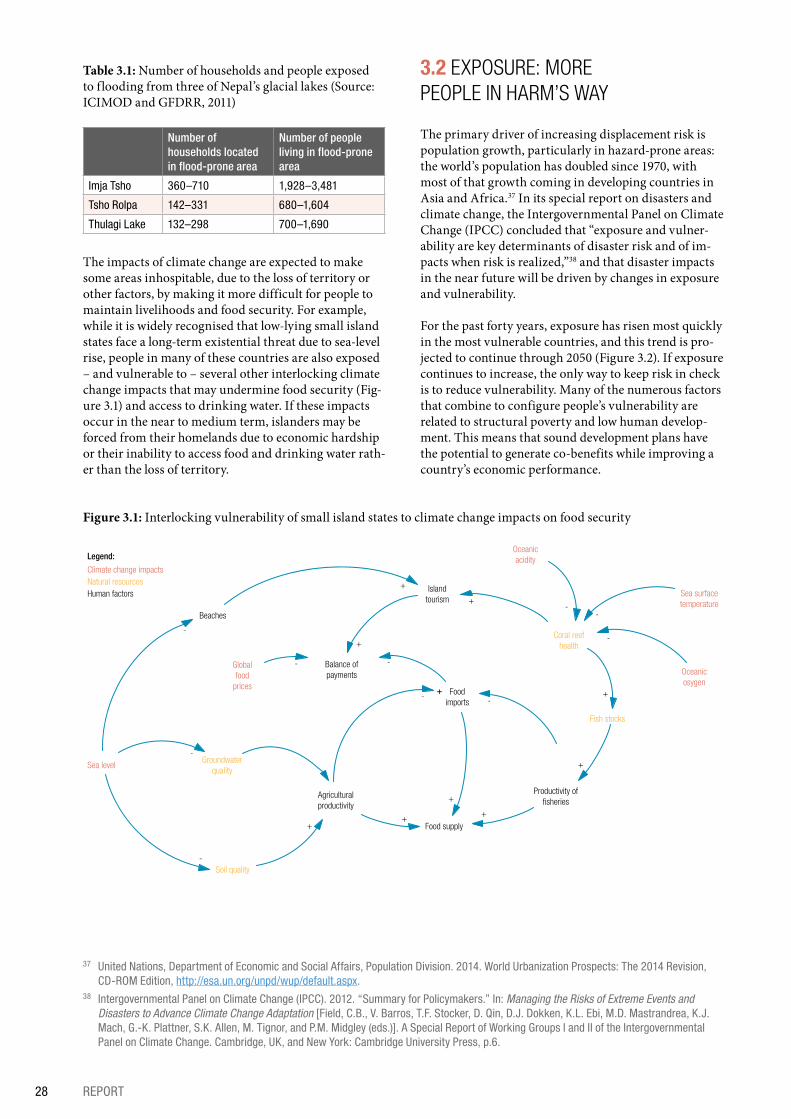
Table 3.1: Number of households and people exposed to flooding from three of Nepal’s glacial lakes (Source: ICIMOD and GFDRR, 2011)
Number of households located in flood-prone area
Number of people living in flood-prone area
Imja Tsho 360–710 1,928–3,481
Tsho Rolpa 142–331 680–1,604
Thulagi Lake 132–298 700–1,690
The impacts of climate change are expected to make some areas inhospitable, due to the loss of territory or other factors, by making it more difficult for people to maintain livelihoods and food security. For example, while it is widely recognised that low-lying small island states face a long-term existential threat due to sea-level rise, people in many of these countries are also exposed – and vulnerable to – several other interlocking climate change impacts that may undermine food security (Fig-ure 3.1) and access to drinking water. If these impacts occur in the near to medium term, islanders may be forced from their homelands due to economic hardship or their inability to access food and drinking water rath-er than the loss of territory.
3.2 EXPOSURE: MORE PEOPLE IN HARM’S WAY
The primary driver of increasing displacement risk is population growth, particularly in hazard-prone areas: the world’s population has doubled since 1970, with most of that growth coming in developing countries in Asia and Africa.37 In its special report on disasters and climate change, the Intergovernmental Panel on Climate Change (IPCC) concluded that “exposure and vulner-ability are key determinants of disaster risk and of im-pacts when risk is realized,”38 and that disaster impacts in the near future will be driven by changes in exposure and vulnerability.
For the past forty years, exposure has risen most quickly in the most vulnerable countries, and this trend is pro-jected to continue through 2050 (Figure 3.2). If exposure continues to increase, the only way to keep risk in check is to reduce vulnerability. Many of the numerous factors that combine to configure people’s vulnerability are related to structural poverty and low human develop-ment. This means that sound development plans have the potential to generate co-benefits while improving a country’s economic performance.
Figure 3.1: Interlocking vulnerability of small island states to climate change impacts on food security
Productivity offisheries
Sea level
Beaches
Human factors
Legend:
-
+
+
+
+
-
+
+
+
+
Islandtourism
Foodimports
Balance ofpayments
Agriculturalproductivity
Food supply
+
Globalfood
prices
Climate change impacts
Oceanicosygen
Oceanicacidity
Sea surfacetemperature
-
--
-
-
Groundwaterquality
Natural resources
+
-
-
-
Fish stocks
Coral reefhealth
Soil quality
+
37 United Nations, Department of Economic and Social Affairs, Population Division. 2014. World Urbanization Prospects: The 2014 Revision, CD-ROM Edition, http://esa.un.org/unpd/wup/default.aspx.
38 Intergovernmental Panel on Climate Change (IPCC). 2012. “Summary for Policymakers.” In: Managing the Risks of Extreme Events and Disasters to Advance Climate Change Adaptation [Field, C.B., V. Barros, T.F. Stocker, D. Qin, D.J. Dokken, K.L. Ebi, M.D. Mastrandrea, K.J. Mach, G.-K. Plattner, S.K. Allen, M. Tignor, and P.M. Midgley (eds.)]. A Special Report of Working Groups I and II of the Intergovernmental Panel on Climate Change. Cambridge, UK, and New York: Cambridge University Press, p.6.
28 REPORT
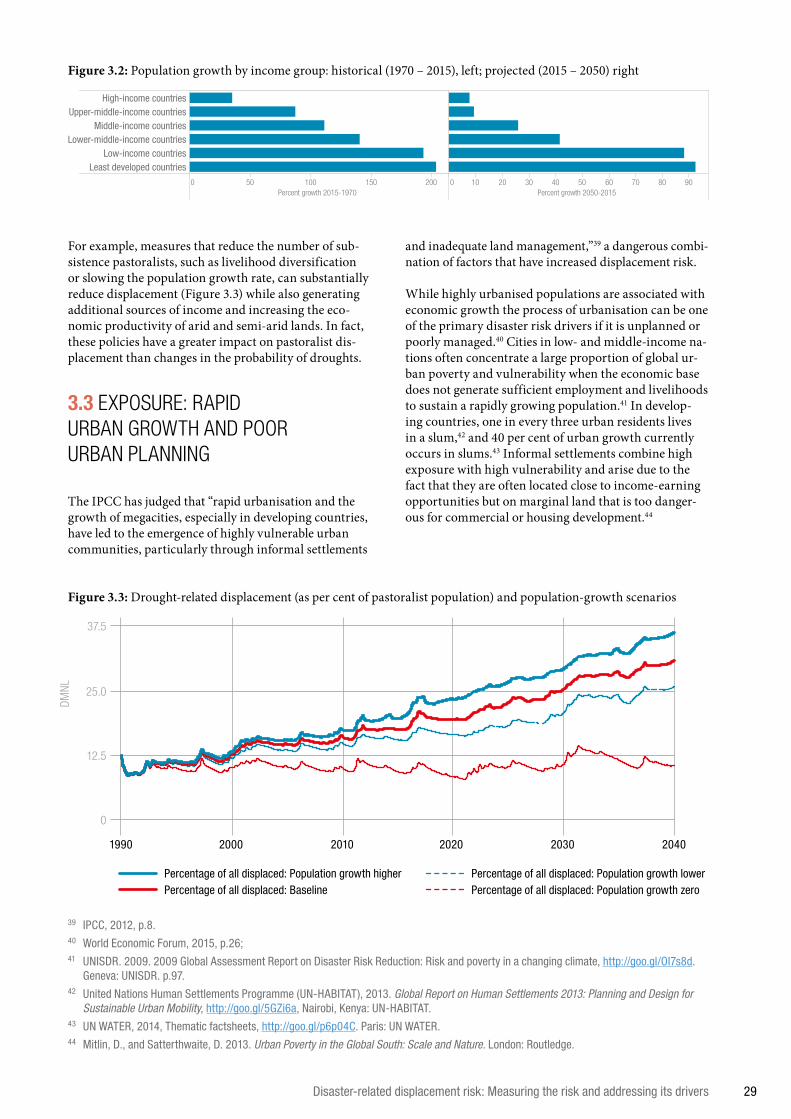
For example, measures that reduce the number of sub-sistence pastoralists, such as livelihood diversification or slowing the population growth rate, can substantially reduce displacement (Figure 3.3) while also generating additional sources of income and increasing the eco-nomic productivity of arid and semi-arid lands. In fact, these policies have a greater impact on pastoralist dis-placement than changes in the probability of droughts.
3.3 EXPOSURE: RAPID URBAN GROWTH AND POOR URBAN PLANNING
The IPCC has judged that “rapid urbanisation and the growth of megacities, especially in developing countries, have led to the emergence of highly vulnerable urban communities, particularly through informal settlements
Figure 3.2: Population growth by income group: historical (1970 – 2015), left; projected (2015 – 2050) right
0 50 100 150 200Percent growth 2015-1970
0 10 20 30 40 50 60 70 80 90Percent growth 2050-2015
High-income countriesUpper-middle-income countries
Middle-income countriesLower-middle-income countries
Low-income countriesLeast developed countries
Figure 3.3: Drought-related displacement (as per cent of pastoralist population) and population-growth scenarios
and inadequate land management,”39 a dangerous combi-nation of factors that have increased displacement risk.
While highly urbanised populations are associated with economic growth the process of urbanisation can be one of the primary disaster risk drivers if it is unplanned or poorly managed.40 Cities in low- and middle-income na-tions often concentrate a large proportion of global ur-ban poverty and vulnerability when the economic base does not generate sufficient employment and livelihoods to sustain a rapidly growing population.41 In develop-ing countries, one in every three urban residents lives in a slum,42 and 40 per cent of urban growth currently occurs in slums.43 Informal settlements combine high exposure with high vulnerability and arise due to the fact that they are often located close to income-earning opportunities but on marginal land that is too danger-ous for commercial or housing development.44
2000 2010 2020 2030 20401990
Percentage of all displaced: Population growth higherPercentage of all displaced: Baseline
Percentage of all displaced: Population growth lowerPercentage of all displaced: Population growth zero
DMNL
37.5
25.0
12.5
0
39 IPCC, 2012, p.8. 40 World Economic Forum, 2015, p.26; 41 UNISDR. 2009. 2009 Global Assessment Report on Disaster Risk Reduction: Risk and poverty in a changing climate, http://goo.gl/OI7s8d.
Geneva: UNISDR. p.97.42 United Nations Human Settlements Programme (UN-HABITAT), 2013. Global Report on Human Settlements 2013: Planning and Design for
Sustainable Urban Mobility, http://goo.gl/5GZi6a, Nairobi, Kenya: UN-HABITAT. 43 UN WATER, 2014, Thematic factsheets, http://goo.gl/p6p04C. Paris: UN WATER.44 Mitlin, D., and Satterthwaite, D. 2013. Urban Poverty in the Global South: Scale and Nature. London: Routledge.
Disaster-related displacement risk: Measuring the risk and addressing its drivers 29
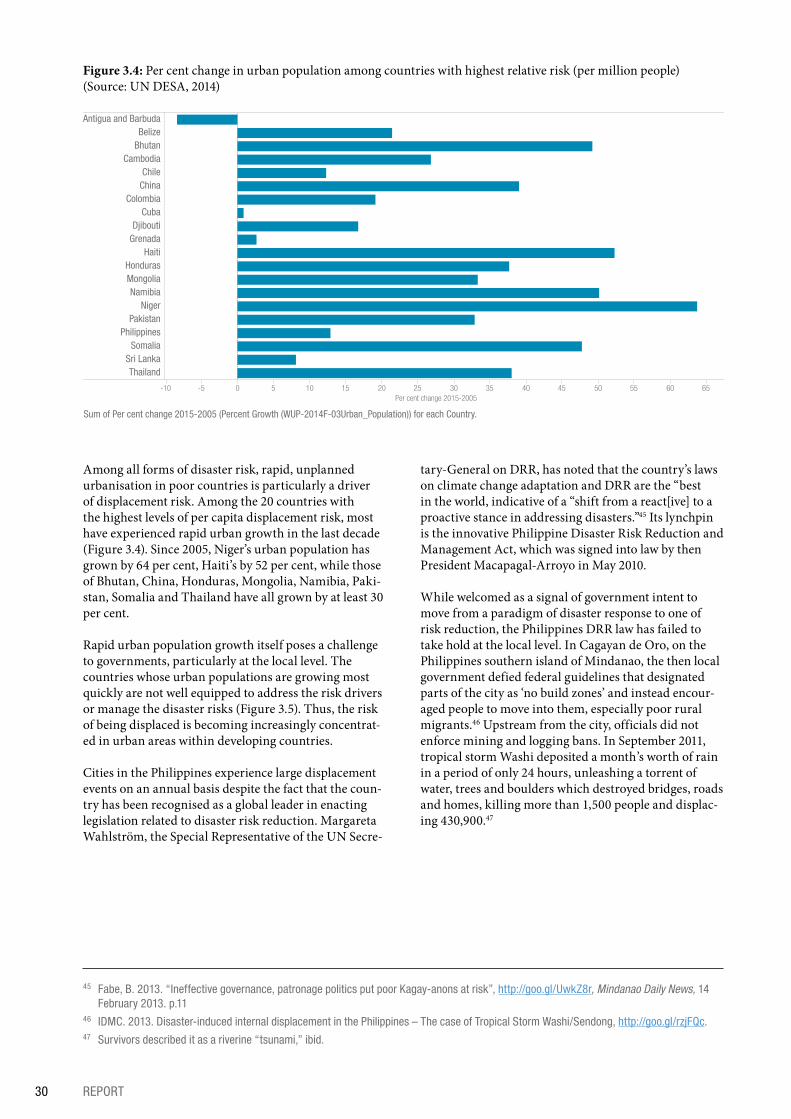
Among all forms of disaster risk, rapid, unplanned urbanisation in poor countries is particularly a driver of displacement risk. Among the 20 countries with the highest levels of per capita displacement risk, most have experienced rapid urban growth in the last decade (Figure 3.4). Since 2005, Niger’s urban population has grown by 64 per cent, Haiti’s by 52 per cent, while those of Bhutan, China, Honduras, Mongolia, Namibia, Paki-stan, Somalia and Thailand have all grown by at least 30 per cent.
Rapid urban population growth itself poses a challenge to governments, particularly at the local level. The countries whose urban populations are growing most quickly are not well equipped to address the risk drivers or manage the disaster risks (Figure 3.5). Thus, the risk of being displaced is becoming increasingly concentrat-ed in urban areas within developing countries.
Cities in the Philippines experience large displacement events on an annual basis despite the fact that the coun-try has been recognised as a global leader in enacting legislation related to disaster risk reduction. Margareta Wahlström, the Special Representative of the UN Secre-
tary-General on DRR, has noted that the country’s laws on climate change adaptation and DRR are the “best in the world, indicative of a “shift from a react[ive] to a proactive stance in addressing disasters.”45 Its lynchpin is the innovative Philippine Disaster Risk Reduction and Management Act, which was signed into law by then President Macapagal-Arroyo in May 2010.
While welcomed as a signal of government intent to move from a paradigm of disaster response to one of risk reduction, the Philippines DRR law has failed to take hold at the local level. In Cagayan de Oro, on the Philippines southern island of Mindanao, the then local government defied federal guidelines that designated parts of the city as ‘no build zones’ and instead encour-aged people to move into them, especially poor rural migrants.46 Upstream from the city, officials did not enforce mining and logging bans. In September 2011, tropical storm Washi deposited a month’s worth of rain in a period of only 24 hours, unleashing a torrent of water, trees and boulders which destroyed bridges, roads and homes, killing more than 1,500 people and displac-ing 430,900.47
Figure 3.4: Per cent change in urban population among countries with highest relative risk (per million people) (Source: UN DESA, 2014)
-10 -5 0 5 10 15 20 25 30 35 40 45 50 55 60 65Per cent change 2015-2005
Antigua and BarbudaBelize
BhutanCambodia
ChileChina
ColombiaCuba
DjiboutiGrenada
HaitiHondurasMongoliaNamibia
NigerPakistan
PhilippinesSomalia
Sri LankaThailand
Sum of Per cent change 2015-2005 (Percent Growth (WUP-2014F-03Urban_Population)) for each Country.
45 Fabe, B. 2013. “Ineffective governance, patronage politics put poor Kagay-anons at risk”, http://goo.gl/UwkZ8r, Mindanao Daily News, 14 February 2013. p.11
46 IDMC. 2013. Disaster-induced internal displacement in the Philippines – The case of Tropical Storm Washi/Sendong, http://goo.gl/rzjFQc.47 Survivors described it as a riverine “tsunami,” ibid.
30 REPORT
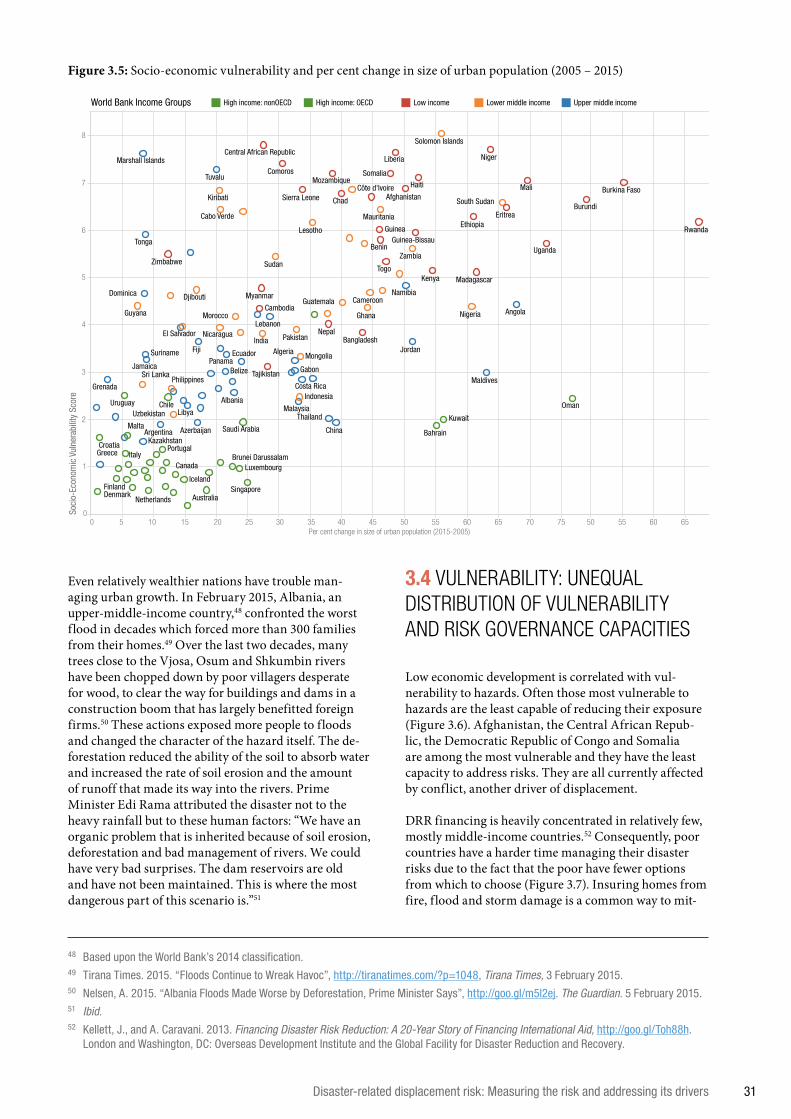
Even relatively wealthier nations have trouble man-aging urban growth. In February 2015, Albania, an upper-middle-income country,48 confronted the worst flood in decades which forced more than 300 families from their homes.49 Over the last two decades, many trees close to the Vjosa, Osum and Shkumbin rivers have been chopped down by poor villagers desperate for wood, to clear the way for buildings and dams in a construction boom that has largely benefitted foreign firms.50 These actions exposed more people to floods and changed the character of the hazard itself. The de-forestation reduced the ability of the soil to absorb water and increased the rate of soil erosion and the amount of runoff that made its way into the rivers. Prime Minister Edi Rama attributed the disaster not to the heavy rainfall but to these human factors: “We have an organic problem that is inherited because of soil erosion, deforestation and bad management of rivers. We could have very bad surprises. The dam reservoirs are old and have not been maintained. This is where the most dangerous part of this scenario is.”51
3.4 VULNERABILITY: UNEQUAL DISTRIBUTION OF VULNERABILITY AND RISK GOVERNANCE CAPACITIES
Low economic development is correlated with vul-nerability to hazards. Often those most vulnerable to hazards are the least capable of reducing their exposure (Figure 3.6). Afghanistan, the Central African Repub-lic, the Democratic Republic of Congo and Somalia are among the most vulnerable and they have the least capacity to address risks. They are all currently affected by conflict, another driver of displacement.
DRR financing is heavily concentrated in relatively few, mostly middle-income countries.52 Consequently, poor countries have a harder time managing their disaster risks due to the fact that the poor have fewer options from which to choose (Figure 3.7). Insuring homes from fire, flood and storm damage is a common way to mit-
Figure 3.5: Socio-economic vulnerability and per cent change in size of urban population (2005 – 2015)
0 5 10 15 20 25 30 35 40 45 50 55 60 65 70 75 50 55 60 65Per cent change in size of urban population (2015-2005)
0
1
2
3
4
5
6
7
8
Soci
o-Ec
onom
ic V
ulne
rabi
lity
Scor
e
Bahrain
Brunei Darussalam
Croatia
KuwaitMalta
Oman
Saudi Arabia
Singapore
Uruguay
Australia
Canada
Chile
DenmarkFinland
Greece
Iceland
Italy
Luxembourg
Netherlands
Portugal
Afghanistan
Bangladesh
Benin
Burkina Faso
Burundi
Cambodia
Central African Republic
Chad
Comoros
EritreaEthiopiaGuinea
Guinea-Bissau
Haiti
Kenya
Liberia
Madagascar
MaliMozambique
Myanmar
Nepal
Niger
Rwanda
Sierra Leone
Somalia
Tajikistan
Togo
UgandaZimbabwe
Cabo Verde
Cameroon
Côte d'Ivoire
Djibouti
El Salvador
Ghana
GuatemalaGuyana
India
Indonesia
Kiribati
Lesotho
Mauritania
Mongolia
Morocco
Nicaragua
Nigeria
Pakistan
Philippines
Solomon Islands
South Sudan
Sri Lanka
Sudan
Uzbekistan
Zambia
Albania
Algeria
Angola
Argentina Azerbaijan
Belize
China
Costa Rica
Dominica
EcuadorFiji
Gabon
Grenada
Jamaica
Jordan
Kazakhstan
Lebanon
Libya Malaysia
Maldives
Marshall Islands
Namibia
PanamaSuriname
Thailand
Tonga
Tuvalu
World Bank Income Groups High income: nonOECD High income: OECD Low income Lower middle income Upper middle income
48 Based upon the World Bank’s 2014 classification.49 Tirana Times. 2015. “Floods Continue to Wreak Havoc”, http://tiranatimes.com/?p=1048, Tirana Times, 3 February 2015. 50 Nelsen, A. 2015. “Albania Floods Made Worse by Deforestation, Prime Minister Says”, http://goo.gl/m5l2ej. The Guardian. 5 February 2015. 51 Ibid.52 Kellett, J., and A. Caravani. 2013. Financing Disaster Risk Reduction: A 20-Year Story of Financing International Aid, http://goo.gl/Toh88h.
London and Washington, DC: Overseas Development Institute and the Global Facility for Disaster Reduction and Recovery.
Disaster-related displacement risk: Measuring the risk and addressing its drivers 31
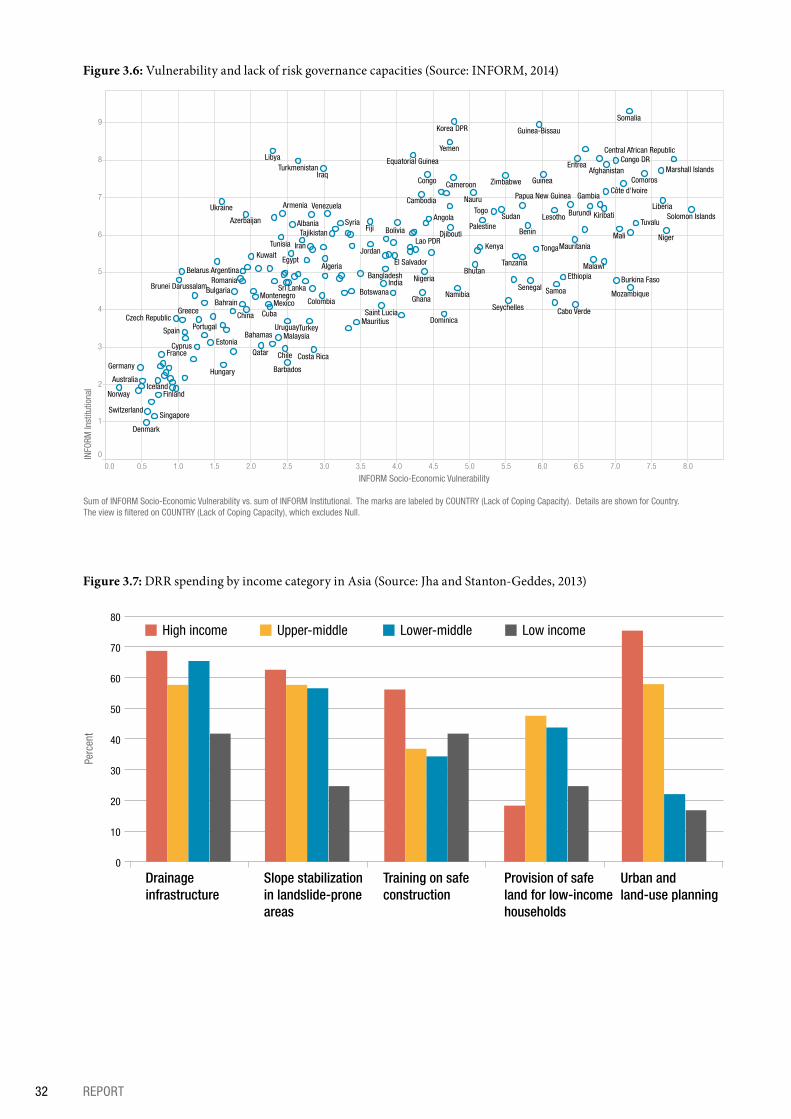
Figure 3.6: Vulnerability and lack of risk governance capacities (Source: INFORM, 2014)
0.0 0.5 1.0 1.5 2.0 2.5 3.0 3.5 4.0 4.5 5.0 5.5 6.0 6.5 7.0 7.5 8.0
INFORM Socio-Economic Vulnerability
0
1
2
3
4
5
6
7
8
9
INFO
RM In
stitu
tiona
l
Afghanistan
Albania
Algeria
Angola
Argentina
Armenia
Australia
Azerbaijan
Bahamas
Bahrain
Bangladesh
Barbados
Belarus
Benin
Bhutan
Bolivia
BotswanaBrunei DarussalamBulgaria
Burkina Faso
Burundi
Cabo Verde
Cambodia
Cameroon
Central African Republic
Chile
China
Colombia
ComorosCongo
Congo DR
Costa Rica
Côte d'Ivoire
Cuba
Cyprus
Czech Republic
Denmark
Djibouti
Dominica
Egypt El Salvador
Equatorial Guinea Eritrea
Estonia
Ethiopia
Fiji
Finland
France
Gambia
Germany
GhanaGreece
Guinea
Guinea-Bissau
Hungary
Iceland
India
Iran
Iraq
Jordan Kenya
Kiribati
Korea DPR
Kuwait
Lao PDR
LesothoLiberia
Libya
Malawi
Malaysia
Mali
Marshall Islands
Mauritania
Mauritius
MexicoMontenegro MozambiqueNamibia
Nauru
Niger
Nigeria
Norway
Palestine
Papua New Guinea
Portugal
Qatar
Romania
Saint Lucia
SamoaSenegal
Seychelles
Singapore
Solomon Islands
Somalia
Spain
Sri Lanka
Sudan
Switzerland
SyriaTajikistan
Tanzania
Togo
TongaTunisia
Turkey
Turkmenistan
Tuvalu
Ukraine
Uruguay
Venezuela
Yemen
Zimbabwe
Sum of INFORM Socio-Economic Vulnerability vs. sum of INFORM Institutional. The marks are labeled by COUNTRY (Lack of Coping Capacity). Details are shown for Country.The view is filtered on COUNTRY (Lack of Coping Capacity), which excludes Null.
Figure 3.7: DRR spending by income category in Asia (Source: Jha and Stanton-Geddes, 2013)
Drainage infrastructure
Slope stabilization in landslide-prone areas
Training on safe construction
Provision of safe land for low-income households
Urban and land-use planning
Perc
ent
80
70
60
50
40
30
20
10
0
High income Upper-middle Lower-middle Low income
32 REPORT
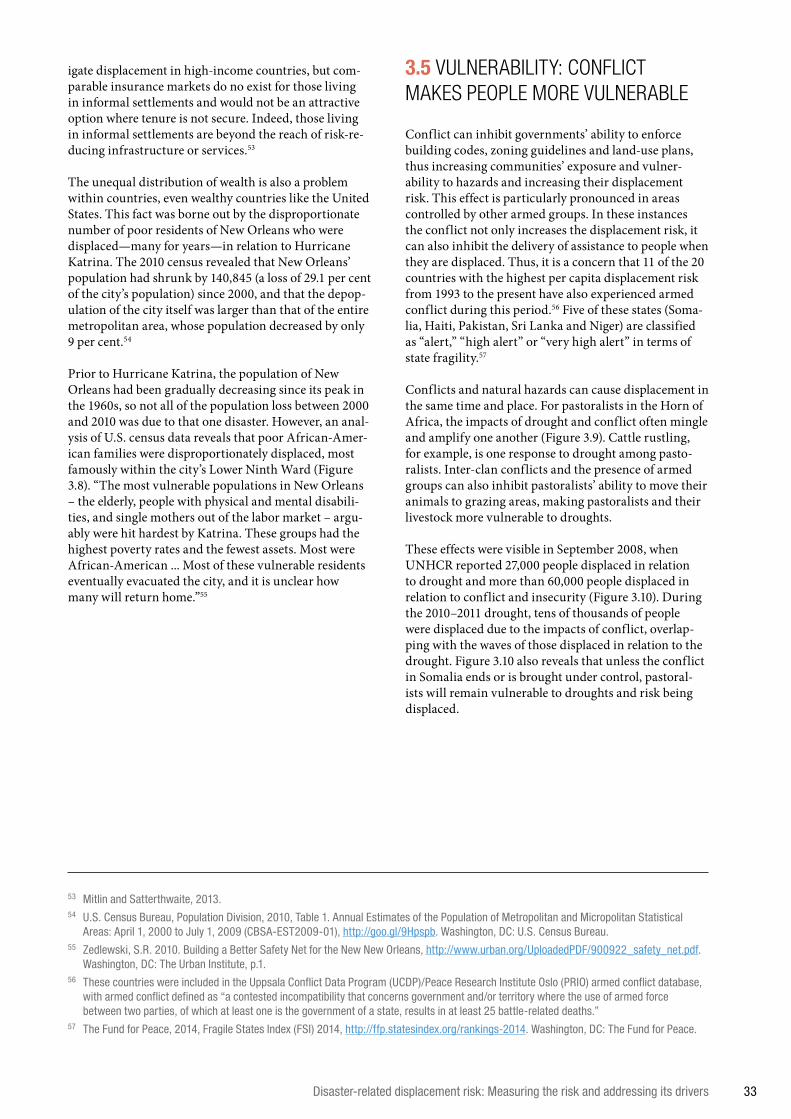
igate displacement in high-income countries, but com-parable insurance markets do no exist for those living in informal settlements and would not be an attractive option where tenure is not secure. Indeed, those living in informal settlements are beyond the reach of risk-re-ducing infrastructure or services.53
The unequal distribution of wealth is also a problem within countries, even wealthy countries like the United States. This fact was borne out by the disproportionate number of poor residents of New Orleans who were displaced—many for years—in relation to Hurricane Katrina. The 2010 census revealed that New Orleans’ population had shrunk by 140,845 (a loss of 29.1 per cent of the city’s population) since 2000, and that the depop-ulation of the city itself was larger than that of the entire metropolitan area, whose population decreased by only 9 per cent.54
Prior to Hurricane Katrina, the population of New Orleans had been gradually decreasing since its peak in the 1960s, so not all of the population loss between 2000 and 2010 was due to that one disaster. However, an anal-ysis of U.S. census data reveals that poor African-Amer-ican families were disproportionately displaced, most famously within the city’s Lower Ninth Ward (Figure 3.8). “The most vulnerable populations in New Orleans – the elderly, people with physical and mental disabili-ties, and single mothers out of the labor market – argu-ably were hit hardest by Katrina. These groups had the highest poverty rates and the fewest assets. Most were African-American ... Most of these vulnerable residents eventually evacuated the city, and it is unclear how many will return home.”55
3.5 VULNERABILITY: CONFLICT MAKES PEOPLE MORE VULNERABLE
Conflict can inhibit governments’ ability to enforce building codes, zoning guidelines and land-use plans, thus increasing communities’ exposure and vulner-ability to hazards and increasing their displacement risk. This effect is particularly pronounced in areas controlled by other armed groups. In these instances the conflict not only increases the displacement risk, it can also inhibit the delivery of assistance to people when they are displaced. Thus, it is a concern that 11 of the 20 countries with the highest per capita displacement risk from 1993 to the present have also experienced armed conflict during this period.56 Five of these states (Soma-lia, Haiti, Pakistan, Sri Lanka and Niger) are classified as “alert,” “high alert” or “very high alert” in terms of state fragility.57
Conflicts and natural hazards can cause displacement in the same time and place. For pastoralists in the Horn of Africa, the impacts of drought and conflict often mingle and amplify one another (Figure 3.9). Cattle rustling, for example, is one response to drought among pasto-ralists. Inter-clan conflicts and the presence of armed groups can also inhibit pastoralists’ ability to move their animals to grazing areas, making pastoralists and their livestock more vulnerable to droughts.
These effects were visible in September 2008, when UNHCR reported 27,000 people displaced in relation to drought and more than 60,000 people displaced in relation to conflict and insecurity (Figure 3.10). During the 2010–2011 drought, tens of thousands of people were displaced due to the impacts of conflict, overlap-ping with the waves of those displaced in relation to the drought. Figure 3.10 also reveals that unless the conflict in Somalia ends or is brought under control, pastoral-ists will remain vulnerable to droughts and risk being displaced.
53 Mitlin and Satterthwaite, 2013.54 U.S. Census Bureau, Population Division, 2010, Table 1. Annual Estimates of the Population of Metropolitan and Micropolitan Statistical
Areas: April 1, 2000 to July 1, 2009 (CBSA-EST2009-01), http://goo.gl/9Hpspb. Washington, DC: U.S. Census Bureau.55 Zedlewski, S.R. 2010. Building a Better Safety Net for the New New Orleans, http://www.urban.org/UploadedPDF/900922_safety_net.pdf.
Washington, DC: The Urban Institute, p.1.56 These countries were included in the Uppsala Conflict Data Program (UCDP)/Peace Research Institute Oslo (PRIO) armed conflict database,
with armed conflict defined as “a contested incompatibility that concerns government and/or territory where the use of armed force between two parties, of which at least one is the government of a state, results in at least 25 battle-related deaths.”
57 The Fund for Peace, 2014, Fragile States Index (FSI) 2014, http://ffp.statesindex.org/rankings-2014. Washington, DC: The Fund for Peace.
Disaster-related displacement risk: Measuring the risk and addressing its drivers 33
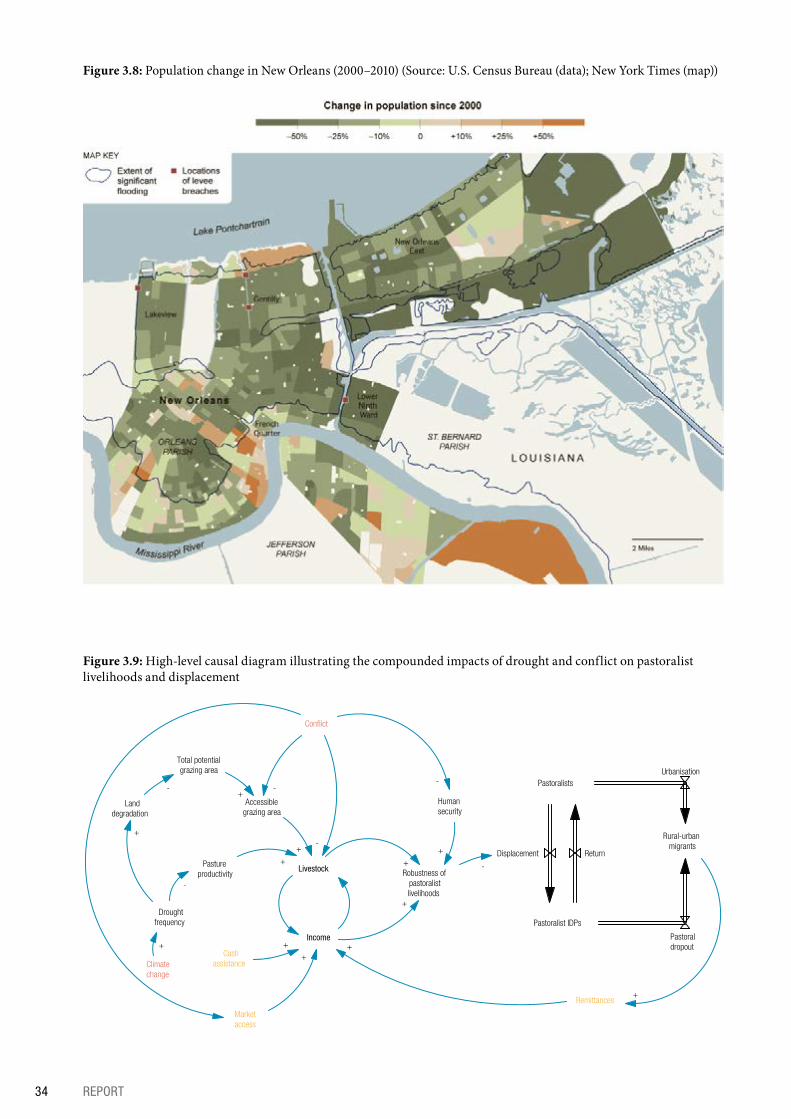
Pastoralists
Pastoralist IDPs
Displacement Return
Droughtfrequency
Accessiblegrazing area
Livestock
Income
Climatechange
Pastureproductivity
Total potentialgrazing area
Robustness ofpastoralistlivelihoods
Rural-urbanmigrants
Urbanisation
Pastoraldropout
-+
+
+
-
++
+Humansecurity
+
Conflict
--
-
Cashassistance
+
Landdegradation
+
-
Remittances
Marketaccess
++
+
Figure 3.9: High-level causal diagram illustrating the compounded impacts of drought and conflict on pastoralist livelihoods and displacement
Figure 3.8: Population change in New Orleans (2000–2010) (Source: U.S. Census Bureau (data); New York Times (map))
34 REPORT
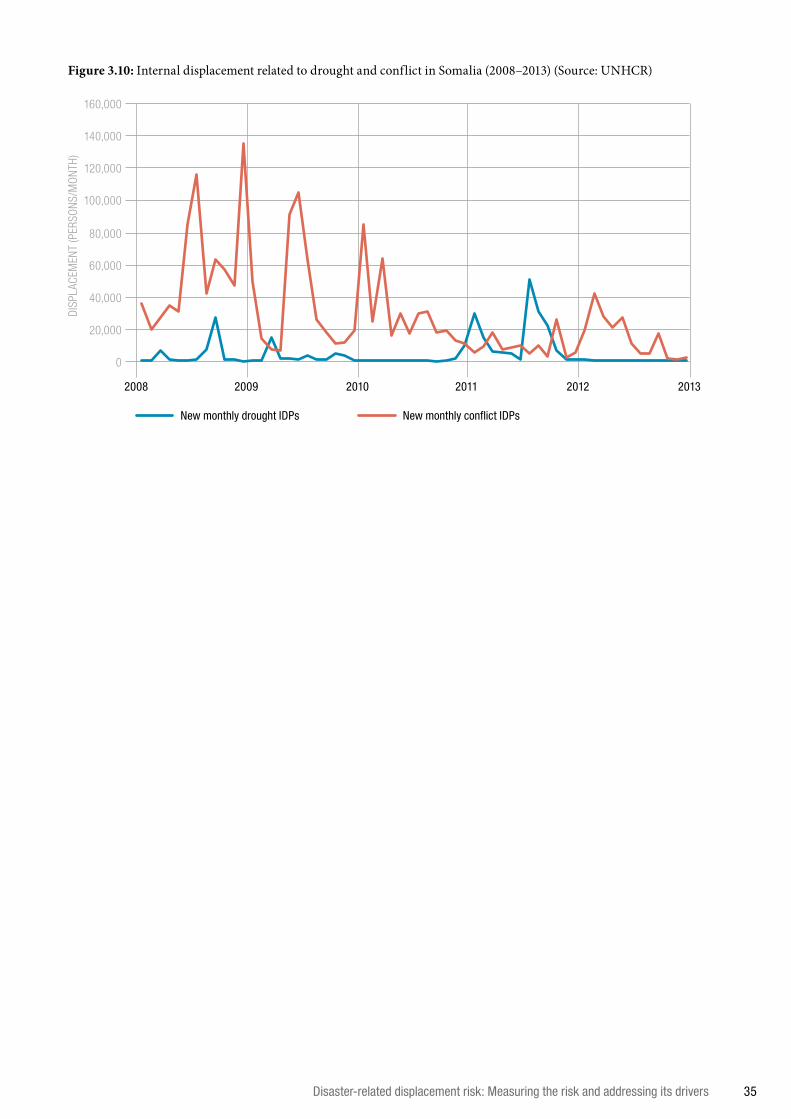
Figure 3.10: Internal displacement related to drought and conflict in Somalia (2008–2013) (Source: UNHCR)
2009 2010 2011 2012 20132008
New monthly drought IDPs New monthly conflict IDPs
160,000
140,000
DISP
LACE
MEN
T (P
ERSO
NS/M
ONTH
)
120,000
100,000
80,000
60,000
40,000
20,000
0
Disaster-related displacement risk: Measuring the risk and addressing its drivers 35
4. CONCLUSION
4.1 COORDINATE POLICY FRAMEWORKS AT MULTIPLE SCALES
This report focused on the risk of disaster-related displacement. Isolating displacement risk helped reveal the scale of this urgent and growing problem. It indi-cated where the threat of displacement is largest – and to whom. The emphasis on displacement as a particular disaster risk allowed us to unpack it and understand it more thoroughly.
To focus on displacement and exclude other disas-ter risks is, however, to make a false distinction. The disaster is not the number of people killed or injured, the magnitude of the economic losses, the disruption of livelihoods or the scale of displacement. The disaster is all of these things together. Patterns of displacement represent how people have responded to the hazard and its impacts on homes, lives and livelihoods. Therefore, many of the measures that can reduce disaster risk in general can also reduce displacement risk in particu-lar. Live-saving evacuations are one notable exception to this rule.
Bearing this in mind, it is no surprise that IDMC’s anal-ysis of displacement risk produced evidence that pointed to the familiar set of risk drivers that are responsible for increasing exposure of vulnerable people and commu-nities: population growth, rapid and unplanned urbani-sation, wealth disparities between and within countries, conflict and state failure and the looming threat of climate change.
Each of these problems is large individually, and collec-tively they may appear to be insurmountable. Tackling these challenges in a coherent and coordinated manner is likely the most effective way to gain traction at the scale required. Fortunately, several opportunities are at hand to set the broad group of stakeholders onto the right paths: the finalisation and adoption of the succes-sor to the HFA; the anticipated agreements on climate change mitigation and adaptation at the UNFCCC’s Conference of the Parties in Paris; the new Sustaina-ble Development Goals and the World Humanitarian Summit. Displacement is one bridge across all of these policy forums – it is the human face of them. Coordinat-ed efforts, coherent standards, objectives and indicators among these global processes will provide the necessary momentum to reduce the human impacts that govern-ments are striving to avoid.
36 REPORT
4.2 ADDRESS EVIDENCE AND KNOWLEDGE GAPS TO INFORM DRR, DEVELOPMENT AND CLIMATE CHANGE ADAPTATION PLANS
There are a number of practical steps that can be taken to measure, manage and reduce displacement risk through DRR, climate change adaptation and develop-ment during 2015 and carried forward into the future. National and global disaster loss databases can be improved by including specific indicators that track the magnitude and duration of disaster-related displace-ment as it evolves over time. This will help establish a more comprehensive baseline record of displacement which will improve efforts to measure the risk of its future occurrence.
Certain important knowledge gaps also need to be filled in partnership with vulnerable communities. Improved understanding of vulnerability at the local level will help reveal the factors, thresholds and tipping points that trigger displacement, particularly those associated with slow-onset events. This evidence base will explain when and why people abandon, or are not able to rebuild, their livelihoods and the processes through which areas may become uninhabitable. This new knowledge can inform DRR and climate change adaptation measures that aim to make livelihoods more resilient to future hazards.
Research on the protracted displacement and the needs of people who have been displaced is also need-ed. Displacement itself can make people vulnerable to future hazards, especially for those living in temporary shelters, those without official documents and those without access to livelihood opportunities, food, water and health services. A better understanding of these causal pathways facilitate the inclusion of DRR meas-ures into disaster response so that affected communities can ‘build back better’ when disasters occur.
Lastly, policymakers can leverage decision-support tools that enable them to explore risk scenarios and the test the effectiveness of plans and policies before deciding which to implement. By incorporating myriad factors and spanning multiple time horizons, such tools can facilitate joint development, DRR and climate change adaptation planning. Where these tools are not yet avail-able, they responsible authorities can demand them.
Regardless of the specific wording of decisions adopted by governments at the global DRR, climate change and development summits, these are steps that can support implementation of these agreements – and reduce the risk of future displacement.
Disaster-related displacement risk: Measuring the risk and addressing its drivers 37
ANNEX: METHODOLOGY
INTRODUCTION
IDMC is working in several ways to increase under-standing of disaster related displacement. Since 2008, IDMC has tracked disaster related displacement by hand-screening disaster event data to create high-quali-ty displacement estimates. In 2013, work commenced on modelling future displacement risk. In 2014, modelled historic displacement estimates were introduced to esti-mate historic risk for a much wider range of years, 1970 to 2012. All of these approaches help to better inform the state of disaster related displacement risk through-out the world. Each approach has particular strengths and weaknesses that together help paint a more com-plete picture of disaster-related displacement.
The historic modelled displacement and displacement risk figures have been broken down into the following units of analysis:• global• regional (Latin America and the Caribbean, South-
east Asia, South Asia and the Horn of Africa)• national
With the exception of the Horn of Africa, the glob-al, regional and national displacement risk estimates are based upon a probabilistic risk model similar to the one used throughout the 2015 GAR and its prede-cessors. Due to the complex causality and time scale, drought-related displacement risk in the Horn of Africa was calculated using a system dynamics model.
DISPLACEMENT RISK ASSOCIATED WITH SUDDEN-ONSET HAZARDS: USING HISTORIC DISPLACEMENT ESTIMATES
IDMC’s DiDD, annual disaster displacement estimate database for 2008-2013 has been augmented with his-toric modelled displacement estimates created by using existing disaster loss data from 1970 to 2012. These modelled displacement figures are provided on a coun-try/year/event type basis, and, where possible, also at a sub-national resolution. They have been constructed as analogs to the actuarial concept of AAL (Average Annu-al Loss, or Average Annual Displacement in this case). These figures are also carried forward as risk estimates for 2015-2020.
Loss data for this analysis was obtained from EM-DAT and DesInventar disaster loss databases, and was then used to create synthetic displacement estimates for 1970-2012, broken down by country and hazard type. The estimates rely on what are considered the strongest loss data categories in these databases (deaths, homeless and people affected variables).
The calibration process involved comparing disaster loss data with IDMC’s DiDD displacement estimates for 2008-2012 where a country-by-country comparison was possible. The loss variables were used in linear equations using weightings obtained from regression models for each individual hazard type for which sufficient data was available, and using a generic weighting for the remainder of hazard types.
The goal of this analysis has been to provide a historic context for displacement since IDMC’s individually col-lected and screened DiDD human displacement dataset on specific events only covers events since 2008. With a longer term, four-decade sample, underlying trends in human displacement that are not visible in IDMC’s DiDD can thus be explored. This helps to better put recent displacement figures in context as part of longer-
38 REPORT
term trends and the intrinsic high levels of inter-annual variability that are necessarily part of the nature of events with long return periods.
As a first iteration of this approach, the modelled displacement estimates have provided some validation of expected patterns, shed light on some interesting rela-tionships between datasets and trends and provided op-portunities for improving our analysis and understand-ing of displacement patterns for future reports, both in terms of underlying data and modelling methodology.
CREATING DISPLACEMENT RISK ESTIMATES
Annual AAL figures for 1970-2013 were also carried forward for the period 2015-2025 as average annual displacement risk estimates. The historic modelled displacement figures were then used in combination with the DiDD and some key demographic variables to produce graphs expressing the probability of any particular level of displacement per year, similar to the actuarial concept of MPL (Maximum Probable Loss, or Maximum Probable Displacement in this case). These calculations uses the entire date range of the data-set. This, naturally, poses some problems in terms of comparability as underlying risk drivers, development patterns, population levels and demographics can all change substantially within that period. It is for this rea-son that Maximum Probable Displacement only loosely follows the actuarial formula for MPL.
AAL and MPL figures have been calculated on a country/event type basis for countries and event types containing sufficient data to run the model, and using generic event types or merged country groupings where sample sizes were too small for a more granular analysis.
RATIONALE
Together with the historical modelled displacement, the DiDD has undergone significant improvements in terms of data normalisation and standardisation . This has significantly increased the type and quality of analytics that can be run on the data. Together with these improvements to the structure of the dataset, there has also been a substantial push to increase the coverage and background information collected for displacement events, providing a richer picture of displacement, and thus informing the calibration process. Furthermore, a similar data structure was employed in the long-term 1970-2012 dataset, extending the analytical capacities and thus enabling direct comparison between the two datasets.
It is important to note that human displacement is al-most always measured via either direct or indirect prox-
ies. For example, evacuation figures, people living in temporary camps and homes destroyed are all valuable proxies for determining displacement levels. There is a sliding scale in terms of the usefulness of these proxies. Some of them directly map onto displacement, while others provide only a loose idea of what displacement may have occurred. The different available datasets all carry differing levels of quality, methodological chal-lenges and coverage that must be taken into account when using them.
IDMC’s 2008-2013 database of high-resolution displace-ment estimates relies only on the highest quality and most directly relevant proxies. Close attention is paid to which proxy takes precedence if only one is used for the estimate, or if a combination of several proxies is used. Then the figures are combined to reach the total displacement estimate for that event. Such high quality, directly mapped proxies are not readily available for longer-term analyses. Thus, longer-term analyses must necessarily be limited to the best, closest proxies that are readily available for all countries and all tracked event types (for example, drought is excluded from this list due to this same issue). The most common data collect-ed for disasters that meets these criteria on a historic basis consists of mortality, homeless and affected people totals.
At a global level, the most thorough and most cited data-base of disaster losses that tracks these variables is EM-DAT. At a national level, the expanding series of disaster loss databases following the DesInventar methodology provide disaggregated loss figures per jurisdiction. Due to the fact that each DesInventar database is admin-istered by each participating country, there are slight variations in structure and more significant variations in coverage and low-end thresholds for inclusion. In the past this has made inter-country comparison difficult. In 2015 IDMC is going to use the ISDR’s GAR data uni-verse, which has been pre-screened to insure the highest level of inter-country comparison, thus largely remov-ing this substantial limitation to previous DesInventar datasets.
In all of these datasets, mortality data is of the highest quality, while homeless and affected population infor-mation can be somewhat less accurate, especially for some particular types of hazard. Homeless data appears to be most accurately represented in earthquake events, and least well tracked in flood events. Storms and floods have both the highest number of entries and total in terms of mortality and homelessness, which makes their individual hazard analyses rather more robust due to the larger sample sizes.
Landslides, and smaller events in general, receive substantially less attention due to a combination of difficulty in collecting data on so many events and problems that can arise from a change in methodology. These can include a lowering of thresholds for inclusion, that would drastically increase the number of entries for these types of events. For example, EM-DAT utilises
Disaster-related displacement risk: Measuring the risk and addressing its drivers 39
a threshold of ten deaths or 100 people affected. Thus, events that are included could be biased toward those in which one or both of these metrics are provided, and biased against events where the particular type of loss is homes or livelihoods. Such variability is present across hazards, loss metrics and different databases, making analysis challenging due to the many sources of con-founding.
THE CALIBRATION MODEL
In order to link the two datasets, the loss-based model was calibrated utilising the DiDD dataset by creating a dataset of overlapping country, hazard and year totals between the two datasets. Three iterations of this pro-cess were run, seeking to improve the predictive capabil-ities and reduce sources of uncertainty in the results.
• The first displacement model based on EM-DAT disaster loss data utilised a naive multiplier across all hazard types. This had the benefit of providing a rough estimate without any significant variance re-lated issues, but also without a high degree of fit with underlying hazard/country/year data.
• The second model utilised per-hazard type regression coefficients, where possible, and generic values for hazard types with limited samples.
• The third model sought to reduce some of the biggest challenges raised in the second model by utilising relative values and increasing the sample size.
Each hazard displacement model was calibrated uti-lizing coefficients obtained from regression analyses between IDMC’s annual displacement totals by country and year (2008-2012) and equivalent annual EM-DAT mortality, affected and homeless annual country data. For most hazard types, these regressions were run with that specific hazard type’s data. For hazard types with limited data (for example, dry landslides) values were obtained from the regression analysis including all IDMC hazard types.
Due to the limited sample sizes, in even the hazard types with the most displacement entries, the variance of the exogenous variables over the 1970-2012 period is much larger than that found in the limited 2008-2012 sample utilised for the regressions. As a result, some entries appeared as extreme outliers that substantially skewed the results. Several approaches were taken to handle the most extreme outliers generated in the second model. First, values were adjusted to relative mortality, affected, homeless and displaced figures (per million inhabit-ants). Another option that has been considered but not yet implemented is to increase the sample size in the re-gression analyses by utilising Monte Carlo simulations.
ADDITIONAL WORK IN PROCESS
Once calibrated, the historic displacement estimates were complemented with other types of indicators, including quantitative demographic, social and gov-ernance components to further dimension the analysis. Further investigation into causal relationships between underlying risk drivers and human displacement is on-going at IDMC, utilising the increased analytical capaci-ties of the DiDD and historical modelled displacement.
Several areas of improvement have been contemplated for the next iteration of both the DiDD and the histori-cal modelled displacement. Disaster loss data from EM-DAT was compiled on an annual level, both to keep the size of the dataset within reason and more importantly, to enable year/hazard/country matching between DiDD and the historical dataset, without which calibration of the historic loss data would not be possible. This makes several assumptions about what set of events are covered within each yearly division, and may pose problems with events that overlap the new year date in terms of which year displacement and loss may be ascribed
One suggested improvement to the calibration algo-rithm for 2016 would be to attempt an event-by-event matching, at least for the top 50 per cent of the entries. Also, as is the case with the DiDD, tracking displace-ment due to drought and/or other slow-onset hazards is addressed using another model described in the section below. Should a DiDD displacement estimate method-ology be implemented for drought, the current model would then be able to calibrate off of this data.
DISPLACEMENT RISK ASSOCIATED WITH SLOW-ONSET HAZARDS: USING A SYSTEM DYNAMICS MODEL
The Pastoralist Livelihood and Displacement Simulator encompasses Garissa, Mandera, Marsabit and Wajir dis-tricts of Kenya, the Borena and Liben zones in Ethiopia as well as the Bay and Gedo regions of southern Soma-lia. It covers the half century from 1990 to 2040 (Figure A.1).
IDMC and Climate Interactive developed the simulator to improve understanding of how drought combined with other factors to influence the livelihood and displacement of pastoralists. The simulator works in real time so that policy-makers, humanitarians and pastoralists themselves can use it to identify the most effective ways to prevent, mitigate and respond to the impacts of droughts. The tool allows people to test how effective policies and interventions would have been had they been implemented during past droughts. It further allows them to explore different future scenarios to see the impacts of policies, interventions and potential changes in climate.
40 REPORT
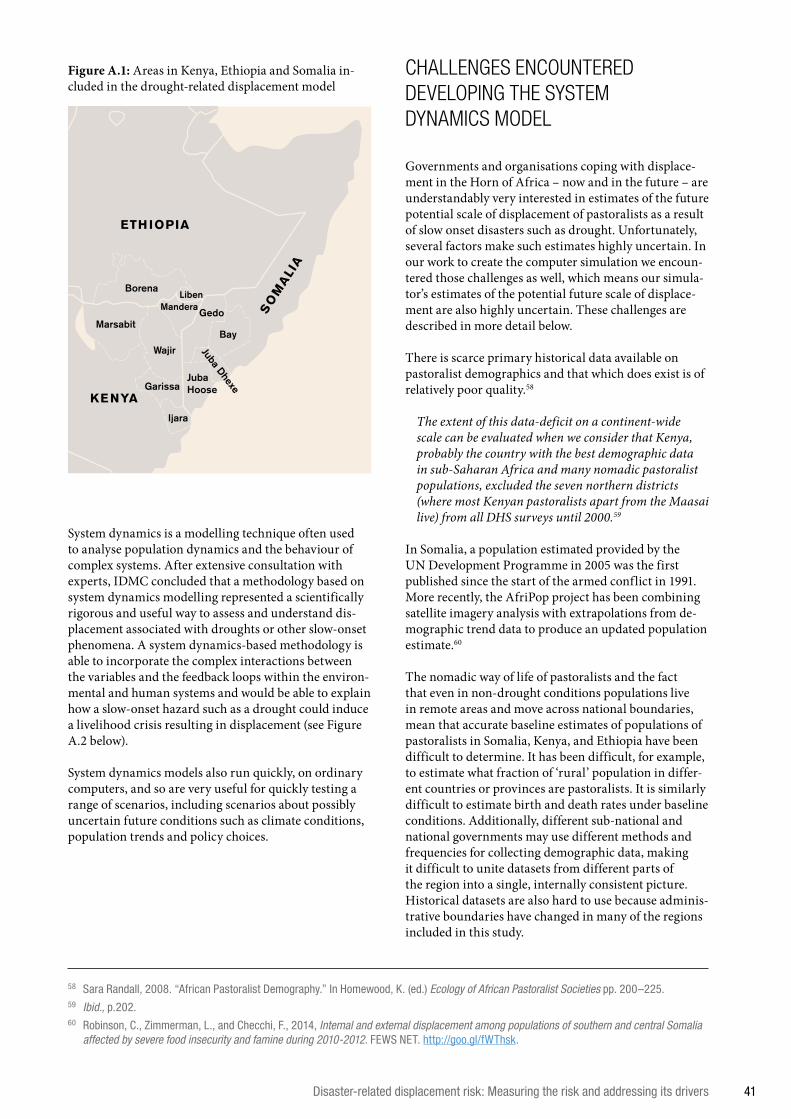
System dynamics is a modelling technique often used to analyse population dynamics and the behaviour of complex systems. After extensive consultation with experts, IDMC concluded that a methodology based on system dynamics modelling represented a scientifically rigorous and useful way to assess and understand dis-placement associated with droughts or other slow-onset phenomena. A system dynamics-based methodology is able to incorporate the complex interactions between the variables and the feedback loops within the environ-mental and human systems and would be able to explain how a slow-onset hazard such as a drought could induce a livelihood crisis resulting in displacement (see Figure A.2 below).
System dynamics models also run quickly, on ordinary computers, and so are very useful for quickly testing a range of scenarios, including scenarios about possibly uncertain future conditions such as climate conditions, population trends and policy choices.
Figure A.1: Areas in Kenya, Ethiopia and Somalia in-cluded in the drought-related displacement model
KENYA
Bay
Juba Dhexe
GedoManderaLiben
Borena
Marsabit
Wajir
Garissa
Ijara
JubaHoose
ETHIOPIA
SOMALIA
CHALLENGES ENCOUNTERED DEVELOPING THE SYSTEM DYNAMICS MODEL
Governments and organisations coping with displace-ment in the Horn of Africa – now and in the future – are understandably very interested in estimates of the future potential scale of displacement of pastoralists as a result of slow onset disasters such as drought. Unfortunately, several factors make such estimates highly uncertain. In our work to create the computer simulation we encoun-tered those challenges as well, which means our simula-tor’s estimates of the potential future scale of displace-ment are also highly uncertain. These challenges are described in more detail below.
There is scarce primary historical data available on pastoralist demographics and that which does exist is of relatively poor quality.58
The extent of this data-deficit on a continent-wide scale can be evaluated when we consider that Kenya, probably the country with the best demographic data in sub-Saharan Africa and many nomadic pastoralist populations, excluded the seven northern districts (where most Kenyan pastoralists apart from the Maasai live) from all DHS surveys until 2000.59
In Somalia, a population estimated provided by the UN Development Programme in 2005 was the first published since the start of the armed conflict in 1991. More recently, the AfriPop project has been combining satellite imagery analysis with extrapolations from de-mographic trend data to produce an updated population estimate.60
The nomadic way of life of pastoralists and the fact that even in non-drought conditions populations live in remote areas and move across national boundaries, mean that accurate baseline estimates of populations of pastoralists in Somalia, Kenya, and Ethiopia have been difficult to determine. It has been difficult, for example, to estimate what fraction of ‘rural’ population in differ-ent countries or provinces are pastoralists. It is similarly difficult to estimate birth and death rates under baseline conditions. Additionally, different sub-national and national governments may use different methods and frequencies for collecting demographic data, making it difficult to unite datasets from different parts of the region into a single, internally consistent picture. Historical datasets are also hard to use because adminis-trative boundaries have changed in many of the regions included in this study.
58 Sara Randall, 2008. “African Pastoralist Demography.” In Homewood, K. (ed.) Ecology of African Pastoralist Societies pp. 200–225.59 Ibid., p.202.60 Robinson, C., Zimmerman, L., and Checchi, F., 2014, Internal and external displacement among populations of southern and central Somalia
affected by severe food insecurity and famine during 2010-2012. FEWS NET. http://goo.gl/fWThsk.
Disaster-related displacement risk: Measuring the risk and addressing its drivers 41
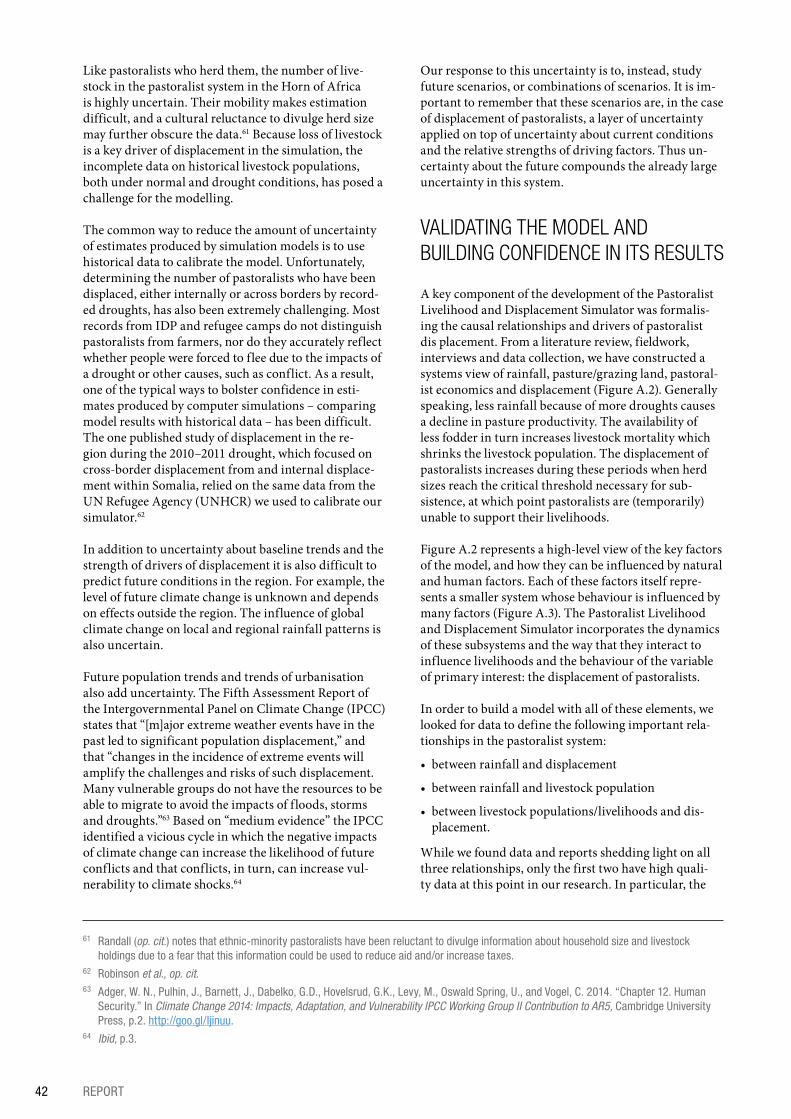
Like pastoralists who herd them, the number of live-stock in the pastoralist system in the Horn of Africa is highly uncertain. Their mobility makes estimation difficult, and a cultural reluctance to divulge herd size may further obscure the data.61 Because loss of livestock is a key driver of displacement in the simulation, the incomplete data on historical livestock populations, both under normal and drought conditions, has posed a challenge for the modelling.
The common way to reduce the amount of uncertainty of estimates produced by simulation models is to use historical data to calibrate the model. Unfortunately, determining the number of pastoralists who have been displaced, either internally or across borders by record-ed droughts, has also been extremely challenging. Most records from IDP and refugee camps do not distinguish pastoralists from farmers, nor do they accurately reflect whether people were forced to flee due to the impacts of a drought or other causes, such as conflict. As a result, one of the typical ways to bolster confidence in esti-mates produced by computer simulations – comparing model results with historical data – has been difficult. The one published study of displacement in the re-gion during the 2010–2011 drought, which focused on cross-border displacement from and internal displace-ment within Somalia, relied on the same data from the UN Refugee Agency (UNHCR) we used to calibrate our simulator.62
In addition to uncertainty about baseline trends and the strength of drivers of displacement it is also difficult to predict future conditions in the region. For example, the level of future climate change is unknown and depends on effects outside the region. The influence of global climate change on local and regional rainfall patterns is also uncertain.
Future population trends and trends of urbanisation also add uncertainty. The Fifth Assessment Report of the Intergovernmental Panel on Climate Change (IPCC) states that “[m]ajor extreme weather events have in the past led to significant population displacement,” and that “changes in the incidence of extreme events will amplify the challenges and risks of such displacement. Many vulnerable groups do not have the resources to be able to migrate to avoid the impacts of floods, storms and droughts.”63 Based on “medium evidence” the IPCC identified a vicious cycle in which the negative impacts of climate change can increase the likelihood of future conflicts and that conflicts, in turn, can increase vul-nerability to climate shocks.64
Our response to this uncertainty is to, instead, study future scenarios, or combinations of scenarios. It is im-portant to remember that these scenarios are, in the case of displacement of pastoralists, a layer of uncertainty applied on top of uncertainty about current conditions and the relative strengths of driving factors. Thus un-certainty about the future compounds the already large uncertainty in this system.
VALIDATING THE MODEL AND BUILDING CONFIDENCE IN ITS RESULTS
A key component of the development of the Pastoralist Livelihood and Displacement Simulator was formalis-ing the causal relationships and drivers of pastoralist dis placement. From a literature review, fieldwork, interviews and data collection, we have constructed a systems view of rainfall, pasture/grazing land, pastoral-ist economics and displacement (Figure A.2). Generally speaking, less rainfall because of more droughts causes a decline in pasture productivity. The availability of less fodder in turn increases livestock mortality which shrinks the livestock population. The displacement of pastoralists increases during these periods when herd sizes reach the critical threshold necessary for sub-sistence, at which point pastoralists are (temporarily) unable to support their livelihoods.
Figure A.2 represents a high-level view of the key factors of the model, and how they can be influenced by natural and human factors. Each of these factors itself repre-sents a smaller system whose behaviour is influenced by many factors (Figure A.3). The Pastoralist Livelihood and Displacement Simulator incorporates the dynamics of these subsystems and the way that they interact to influence livelihoods and the behaviour of the variable of primary interest: the displacement of pastoralists.
In order to build a model with all of these elements, we looked for data to define the following important rela-tionships in the pastoralist system:
• between rainfall and displacement
• between rainfall and livestock population
• between livestock populations/livelihoods and dis-placement.
While we found data and reports shedding light on all three relationships, only the first two have high quali-ty data at this point in our research. In particular, the
61 Randall (op. cit.) notes that ethnic-minority pastoralists have been reluctant to divulge information about household size and livestock holdings due to a fear that this information could be used to reduce aid and/or increase taxes.
62 Robinson et al., op. cit. 63 Adger, W. N., Pulhin, J., Barnett, J., Dabelko, G.D., Hovelsrud, G.K., Levy, M., Oswald Spring, U., and Vogel, C. 2014. “Chapter 12. Human
Security.” In Climate Change 2014: Impacts, Adaptation, and Vulnerability IPCC Working Group II Contribution to AR5, Cambridge University Press, p.2. http://goo.gl/Ijinuu.
64 Ibid, p.3.
42 REPORT
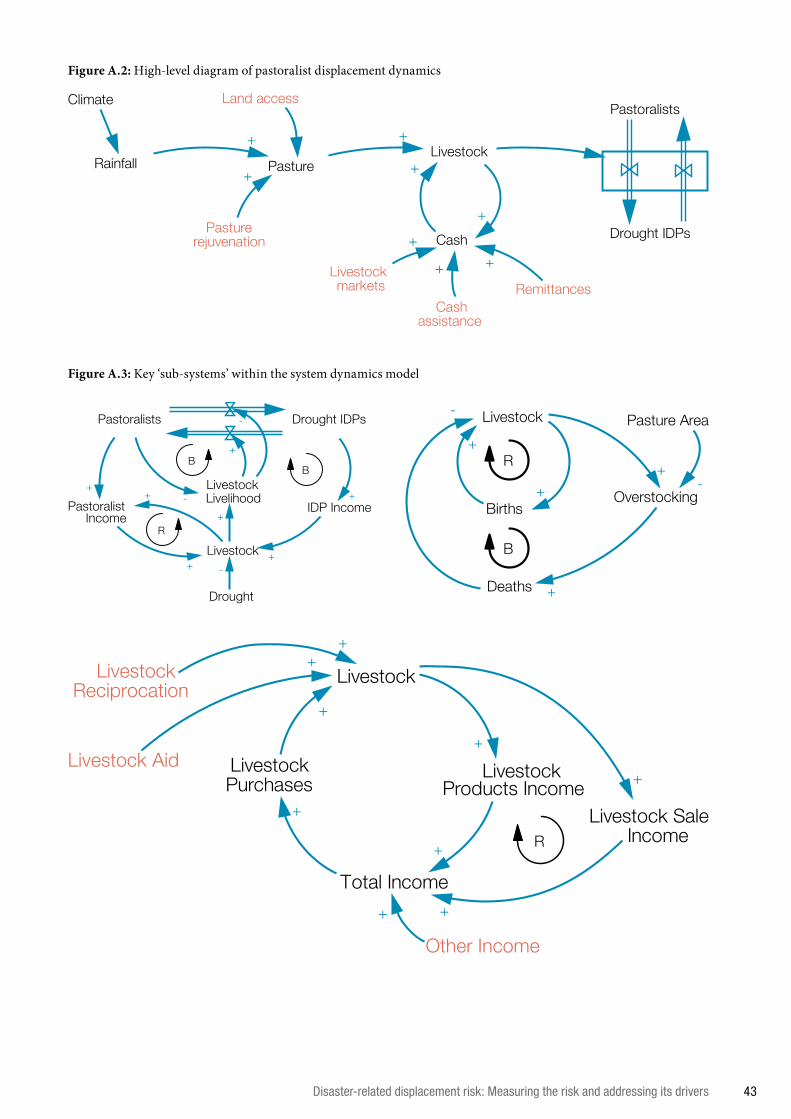
Figure A.2: High-level diagram of pastoralist displacement dynamics
Figure A.3: Key ‘sub-systems’ within the system dynamics model
Land access
PastureLivestock
Pastoralists
Drought IDPsCash
Rainfall
Climate
Pasturerejuvenation
Cashassistance
Remittances
++
+
+
+
+
+
Livestockmarkets
+
Livestock
Drought IDPsPastoralists
LivestockLivelihood
+-Pastoralist
IncomeIDP Income
+
+
+
+
+
Drought
-
B
R
-
+B
Livestock
BirthsOverstocking
Pasture Area
Deaths
+-
+
-
+
+R
B
LivestockProducts Income
Livestock SaleIncome
Livestock
Total Income
+
+
R
LivestockPurchases +
+
+
+
Other Income+
LivestockReciprocation
Livestock Aid
++
Disaster-related displacement risk: Measuring the risk and addressing its drivers 43
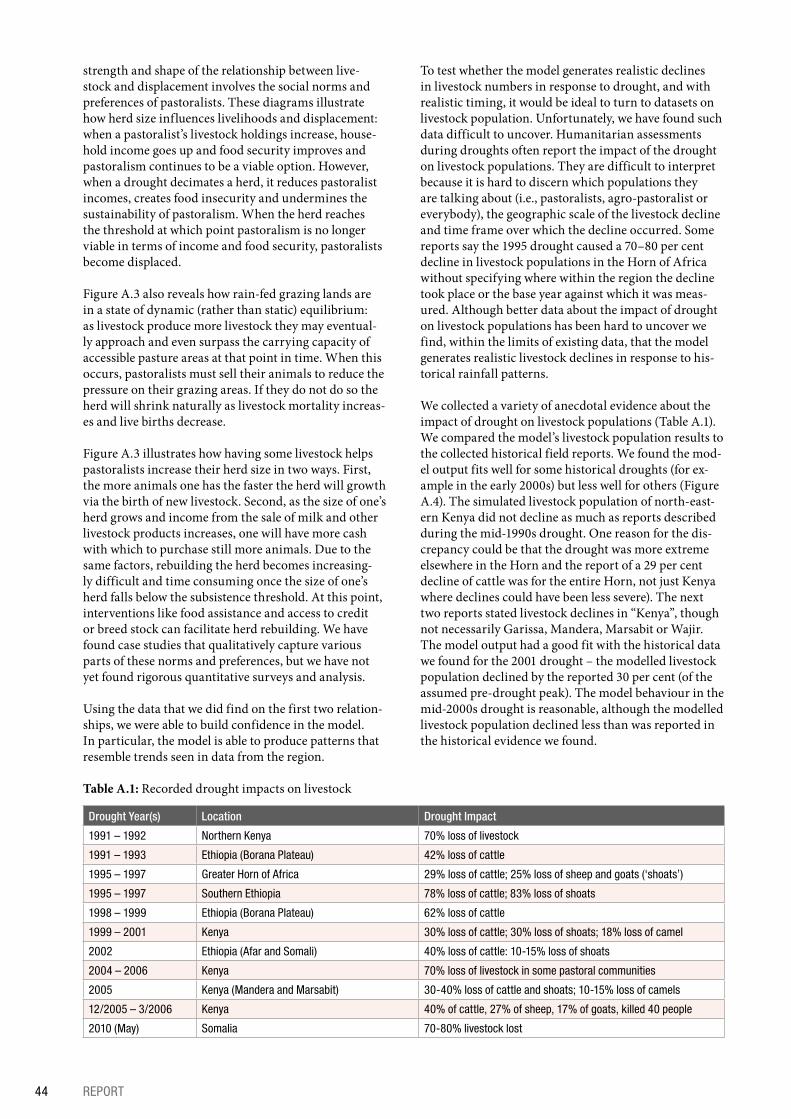
strength and shape of the relationship between live-stock and displacement involves the social norms and preferences of pastoralists. These diagrams illustrate how herd size influences livelihoods and displacement: when a pastoralist’s livestock holdings increase, house-hold income goes up and food security improves and pastoralism continues to be a viable option. However, when a drought decimates a herd, it reduces pastoralist incomes, creates food insecurity and undermines the sustainability of pastoralism. When the herd reaches the threshold at which point pastoralism is no longer viable in terms of income and food security, pastoralists become displaced.
Figure A.3 also reveals how rain-fed grazing lands are in a state of dynamic (rather than static) equilibrium: as livestock produce more livestock they may eventual-ly approach and even surpass the carrying capacity of accessible pasture areas at that point in time. When this occurs, pastoralists must sell their animals to reduce the pressure on their grazing areas. If they do not do so the herd will shrink naturally as livestock mortality increas-es and live births decrease.
Figure A.3 illustrates how having some livestock helps pastoralists increase their herd size in two ways. First, the more animals one has the faster the herd will growth via the birth of new livestock. Second, as the size of one’s herd grows and income from the sale of milk and other livestock products increases, one will have more cash with which to purchase still more animals. Due to the same factors, rebuilding the herd becomes increasing-ly difficult and time consuming once the size of one’s herd falls below the subsistence threshold. At this point, interventions like food assistance and access to credit or breed stock can facilitate herd rebuilding. We have found case studies that qualitatively capture various parts of these norms and preferences, but we have not yet found rigorous quantitative surveys and analysis.
Using the data that we did find on the first two relation-ships, we were able to build confidence in the model. In particular, the model is able to produce patterns that resemble trends seen in data from the region.
To test whether the model generates realistic declines in livestock numbers in response to drought, and with realistic timing, it would be ideal to turn to datasets on livestock population. Unfortunately, we have found such data difficult to uncover. Humanitarian assessments during droughts often report the impact of the drought on livestock populations. They are difficult to interpret because it is hard to discern which populations they are talking about (i.e., pastoralists, agro-pastoralist or everybody), the geographic scale of the livestock decline and time frame over which the decline occurred. Some reports say the 1995 drought caused a 70–80 per cent decline in livestock populations in the Horn of Africa without specifying where within the region the decline took place or the base year against which it was meas-ured. Although better data about the impact of drought on livestock populations has been hard to uncover we find, within the limits of existing data, that the model generates realistic livestock declines in response to his-torical rainfall patterns.
We collected a variety of anecdotal evidence about the impact of drought on livestock populations (Table A.1). We compared the model’s livestock population results to the collected historical field reports. We found the mod-el output fits well for some historical droughts (for ex-ample in the early 2000s) but less well for others (Figure A.4). The simulated livestock population of north-east-ern Kenya did not decline as much as reports described during the mid-1990s drought. One reason for the dis-crepancy could be that the drought was more extreme elsewhere in the Horn and the report of a 29 per cent decline of cattle was for the entire Horn, not just Kenya where declines could have been less severe). The next two reports stated livestock declines in “Kenya”, though not necessarily Garissa, Mandera, Marsabit or Wajir. The model output had a good fit with the historical data we found for the 2001 drought – the modelled livestock population declined by the reported 30 per cent (of the assumed pre-drought peak). The model behaviour in the mid-2000s drought is reasonable, although the modelled livestock population declined less than was reported in the historical evidence we found.
Table A.1: Recorded drought impacts on livestock
Drought Year(s) Location Drought Impact
1991 – 1992 Northern Kenya 70% loss of livestock
1991 – 1993 Ethiopia (Borana Plateau) 42% loss of cattle
1995 – 1997 Greater Horn of Africa 29% loss of cattle; 25% loss of sheep and goats (‘shoats’)
1995 – 1997 Southern Ethiopia 78% loss of cattle; 83% loss of shoats
1998 – 1999 Ethiopia (Borana Plateau) 62% loss of cattle
1999 – 2001 Kenya 30% loss of cattle; 30% loss of shoats; 18% loss of camel
2002 Ethiopia (Afar and Somali) 40% loss of cattle: 10-15% loss of shoats
2004 – 2006 Kenya 70% loss of livestock in some pastoral communities
2005 Kenya (Mandera and Marsabit) 30-40% loss of cattle and shoats; 10-15% loss of camels
12/2005 – 3/2006 Kenya 40% of cattle, 27% of sheep, 17% of goats, killed 40 people
2010 (May) Somalia 70-80% livestock lost
44 REPORT
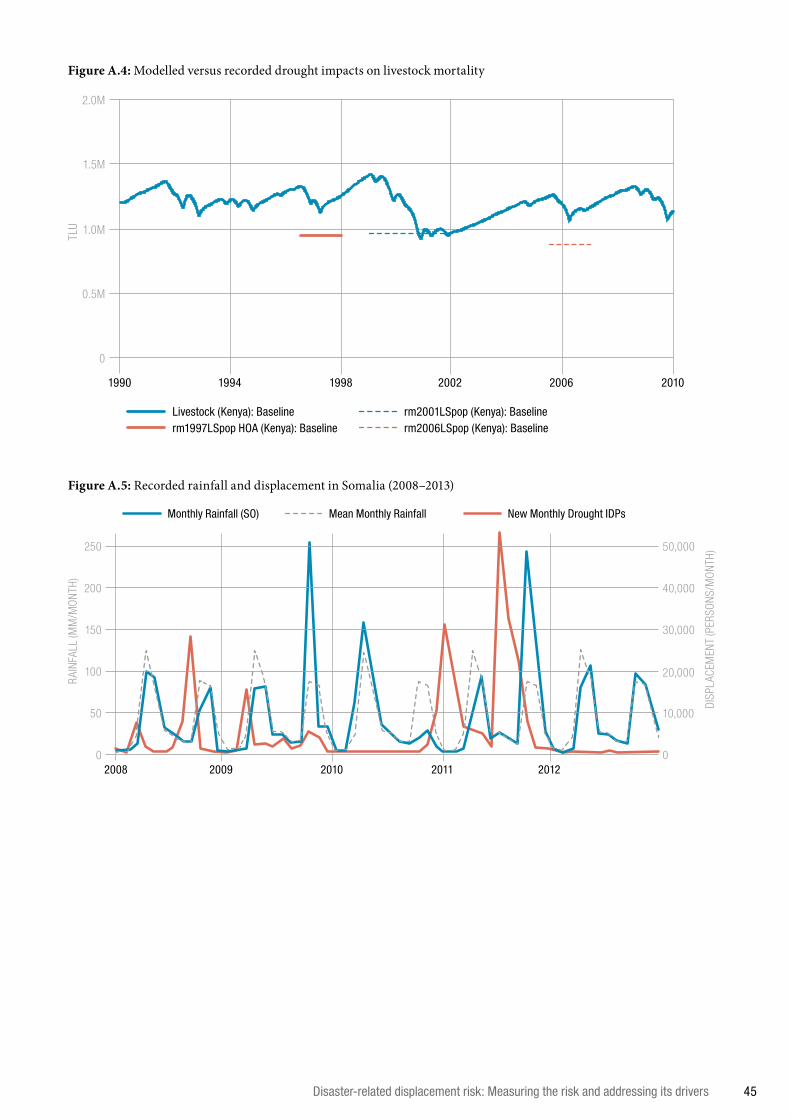
Figure A.4: Modelled versus recorded drought impacts on livestock mortality
Figure A.5: Recorded rainfall and displacement in Somalia (2008–2013)
1994 1998 2002 2006 20101990
Livestock (Kenya): Baselinerm1997LSpop HOA (Kenya): Baseline
rm2001LSpop (Kenya): Baselinerm2006LSpop (Kenya): Baseline
2.0M
TLU
1.5M
1.0M
0.5M
0
2009 2010 2011 20122008
Monthly Rainfall (SO) Mean Monthly Rainfall New Monthly Drought IDPs
RAIN
FALL
(MM
/MON
TH)
DISP
LACE
MEN
T (P
ERSO
NS/M
ONTH
)250 50,000
200 40,000
150 30,000
100 20,000
50 10,000
0 0
Disaster-related displacement risk: Measuring the risk and addressing its drivers 45
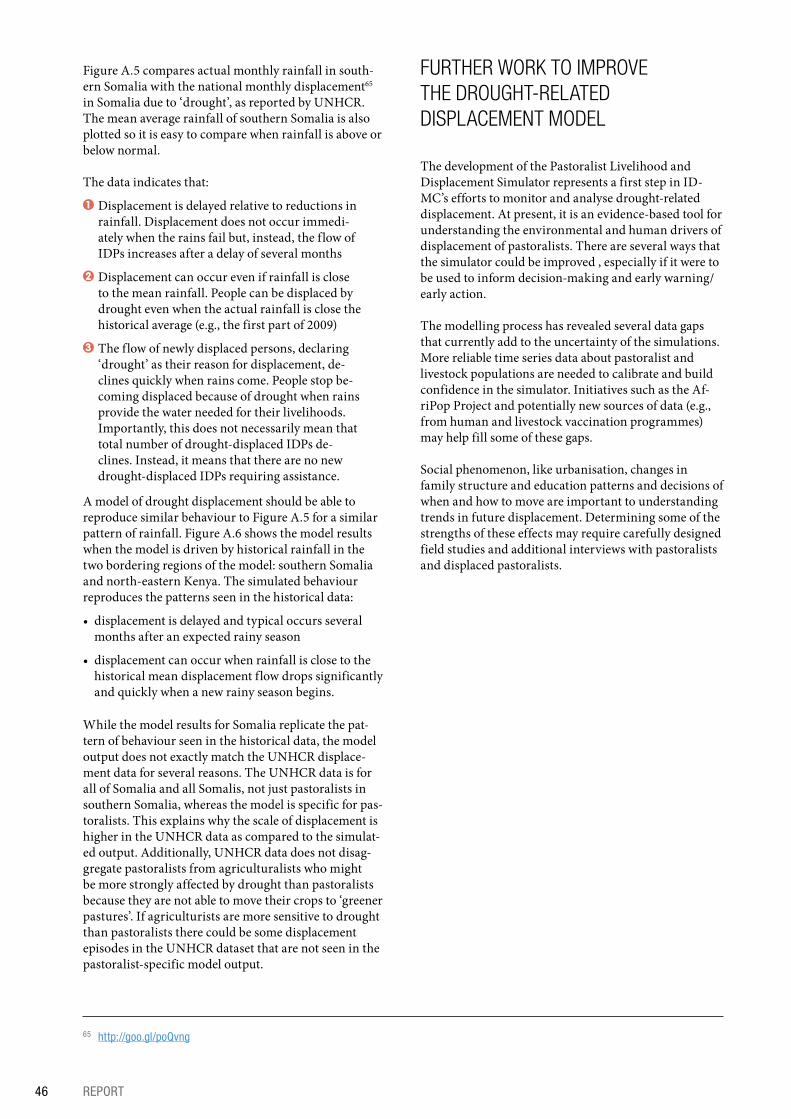
Figure A.5 compares actual monthly rainfall in south-ern Somalia with the national monthly displacement65 in Somalia due to ‘drought’, as reported by UNHCR. The mean average rainfall of southern Somalia is also plotted so it is easy to compare when rainfall is above or below normal.
The data indicates that:
1 Displacement is delayed relative to reductions in rainfall. Displacement does not occur immedi-ately when the rains fail but, instead, the flow of IDPs increases after a delay of several months
2 Displacement can occur even if rainfall is close to the mean rainfall. People can be displaced by drought even when the actual rainfall is close the historical average (e.g., the first part of 2009)
3 The flow of newly displaced persons, declaring ‘drought’ as their reason for displacement, de-clines quickly when rains come. People stop be-coming displaced because of drought when rains provide the water needed for their livelihoods. Importantly, this does not necessarily mean that total number of drought-displaced IDPs de-clines. Instead, it means that there are no new drought-displaced IDPs requiring assistance.
A model of drought displacement should be able to reproduce similar behaviour to Figure A.5 for a similar pattern of rainfall. Figure A.6 shows the model results when the model is driven by historical rainfall in the two bordering regions of the model: southern Somalia and north-eastern Kenya. The simulated behaviour reproduces the patterns seen in the historical data:
• displacement is delayed and typical occurs several months after an expected rainy season
• displacement can occur when rainfall is close to the historical mean displacement flow drops significantly and quickly when a new rainy season begins.
While the model results for Somalia replicate the pat-tern of behaviour seen in the historical data, the model output does not exactly match the UNHCR displace-ment data for several reasons. The UNHCR data is for all of Somalia and all Somalis, not just pastoralists in southern Somalia, whereas the model is specific for pas-toralists. This explains why the scale of displacement is higher in the UNHCR data as compared to the simulat-ed output. Additionally, UNHCR data does not disag-gregate pastoralists from agriculturalists who might be more strongly affected by drought than pastoralists because they are not able to move their crops to ‘greener pastures’. If agriculturists are more sensitive to drought than pastoralists there could be some displacement episodes in the UNHCR dataset that are not seen in the pastoralist-specific model output.
FURTHER WORK TO IMPROVE THE DROUGHT-RELATED DISPLACEMENT MODEL
The development of the Pastoralist Livelihood and Displacement Simulator represents a first step in ID-MC’s efforts to monitor and analyse drought-related displacement. At present, it is an evidence-based tool for understanding the environmental and human drivers of displacement of pastoralists. There are several ways that the simulator could be improved , especially if it were to be used to inform decision-making and early warning/early action.
The modelling process has revealed several data gaps that currently add to the uncertainty of the simulations. More reliable time series data about pastoralist and livestock populations are needed to calibrate and build confidence in the simulator. Initiatives such as the Af-riPop Project and potentially new sources of data (e.g., from human and livestock vaccination programmes) may help fill some of these gaps.
Social phenomenon, like urbanisation, changes in family structure and education patterns and decisions of when and how to move are important to understanding trends in future displacement. Determining some of the strengths of these effects may require carefully designed field studies and additional interviews with pastoralists and displaced pastoralists.
65 http://goo.gl/poQvng
46 REPORT
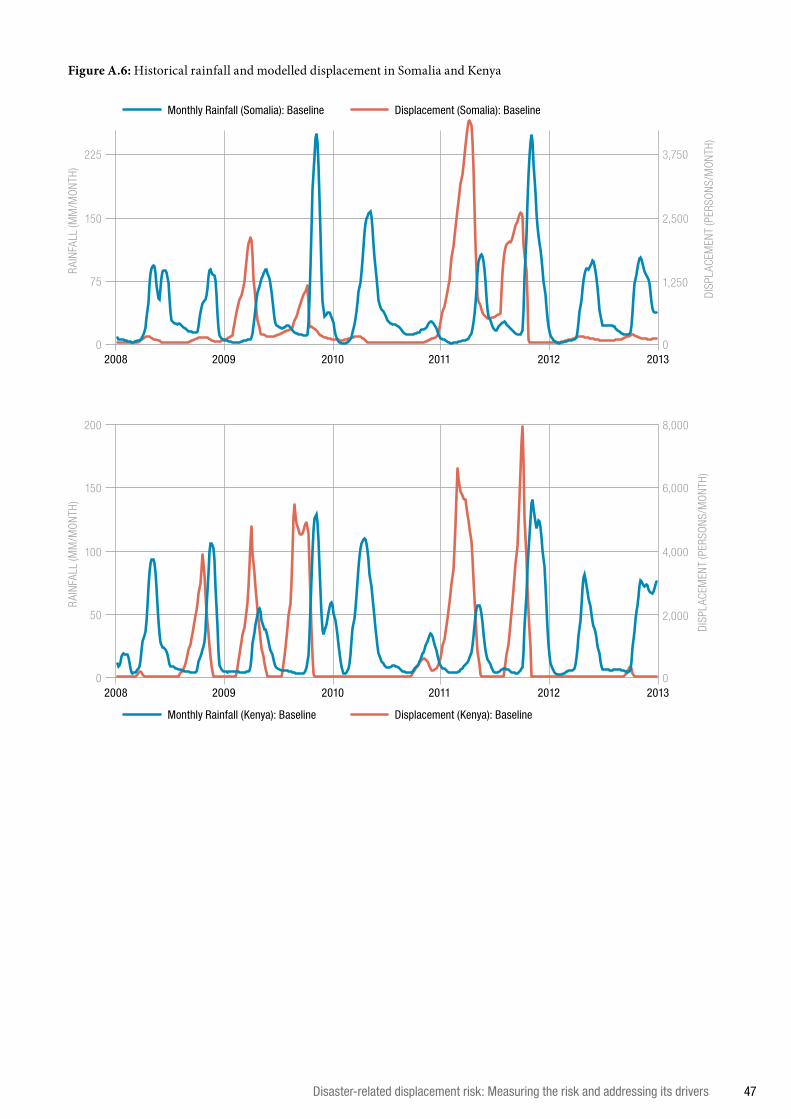
Figure A.6: Historical rainfall and modelled displacement in Somalia and Kenya
2009 2010 2011 2012 20132008
Monthly Rainfall (Somalia): Baseline Displacement (Somalia): Baseline
RAIN
FALL
(MM
/MON
TH)
DISP
LACE
MEN
T (P
ERSO
NS/M
ONTH
)
225 3,750
150 2,500
75 1,250
0 0
2009 2010 2011 2012 20132008
Monthly Rainfall (Kenya): Baseline Displacement (Kenya): Baseline
200 8,000
RAIN
FALL
(MM
/MON
TH)
DISP
LACE
MEN
T (P
ERSO
NS/M
ONTH
)
150 6,000
100 4,000
50 2,000
0 0
Disaster-related displacement risk: Measuring the risk and addressing its drivers 47
This is a multi-partner project funded by the European Commission (EC) whose overall aim is to address a legal gap regarding cross-border displacement in the context of disasters. The project brings together the expertise of three distinct partners (UNHCR, NRC/IDMC and the Nansen Initiative) seeking to:
1 > increase the understanding of States and relevant actors in the international community about displacement related to disasters and climate change;
2 > equip them to plan for and manage internal relocations of populations in a protection sensitive manner; and
3 > provide States and other relevant actors tools and guidance to protect persons who cross international borders owing to disasters, including those linked to climate change.