Embed Size (px)
Citation preview
BIOL 3034 Lab report Jessica Denning 25300792
1
Has parallel domestication occurred
between Aubergine and Tomato in shape
and colour traits?
BIOL 3034 Long Lab Report
Jessica Denning 25300792
BIOL 3034 Lab report Jessica Denning 25300792
2
Lay Summary
The process of domestication involves altering the physical attributes of plants and animals
to best suit our provisional human needs. The species of crops that we consume today look
significantly different from those that our ancestors would have initially come across, many
of which would have been inedible. Plants and animals would have originally evolved to have
the highest fitness for the environment that they lived in. They would have only been under
environmental selection pressures i.e. the species best adapted to dry environments under
dry conditions would have thrived and reproduced where others that were not as well
adapted to those conditions could have died out and been removed from the gene pool had
the selection pressure been strong enough.
During the process of domestication humans shaped plants and animals through breeding
them with characteristics to meet their needs as well as being able to thrive under their
environmental conditions. Selecting characteristics to improve crops and animals for our own
consumption is termed artificial selection. It is thought artificial selection began around
10,000 years ago in an area of the Middle East called the Fertile Crescent where the first
evidence of agriculture has been discovered. It has become evident that there are certain
characters that have been selected for in modern cultivars across species such as large fruit
and seed size, loss of natural seed dispersal, pod shattering and reduced branching of plants;
it is this set of attributes that characterise domestication syndrome.
Most fruiting plants (the angiosperms) rely on animals to disperse their fruit and seeds so that
their offspring may grow in an uncrowded environment, because of this requirement they
have developed a mutualistic relationship with animals to carry out their reproductive cycle.
This meant most ancestral crop fruits and seeds were originally small and round as they had
to be easy to carry by animals. Some ancestral plants such as aubergine’s produced spines on
their stems and leaves which although deters predators such as herbivores it makes
harvesting them in large quantities by hand more difficult, so when a chance mutation
occurred where they did not have them that character would have been selected for and bred
into the population, this is the principal of domestication by artificial selection.
BIOL 3034 Lab report Jessica Denning 25300792
3
This project has attempted to identify genes involved in domestication syndrome in tomatoes
and compare them to the aubergine genome in order to determine if the same characters
have been selected for in both species, this would infer if parallel domestication has occurred.
Four genes sequenced from tomato were successfully sequenced in aubergine. Identical
colour polymorphisms were found in aubergine in the genes 3GT and DFR, and shape
polymorphisms found in OVATE, suggesting it is possible that parallel domestication has
occurred.
Abstract
In recent years there have been huge advances in genetic sequencing and mapping
techniques which has enabled us to generate a much deeper understanding of evolutionary
processes. Domestication has led to rapid evolutionary changes in both animals and plants
and recent studies have been able to identify and locate the artificially selected genes that
have given rise to the phenotypes that characterise our food crops.
Through these studies it has become evident that in some cases a pattern of parallel
domestication has occurred where the same genes have been conserved in different species.
Solanaceous species seem to have conserved several genes relating to domestication; for
example in aubergine 43% of the QTL for fruit weight, shape and colour have orthologues in
tomato, potato and pepper.
This project has examined genes involved in fruit shape and colour in the aubergine in order
to determine if they share polymorphic correlations between alleles and phenotype with
tomato. This would indicate that at some stage they have both been subjected to parallel
domestication where the same characters have been artificially selected in both species. It
was found that the genes DFR, 3GT, 5GT and OVATE had been conserved in aubergine and
that there were colour and shape polymorphisms present. This indicates these genes may
have similar roles in tomato as aubergine which supports the evidence found in prior studies
suggesting parallel domestication may have occurred.
BIOL 3034 Lab report Jessica Denning 25300792
4
Contents Page
1. List of abbreviations 5 2. List of tables and figures 5 3. Introduction - review of the literature 6
3.1 How, when and where did domestication arise 6 3.2 Why was domestication successful 7 3.3 Domestication syndrome 7 3.4. Domestication syndrome in tomato 8 3.5. The genetics of seed shattering 9 3.6. The genetics of reduced branching 9 3.7. Anthocyanins and domestication 10 3.8. Domestication syndrome in animals 11 3.9. Studying domestication using polymorphisms 11 3.10. Evidence of recent domestication 12 3.11. Parallel domestication 13 3.12. Selective Sweeps under strong selection pressures 14 3.13. Aims, hypotheses and Acknowledgements 14
4. Materials and Methods 15
4.1. PCR Primer design 15 4.2. DNA extractions 16 4.3. Calculating DNA concentrations 16 4.5. PCR 17 4.6. Sequence analysis 18
5. Results 19 5.1 Identification of Polymorphisms 20 5.2 Identification of the coding region and amino acid changes 21 6. Discussion 23 6.1. Relation of DFR expression to colour pigment 23 6.2. Relation of OVATE expression to round fruit phenotypes 23 6.3. Relation of 3FT expression to fruit pigmentation 24 6.4. Does my data support colour and shape phenotypes? 25 and does it show evidence of parallel domestication? 6.5 Limitations and further study 27
7. References 28
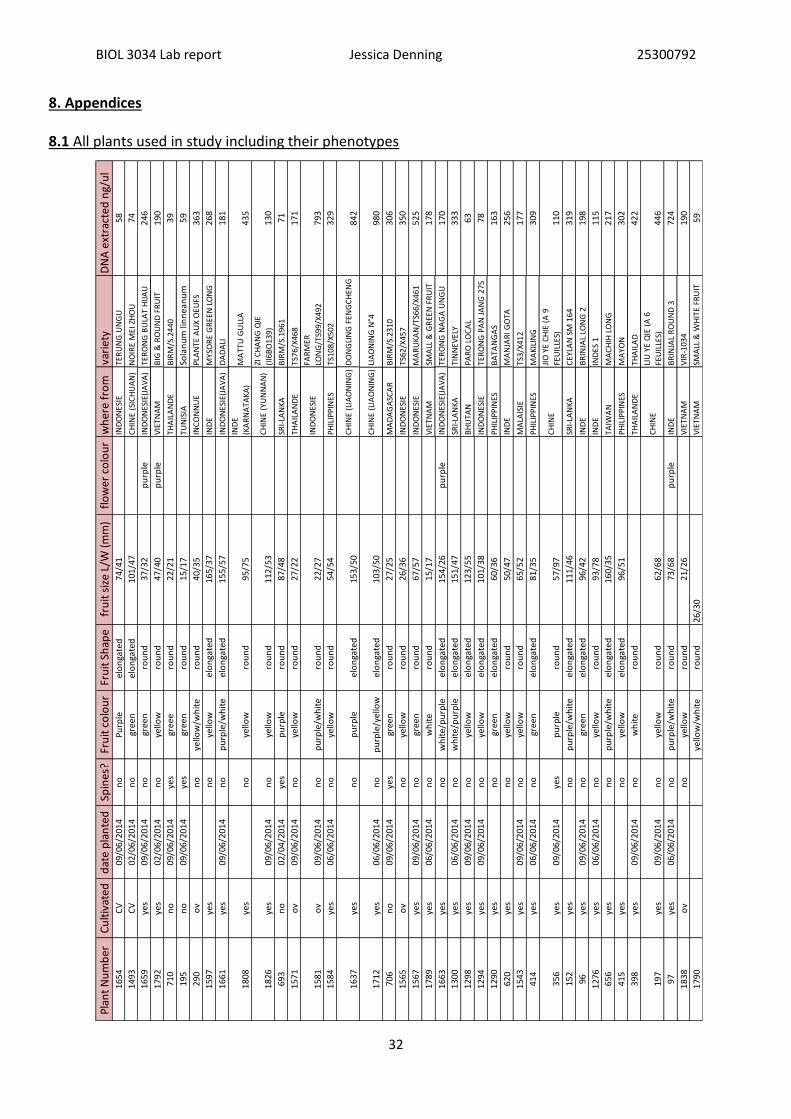
8. Appendices 32 8.1 All plants used in study 32
8.2 All identified polymorphisms and alleles 33
BIOL 3034 Lab report Jessica Denning 25300792
5
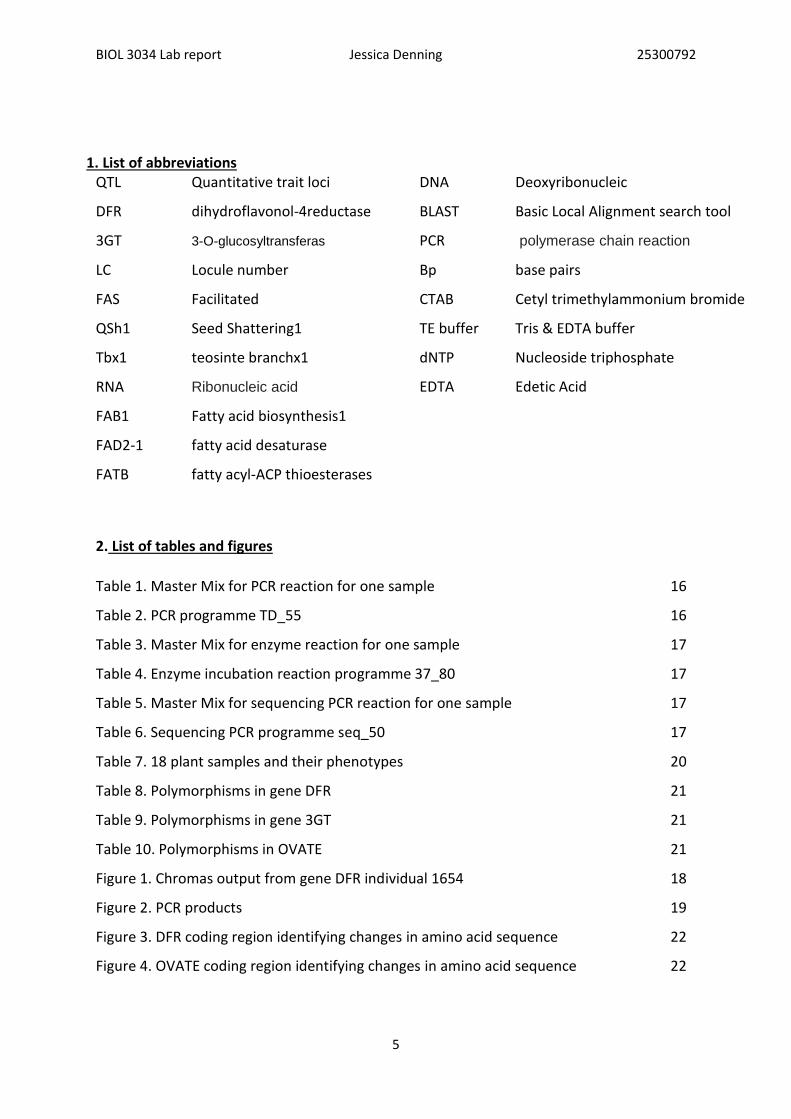
1. List of abbreviations
QTL Quantitative trait loci
DFR dihydroflavonol-4reductase
3GT 3-O-glucosyltransferas
LC Locule number
FAS Facilitated
QSh1 Seed Shattering1
Tbx1 teosinte branchx1
RNA Ribonucleic acid
FAB1 Fatty acid biosynthesis1
FAD2-1 fatty acid desaturase
FATB fatty acyl-ACP thioesterases
DNA Deoxyribonucleic
BLAST Basic Local Alignment search tool
PCR polymerase chain reaction
Bp base pairs
CTAB Cetyl trimethylammonium bromide
TE buffer Tris & EDTA buffer
dNTP Nucleoside triphosphate
EDTA Edetic Acid
2. List of tables and figures
Table 1. Master Mix for PCR reaction for one sample 16
Table 2. PCR programme TD_55 16
Table 3. Master Mix for enzyme reaction for one sample 17
Table 4. Enzyme incubation reaction programme 37_80 17
Table 5. Master Mix for sequencing PCR reaction for one sample 17
Table 6. Sequencing PCR programme seq_50 17
Table 7. 18 plant samples and their phenotypes 20
Table 8. Polymorphisms in gene DFR 21
Table 9. Polymorphisms in gene 3GT 21
Table 10. Polymorphisms in OVATE 21
Figure 1. Chromas output from gene DFR individual 1654 18
Figure 2. PCR products 19
Figure 3. DFR coding region identifying changes in amino acid sequence 22
Figure 4. OVATE coding region identifying changes in amino acid sequence 22
BIOL 3034 Lab report Jessica Denning 25300792
6
3. Introduction
3.1. How, when, and where did domestication arise?
The development of agriculture has been one of the most significant shapers of modern
civilisation our species has experienced. The crops produced as a result of domestication
which started around 10,000 years ago still feed the world’s population today. (Doganlar et
al., 2002; Doebley & Gaut, 2006). It is thought that farming could not have arisen consciously
(Diamond, 2002), the first farmers would have had no way of learning the functional trait that
enabled agricultural skills from anything or anyone else. It may have been a behavioural trait,
an evolved skill, with no goal orientation of domestication. The first evidence of agriculture
was found at the Fertile Crescent, a highly fertile area in the Middle East surrounding Syria
and Jordan; however this is now being reviewed as evidence suggests that a multi-regional
model of domestication is more likely. The multi-regional model suggests that farming arose
several times independently in different parts of the world leading to convergent evolution.
(Brown et al., 2009). It is likely farming arose in areas only where there were high abundances
of progenitor crops such as teosinte the ancestor of maize. It has been suggested only in these
areas of high density progenitor species that farming was able to out- compete the traditional
hunter-gathering lifestyle that up until that point had been the dominant life-history strategy
for human beings (Doganlar et al., 2002).
The Fertile Crescent has produced several progenitors of modern crops and animals including
wheat, barley, peas, sheep and goats and emerged as the first real centre of agriculture
around 8,500 years ago. There are however a further eight proposed regions that arose
independently; China, Mesoamerica, Andes/Amazonia, Eastern United States, Sahel tropical
West Africa, Ethiopia and New Guinea which gives supporting evidence to the multi-regional
theory. The Fertile Crescent community spread their genetics and knowledge, subsequently
migrating to areas like Italy and Greece which may not have otherwise developed agriculture
and the early great civilisations would not have been as successful as they were (Doganlar et
al., 2002).
In order for a living and evolving system to have remained viable for so long, continued and
successful domestication would have involved generating genetic diversity by selection both
natural and artificial (Brush, 2000). Artificial selection has been one of the main drivers of
BIOL 3034 Lab report Jessica Denning 25300792
7
domestication through the ages as it involves selecting the plants we wish to breed into the
future based on the genetic traits they possess best meeting our needs and wants as a
consumer. We could infer that early domestication probably focussed mostly on fruit or grain
size and stem strength to support the enlarged fruit as most wild species relying on animal
dispersal had very small fruit that would have not been adequate for human consumption
other than in large quantities.
3.2 Why was domestication successful?
Farming led to the formation of settlements; despite these causing higher levels of infectious
diseases due to population explosion and overcrowding agriculture remained the dominant
way of life. These farming settlements increased the available food to early populations
leading to an increase in carrying capacity. This life history strategy also gave rise to
technology; sedentary living allowed the pooling of ideas and the creation of technology that
could not be carried by nomadic people e.g. forges that allowed for the further development
of agriculture by creating advanced tools. Farming enabled food surplus that could feed full
time inventors, but also lead to the formation of social stratification creating social politics
(Doganlar et al., 2002). It was these advantages that gave the agriculture and domestication
of wild species the evolutionary advantage over the hunter gatherer strategy.
3.3 Domestication syndrome
Modern cultivars differ greatly from their wild progenitors, they typically have more robust
stems, larger fruit and do not shed their seeds (Doebley et al., 2006). The production of fruit
and flowers is the fundamental way in which plants reproduce and which has led to the great
success of the angiosperms (Midgley et al., 1991). The floral meristem produces both male
(the stamen) and female plant organs (petals, sepals, and pistil), fertilisation of the ovules by
pollen stimulates fruit development. (Monforte et al., 2013). The fruit produced by the plant
contains the seeds, these require dispersing and that is where the mutualistic relationship
between plants and animals arose (Schupp, 1993); therefore originally wild progenitor fruits
would have needed to be small enough to be carried potentially long distances by animals but
be large and colourful enough to attract them (Frary et al., 2000). Dispersal of seeds is
important for all plants, it reduces crowding of the natal environment and also helps prevents
inbreeding. Large fruit in the wild progenitor populations would not have been advantageous
BIOL 3034 Lab report Jessica Denning 25300792
8
for dispersal, however it was maximised during the domestication process for human
consumption (Monforte, et al., 2013).
Domestication is defined as the selective breeding of species by humans in order to
accommodate human needs (Allaby, 2009). Early domestication involved increased seed or
fruit size, more flowering, reduced branching, suppression of natural seed dispersal and the
loss of seed dormancy (Burke et al., 2007). Reducing the energy used to grow surplus
branches increases the amount available for fruit and seed production which could have
facilitated the growth of larger fruit. Increasing the fruit and seed size from small wild varieties
meant one plant could provide more nutrition to more people, these traits would have
enabled humans to increase their own fitness and so would have been selected for.
Supressing natural seed dispersal would have also been important, having the seed remain
on the plant would have increased ease of harvest as well as reducing spoilage and increasing
yield. These archetypal changes have been characterised as ‘domestication syndrome’
(Poncet, et al., 2004).
Current consensus suggests that there have been two stages of domestication, one initial
stage followed by a current and ongoing stage of improvement. For example plants selected
with disease and pest resistance, increased yield and nutritional value like the biofortification
of rice with vitamin A (golden rice) (Paine et al., 2005) and also for drought intolerance would
be going through the second phase of domestication.
3.4. Domestication syndrome in tomato
The tomato is one of the most well studied crops, through domestication it has reached a size
that is over several times larger than its progenitor Solanum pimpinellifolium which measures
less than 1cm across and weighed only a few grams (Monforte et al., 2013). Many studies
have been conducted in attempts to identify and clone the genes that underlie the phenotypic
changes in domesticated crops. Changes in tomato fruit shape have been accounted for by
mutational changes to four genes: SUN and OVATE regulate fruit elongation and LC and FAS
determine the locule number and flat fruit shape respectively (Rodriguez et al., 2011; Liu &
Van Eck, 2002).
BIOL 3034 Lab report Jessica Denning 25300792
9
Fw2.2 was found responsible for changes in fruit weight by up to 30%, it is thought that the
effect is caused by ORFX which is expressed early on in floral development as this gene
controls the number of cells present in the carpals (Frary et al., 2000). This suggests that it is
not just fw2.2 that is responsible for their gigantic size Cong et al. (2008) imply two QTLs, LC
and FAS both affect carpel number rather than size and this in turn could increases fruit size
by up to 50%
3.5. The genetics of seed shattering
The prevention of seed shattering would have been fundamental to early domestication, it
would have made harvesting more efficient and also prevented the seeds from damage as
well as increasing yield (Zhongwei et al., 2012). Taking away cereals natural seed shedding
ability would have made them very dependent on humans for seed dispersal which is another
trait associated with domestication syndrome. The genes responsible for seed shattering have
been identified in a select few cereals: Qsh1 and Sh4 have been cloned from rice and recently
the Sh1 gene has been cloned from several cereals including wheat.
Studies show that even though many of the early progenitors of cereal cultivars were
domesticated in different regions globally they share the same conserved genes (Patterson et
al., 2005). The recently identified Sh1 gene possibly has the most orthologues, initially
sequenced from sorghum, rice has ortholog OsSh1 and there are structural variations in Maize
(ZmSh1-1 and ZmSh1-5.1+ZmSh1-5.2) (Zhongwei et al., 2012). The evidence from these
studies does suggest that parallel evolution did occur during domestication due to selection.
It would depend of course on each species having the same genes to be conserved in the first
place, or being in similar conditions that would encourage similar mutations and the
development of similar traits.
3.6. The genetics of reduced branching.
The cultivar maize and its progenitor teosinte are so vastly different and it its thought that
this drastic alteration in plant architecture is controlled by five loci with major effect genes.
(tbx1) corresponds to one of these loci and has been found to effect the apical dominance;
this causes the lower buds on the stem to fail to form resulting in less branching. Although
the gene is expressed in both the cultivar and the progenitor it is shown that there is a greater
amount of tbx1 RNA in maize and higher expression in certain parts of the plant which may
BIOL 3034 Lab report Jessica Denning 25300792
10
cause such major variation. The gene teosinte glume architecture has also been described
and interacts with tbx1 and is involved in the growth of the stalk and the orientation of the
floral bract (Kellogg, 1997). These genes would most likely have been selected for because a
plant that produces fewer branches and has more energy for producing fruit, less branching
also reduces shading and allows plants to be planted closer together all of which are
advantageous for producing higher yielding plants.
3.7. Anthocyanins and domestication
Anthocyanins are flavonoid compounds that control pigment and have been shown to be vital
to plant growth and development. Colour creates a visual target attracting pollinating insects
and animals to aid in seed dispersal (Vogt et al., 1994). The evolution of this mutualistic
relationship with insects and animals has led to the angiosperms becoming the dominant
plant species on Earth (Crepet & Niklas 2008) and anthocyanins have played a pivotal role in
the development of this important relationship. Anthocyanins protect plants from the
damage of ultra violet light irradiation, insect attack and pathogen infection (Li et al., 2014).
This role would have been vital during domestication along with a robust immune response
as there were no pesticides which we rely heavily on today due to the high pest prevalence
within monocultures.
Around 35% of crop plants globally rely on insect and animal pollination and throughout
domestication ancestral varieties would have also (Winifree et al., 2011). Maintaining species
genetic diversity so that they maintained or enhanced the level of pigmentation in their
flowers and fruit would have been very advantageous to ensure that crops continued to have
a high fertilisation rate and produced high yields.
Anthocyanins clearly have a role in biotic environmental plant interactions however a recent
study identified the role of DFR in abiotic stress tolerance. It was found that anthocyanin
biosynthesis increased under stress conditions and that miR156-SPL9 may directly influence
anthocyanin biosynthesis through DFR. Blocking anthocyanin biosynthesis increased the
sensitivity of the plants to salt and drought stress. DFR then is an important part of the
anthocyanin pathway for surviving abiotic stress (Cui, et al., 2014). It is likely that abiotic stress
such as drought would put strong selection pressure on plants and so it is likely that DFR may
have been conserved across domesticated species because of this.
BIOL 3034 Lab report Jessica Denning 25300792
11
Interesting work with poplar under elevated CO2 conditions has discovered an up regulation
in anthocyanin production with DFR upregulating by 39%. This work was in response to
studies looking at senescence in late autumn of trees. It was found that increasing levels of
anthocyanin production due to elevated CO2 conditions was the likely cause of a prolonged
growing season; in domesticated crops this could increase yields and the shelf life of the
commercial product which would be very beneficial. Up-regulation of anthocyanins also
increased the levels of antioxidants produced by the plant reducing oxidative damage and
prolonging the life of the plant (Tallis et al., 2010). Raised antioxidant activity has been found
present in fruiting plants such as Vaccinium uliginosum L. that have high anthocyanin content
(Wang, et al., 2014). Not only do anthocyanins potentially have a role in prolonging growing
seasons and the shelf life of the fruit but many studies have shown that high levels of
flavonoids in grapes, cranberries and blackcurrants can have benefits to human health
including having anti-inflammatory and anti-cancer properties so selecting for anthocyanin
content would have been very advantageous (Pietta, 2000).
3.8 Domestication syndrome in animals
The domestication syndrome characterised by domesticated animals tended to be the
opposite in most respects to plants. Herders would have wanted animals smaller than their
progenitors that were easy to handle and less aggressive. The domestication of animals was
thought to have also occurred in the Fertile Crescent with goats and sheep around 1000 years
after crop domestication began. With emphasis on breeding herds archaeological evidence
suggests that it was mainly females that were culled beyond their fertile years and much like
today there were few males as surpluses were not needed for breeding (Zeder, 2008). It
seems although we now have access to technology that enables greater speed and
understanding of the principals underlying domestication, the traits that we have been
selecting for over generations has changed very little.
3.9. Studying domestication using polymorphisms
There are ways of testing for selection that do not require complex genetic mapping but which
instead involve polymorphism (Chapman, et al., 2013). Strong selection can reduce patterns
of diversity among populations of crop plants for example molecular markers exhibit a
reduced state of polymorphism compared to wild gene pools. Once identified this data can
BIOL 3034 Lab report Jessica Denning 25300792
12
be applied to sequence data and loci under selection can be discovered. It becomes evident
that genes that have undergone positive or directional selection show a greater than
expected loss in diversity between progenitor and cultivar specimens. This can be measured
using a ML-HKA program as used by (Chapman et al., 2013). This analysis uses maximum
likelihood analysis on multi-locus polymorphism and divergence data and tests for natural
selection in genes you are interested in.
3.10. Evidence of recent domestication
Work on sunflower genetics has shown evidence of recent secondary domestication, the
second phase of improvement and refinement. Using phylogenetic studies it is possible to
test for selection and whether it occurred before/during domestication or in the subsequent
improvement stage. In a study by Chapman et al. (2012) fatty Acid biosynthesis genes were
used for comparison and it was found that four of the five analysed (FAB1, FAD2-1, FAD6, and
FATB) only showed selection in the improved–outgroup comparison only; this would suggest
that these genes were fixed more recently as part of the improvement process of
domestication due to the increased demand for sunflower oil. As our needs have changed
over the previous 10,000 years of agriculture, plants have been selected to meet that change
which is why we see both ancient and more recent traces of domestication.
Domestication much like evolution is a continuing process we are always looking for ways of
breeding a better plant and now with greater scientific understanding of genetics we are able
to do this at an accelerated rate which means more useful traits are being recognised and
fixed quickly. Improving cultivars requires selection of mutations that may have arisen
naturally or by genetic manipulation (Paran & Van der Knaap, 2007). A mutation that has
arisen through natural means recently is the delayed fruit deterioration (DFD) in the tomato.
The delayed deterioration is due to the reduction of water loss in the ripe fruit. This trait is
thought to be displayed phenotypically because of a change in the chemical composition of
the cuticle (Saladie et al., 2007). This trait will be valuable in increasing the longevity of the
harvested fruit which is important in terms of its commerciality as some fruits travel long
distances which takes time before they are eventually consumed.
BIOL 3034 Lab report Jessica Denning 25300792
13
3.11. Parallel Domestication
One of the major questions that science is unravelling at present is if the same genes are
responsible across species for causing the domestication syndrome, i.e. do the same genes
underlie the same phenotypic changes? QTL is a statistical analysis that enables the
comparison of genes with phenotypic traits (Miles, & Wayne, 2008). Its aim is to discover the
cause of variation in specific traits and to also discover if a few major QTL are responsible for
the majority of genetic change, or whether several QTL are responsible for only a few changes.
As comparative QTL studies and fine mapping techniques have improved light has been
gradually shed on these theories. In some species it is thought that only a few major genes
can alter phenotypes (Doganlar et al., 2002) enabling plants which were inedible to us
previously to be made very useful. Being able to identify these genetic traits could conceivably
allow us help people thrive in areas where agriculture is extremely difficult or unprofitable.
FThis will be increasingly important as the effects of climate change are realised and areas
like Southern Europe and Africa struggle to maintain yields under high drought conditions.
Comparative QTL studies have revealed some interesting results when investigating parallel
domestication. The Solanacaea family which includes the eggplant, pepper, tomato and
potato contain several orthologues relating to domestication syndrome. These genes have
been conserved despite the potato being domesticated on a completely different continent
(Doganlar, et al., 2002). The three QTL that control fruit weight in the eggplant (fw2.1, fw9.1
and fw11.1) are found as orthologues in all the aforementioned plants and fruit shape
orthologues from the eggplant in the tomato and pepper (fs7.1 and ovs4.1) have also been
identified (Grandillo et al., 1999). There seems to be substantial number of QTL that have
been conserved between Solanaceous species including plant height and flowering time and
leaf lobbing which isn’t agronomical. The eggplant shares forty four different QTL with the
other species and 27% of these have putative orthologues in the tomato and potato (Frary,
et al., 2003); and also 43% of the QTL for fruit weight, shape and colour in eggplant have
orthologues in tomato, potato and pepper (Doganlar et al., 2002). These studies have shown
that there is conservation in related species of the same genes that are related to
domestication and also those that are not. This could indicate that some genes are linked- the
non-agronomical i.e. leaf lobbing to an agronomical trait that is selected for intentionally or
it may persist due to epistasis.
BIOL 3034 Lab report Jessica Denning 25300792
14
3.12. Selective Sweeps under strong selection
During intense selection, a selective sweep may occur whereby advantageous traits are
selected for along with genes that ‘hitchhike’ or are associated closely with the advantageous
gene on the chromosome and are so inherited together. These genes are fixed quickly by
increased prevalence in the population whereas less beneficial alleles are lost
(Schaffner & Sabeti, 2008). Given that domestication can put such strong selection pressure
of progenitor crops it is possible that selective sweeps may have occurred in cultivars. Rice
has been cultivated from O. rufipogon, in Asia different starch qualities have been selected
for during domestication depending on human preference (Whitt et al., 2002). A study of the
Waxy gene responsible for the absence of amylose found that it was present in temperate
japonica rice varieties, but rare or absent in tropical japonica, indica, aus, and aromatic
varieties (Olson et al., 2006). Analysis found that the gene had undergone strong selection in
temperate japonica and is likely to have undergone a selective sweep as it is not found in the
other domesticated varieties even though they are closely related.
A selective sweep was also identified in a study by Wang et al. (2005) in the gene responsible
for the loss of the hard casing around the maize kernel, this has been beneficial for farmers
allowing less processing of the crop. The gene tga1 is a transcriptional regulator and the trait
is controlled by just this one gene, being such a beneficial trait it would have been under
strong selection and does show evidence of a selective sweep at the promoter region (Wang
et al., 2005). Selective sweeps although reducing genetic diversity in domesticated crops does
lead to the most beneficial trait being fixed in the population quickly and eliminates the
chance of less advantageous traits being displayed in the phenotype which could decrease
yields.
3.13. Aims, hypotheses and acknowledgements
This study aims to sequence domestication genes related to size such as fw2.2, yield, colour
and shape such as LC and FAS in the aubergine based on the domestication of the tomato to
determine if parallel selection has occurred. The study aims to take sequences from the
tomato and identify them in the aubergine by designing PCR primers to amplify aubergine
genes and relate them to phenotypic measurements. The hypotheses for this study are H0:
BIOL 3034 Lab report Jessica Denning 25300792
15
Genes under selection in one species will not be under selection in another species. HA: Genes
in one species will be under selection in another species.
I would like to thank Dr Mark Chapman for all his help, support and guidance throughout the
entirety of my project.
4. Materials and Methods
4.1 PCR primer Design
Firstly it was necessary to locate the gene of interest from the eggplant genome database
(Hirakawa et al., 2014) by searching for a key word e.g. ovate or its gene name (e.g.
Sme2.5_00099.1_g00011.1).On the resulting webpage the top hit was checked against the
sequence number and the nucleotide sequence copied into the query box in the BLAST tab
with an expected setting of 0.01. From the output the genomic hit was used to calculate the
size and position of the introns. Using the Primer 3 website, (Untergrasser et al., 2013) the
intron positions were copied into the excluded regions box and an appropriate product range
was selected for the size of the DNA fragment and pick primers was selected. From the
output the Left primer which is closest to the start of the DNA fragment and any Right primer
closest to the end of the DNA fragment were selected. Some pieces of DNA are large and may
need two sets of primers for effective PCR up to about 1500 bp.
4.2 DNA Extractions
All fruiting plants were sampled in the greenhouse (see Appendix 1 for plants used). 200mg
of meristem tissue taken from fruiting plants was submerged in liquid nitrogen then ground
to a fine dust before adding 700µl of CTAB. Samples were incubated at 60⁰ C for one hour
inverting once. **700µl 24:1 Chloroform: Iso Amyl Alcohol was added once samples had
cooled and were mixed for 15 minutes and centrifuged for 10 minutes at 13, 000rpm. 650µl
of the aqueous phase was pipetted into a new Eppendorf. Repeated from ** once, pipetting
only 600µl of aqueous phase. 0.08 volumes of 7.5M ammonium acetate (48 µl) and 0.5
volumes freezer cold isopropanol (324 µl) were added the samples frozen for 2 hours.
Centrifuged for 10mins at 13,000rpm. The liquid was poured off leaving the pellet each time
the. 500µl of freezer cold 70% ethanol was added to the pellet and centrifuged for 3 minutes
at 13rpm and the liquid poured off. 500 µl of freezer cold 95% ethanol was added to the pellet
BIOL 3034 Lab report Jessica Denning 25300792
16
and centrifuged for 3 minutes at 13rpm. The liquid was poured off and the eppendorf left to
dry on a tissue for 15 minutes. The samples were re-suspended samples in 100 µl of TE buffer
and frozen until needed.
4.3 Calculating DNA concentration (ng/µl)
Using the Nano drop (ND-1000 Spectrophotometer 6070/1584) it was first calibrated using
sterile H2O. 1 µ𝑙 was placed on the receptacle and a measurement taken; then a blank
measurement using the buffer my sample was suspended in e.g. TE. Each of the DNA samples
(1µ𝑙) was pipetted onto the Nanodrop to calculate the concentration. Measurements were
taken for each of the DNA samples ensuring the receptacle was wiped clean each time to
prevent contamination.
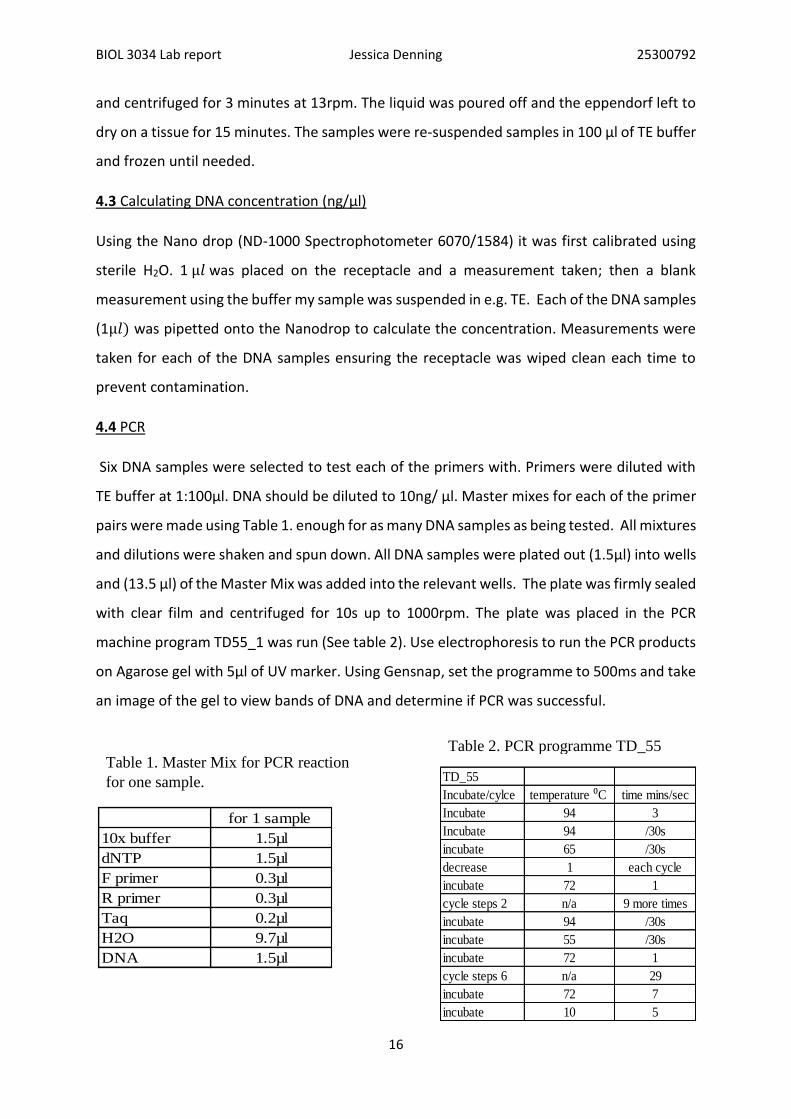
4.4 PCR
Six DNA samples were selected to test each of the primers with. Primers were diluted with
TE buffer at 1:100µl. DNA should be diluted to 10ng/ µl. Master mixes for each of the primer
pairs were made using Table 1. enough for as many DNA samples as being tested. All mixtures
and dilutions were shaken and spun down. All DNA samples were plated out (1.5µl) into wells
and (13.5 µl) of the Master Mix was added into the relevant wells. The plate was firmly sealed
with clear film and centrifuged for 10s up to 1000rpm. The plate was placed in the PCR
machine program TD55_1 was run (See table 2). Use electrophoresis to run the PCR products
on Agarose gel with 5µl of UV marker. Using Gensnap, set the programme to 500ms and take
an image of the gel to view bands of DNA and determine if PCR was successful.
for 1 sample
10x buffer 1.5µl
dNTP 1.5µl
F primer 0.3µl
R primer 0.3µl
Taq 0.2µl
H2O 9.7µl
DNA 1.5µl
Table 1. Master Mix for PCR reaction
for one sample. TD_55
Incubate/cylce temperature ⁰C time mins/sec
Incubate 94 3
Incubate 94 /30s
incubate 65 /30s
decrease 1 each cycle
incubate 72 1
cycle steps 2 n/a 9 more times
incubate 94 /30s
incubate 55 /30s
incubate 72 1
cycle steps 6 n/a 29
incubate 72 7
incubate 10 5
Table 2. PCR programme TD_55
BIOL 3034 Lab report Jessica Denning 25300792
17
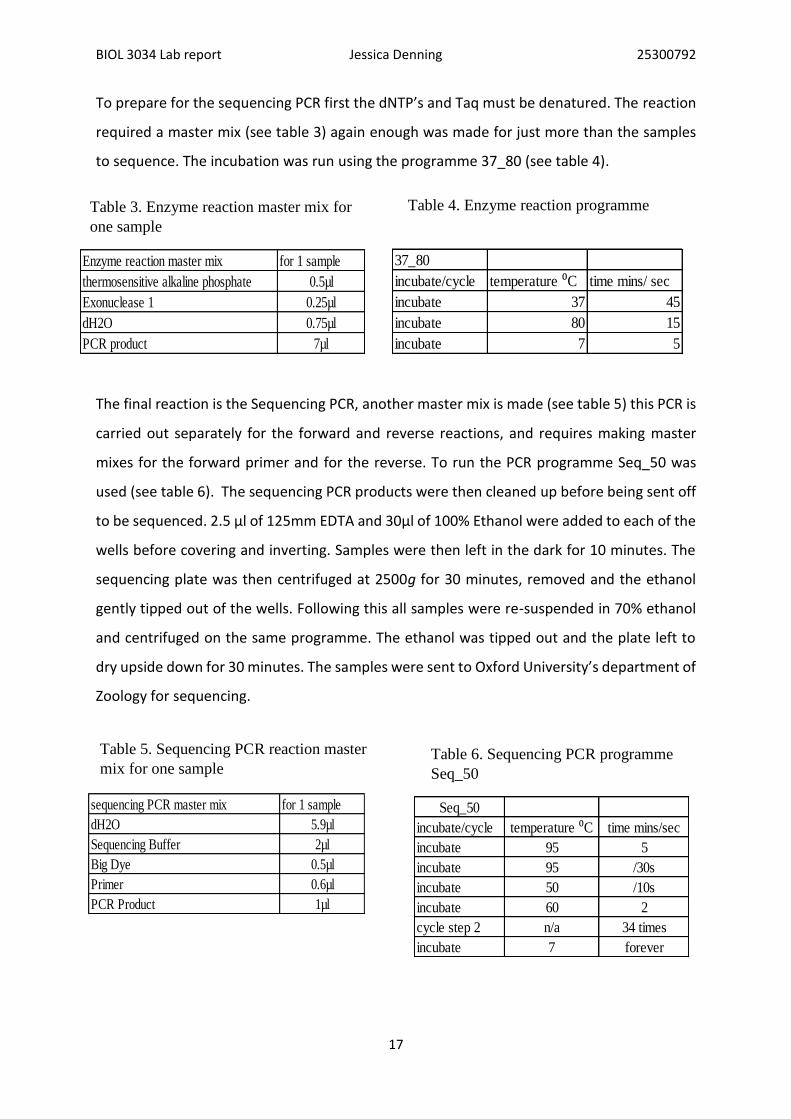
To prepare for the sequencing PCR first the dNTP’s and Taq must be denatured. The reaction
required a master mix (see table 3) again enough was made for just more than the samples
to sequence. The incubation was run using the programme 37_80 (see table 4).
The final reaction is the Sequencing PCR, another master mix is made (see table 5) this PCR is
carried out separately for the forward and reverse reactions, and requires making master
mixes for the forward primer and for the reverse. To run the PCR programme Seq_50 was
used (see table 6). The sequencing PCR products were then cleaned up before being sent off
to be sequenced. 2.5 µl of 125mm EDTA and 30µl of 100% Ethanol were added to each of the
wells before covering and inverting. Samples were then left in the dark for 10 minutes. The
sequencing plate was then centrifuged at 2500g for 30 minutes, removed and the ethanol
gently tipped out of the wells. Following this all samples were re-suspended in 70% ethanol
and centrifuged on the same programme. The ethanol was tipped out and the plate left to
dry upside down for 30 minutes. The samples were sent to Oxford University’s department of
Zoology for sequencing.
Enzyme reaction master mix for 1 sample
thermosensitive alkaline phosphate 0.5µl
Exonuclease 1 0.25µl
dH2O 0.75µl
PCR product 7µl
Table 3. Enzyme reaction master mix for
one sample
37_80
incubate/cycle temperature ⁰C time mins/ sec
incubate 37 45
incubate 80 15
incubate 7 5
Table 4. Enzyme reaction programme
sequencing PCR master mix for 1 sample
dH2O 5.9µl
Sequencing Buffer 2µl
Big Dye 0.5µl
Primer 0.6µl
PCR Product 1µl
Table 5. Sequencing PCR reaction master
mix for one sample
Seq_50
incubate/cycle temperature ⁰C time mins/sec
incubate 95 5
incubate 95 /30s
incubate 50 /10s
incubate 60 2
cycle step 2 n/a 34 times
incubate 7 forever
Table 6. Sequencing PCR programme
Seq_50
BIOL 3034 Lab report Jessica Denning 25300792
18
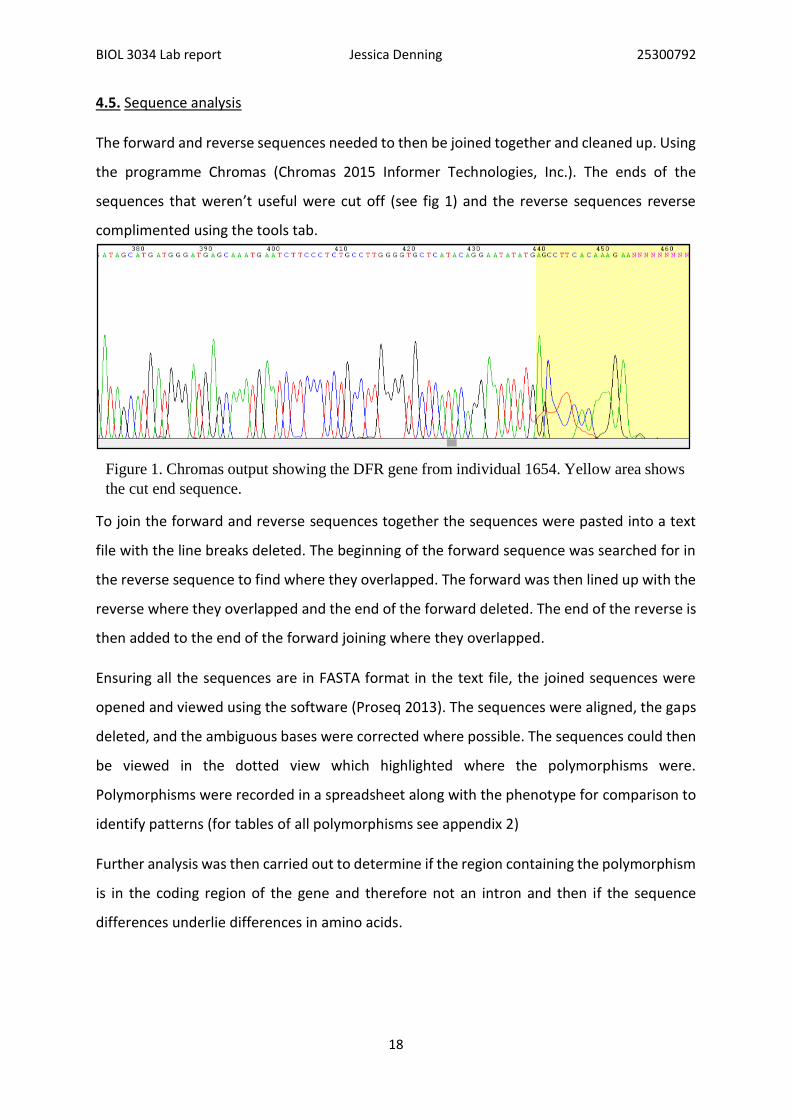
4.5. Sequence analysis
The forward and reverse sequences needed to then be joined together and cleaned up. Using
the programme Chromas (Chromas 2015 Informer Technologies, Inc.). The ends of the
sequences that weren’t useful were cut off (see fig 1) and the reverse sequences reverse
complimented using the tools tab.
To join the forward and reverse sequences together the sequences were pasted into a text
file with the line breaks deleted. The beginning of the forward sequence was searched for in
the reverse sequence to find where they overlapped. The forward was then lined up with the
reverse where they overlapped and the end of the forward deleted. The end of the reverse is
then added to the end of the forward joining where they overlapped.
Ensuring all the sequences are in FASTA format in the text file, the joined sequences were
opened and viewed using the software (Proseq 2013). The sequences were aligned, the gaps
deleted, and the ambiguous bases were corrected where possible. The sequences could then
be viewed in the dotted view which highlighted where the polymorphisms were.
Polymorphisms were recorded in a spreadsheet along with the phenotype for comparison to
identify patterns (for tables of all polymorphisms see appendix 2)
Further analysis was then carried out to determine if the region containing the polymorphism
is in the coding region of the gene and therefore not an intron and then if the sequence
differences underlie differences in amino acids.
Figure 1. Chromas output showing the DFR gene from individual 1654. Yellow area shows
the cut end sequence.
BIOL 3034 Lab report Jessica Denning 25300792
19
To translate the coding region the website (ExPACy 2011) on the compact setting was used
which highlighted any introns making it easy to identify the coding region. This was performed
for each of the alleles with polymorphisms once the coding region had been translated and
identified the two could be compared to identify whether there were amino acid changes,
this was achieved by aligning them in a text file.
5. Results
A variety of 40 aubergine plants grown under glasshouse conditions were initially sampled;
their DNA was extracted and several attempts at PCR were completed as described previously
in the methods. Primers for the genes OVATE, Fw2.2, SUN, SUN2, FAS,
Anthocyanidinsynthase, CHS, S1_anthocyanin1, S1_anthocyanin2, Sm_5GT, St_3GT were
designed in order to result in a range of colour and shape genes to be sequenced. There was
great difficulty however in getting the genes to amplify in the majority of the DNA samples
and only four were ultimately successful. For the 18 DNA samples that were the most
consistent in amplifying the genes during PCR four genes: DFR, 3GT, 5GT and OVATE were
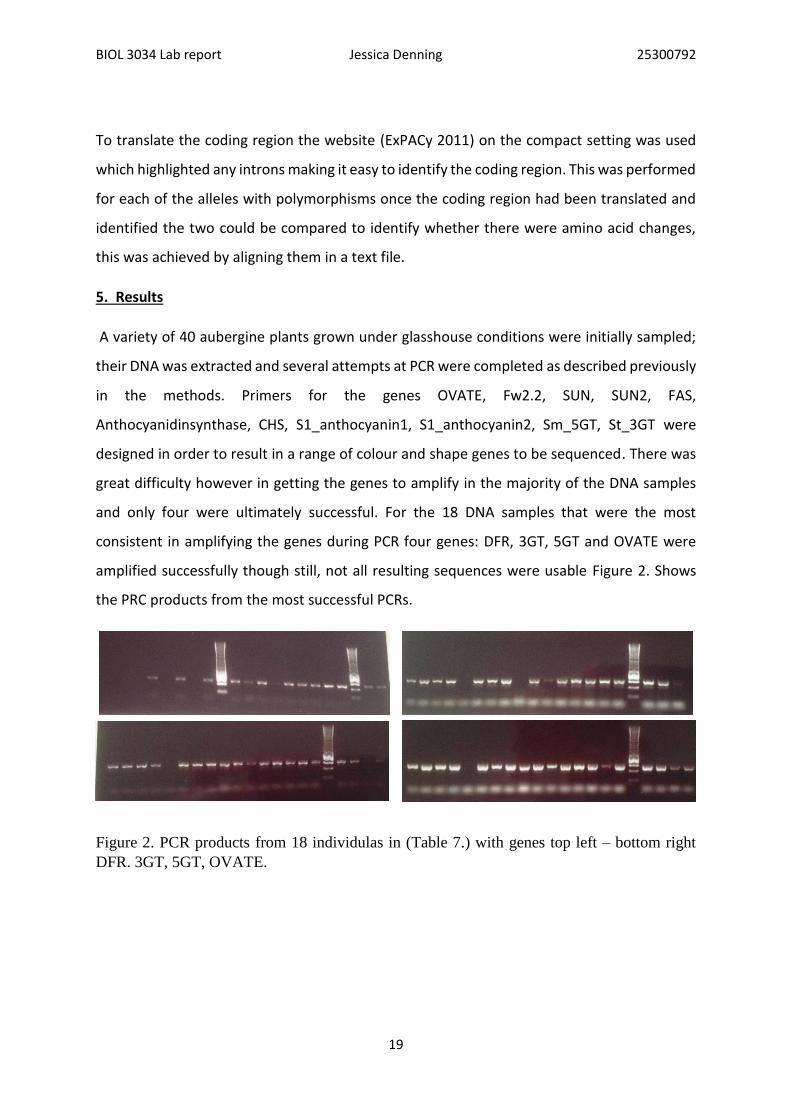
amplified successfully though still, not all resulting sequences were usable Figure 2. Shows
the PRC products from the most successful PCRs.
Figure 2. PCR products from 18 individulas in (Table 7.) with genes top left – bottom right
DFR. 3GT, 5GT, OVATE.
BIOL 3034 Lab report Jessica Denning 25300792
20
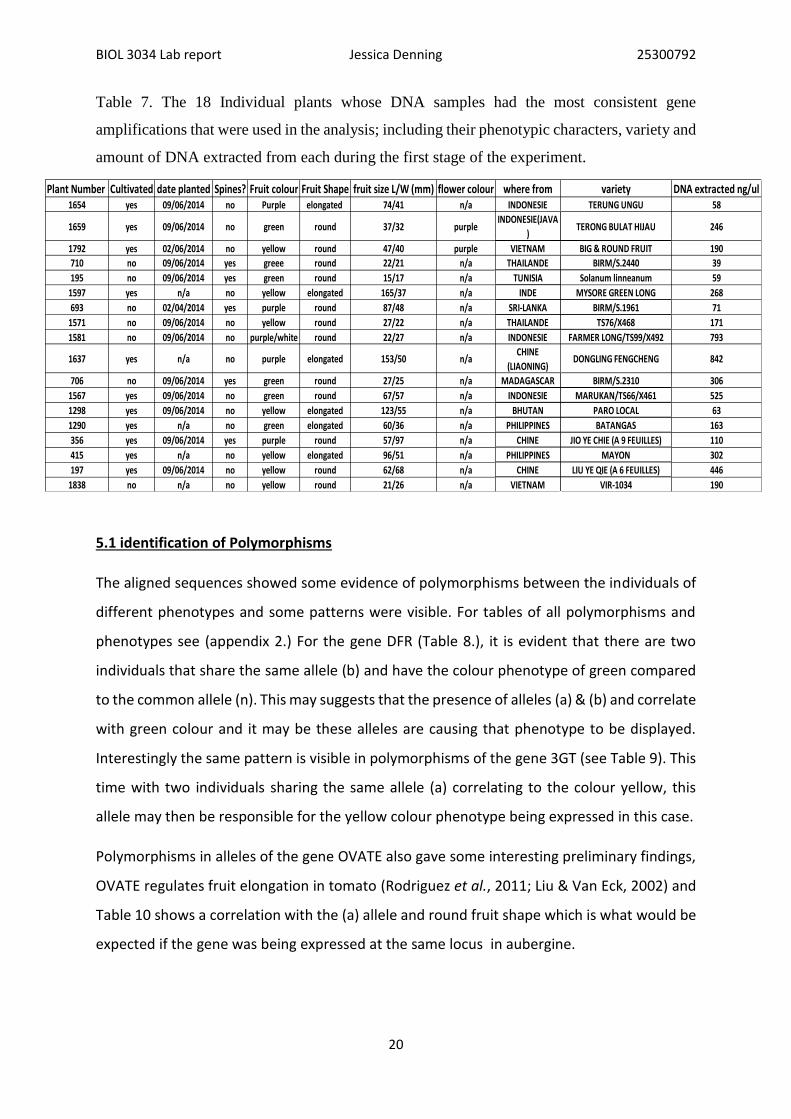
Table 7. The 18 Individual plants whose DNA samples had the most consistent gene
amplifications that were used in the analysis; including their phenotypic characters, variety and
amount of DNA extracted from each during the first stage of the experiment.
5.1 identification of Polymorphisms
The aligned sequences showed some evidence of polymorphisms between the individuals of
different phenotypes and some patterns were visible. For tables of all polymorphisms and
phenotypes see (appendix 2.) For the gene DFR (Table 8.), it is evident that there are two
individuals that share the same allele (b) and have the colour phenotype of green compared
to the common allele (n). This may suggests that the presence of alleles (a) & (b) and correlate
with green colour and it may be these alleles are causing that phenotype to be displayed.
Interestingly the same pattern is visible in polymorphisms of the gene 3GT (see Table 9). This
time with two individuals sharing the same allele (a) correlating to the colour yellow, this
allele may then be responsible for the yellow colour phenotype being expressed in this case.
Polymorphisms in alleles of the gene OVATE also gave some interesting preliminary findings,
OVATE regulates fruit elongation in tomato (Rodriguez et al., 2011; Liu & Van Eck, 2002) and
Table 10 shows a correlation with the (a) allele and round fruit shape which is what would be
expected if the gene was being expressed at the same locus in aubergine.
Plant Number Cultivated date planted Spines? Fruit colour Fruit Shape fruit size L/W (mm) flower colour where from variety DNA extracted ng/ul1654 yes 09/06/2014 no Purple elongated 74/41 n/a INDONESIE TERUNG UNGU 58
1659 yes 09/06/2014 no green round 37/32 purpleINDONESIE(JAVA
)TERONG BULAT HIJAU 246
1792 yes 02/06/2014 no yellow round 47/40 purple VIETNAM BIG & ROUND FRUIT 190
710 no 09/06/2014 yes greee round 22/21 n/a THAILANDE BIRM/S.2440 39
195 no 09/06/2014 yes green round 15/17 n/a TUNISIA Solanum linneanum 59
1597 yes n/a no yellow elongated 165/37 n/a INDE MYSORE GREEN LONG 268
693 no 02/04/2014 yes purple round 87/48 n/a SRI-LANKA BIRM/S.1961 71
1571 no 09/06/2014 no yellow round 27/22 n/a THAILANDE TS76/X468 171
1581 no 09/06/2014 no purple/white round 22/27 n/a INDONESIE FARMER LONG/TS99/X492 793
1637 yes n/a no purple elongated 153/50 n/aCHINE
(LIAONING)DONGLING FENGCHENG 842
706 no 09/06/2014 yes green round 27/25 n/a MADAGASCAR BIRM/S.2310 306
1567 yes 09/06/2014 no green round 67/57 n/a INDONESIE MARUKAN/TS66/X461 525
1298 yes 09/06/2014 no yellow elongated 123/55 n/a BHUTAN PARO LOCAL 63
1290 yes n/a no green elongated 60/36 n/a PHILIPPINES BATANGAS 163
356 yes 09/06/2014 yes purple round 57/97 n/a CHINE JIO YE CHIE (A 9 FEUILLES) 110
415 yes n/a no yellow elongated 96/51 n/a PHILIPPINES MAYON 302
197 yes 09/06/2014 no yellow round 62/68 n/a CHINE LIU YE QIE (A 6 FEUILLES) 446
1838 no n/a no yellow round 21/26 n/a VIETNAM VIR-1034 190
BIOL 3034 Lab report Jessica Denning 25300792
21
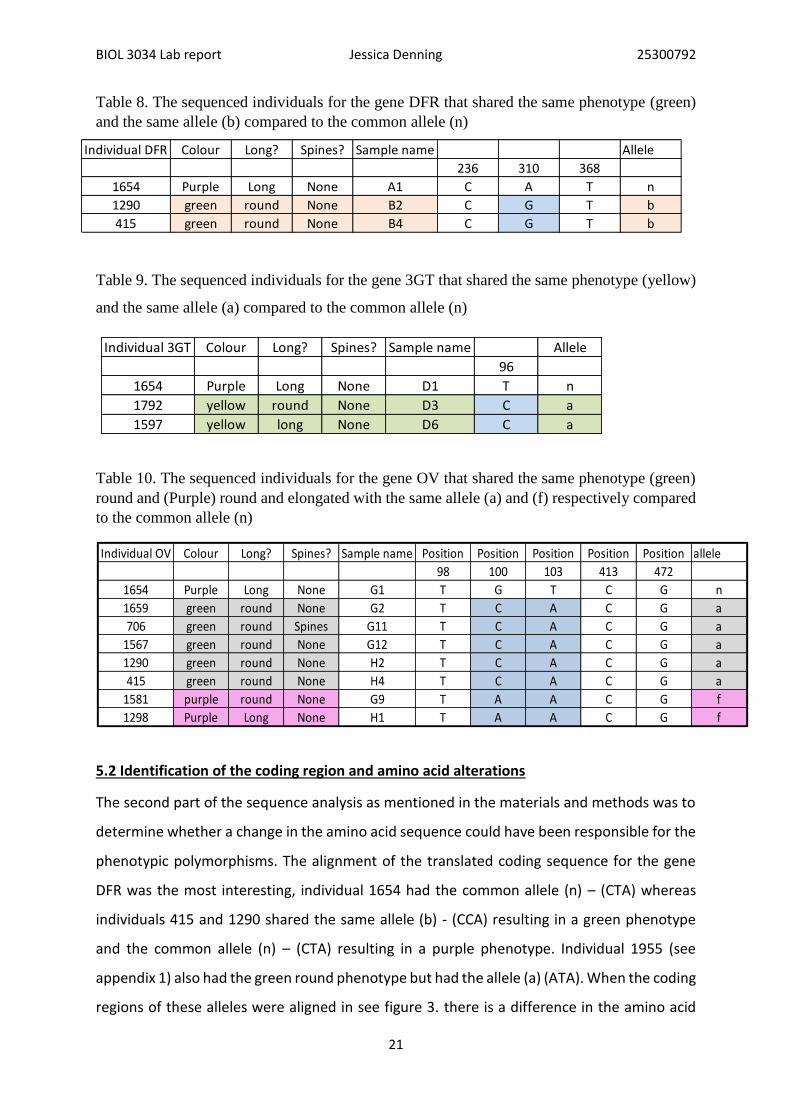
Table 8. The sequenced individuals for the gene DFR that shared the same phenotype (green)
and the same allele (b) compared to the common allele (n)
Table 9. The sequenced individuals for the gene 3GT that shared the same phenotype (yellow)
and the same allele (a) compared to the common allele (n)
Table 10. The sequenced individuals for the gene OV that shared the same phenotype (green)
round and (Purple) round and elongated with the same allele (a) and (f) respectively compared
to the common allele (n)
5.2 Identification of the coding region and amino acid alterations
The second part of the sequence analysis as mentioned in the materials and methods was to
determine whether a change in the amino acid sequence could have been responsible for the
phenotypic polymorphisms. The alignment of the translated coding sequence for the gene
DFR was the most interesting, individual 1654 had the common allele (n) – (CTA) whereas
individuals 415 and 1290 shared the same allele (b) - (CCA) resulting in a green phenotype
and the common allele (n) – (CTA) resulting in a purple phenotype. Individual 1955 (see
appendix 1) also had the green round phenotype but had the allele (a) (ATA). When the coding
regions of these alleles were aligned in see figure 3. there is a difference in the amino acid
Individual 3GT Colour Long? Spines? Sample name Allele
96
1654 Purple Long None D1 T n
1792 yellow round None D3 C a
1597 yellow long None D6 C a
Individual OV Colour Long? Spines? Sample name Position Position Position Position Position allele
98 100 103 413 472
1654 Purple Long None G1 T G T C G n
1659 green round None G2 T C A C G a
706 green round Spines G11 T C A C G a
1567 green round None G12 T C A C G a
1290 green round None H2 T C A C G a
415 green round None H4 T C A C G a
1581 purple round None G9 T A A C G f
1298 Purple Long None H1 T A A C G f
Individual DFR Colour Long? Spines? Sample name Allele
236 310 368
1654 Purple Long None A1 C A T n
1290 green round None B2 C G T b
415 green round None B4 C G T b
BIOL 3034 Lab report Jessica Denning 25300792
22
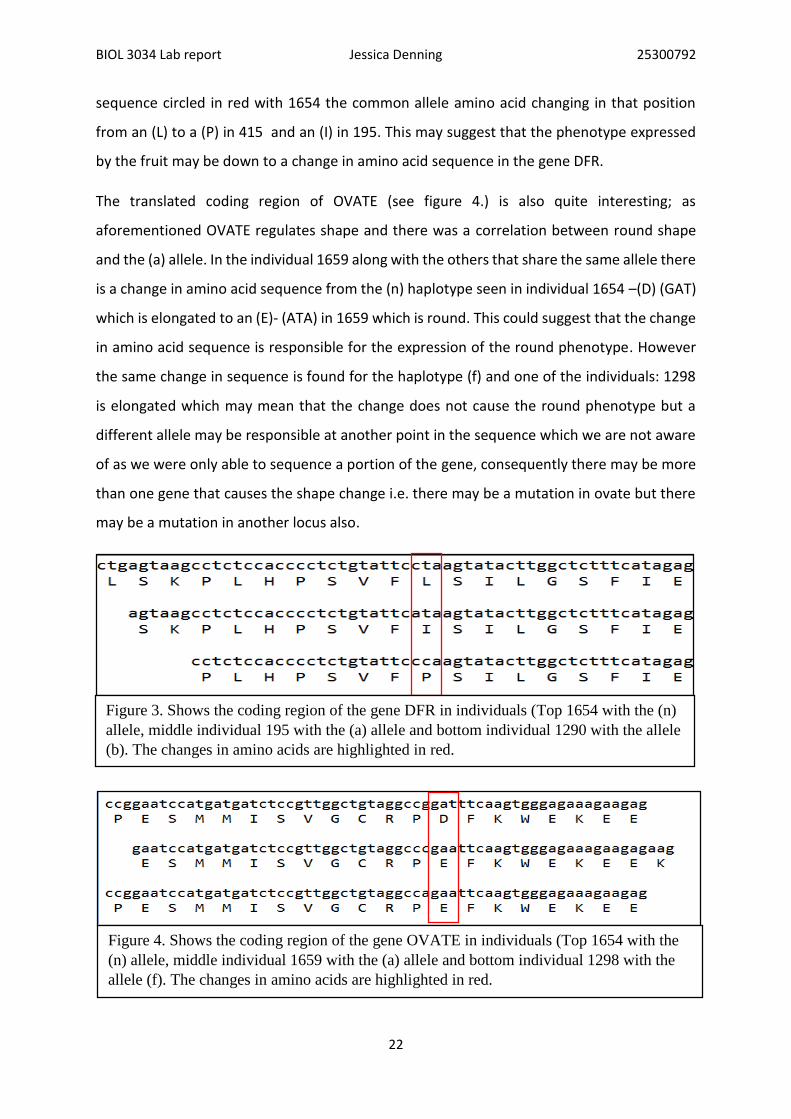
sequence circled in red with 1654 the common allele amino acid changing in that position
from an (L) to a (P) in 415 and an (I) in 195. This may suggest that the phenotype expressed
by the fruit may be down to a change in amino acid sequence in the gene DFR.
The translated coding region of OVATE (see figure 4.) is also quite interesting; as
aforementioned OVATE regulates shape and there was a correlation between round shape
and the (a) allele. In the individual 1659 along with the others that share the same allele there
is a change in amino acid sequence from the (n) haplotype seen in individual 1654 –(D) (GAT)
which is elongated to an (E)- (ATA) in 1659 which is round. This could suggest that the change
in amino acid sequence is responsible for the expression of the round phenotype. However
the same change in sequence is found for the haplotype (f) and one of the individuals: 1298
is elongated which may mean that the change does not cause the round phenotype but a
different allele may be responsible at another point in the sequence which we are not aware
of as we were only able to sequence a portion of the gene, consequently there may be more
than one gene that causes the shape change i.e. there may be a mutation in ovate but there
may be a mutation in another locus also.
Figure 3. Shows the coding region of the gene DFR in individuals (Top 1654 with the (n)
allele, middle individual 195 with the (a) allele and bottom individual 1290 with the allele
(b). The changes in amino acids are highlighted in red.
Figure 4. Shows the coding region of the gene OVATE in individuals (Top 1654 with the
(n) allele, middle individual 1659 with the (a) allele and bottom individual 1298 with the
allele (f). The changes in amino acids are highlighted in red.
BIOL 3034 Lab report Jessica Denning 25300792
23
6. Discussion
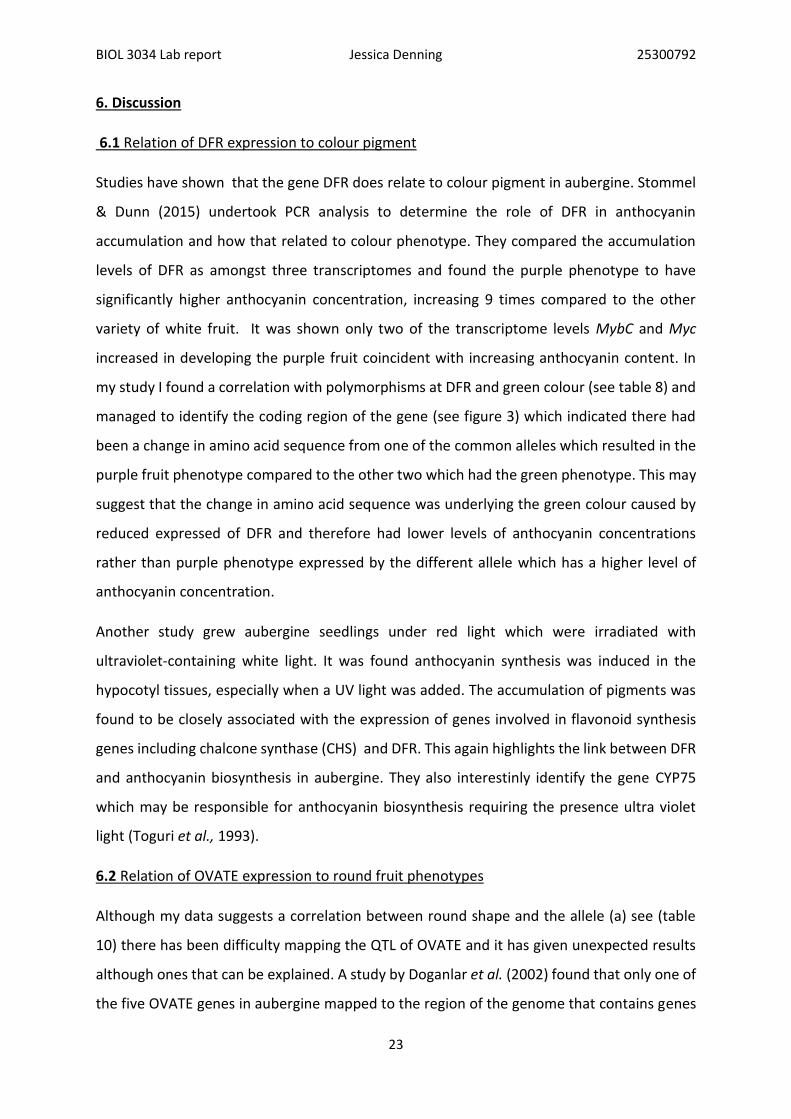
6.1 Relation of DFR expression to colour pigment
Studies have shown that the gene DFR does relate to colour pigment in aubergine. Stommel
& Dunn (2015) undertook PCR analysis to determine the role of DFR in anthocyanin
accumulation and how that related to colour phenotype. They compared the accumulation
levels of DFR as amongst three transcriptomes and found the purple phenotype to have
significantly higher anthocyanin concentration, increasing 9 times compared to the other
variety of white fruit. It was shown only two of the transcriptome levels MybC and Myc
increased in developing the purple fruit coincident with increasing anthocyanin content. In
my study I found a correlation with polymorphisms at DFR and green colour (see table 8) and
managed to identify the coding region of the gene (see figure 3) which indicated there had
been a change in amino acid sequence from one of the common alleles which resulted in the
purple fruit phenotype compared to the other two which had the green phenotype. This may
suggest that the change in amino acid sequence was underlying the green colour caused by
reduced expressed of DFR and therefore had lower levels of anthocyanin concentrations
rather than purple phenotype expressed by the different allele which has a higher level of
anthocyanin concentration.
Another study grew aubergine seedlings under red light which were irradiated with
ultraviolet-containing white light. It was found anthocyanin synthesis was induced in the
hypocotyl tissues, especially when a UV light was added. The accumulation of pigments was
found to be closely associated with the expression of genes involved in flavonoid synthesis
genes including chalcone synthase (CHS) and DFR. This again highlights the link between DFR
and anthocyanin biosynthesis in aubergine. They also interestinly identify the gene CYP75
which may be responsible for anthocyanin biosynthesis requiring the presence ultra violet
light (Toguri et al., 1993).
6.2 Relation of OVATE expression to round fruit phenotypes
Although my data suggests a correlation between round shape and the allele (a) see (table
10) there has been difficulty mapping the QTL of OVATE and it has given unexpected results
although ones that can be explained. A study by Doganlar et al. (2002) found that only one of
the five OVATE genes in aubergine mapped to the region of the genome that contains genes
BIOL 3034 Lab report Jessica Denning 25300792
24
relating to fruit shape; this suggests that the genes responsible for determining the final size
and shape of the eggplant ovaries are controlled by loci that are not directly involved in the
final size of the mature fruit.
QTL studies of OVATE also showed that the genes mapped by Doganlar et al. (2002) explained
fairly little of the variation in ovary shape and size. Three QTL fitted simultaneously for ovary
diameter only explained 24% of the variation in aubergine, the QTL for ovary shape ovs4.1
explained 36% of phenotypic variation and was the most significant. In terms of my study this
could mean that sequencing only a small portion of the gene alone would not give indicative
results of a correlation as I also found that one of the (f) allele individuals had an elongated
shape. Although we are aware that ovate does control fruit shape in aubergine it only appears
to explain a portion of the variation in shape. It may have been more useful if it were possible
to also successfully amplify the genes involved in fruit length fl2.1 and fl9.1 as well as fl11.1.
as they were shown to explain 47% of the phenotypic variation but they are yet to be
sequenced (Doganlar et al., 2002).
6.3 Relation of 3GT expression to yellow fruit pigmentation
Althought there is little work in the literature relating to 3-O-glucosyltransferase in aubergine
most of the research has been on colour pigments in flowers and it is one of the most studied
glycosylation enzymes. 3GT has been identified and cloned from numerous plant species
which suggests parallel domestication or selection. 3GT is responsible for the modification of
the anthocyanin by the addition of a glucose, this stage is the last in the anthocyanin pathway
and appears to have been conserved across species (Grotewold 2006).
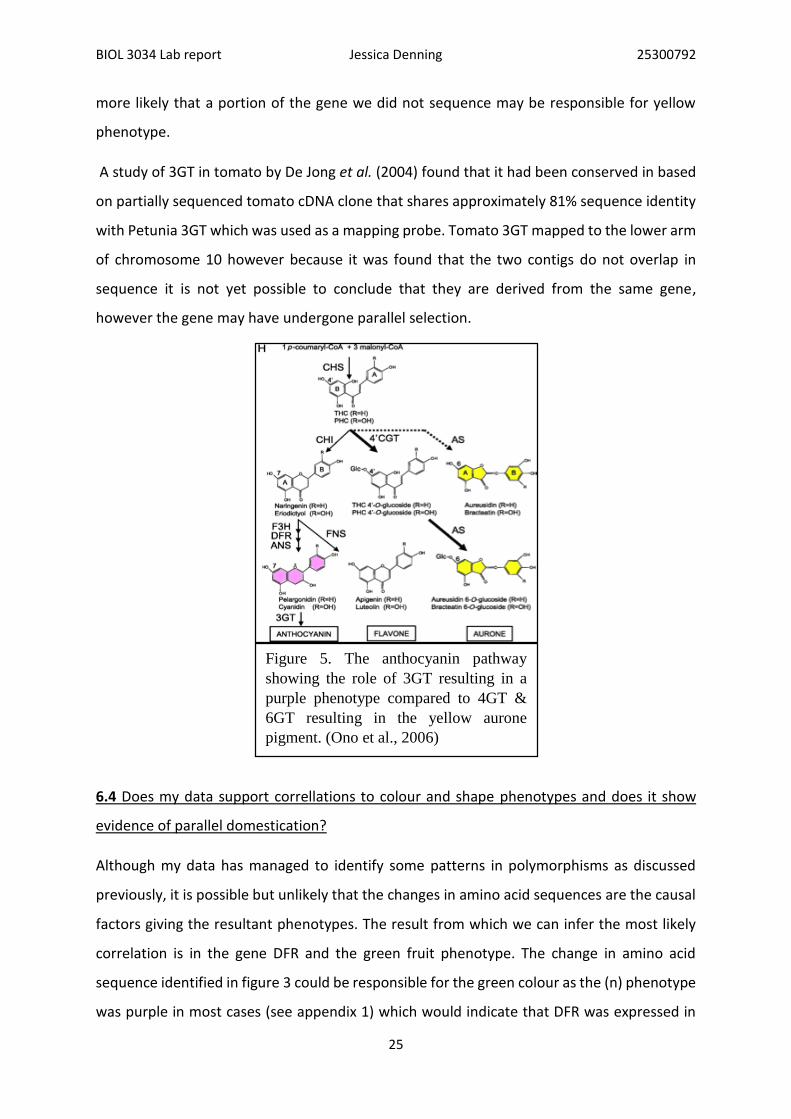
A study by Ono et al. (2006) examined the anthocyanin pathway in flower petals and describes
that the Aurones class of flavonoids exhibit a bright yellow colour in ornamental flowers, such
as the snapdragon (Scrophulariaceae, Antirrhinum majus). However the pathway involving
3GT (see fig four) was found to give a pink/purple pigment so it is unlikely that the correlation
I found between the polymorphisms and 3GT (see table 9.) and the yellow phenotype is
unlikely to actually be causal gene in that case. The gene was sequenced in purple individuals
indicating that the polymorphism identified could be interfering with the anthocyanin
pathway by knock out which may cause an alteration in phenotype; however when the coding
region was sequenced it was found that there was no change in amino acid sequence so it is
BIOL 3034 Lab report Jessica Denning 25300792
25
more likely that a portion of the gene we did not sequence may be responsible for yellow
phenotype.
A study of 3GT in tomato by De Jong et al. (2004) found that it had been conserved in based
on partially sequenced tomato cDNA clone that shares approximately 81% sequence identity
with Petunia 3GT which was used as a mapping probe. Tomato 3GT mapped to the lower arm
of chromosome 10 however because it was found that the two contigs do not overlap in
sequence it is not yet possible to conclude that they are derived from the same gene,
however the gene may have undergone parallel selection.
6.4 Does my data support correllations to colour and shape phenotypes and does it show
evidence of parallel domestication?
Although my data has managed to identify some patterns in polymorphisms as discussed
previously, it is possible but unlikely that the changes in amino acid sequences are the causal
factors giving the resultant phenotypes. The result from which we can infer the most likely
correlation is in the gene DFR and the green fruit phenotype. The change in amino acid
sequence identified in figure 3 could be responsible for the green colour as the (n) phenotype
was purple in most cases (see appendix 1) which would indicate that DFR was expressed in
Figure 5. The anthocyanin pathway
showing the role of 3GT resulting in a
purple phenotype compared to 4GT &
6GT resulting in the yellow aurone
pigment. (Ono et al., 2006)
BIOL 3034 Lab report Jessica Denning 25300792
26
higher levels with the (n) haplotype than in the (a) and (b) haplotypes which resulted in a
green phenotype which express lower levels of anthocyanin (Stommel & Dumm 2015).
3GT although showing a polymorphic correlation to colour and haplotype had no change in
amino acid sequence in the coding region so it is unlikely that the resultant phenotypes are
caused by the polymorphism identified in Table 9. Also studies have identified 3GT normally
results in a purple rather than yellow phenotype however different alleles may not code for
purple pigment although there were no changes identified in the amino acid sequence there
may be genetic changes for example stop codons or insertions which could knock out the
gene expression of 3GT.
OVATE did show a strong correlation in haplotype and phenotype with a number of
individuals showing the round phenotype (a) (see table 10) and also there was a change in
the amino acid sequence of the coding region (see figure 4) from (D) – (GAT) in the (n) allele
to (E) – (GAA) which is suggestive that the alteration in amino acids could be the causal factor
in the altered phenotype as the (n) phenotype has an elongated phenotype. There is a
discrepancy however as the other polymorphism identified (f) shows the same alteration in
coding region (D) to (E), and one of the individuals with the (f) allele has an elongated
phenotype so this may suggest that the polymorphism in this case is not underlying the
change in phenotype.
Although genes from tomato were successfully sequenced in the aubergine it is not possible
to define that they are serving the same purpose from the data I have collected so it is not
definitive to say that parallel domestication has occurred in this case, although other studies
mentioned previously including one by Doganlar et al. (2002) have shown significant
similarities between the two genomes.
6.5 Limitations and Further Study
The main limiation to this study was the difficulty in getting the genes to amplify sucessfully
in the individual plant samples. This factor was also limiting in the variety of genes and
phenotypes that it was possible to sequnce, in the end most of the genes that were sucessful
were anthocyanins and it would have been better if some of the fruit size and shape genes
were also successful as they play an equal role in domestication syndrome. Having a limited
number of phenotypes to measure against also was not ideal, with a more numerous and
BIOL 3034 Lab report Jessica Denning 25300792
27
varied sample size it is likely that stronger less ambiguous correlations would have been found
giving more difinitive results. The study also only sequenced a portion of each gene so it is
possible that the correlations we found may be the result of a genetic change in a portion of
the gene that we did not sequence so being able to sequence the whole of each gene would
have been beneficial.
The fact that we were able to sequence the genes from tomato in aubergine suggests that
they have been conserved in the two species which does suggest that there has been parallel
domestication although we were unable to explicitly identify that the genes served the same
function this study does support the comprehensive analysis by (Doganlar et al., 2002) who
found highly significant evidence of the conservation of domestication genes relating to
shape, size and colour QTL in tomato and aubergine. The study also highlighted that the major
phenotypic changes that occurred during domestication are controlled by only a few loci for
instance size and shape in aubergine are controlled by only 2 major loci.
The discoveries made in identifying the genetics underlying domestication and parallel
domestication could have significant applications in the future especially as gentic techniques
and analyses improve. If we are able to detect which genes control certain traits important to
commercialisation and improved growth, it may be possible to genetically engineer wild
species that grow well insitu under climate change conditions, to be cultivated and feed more
people more efficiently rather than trying to import crop varieties that are ill suited to their
alien conditions. If other groups of species also show evidence of having few major loci
controlling large aspects of the phenotype then it may be posisble to fast track domestication
and plant breeding. By selecting specifically for these gentic changes we could effect an
artificial selective sweep that could maintain yeilds in the future when the effects of climate
change become apparent and growing crops in certain areas becomes near impossible.
BIOL 3034 Lab report Jessica Denning 25300792
28
References
Allaby, M (2009) Oxford English Dictionary of Zoology Oxford University Press United States New York
Artimo P. Jonnalagedda M. Arnold K. Baratin D. Csardi G et al., (2012). ExPACy Translate
tool. Available: http://web.expasy.org/translate/. [Last accessed 29th May 2015.]
Brown, T.L. Jones, M.K et al., (2009) the complex origins domesticated crops in the Fertile Crescent.
Trends in ecology and evolution. 24: (2) 103–109
Brush, S. (2000). Genes in the field On-farm Conservation of Crop Diversity. U.S.A: Lewis Publishers
Burke, J.M. Burger, J.C. & Chapman, M.A. (2007) Current Opinion in Genetics & Development 17:525–
532
Chakrabarti M. Zhang N. Sauvage C. et al., (2013). A cytochrome P450 regulates a domestication trait
incultivated tomato. Proceedings of the National Academy of Sciences, USA 110: 17125–
17130.
Chapman, M.A. & Burke, J.M. (2012). Evidence of selection on fatty acid biosynthetic genes during
the evolution of cultivated sunflower. Theoretical Applied Genetics 125:897–907
Chapman M.A. Mandel J.R. Burke, J.M. (2013) Sequence Validation of Candidates for Selectively
Important Genes in Sunflower. PLoS ONE 8(8): e71941.
Chromas, Informer Technologies, Inc., Computer Software 2015. Available
<http://chromas.software.informer.com/2.4/> [26th May 2015]
Cong, B. Barrero, L.S & Tanksley, S.D (2008) Regulatory change in YABBY-like transcription factor led
to evolution of extreme fruit size during tomato domestication. Nature Genetics. 40: (6) 800-
804
Cui, L. Shan, J. Shi, M. Gao, J. Lin, H. (2014) The miR156-SPL9-DFR pathway coordinates the
relationship between development and abiotic stress tolerance in plants. The plant journal.
80: (6) 1108-1117
Crepet, W.L. & Niklas, K.J. (2008) Darwin’s second “abominable mystery”: Why are there so many
angiosperm species? The American Journal of Botany. 96: (1) 366-381
De Jong, W.S. Eannetta, N.T. De Jong, D.M. Bodis, M. (2004) Candidate gene analysis of anthocyanin
pigmentation loci in the Solanaceae. Theoretical Applied Genetics. 108:423–432
Diamond, J. (2002) Evolution, consequences and future of plant and animal domestication. Nature
418: 700-707
BIOL 3034 Lab report Jessica Denning 25300792
29
Doebley, J.F. Gaut, B.S. (2006) The Molecular Genetics of Crop Domestication. Cell. 127: 1309-1323
Doganlar, S. Frary, S. et al., (2002) Conservation of Gene Function in the Solanaceae as Revealed by
Comparative Mapping of Domestication Traits in Eggplant. The genetics society of America
161: 1713–1726
Frary, A. Nesbitt, T.C. et al., (2000) fw2.2: A Quantitative Trait Locus Key to the Evolution of Tomato
Fruit Science. 289: 85
Frary, A. Doganlar et al (2003) QTL analysis of morphological traits in eggplant and implications for
conservation of gene function during evolution of solanaceous species. Theoretical Applied
Genetics 107: 359–370
Grandillo, S. Ku, H.M. & Tanksley, S.D. (1999). Identifying the loci responsible for natural variation in
fruit size & Shape in Tomato. Theoretical Applied Genetics. 99: 978-887
Grotewold, E. (2006). The genetics and biochemistry of floral pigments. Annual review of plant
biology. 57: 761-780
Heffner, E.L. et al., (2009). Genomic Selection for Crop Improvement. Alliance of crop, soil and
environmental science societies. 49: (1) 1-12
Hirakawa H. Shirasawa K. Miyatake K. Nunome T. Negoro S. Ohyama A. Yamaguchi H. Sato S. Isobe S,
Tabata S. Fukuoka H. (2014). Draft Genome Sequence of Eggplant (Solanum melongena L.):
the Representative Solanum Species Indigenous to the Old World. .Available:
http://eggplant.kazusa.or.jp/index.html. Last accessed 10/10/2014.
Hirakawa, H. et al (2014) Draft Genome Sequence of Eggplant (Solanum melongena L.): the
Representative Solanum Species Indigenous to the Old World. DNA research 49: 1-12
Kellogg, E.A. (1997). Plant evolution: The dominance of maize. Current Biology. 7: (7) 411–413,
Li, T. Jia, K.P. Lian, H. Yang, X. Li, L. Yang, H. Jasmonic acid enhancement of anthocyanin accumulation
is dependent on phytochrome a signaling pathway under far-red light in Arabidopsis.
Biochemical and Biophysical Research Communications. 454: (1) 78-83
Liu, J. Van Eck, J. (2002) A new class of regulatory genes underlying the cause of pear-shaped tomato
fruit. PNAS 99 (20) 13302–13306
McConn, M. Creelman, R. A. Bell, E. Mullet, J.E. Browse, J. (1994) Jasmonate is essential for insect
defense Arabidopsis. Proc. Natl. Acad. Sci. U.S.A., 94: 5473-5477
Midgley, J.J. Bond, W.J. et al (1991) How Important is Biotic Pollination and Dispersal to the Success
of the Angiosperms? Philosophical transactions of the royal society of biological sciences.
333: (1) 1267 209-215
BIOL 3034 Lab report Jessica Denning 25300792
30
Miles, C.M. & Wayne, M. (2008) Quantitative Trait Locus (QTL) Analysis. Nature Education. 1 :( 1) 208
Monforte, A.J. Diaz, A. et al (2013) The genetic basis of fruit morphology in horticultural crops: lessons
from tomato and melon. The Journal of Experimental Botany. doi:10.1093/jxb/eru017
Olson, K.M. et al., (2006). Selection under Domestication: Evidence for a Sweep in the Rice Waxy
Genomic Region. Genetics society of America. 173: 975–983
Paine, J.A. Shipton, C. A. et al., (2005) Improving the nutritional value of Golden Rice through
increased pro-vitamin A content Nature Biotechnology 23: 482 - 487
Paran, I. Goldman, I. Zamir, D. (1997) QTL analysis of morphological traits in a tomato recombinant
inbred line population. Genome 40: 242–248
Paran, I. & Van der Knaap, E. (2007) Genetic and molecular regulation of fruit and plant domestication
traits in tomato and pepper. Journal of Experimental Botany. 58: (14) 3841–3852
Patterson, A. H. et al., (2005) Grains of knowledge: Genomics of model cereals. Genetic Research. 15:
1643-1650
Pietta, P.G. (2000) Flavonoids as antioxidants. Journal of Natural Products. 63: 1035–1042
Poncet, V. Robert, T. & Sarr, A. (2004) Quantitative Trait Locus Analyses of the Domestication
Syndrome and Domestication. Encyclopaedia of Plant and Crop Science 1069 DOI: 10.1081/E-
EPCS Process Marcel Dekker Inc. New York
Proseq, Computer Software 2013. Available <http://dps.plants.ox.ac.uk/sequencing/proseq.htm>
[26th May 2015]
Rodriguez G.R. Munos, S. Anderson, C. Sim, S.C. Michel, A. Causse, M. Gardener, B.B.M. Francis, D.
van der Knaap E. (2011). Distribution of SUN, OVATE, LC, and FAS in the tomato germplasm
and the relationship to fruit shape diversity. Plant Physiology 156: 275–285.
Roy A, Bal, S.S. Fergany, M. Kaur, S. Singh, H. Malik, A.A. Singh, J. Monforte, A.J. Dhillon, N.P.S. 2012.
Wild melon diversity in India (Punjab State). Genetic Resources and Crop Evolution 59: 755–
767
Saladie, M. Matas, A.J. Isaacson T. et al. (2007). A revaluation of the key factors that influence tomato
fruit softening and integrity. Plant Physiology 144: 1012–1028.
Schaffner, S. & Sabeti, P. (2008) Evolutionary adaptation in the human lineage. Nature Education 1 :(
1)14
BIOL 3034 Lab report Jessica Denning 25300792
31
Schupp, E.W (1993) Quantity, quality and the effectiveness of seed dispersal by animals. Frugivory
and seed dispersal: ecological and evolutionary aspects. Advances in vegetation science. 15:
15-29
Stommel, J.R, & Dumm, J.M (2015) Coordinated Regulation of Biosynthetic and Regulatory Genes
Coincides with Anthocyanin Accumulation in Developing Eggplant Fruit. Journal for the
American society for horticultural science. 140: (2) 129-135
Toguri, T. Umemoto, N. Kobayashi, O. Ohtani, T. (1993) Activation of anthocyanin synthesis genes by
white light in eggplant hypocotyl tissues, and identification of an inducible P-450 cDNA. Plant
molecular Biology. 23: (5) 933-946
Tallis, M.J. Lin, Y. Rogers, A. et al., (2010) The transcriptome of Populous in elevated CO2 reveals
increased anthocyanin biosynthesis during delayed autumnal senescence. New Phytologist.
186: 415–428
Untergrasser, A. Cutcutache, I. Koressaar, T. Ye, J. Faircloth, B.C. Remm, M. Rozen,
S.G. (2012) Primer3 - new capabilities and interfaces. Nucleic Acids Research 40(15):e115
Koressaar T, Remm M (2007) Enhancements and modifications of primer design program
Primer3. Bioinformatics 23 :( 10)1289-91
Vignal, A. et al. (2002) A review on SNP and other types of molecular markers and their use in animal
genetics. Genetics Selection Evolution 34: 275–305
Vogt, T. Pollak, P. Tarlyn, T. Taylor, L.P. (1994) Pollination- or wound-induced kaempferol accumulation in petunia stigmas enhances seed production. Plant Cell, 6: 11–23
Wang, L. et al (2005) The origin of the naked grains of maize. Nature 436: 714-719ss
Wang, L. Su, S. Wu, J. Du, H. (2014) Variation of anthocyanins and flavonols in Vaccinium
uliginosum berry in Lesser Khingan Mountains and its antioxidant activity. Food Chemistry.
160: (1) 357-364
Whitt et al (2002) Genetic diversity and selection in the maize starch pathway. PNAS. 99: (20) 12959–
12962
Winifree, R. Gross, B.J. Kremen, C. (2011) Valuing pollination services to agriculture. Ecological
Economics. 71: 80-88
Zeder, M.A. (2008) Domestication and early agriculture in the Mediterranean Basin: Origins,
diffusion, and impact. PNAS. 105: (33)11597–11604
Zhongwei, L. Xianran, Li. et al., (2012) Parallel domestication of the Shattering1 genes in cereals.
Nature Genetics. 44: (6) pp 720-725
BIOL 3034 Lab report Jessica Denning 25300792
32
8. Appendices
8.1 All plants used in study including their phenotypes
Plan
t N
um
ber
C
ult
ivat
edd
ate
pla
nte
dSp
ines
?Fr
uit
co
lou
rFr
uit
Sh
ape
fru
it s
ize
L/W
(m
m)
flo
wer
co
lou
rw
her
e fr
om
vari
ety
DN
A e
xtra
cted
ng/
ul
1654
CV
09/0
6/20
14n
oPu
rple
elo
nga
ted
74
/41
IND
ON
ESIE
TER
UN
G U
NG
U58
1493
CV
02/0
6/20
14n
ogr
een
elo
nga
ted
10
1/47
CH
INE
(SI
CH
UA
N)
NO
IRE
MEI
ZH
OU
74
1659
yes
09/0
6/20
14n
ogr
een
rou
nd
37/3
2p
urp
leIN
DO
NES
IE(J
AV
A)
TER
ON
G B
ULA
T H
IJA
U24
6
1792
yes
02/0
6/20
14n
oye
llow
rou
nd
47/4
0p
urp
leV
IETN
AM
BIG
& R
OU
ND
FR
UIT
190
710
no
09/0
6/20
14ye
sgr
eee
rou
nd
22/2
1TH
AIL
AN
DE
BIR
M/S
.244
039
195
no
09/0
6/20
14ye
sgr
een
rou
nd
15/1
7TU
NIS
IASo
lan
um
lin
nea
nu
m59
290
ov
no
yello
w/w
hit
ero
un
d40
/35
INC
ON
NU
EPL
AN
TE A
UX
OEU
FS36
3
1597
yes
no
yello
wel
on
gate
d16
5/37
IND
EM
YSO
RE
GR
EEN
LO
NG
268
1661
yes
09/0
6/20
14n
op
urp
le/w
hit
eel
on
gate
d15
5/57
IND
ON
ESIE
(JA
VA
)D
AD
ALI
181
1808
yes
no
yello
wro
un
d95
/75
IND
E
(KA
RN
ATA
KA)
MA
TTU
GU
LLA
43
5
1826
yes
09/0
6/20
14n
oye
llow
rou
nd
112/
53C
HIN
E (
YUN
NA
N)
ZI C
HA
NG
QIE
(II6
BO
139)
130
693
no
02/0
4/20
14ye
sp
urp
lero
un
d87
/48
SRI-
LAN
KAB
IRM
/S.1
961
71
1571
ov
09/0
6/20
14n
oye
llow
rou
nd
27/2
2TH
AIL
AN
DE
TS76
/X46
817
1
1581
ov
09/0
6/20
14n
op
urp
le/w
hit
ero
un
d22
/27
IND
ON
ESIE
FAR
MER
LON
G/T
S99/
X492
793
1584
yes
06/0
6/20
14n
oye
llow
rou
nd
54/5
4PH
ILIP
PIN
ES
TS10
8/X5
0232
9
1637
yes
no
pu
rple
elo
nga
ted
153/
50C
HIN
E (
LIA
ON
ING
)D
ON
GLI
NG
FEN
GC
HEN
G84
2
1712
yes
06/0
6/20
14n
op
urp
le/y
ello
wel
on
gate
d10
3/50
CH
INE
(LI
AO
NIN
G)
LIA
ON
ING
N°4
980
706
no
09/0
6/20
14ye
sgr
een
rou
nd
27/2
5M
AD
AG
ASC
AR
BIR
M/S
.231
030
6
1565
ov
no
yello
wro
un
d26
/36
IND
ON
ESIE
TS62
/X45
735
0
1567
yes
09/0
6/20
14n
ogr
een
rou
nd
67/5
7IN
DO
NES
IEM
AR
UKA
N/T
S66/
X461
525
1789
yes
06/0
6/20
14n
ow
hit
ero
un
d15
/17
VIE
TNA
MSM
ALL
& G
REE
N F
RU
IT17
8
1663
yes
no
wh
ite/
pu
rple
elo
nga
ted
154/
26p
urp
leIN
DO
NES
IE(J
AV
A)
TER
ON
G N
AG
A U
NG
U17
0
1300
yes
06/0
6/20
14n
ow
hit
e/p
urp
leel
on
gate
d15
1/47
SRI-
LAN
KATI
NN
EVEL
Y33
3
1298
yes
09/0
6/20
14n
oye
llow
elo
nga
ted
123/
55B
HU
TAN
PAR
O L
OC
AL
63
1294
yes
09/0
6/20
14n
oye
llow
elo
nga
ted
101/
38IN
DO
NES
IETE
RO
NG
PA
N J
AN
G 2
7578
1290
yes
no
gree
nel
on
gate
d60
/36
PHIL
IPPI
NE
SB
ATA
NG
AS
163
620
yes
no
yello
wro
un
d50
/47
IND
EM
AN
JAR
I GO
TA25
6
1543
yes
09/0
6/20
14n
oye
llow
rou
nd
65/5
2M
ALA
ISIE
TS3/
X412
177
414
yes
06/0
6/20
14n
ogr
een
elo
nga
ted
81/3
5PH
ILIP
PIN
ES
MA
KILI
NG
309
356
yes
09/0
6/20
14ye
sp
urp
lero
un
d57
/97
CH
INE
JIO
YE
CH
IE (
A 9
FEU
ILLE
S)11
0
152
yes
no
pu
rple
/wh
ite
elo
nga
ted
111/
46SR
I-LA
NKA
CEY
LAN
SM
164
319
96ye
s09
/06/
2014
no
gree
nel
on
gate
d96
/42
IND
EB
RIN
JAL
LON
G 2
198
1276
yes
06/0
6/20
14n
oye
llow
rou
nd
93/7
8IN
DE
IND
ES 1
115
656
yes
no
pu
rple
/wh
ite
elo
nga
ted
160/
35TA
IWA
NM
AC
HIH
LO
NG
217
415
yes
no
yello
wel
on
gate
d96
/51
PHIL
IPPI
NE
SM
AYO
N30
2
398
yes
09/0
6/20
14n
ow
hit
ero
un
dTH
AIL
AN
DE
THA
ILA
D42
2
197
yes
09/0
6/20
14n
oye
llow
rou
nd
62/6
8C
HIN
ELI
U Y
E Q
IE (
A 6
FEU
ILLE
S)44
6
97ye
s06
/06/
2014
no
pu
rple
/wh
ite
rou
nd
73/6
8p
urp
leIN
DE
BR
INJA
L R
OU
ND
372
4
1838
ov
no
yello
wro
un
d21
/26
VIE
TNA
MV
IR-1
034
190
1790
yello
w/w
hit
ero
un
d26
/30
VIE
TNA
MSM
ALL
& W
HIT
E FR
UIT
59
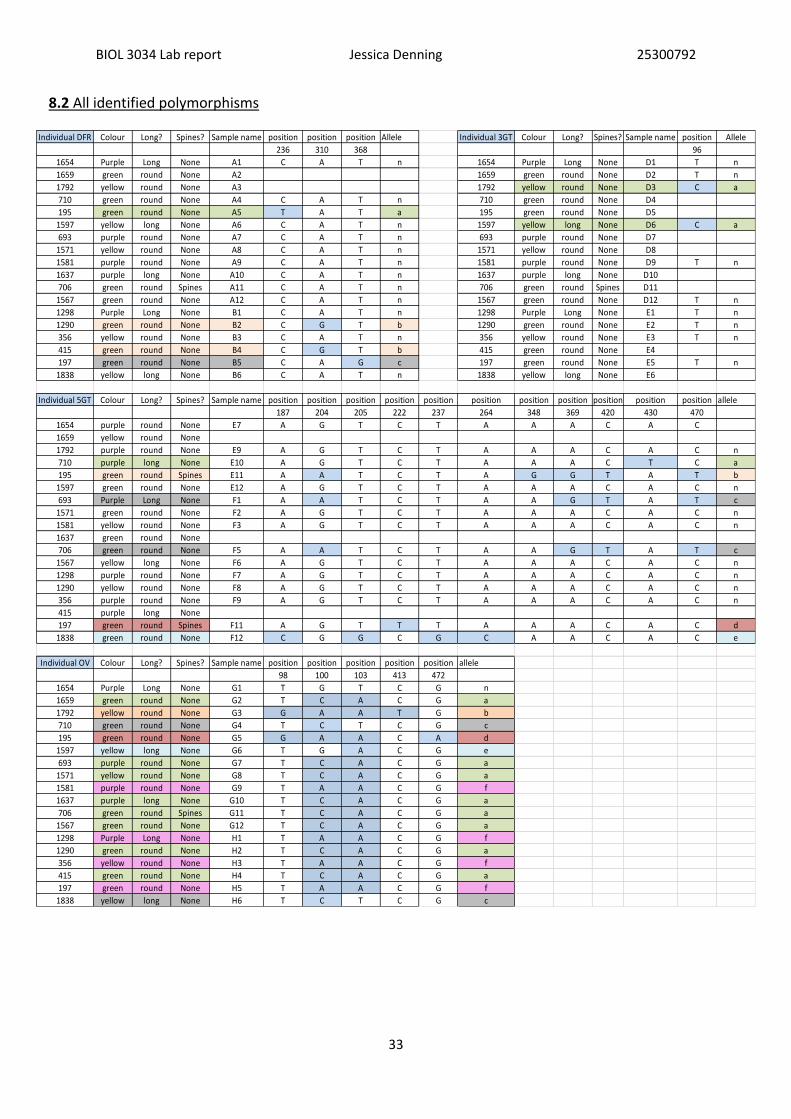
BIOL 3034 Lab report Jessica Denning 25300792
33
8.2 All identified polymorphisms
Individual DFR Colour Long? Spines? Sample name position position position Allele Individual 3GT Colour Long? Spines? Sample name position Allele
236 310 368 96
1654 Purple Long None A1 C A T n 1654 Purple Long None D1 T n
1659 green round None A2 1659 green round None D2 T n
1792 yellow round None A3 1792 yellow round None D3 C a
710 green round None A4 C A T n 710 green round None D4
195 green round None A5 T A T a 195 green round None D5
1597 yellow long None A6 C A T n 1597 yellow long None D6 C a
693 purple round None A7 C A T n 693 purple round None D7
1571 yellow round None A8 C A T n 1571 yellow round None D8
1581 purple round None A9 C A T n 1581 purple round None D9 T n
1637 purple long None A10 C A T n 1637 purple long None D10
706 green round Spines A11 C A T n 706 green round Spines D11
1567 green round None A12 C A T n 1567 green round None D12 T n
1298 Purple Long None B1 C A T n 1298 Purple Long None E1 T n
1290 green round None B2 C G T b 1290 green round None E2 T n
356 yellow round None B3 C A T n 356 yellow round None E3 T n
415 green round None B4 C G T b 415 green round None E4
197 green round None B5 C A G c 197 green round None E5 T n
1838 yellow long None B6 C A T n 1838 yellow long None E6
Individual 5GT Colour Long? Spines? Sample name position position position position position position position position position position position allele
187 204 205 222 237 264 348 369 420 430 470
1654 purple round None E7 A G T C T A A A C A C
1659 yellow round None
1792 purple round None E9 A G T C T A A A C A C n
710 purple long None E10 A G T C T A A A C T C a
195 green round Spines E11 A A T C T A G G T A T b
1597 green round None E12 A G T C T A A A C A C n
693 Purple Long None F1 A A T C T A A G T A T c
1571 green round None F2 A G T C T A A A C A C n
1581 yellow round None F3 A G T C T A A A C A C n
1637 green round None
706 green round None F5 A A T C T A A G T A T c
1567 yellow long None F6 A G T C T A A A C A C n
1298 purple round None F7 A G T C T A A A C A C n
1290 yellow round None F8 A G T C T A A A C A C n
356 purple round None F9 A G T C T A A A C A C n
415 purple long None
197 green round Spines F11 A G T T T A A A C A C d
1838 green round None F12 C G G C G C A A C A C e
Individual OV Colour Long? Spines? Sample name position position position position position allele
98 100 103 413 472
1654 Purple Long None G1 T G T C G n
1659 green round None G2 T C A C G a
1792 yellow round None G3 G A A T G b
710 green round None G4 T C T C G c
195 green round None G5 G A A C A d
1597 yellow long None G6 T G A C G e
693 purple round None G7 T C A C G a
1571 yellow round None G8 T C A C G a
1581 purple round None G9 T A A C G f
1637 purple long None G10 T C A C G a
706 green round Spines G11 T C A C G a
1567 green round None G12 T C A C G a
1298 Purple Long None H1 T A A C G f
1290 green round None H2 T C A C G a
356 yellow round None H3 T A A C G f
415 green round None H4 T C A C G a
197 green round None H5 T A A C G f
1838 yellow long None H6 T C T C G c