Embed Size (px)
Citation preview
Distance Education at Degree-Granting Postsecondary Institutions: 2006–07
Dista
nce
Ed
uca
tion
at D
eg
ree
-Gra
ntin
g P
ostse
con
da
ry Institu
tion
s: 20
06
–0
7
NCES 2009-044 U.S. DEPARTMENT OF EDUCATION
ies.ed.gov
First Look
www.ed.gov
20
08
Distance Education at Degree-Granting Postsecondary Institutions: 2006–07 First Look December 2008
Basmat Parsad Laurie Lewis Westat Peter Tice Project Officer National Center for Education Statistics
NCES 2009–044
U.S. DEPARTMENT OF EDUCATION
U.S. Department of Education Margaret Spellings Secretary
Institute of Education Sciences Sue Betka Acting Director
National Center for Education Statistics Stuart Kerachsky Acting Commissioner
The National Center for Education Statistics (NCES) is the primary federal entity for collecting, analyzing, and reporting data related to education in the United States and other nations. It fulfills a congressional mandate to collect, collate, analyze, and report full and complete statistics on the condition of education in the United States; conduct and publish reports and specialized analyses of the meaning and significance of such statistics; assist state and local education agencies in improving their statistical systems; and review and report on education activities in foreign countries.
NCES activities are designed to address high-priority education data needs; provide consistent, reliable, complete, and accurate indicators of education status and trends; and report timely, useful, and high-quality data to the U.S. Department of Education, the Congress, the states, other education policymakers, practitioners, data users, and the general public. Unless specifically noted, all information contained herein is in the public domain.
We strive to make our products available in a variety of formats and in language that is appropriate to a variety of audiences. You, as our customer, are the best judge of our success in communicating information effectively. If you have any comments or suggestions about this or any other NCES product or report, we would like to hear from you. Please direct your comments to
National Center for Education Statistics Institute of Education Sciences U.S. Department of Education 1990 K Street NW Washington, DC 20006-5651
December 2008
The NCES World Wide Web Home Page address is http://nces.ed.gov. The NCES World Wide Web Electronic Catalog is http://nces.ed.gov/pubsearch.
Suggested Citation Parsad, B., and Lewis, L. (2008). Distance Education at Degree-Granting Postsecondary Institutions: 2006–07 (NCES 2009–044). National Center for Education Statistics, Institute of Education Sciences, U.S. Department of Education. Washington, DC.
For ordering information on this report, write to U.S. Department of Education ED Pubs P.O. Box 1398 Jessup, MD 20794-1398
or call toll free 1-877-4ED-Pubs or order online at http://www.edpubs.org.
Content Contact Peter Tice (202) 502-7497 [email protected]

iii
Acknowledgments
The authors would like to recognize the respondents from postsecondary institutions who provided
data on distance education upon which the report is based. We also thank the sponsors from the Office of Educational Technology.

This page intentionally left blank.
v
Contents
Page Acknowledgments ..........................................................................................................................iii List of Tables ..................................................................................................................................vi Appendix A Tables .......................................................................................................................viii First Look Summary ........................................................................................................................ 1
Introduction.............................................................................................................................. 1 Selected Findings ..................................................................................................................... 2
Tables............................................................................................................................................... 5 References...................................................................................................................................... 19 Appendix A: Standard Error Tables ...........................................................................................A-1 Appendix B: Technical Notes..................................................................................................... B-1 Appendix C: Questionnaire ........................................................................................................ C-1
vi
List of Tables
Table Page
1 Total number of 2-year and 4-year Title IV degree-granting postsecondary institutions, and percent that offered distance education courses, by course type, institutional type, and institution size: 2006–07......................................................... 5
2 Percent of 2-year and 4-year Title IV degree-granting postsecondary institutions
offering online, hybrid/blended online, and other types of college-level credit-granting distance education courses, by course type, institutional type, and institution size: 2006–07 .............................................................................................. 6
3 Percentage distribution of 2-year and 4-year Title IV degree-granting
postsecondary institutions offering distance education that reported the minimum amount of online instruction or other criteria required to formally designate courses as online, by institutional type and institution size: 2006–07 ...................................... 7
4 Total number of enrollments in college-level credit-granting distance education
courses at 2-year and 4-year Title IV degree-granting postsecondary institutions, by course type, institutional type, and institution size: 2006–07 ................................. 8
5 Total enrollments in online, hybrid/blended online, and other types of college-level
credit-granting distance education courses at 2-year and 4-year Title IV degree-granting postsecondary institutions, and percent of total distance education enrollments, by course level, institutional type, and institution size: 2006–07 ........... 9
6 Percent of all 2-year and 4-year Title IV degree-granting postsecondary institutions
offering any college-level credit-granting distance education courses, and percent that had college-level degree or certificate programs designed to be completed totally through distance education, by program level, institutional type, and institution size: 2006–07.............................................................................................. 10
7 Total number of college-level degree or certificate programs designed to be
completed totally through distance education at 2-year and 4-year Title IV degree-granting postsecondary institutions, and percent of total distance education programs, by program type, program level, institutional type, and institution size: 2006–07 ........................................................................................................................ 11
8 Percent of 2-year and 4-year Title IV degree-granting postsecondary institutions
offering any academic distance education courses for elementary or secondary students, by course type, institutional type, and institution size: 2006–07 .................. 12
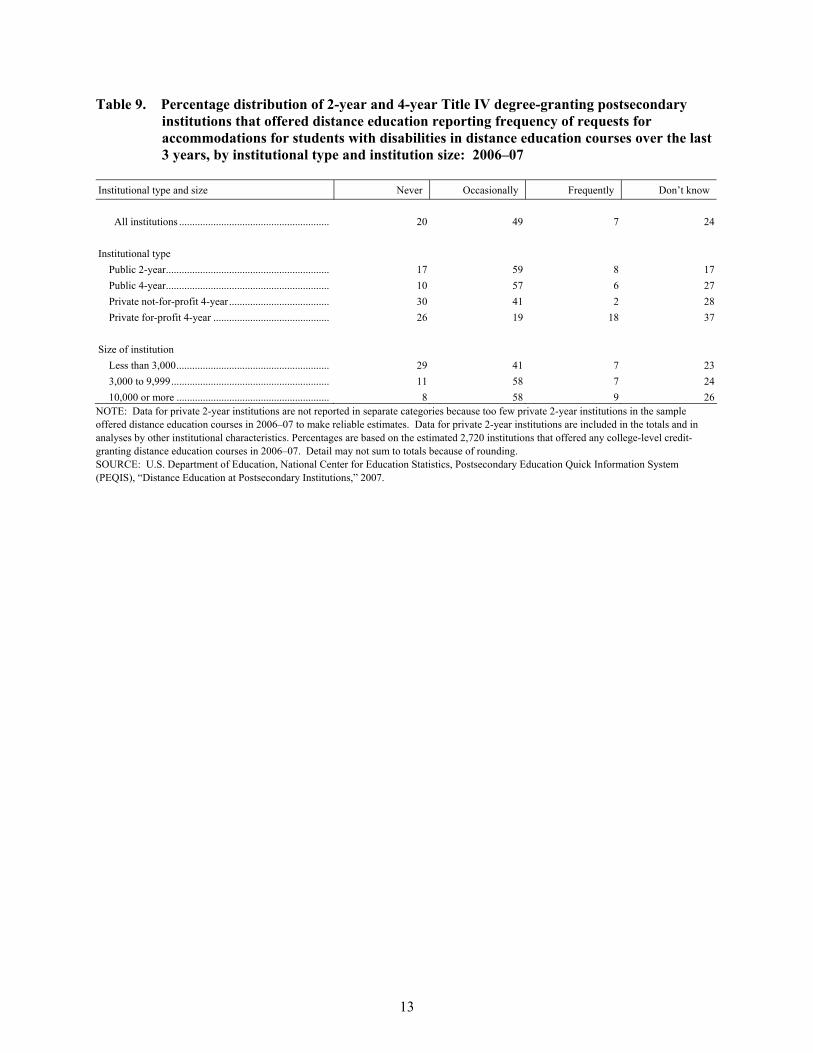
9 Percentage distribution of 2-year and 4-year Title IV degree-granting
postsecondary institutions that offered distance education reporting frequency of requests for accommodations for students with disabilities in distance education courses over the last 3 years, by institutional type and institution size: 2006–07........ 13
vii
List of Tables (Continued)
Table Page 10 Percentage distribution of 2-year and 4-year Title IV degree-granting
postsecondary institutions offering any distance education courses reporting use of various technologies or media for instruction in college-level credit-granting distance education courses: 2006–07........................................................................... 14
11 Percent of 2-year and 4-year Title IV degree-granting postsecondary institutions
offering any distance education courses reporting that they used various technologies or mediums to a moderate or large extent for instructional delivery of college-level credit-granting distance education courses, by institutional type and institution size: 2006–07 .............................................................................................. 15
12 Percentage distribution of 2-year and 4-year Title IV degree-granting
postsecondary institutions offering any distance education courses reporting the extent to which various factors affected decisions regarding distance education offerings: 2006–07....................................................................................................... 16
13 Percent of 2-year and 4-year Title IV degree-granting postsecondary institutions
offering any distance education courses reporting that various factors affected decisions regarding distance education offerings to a moderate or major extent, by institutional type and institution size: 2006–07 ...................................................... 17
14 Percent of 2-year and 4-year Title IV degree-granting postsecondary institutions
indicating means for acquiring or developing distance education courses, by credit/noncredit courses, institutional type, and institution size: 2006–07 ............. 18
viii
Appendix A Tables Table Page
1a Standard errors for the total number of 2-year and 4-year Title IV degree-granting
postsecondary institutions, and percent that offered distance education courses, by course type, institutional type, and institution size: 2006–07 ............................... A-3
2a Standard errors for the percent of 2-year and 4-year Title IV degree-granting
postsecondary institutions offering online, hybrid/blended online, and other types of college-level credit-granting distance education courses, by course type, institutional type, and institution size: 2006–07......................................................... A-4
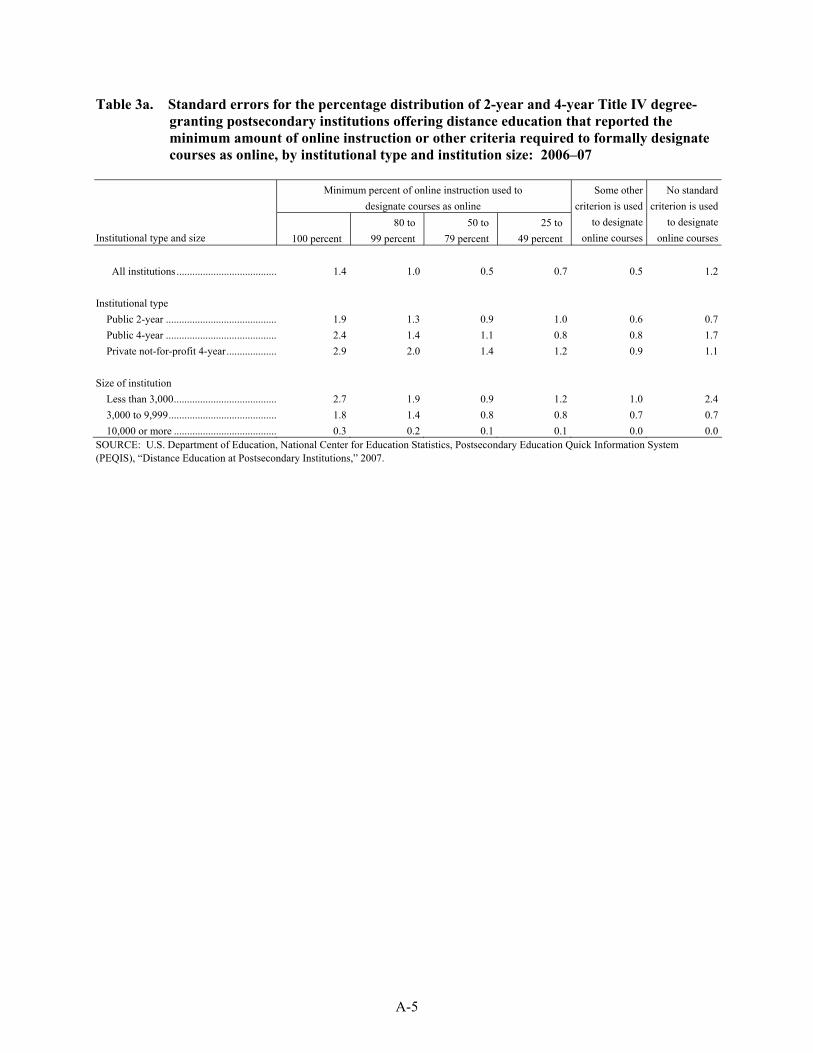
3a Standard errors for the percentage distribution of 2-year and 4-year Title IV
degree-granting postsecondary institutions offering distance education that reported the minimum amount of online instruction or other criteria required to formally designate courses as online, by institutional type and institution size: 2006–07....................................................................................................................... A-5
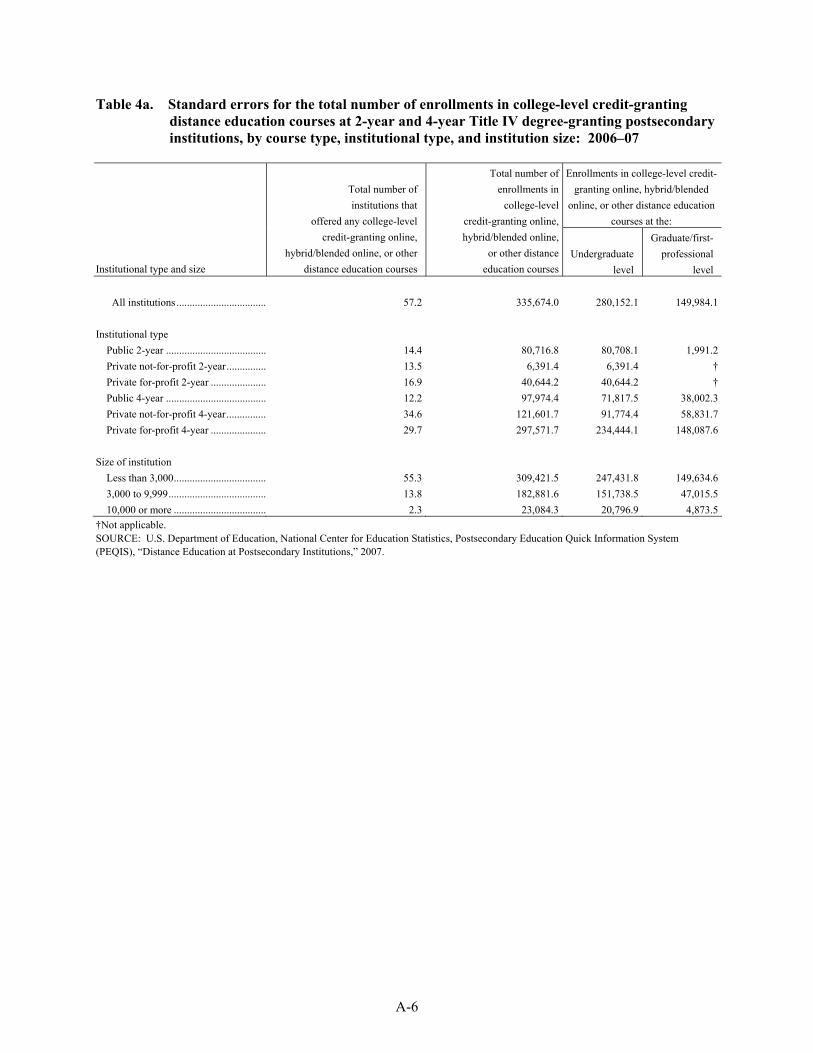
4a Standard errors for the total number of enrollments in college-level credit-granting
distance education courses at 2-year and 4-year Title IV degree-granting postsecondary institutions, by course type, institutional type, and institution size: 2006–07....................................................................................................................... A-6
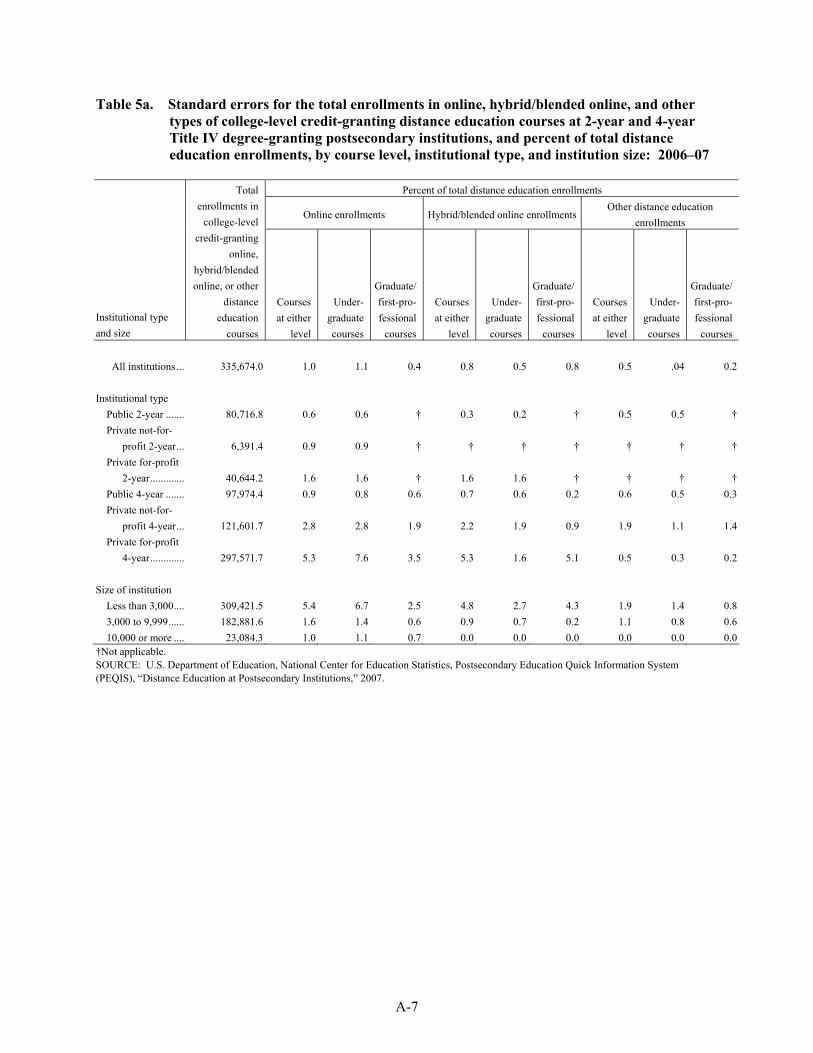
5a Standard errors for the total enrollments in online, hybrid/blended online, and
other types of college-level credit-granting distance education courses at 2-year and 4-year Title IV degree-granting postsecondary institutions, and percent of total distance education enrollments, by course level, institutional type, and institution size: 2006–07 ............................................................................................ A-7
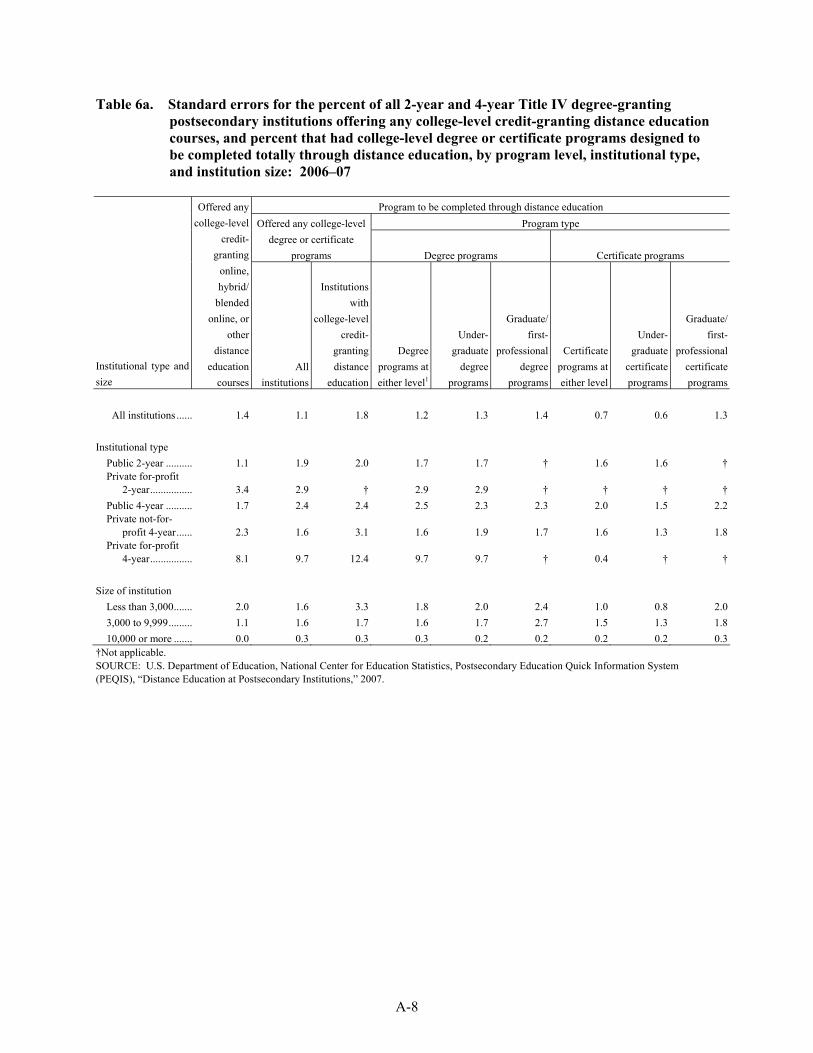
6a Standard errors for the percent of all 2-year and 4-year Title IV degree-granting
postsecondary institutions offering any college-level credit-granting distance education courses, and percent that had college-level degree or certificate programs designed to be completed totally through distance education, by program level, institutional type, and institution size: 2006–07 ........................... A-8
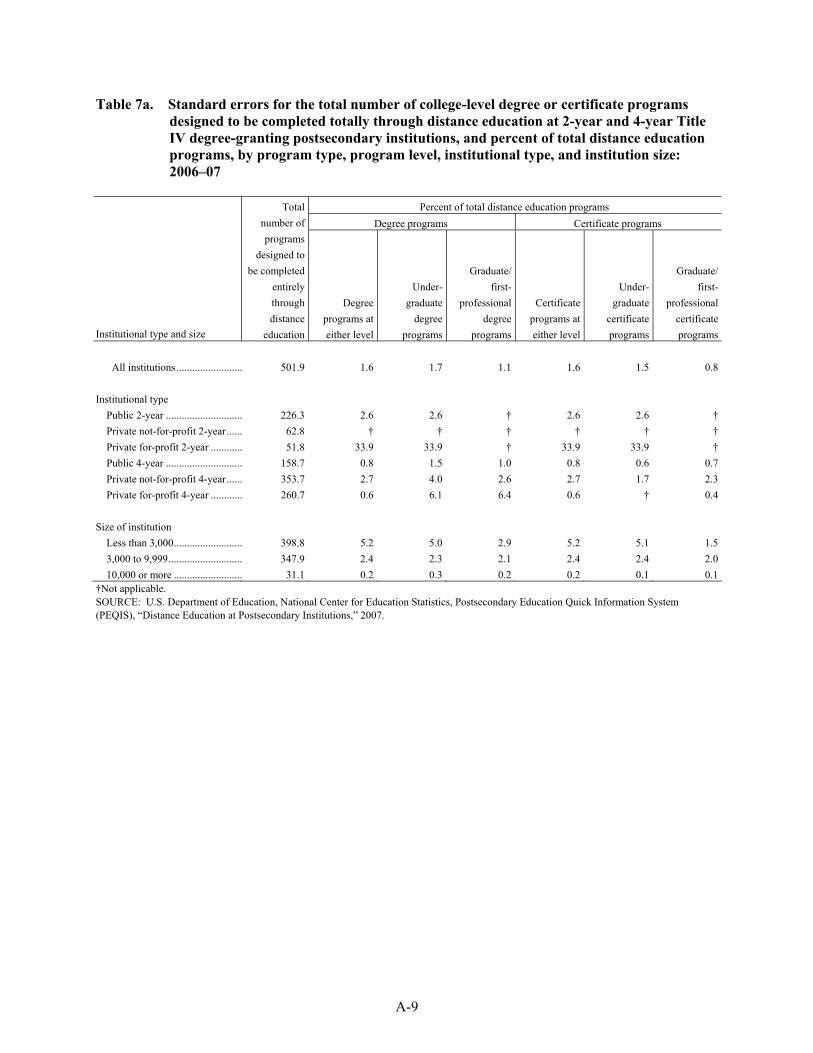
7a Standard errors for the total number of college-level degree or certificate programs
designed to be completed totally through distance education at 2-year and 4-year Title IV degree-granting postsecondary institutions, and percent of total distance education programs, by program type, program level, institutional type, and institution size: 2006–07 ............................................................................................ A-9
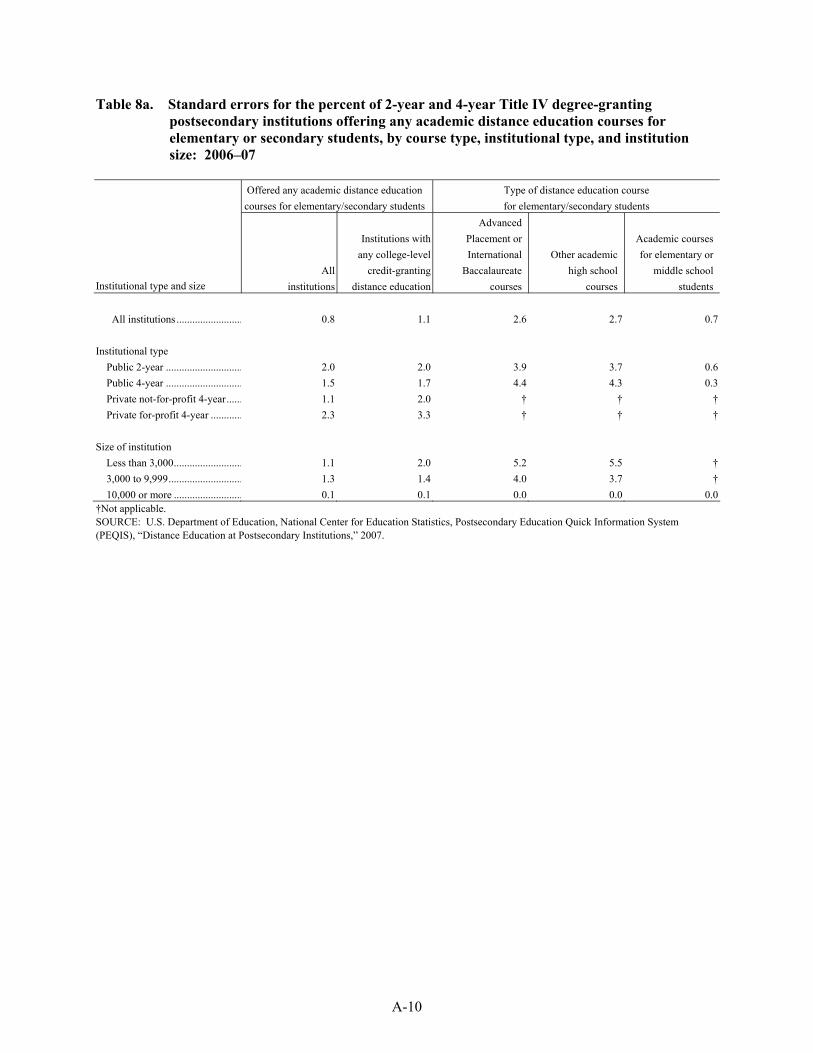
8a Standard errors for the percent of 2-year and 4-year Title IV degree-granting
postsecondary institutions offering any academic distance education courses for elementary or secondary students, by course type, institutional type, and institution size: 2006–07 ............................................................................................ A-10
ix
Appendix A Tables (Continued) Table Page
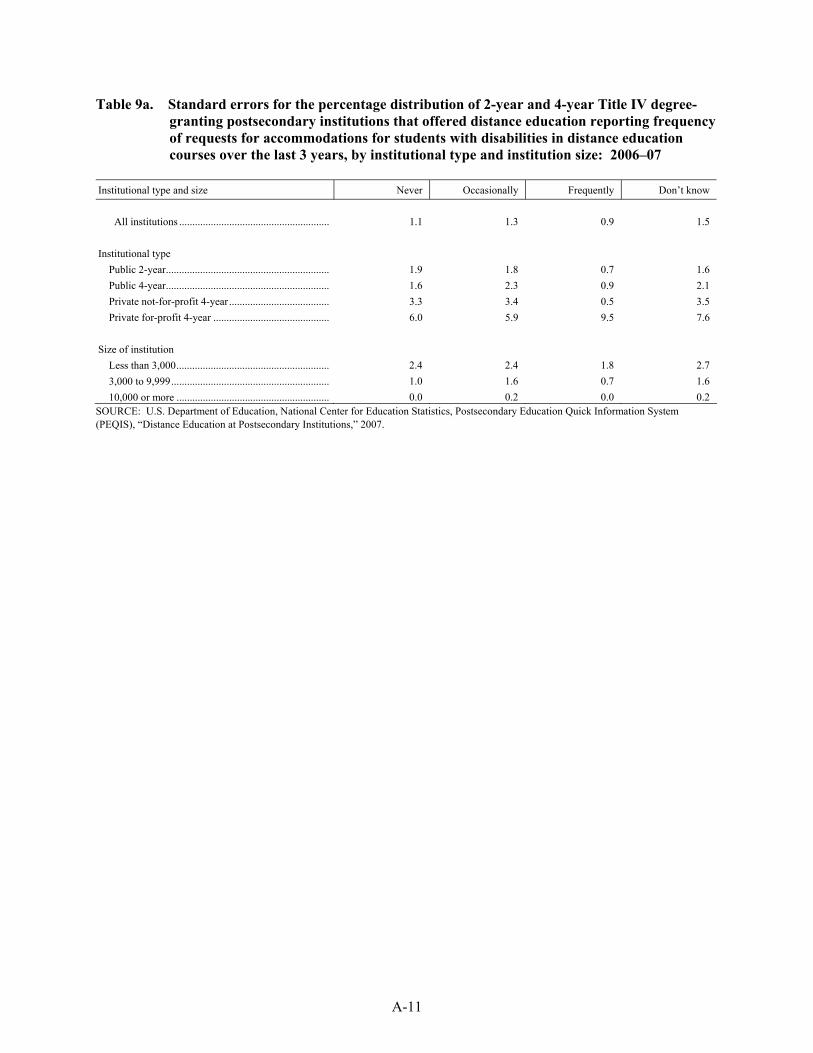
9a Standard errors for the percentage distribution of 2-year and 4-year Title IV
degree-granting postsecondary institutions that offered distance education reporting frequency of requests for accommodations for students with disabilities in distance education courses over the last 3 years, by institutional type and institution size: 2006–07 ............................................................................................ A-11
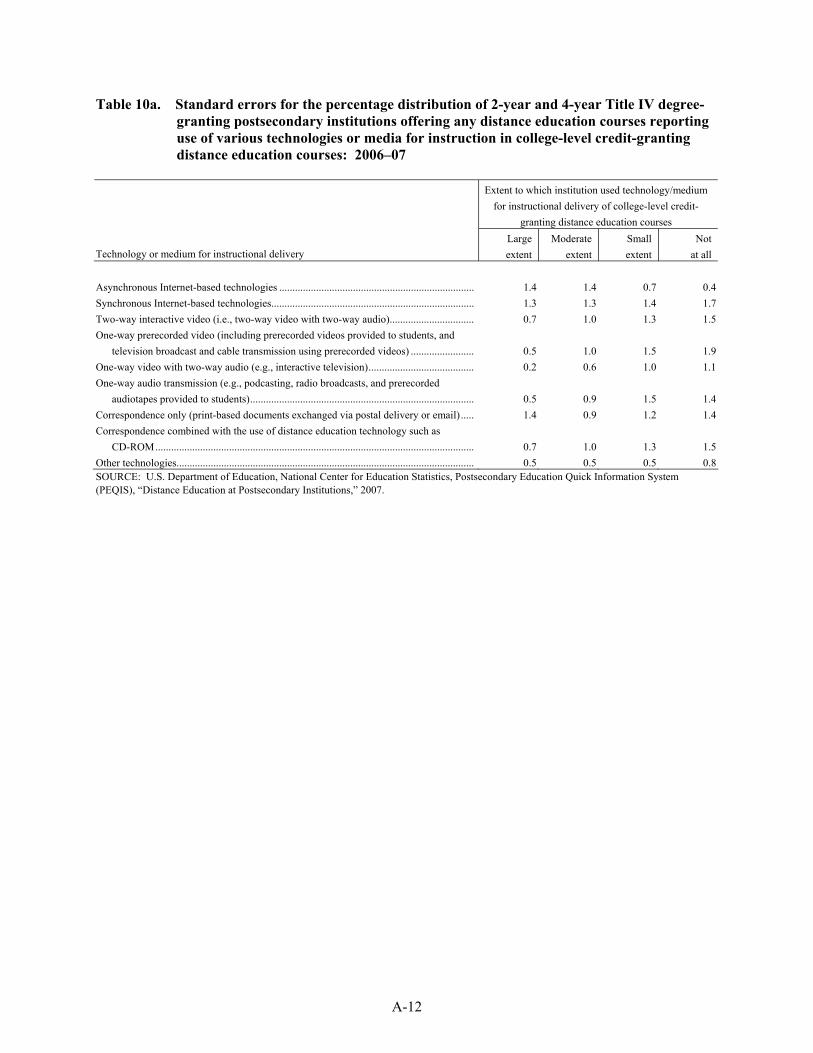
10a Standard errors for the percentage distribution of 2-year and 4-year Title IV
degree-granting postsecondary institutions offering any distance education courses reporting use of various technologies or media for instruction in college-level credit-granting distance education courses: 2006–07.................................................. A-12
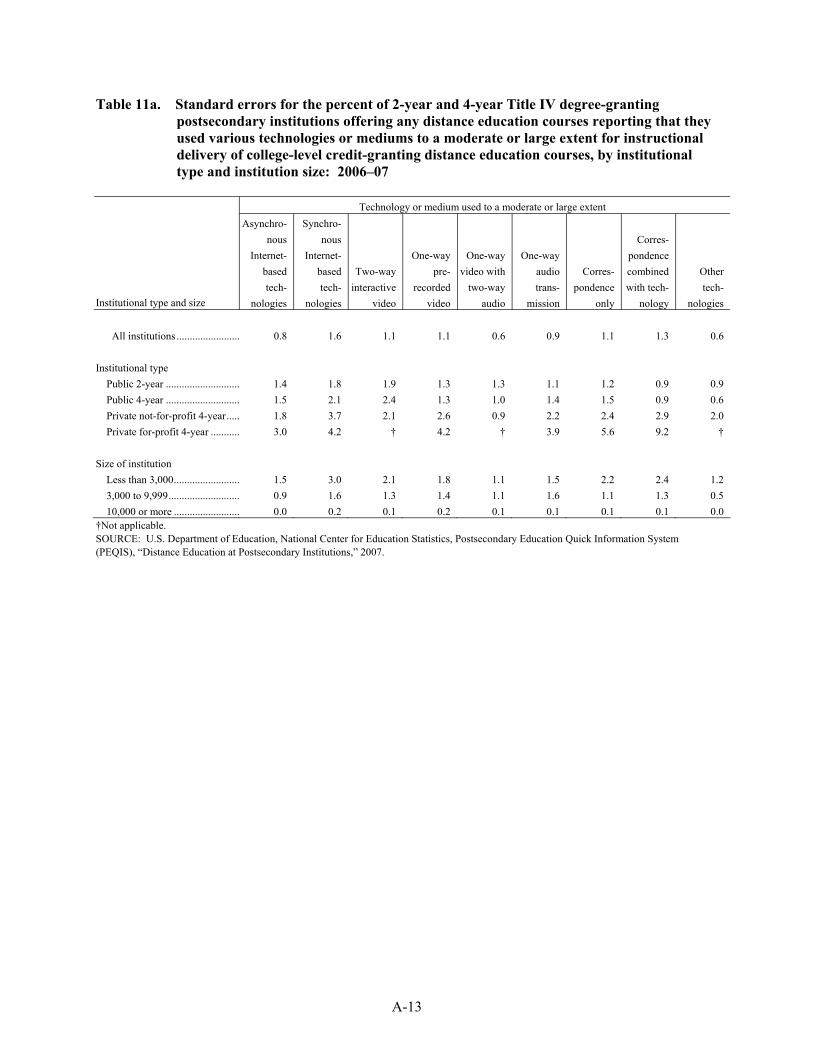
11a Standard errors for the percent of 2-year and 4-year Title IV degree-granting
postsecondary institutions offering any distance education courses reporting that they used various technologies or mediums to a moderate or large extent for instructional delivery of college-level credit-granting distance education courses, by institutional type and institution size: 2006–07..................................................... A-13
12a Standard errors for the percentage distribution of 2-year and 4-year Title IV
degree-granting postsecondary institutions offering any distance education courses reporting the extent to which various factors affected decisions regarding distance education offerings: 2006–07..................................................................................... A-14
13a Standard errors for the percent of 2-year and 4-year Title IV degree-granting
postsecondary institutions offering any distance education courses reporting that various factors affected decisions regarding distance education offerings to a moderate or major extent, by institutional type and institution size: 2006–07........... A-15
14a Standard errors for the percent of 2-year and 4-year Title IV degree-granting
postsecondary institutions indicating means for acquiring or developing distance education courses, by credit/noncredit courses, institutional type, and institution size: 2006–07 ............................................................................................................. A-16

This page intentionally left blank.
1
First Look Summary
Introduction
This report provides national estimates on distance education at degree-granting postsecondary institutions in the 2006–07 academic year.1 The survey is the fourth of its kind undertaken by the National Center for Education Statistics (NCES); the first survey was conducted in 1995, the second in 1998, and the third in 2002. For the 2006–07 study, distance education was defined as a formal education process in which the student and instructor are not in the same place. Thus, instruction may be synchronous or asynchronous, and it may involve communication through the use of video, audio, or computer technologies, or by correspondence (which may include both written correspondence and the use of technology such as CD-ROM).2 While this report covers many of the topics in the previous reports, the data are not comparable. The definition of distance education in the 2006–07 study reflected two major changes from earlier studies. First, the definition no longer included a criterion for instructional delivery to off-campus or remote locations because online courses could be accessed on campus at a convenient time and place (e.g., between classes and in a computer lab). Second, the definition included correspondence courses and distance education courses that were designated by institutions as hybrid/blended online courses.
The questionnaire instructed institutions to include distance education courses and programs that
were formally designated as online, hybrid/blended online, and other distance education courses and programs. Institutions may have varied in the proportion of online instruction required for a course to be considered an online course or a hybrid/blended online course. For example, some institutions considered online courses as courses in which 100 percent of the instruction was delivered online, while others used various percentage cutoffs such as 80 percent, 70 percent, and 50 percent of online instruction. Hybrid/blended online courses were defined as a combination of online and in-class instruction with reduced in-class seat time for students. Thus, web-enhanced courses that did not result in reduced seat time (i.e., class time) were not intended to be included in the counts of hybrid/blended online courses.
The 2006–07 study on distance education collected information on the prevalence, types, delivery,
policies, and acquisition or development of distance education courses and programs. Specifically, the survey covered the following:
• Whether institutions offered various types of distance education courses, and enrollment in
those courses, including online, hybrid/blended online, and other distance education courses;
• Number and types of degree or certificate programs designed to be completed totally through distance education;
• Technologies used for the instructional delivery of distance education courses;
• Factors affecting institutions’ decisions about distance education;
1 The term distance education has been used interchangeably with distance learning in the literature. 2 Synchronous Internet-based technologies refer to simultaneous or “real-time” computer-based instruction, while asynchronous Internet-based technologies are used for courses that are not based on simultaneous computer-based instruction.
2
• Distance education offerings for elementary or secondary students; and
• Ways in which institutions acquired or developed their distance education courses.
The survey was conducted for NCES in fall 2007 using the Postsecondary Education Quick Information System (PEQIS). PEQIS is a survey system designed to collect small amounts of issue-oriented data from a previously recruited, nationally representative sample of institutions with minimal burden on respondents and within a relatively short period of time. Questionnaires were mailed to approximately 1,600 Title IV eligible, degree-granting postsecondary institutions in the 50 states and the District of Columbia. 3 The unweighted survey response rate was 90 percent, and the weighted response rate was 87 percent. Data were adjusted for questionnaire nonresponse and weighted to yield national estimates that represent the estimated 4,200 Title IV degree-granting postsecondary institutions in the United States.
Because the purpose of this report is to introduce new NCES data through the presentation of tables
containing descriptive information, only selected findings are presented. These findings have been chosen to demonstrate the range of information available from the PEQIS study rather than to discuss all of the observed differences; they are not meant to emphasize any particular issue. The findings are based on self-reported data from postsecondary institutions. Some of the survey responses (e.g., small, moderate, and large extent) were not defined for respondents.
All specific statements of comparisons made in the bullets have been tested for statistical
significance at the .05 level using Student’s t-statistics to ensure that the differences are larger than those that might be expected due to sampling variation. Adjustments for multiple comparisons were not included. Many of the variables examined are related to one another, and complex interactions and relationships have not been explored. Tables of standard error estimates are provided in appendix A. Detailed information about the survey methodology is provided in appendix B, and the questionnaire can be found in appendix C.
Selected Findings
This section presents key findings on distance education at Title IV degree-granting postsecondary institutions.
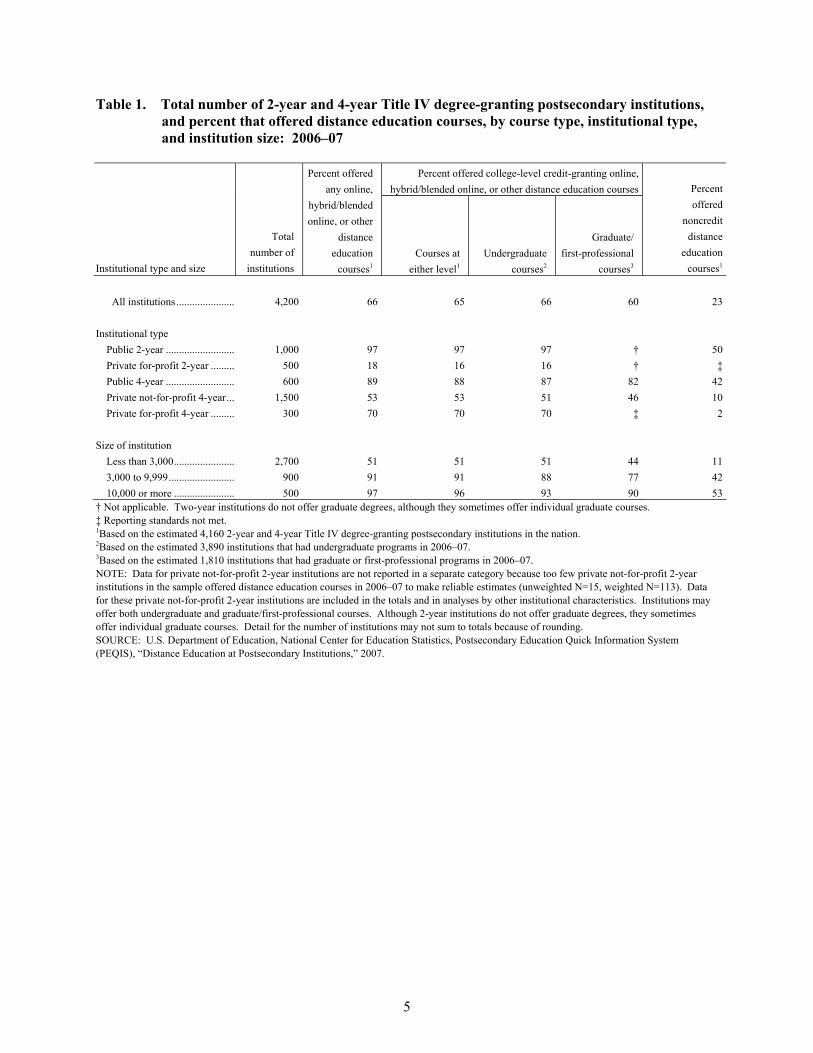
• During the 2006–07 academic year, two-thirds (66 percent) of 2-year and 4-year Title IV degree-
granting postsecondary institutions reported offering online, hybrid/blended online, or other distance education courses for any level or audience (table 1). Sixty-five percent of the institutions reported college-level credit-granting distance education courses, and 23 percent of the institutions reported noncredit distance education courses.
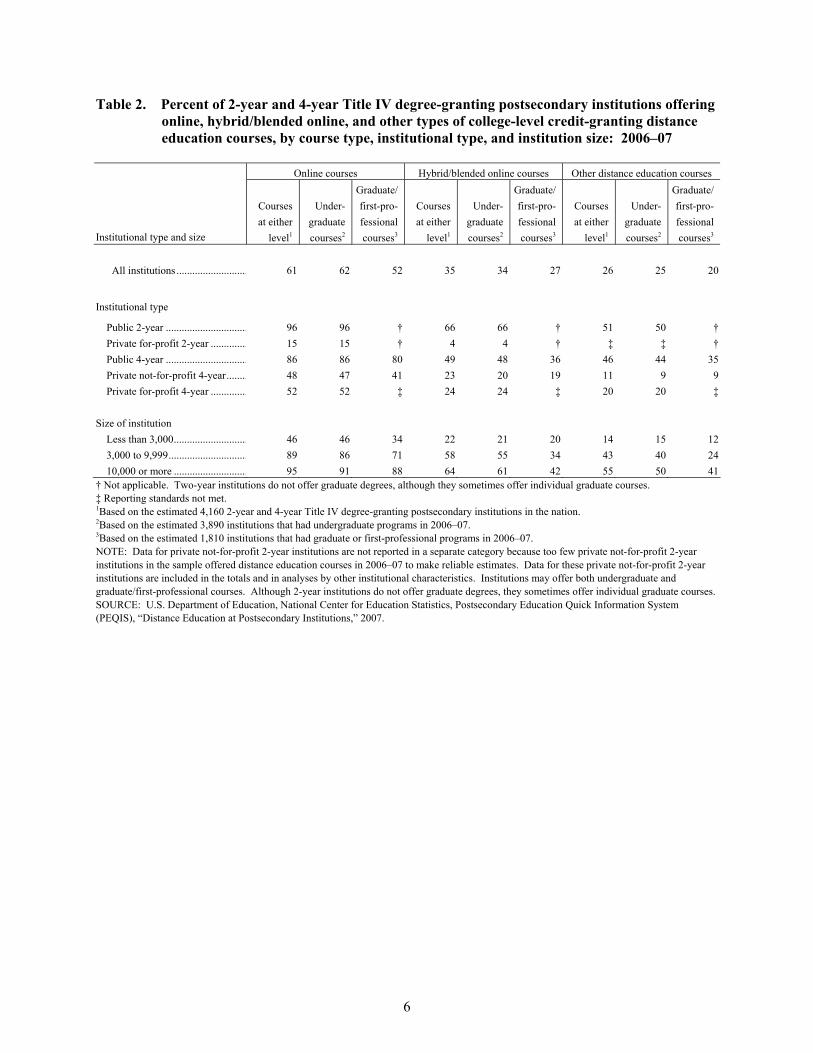
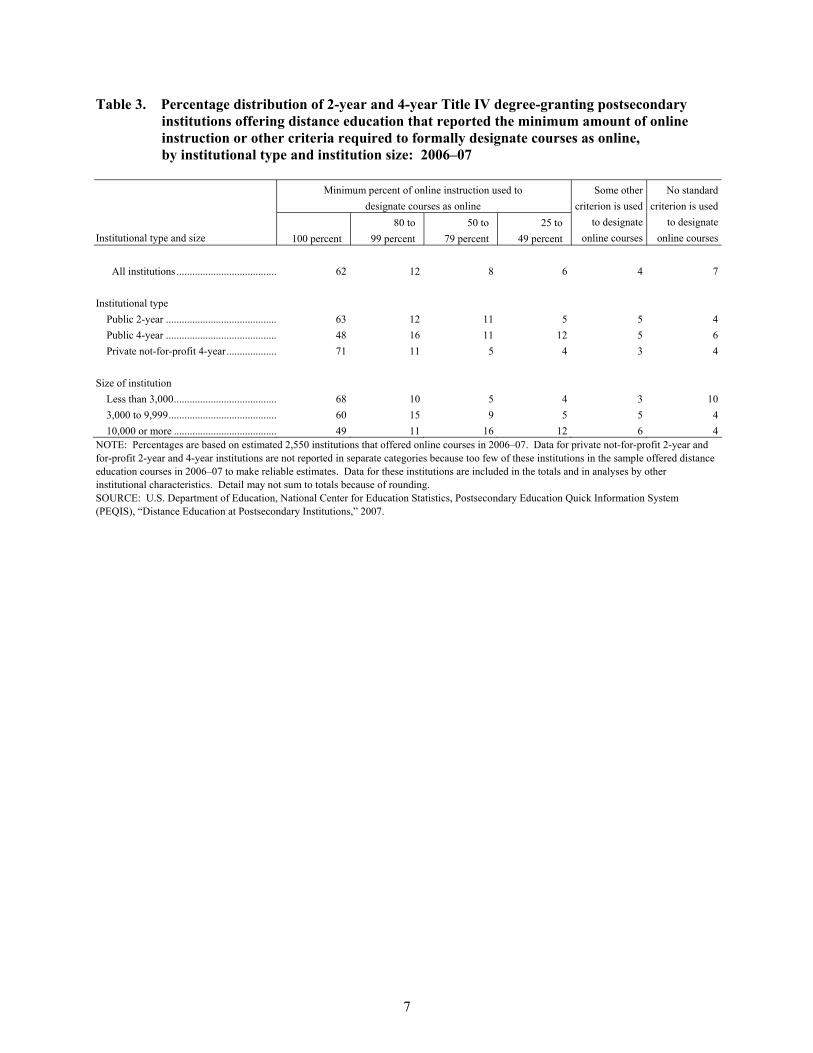
• Sixty-one percent of 2-year and 4-year institutions reported offering online courses, 35 percent reported hybrid/blended courses, and 26 percent reported other types of college-level credit-granting distance education courses in 2006–07 (table 2). Among institutions that offered online courses, 62 percent reported that 100 percent of the instruction in those courses must be online (table 3).
3 Institutions participating in Title IV federal student financial aid programs (such as Pell grants or Stafford loans) are accredited by an agency or organization recognized by the U.S. Department of Education, have a program of more than 300 clock hours or 8 credit hours, have been in business for at least 2 years, and have a signed Program Participation Agreement with the Office of Postsecondary Education (OPE), U.S. Department of Education. Degree-granting institutions are those that offer an associate’s, bachelor’s, master’s, doctor’s, or first-professional degree (Knapp et al. 2001).
3
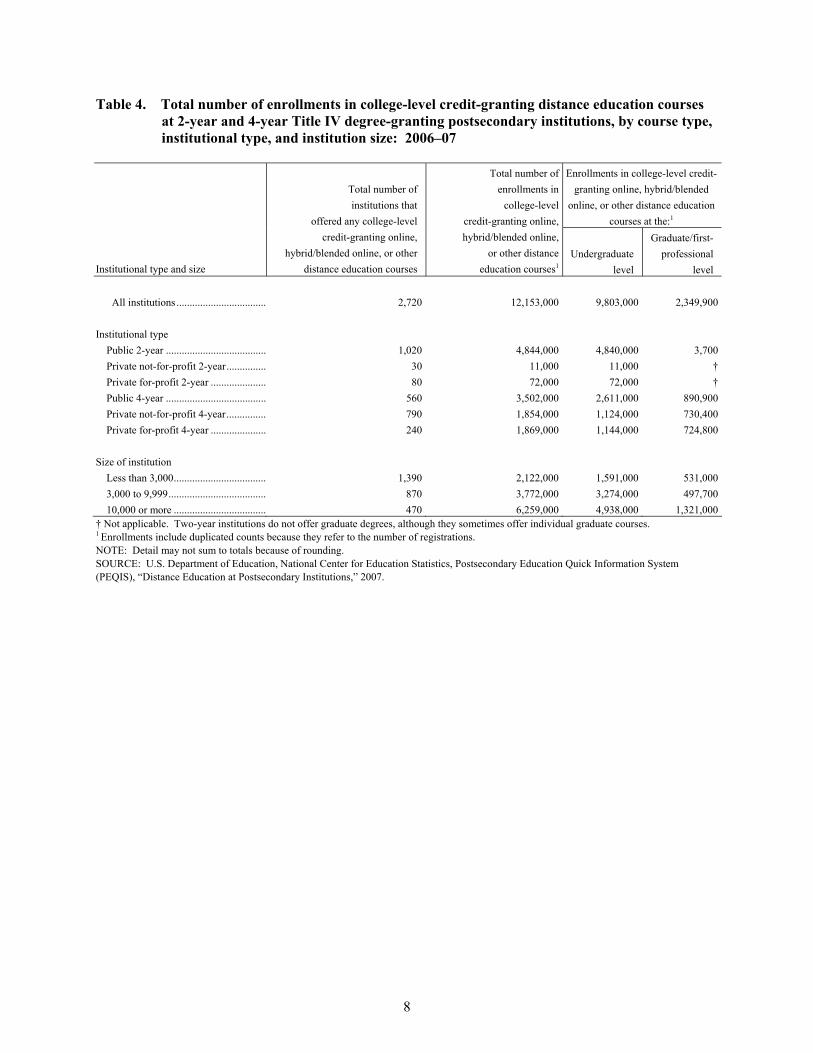
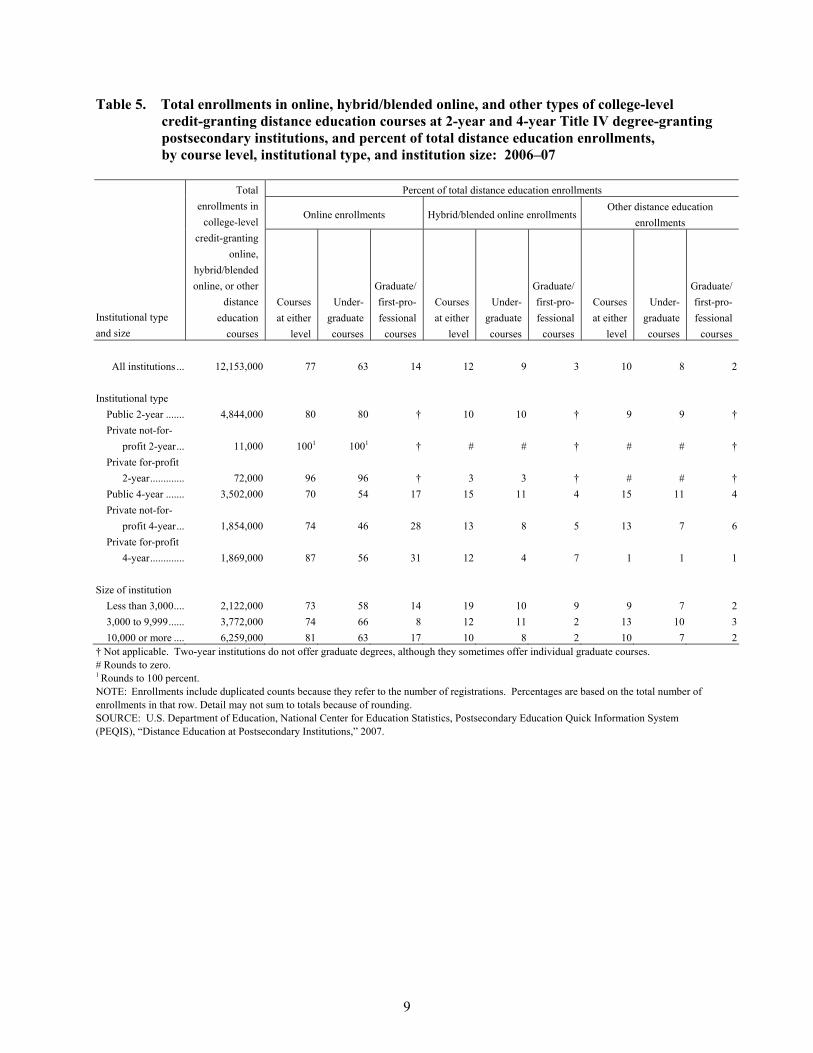
• In the 2006–07 academic year, 2-year and 4-year institutions reported an estimated 12.2 million enrollments (or registrations) in college-level credit-granting distance education courses (table 4). Of these distance education enrollments, 77 percent were reported in online courses, 12 percent were reported in hybrid/blended online courses, and 10 percent were reported in other types of distance education courses (table 5).
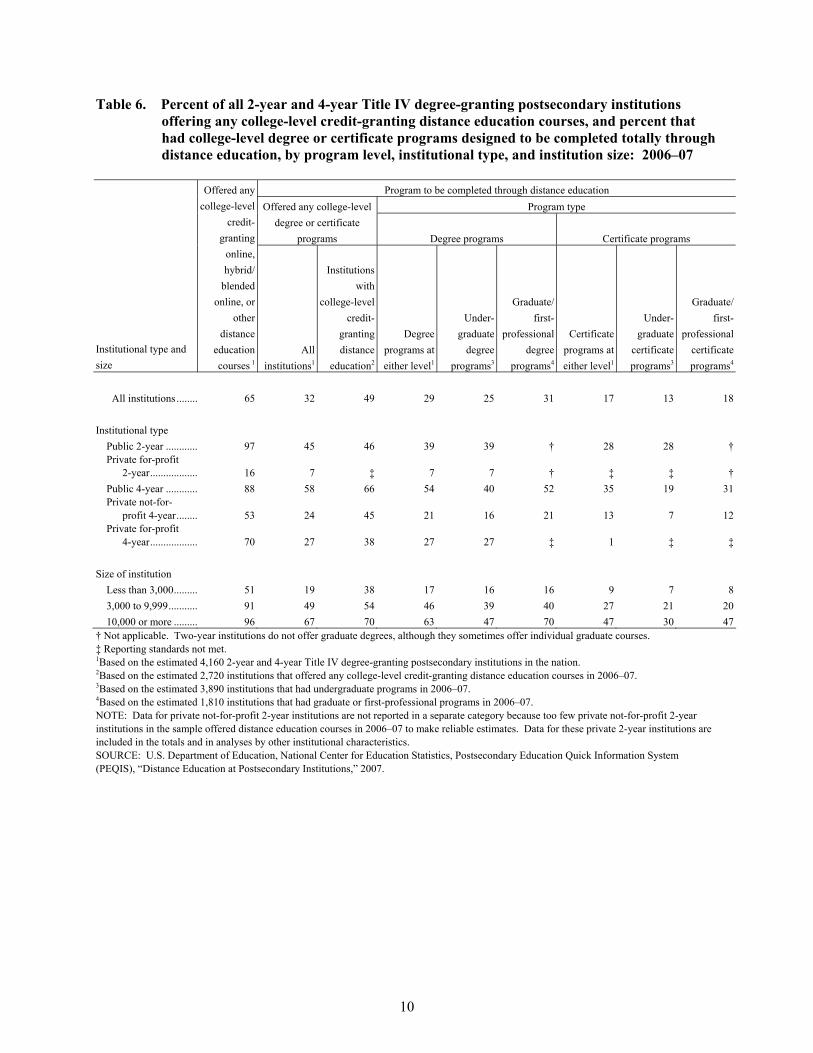
• Thirty-two percent of all 2-year and 4-year institutions reported offering college-level degree or certificate programs that were designed to be completed totally through distance education in 2006–07 (table 6). Twenty-nine percent of 2-year and 4-year institutions reported degree programs and 17 percent reported certificate programs that were designed to be completed totally through distance education.
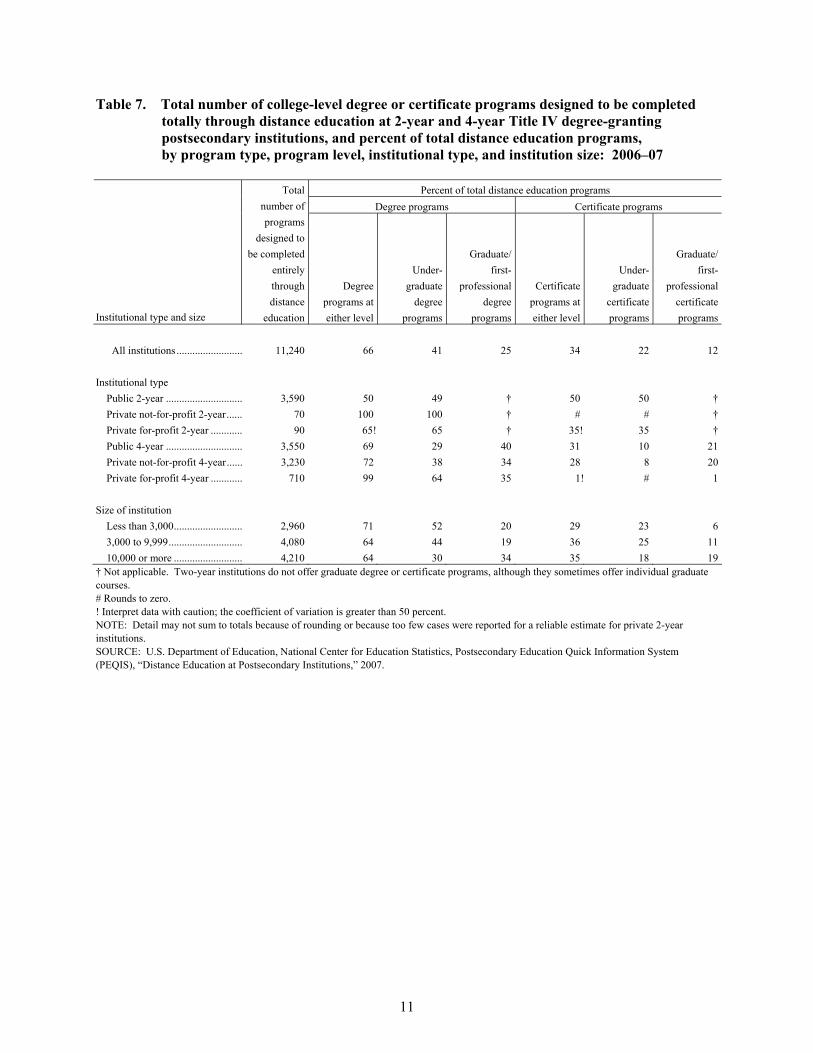
• Of the estimated 11,200 college-level programs that were designed to be completed totally through distance education in 2006–07, 66 percent were reported as degree programs while the remaining 34 percent were reported as certificate programs (table 7).
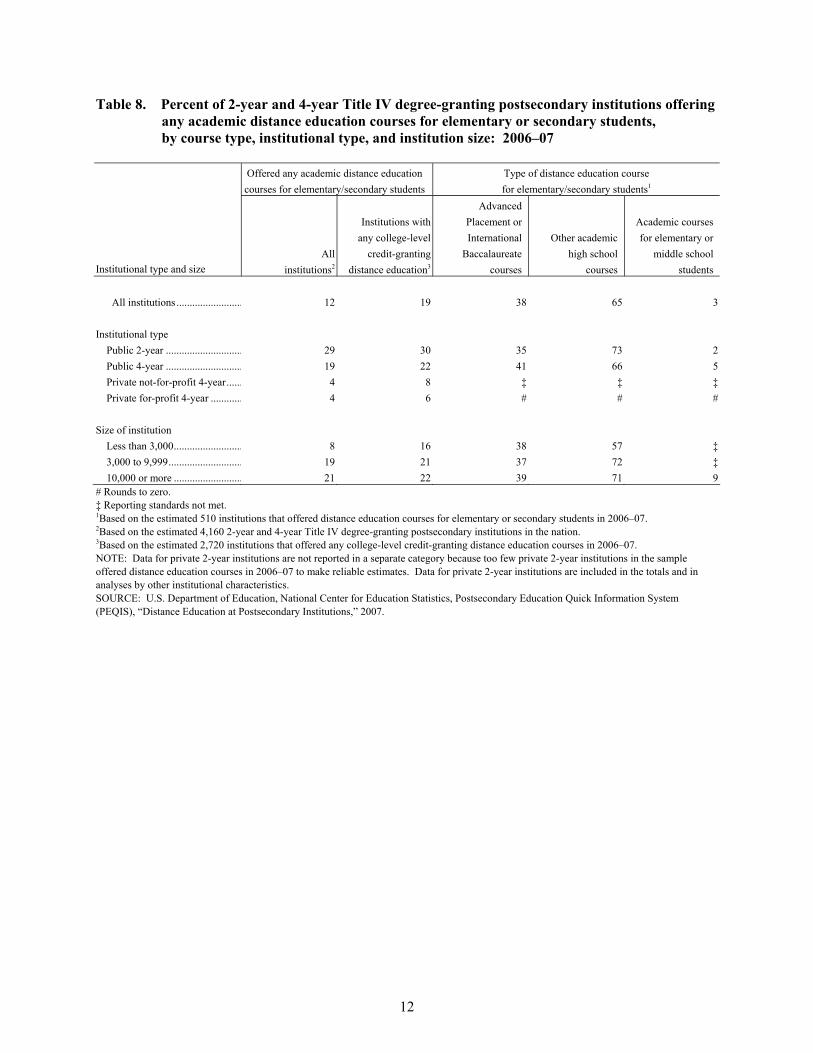
• Twelve percent of all 2-year and 4-year institutions reported offering academic distance education courses for elementary or secondary students in 2006–07 (table 8). Of these institutions, 38 percent reported Advanced Placement or International Baccalaureate courses, 65 percent reported other academic high school courses, and 3 percent reported academic courses specifically for elementary or middle school students.
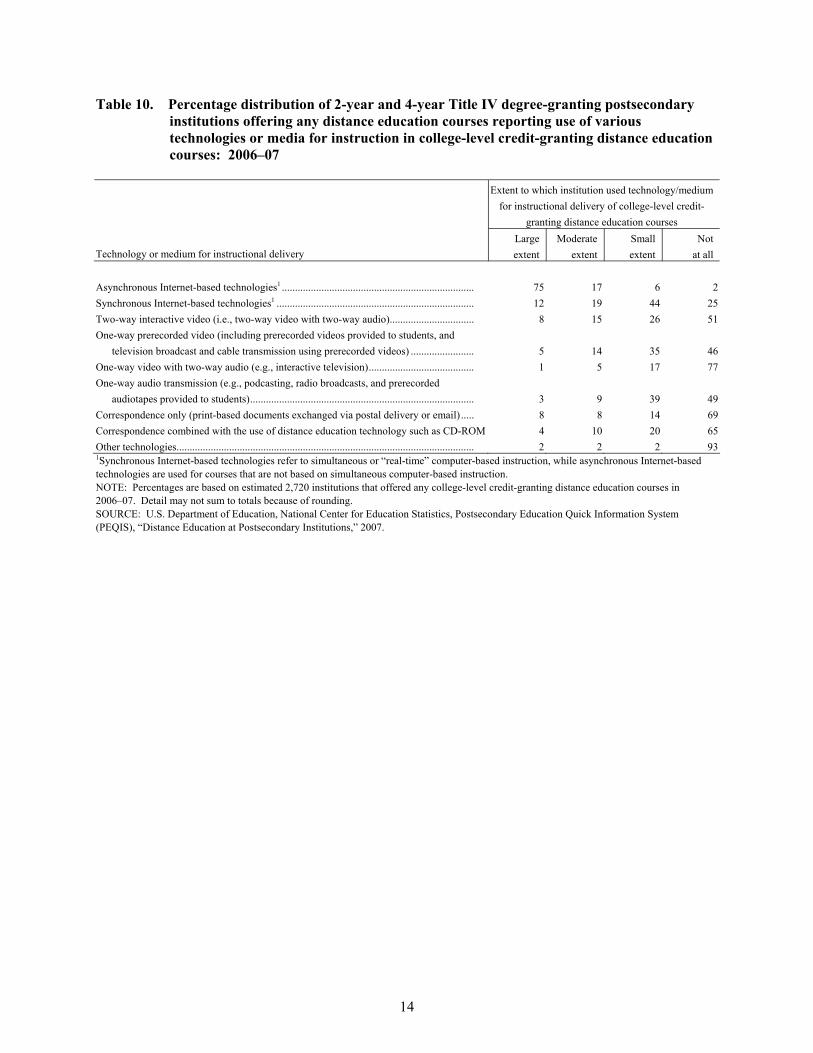
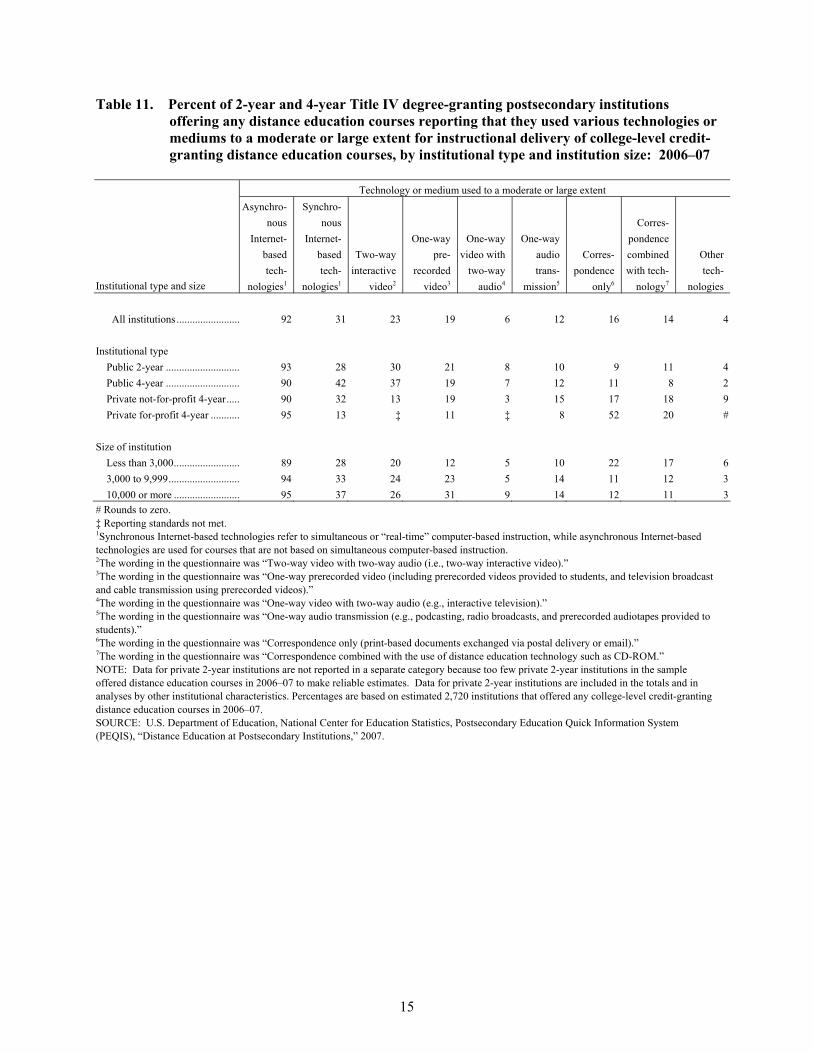
• Asynchronous (not simultaneous or real-time) Internet-based technologies were cited as the most widely used technology for the instructional delivery of distance education courses; they were used to a large extent in 75 percent and to a moderate extent in 17 percent of the institutions that offered college-level credit-granting distance education courses (table 10). The proportion of institutions that reported using various other types of technologies or media to a moderate or large extent ranged from 4 percent for other technologies to 31 percent for synchronous (simultaneous or real-time) Internet-based technologies (table 11).
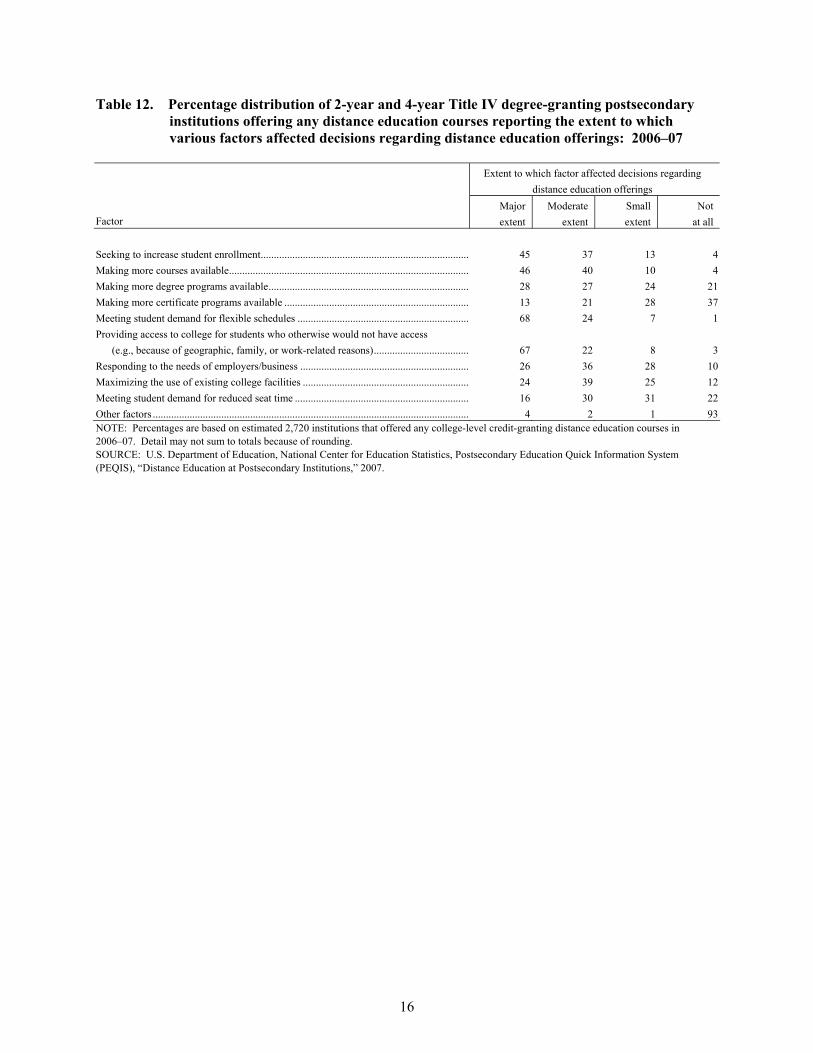
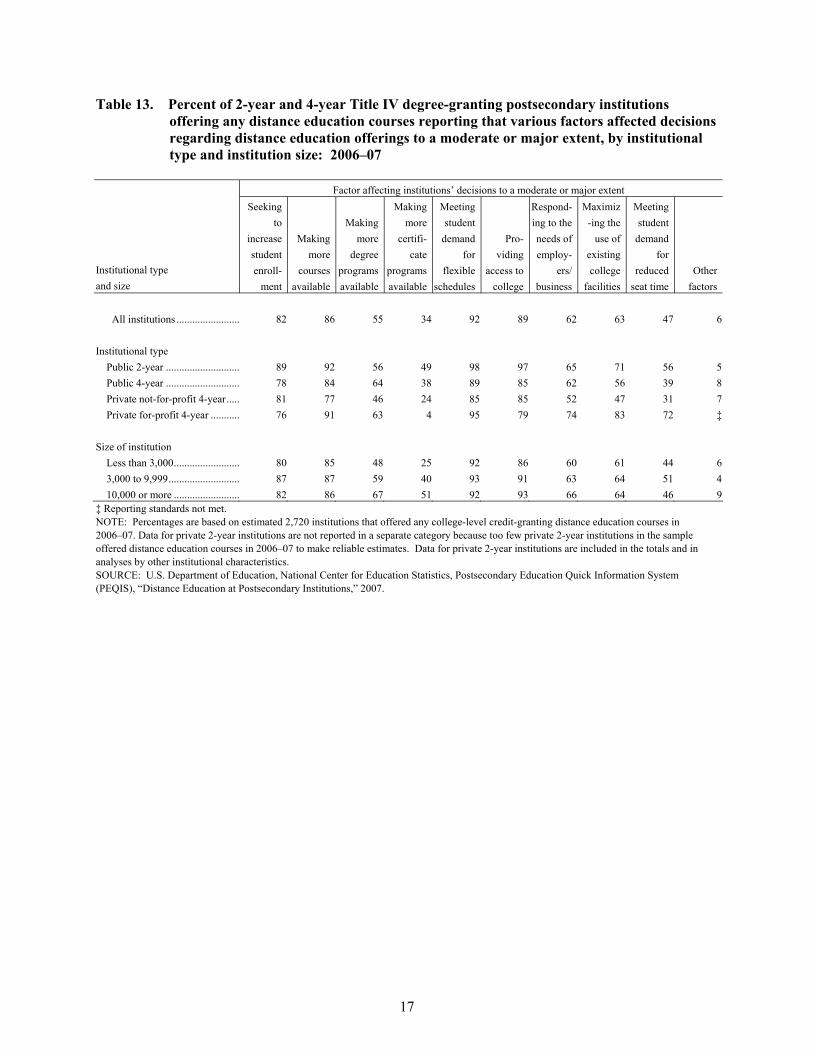
• The most common factors cited as affecting distance education decisions to a major extent were meeting student demand for flexible schedules (68 percent), providing access to college for students who would otherwise not have access (67 percent), making more courses available (46 percent), and seeking to increase student enrollment (45 percent) (table 12). These same factors were rated as affecting distance education decisions to a moderate or major extent in 82 percent to 92 percent of the 2-year and 4-year institutions that offered college-level credit-granting distance education courses (table 13). The proportion of institutions that rated various other factors as affecting distance education to a moderate or major extent ranged from 6 percent for “other factors” to 63 percent for maximizing the use of existing college facilities.
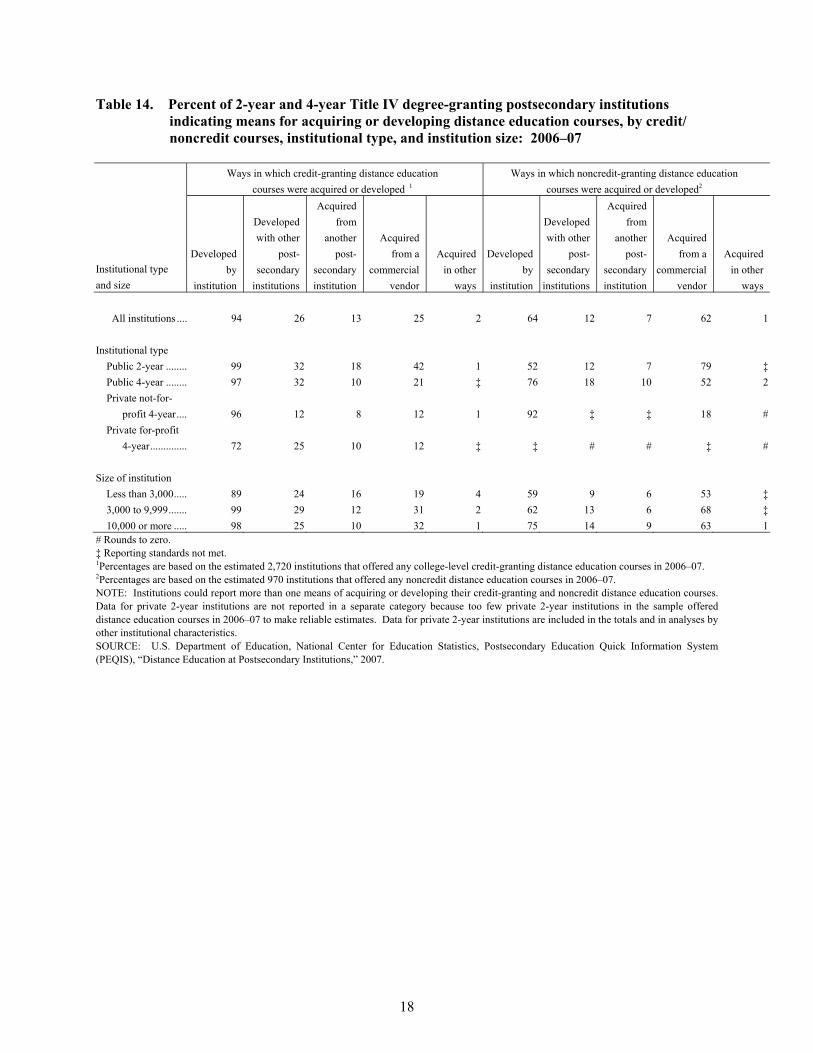
• Most 2-year and 4-year institutions that reported offering credit-granting distance education courses indicated that their institutions developed the distance education courses (94 percent) (table 14). Among institutions that reported offering noncredit distance education courses, 64 percent indicated that they developed their noncredit distance education courses, and 62 percent reported that they acquired the courses from a commercial vendor.

This page intentionally left blank.
5
Table 1. Total number of 2-year and 4-year Title IV degree-granting postsecondary institutions, and percent that offered distance education courses, by course type, institutional type, and institution size: 2006–07
Percent offered college-level credit-granting online,
hybrid/blended online, or other distance education courses
Institutional type and size
Total number of
institutions
Percent offered any online,
hybrid/blended online, or other
distance education
courses1 Courses at
either level1 Undergraduate
courses2
Graduate/ first-professional
courses3
Percent offered
noncredit distance
education courses1
All institutions ....................... 4,200 66 65 66 60 23 Institutional type Public 2-year ........................... 1,000 97 97 97 † 50 Private for-profit 2-year .......... 500 18 16 16 † ‡ Public 4-year ........................... 600 89 88 87 82 42 Private not-for-profit 4-year.... 1,500 53 53 51 46 10 Private for-profit 4-year .......... 300 70 70 70 ‡ 2 Size of institution Less than 3,000........................ 2,700 51 51 51 44 11 3,000 to 9,999.......................... 900 91 91 88 77 42 10,000 or more ........................ 500 97 96 93 90 53† Not applicable. Two-year institutions do not offer graduate degrees, although they sometimes offer individual graduate courses. ‡ Reporting standards not met. 1Based on the estimated 4,160 2-year and 4-year Title IV degree-granting postsecondary institutions in the nation. 2Based on the estimated 3,890 institutions that had undergraduate programs in 2006–07. 3Based on the estimated 1,810 institutions that had graduate or first-professional programs in 2006–07. NOTE: Data for private not-for-profit 2-year institutions are not reported in a separate category because too few private not-for-profit 2-year institutions in the sample offered distance education courses in 2006–07 to make reliable estimates (unweighted N=15, weighted N=113). Data for these private not-for-profit 2-year institutions are included in the totals and in analyses by other institutional characteristics. Institutions may offer both undergraduate and graduate/first-professional courses. Although 2-year institutions do not offer graduate degrees, they sometimes offer individual graduate courses. Detail for the number of institutions may not sum to totals because of rounding. SOURCE: U.S. Department of Education, National Center for Education Statistics, Postsecondary Education Quick Information System (PEQIS), “Distance Education at Postsecondary Institutions,” 2007.
6
Table 2. Percent of 2-year and 4-year Title IV degree-granting postsecondary institutions offering online, hybrid/blended online, and other types of college-level credit-granting distance education courses, by course type, institutional type, and institution size: 2006–07
Online courses Hybrid/blended online courses Other distance education courses
Institutional type and size
Courses at either
level1
Under-graduate courses2
Graduate/ first-pro-fessional courses3
Courses at either
level1
Under-graduate courses2
Graduate/ first-pro-fessional courses3
Courses at either
level1
Under-graduate courses2
Graduate/ first-pro-fessional courses3
All institutions ........................... 61 62 52 35 34 27 26 25 20
Institutional type Public 2-year ............................... 96 96 † 66 66 † 51 50 † Private for-profit 2-year .............. 15 15 † 4 4 † ‡ ‡ † Public 4-year ............................... 86 86 80 49 48 36 46 44 35 Private not-for-profit 4-year........ 48 47 41 23 20 19 11 9 9 Private for-profit 4-year .............. 52 52 ‡ 24 24 ‡ 20 20 ‡ Size of institution Less than 3,000............................ 46 46 34 22 21 20 14 15 12 3,000 to 9,999.............................. 89 86 71 58 55 34 43 40 24 10,000 or more ............................ 95 91 88 64 61 42 55 50 41† Not applicable. Two-year institutions do not offer graduate degrees, although they sometimes offer individual graduate courses. ‡ Reporting standards not met. 1Based on the estimated 4,160 2-year and 4-year Title IV degree-granting postsecondary institutions in the nation. 2Based on the estimated 3,890 institutions that had undergraduate programs in 2006–07. 3Based on the estimated 1,810 institutions that had graduate or first-professional programs in 2006–07. NOTE: Data for private not-for-profit 2-year institutions are not reported in a separate category because too few private not-for-profit 2-year institutions in the sample offered distance education courses in 2006–07 to make reliable estimates. Data for these private not-for-profit 2-year institutions are included in the totals and in analyses by other institutional characteristics. Institutions may offer both undergraduate and graduate/first-professional courses. Although 2-year institutions do not offer graduate degrees, they sometimes offer individual graduate courses. SOURCE: U.S. Department of Education, National Center for Education Statistics, Postsecondary Education Quick Information System (PEQIS), “Distance Education at Postsecondary Institutions,” 2007.
7
Table 3. Percentage distribution of 2-year and 4-year Title IV degree-granting postsecondary institutions offering distance education that reported the minimum amount of online instruction or other criteria required to formally designate courses as online, by institutional type and institution size: 2006–07
Minimum percent of online instruction used to
designate courses as online
Institutional type and size 100 percent 80 to
99 percent 50 to
79 percent 25 to
49 percent
Some other criterion is used
to designate online courses
No standard criterion is used
to designate online courses
All institutions ...................................... 62 12 8 6 4 7 Institutional type Public 2-year .......................................... 63 12 11 5 5 4 Public 4-year .......................................... 48 16 11 12 5 6 Private not-for-profit 4-year................... 71 11 5 4 3 4 Size of institution Less than 3,000....................................... 68 10 5 4 3 10 3,000 to 9,999......................................... 60 15 9 5 5 4 10,000 or more ....................................... 49 11 16 12 6 4NOTE: Percentages are based on estimated 2,550 institutions that offered online courses in 2006–07. Data for private not-for-profit 2-year and for-profit 2-year and 4-year institutions are not reported in separate categories because too few of these institutions in the sample offered distance education courses in 2006–07 to make reliable estimates. Data for these institutions are included in the totals and in analyses by other institutional characteristics. Detail may not sum to totals because of rounding. SOURCE: U.S. Department of Education, National Center for Education Statistics, Postsecondary Education Quick Information System (PEQIS), “Distance Education at Postsecondary Institutions,” 2007.
8
Table 4. Total number of enrollments in college-level credit-granting distance education courses at 2-year and 4-year Title IV degree-granting postsecondary institutions, by course type, institutional type, and institution size: 2006–07
Enrollments in college-level credit-
granting online, hybrid/blended online, or other distance education
courses at the:1
Institutional type and size
Total number of institutions that
offered any college-level credit-granting online,
hybrid/blended online, or other distance education courses
Total number of enrollments in
college-level credit-granting online, hybrid/blended online,
or other distance education courses1
Undergraduate level
Graduate/first-professional
level All institutions .................................. 2,720 12,153,000 9,803,000 2,349,900 Institutional type Public 2-year ...................................... 1,020 4,844,000 4,840,000 3,700 Private not-for-profit 2-year............... 30 11,000 11,000 † Private for-profit 2-year ..................... 80 72,000 72,000 † Public 4-year ...................................... 560 3,502,000 2,611,000 890,900 Private not-for-profit 4-year............... 790 1,854,000 1,124,000 730,400 Private for-profit 4-year ..................... 240 1,869,000 1,144,000 724,800 Size of institution Less than 3,000................................... 1,390 2,122,000 1,591,000 531,000 3,000 to 9,999..................................... 870 3,772,000 3,274,000 497,700 10,000 or more ................................... 470 6,259,000 4,938,000 1,321,000† Not applicable. Two-year institutions do not offer graduate degrees, although they sometimes offer individual graduate courses. 1 Enrollments include duplicated counts because they refer to the number of registrations. NOTE: Detail may not sum to totals because of rounding. SOURCE: U.S. Department of Education, National Center for Education Statistics, Postsecondary Education Quick Information System (PEQIS), “Distance Education at Postsecondary Institutions,” 2007.
9
Table 5. Total enrollments in online, hybrid/blended online, and other types of college-level credit-granting distance education courses at 2-year and 4-year Title IV degree-granting postsecondary institutions, and percent of total distance education enrollments, by course level, institutional type, and institution size: 2006–07
Percent of total distance education enrollments
Online enrollments Hybrid/blended online enrollments Other distance education
enrollments
Institutional type and size
Total enrollments in
college-level credit-granting
online, hybrid/blended online, or other
distance education
courses
Courses at either
level
Under-graduate courses
Graduate/ first-pro-fessional
courses
Courses at either
level
Under-graduate courses
Graduate/ first-pro-fessional
courses
Courses at either
level
Under-graduate courses
Graduate/ first-pro-fessional
courses All institutions .... 12,153,000 77 63 14 12 9 3 10 8 2 Institutional type Public 2-year ........ 4,844,000 80 80 † 10 10 † 9 9 † Private not-for- profit 2-year.... 11,000 1001 1001 † # # † # # † Private for-profit 2-year.............. 72,000 96 96 † 3 3 † # # † Public 4-year ........ 3,502,000 70 54 17 15 11 4 15 11 4 Private not-for- profit 4-year.... 1,854,000 74 46 28 13 8 5 13 7 6 Private for-profit 4-year.............. 1,869,000 87 56 31 12 4 7 1 1 1 Size of institution Less than 3,000..... 2,122,000 73 58 14 19 10 9 9 7 2 3,000 to 9,999....... 3,772,000 74 66 8 12 11 2 13 10 3 10,000 or more ..... 6,259,000 81 63 17 10 8 2 10 7 2† Not applicable. Two-year institutions do not offer graduate degrees, although they sometimes offer individual graduate courses. # Rounds to zero. 1 Rounds to 100 percent. NOTE: Enrollments include duplicated counts because they refer to the number of registrations. Percentages are based on the total number of enrollments in that row. Detail may not sum to totals because of rounding. SOURCE: U.S. Department of Education, National Center for Education Statistics, Postsecondary Education Quick Information System (PEQIS), “Distance Education at Postsecondary Institutions,” 2007.
10
Table 6. Percent of all 2-year and 4-year Title IV degree-granting postsecondary institutions offering any college-level credit-granting distance education courses, and percent that had college-level degree or certificate programs designed to be completed totally through distance education, by program level, institutional type, and institution size: 2006–07
Program to be completed through distance education
Program type Offered any college-level degree or certificate
programs Degree programs Certificate programs
Institutional type and size
Offered any college-level
credit-granting
online, hybrid/
blended online, or
other distance
education courses 1
All institutions1
Institutions with
college-level credit-
granting distance
education2
Degree programs at either level1
Under-graduate
degree programs3
Graduate/ first-
professional degree
programs4
Certificate programs at either level1
Under-graduate
certificate programs3
Graduate/ first-
professional certificate programs4
All institutions ........ 65 32 49 29 25 31 17 13 18 Institutional type Public 2-year ............ 97 45 46 39 39 † 28 28 † Private for-profit 2-year.................. 16 7 ‡ 7 7 † ‡ ‡ † Public 4-year ............ 88 58 66 54 40 52 35 19 31 Private not-for- profit 4-year........ 53 24 45 21 16 21 13 7 12 Private for-profit 4-year.................. 70 27 38 27 27 ‡ 1 ‡ ‡ Size of institution Less than 3,000......... 51 19 38 17 16 16 9 7 8 3,000 to 9,999........... 91 49 54 46 39 40 27 21 20 10,000 or more ......... 96 67 70 63 47 70 47 30 47† Not applicable. Two-year institutions do not offer graduate degrees, although they sometimes offer individual graduate courses. ‡ Reporting standards not met. 1Based on the estimated 4,160 2-year and 4-year Title IV degree-granting postsecondary institutions in the nation. 2Based on the estimated 2,720 institutions that offered any college-level credit-granting distance education courses in 2006–07. 3Based on the estimated 3,890 institutions that had undergraduate programs in 2006–07. 4Based on the estimated 1,810 institutions that had graduate or first-professional programs in 2006–07. NOTE: Data for private not-for-profit 2-year institutions are not reported in a separate category because too few private not-for-profit 2-year institutions in the sample offered distance education courses in 2006–07 to make reliable estimates. Data for these private 2-year institutions are included in the totals and in analyses by other institutional characteristics. SOURCE: U.S. Department of Education, National Center for Education Statistics, Postsecondary Education Quick Information System (PEQIS), “Distance Education at Postsecondary Institutions,” 2007.
11
Table 7. Total number of college-level degree or certificate programs designed to be completed totally through distance education at 2-year and 4-year Title IV degree-granting postsecondary institutions, and percent of total distance education programs, by program type, program level, institutional type, and institution size: 2006–07
Percent of total distance education programs
Degree programs Certificate programs
Institutional type and size
Total number of programs
designed to be completed
entirely through distance
education
Degree programs at either level
Under-graduate
degree programs
Graduate/ first-
professional degree
programs
Certificate programs at either level
Under- graduate
certificate programs
Graduate/ first-
professional certificate programs
All institutions ......................... 11,240 66 41 25 34 22 12 Institutional type Public 2-year ............................. 3,590 50 49 † 50 50 † Private not-for-profit 2-year...... 70 100 100 † # # † Private for-profit 2-year ............ 90 65! 65 † 35! 35 † Public 4-year ............................. 3,550 69 29 40 31 10 21 Private not-for-profit 4-year...... 3,230 72 38 34 28 8 20 Private for-profit 4-year ............ 710 99 64 35 1! # 1 Size of institution Less than 3,000.......................... 2,960 71 52 20 29 23 6 3,000 to 9,999............................ 4,080 64 44 19 36 25 11 10,000 or more .......................... 4,210 64 30 34 35 18 19† Not applicable. Two-year institutions do not offer graduate degree or certificate programs, although they sometimes offer individual graduate courses. # Rounds to zero. ! Interpret data with caution; the coefficient of variation is greater than 50 percent. NOTE: Detail may not sum to totals because of rounding or because too few cases were reported for a reliable estimate for private 2-year institutions. SOURCE: U.S. Department of Education, National Center for Education Statistics, Postsecondary Education Quick Information System (PEQIS), “Distance Education at Postsecondary Institutions,” 2007.
12
Table 8. Percent of 2-year and 4-year Title IV degree-granting postsecondary institutions offering any academic distance education courses for elementary or secondary students, by course type, institutional type, and institution size: 2006–07
Offered any academic distance education courses for elementary/secondary students
Type of distance education course for elementary/secondary students1
Institutional type and size All
institutions2
Institutions with any college-level
credit-granting distance education3
Advanced Placement or International
Baccalaureate courses
Other academic high school
courses
Academic courses for elementary or
middle school students
All institutions ......................... 12 19 38 65 3 Institutional type Public 2-year ............................. 29 30 35 73 2 Public 4-year ............................. 19 22 41 66 5 Private not-for-profit 4-year...... 4 8 ‡ ‡ ‡ Private for-profit 4-year ............ 4 6 # # # Size of institution Less than 3,000.......................... 8 16 38 57 ‡ 3,000 to 9,999............................ 19 21 37 72 ‡ 10,000 or more .......................... 21 22 39 71 9# Rounds to zero. ‡ Reporting standards not met. 1Based on the estimated 510 institutions that offered distance education courses for elementary or secondary students in 2006–07. 2Based on the estimated 4,160 2-year and 4-year Title IV degree-granting postsecondary institutions in the nation. 3Based on the estimated 2,720 institutions that offered any college-level credit-granting distance education courses in 2006–07. NOTE: Data for private 2-year institutions are not reported in a separate category because too few private 2-year institutions in the sample offered distance education courses in 2006–07 to make reliable estimates. Data for private 2-year institutions are included in the totals and in analyses by other institutional characteristics. SOURCE: U.S. Department of Education, National Center for Education Statistics, Postsecondary Education Quick Information System (PEQIS), “Distance Education at Postsecondary Institutions,” 2007.
13
Table 9. Percentage distribution of 2-year and 4-year Title IV degree-granting postsecondary institutions that offered distance education reporting frequency of requests for accommodations for students with disabilities in distance education courses over the last 3 years, by institutional type and institution size: 2006–07
Institutional type and size Never Occasionally Frequently Don’t know All institutions ......................................................... 20 49 7 24 Institutional type Public 2-year.............................................................. 17 59 8 17 Public 4-year.............................................................. 10 57 6 27 Private not-for-profit 4-year...................................... 30 41 2 28 Private for-profit 4-year ............................................ 26 19 18 37 Size of institution Less than 3,000.......................................................... 29 41 7 23 3,000 to 9,999............................................................ 11 58 7 24 10,000 or more .......................................................... 8 58 9 26NOTE: Data for private 2-year institutions are not reported in separate categories because too few private 2-year institutions in the sample offered distance education courses in 2006–07 to make reliable estimates. Data for private 2-year institutions are included in the totals and in analyses by other institutional characteristics. Percentages are based on the estimated 2,720 institutions that offered any college-level credit-granting distance education courses in 2006–07. Detail may not sum to totals because of rounding. SOURCE: U.S. Department of Education, National Center for Education Statistics, Postsecondary Education Quick Information System (PEQIS), “Distance Education at Postsecondary Institutions,” 2007.
14
Table 10. Percentage distribution of 2-year and 4-year Title IV degree-granting postsecondary institutions offering any distance education courses reporting use of various technologies or media for instruction in college-level credit-granting distance education courses: 2006–07
Extent to which institution used technology/medium
for instructional delivery of college-level credit-granting distance education courses
Technology or medium for instructional delivery Large extent
Moderate extent
Small extent
Not at all
Asynchronous Internet-based technologies1 ......................................................................... 75 17 6 2Synchronous Internet-based technologies1 ........................................................................... 12 19 44 25Two-way interactive video (i.e., two-way video with two-way audio)................................ 8 15 26 51One-way prerecorded video (including prerecorded videos provided to students, and television broadcast and cable transmission using prerecorded videos) ........................ 5 14 35 46One-way video with two-way audio (e.g., interactive television)........................................ 1 5 17 77One-way audio transmission (e.g., podcasting, radio broadcasts, and prerecorded audiotapes provided to students)..................................................................................... 3 9 39 49Correspondence only (print-based documents exchanged via postal delivery or email)..... 8 8 14 69Correspondence combined with the use of distance education technology such as CD-ROM 4 10 20 65Other technologies................................................................................................................. 2 2 2 931Synchronous Internet-based technologies refer to simultaneous or “real-time” computer-based instruction, while asynchronous Internet-based technologies are used for courses that are not based on simultaneous computer-based instruction. NOTE: Percentages are based on estimated 2,720 institutions that offered any college-level credit-granting distance education courses in 2006–07. Detail may not sum to totals because of rounding. SOURCE: U.S. Department of Education, National Center for Education Statistics, Postsecondary Education Quick Information System (PEQIS), “Distance Education at Postsecondary Institutions,” 2007.
15
Table 11. Percent of 2-year and 4-year Title IV degree-granting postsecondary institutions offering any distance education courses reporting that they used various technologies or mediums to a moderate or large extent for instructional delivery of college-level credit-granting distance education courses, by institutional type and institution size: 2006–07
Technology or medium used to a moderate or large extent
Institutional type and size
Asynchro-nous
Internet-based tech-
nologies1
Synchro-nous
Internet-based tech-
nologies1
Two-way interactive
video2
One-way pre-
recorded video3
One-way video with
two-way audio4
One-way audio trans-
mission5
Corres-pondence
only6
Corres-pondence combined with tech-
nology7
Other tech-
nologies All institutions ........................ 92 31 23 19 6 12 16 14 4 Institutional type Public 2-year ............................ 93 28 30 21 8 10 9 11 4 Public 4-year ............................ 90 42 37 19 7 12 11 8 2 Private not-for-profit 4-year..... 90 32 13 19 3 15 17 18 9 Private for-profit 4-year ........... 95 13 ‡ 11 ‡ 8 52 20 # Size of institution Less than 3,000......................... 89 28 20 12 5 10 22 17 6 3,000 to 9,999........................... 94 33 24 23 5 14 11 12 3 10,000 or more ......................... 95 37 26 31 9 14 12 11 3# Rounds to zero. ‡ Reporting standards not met. 1Synchronous Internet-based technologies refer to simultaneous or “real-time” computer-based instruction, while asynchronous Internet-based technologies are used for courses that are not based on simultaneous computer-based instruction. 2The wording in the questionnaire was “Two-way video with two-way audio (i.e., two-way interactive video).” 3The wording in the questionnaire was “One-way prerecorded video (including prerecorded videos provided to students, and television broadcast and cable transmission using prerecorded videos).” 4The wording in the questionnaire was “One-way video with two-way audio (e.g., interactive television).” 5The wording in the questionnaire was “One-way audio transmission (e.g., podcasting, radio broadcasts, and prerecorded audiotapes provided to students).” 6The wording in the questionnaire was “Correspondence only (print-based documents exchanged via postal delivery or email).” 7The wording in the questionnaire was “Correspondence combined with the use of distance education technology such as CD-ROM.” NOTE: Data for private 2-year institutions are not reported in a separate category because too few private 2-year institutions in the sample offered distance education courses in 2006–07 to make reliable estimates. Data for private 2-year institutions are included in the totals and in analyses by other institutional characteristics. Percentages are based on estimated 2,720 institutions that offered any college-level credit-granting distance education courses in 2006–07. SOURCE: U.S. Department of Education, National Center for Education Statistics, Postsecondary Education Quick Information System (PEQIS), “Distance Education at Postsecondary Institutions,” 2007.
16
Table 12. Percentage distribution of 2-year and 4-year Title IV degree-granting postsecondary institutions offering any distance education courses reporting the extent to which various factors affected decisions regarding distance education offerings: 2006–07
Extent to which factor affected decisions regarding
distance education offerings
Factor Major extent
Moderate extent
Small extent
Not at all
Seeking to increase student enrollment................................................................................ 45 37 13 4Making more courses available............................................................................................ 46 40 10 4Making more degree programs available............................................................................. 28 27 24 21Making more certificate programs available ....................................................................... 13 21 28 37Meeting student demand for flexible schedules .................................................................. 68 24 7 1Providing access to college for students who otherwise would not have access (e.g., because of geographic, family, or work-related reasons)..................................... 67 22 8 3Responding to the needs of employers/business ................................................................. 26 36 28 10Maximizing the use of existing college facilities ................................................................ 24 39 25 12Meeting student demand for reduced seat time ................................................................... 16 30 31 22Other factors ......................................................................................................................... 4 2 1 93NOTE: Percentages are based on estimated 2,720 institutions that offered any college-level credit-granting distance education courses in 2006–07. Detail may not sum to totals because of rounding. SOURCE: U.S. Department of Education, National Center for Education Statistics, Postsecondary Education Quick Information System (PEQIS), “Distance Education at Postsecondary Institutions,” 2007.
17
Table 13. Percent of 2-year and 4-year Title IV degree-granting postsecondary institutions offering any distance education courses reporting that various factors affected decisions regarding distance education offerings to a moderate or major extent, by institutional type and institution size: 2006–07
Factor affecting institutions’ decisions to a moderate or major extent
Institutional type and size
Seeking to
increase student enroll-
ment
Making more
courses available
Making more
degree programs available
Making more
certifi-cate
programs available
Meeting student
demand for
flexible schedules
Pro-viding
access to college
Respond-ing to the needs of employ-
ers/ business
Maximiz-ing the
use of existing college
facilities
Meeting student
demand for
reduced seat time
Other factors
All institutions ........................ 82 86 55 34 92 89 62 63 47 6 Institutional type Public 2-year ............................ 89 92 56 49 98 97 65 71 56 5 Public 4-year ............................ 78 84 64 38 89 85 62 56 39 8 Private not-for-profit 4-year..... 81 77 46 24 85 85 52 47 31 7 Private for-profit 4-year ........... 76 91 63 4 95 79 74 83 72 ‡ Size of institution Less than 3,000......................... 80 85 48 25 92 86 60 61 44 6 3,000 to 9,999........................... 87 87 59 40 93 91 63 64 51 4 10,000 or more ......................... 82 86 67 51 92 93 66 64 46 9‡ Reporting standards not met. NOTE: Percentages are based on estimated 2,720 institutions that offered any college-level credit-granting distance education courses in 2006–07. Data for private 2-year institutions are not reported in a separate category because too few private 2-year institutions in the sample offered distance education courses in 2006–07 to make reliable estimates. Data for private 2-year institutions are included in the totals and in analyses by other institutional characteristics. SOURCE: U.S. Department of Education, National Center for Education Statistics, Postsecondary Education Quick Information System (PEQIS), “Distance Education at Postsecondary Institutions,” 2007.
18
Table 14. Percent of 2-year and 4-year Title IV degree-granting postsecondary institutions indicating means for acquiring or developing distance education courses, by credit/ noncredit courses, institutional type, and institution size: 2006–07
Ways in which credit-granting distance education
courses were acquired or developed 1 Ways in which noncredit-granting distance education
courses were acquired or developed2
Institutional type and size
Developed by
institution
Developed with other
post-secondary
institutions
Acquired from
another post-
secondary institution
Acquired from a
commercial vendor
Acquired in other
ways
Developed by
institution
Developed with other
post-secondary
institutions
Acquired from
another post-
secondary institution
Acquired from a
commercial vendor
Acquired in other
ways
All institutions .... 94 26 13 25 2 64 12 7 62 1 Institutional type Public 2-year ........ 99 32 18 42 1 52 12 7 79 ‡ Public 4-year ........ 97 32 10 21 ‡ 76 18 10 52 2 Private not-for- profit 4-year.... 96 12 8 12 1 92 ‡ ‡ 18 # Private for-profit 4-year.............. 72 25 10 12 ‡ ‡ # # ‡ # Size of institution Less than 3,000..... 89 24 16 19 4 59 9 6 53 ‡ 3,000 to 9,999....... 99 29 12 31 2 62 13 6 68 ‡ 10,000 or more ..... 98 25 10 32 1 75 14 9 63 1# Rounds to zero. ‡ Reporting standards not met. 1Percentages are based on the estimated 2,720 institutions that offered any college-level credit-granting distance education courses in 2006–07. 2Percentages are based on the estimated 970 institutions that offered any noncredit distance education courses in 2006–07. NOTE: Institutions could report more than one means of acquiring or developing their credit-granting and noncredit distance education courses. Data for private 2-year institutions are not reported in a separate category because too few private 2-year institutions in the sample offered distance education courses in 2006–07 to make reliable estimates. Data for private 2-year institutions are included in the totals and in analyses by other institutional characteristics. SOURCE: U.S. Department of Education, National Center for Education Statistics, Postsecondary Education Quick Information System (PEQIS), “Distance Education at Postsecondary Institutions,” 2007.
19
References
Chowdhury, S., Chu, A., and Kaufman, S. (2000). Minimizing overlap in NCES surveys. Proceedings of the Survey Methods Research Section. American Statistical Association, 174-179.
Knapp, L.G., Kelly, J.E., Whitmore, R.W., Wu, S., Gallego, L.M., and Grau, E. (2001). Postsecondary Institutions in the United States: Fall 2000 and Degrees and Other Awards Conferred: 1999–2000 (NCES 2002–156). National Center for Education Statistics, U.S. Department of Education. Washington, DC.
Lewis, L., Alexander, D., and Farris, E. (1997). Distance Education in Higher Education Institutions (NCES 97–062). National Center for Education Statistics, U.S. Department of Education. Washington, DC.
Lewis, L., Snow, K., Farris, E., and Levin, D. (1999). Distance Education at Postsecondary Education Institutions: 1997–98 (NCES 2000–013). National Center for Education Statistics, U.S. Department of Education. Washington, DC.
Lewis, L., and Waits, T. (2003). Distance Education at Degree-Granting Postsecondary Education Institutions: 2000–2001 (NCES 2003–017). National Center for Education Statistics, Institute of Education Sciences, U.S. Department of Education. Washington, DC.

This page intentionally left blank.

A-1
Appendix A
Standard Error Tables

This page intentionally left blank.
A-3
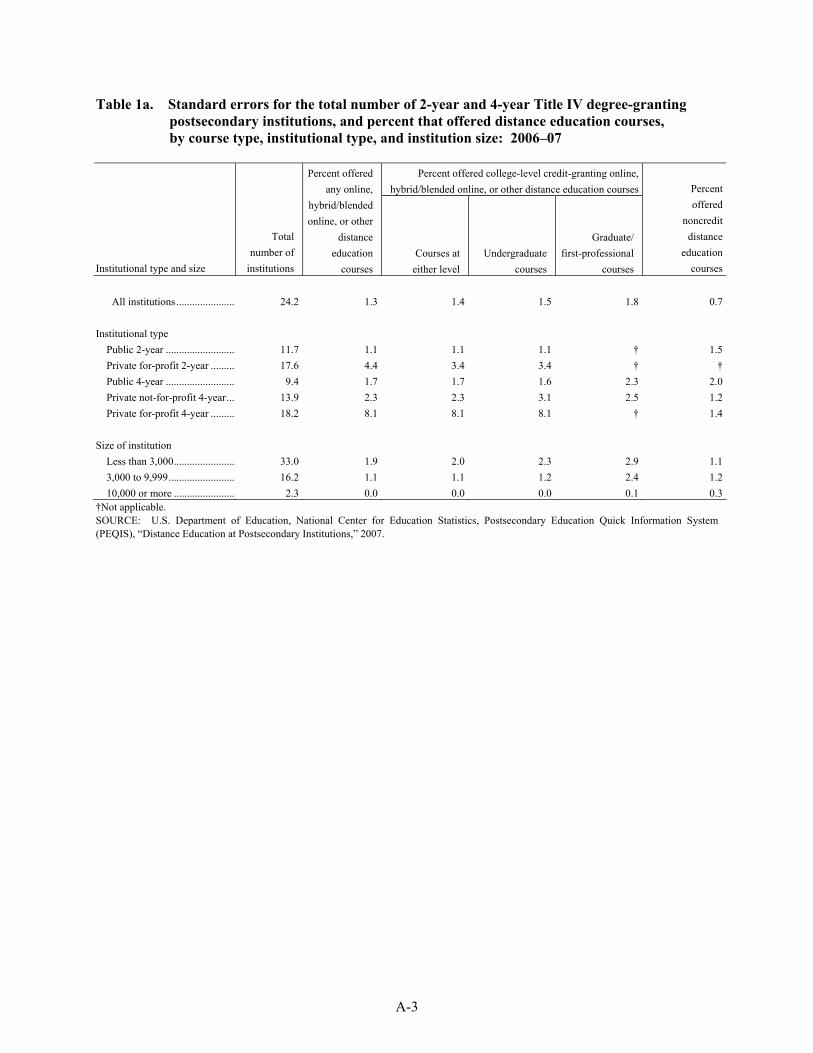
Table 1a. Standard errors for the total number of 2-year and 4-year Title IV degree-granting postsecondary institutions, and percent that offered distance education courses, by course type, institutional type, and institution size: 2006–07
Percent offered college-level credit-granting online,
hybrid/blended online, or other distance education courses
Institutional type and size
Total number of
institutions
Percent offered any online,
hybrid/blended online, or other
distance education
courses Courses at
either level Undergraduate
courses
Graduate/ first-professional
courses
Percent offered
noncredit distance
education courses
All institutions ....................... 24.2 1.3 1.4 1.5 1.8 0.7 Institutional type Public 2-year ........................... 11.7 1.1 1.1 1.1 † 1.5 Private for-profit 2-year .......... 17.6 4.4 3.4 3.4 † † Public 4-year ........................... 9.4 1.7 1.7 1.6 2.3 2.0 Private not-for-profit 4-year.... 13.9 2.3 2.3 3.1 2.5 1.2 Private for-profit 4-year .......... 18.2 8.1 8.1 8.1 † 1.4 Size of institution Less than 3,000........................ 33.0 1.9 2.0 2.3 2.9 1.1 3,000 to 9,999.......................... 16.2 1.1 1.1 1.2 2.4 1.2 10,000 or more ........................ 2.3 0.0 0.0 0.0 0.1 0.3†Not applicable. SOURCE: U.S. Department of Education, National Center for Education Statistics, Postsecondary Education Quick Information System (PEQIS), “Distance Education at Postsecondary Institutions,” 2007.
A-4
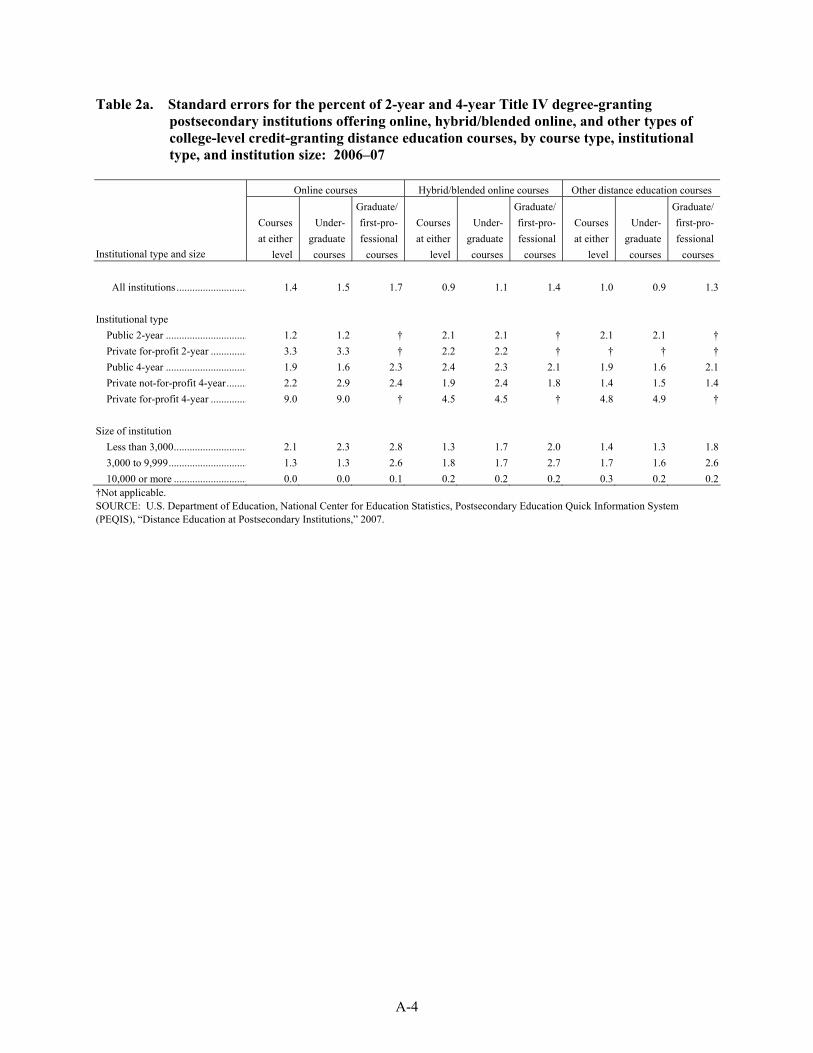
Table 2a. Standard errors for the percent of 2-year and 4-year Title IV degree-granting postsecondary institutions offering online, hybrid/blended online, and other types of college-level credit-granting distance education courses, by course type, institutional type, and institution size: 2006–07
Online courses Hybrid/blended online courses Other distance education courses
Institutional type and size
Courses at either
level
Under-graduate courses
Graduate/ first-pro-fessional
courses
Courses at either
level
Under-graduate courses
Graduate/ first-pro-fessional
courses
Courses at either
level
Under-graduate courses
Graduate/ first-pro-fessional
courses All institutions ........................... 1.4 1.5 1.7 0.9 1.1 1.4 1.0 0.9 1.3 Institutional type Public 2-year ............................... 1.2 1.2 † 2.1 2.1 † 2.1 2.1 † Private for-profit 2-year .............. 3.3 3.3 † 2.2 2.2 † † † † Public 4-year ............................... 1.9 1.6 2.3 2.4 2.3 2.1 1.9 1.6 2.1 Private not-for-profit 4-year........ 2.2 2.9 2.4 1.9 2.4 1.8 1.4 1.5 1.4 Private for-profit 4-year .............. 9.0 9.0 † 4.5 4.5 † 4.8 4.9 † Size of institution Less than 3,000............................ 2.1 2.3 2.8 1.3 1.7 2.0 1.4 1.3 1.8 3,000 to 9,999.............................. 1.3 1.3 2.6 1.8 1.7 2.7 1.7 1.6 2.6 10,000 or more ............................ 0.0 0.0 0.1 0.2 0.2 0.2 0.3 0.2 0.2†Not applicable. SOURCE: U.S. Department of Education, National Center for Education Statistics, Postsecondary Education Quick Information System (PEQIS), “Distance Education at Postsecondary Institutions,” 2007.
A-5
Table 3a. Standard errors for the percentage distribution of 2-year and 4-year Title IV degree-granting postsecondary institutions offering distance education that reported the minimum amount of online instruction or other criteria required to formally designate courses as online, by institutional type and institution size: 2006–07
Minimum percent of online instruction used to
designate courses as online
Institutional type and size 100 percent 80 to
99 percent 50 to
79 percent 25 to
49 percent
Some other criterion is used
to designate online courses
No standard criterion is used
to designate online courses
All institutions ...................................... 1.4 1.0 0.5 0.7 0.5 1.2 Institutional type Public 2-year .......................................... 1.9 1.3 0.9 1.0 0.6 0.7 Public 4-year .......................................... 2.4 1.4 1.1 0.8 0.8 1.7 Private not-for-profit 4-year................... 2.9 2.0 1.4 1.2 0.9 1.1 Size of institution Less than 3,000....................................... 2.7 1.9 0.9 1.2 1.0 2.4 3,000 to 9,999......................................... 1.8 1.4 0.8 0.8 0.7 0.7 10,000 or more ....................................... 0.3 0.2 0.1 0.1 0.0 0.0SOURCE: U.S. Department of Education, National Center for Education Statistics, Postsecondary Education Quick Information System (PEQIS), “Distance Education at Postsecondary Institutions,” 2007.
A-6
Table 4a. Standard errors for the total number of enrollments in college-level credit-granting distance education courses at 2-year and 4-year Title IV degree-granting postsecondary institutions, by course type, institutional type, and institution size: 2006–07
Enrollments in college-level credit-
granting online, hybrid/blended online, or other distance education
courses at the:
Institutional type and size
Total number of institutions that
offered any college-level credit-granting online,
hybrid/blended online, or other distance education courses
Total number of enrollments in
college-level credit-granting online, hybrid/blended online,
or other distance education courses
Undergraduate level
Graduate/first-professional
level All institutions .................................. 57.2 335,674.0 280,152.1 149,984.1 Institutional type Public 2-year ...................................... 14.4 80,716.8 80,708.1 1,991.2 Private not-for-profit 2-year............... 13.5 6,391.4 6,391.4 † Private for-profit 2-year ..................... 16.9 40,644.2 40,644.2 † Public 4-year ...................................... 12.2 97,974.4 71,817.5 38,002.3 Private not-for-profit 4-year............... 34.6 121,601.7 91,774.4 58,831.7 Private for-profit 4-year ..................... 29.7 297,571.7 234,444.1 148,087.6 Size of institution Less than 3,000................................... 55.3 309,421.5 247,431.8 149,634.6 3,000 to 9,999..................................... 13.8 182,881.6 151,738.5 47,015.5 10,000 or more ................................... 2.3 23,084.3 20,796.9 4,873.5†Not applicable. SOURCE: U.S. Department of Education, National Center for Education Statistics, Postsecondary Education Quick Information System (PEQIS), “Distance Education at Postsecondary Institutions,” 2007.
A-7
Table 5a. Standard errors for the total enrollments in online, hybrid/blended online, and other types of college-level credit-granting distance education courses at 2-year and 4-year Title IV degree-granting postsecondary institutions, and percent of total distance education enrollments, by course level, institutional type, and institution size: 2006–07
Percent of total distance education enrollments
Online enrollments Hybrid/blended online enrollments Other distance education
enrollments
Institutional type and size
Total enrollments in
college-level credit-granting
online, hybrid/blended online, or other
distance education
courses
Courses at either
level
Under-graduate courses
Graduate/ first-pro-fessional
courses
Courses at either
level
Under-graduate courses
Graduate/ first-pro-fessional
courses
Courses at either
level
Under-graduate courses
Graduate/ first-pro-fessional
courses All institutions .... 335,674.0 1.0 1.1 0.4 0.8 0.5 0.8 0.5 .04 0.2 Institutional type Public 2-year ........ 80,716.8 0.6 0.6 † 0.3 0.2 † 0.5 0.5 † Private not-for- profit 2-year.... 6,391.4 0.9 0.9 † † † † † † † Private for-profit 2-year.............. 40,644.2 1.6 1.6 † 1.6 1.6 † † † † Public 4-year ........ 97,974.4 0.9 0.8 0.6 0.7 0.6 0.2 0.6 0.5 0.3 Private not-for- profit 4-year.... 121,601.7 2.8 2.8 1.9 2.2 1.9 0.9 1.9 1.1 1.4 Private for-profit 4-year.............. 297,571.7 5.3 7.6 3.5 5.3 1.6 5.1 0.5 0.3 0.2 Size of institution Less than 3,000..... 309,421.5 5.4 6.7 2.5 4.8 2.7 4.3 1.9 1.4 0.8 3,000 to 9,999....... 182,881.6 1.6 1.4 0.6 0.9 0.7 0.2 1.1 0.8 0.6 10,000 or more ..... 23,084.3 1.0 1.1 0.7 0.0 0.0 0.0 0.0 0.0 0.0†Not applicable. SOURCE: U.S. Department of Education, National Center for Education Statistics, Postsecondary Education Quick Information System (PEQIS), “Distance Education at Postsecondary Institutions,” 2007.
A-8
Table 6a. Standard errors for the percent of all 2-year and 4-year Title IV degree-granting postsecondary institutions offering any college-level credit-granting distance education courses, and percent that had college-level degree or certificate programs designed to be completed totally through distance education, by program level, institutional type, and institution size: 2006–07
Program to be completed through distance education
Program type Offered any college-level degree or certificate
programs Degree programs Certificate programs
Institutional type and size
Offered any college-level
credit-granting
online, hybrid/
blended online, or
other distance
education courses
All institutions
Institutions with
college-level credit-
granting distance
education
Degree programs at either level1
Under-graduate
degree programs
Graduate/ first-
professional degree
programs
Certificate programs at either level
Under-graduate
certificate programs
Graduate/ first-
professional certificate programs
All institutions ...... 1.4 1.1 1.8 1.2 1.3 1.4 0.7 0.6 1.3 Institutional type Public 2-year .......... 1.1 1.9 2.0 1.7 1.7 † 1.6 1.6 † Private for-profit 2-year................ 3.4 2.9 † 2.9 2.9 † † † † Public 4-year .......... 1.7 2.4 2.4 2.5 2.3 2.3 2.0 1.5 2.2 Private not-for- profit 4-year...... 2.3 1.6 3.1 1.6 1.9 1.7 1.6 1.3 1.8 Private for-profit 4-year................ 8.1 9.7 12.4 9.7 9.7 † 0.4 † † Size of institution Less than 3,000....... 2.0 1.6 3.3 1.8 2.0 2.4 1.0 0.8 2.0 3,000 to 9,999......... 1.1 1.6 1.7 1.6 1.7 2.7 1.5 1.3 1.8 10,000 or more ....... 0.0 0.3 0.3 0.3 0.2 0.2 0.2 0.2 0.3†Not applicable. SOURCE: U.S. Department of Education, National Center for Education Statistics, Postsecondary Education Quick Information System (PEQIS), “Distance Education at Postsecondary Institutions,” 2007.
A-9
Table 7a. Standard errors for the total number of college-level degree or certificate programs designed to be completed totally through distance education at 2-year and 4-year Title IV degree-granting postsecondary institutions, and percent of total distance education programs, by program type, program level, institutional type, and institution size: 2006–07
Percent of total distance education programs
Degree programs Certificate programs
Institutional type and size
Total number of programs
designed to be completed
entirely through distance
education
Degree programs at either level
Under-graduate
degree programs
Graduate/ first-
professional degree
programs
Certificate programs at either level
Under- graduate
certificate programs
Graduate/ first-
professional certificate programs
All institutions ......................... 501.9 1.6 1.7 1.1 1.6 1.5 0.8 Institutional type Public 2-year ............................. 226.3 2.6 2.6 † 2.6 2.6 † Private not-for-profit 2-year...... 62.8 † † † † † † Private for-profit 2-year ............ 51.8 33.9 33.9 † 33.9 33.9 † Public 4-year ............................. 158.7 0.8 1.5 1.0 0.8 0.6 0.7 Private not-for-profit 4-year...... 353.7 2.7 4.0 2.6 2.7 1.7 2.3 Private for-profit 4-year ............ 260.7 0.6 6.1 6.4 0.6 † 0.4 Size of institution Less than 3,000.......................... 398.8 5.2 5.0 2.9 5.2 5.1 1.5 3,000 to 9,999............................ 347.9 2.4 2.3 2.1 2.4 2.4 2.0 10,000 or more .......................... 31.1 0.2 0.3 0.2 0.2 0.1 0.1†Not applicable. SOURCE: U.S. Department of Education, National Center for Education Statistics, Postsecondary Education Quick Information System (PEQIS), “Distance Education at Postsecondary Institutions,” 2007.
A-10
Table 8a. Standard errors for the percent of 2-year and 4-year Title IV degree-granting postsecondary institutions offering any academic distance education courses for elementary or secondary students, by course type, institutional type, and institution size: 2006–07
Offered any academic distance education courses for elementary/secondary students
Type of distance education course for elementary/secondary students
Institutional type and size All
institutions
Institutions with any college-level
credit-granting distance education
Advanced Placement or International
Baccalaureate courses
Other academic high school
courses
Academic courses for elementary or
middle school students
All institutions ......................... 0.8 1.1 2.6 2.7 0.7 Institutional type Public 2-year ............................. 2.0 2.0 3.9 3.7 0.6 Public 4-year ............................. 1.5 1.7 4.4 4.3 0.3 Private not-for-profit 4-year...... 1.1 2.0 † † † Private for-profit 4-year ............ 2.3 3.3 † † † Size of institution Less than 3,000.......................... 1.1 2.0 5.2 5.5 † 3,000 to 9,999............................ 1.3 1.4 4.0 3.7 † 10,000 or more .......................... 0.1 0.1 0.0 0.0 0.0†Not applicable. SOURCE: U.S. Department of Education, National Center for Education Statistics, Postsecondary Education Quick Information System (PEQIS), “Distance Education at Postsecondary Institutions,” 2007.
A-11
Table 9a. Standard errors for the percentage distribution of 2-year and 4-year Title IV degree-granting postsecondary institutions that offered distance education reporting frequency of requests for accommodations for students with disabilities in distance education courses over the last 3 years, by institutional type and institution size: 2006–07
Institutional type and size Never Occasionally Frequently Don’t know All institutions ......................................................... 1.1 1.3 0.9 1.5 Institutional type Public 2-year.............................................................. 1.9 1.8 0.7 1.6 Public 4-year.............................................................. 1.6 2.3 0.9 2.1 Private not-for-profit 4-year...................................... 3.3 3.4 0.5 3.5 Private for-profit 4-year ............................................ 6.0 5.9 9.5 7.6 Size of institution Less than 3,000.......................................................... 2.4 2.4 1.8 2.7 3,000 to 9,999............................................................ 1.0 1.6 0.7 1.6 10,000 or more .......................................................... 0.0 0.2 0.0 0.2 SOURCE: U.S. Department of Education, National Center for Education Statistics, Postsecondary Education Quick Information System (PEQIS), “Distance Education at Postsecondary Institutions,” 2007.
A-12
Table 10a. Standard errors for the percentage distribution of 2-year and 4-year Title IV degree-granting postsecondary institutions offering any distance education courses reporting use of various technologies or media for instruction in college-level credit-granting distance education courses: 2006–07
Extent to which institution used technology/medium
for instructional delivery of college-level credit-granting distance education courses
Technology or medium for instructional delivery Large extent
Moderate extent
Small extent
Not at all
Asynchronous Internet-based technologies .......................................................................... 1.4 1.4 0.7 0.4Synchronous Internet-based technologies............................................................................. 1.3 1.3 1.4 1.7Two-way interactive video (i.e., two-way video with two-way audio)................................ 0.7 1.0 1.3 1.5One-way prerecorded video (including prerecorded videos provided to students, and television broadcast and cable transmission using prerecorded videos) ........................ 0.5 1.0 1.5 1.9One-way video with two-way audio (e.g., interactive television)........................................ 0.2 0.6 1.0 1.1One-way audio transmission (e.g., podcasting, radio broadcasts, and prerecorded audiotapes provided to students)..................................................................................... 0.5 0.9 1.5 1.4Correspondence only (print-based documents exchanged via postal delivery or email)..... 1.4 0.9 1.2 1.4Correspondence combined with the use of distance education technology such as CD-ROM......................................................................................................................... 0.7 1.0 1.3 1.5Other technologies................................................................................................................. 0.5 0.5 0.5 0.8SOURCE: U.S. Department of Education, National Center for Education Statistics, Postsecondary Education Quick Information System (PEQIS), “Distance Education at Postsecondary Institutions,” 2007.
A-13
Table 11a. Standard errors for the percent of 2-year and 4-year Title IV degree-granting postsecondary institutions offering any distance education courses reporting that they used various technologies or mediums to a moderate or large extent for instructional delivery of college-level credit-granting distance education courses, by institutional type and institution size: 2006–07
Technology or medium used to a moderate or large extent
Institutional type and size
Asynchro-nous
Internet-based tech-
nologies
Synchro-nous
Internet-based tech-
nologies
Two-way interactive
video
One-way pre-
recorded video
One-way video with
two-way audio
One-way audio trans-
mission
Corres-pondence
only
Corres-pondence combined with tech-
nology
Other tech-
nologies All institutions ........................ 0.8 1.6 1.1 1.1 0.6 0.9 1.1 1.3 0.6 Institutional type Public 2-year ............................ 1.4 1.8 1.9 1.3 1.3 1.1 1.2 0.9 0.9 Public 4-year ............................ 1.5 2.1 2.4 1.3 1.0 1.4 1.5 0.9 0.6 Private not-for-profit 4-year..... 1.8 3.7 2.1 2.6 0.9 2.2 2.4 2.9 2.0 Private for-profit 4-year ........... 3.0 4.2 † 4.2 † 3.9 5.6 9.2 † Size of institution Less than 3,000......................... 1.5 3.0 2.1 1.8 1.1 1.5 2.2 2.4 1.2 3,000 to 9,999........................... 0.9 1.6 1.3 1.4 1.1 1.6 1.1 1.3 0.5 10,000 or more ......................... 0.0 0.2 0.1 0.2 0.1 0.1 0.1 0.1 0.0 †Not applicable. SOURCE: U.S. Department of Education, National Center for Education Statistics, Postsecondary Education Quick Information System (PEQIS), “Distance Education at Postsecondary Institutions,” 2007.
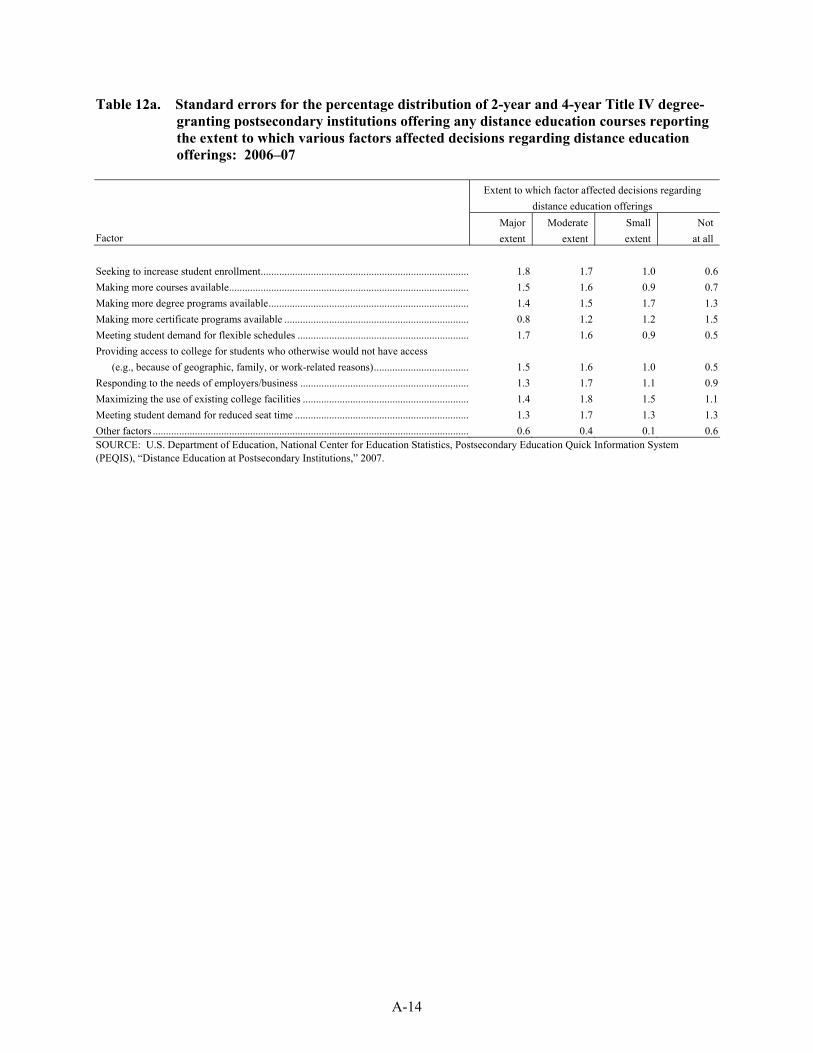
A-14
Table 12a. Standard errors for the percentage distribution of 2-year and 4-year Title IV degree-granting postsecondary institutions offering any distance education courses reporting the extent to which various factors affected decisions regarding distance education offerings: 2006–07
Extent to which factor affected decisions regarding
distance education offerings
Factor Major extent
Moderate extent
Small extent
Not at all
Seeking to increase student enrollment................................................................................ 1.8 1.7 1.0 0.6Making more courses available............................................................................................ 1.5 1.6 0.9 0.7Making more degree programs available............................................................................. 1.4 1.5 1.7 1.3Making more certificate programs available ....................................................................... 0.8 1.2 1.2 1.5Meeting student demand for flexible schedules .................................................................. 1.7 1.6 0.9 0.5Providing access to college for students who otherwise would not have access (e.g., because of geographic, family, or work-related reasons)..................................... 1.5 1.6 1.0 0.5Responding to the needs of employers/business ................................................................. 1.3 1.7 1.1 0.9Maximizing the use of existing college facilities ................................................................ 1.4 1.8 1.5 1.1Meeting student demand for reduced seat time ................................................................... 1.3 1.7 1.3 1.3Other factors ......................................................................................................................... 0.6 0.4 0.1 0.6SOURCE: U.S. Department of Education, National Center for Education Statistics, Postsecondary Education Quick Information System (PEQIS), “Distance Education at Postsecondary Institutions,” 2007.
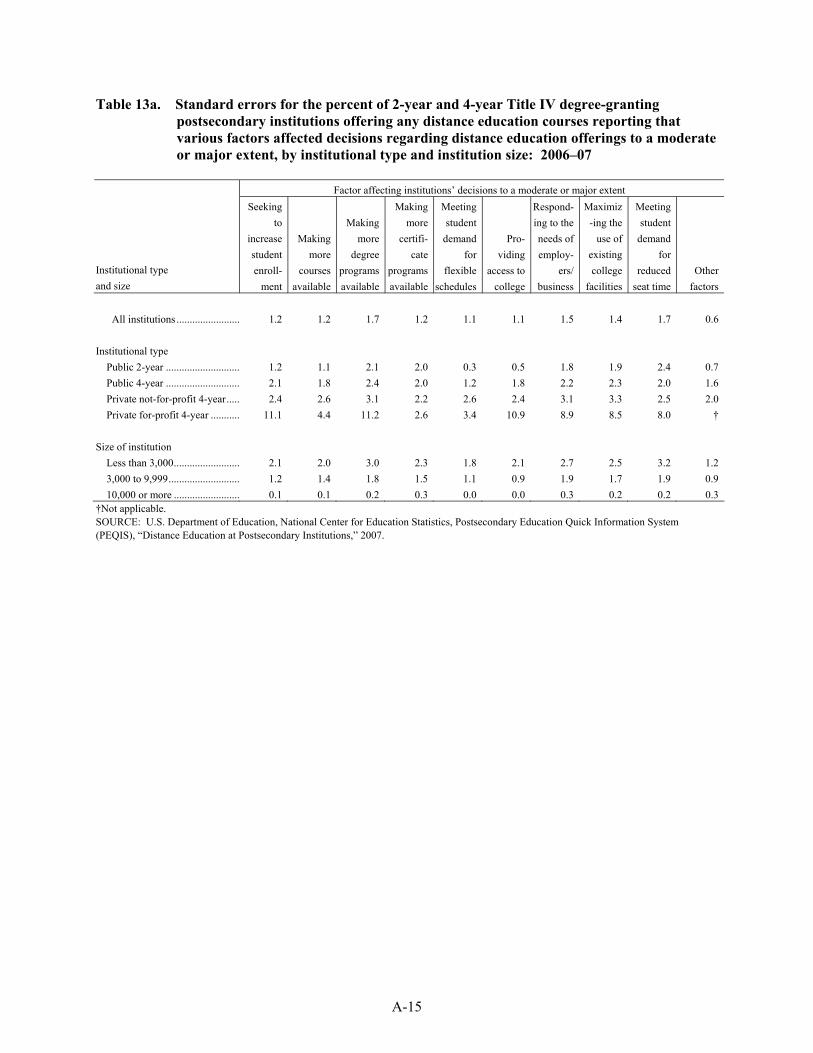
A-15
Table 13a. Standard errors for the percent of 2-year and 4-year Title IV degree-granting postsecondary institutions offering any distance education courses reporting that various factors affected decisions regarding distance education offerings to a moderate or major extent, by institutional type and institution size: 2006–07
Factor affecting institutions’ decisions to a moderate or major extent
Institutional type and size
Seeking to
increase student enroll-
ment
Making more
courses available
Making more
degree programs available
Making more
certifi-cate
programs available
Meeting student
demand for
flexible schedules
Pro-viding
access to college
Respond-ing to the needs of employ-
ers/ business
Maximiz-ing the
use of existing college
facilities
Meeting student
demand for
reduced seat time
Other factors
All institutions ........................ 1.2 1.2 1.7 1.2 1.1 1.1 1.5 1.4 1.7 0.6 Institutional type Public 2-year ............................ 1.2 1.1 2.1 2.0 0.3 0.5 1.8 1.9 2.4 0.7 Public 4-year ............................ 2.1 1.8 2.4 2.0 1.2 1.8 2.2 2.3 2.0 1.6 Private not-for-profit 4-year..... 2.4 2.6 3.1 2.2 2.6 2.4 3.1 3.3 2.5 2.0 Private for-profit 4-year ........... 11.1 4.4 11.2 2.6 3.4 10.9 8.9 8.5 8.0 † Size of institution Less than 3,000......................... 2.1 2.0 3.0 2.3 1.8 2.1 2.7 2.5 3.2 1.2 3,000 to 9,999........................... 1.2 1.4 1.8 1.5 1.1 0.9 1.9 1.7 1.9 0.9 10,000 or more ......................... 0.1 0.1 0.2 0.3 0.0 0.0 0.3 0.2 0.2 0.3 †Not applicable. SOURCE: U.S. Department of Education, National Center for Education Statistics, Postsecondary Education Quick Information System (PEQIS), “Distance Education at Postsecondary Institutions,” 2007.
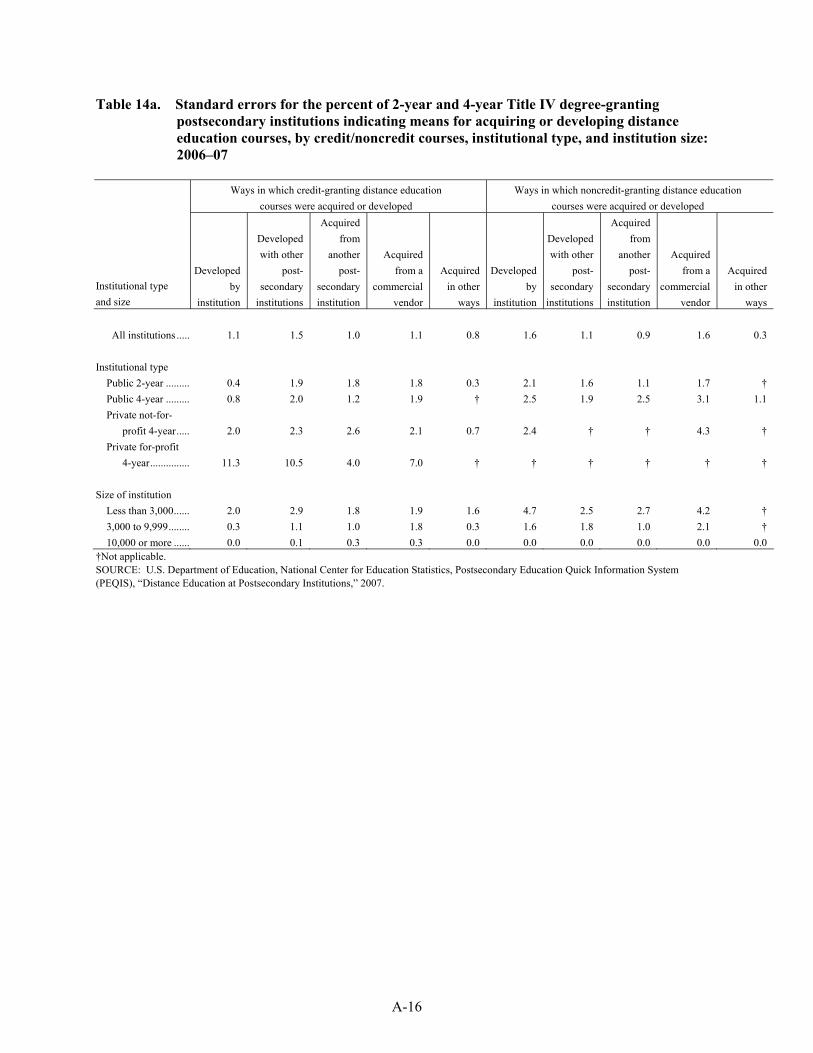
A-16
Table 14a. Standard errors for the percent of 2-year and 4-year Title IV degree-granting postsecondary institutions indicating means for acquiring or developing distance education courses, by credit/noncredit courses, institutional type, and institution size: 2006–07
Ways in which credit-granting distance education
courses were acquired or developed Ways in which noncredit-granting distance education
courses were acquired or developed
Institutional type and size
Developed by
institution
Developed with other
post-secondary
institutions
Acquired from
another post-
secondary institution
Acquired from a
commercial vendor
Acquired in other
ways
Developed by
institution
Developed with other
post-secondary
institutions
Acquired from
another post-
secondary institution
Acquired from a
commercial vendor
Acquired in other
ways
All institutions ..... 1.1 1.5 1.0 1.1 0.8 1.6 1.1 0.9 1.6 0.3 Institutional type Public 2-year ......... 0.4 1.9 1.8 1.8 0.3 2.1 1.6 1.1 1.7 † Public 4-year ......... 0.8 2.0 1.2 1.9 † 2.5 1.9 2.5 3.1 1.1 Private not-for- profit 4-year..... 2.0 2.3 2.6 2.1 0.7 2.4 † † 4.3 † Private for-profit 4-year............... 11.3 10.5 4.0 7.0 † † † † † † Size of institution Less than 3,000...... 2.0 2.9 1.8 1.9 1.6 4.7 2.5 2.7 4.2 † 3,000 to 9,999........ 0.3 1.1 1.0 1.8 0.3 1.6 1.8 1.0 2.1 † 10,000 or more ...... 0.0 0.1 0.3 0.3 0.0 0.0 0.0 0.0 0.0 0.0 †Not applicable. SOURCE: U.S. Department of Education, National Center for Education Statistics, Postsecondary Education Quick Information System (PEQIS), “Distance Education at Postsecondary Institutions,” 2007.
B-1
Appendix B
Technical Notes

This page intentionally left blank.
B-3
Technical Notes
Postsecondary Education Quick Information System
The Postsecondary Education Quick Information System (PEQIS) was established in 1991 by the National Center for Education Statistics (NCES), U.S. Department of Education (ED). PEQIS is designed to conduct brief surveys of postsecondary institutions or state higher education agencies on postsecondary education topics of national importance. Surveys are generally limited to 3 pages of questions, with a response burden of 30 to 45 minutes per respondent. Most PEQIS institutional surveys use a previously recruited, nationally representative panel of institutions. The PEQIS panel was originally selected and recruited in 1991–92. In 1996, 2002, and 2006, the PEQIS panel was reselected to reflect changes in the postsecondary education universe that had occurred since the original panel was selected. A modified Keyfitz approach was used to maximize overlap between the panels for each reselection. This approach resulted in about 80 percent of the institutions overlapping for each reselection of the panel (Chowdhury, Chu, and Kaufman 2000).
The sampling frame for the 2006 PEQIS panel was constructed from the 2005 Integrated
Postsecondary Education Data System (IPEDS) Institutional Characteristics file. Institutions eligible for the 2006 PEQIS frame included 2-year and 4-year (including graduate-level) institutions that are both Title IV eligible and degree granting, and are located in the 50 states and the District of Columbia: a total of 4,265 institutions. The 2006 PEQIS sampling frame was stratified by instructional level (4-year, 2-year), control (public, private not-for-profit, private for-profit), highest level of offering (doctor’s/first-professional, master’s, bachelor’s, less than bachelor’s), and total enrollment. Within each of the strata, institutions were sorted by region (Northeast, Southeast, Central, West) and by whether the institution had a relatively high minority enrollment. The sample of 1,627 institutions was allocated to the strata in proportion to the aggregate square root of total enrollment. Institutions within a stratum were sampled with equal probabilities of selection. Panel recruitment was conducted with the 339 institutions that were selected for the 2006 panel that were not part of the 2002 panel.
Each institution in the PEQIS panel was asked to identify a campus representative to serve as
survey coordinator. The campus representative facilitated data collection by identifying the appropriate respondent for each survey and forwarding the questionnaire to that person. Data were weighted to produce national estimates, and the sample size allowed for limited breakouts by classification variables. However, as the number of categories within the classification variables increased, the sample size within categories decreased, which resulted in larger sampling errors for the breakouts by classification variables.
Sample Selection and Response Rates
The sample for the distance education survey consisted of all of the institutions in the 2006 PEQIS panel. Questionnaires (see appendix C) were mailed to the PEQIS coordinators at the 1,627 institutions in fall 2007. Coordinators were told that the survey was designed to be completed by the person at the institution most knowledgeable about the institution’s distance education programs. In addition, data were collected from one 4-year private for-profit institution that was added to the sample for this survey only because it is the largest provider of online distance education courses in the nation, bringing the total sample size for this survey to 1,628 institutions. Respondents had the option of completing the survey online. Telephone follow-up of nonrespondents was initiated 3 weeks after mailout; data collection and clarification were completed in March 2008. During data collection, 18 institutions were determined to
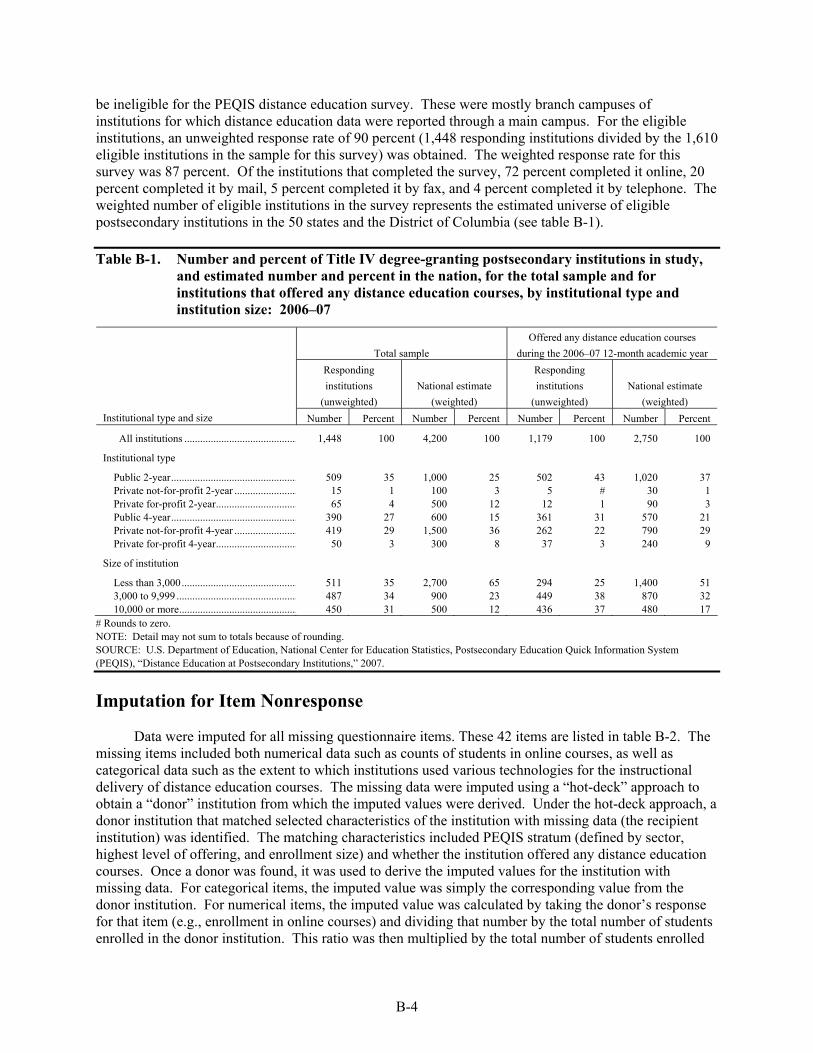
B-4
be ineligible for the PEQIS distance education survey. These were mostly branch campuses of institutions for which distance education data were reported through a main campus. For the eligible institutions, an unweighted response rate of 90 percent (1,448 responding institutions divided by the 1,610 eligible institutions in the sample for this survey) was obtained. The weighted response rate for this survey was 87 percent. Of the institutions that completed the survey, 72 percent completed it online, 20 percent completed it by mail, 5 percent completed it by fax, and 4 percent completed it by telephone. The weighted number of eligible institutions in the survey represents the estimated universe of eligible postsecondary institutions in the 50 states and the District of Columbia (see table B-1).
Table B-1. Number and percent of Title IV degree-granting postsecondary institutions in study,
and estimated number and percent in the nation, for the total sample and for institutions that offered any distance education courses, by institutional type and institution size: 2006–07
Total sample Offered any distance education courses
during the 2006–07 12-month academic year Responding institutions
(unweighted) National estimate
(weighted)
Responding institutions
(unweighted) National estimate
(weighted) Institutional type and size Number Percent Number Percent Number Percent Number Percent All institutions ........................................... 1,448 100 4,200 100 1,179 100 2,750 100 Institutional type Public 2-year................................................ 509 35 1,000 25 502 43 1,020 37 Private not-for-profit 2-year ........................ 15 1 100 3 5 # 30 1 Private for-profit 2-year............................... 65 4 500 12 12 1 90 3 Public 4-year................................................ 390 27 600 15 361 31 570 21 Private not-for-profit 4-year ........................ 419 29 1,500 36 262 22 790 29 Private for-profit 4-year............................... 50 3 300 8 37 3 240 9 Size of institution Less than 3,000............................................ 511 35 2,700 65 294 25 1,400 51 3,000 to 9,999 .............................................. 487 34 900 23 449 38 870 32 10,000 or more............................................. 450 31 500 12 436 37 480 17
# Rounds to zero. NOTE: Detail may not sum to totals because of rounding. SOURCE: U.S. Department of Education, National Center for Education Statistics, Postsecondary Education Quick Information System (PEQIS), “Distance Education at Postsecondary Institutions,” 2007.
Imputation for Item Nonresponse
Data were imputed for all missing questionnaire items. These 42 items are listed in table B-2. The missing items included both numerical data such as counts of students in online courses, as well as categorical data such as the extent to which institutions used various technologies for the instructional delivery of distance education courses. The missing data were imputed using a “hot-deck” approach to obtain a “donor” institution from which the imputed values were derived. Under the hot-deck approach, a donor institution that matched selected characteristics of the institution with missing data (the recipient institution) was identified. The matching characteristics included PEQIS stratum (defined by sector, highest level of offering, and enrollment size) and whether the institution offered any distance education courses. Once a donor was found, it was used to derive the imputed values for the institution with missing data. For categorical items, the imputed value was simply the corresponding value from the donor institution. For numerical items, the imputed value was calculated by taking the donor’s response for that item (e.g., enrollment in online courses) and dividing that number by the total number of students enrolled in the donor institution. This ratio was then multiplied by the total number of students enrolled
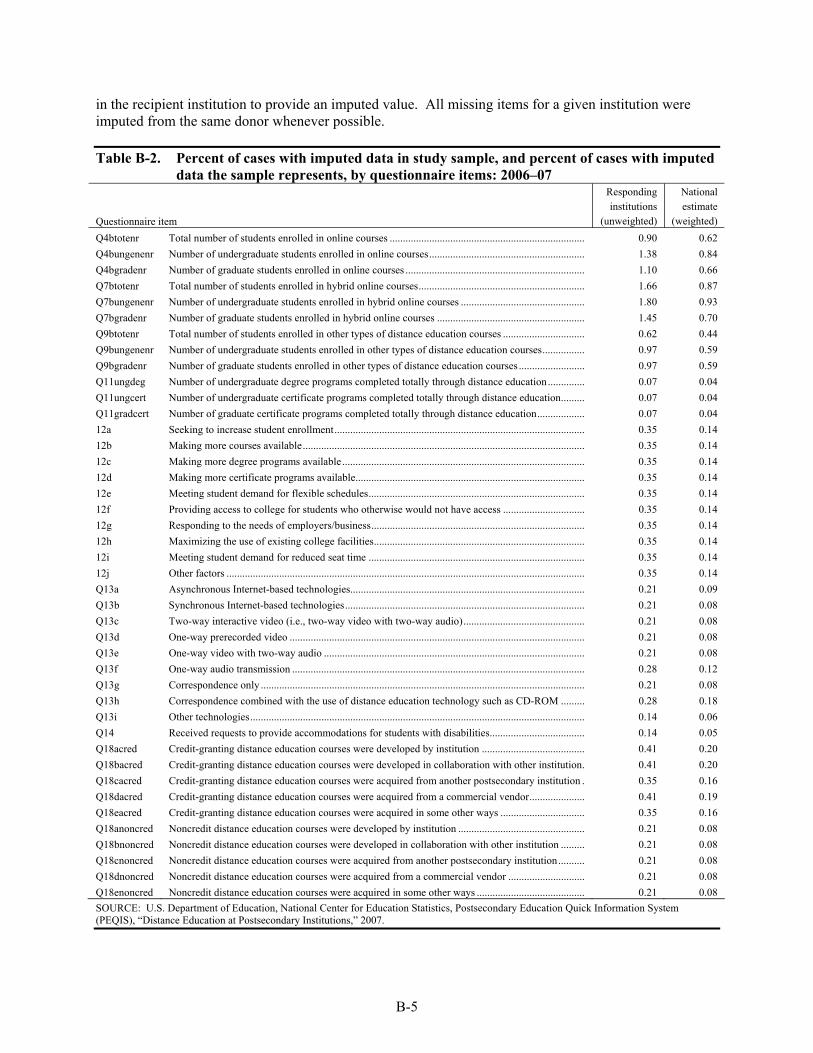
B-5
in the recipient institution to provide an imputed value. All missing items for a given institution were imputed from the same donor whenever possible.
Table B-2. Percent of cases with imputed data in study sample, and percent of cases with imputed
data the sample represents, by questionnaire items: 2006–07
Questionnaire item
Responding institutions
(unweighted)
National estimate
(weighted) Q4btotenr Total number of students enrolled in online courses .......................................................................... 0.90 0.62 Q4bungenenr Number of undergraduate students enrolled in online courses........................................................... 1.38 0.84 Q4bgradenr Number of graduate students enrolled in online courses .................................................................... 1.10 0.66 Q7btotenr Total number of students enrolled in hybrid online courses............................................................... 1.66 0.87 Q7bungenenr Number of undergraduate students enrolled in hybrid online courses ............................................... 1.80 0.93 Q7bgradenr Number of graduate students enrolled in hybrid online courses ........................................................ 1.45 0.70 Q9btotenr Total number of students enrolled in other types of distance education courses ............................... 0.62 0.44 Q9bungenenr Number of undergraduate students enrolled in other types of distance education courses................ 0.97 0.59 Q9bgradenr Number of graduate students enrolled in other types of distance education courses ......................... 0.97 0.59 Q11ungdeg Number of undergraduate degree programs completed totally through distance education.............. 0.07 0.04 Q11ungcert Number of undergraduate certificate programs completed totally through distance education......... 0.07 0.04 Q11gradcert Number of graduate certificate programs completed totally through distance education.................. 0.07 0.04 12a Seeking to increase student enrollment............................................................................................... 0.35 0.14 12b Making more courses available........................................................................................................... 0.35 0.1412c Making more degree programs available............................................................................................ 0.35 0.1412d Making more certificate programs available....................................................................................... 0.35 0.1412e Meeting student demand for flexible schedules.................................................................................. 0.35 0.1412f Providing access to college for students who otherwise would not have access ............................... 0.35 0.1412g Responding to the needs of employers/business................................................................................. 0.35 0.1412h Maximizing the use of existing college facilities................................................................................ 0.35 0.1412i Meeting student demand for reduced seat time .................................................................................. 0.35 0.1412j Other factors ........................................................................................................................................ 0.35 0.14Q13a Asynchronous Internet-based technologies......................................................................................... 0.21 0.09 Q13b Synchronous Internet-based technologies........................................................................................... 0.21 0.08 Q13c Two-way interactive video (i.e., two-way video with two-way audio).............................................. 0.21 0.08 Q13d One-way prerecorded video ................................................................................................................ 0.21 0.08 Q13e One-way video with two-way audio ................................................................................................... 0.21 0.08 Q13f One-way audio transmission ............................................................................................................... 0.28 0.12 Q13g Correspondence only ........................................................................................................................... 0.21 0.08 Q13h Correspondence combined with the use of distance education technology such as CD-ROM ......... 0.28 0.18 Q13i Other technologies............................................................................................................................... 0.14 0.06 Q14 Received requests to provide accommodations for students with disabilities.................................... 0.14 0.05 Q18acred Credit-granting distance education courses were developed by institution ....................................... 0.41 0.20 Q18bacred Credit-granting distance education courses were developed in collaboration with other institution. 0.41 0.20 Q18cacred Credit-granting distance education courses were acquired from another postsecondary institution . 0.35 0.16 Q18dacred Credit-granting distance education courses were acquired from a commercial vendor..................... 0.41 0.19 Q18eacred Credit-granting distance education courses were acquired in some other ways ................................ 0.35 0.16 Q18anoncred Noncredit distance education courses were developed by institution ................................................ 0.21 0.08 Q18bnoncred Noncredit distance education courses were developed in collaboration with other institution ......... 0.21 0.08Q18cnoncred Noncredit distance education courses were acquired from another postsecondary institution.......... 0.21 0.08Q18dnoncred Noncredit distance education courses were acquired from a commercial vendor ............................. 0.21 0.08Q18enoncred Noncredit distance education courses were acquired in some other ways ......................................... 0.21 0.08SOURCE: U.S. Department of Education, National Center for Education Statistics, Postsecondary Education Quick Information System (PEQIS), “Distance Education at Postsecondary Institutions,” 2007.
B-6
Data Reliability
While the “Distance Education at Postsecondary Institutions” survey was designed to account for sampling error and to minimize nonsampling error, estimates produced from the data collected are subject to both types of error. Sampling error occurs because the data are collected from a sample rather than a census of the population, and nonsampling errors are errors made during the collection and processing of the data.
Sampling Errors
The responses were weighted to produce national estimates (see table B-1). The weights were designed to adjust for the variable probabilities of selection and differential nonresponse. The findings in this report are estimates based on the sample selected and, consequently, are subject to sampling variability. General sampling theory was used to estimate the sampling variability of the estimates and to test for statistically significant differences between estimates.
The standard error is a measure of the variability of an estimate due to sampling. It indicates the
variability of a sample estimate that would be obtained from all possible samples of a given design and size. Standard errors are used as a measure of the precision expected from a particular sample. If all possible samples were surveyed under similar conditions, intervals of 1.96 standard errors below to 1.96 standard errors above a particular statistic would include the true population parameter being estimated in about 95 percent of the samples. This is a 95 percent confidence interval. For example, the estimated percentage of Title IV degree-granting postsecondary institutions that offered any distance education courses is 65.9 percent and the standard error is 1.3 percent (see tables 1 and 1a). The 95 percent confidence interval for the statistic extends from [65.9 – (1.3 x 1.96)] to [65.9 + (1.3 x 1.96)], or from 63.4 to 68.4 percent. The 1.96 is the critical value for a statistical test at the 0.05 significance level (where 0.05 indicates the 5 percent of all possible samples that would be outside the range of the confidence interval).
Because the data from the PEQIS distance education survey were collected using a complex
sampling design, the variances of the estimates from this survey (e.g., estimates of proportions) are typically different from what would be expected from data collected with a simple random sample. Not taking the complex sample design into account can lead to an underestimation of the standard errors associated with such estimates. To generate accurate standard errors for the estimates in this report, standard errors were computed using a technique known as jackknife replication. As with any replication method, jackknife replication involves constructing a number of subsamples (replicates) from the full sample and computing the statistic of interest for each replicate. The mean square error of the replicate estimates around the full sample estimate provides an estimate of the variance of the statistic. To construct the replications, 50 stratified subsamples of the full sample were created and then dropped 1 at a time to define 50 jackknife replicates. A computer program (WesVar) was used to calculate the estimates of standard errors.
All specific statements of comparisons made in this report have been tested for statistical
significance at the .05 level using Student’s t-statistics to ensure that the differences are larger than those that might be expected due to sampling variation. Adjustments for multiple comparisons were not included. Student’s t values were computed to test the difference between estimates with the following formula:
22
21
21
sese
EEt+
−=
B-7
where E1 and E2 are the estimates to be compared and se1 and se2 are their corresponding standard errors. Many of the variables examined are related to one another, and complex interactions and relationships have not been explored.
Nonsampling Errors
Nonsampling error is the term used to describe variations in the estimates that may be caused by population coverage limitations and data collection, processing, and reporting procedures. The sources of nonsampling errors are typically problems like unit and item nonresponse, differences in respondents’ interpretations of the meaning of questions, response differences related to the particular time the survey was conducted, and mistakes made during data preparation. It is difficult to identify and estimate either the amount of nonsampling error or the bias caused by this error. To minimize the potential for nonsampling error, this study used a variety of procedures, including a pretest of the questionnaire with individuals at postsecondary institutions deemed to be the most knowledgeable about the distance education offerings at their institutions. The pretest provided the opportunity to check for consistency of interpretation of questions and definitions and to eliminate ambiguous items. The questionnaire and instructions were also extensively reviewed by NCES and the data requestor at the Office of Educational Technology. In addition, extensive editing of the questionnaire responses was conducted to check the data for accuracy and consistency. Cases with missing or inconsistent items were recontacted by telephone to resolve problems. Data were keyed with 100 percent verification for surveys received by mail, fax, or telephone.
Definitions of Analysis Variables
• Institutional type: public 2-year, private not-for-profit 2-year, private for-profit 2-year, public 4-year, private not-for-profit 4-year, private for-profit 4-year. Type was created from a combination of level (2-year, 4-year) and control (public, private not-for-profit, private for-profit). Two-year institutions are defined as institutions at which the highest level of offering is at least 2 but less than 4 years (below the baccalaureate degree); 4-year institutions are those at which the highest level of offering is 4 or more years (baccalaureate or higher degree).1
• Institution size: less than 3,000 students; 3,000 to 9,999 students; and 10,000 or more students.
For more information about the Postsecondary Education Quick Information System or the Survey
on Distance Education at Postsecondary Institutions, contact Peter Tice, Early Childhood, International, and Crosscutting Studies Division, National Center for Education Statistics, Institute of Education Sciences, U.S. Department of Education, 1990 K Street, NW, Washington, DC 20006; e-mail: [email protected]; telephone (202) 502-7497.
1Definitions for level are from the data file documentation for the Integrated Postsecondary Education Data System (IPEDS) Institutional Characteristics file, U.S. Department of Education, National Center for Education Statistics.

C-1
Appendix C
Questionnaire

This page intentionally left blank.
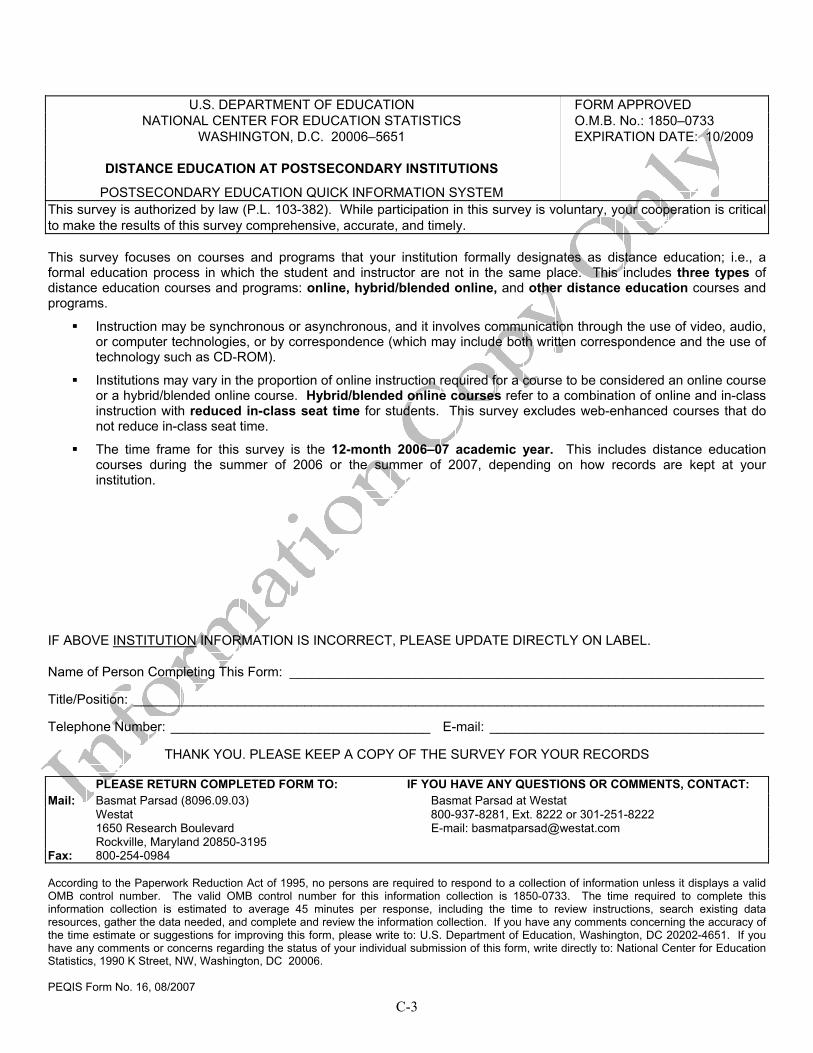
C-3
U.S. DEPARTMENT OF EDUCATION FORM APPROVED NATIONAL CENTER FOR EDUCATION STATISTICS O.M.B. No.: 1850–0733 WASHINGTON, D.C. 20006–5651 EXPIRATION DATE: 10/2009 DISTANCE EDUCATION AT POSTSECONDARY INSTITUTIONS POSTSECONDARY EDUCATION QUICK INFORMATION SYSTEM This survey is authorized by law (P.L. 103-382). While participation in this survey is voluntary, your cooperation is critical to make the results of this survey comprehensive, accurate, and timely. This survey focuses on courses and programs that your institution formally designates as distance education; i.e., a formal education process in which the student and instructor are not in the same place. This includes three types of distance education courses and programs: online, hybrid/blended online, and other distance education courses and programs.
Instruction may be synchronous or asynchronous, and it involves communication through the use of video, audio, or computer technologies, or by correspondence (which may include both written correspondence and the use of technology such as CD-ROM).
Institutions may vary in the proportion of online instruction required for a course to be considered an online course or a hybrid/blended online course. Hybrid/blended online courses refer to a combination of online and in-class instruction with reduced in-class seat time for students. This survey excludes web-enhanced courses that do not reduce in-class seat time.
The time frame for this survey is the 12-month 2006–07 academic year. This includes distance education courses during the summer of 2006 or the summer of 2007, depending on how records are kept at your institution.
IF ABOVE INSTITUTION INFORMATION IS INCORRECT, PLEASE UPDATE DIRECTLY ON LABEL. Name of Person Completing This Form: ________________________________________________________________ Title/Position: _____________________________________________________________________________________ Telephone Number: ___________________________________ E-mail: _____________________________________
THANK YOU. PLEASE KEEP A COPY OF THE SURVEY FOR YOUR RECORDS PLEASE RETURN COMPLETED FORM TO: IF YOU HAVE ANY QUESTIONS OR COMMENTS, CONTACT: Mail: Basmat Parsad (8096.09.03) Basmat Parsad at Westat Westat 800-937-8281, Ext. 8222 or 301-251-8222 1650 Research Boulevard E-mail: [email protected] Rockville, Maryland 20850-3195 Fax: 800-254-0984 According to the Paperwork Reduction Act of 1995, no persons are required to respond to a collection of information unless it displays a valid OMB control number. The valid OMB control number for this information collection is 1850-0733. The time required to complete this information collection is estimated to average 45 minutes per response, including the time to review instructions, search existing data resources, gather the data needed, and complete and review the information collection. If you have any comments concerning the accuracy of the time estimate or suggestions for improving this form, please write to: U.S. Department of Education, Washington, DC 20202-4651. If you have any comments or concerns regarding the status of your individual submission of this form, write directly to: National Center for Education Statistics, 1990 K Street, NW, Washington, DC 20006. PEQIS Form No. 16, 08/2007
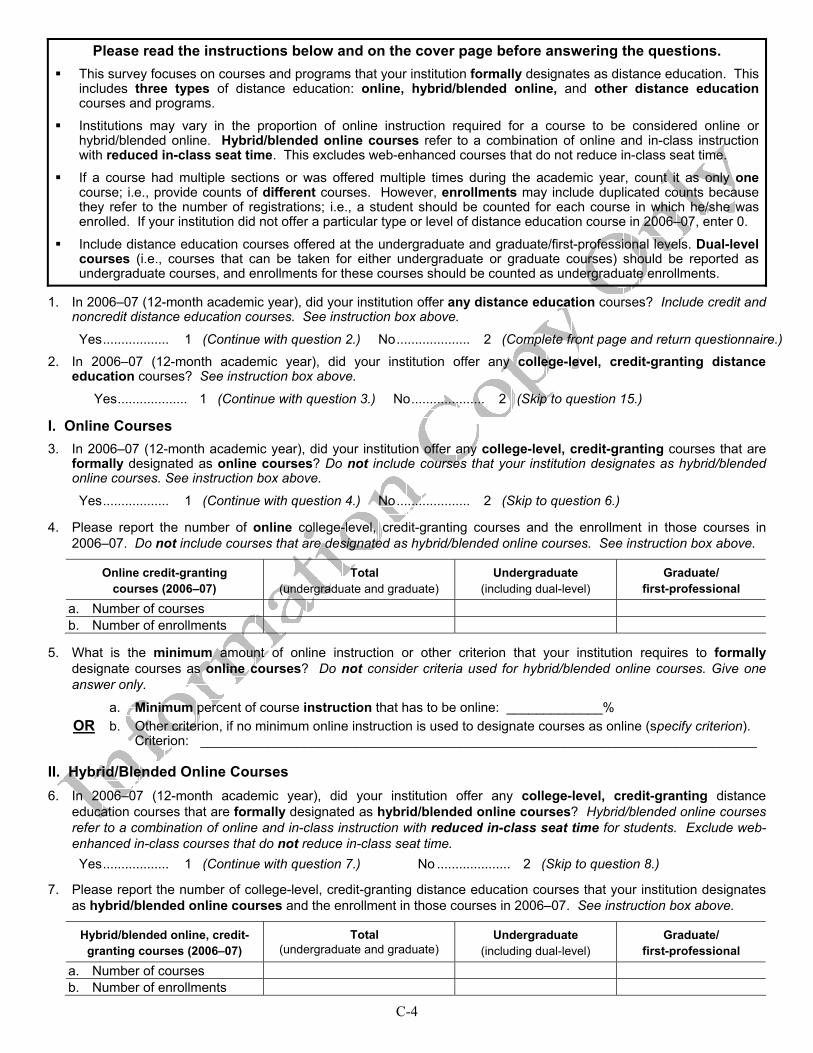
C-4
Please read the instructions below and on the cover page before answering the questions. This survey focuses on courses and programs that your institution formally designates as distance education. This
includes three types of distance education: online, hybrid/blended online, and other distance education courses and programs.
Institutions may vary in the proportion of online instruction required for a course to be considered online or hybrid/blended online. Hybrid/blended online courses refer to a combination of online and in-class instruction with reduced in-class seat time. This excludes web-enhanced courses that do not reduce in-class seat time.
If a course had multiple sections or was offered multiple times during the academic year, count it as only one course; i.e., provide counts of different courses. However, enrollments may include duplicated counts because they refer to the number of registrations; i.e., a student should be counted for each course in which he/she was enrolled. If your institution did not offer a particular type or level of distance education course in 2006–07, enter 0.
Include distance education courses offered at the undergraduate and graduate/first-professional levels. Dual-level courses (i.e., courses that can be taken for either undergraduate or graduate courses) should be reported as undergraduate courses, and enrollments for these courses should be counted as undergraduate enrollments.
1. In 2006–07 (12-month academic year), did your institution offer any distance education courses? Include credit and
noncredit distance education courses. See instruction box above.
Yes.................. 1 (Continue with question 2.) No.................... 2 (Complete front page and return questionnaire.) 2. In 2006–07 (12-month academic year), did your institution offer any college-level, credit-granting distance
education courses? See instruction box above.
Yes................... 1 (Continue with question 3.) No.................... 2 (Skip to question 15.) I. Online Courses 3. In 2006–07 (12-month academic year), did your institution offer any college-level, credit-granting courses that are
formally designated as online courses? Do not include courses that your institution designates as hybrid/blended online courses. See instruction box above.
Yes.................. 1 (Continue with question 4.) No.................... 2 (Skip to question 6.) 4. Please report the number of online college-level, credit-granting courses and the enrollment in those courses in
2006–07. Do not include courses that are designated as hybrid/blended online courses. See instruction box above.
Online credit-granting courses (2006–07)
Total (undergraduate and graduate)
Undergraduate (including dual-level)
Graduate/ first-professional
a. Number of courses b. Number of enrollments
5. What is the minimum amount of online instruction or other criterion that your institution requires to formally
designate courses as online courses? Do not consider criteria used for hybrid/blended online courses. Give one answer only.
a. Minimum percent of course instruction that has to be online: _____________% OR b. Other criterion, if no minimum online instruction is used to designate courses as online (specify criterion).
Criterion: ___________________________________________________________________________ II. Hybrid/Blended Online Courses 6. In 2006–07 (12-month academic year), did your institution offer any college-level, credit-granting distance
education courses that are formally designated as hybrid/blended online courses? Hybrid/blended online courses refer to a combination of online and in-class instruction with reduced in-class seat time for students. Exclude web-enhanced in-class courses that do not reduce in-class seat time. Yes.................. 1 (Continue with question 7.) No .................... 2 (Skip to question 8.)
7. Please report the number of college-level, credit-granting distance education courses that your institution designates
as hybrid/blended online courses and the enrollment in those courses in 2006–07. See instruction box above.
Hybrid/blended online, credit-granting courses (2006–07)
Total (undergraduate and graduate)
Undergraduate (including dual-level)
Graduate/ first-professional
a. Number of courses b. Number of enrollments
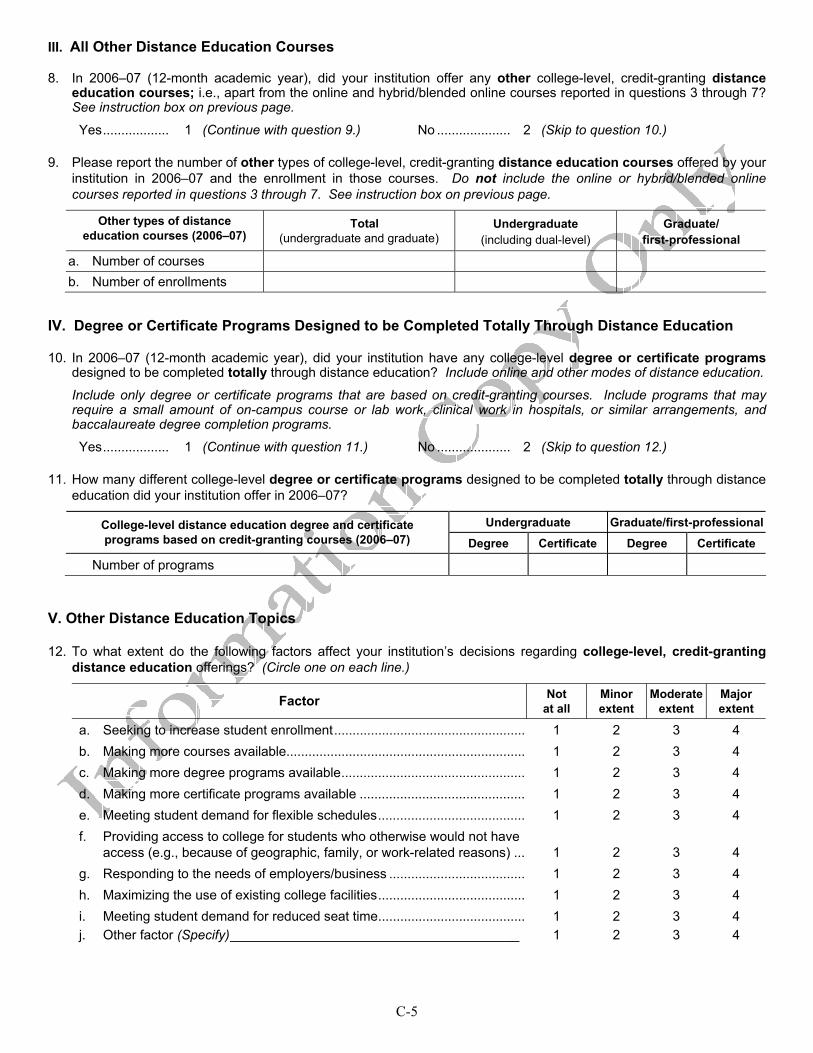
C-5
III. All Other Distance Education Courses 8. In 2006–07 (12-month academic year), did your institution offer any other college-level, credit-granting distance
education courses; i.e., apart from the online and hybrid/blended online courses reported in questions 3 through 7? See instruction box on previous page.
Yes.................. 1 (Continue with question 9.) No .................... 2 (Skip to question 10.) 9. Please report the number of other types of college-level, credit-granting distance education courses offered by your
institution in 2006–07 and the enrollment in those courses. Do not include the online or hybrid/blended online courses reported in questions 3 through 7. See instruction box on previous page.
Other types of distance education courses (2006–07)
Total (undergraduate and graduate)
Undergraduate (including dual-level)
Graduate/ first-professional
a. Number of courses b. Number of enrollments
IV. Degree or Certificate Programs Designed to be Completed Totally Through Distance Education 10. In 2006–07 (12-month academic year), did your institution have any college-level degree or certificate programs
designed to be completed totally through distance education? Include online and other modes of distance education.
Include only degree or certificate programs that are based on credit-granting courses. Include programs that may require a small amount of on-campus course or lab work, clinical work in hospitals, or similar arrangements, and baccalaureate degree completion programs.
Yes.................. 1 (Continue with question 11.) No .................... 2 (Skip to question 12.) 11. How many different college-level degree or certificate programs designed to be completed totally through distance
education did your institution offer in 2006–07?
Undergraduate Graduate/first-professionalCollege-level distance education degree and certificate programs based on credit-granting courses (2006–07) Degree Certificate Degree Certificate
Number of programs V. Other Distance Education Topics 12. To what extent do the following factors affect your institution’s decisions regarding college-level, credit-granting
distance education offerings? (Circle one on each line.)
Factor Not at all
Minor extent
Moderate extent
Major extent
a. Seeking to increase student enrollment..................................................... 1 2 3 4 b. Making more courses available.................................................................. 1 2 3 4 c. Making more degree programs available................................................... 1 2 3 4 d. Making more certificate programs available .............................................. 1 2 3 4 e. Meeting student demand for flexible schedules......................................... 1 2 3 4 f. Providing access to college for students who otherwise would not have
access (e.g., because of geographic, family, or work-related reasons) .... 1 2 3 4 g. Responding to the needs of employers/business ...................................... 1 2 3 4 h. Maximizing the use of existing college facilities......................................... 1 2 3 4 i. Meeting student demand for reduced seat time......................................... 1 2 3 4 j. Other factor (Specify)_______________________________________ 1 2 3 4
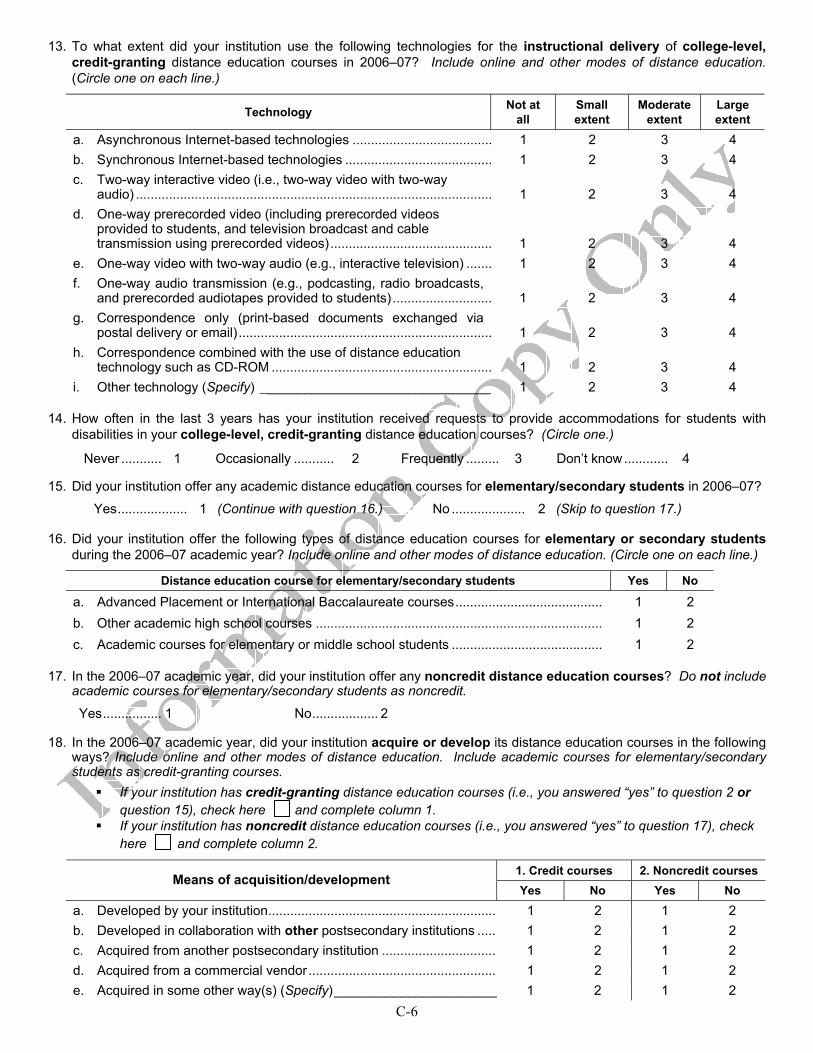
C-6
13. To what extent did your institution use the following technologies for the instructional delivery of college-level, credit-granting distance education courses in 2006–07? Include online and other modes of distance education. (Circle one on each line.)
Technology Not at all
Small extent
Moderate extent
Large extent
a. Asynchronous Internet-based technologies ...................................... 1 2 3 4 b. Synchronous Internet-based technologies ........................................ 1 2 3 4 c. Two-way interactive video (i.e., two-way video with two-way
audio) ................................................................................................. 1 2 3 4 d. One-way prerecorded video (including prerecorded videos
provided to students, and television broadcast and cable transmission using prerecorded videos)............................................ 1 2 3 4
e. One-way video with two-way audio (e.g., interactive television) ....... 1 2 3 4 f. One-way audio transmission (e.g., podcasting, radio broadcasts,
and prerecorded audiotapes provided to students) ........................... 1 2 3 4 g. Correspondence only (print-based documents exchanged via
postal delivery or email)..................................................................... 1 2 3 4 h. Correspondence combined with the use of distance education
technology such as CD-ROM ............................................................ 1 2 3 4 i. Other technology (Specify) ________________________________ 1 2 3 4
14. How often in the last 3 years has your institution received requests to provide accommodations for students with
disabilities in your college-level, credit-granting distance education courses? (Circle one.)
Never ........... 1 Occasionally ........... 2 Frequently ......... 3 Don’t know............ 4 15. Did your institution offer any academic distance education courses for elementary/secondary students in 2006–07?
Yes................... 1 (Continue with question 16.) No .................... 2 (Skip to question 17.) 16. Did your institution offer the following types of distance education courses for elementary or secondary students
during the 2006–07 academic year? Include online and other modes of distance education. (Circle one on each line.)
Distance education course for elementary/secondary students Yes No
a. Advanced Placement or International Baccalaureate courses........................................ 1 2 b. Other academic high school courses .............................................................................. 1 2 c. Academic courses for elementary or middle school students ......................................... 1 2
17. In the 2006–07 academic year, did your institution offer any noncredit distance education courses? Do not include
academic courses for elementary/secondary students as noncredit.
Yes................ 1 No.................. 2 18. In the 2006–07 academic year, did your institution acquire or develop its distance education courses in the following
ways? Include online and other modes of distance education. Include academic courses for elementary/secondary students as credit-granting courses.
If your institution has credit-granting distance education courses (i.e., you answered “yes” to question 2 or question 15), check here and complete column 1.
If your institution has noncredit distance education courses (i.e., you answered “yes” to question 17), check here and complete column 2.
1. Credit courses 2. Noncredit courses Means of acquisition/development
Yes No Yes No a. Developed by your institution.............................................................. 1 2 1 2 b. Developed in collaboration with other postsecondary institutions ..... 1 2 1 2 c. Acquired from another postsecondary institution ............................... 1 2 1 2 d. Acquired from a commercial vendor................................................... 1 2 1 2 e. Acquired in some other way(s) (Specify)______________________ 1 2 1 2