Embed Size (px)
Citation preview
Ecosystem Services 29 (2018) 70–82
Contents lists available at ScienceDirect
Ecosystem Services
journal homepage: www.elsevier .com/locate /ecoser
Distilling the role of ecosystem services in the Sustainable DevelopmentGoals
https://doi.org/10.1016/j.ecoser.2017.10.0102212-0416/� 2017 Elsevier B.V. All rights reserved.
⇑ Corresponding author at: Institut des sciences de la forêt tempérée, Universitéde Québec en Outaouais, 58 rue Principale, Ripon, QC., J0V 1V0, poste 2931, Canada.
E-mail addresses: [email protected] (S.L.R. Wood), [email protected](S.K. Jones), [email protected] (J.A. Johnson), [email protected] (K.A. Brauman),[email protected] (R. Chaplin-Kramer), [email protected] (A. Fremier),[email protected] (E. Girvetz), [email protected] (L.J. Gordon),[email protected] (C.V. Kappel), [email protected] (L. Mandle), [email protected] (M. Mulligan), [email protected] (P. O’Farrell), [email protected] (W.K. Smith), [email protected] (L. Willemen), [email protected] (W. Zhang), [email protected] (F.A. DeClerck).
Sylvia L.R. Wood a,d,⇑, Sarah K. Jones a,b, Justin A. Johnson c, Kate A. Brauman c, Rebecca Chaplin-Kramer e,Alexander Fremier f, Evan Girvetz g, Line J. Gordon h, Carrie V. Kappel i, Lisa Mandle e, Mark Mulligan b,Patrick O’Farrell j, William K. Smith k, Louise Willemen l, Wei Zhangm, Fabrice A. DeClerck a,h
aBioversity International, CGIAR, Montpellier, FrancebDepartment of Geography, King’s College London, London, UKc Institute on the Environment, University of Minnesota, St. Paul, USAdColumbia University Earth Institute Center on Environmental Sustainability, New York, USAeNatural Capital Project, Stanford University, Stanford, CA, USAf School of the Environment, Washington State University, Pullman, WA, USAg International Center for Tropical Agriculture, Nairobi, Kenyah Stockholm Resilience Center, Stockholm University, Stockholm, SwedeniNational Center for Ecological Analysis and Synthesis, Santa Barbara, CA, USAjCouncil for Scientific and Industrial Research, South Africak School of Natural Resources and the Environment, University of Arizona, Tucson, AZ, USAl Faculty of Geo-information Science and Earth Observation (ITC), University of Twente, Enschede, The Netherlandsm International Food Policy Research Institute, CGIAR, Washington, DC, USA
a r t i c l e i n f o a b s t r a c t
Article history:Received 16 January 2017Received in revised form 9 October 2017Accepted 16 October 2017
Keywords:Environmental benefitsSustainable Development GoalsInteractionsEcosystem modellingPolicy review
Achieving well-being for all, while protecting the environment, is one of the most pressing global chal-lenges of our time, and a central idea in the UN Sustainable Development Goals (SDGs). We believe thatintegrating ecosystem services, the benefits nature provides to people, into strategies for meeting theSDGs can help achieve this. Many development goals are likely underpinned by the delivery of one ormore ecosystem services. Understanding how these services could support multiple development targetswill be essential for planning synergistic and cost-effective interventions. Here we present the results ofan expert survey on the contributions of 16 ecosystem services to achieving SDG targets linked to envi-ronment and human well-being, and review the capacity of modelling tools to evaluate SDG-relevantecosystem services interactions. Survey respondents judged that individual ecosystem services couldmake important contributions to achieving 41 targets across 12 SDGs. The provision of food and water,habitat & biodiversity maintenance, and carbon storage & sequestration were perceived to each makecontributions to >14 SDG targets, suggesting cross-target interactions are likely, and may present oppor-tunities for synergistic outcomes across multiple SDGs. Existing modelling tools are well-aligned to sup-port SDG-relevant ecosystem service planning. Together, this work identifies entry points and tools tofurther analyze the role of ecosystem services to support the SDGs.
� 2017 Elsevier B.V. All rights reserved.
1. Introduction
With the formal adoption of the UN Sustainable DevelopmentGoals (SDGs) and their launch in 2016, governments globally aretasked with developing pathways to achieve nationally prioritizedtargets that incorporate social, economic and environmentaldimensions of sustainability, moving beyond sectoral approachesof the past. Building on progress made under the UN MillenniumDevelopment Goals (UN, 2015a), the SDGs are a globally agreedupon set of 17 goals, 169 nested targets, and over 200 associated
S.L.R. Wood et al. / Ecosystem Services 29 (2018) 70–82 71
indicators that set the agenda for addressing sustainable develop-ment challenges by 2030. Yet, practical strategies for achievingthese aims in unison, particularly how ecosystems can be both pro-tected and managed to support human well-being objectives, arenot specified and present important and urgent research questions.
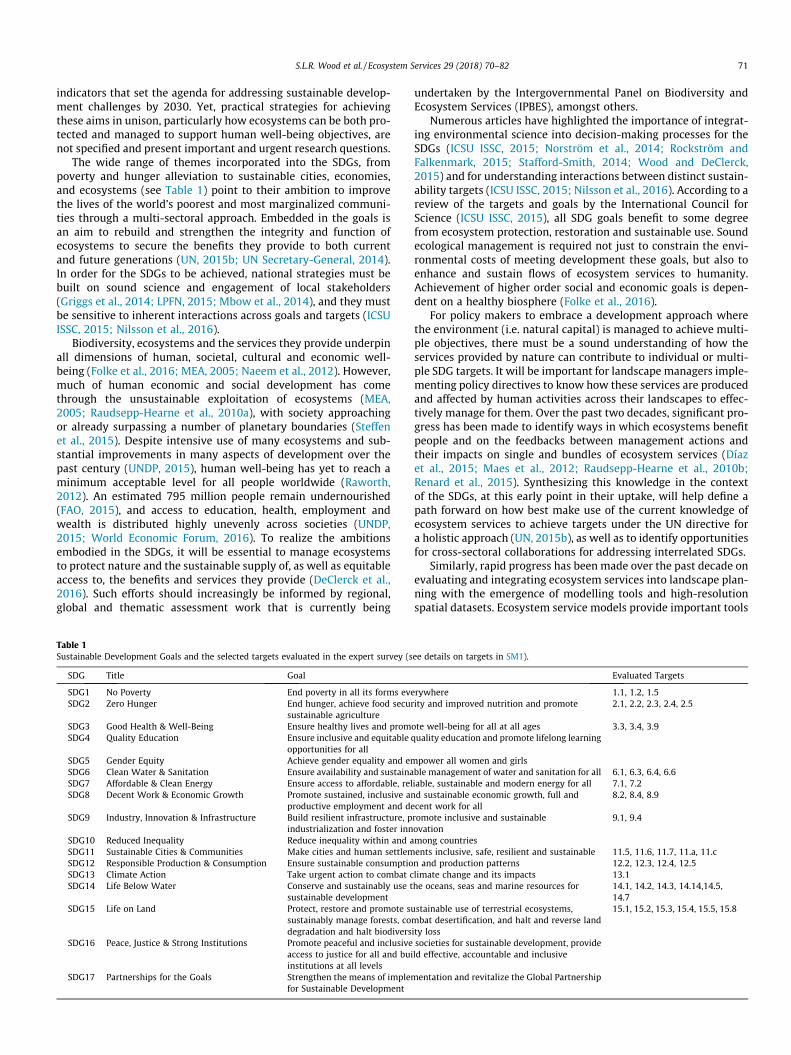
The wide range of themes incorporated into the SDGs, frompoverty and hunger alleviation to sustainable cities, economies,and ecosystems (see Table 1) point to their ambition to improvethe lives of the world’s poorest and most marginalized communi-ties through a multi-sectoral approach. Embedded in the goals isan aim to rebuild and strengthen the integrity and function ofecosystems to secure the benefits they provide to both currentand future generations (UN, 2015b; UN Secretary-General, 2014).In order for the SDGs to be achieved, national strategies must bebuilt on sound science and engagement of local stakeholders(Griggs et al., 2014; LPFN, 2015; Mbow et al., 2014), and they mustbe sensitive to inherent interactions across goals and targets (ICSUISSC, 2015; Nilsson et al., 2016).
Biodiversity, ecosystems and the services they provide underpinall dimensions of human, societal, cultural and economic well-being (Folke et al., 2016; MEA, 2005; Naeem et al., 2012). However,much of human economic and social development has comethrough the unsustainable exploitation of ecosystems (MEA,2005; Raudsepp-Hearne et al., 2010a), with society approachingor already surpassing a number of planetary boundaries (Steffenet al., 2015). Despite intensive use of many ecosystems and sub-stantial improvements in many aspects of development over thepast century (UNDP, 2015), human well-being has yet to reach aminimum acceptable level for all people worldwide (Raworth,2012). An estimated 795 million people remain undernourished(FAO, 2015), and access to education, health, employment andwealth is distributed highly unevenly across societies (UNDP,2015; World Economic Forum, 2016). To realize the ambitionsembodied in the SDGs, it will be essential to manage ecosystemsto protect nature and the sustainable supply of, as well as equitableaccess to, the benefits and services they provide (DeClerck et al.,2016). Such efforts should increasingly be informed by regional,global and thematic assessment work that is currently being
Table 1Sustainable Development Goals and the selected targets evaluated in the expert survey (s
SDG Title Goal
SDG1 No Poverty End poverty in all its forms eveSDG2 Zero Hunger End hunger, achieve food secur
sustainable agricultureSDG3 Good Health & Well-Being Ensure healthy lives and promSDG4 Quality Education Ensure inclusive and equitable q
opportunities for allSDG5 Gender Equity Achieve gender equality and emSDG6 Clean Water & Sanitation Ensure availability and sustainaSDG7 Affordable & Clean Energy Ensure access to affordable, relSDG8 Decent Work & Economic Growth Promote sustained, inclusive an
productive employment and deSDG9 Industry, Innovation & Infrastructure Build resilient infrastructure, p
industrialization and foster innSDG10 Reduced Inequality Reduce inequality within and aSDG11 Sustainable Cities & Communities Make cities and human settlemSDG12 Responsible Production & Consumption Ensure sustainable consumptioSDG13 Climate Action Take urgent action to combat cSDG14 Life Below Water Conserve and sustainably use t
sustainable developmentSDG15 Life on Land Protect, restore and promote su
sustainably manage forests, codegradation and halt biodivers
SDG16 Peace, Justice & Strong Institutions Promote peaceful and inclusiveaccess to justice for all and buiinstitutions at all levels
SDG17 Partnerships for the Goals Strengthen the means of implemfor Sustainable Development
undertaken by the Intergovernmental Panel on Biodiversity andEcosystem Services (IPBES), amongst others.
Numerous articles have highlighted the importance of integrat-ing environmental science into decision-making processes for theSDGs (ICSU ISSC, 2015; Norström et al., 2014; Rockström andFalkenmark, 2015; Stafford-Smith, 2014; Wood and DeClerck,2015) and for understanding interactions between distinct sustain-ability targets (ICSU ISSC, 2015; Nilsson et al., 2016). According to areview of the targets and goals by the International Council forScience (ICSU ISSC, 2015), all SDG goals benefit to some degreefrom ecosystem protection, restoration and sustainable use. Soundecological management is required not just to constrain the envi-ronmental costs of meeting development these goals, but also toenhance and sustain flows of ecosystem services to humanity.Achievement of higher order social and economic goals is depen-dent on a healthy biosphere (Folke et al., 2016).
For policy makers to embrace a development approach wherethe environment (i.e. natural capital) is managed to achieve multi-ple objectives, there must be a sound understanding of how theservices provided by nature can contribute to individual or multi-ple SDG targets. It will be important for landscape managers imple-menting policy directives to know how these services are producedand affected by human activities across their landscapes to effec-tively manage for them. Over the past two decades, significant pro-gress has been made to identify ways in which ecosystems benefitpeople and on the feedbacks between management actions andtheir impacts on single and bundles of ecosystem services (Díazet al., 2015; Maes et al., 2012; Raudsepp-Hearne et al., 2010b;Renard et al., 2015). Synthesizing this knowledge in the contextof the SDGs, at this early point in their uptake, will help define apath forward on how best make use of the current knowledge ofecosystem services to achieve targets under the UN directive fora holistic approach (UN, 2015b), as well as to identify opportunitiesfor cross-sectoral collaborations for addressing interrelated SDGs.
Similarly, rapid progress has been made over the past decade onevaluating and integrating ecosystem services into landscape plan-ning with the emergence of modelling tools and high-resolutionspatial datasets. Ecosystem service models provide important tools
ee details on targets in SM1).
Evaluated Targets
rywhere 1.1, 1.2, 1.5ity and improved nutrition and promote 2.1, 2.2, 2.3, 2.4, 2.5
ote well-being for all at all ages 3.3, 3.4, 3.9uality education and promote lifelong learning
power all women and girlsble management of water and sanitation for all 6.1, 6.3, 6.4, 6.6iable, sustainable and modern energy for all 7.1, 7.2d sustainable economic growth, full andcent work for all
8.2, 8.4, 8.9
romote inclusive and sustainableovation
9.1, 9.4
mong countriesents inclusive, safe, resilient and sustainable 11.5, 11.6, 11.7, 11.a, 11.cn and production patterns 12.2, 12.3, 12.4, 12.5limate change and its impacts 13.1he oceans, seas and marine resources for 14.1, 14.2, 14.3, 14.14,14.5,
14.7stainable use of terrestrial ecosystems,
mbat desertification, and halt and reverse landity loss
15.1, 15.2, 15.3, 15.4, 15.5, 15.8
societies for sustainable development, provideld effective, accountable and inclusive
entation and revitalize the Global Partnership
Table 2The 16 ecosystem services included in the expert survey modified from the original22 TEEB ecosystem services typology.
TEEB EcosystemService Categories
TEEB Typology Survey Typology
Provisioning Food FoodWater WaterRaw Materials Raw MaterialsGenetic Resources Genetic Resources (Includes
Medicinal, Ornamental)Medicinal ResourcesOrnamentalResources
Regulation Air QualityRegulation
Air Quality/Purification
Waste treatment(water purification)
Water Quality/Purification
Moderation ofextreme flows
Water Regulation/FloodControl
Erosion prevention Erosion/SedimentationPrevention
Climate regulation Moderation of ExtremesCarbon Storage &Sequestration
Maintenance of SoilFertility
Nutrient Cycling
Pollination PollinationBiological Control Pest & Disease Control
Supporting Maintenance of LifeCycles
Habitat & BiodiversityMaintenance
Maintenance ofGenetic Diversity
72 S.L.R. Wood et al. / Ecosystem Services 29 (2018) 70–82
to facilitate national and regional decision-making by assessingservice trade-offs and synergies across multiple sectors underdiverse management scenarios (e.g. Guerry et al., 2015; Mulligan,2015; Ruckelshaus et al., 2015; Villa et al., 2014), moving awayfrom single-goal oriented approaches. IPBES has recently ledefforts to review and summarize existing modelling tools to guidetheir use in regional, global and thematic assessments as well asoutlining best-practices for policy-makers in the use of these tools(Ferrier et al., 2016). However, guidance on how and when ecosys-tems and their services can be managed to deliver on specific and/or multiple human development targets remains poorly articulatedand difficult for policy-makers to incorporate into national devel-opment plans.
The goal of this paper is to summarize current understandingson the potential role of ecosystem services to contribute to theSDGs and thereby outline a path forward for their incorporationinto national SDG policy considerations and landscape planning.We consulted ecosystem service and development experts via asurvey on their perceptions of the contribution of 16 individualecosystem services to SDG targets. We use information gatheredthrough this survey and a review of current modelling tools toaddress the following questions: (i) what are expert perceptionsregarding potential of ecosystem services to contribute to attain-ment of the SDGs?; (ii) where are cross-target or cross-goal inter-actions likely to occur based on these perceptions?; and (iii) arecurrent modelling tool capacities adequately aligned to supportlandscape planning around these interactions?
Cultural Spiritual Experience Spiritual, Aesthetic, CulturalAestheticinformationInspiration for art,culture, designRecreation & tourism Recreation & EcotourismInformationCognitiveDevelopment
2. Materials and methods
2.1. ES-SDG linkages
We conducted an anonymous online survey to evaluate link-ages between SDG targets and 16 specific ecosystems servicestaken from the TEEB ecosystem services typology (TEEB 2010,Table 2). The 16 selected ecosystem services include provisioning,regulating, supporting and cultural services. An online survey tool(SurveyMonkey) was used to create the survey and was sent outfrom April 29th to May 30th, 2016 through academic and profes-sional listservs to ecosystem service experts. A second round ofthe survey was conducted from March 15th to March 23rd, 2017with the aim of broadening the profile of respondents to includegreater representation from development and practitioner com-munities. Contacted organizations include the network mailinglists of: Ecosystem Services Partnership (ESP), The Economics ofEcosystems and Biodiversity (TEEB), Intergovernmental Panel onBiodiversity and Ecosystem Services (IPBES), Ecological Society ofAmerica (ECOLOG), CGIAR Water Land Ecosystems and its programpartners, CGIAR Ecosystem Services and Resilience, UN SustainableDevelopment Solutions Network (SDSN), Natural Capital Project,Institute International Sustainable Development, Science for Nat-ure and People Partnership (SNAPP) working group membersinvolved in this study, as well as directed emails to researcherand practitioners in the field (for a full list of contacted organiza-tions see SM2). We used a snowball technique to increase partici-pation, asking respondents to forward the survey to qualifiedcolleagues. This is a non-probability approach, and thus we relyon descriptive rather than statistical analysis of the collected data.
Survey respondents were asked to identify their highest aca-demic qualification, institutional affiliation type, discipline or areaof expertise, landscape of expertise and their number of yearsexperience (<1 year, 1–5 years, 5–10 years, >10 years) working onecosystem services (round 1) or development issues (round 2).Respondents in the second survey round were additionally askedto identify the use of ecosystem service concepts in their work
from ‘Never, Rarely, Occasionally’ to ‘Frequently’. We only considerrespondents with a reported academic degree and/or more thanone year of experience with ecosystem services (round 1) or devel-opment (round 2) to ensure minimum qualifications to be consid-ered an expert. We further exclude respondents in round 2 who‘Never’ or ‘Rarely’ used ecosystem service concepts, as we considerthese respondents less likely to provide informed responses on theroles of ecosystem services in the SDGs. Full copies of the surveytools can be found in the Supplementary Material (SM3).
The survey aimed to gather expert views on, primarily, whethergood management of each of the 16 ecosystem services could con-tribute to specific SDG targets, and, secondarily, how importantthese ecosystem service flows are to achieving the SDG target inquestion (see SM3 for copy of the survey). A wide range of prac-tices can be considered ‘‘good management” (for instance opti-mization for a single service at the expense of others) and thismay vary with socio-ecological context. We intentionally usedthe term ‘‘good management” in the phrasing of the question toallow for individual interpretation by experts. We requested thatrespondents choose up to three ecosystem services in line withtheir expertise and evaluate their potential contribution to targetsunder one to two SDG goals they felt competent to assess. For eachselected ecosystem service-SDG target combination (ES-T), respon-dents were asked i) if they ‘Agreed’, ‘Disagreed’ or ‘Didn’t know’whether good management of the selected ecosystem servicecould directly or indirectly help to attain the stated target; ii) torank the importance of the ecosystem service contribution to tar-get achievement on a four-point scale from ‘Not important’ to‘High’; and iii) to assess confidence in their own evaluation of this
S.L.R. Wood et al. / Ecosystem Services 29 (2018) 70–82 73
ES-T relationship on a five-point scale from ‘Very Low’ to ‘VeryHigh’. Median responses were used in the analysis of these data.
Due to the large number of SDG targets (n = 169), we reducedthe number included in the survey by excluding those targets forwhich there was no clear environmental link (e.g. reducing sub-stance abuse or improving access to reproductive health-care ser-vices) and policy-oriented targets (e.g. new laws or financialmechanisms; see SM1 for list of included and excluded targets).This left 44 targets across 12 SDGs for consideration (Table 1). Link-ages between ecosystem services and the 125 excluded SDG tar-gets may exist but were not evaluated here.
We identify ES-T combinations with perceived support frompooled survey responses (an analysis treating each survey roundindependently is found in SM5). By ‘‘support” we mean that multi-ple experts judged an ecosystem service could positively con-tribute to a target, and that the experts were confident in theirassessments. Our criteria for levels of support were as follows:"strong" expert support was defined as ES-T combinations that: i)were evaluated by more than five respondents, ii) of which morethan 75% agreed that the ecosystem service could contribute pos-itively to the target, and iii) the median ranked confidence in thisassessment was ‘High’ or above. Those ES-T combinations withfewer than five responses or where only 50–75% of expertsresponded that there could be a positive contribution were classi-fied as having insufficient or "weak" expert support and were notconsidered further in our analysis. We also excluded combinationswhere less than 50% of respondents judged good management ofthe ecosystem service to contribute to attainment of the target asthey were considered to have "uncertain" or no support fromexperts.
Of the ES-T combinations classified by the authors as havingstrong expert support, we highlight those combinations wherethe median response to the question on the importance of theecosystem service contribution to target attainment was rankedas ‘High’ as focal points for policy action. We focus on these ‘‘Highimportance”ES-T combinations because decisions affecting suchservices are expected, based on expert response, to have the great-est potential impact on SDG outcomes. Finally, we tabulate the co-occurrence of expert supported ecosystem services contributionsto common targets to detect likely points of cross-service andcross-target interactions, i.e. where potential exists for synergiesand trade-offs. We used the program Gephi v3 0.9.1 (Bastianet al., 2009) to create bipartite network diagrams to visualize theseecosystem service contributions of "High importance" to each ofthe assessed SDG targets.
2.2. Review of modelling tools for evaluating ES-SDG linkages
We reviewed current ecosystem service modelling tools toassess their capacity to inform ecosystem service provision andinteractions important to SDGs identified from the survey results.To identify ecosystem service models commonly in use, wesearched Google Scholar for articles with the following key searchterms, individually or in combination, ⁄ecosystem, ⁄ecosystem ser-vice, ⁄modelling, as well as individual ecosystem service names,coupled with ⁄terrestrial and ⁄urban. We included only articlespublished before April 1st, 2016. We reviewed the cited referencesin these papers for additional modelling tools and followed up withtargeted web searches to identify tool platforms, applications anddocumentation. We searched United States Environmental Protec-
tion Agency’s online EcoService Model Library and GIZ’s ValuES
portal to identify additional modelling tools. To be included inour review, tools needed to: i) address more than a single ecosys-tem service at the landscape-level or larger (so as to be relevant fortrade-off assessments), ii) be a publically accessible ‘off-the-shelf’
tool and not a proprietary product, iii) not be tied to a specific geo-graphic location or landscape (e.g. Vermont forests), and iv) be spa-tially explicit. For models meeting these criteria we reviewed theirstated capacity to evaluate the 16 ecosystem services included inthe expert survey. In addition, tools were classified as ecosystemprocess, ecosystem service, or integrated assessment models. ‘Eco-logical process’ tools are those able to evaluate ecological functionsand drivers that underpin ecosystem service provision (e.g. soilerosion, infiltration, pollination) but require post-processing toevaluate an ecosystem service (i.e. human benefit) (Vigerstol andAukema, 2011); ‘ecosystem service’ tools connect an ecosystemfunction to a real or estimated local population benefit; finally ‘in-tegrated assessment models’ are tools which couple multiple eco-logical, social and/or economic sub-models to predict changes inecosystem function, services and/or economy resulting from policyoutcomes (Jakeman and Letcher, 2003). For each we also recordedtheir method of analysis (i.e. statistical, process-based, Bayesian,optimization), focal biome, ability to estimate service delivery ordemand, economic valuation approach and ease of use. A list ofall models, criteria and references for each model are provided inSupplementary Material (SM4).
3. Results
3.1. Survey results
3.1.1. Summary of survey responsesIn the first survey round, 328 individuals participated, of whom
169 provided opinions on the contribution of at least one ecosys-tem service to one SDG target. In the second survey round, aimedto reach additional experts in development communities, 231 indi-viduals initiated the survey and 123 completed at least one ecosys-tem service – target (ES-T) evaluation. In total, this translated into3281 and 2550 unique ES-T evaluations completed by respondentsin the two surveys rounds.
3.1.2. Profile of survey respondentsBased on descriptive qualities provided by respondents, the two
survey rounds reached a broad array of ecosystem service anddevelopment experts. Respondents spanned the five major conti-nents with 27% of respondents from North America, 22% Europe,17% Asia, and �10% from both Latin America and Africa. Expertsworked in a mix of institutional settings (14% research, 14% gov-ernment, 16% non-government, 10% international organizationsand 8% private), with slightly greater representation from aca-demic institutions (33%). The majority of respondents held a mas-ters or doctoral degree (40% and 47%, respectively) with 5 to 10 ormore years of experience (19% and 43%, respectively). Only 3% ofrespondents indicated no degree and 3.5% had less than one yearof experience or provided no indicated experience and wereexcluded in the analysis. Across the surveys, respondents predom-inantly worked within agriculture, ecology, natural resource man-agement sectors though many also worked in interdisciplinary andsustainability sciences (SM5.1 for detailed respondent group pro-files). The profile of survey respondents who initiated but did notcomplete the surveys had very similar distributions of backgroundand institutional traits as those completing the survey (See SM5.2).Survey data were pooled across the two rounds in subsequentanalyses.
3.1.3. Ecosystem Service-SDG target evaluation rateRespondents’ evaluations were unevenly distributed across SDG
goals and across ecosystem services. While almost all possibleecosystem service-target (ES-T) contributions were evaluated atleast once, the distribution of responses was skewed towards
74 S.L.R. Wood et al. / Ecosystem Services 29 (2018) 70–82
SDG1 No Poverty, SDG2 Zero Hunger, SDG6 Clean Water, andSDG15 Life on Land (SM6.1). The most frequently evaluated ser-vices were provision of food and water, habitat & biodiversitymaintenance, and water quality services. Despite the high numberof respondents pooled across both surveys, several ecosystem ser-vices were only selected for evaluation by a small number ofexperts (n < 30), including air quality, raw materials, geneticresources, pest & disease control, and pollination services, suggest-ing that these services may not have been adequately evaluated toidentify all potential linkages. Because of the low response rate forthese ES-T combinations, many failed to meet our minimumthreshold of five evaluations and were excluded from further eval-uation, potentially under-representing the contribution these ser-vices could make towards the SDGs. Possible explanations forlow response rates for these services include i) low familiarity orfewer people working on the service, ii) low perceived importanceor priority relative to other ecosystem services, or iii) the length ofthe survey and limit of selecting only three services to evaluate.
3.1.4. Expert perceptions of ecosystem service contribution to SDGtargets
From a total of 704 potential ES-T combinations, there wasstrong expert support for 231 unique combinations. The majorityof remaining ES-T combinations evaluated (n = 364) were classifiedas having weak or insufficient support, primarily because they hadless than five evaluations, rather than due to low agreement orconfidence. In these cases, support regarding the existence orimportance of ES-T interactions is considered to be too weak forinclusion in the analysis. Fourteen ES-T interactions received morethan 5 responses but less than 50% agreement that the ecosystemservice in question would contribute to target attainment; thesewere considered to have uncertain support and a further 95 ES-Tinteractions were not assessed.
3.1.5. Perceived importance of ecosystem service – targetcontributions
Although Fig. 1 illustrates areas where experts perceivedecosystem services to make a contribution, respondents did notrate all contributions with equal importance for SDG target attain-ment. Amongst the 231 ES-T combinations with strong expert sup-port, 178 were perceived to have ‘High’ importance for theattainment of the target. For 41 of the 44 assessed SDG targets,at least one ecosystem service was considered to be of ‘High’importance for attainment of the target (Fig. 2). Of the 12 SDGsconsidered in the survey, SDG2 Zero Hunger, SDG14 Life BelowWater and SDG15 Life on Land, had the most number of targetsthought to depend up on ecosystem service contributions. Simi-larly, ecosystem services were judged to make important contribu-tions to 40–50% of targets under SDG6 Clean Water and SDG11Sustainable Cities. In subsequent sections we focus on only theseES-T contributions of ‘High’ perceived importance.
3.1.6. Network analyses of important ecosystem service contributionsto targets
We used a bipartite network analysis to plot the 178 ES-T inter-actions of ‘High’ perceived importance by each SDG target (Fig. 3).In the pooled surveys, provision of food and water and habitat &biodiversity maintenance services were the most frequently evalu-ated and also perceived as contributing to the greatest number ofdistinct targets (21, 21 and 26 targets respectively) followed bycarbon storage & sequestration (14). Water quality, water regula-tion, raw material provisioning and recreation & tourism each con-tributed to 10 or more targets. Goals SDG1 No Poverty, SDG2 ZeroHunger, SDG6 Clean Water and SDG15 Life on Land were thoughtto receive the greatest number of distinct ecosystem services con-
tributions, with 5, 12, 7 and 14 ecosystem services contributing totargets within each SDG respectively (Fig. 3 and Fig. 4).
3.1.7. Poverty-agriculture-water-nature nexus – Opportunities forsynergies?
To draw out potential interactions and opportunities for syn-ergies across perceived ES-T contributions, we plotted the networkdiagram of ecosystem service contributions identified by expertsfor the most highly connected goals: SDG1 No Poverty, SDG2 ZeroHunger, SDG6 Clean Water and SDG15 Life on Land targets (Fig. 4).While many of the services were thought to contribute to at leasttwo goals, food provision, water provision, and habitat & biodiver-sity maintenance were perceived as central to all four goals. Thesethree services represent potentially important interaction spacesfor trade-offs or synergies across services and policy makers mayneed to consider these services in tandem for the attainment ofthese four SDGs in concert.
3.1.8. Anticipated interactions among ecosystem services for the SDGsResults from surveyed experts suggest that at least one ecosys-
tem service was deemed important for the attainment 41 of the 44targets and many targets were thought to receive important con-tributions from two or more services (Fig. 2b). When designinginterventions around targets underpinned by multiple services itwill be critical to assess and predict how landscape decisionschange the provision of each service to identify cost-effective andsynergistic solutions. Interventions designed to address one targetby increasing supply of a single ecosystem service (e.g. tree plant-ing to increase carbon sequestration) may cause an increase in asecond (i.e. synergies, e.g. erosion control) but declines in a third(i.e. trade-offs, e.g. reduced food production). In order to under-stand which combinations of services will most frequently needto be managed in concert when tackling the SDGs we tabulatedthe total number of pair-wise sets of ecosystem services perceivedto contribute to individual targets across all SDG goals (Fig. 5a). Themost common combinations of services involved food and waterprovision and habitat & biodiversity maintenance together and incombination with most regulating ecosystem services except forpest & disease control and air quality which had few co-occurences with other services. Spatial models that estimate bothoverall direction (i.e. increase or decrease) as well as spatial varia-tion in the provision of multiple services can help landscape plan-ners to predict the outcomes of proposed interventions oncommunities across the landscape and reduce potential negativetrade-offs.
3.2. Modelling tool review
3.2.1. Modelling tool capacitiesOur Internet search identified 67 modelling tools addressing
ecosystem processes and services. Of these, 42 were excluded fromour assessment because they were either under proprietary rights,single ecosystems service models, conceptual assessment frame-works, under development, or no longer in use. This left 23 mod-elling tools accessible to policy-makers and potentially capable ofassessing trade-offs in ecosystem functions or services at the land-scape scale or larger (Table 3).
Most of the tools evaluated did not incorporate the capacity todynamically assess synergies or trade-offs between multiple ser-vices, rather users can combine model outputs for a number ofecosystems services post hoc to assess trade-offs. At the time ofreview, the modelling tools examined produce outputs for, onaverage, seven of the 16 ecosystem services considered in ourassessment (Table 3), however some models may have sinceevolved to include more services (e.g. Co$tingNature). Reviewedmodels most commonly provided the option to assess the follow-
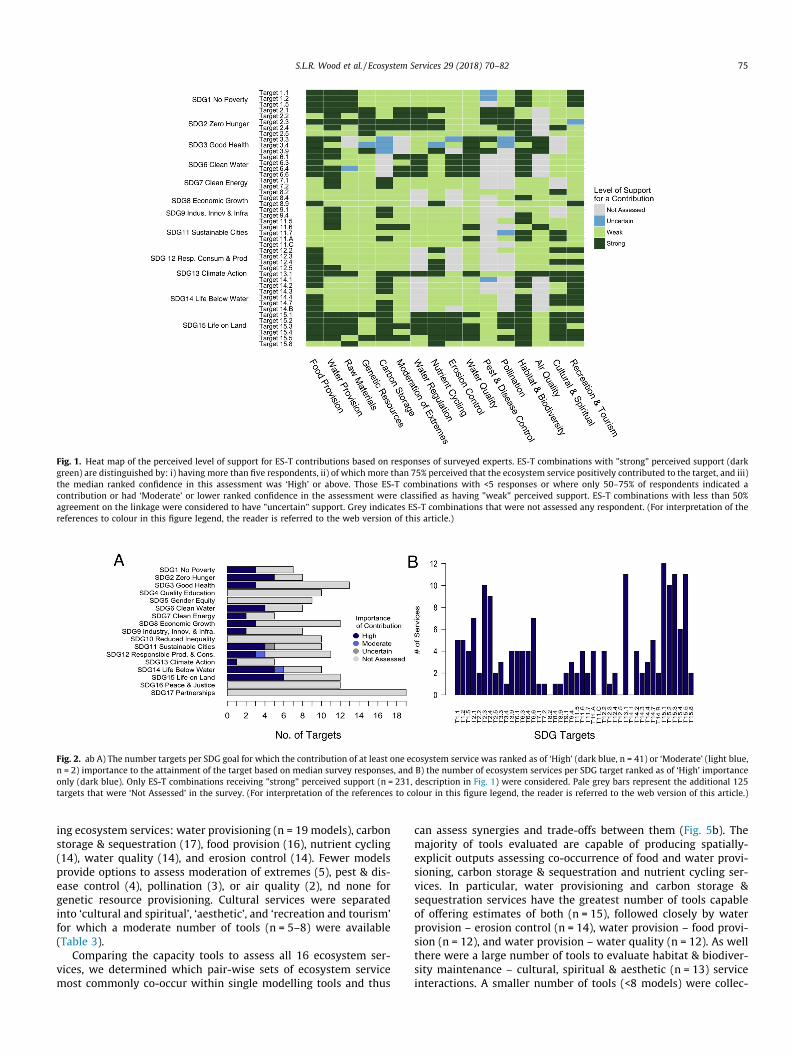
Fig. 1. Heat map of the perceived level of support for ES-T contributions based on responses of surveyed experts. ES-T combinations with "strong" perceived support (darkgreen) are distinguished by: i) having more than five respondents, ii) of which more than 75% perceived that the ecosystem service positively contributed to the target, and iii)the median ranked confidence in this assessment was ‘High’ or above. Those ES-T combinations with <5 responses or where only 50–75% of respondents indicated acontribution or had ‘Moderate’ or lower ranked confidence in the assessment were classified as having "weak" perceived support. ES-T combinations with less than 50%agreement on the linkage were considered to have "uncertain" support. Grey indicates ES-T combinations that were not assessed any respondent. (For interpretation of thereferences to colour in this figure legend, the reader is referred to the web version of this article.)
Fig. 2. ab A) The number targets per SDG goal for which the contribution of at least one ecosystem service was ranked as of ‘High’ (dark blue, n = 41) or ‘Moderate’ (light blue,n = 2) importance to the attainment of the target based on median survey responses, and B) the number of ecosystem services per SDG target ranked as of ‘High’ importanceonly (dark blue). Only ES-T combinations receiving "strong" perceived support (n = 231, description in Fig. 1) were considered. Pale grey bars represent the additional 125targets that were ‘Not Assessed’ in the survey. (For interpretation of the references to colour in this figure legend, the reader is referred to the web version of this article.)
S.L.R. Wood et al. / Ecosystem Services 29 (2018) 70–82 75
ing ecosystem services: water provisioning (n = 19 models), carbonstorage & sequestration (17), food provision (16), nutrient cycling(14), water quality (14), and erosion control (14). Fewer modelsprovide options to assess moderation of extremes (5), pest & dis-ease control (4), pollination (3), or air quality (2), nd none forgenetic resource provisioning. Cultural services were separatedinto ‘cultural and spiritual’, ‘aesthetic’, and ‘recreation and tourism’for which a moderate number of tools (n = 5–8) were available(Table 3).
Comparing the capacity tools to assess all 16 ecosystem ser-vices, we determined which pair-wise sets of ecosystem servicemost commonly co-occur within single modelling tools and thus
can assess synergies and trade-offs between them (Fig. 5b). Themajority of tools evaluated are capable of producing spatially-explicit outputs assessing co-occurrence of food and water provi-sioning, carbon storage & sequestration and nutrient cycling ser-vices. In particular, water provisioning and carbon storage &sequestration services have the greatest number of tools capableof offering estimates of both (n = 15), followed closely by waterprovision – erosion control (n = 14), water provision – food provi-sion (n = 12), and water provision – water quality (n = 12). As wellthere were a large number of tools to evaluate habitat & biodiver-sity maintenance – cultural, spiritual & aesthetic (n = 13) serviceinteractions. A smaller number of tools (<8 models) were collec-
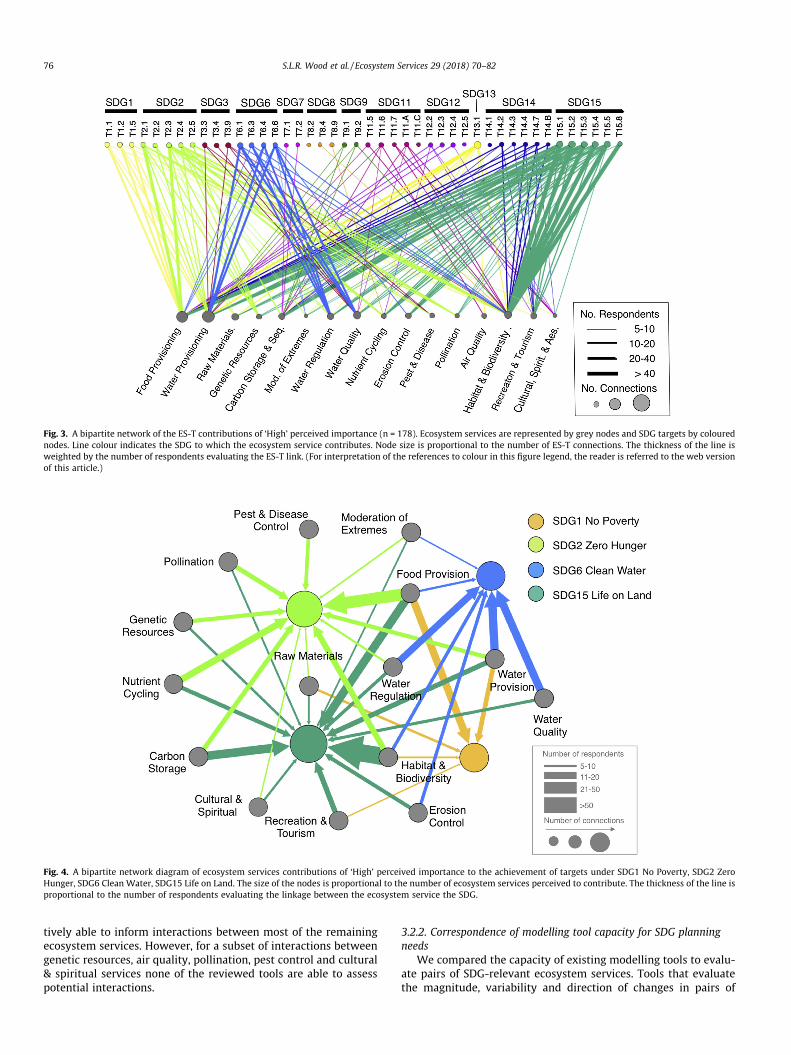
Fig. 3. A bipartite network of the ES-T contributions of ‘High’ perceived importance (n = 178). Ecosystem services are represented by grey nodes and SDG targets by colourednodes. Line colour indicates the SDG to which the ecosystem service contributes. Node size is proportional to the number of ES-T connections. The thickness of the line isweighted by the number of respondents evaluating the ES-T link. (For interpretation of the references to colour in this figure legend, the reader is referred to the web versionof this article.)
Fig. 4. A bipartite network diagram of ecosystem services contributions of ‘High’ perceived importance to the achievement of targets under SDG1 No Poverty, SDG2 ZeroHunger, SDG6 Clean Water, SDG15 Life on Land. The size of the nodes is proportional to the number of ecosystem services perceived to contribute. The thickness of the line isproportional to the number of respondents evaluating the linkage between the ecosystem service the SDG.
76 S.L.R. Wood et al. / Ecosystem Services 29 (2018) 70–82
tively able to inform interactions between most of the remainingecosystem services. However, for a subset of interactions betweengenetic resources, air quality, pollination, pest control and cultural& spiritual services none of the reviewed tools are able to assesspotential interactions.
3.2.2. Correspondence of modelling tool capacity for SDG planningneeds
We compared the capacity of existing modelling tools to evalu-ate pairs of SDG-relevant ecosystem services. Tools that evaluatethe magnitude, variability and direction of changes in pairs of
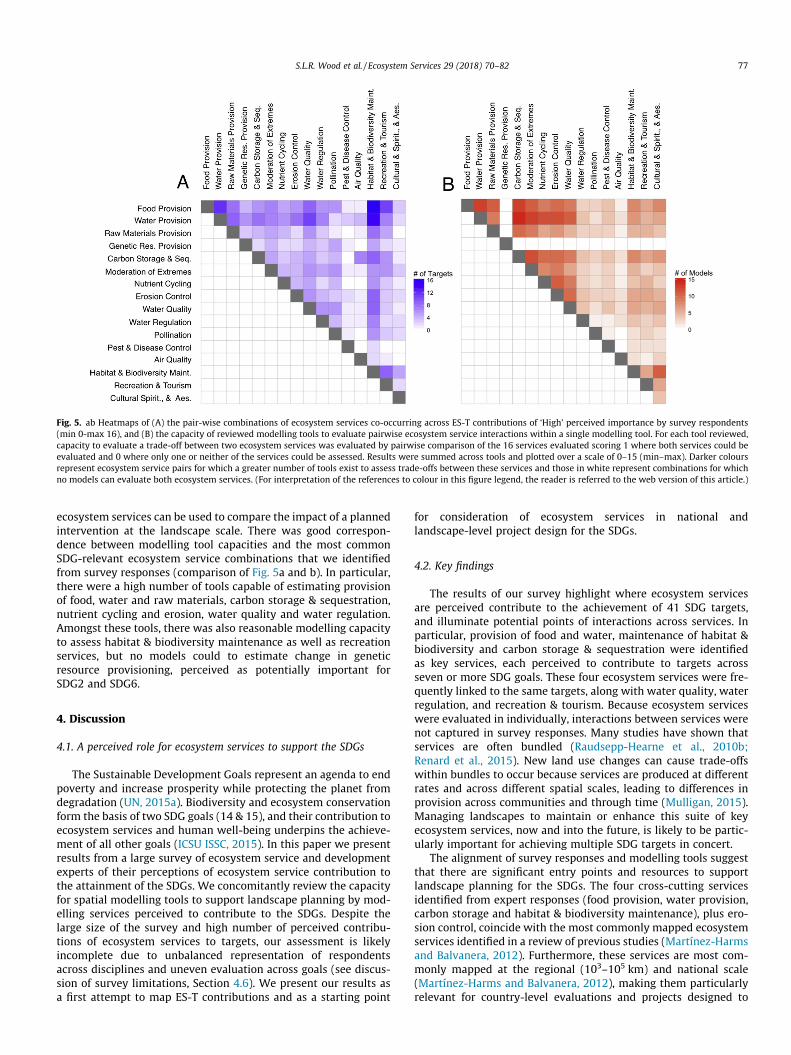
Fig. 5. ab Heatmaps of (A) the pair-wise combinations of ecosystem services co-occurring across ES-T contributions of ‘High’ perceived importance by survey respondents(min 0-max 16), and (B) the capacity of reviewed modelling tools to evaluate pairwise ecosystem service interactions within a single modelling tool. For each tool reviewed,capacity to evaluate a trade-off between two ecosystem services was evaluated by pairwise comparison of the 16 services evaluated scoring 1 where both services could beevaluated and 0 where only one or neither of the services could be assessed. Results were summed across tools and plotted over a scale of 0–15 (min–max). Darker coloursrepresent ecosystem service pairs for which a greater number of tools exist to assess trade-offs between these services and those in white represent combinations for whichno models can evaluate both ecosystem services. (For interpretation of the references to colour in this figure legend, the reader is referred to the web version of this article.)
S.L.R. Wood et al. / Ecosystem Services 29 (2018) 70–82 77
ecosystem services can be used to compare the impact of a plannedintervention at the landscape scale. There was good correspon-dence between modelling tool capacities and the most commonSDG-relevant ecosystem service combinations that we identifiedfrom survey responses (comparison of Fig. 5a and b). In particular,there were a high number of tools capable of estimating provisionof food, water and raw materials, carbon storage & sequestration,nutrient cycling and erosion, water quality and water regulation.Amongst these tools, there was also reasonable modelling capacityto assess habitat & biodiversity maintenance as well as recreationservices, but no models could to estimate change in geneticresource provisioning, perceived as potentially important forSDG2 and SDG6.
4. Discussion
4.1. A perceived role for ecosystem services to support the SDGs
The Sustainable Development Goals represent an agenda to endpoverty and increase prosperity while protecting the planet fromdegradation (UN, 2015a). Biodiversity and ecosystem conservationform the basis of two SDG goals (14 & 15), and their contribution toecosystem services and human well-being underpins the achieve-ment of all other goals (ICSU ISSC, 2015). In this paper we presentresults from a large survey of ecosystem service and developmentexperts of their perceptions of ecosystem service contribution tothe attainment of the SDGs. We concomitantly review the capacityfor spatial modelling tools to support landscape planning by mod-elling services perceived to contribute to the SDGs. Despite thelarge size of the survey and high number of perceived contribu-tions of ecosystem services to targets, our assessment is likelyincomplete due to unbalanced representation of respondentsacross disciplines and uneven evaluation across goals (see discus-sion of survey limitations, Section 4.6). We present our results asa first attempt to map ES-T contributions and as a starting point
for consideration of ecosystem services in national andlandscape-level project design for the SDGs.
4.2. Key findings
The results of our survey highlight where ecosystem servicesare perceived contribute to the achievement of 41 SDG targets,and illuminate potential points of interactions across services. Inparticular, provision of food and water, maintenance of habitat &biodiversity and carbon storage & sequestration were identifiedas key services, each perceived to contribute to targets acrossseven or more SDG goals. These four ecosystem services were fre-quently linked to the same targets, along with water quality, waterregulation, and recreation & tourism. Because ecosystem serviceswere evaluated in individually, interactions between services werenot captured in survey responses. Many studies have shown thatservices are often bundled (Raudsepp-Hearne et al., 2010b;Renard et al., 2015). New land use changes can cause trade-offswithin bundles to occur because services are produced at differentrates and across different spatial scales, leading to differences inprovision across communities and through time (Mulligan, 2015).Managing landscapes to maintain or enhance this suite of keyecosystem services, now and into the future, is likely to be partic-ularly important for achieving multiple SDG targets in concert.
The alignment of survey responses and modelling tools suggestthat there are significant entry points and resources to supportlandscape planning for the SDGs. The four cross-cutting servicesidentified from expert responses (food provision, water provision,carbon storage and habitat & biodiversity maintenance), plus ero-sion control, coincide with the most commonly mapped ecosystemservices identified in a review of previous studies (Martínez-Harmsand Balvanera, 2012). Furthermore, these services are most com-monly mapped at the regional (103–105 km) and national scale(Martínez-Harms and Balvanera, 2012), making them particularlyrelevant for country-level evaluations and projects designed to
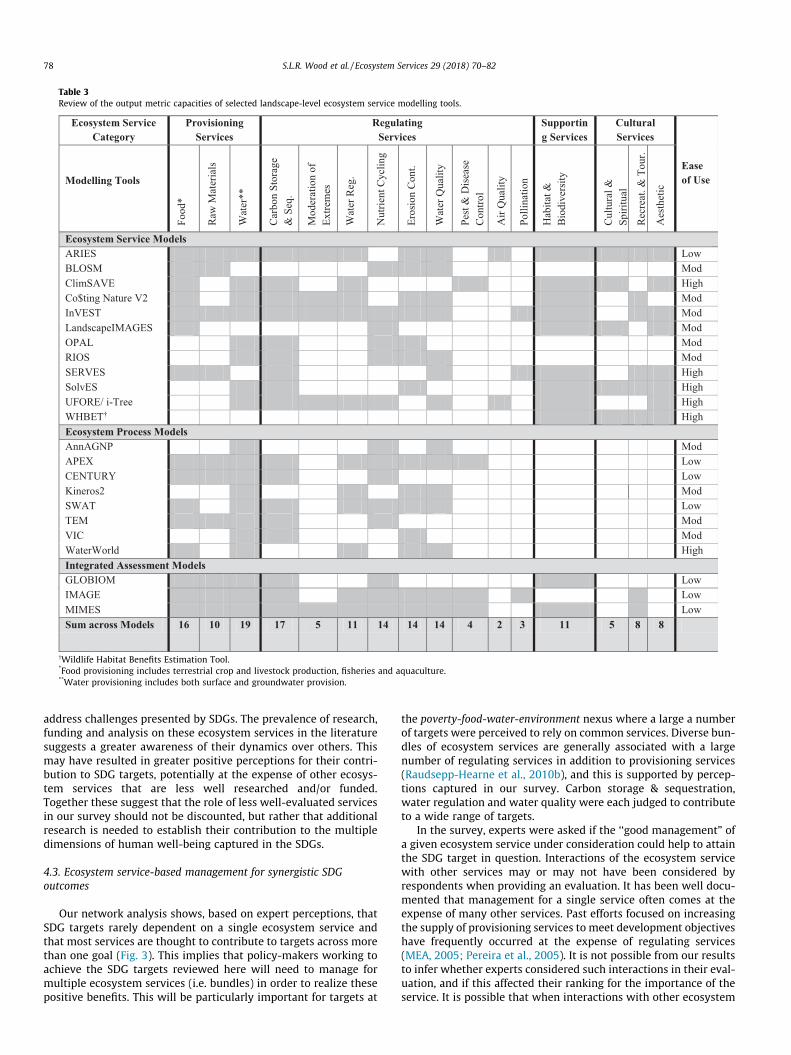
Table 3Review of the output metric capacities of selected landscape-level ecosystem service modelling tools.
yWildlife Habitat Benefits Estimation Tool.*Food provisioning includes terrestrial crop and livestock production, fisheries and aquaculture.**Water provisioning includes both surface and groundwater provision.
78 S.L.R. Wood et al. / Ecosystem Services 29 (2018) 70–82
address challenges presented by SDGs. The prevalence of research,funding and analysis on these ecosystem services in the literaturesuggests a greater awareness of their dynamics over others. Thismay have resulted in greater positive perceptions for their contri-bution to SDG targets, potentially at the expense of other ecosys-tem services that are less well researched and/or funded.Together these suggest that the role of less well-evaluated servicesin our survey should not be discounted, but rather that additionalresearch is needed to establish their contribution to the multipledimensions of human well-being captured in the SDGs.
4.3. Ecosystem service-based management for synergistic SDGoutcomes
Our network analysis shows, based on expert perceptions, thatSDG targets rarely dependent on a single ecosystem service andthat most services are thought to contribute to targets across morethan one goal (Fig. 3). This implies that policy-makers working toachieve the SDG targets reviewed here will need to manage formultiple ecosystem services (i.e. bundles) in order to realize thesepositive benefits. This will be particularly important for targets at
the poverty-food-water-environment nexus where a large a numberof targets were perceived to rely on common services. Diverse bun-dles of ecosystem services are generally associated with a largenumber of regulating services in addition to provisioning services(Raudsepp-Hearne et al., 2010b), and this is supported by percep-tions captured in our survey. Carbon storage & sequestration,water regulation and water quality were each judged to contributeto a wide range of targets.
In the survey, experts were asked if the ‘‘good management” ofa given ecosystem service under consideration could help to attainthe SDG target in question. Interactions of the ecosystem servicewith other services may or may not have been considered byrespondents when providing an evaluation. It has been well docu-mented that management for a single service often comes at theexpense of many other services. Past efforts focused on increasingthe supply of provisioning services to meet development objectiveshave frequently occurred at the expense of regulating services(MEA, 2005; Pereira et al., 2005). It is not possible from our resultsto infer whether experts considered such interactions in their eval-uation, and if this affected their ranking for the importance of theservice. It is possible that when interactions with other ecosystem
S.L.R. Wood et al. / Ecosystem Services 29 (2018) 70–82 79
services in a landscape are considered, that the importance of thecontribution of any one service declines.
The adoption of an ecosystem service-based approach, bypolicy-makers and practitioners, which explicitly considers theinteractions across services and goals, could help to better balanceshort-term efforts to increase provision of food, water and othermaterial resources with the suite of regulating services supportingtheir long-term supply. We note that many technical and policy-oriented SDG targets were not included in our survey and that pol-icy makers will need to take a multi-pronged approach thatincludes legislative, economic and socio-technical initiativesalongside an ecosystem service-based approach to achieve the fullspectrum of development priorities.
4.4. The role of modelling tools to support SDG planning
Making ecosystem services tangible to decision-makers throughbiophysical quantification is a critical step towards their successfulinclusion into policies and planning frameworks (Cowling et al.,2008; Egoh et al., 2011). In their recent review of models and sce-narios, IPBES highlights that models can be an effective means ofarticulating the relationships between nature, people and well-being, and allow the exploration of the projected consequencesof alternative policy scenarios to inform decision-making (IPBES,2016). For instance, while an intervention may increase servicesupply overall (e.g. water provision), it does not necessarily trans-late into improved SDG target attainment if access increases for aprivileged group (e.g. commercial irrigators withdrawing reservoirwater) at the expense of others targeted by the intervention (e.g.smallholder or downstream floodplain farmers). To date, a largenumber of ecosystem service models have been developed andare increasingly being used at local, national, and regional levelsto inform landscape planning, priority setting and evaluation ofinvestment trade-offs (Maes et al., 2012; Mulligan, 2015;Ruckelhaus et al., 2015; Ferrier et al., 2016).
Across the reviewed modelling tools, we found there was a sta-ted capacity to estimate nearly all ecosystem services except forgenetic resource provisioning. At the time of review, most modelsestimated food and water provisioning in combination with anassortment of regulating and cultural services, though none wasable to model them all, however this situation may have changedsince carrying out the study. This suggests that a strong and possi-bly growing modelling capacity exists to support and inform inter-actions around key ecosystem services identified by experts,particularly interactions across SDG 1, 2, 6 and 15. There was, how-ever, generally lower stated capacity to evaluate animal-meditatedservices (pollination, pest & disease control) and urban-related ser-vices (air pollution, moderation of extremes) or their trades-offs.This may be due to the inherent difficulty in predicting animalbehaviours and a greater focus in the ecosystem services commu-nity and survey respondents on rural landscapes (although there isa growing literature on urban ecosystem services, e.g. Baró et al.,2014; Escobedo et al., 2011). These results complement and dee-pen the model review undertaken by IPBES (Ferrier et al., 2016)by looking at the specific ecosystem service interactions whichmodels are capable of assessing and identify additional gaps in cur-rent tools that will need to be addressed in order to capture therange of service interactions expected in the SDGs. It was not, how-ever, within the scope of this paper to assess the efficacy or accu-racy of the tools’ service estimations and additional review isneeded to determine quality of model outputs.
4.5. The perceived importance of habitat & biodiversity maintenance
Of reviewed the ecosystem services, habitat & biodiversitymaintenance was most frequently evaluated and, as a conse-
quence, had the greatest number of perceived contributions toattainment of SDG targets. Many of these perceived contributionswere linked to targets under SDG 14 (Life Below Water) and SDG15 (Life on Land) for the direct protection of species and the envi-ronment. A significant number were also thought to contribute tosix other SDGs ranging from No Poverty (SDG1) to SustainableCities (SDG11). In many ecosystem service frameworks, biodiver-sity is often not considered an service sensu stricto (Naeem et al.,2002), but rather the interactions amongst species and their envi-ronment are the means by which other ecosystem services are pro-duced (Balvanera et al., 2006; Cardinale et al., 2012; Duncan et al.,2015; Ricketts et al., 2016). There is growing evidence that greaterlevels of biodiversity support enhanced and/or more stable provi-sion of other services (e.g. insect diversity – pollination, Garibaldiet al., 2013; crop diversity – yield, Smith et al., 2008; tree diversity– carbon storage, Poorter et al., 2015). Where species conservationwas not the primary objective of the SDG target, we expect thatmany of the contributions from habitat & biodiversity maintenanceidentified by experts were perceived as indirect in nature.
This dual contribution of habitat & biodiversity maintenance tothe SDGs, both direct and indirect, may pose a significant challengefor its accurate consideration in landscape management plans.While many of the reviewed modelling tools had the capacity toevaluate the service, this was achieved primarily by calculatingthe change in area of land cover. None of the models reviewedincluded an explicit modelling of biodiversity as an outcome oflandscape change. Previous reviews of ecosystem service models(Crossman et al., 2013; Martínez-Harms and Balvanera, 2012) havealso found that despite a long disciplinary history of modellinghabitat suitability, population dynamics and biodiversity hotspotsin the ecological and environmental sciences, methods to modelbiodiversity change remain less common in the ecosystem serviceliterature (Crossman et al., 2013). Few, if any models, incorporateboth direct impact of land use changes on biodiversity, and its indi-rect impact on the provision of other services. This is a criticallymissing component in our ability to accurately assess the impactsof landscape change on ecosystem service provision. There is aneed to develop a more mechanistic inclusion of biodiversity’sindirect role in estimating other ecosystem functions and services(e.g. Duncan et al., 2015, Gonzalez et al., 2009) to better appreci-ated its role in achieving the SDGs.
4.6. Survey limitations
Our survey acknowledged a priori a role for ecosystem servicesin achieving the SDGs and sought out expert knowledge to identifywhere management of ecosystem services could most contributeto specific development targets. We observed a broad tendencyfor respondents to agree that ecosystem services could contributeto almost all of the 44 selected targets evaluated. This bias is notunexpected given respondents’ background, self-selection to takethe survey, and the fact that respondents were asked to select theirown areas of expertise. We found that food provisioning and habi-tat & biodiversity maintenance services and SDG 2, 6 and 15 weremost commonly selected to evaluate (SM4a), likely reflecting thelarger number of survey respondents from agriculture, ecology,natural resource management and sustainability sciences (SM5).We used a snowballing technique to access this ‘‘hidden commu-nity” of ecosystem service and development experts (Sudmanand Kalton, 1986), an approach that can also introduce bias intothe sample. In general, individuals receiving the survey are morelikely to forward it on to colleagues within their own social net-work who may share common understandings and perspectives,thus amplifying certain perceptions over others. As a result, thisapproach is effective in identifying where there is strong agree-ment in understanding around particular ecosystem services, but
80 S.L.R. Wood et al. / Ecosystem Services 29 (2018) 70–82
can result in other perspectives or services being underrepresented.
This sampling approach also may explain why certain ES-Tcombinations were evaluated much more frequently than others,resulting in under-evaluation of certain sets of ecosystem servicesor goals. For example, a large body of literature exists on the role ofnutrient cycling and erosion control on downstream coastal waterquality (Barbier, 2012; Carpenter et al., 1998; Vitousek et al., 1997).However, the contribution of these services to SDG14.1 to preventand significantly reduce marine pollution of all kinds, in particularfrom land-based activities, including marine debris and nutrient pollu-tion, were evaluated as having only ‘Weak’ expert support becausethe target was assessed by less than 5 respondents and only 5% ofour respondent pool worked on coastal and marine systems (SM5).Thus, we urge a strong degree of caution before excluding the pos-sibility of ES-T combinations not classified as having ‘Strong’ sup-port, as the sampling design is highly susceptible to under-evaluation. Additional research and review of current literature isneeded on these under-evaluated linkages to broaden and betterevaluate the evidence base for the potential contribution of theseecosystem services to SDG targets.
Finally, since experts were asked to evaluate ecosystem serviceson an individual basis, we cannot predict from experts’ responseshow two or more services contributing to a common target areexpected to interact. Additional surveys and reviews of the litera-ture are needed to estimate if these interactions are likely to bepositive (‘‘indivisible, reinforcing, enabling”), neutral (‘‘consistent”)or negative (‘‘constraining, counteracting or cancelling”) using ascale such as Nilsson et al. (2016).
4.7. Ways forward
We recognize that ecosystem service management alone will beinsufficient to achieve the ambitious SDG agenda. Ecosystem ser-vice management will need to be paired with complementarytechnologies and socio-institutional-based solutions in order toachieve targets over the short SDG timespan (2015–2030). Forexample, achieving clean water targets under SDG6 will require acombination of installing water treatment plants alongside catch-ment land cover and land use management. Similarly, efforts toeradicate malaria and other emerging neotropical diseases (SDG3,target 3.3) will require a suite of tools from land cover and land-use management for pest & disease control, to insecticide-treatedbed nets and national health programs to educate and treataffected communities. In many instances socio-institutional solu-tions may offer cheaper and quicker solutions to pressing chal-lenges, as they require less infrastructure to implement and cantackle some of the root causes of the problem (Cartwright et al.,2013). However, all too often ecosystem services are undervaluedin planning which can lead to ineffective solutions in the long term,e.g. levying of the Mississippi river to prevent flooding has alteredthe hydrology sustaining the surrounding wetlands needed to buf-fer the coastline against storm surges (Day et al., 2007). Both socio-institutional and technology-based solutions should be planned inconcert rather than in competition with ecosystem-basedapproaches at the outset of policy development to identify themost effective and enduring solutions to achieve national develop-ment aims while avoiding unforeseen trade-offs with other goals.
To facilitate uptake of ecosystem service-based approaches forthe SDGs, new output indicators that speak directly to the metricstracked in the SDG framework would also be useful (Ferrier et al.,2016). Indicators which report ecosystem service outcomes interms of land area or number of people affected (as is done inWaterWorld and Co$tingNature), malnutrition rates, and propor-tion of demographic groups with access to specific resources are
likely more intuitive and compelling for decision-makers than tra-ditional biophysical or economic indicators (e.g. tons of carbon, m3
of water, avoided costs). Small changes to current model outputs,for example translating sediment erosion into avoided degradationor crop production into calories and micronutrient availability, arepossible and would provide entry points with policymakers on thevalue of ecosystem service-based approaches. However, includingthese ‘‘human well-being” indicators in model outputs addsanother ‘step’ in the chain of estimation from ecosystem function,service supply, and service use to human well-being, requiringgreater model simplification and potentially increasing uncertaintyand errors.
5. Conclusions
Our survey results reflect broad support from ecosystem serviceand development experts for the role of ecosystem services in sup-porting the SDGs. While we were not able to assess the contribu-tion of all services to all SDG targets evenly, we identify fourecosystem services that are perceived to make important contribu-tions to achieving targets across 12 different goals and identifyadditional services expected to contribute to more select sets oftargets. A large number of modelling tools are already availableto support policy-makers in their efforts to incorporate ecosystemservice approaches, which can increase the chances of achievingthe ambitions set out in the SDGs. By distilling expert perceptionsand identifying tools, we help chart a path forward for the consid-erations of ecosystem service and management into local andnational development policy plans.
Acknowledgements
This research was conducted by the Making Ecosystems Countin the Sustainable Development Goals expert working group sup-ported in part by Science for Nature and People Partnership(SNAPP), a partnership of The Nature Conservancy, the WildlifeConservation Society and the National Center for Ecological Analy-sis and Synthesis (NCEAS) at University of California, Santa Bar-bara, and with funding from the CGIAR programs on Water Land& Ecosystems, and Policy, Institutions & Markets and The Chris-tensen Fund [grant number 2103-6712225, 2013-2016] and TheChristensen Fund [grant number 2013-6712225]. NCEAS, TNC,and the CGIAR sponsored staff salaries and travel of workshop par-ticipants during the duration of the project. We received ethicalapproval for the survey from project partner King’s College London,ethics number MR/15/16-229. We heartily thank all the anony-mous survey respondents, and consultation and workshop partici-pants for their contribution to this project as well as A.G. for hisvery thoughtful and supportive input throughout the process.
Appendix A. Supplementary data
Supplementary data associated with this article can be found, inthe online version, at https://doi.org/10.1016/j.ecoser.2017.10.010.
References
Balvanera, P., Pfisterer, A.B., Buchmann, N., He, J.S., Nakashizuka, T., Raffaelli, D.,Schmid, B., 2006. Quantifying the evidence for biodiversity effects on ecosystemfunctioning and services. Ecol. Lett. 9 (10), 1146–1156.
Barbier, E.B., 2012. Progress and challenges in valuing coastal and marine ecosystemservices. Rev. Environ. Econ. Policy 6 (1), 1–19.
Baró, F., Chaparro, L., Gómez-Baggethun, E., Langemeyer, J., Nowak, D.J., Terradas, J.,2014. Contribution of ecosystem services to air quality and climate changemitigation policies: the case of urban forests in Barcelona, Spain. Ambio 43 (4),466–479.
S.L.R. Wood et al. / Ecosystem Services 29 (2018) 70–82 81
Bastian, M., Heymann, S., Jacomy, M., 2009. Gephi: an open source software forexploring and manipulating networks. In: International AAAI Conference onWeblogs and Social Media.
Cardinale, B.J., Duffy, J.E., Gonzalez, A., Hooper, D.U., Perrings, C., Venail, P., Narwani,A., Mace, G.M., Tilman, D., Wardle, D.A., Kinzig, A.P., 2012. Biodiversity loss andits impact on humanity. Nature 486 (7401), 59–67.
Carpenter, S.R., Caraco, N.F., Correll, D.L., Howarth, R.W., Sharpley, A.N., Smith, V.H.,1998. Nonpoint pollution of surface waters with phosphorus and nitrogen. Ecol.Appl. 8 (3), 559–568.
Cartwright, A., Blignaut, J., De Wit, M., Goldberg, K., Mander, M., O’Donoghue, S.,Roberts, D., 2013. Economics of climate change adaptation at the local scaleunder conditions of uncertainty and resource constraints: the case of Durban,South Africa. Environ. Urban. 25 (1), 139–156.
Cowling, R.M., Egoh, B., Knight, A.T., O’Farrell, P.J., Reyers, B., Rouget, M., Roux, D.J.,Welz, A., Wilhelm-Rechman, A., 2008. An operational model for mainstreamingecosystem services for implementation. Proc. Natl. Acad. Sci. 105 (28),9483–9488.
Crossman, N.D., Burkhard, B., Nedkov, S., Willemen, L., Petz, K., Palomo, I., Drakou, E.G., Martín-Lopez, B., McPhearson, T., Boyanova, K., Alkemade, R., 2013. Ablueprint for mapping and modelling ecosystem services. Ecosyst. Services 4, 4–14.
Day Jr., J.W., Boesch, D.F., Clairain, E.J., Kemp, G.P., Laska, S.B., Mitsch, W.J., Orth, K.,Mashriqui, H., Reed, D.J., Shabman, L., Simenstad, C.A., Streever, B.J., Twilley, R.R., Watson, C.C., Wells, J.T., Whigham, D.F., 2007. Restoration of theMississippi delta: lessons from hurricane Katrina and Rita. Science 315,1679–1684.
DeClerck, F.A., Jones, S., Attwood, S., Bossio, D., Girvetz, E., Chaplin-Kramer, R.,Enfors, E., Fremier, A.K., Gordon, L.J., Kizito, F., Lopez-Noriega, I., Matthews, N.,McCartney, M., Meacham, M., Noble, A., Quintero, M., Remans, R., Soppe, R.,Willemen, L., Wood, S.L.R., Zhang, W., 2016. Agricultural ecosystems and theirservices: the vanguard of sustainability? Curr. Opin. Environm. Sustain. 23, 92–99.
Díaz, S., Demissew, S., Carabias, J., Joly, C., Lonsdale, M., Ash, N., Larigauderie, A.,Adhikari, J.R., Arico, S., Báldi, A., Bartuska, A., 2015. The IPBES conceptualframework—connecting nature and people. Curr. Opin. Environm. Sustain. 14,1–16.
Duncan, C., Thompson, J.R., Pettorelli, N., 2015. The quest for a mechanisticunderstanding of biodiversity–ecosystem services relationships. Proc. R. Soc. B282 (1817), 20151348.
Egoh, B.N., Reyers, B., Rouget, M., Richardson, D.M., 2011. Identifying priority areasfor ecosystem service management in South African grasslands. J. Environ.Manage. 92 (6), 1642–1650.
Escobedo, F.J., Kroeger, T., Wagner, J.E., 2011. Urban forests and pollutionmitigation: analyzing ecosystem services and disservices. Environ. pollut. 159(8), 2078–2087.
Ferrier, S., Ninan, K.N. Leadley, P., Alkemade, R., Acosta, L.A., Akcakaya, H.R. Brotons,L., Cheun, W.W.L., Christensen, V., Harhash, K.A., Kabubo-Mariara J., Lundquist,C., Obersteiner, M., Pereira, H.M. Peterson, G. Pichs-Madruga, R., Ravindranath,N., Rondinini, C., Wintle, B.A., 2016. The methodological assessment report onscenarios and models of biodiversity and ecosystem services. Secretariat of theIntergovernmental Science-Policy Platform on Biodiversity and EcosystemServices, Bonn, Germany, pp. 348.
Food and Agriculture Organization of United Nations (FAO), 2015. The State of FoodInsecurity in the World 2015: Meeting the 2015 international hunger targets:taking stock of uneven progress. Economic and Social Development Departmentof the United Nations Food and Agriculture Organization, Rome, Italy.
Folke, C., Biggs, R., Norström, A., Reyers, B., Rockström, J., 2016. Social-ecologicalresilience and biosphere-based sustainability science. Ecol. Soc. 21 (3). Online.
Garibaldi, L.A., Steffan-Dewenter, I., Winfree, R., Aizen, M.A., Bommarco, R.,Cunningham, S.A., Kremen, C., Carvalheiro, L.G., Harder, L.D., Afik, O.,Bartomeus, I., 2013. Wild pollinators enhance fruit set of crops regardless ofhoney bee abundance. Science 339 (6127), 1608–1611.
Gonzalez, A., Mouquet, N., Loreau, M., 2009. Biodiversity as spatial insurance: theeffects of habitat fragmentation and dispersal on ecosystem functioning. In:Naeem, S., Bunker, D.E., Hector, A., Loreau, M., Perrings, C. (Eds.), Biodiversity,Ecosystem Functioning and Ecosystem Services: An Ecological and EconomicPerspective. Oxford University Press Inc., New York, NY.
Griggs, D., Stafford Smith, M., Rockström, J., Öhman, M.C., Gaffney, O., Glaser, G.,Kanie, N., Noble, I., Steffen, W., Shyamsundar, P., 2014. An integrated frameworkfor sustainable development goals. Ecol. Soc. 19 (4), 49.
Guerry, A.D., Polasky, S., Lubchenco, J., Chaplin-Kramer, R., Daily, G.C., Griffin, R.,Ruckelshaus, M.H., Bateman, I.J., Duraiappah, A., Elmqvist, T., Feldman, M.W.,Folke, C., Hoekstra, J., Kareiva, P., Keeler, B., Li, S., McKenzie, E., Ouyang, Z.,Reyers, B., Ricketts, T., Rockström, J., Tallis, H., Vira, B., 2015. Natural capitalinforming decisions: from promise to practice. Proc. Natl. Acad. Sci. 112, 7348–7355.
ICSU ISSC, 2015. Review of the Sustainable Development Goals: The SciencePerspective. Paris: International Council for Science (ICSU). Accessed March23rd 2016. Available from: http://www.icsu.org/publications/reports-and-reviews/review-of-targets-for-the-sustainable-development-goals-the-science-perspective-2015/SDG-Report.pdf
International Panel on Biodiversity and Ecosystem Services (IPBES), 2016.Decision and scoping report for the IPBES global assessment on biodiversityand ecosystem services. Accessed November 9th 2016. Available from:http://www.ipbes.net/sites/default/files/downloads/pdf/Scoping_Global%20assessment.pdf
Landscapes for People Food and Nature (LPFN), 2015. Achieving the SDGs throughIntegrated Landscape Management. White Paper. Accessed Jan 8th 2016.Available from: http://ecoagriculture.org/wp-content/uploads/2015/12/LPFN_WhitePaper_112415c_lowres.pdf
Maes, J., Paracchini, M.L., Zulian, G., Dunbar, M.B., Alkemade, R., 2012. Synergies andtrade-offs between ecosystem service supply, biodiversity, and habitatconservation status in Europe. Biol. Conserv. 155, 1–12.
Martínez-Harms, M.J., Balvanera, P., 2012. Methods for mapping ecosystem servicesupply: a review. Int. J. Biodivers. Sci. Ecosyst. Services Manage. 8 (1–2), 17–25.
Mbow, C., Van Noordwijk, M., Prabhu, R., Simons, T., 2014. Knowledge gaps andresearch needs concerning agroforestry’s contribution to sustainabledevelopment goals in Africa. Curr. Opin. Environm. Sustain. 6, 162–170.
Millennium Ecosystem Assessment (MEA), 2005. Ecosystems and Human Well-being: Synthesis vol 5 Online: http://www.millenniumassessment.org/documents/document.356.aspx.pdf
Mulligan, M., 2015. Trading off agriculture with nature’s other benefits, spatially. In:Zolin, C.A., Rodrigues, R.deA.R. (Eds.), Impact of Climate Change on WaterResources in Agriculture. CRC Press, Boca Raton, pp. 184–204.
Naeem, S., Loreau, M., Inchausti, P., 2002. Biodiversity and ecosystem functioning:the emergence of a synthetic ecological framework. In: Loreau, M., Naeem, S.,Inchausti, P. (Eds.), Biodiversity and Ecosystem Functioning: Synthesis andperspectives. Oxford University Press, Oxford, p. 294.
Naeem, S., Duffy, J.E., Zavaleta, E., 2012. The functions of biological diversity in anage of extinction. Science 336 (6087), 1401–1406.
Nilsson, M., Griggs, D., Visbeck, M., 2016. Policy: map the interactions betweenSustainable Development Goals. Nature 534, 320–322.
Norström, A., Wetterstrand, H., Schultz, M., Elmqvist, T., Cornell, S., Öhman, M.C.,Daw, T., Moberg, F., Persson, A., Peterson, G. and J. Rockström. 2014. Issue brief:Integrating social-ecological resilience, biodiversity and ecosystem services intothe sustainable development goals. A contribution of Stockholm ResilienceCentre and ICSU (International Council for Science) for the 8th Session of the UNGeneral Assembly Open Working Group on Sustainable Development Goals,New York, pp. 4–8.
Pereira, H.M., Reyers, B., Watanabe, M., Bohensky, E., Foale, S., Palm, C., Espaldon, M.V., Armenteras, D., Tapia, M., Rincon, A., Lee, M.J., Patwardhan, A., Gomes, I.,2005. Condition and trends of ecosystem services and biodiversity. In:Capistrano, D. (Ed.), Millennium Ecosystem Assessment. Island Press,Washington, USA, pp. 171–203.
Poorter, L., Sande, M.T., Thompson, J., Arets, E.J.M.M., Alarcón, A., Álvarez-Sánchez, J.,Ascarrunz, N., Balvanera, P., Barajas-Guzmán, G., Boit, A., Bongers, F., 2015.Diversity enhances carbon storage in tropical forests. Glob. Ecol. Biogeogr. 24(11), 1314–1328.
Raudsepp-Hearne, C., Peterson, G.D., Tengö, M., Bennett, E.M., Holland, T.,Benessaiah, K., MacDonald, G.K., Pfeifer, L., 2010a. Untangling theenvironmentalist’s paradox: why is human well-being increasing asecosystem services degrade? Bioscience 60 (8), 576–589.
Raudsepp-Hearne, C., Peterson, G.D., Bennett, E.M., 2010b. Ecosystem servicebundles for analyzing tradeoffs in diverse landscapes. Proc. Natl. Acad. Sci. 107(11), 5242–5247.
Raworth, K., 2012. A Safe and just space for humanity: Can we live within thedoughnut? Oxfam Discussion Paper. Oxfam GB, Oxford.
Renard, D., Rhemtulla, J.M., Bennett, E.M., 2015. Historical dynamics in ecosystemservice bundles. Proc. Natl. Acad. Sci. 112 (43), 13411–13416.
Ricketts, T.H., Watson, K.B., Koh, I., Ellis, A.M., Nicholson, C.C., Posner, S., Richardson,L.L., Sonter, L.J., 2016. Disaggregating the evidence linking biodiversity andecosystem services. Nat. Commun. 7, 13106.
Rockström, J., Falkenmark, M., 2015. Agriculture: increase water harvesting inAfrica. Nature 519 (7543), 283–285.
Ruckelshaus, M., McKenzie, E., Tallis, H., Guerry, A., Daily, G., Kareiva, P., Polasky, S.,Ricketts, T., Bhagabati, N., Wood, S.A., Bernhardt, J., 2015. Notes from the field:Lessons learned from using ecosystem service approaches to inform real-worlddecisions. Ecol. Econ. 115, 11–21.
Smith, R.G., Gross, K.L., Robertson, G.P., 2008. Effects of crop diversity onagroecosystem function: crop yield response. Ecosystems 11 (3), 355–366.
Stafford-Smith, M., 2014. UN sustainability goals need quantified targets. Nature513 (7518), 281.
Steffen, W., Richardson, K., Rockström, J., Cornell, S.E., Fetzer, I., Bennett, E.M., Biggs,R., Carpenter, S.R., de Vries, W., de Wit, C.A., Folke, C., 2015. Planetaryboundaries: Guiding human development on a changing planet. Science 347(6223), 1259855.
Sudman, S., Kalton, G., 1986. New developments in the sampling of specialpopulations. Ann. Rev. Sociol. 12, 401–429.
The Economics of Ecosystems and Biodiversity (TEEB), 2010. Ecosystem ServicesTypology. The Economics of Ecosystems and Biodiversity: Ecological andEconomic Foundations. In: Pushpam Kumar (ed.), EarthScan, London andWashington. Accessed on October 28th 2016, Available from: http://www.teebweb.org/resources/ecosystem-services/
UN Secretary-General, 2014. The road to dignity by 2030: Ending poverty,transforming all lives and protecting the planet. Synthesis report of theSecretary-General on the Post-2015 Agenda. A/69/700, Accessed January 26th2015, Available from: http://www.un.org/ga/search/view_doc.asp?symbol=A/69/700&Lang=E.
United Nations, 2015a. Millennium Development Goals Report 2015. UnitedNations. Accessed December 3rd 2016, Available from: http://www.un.org/millenniumgoals/2015_MDG_Report/pdf/MDG%202015%20rev%20%28July%201%29.pdf.

82 S.L.R. Wood et al. / Ecosystem Services 29 (2018) 70–82
United Nations, 2015b. Transforming our world: the 2030 Agenda for SustainableDevelopment A/RES/70/1. Accessed January 21st 2016, Available from:https://sustainabledevelopment.un.org/content/documents/21252030%20Agenda%20for%20Sustainable%20Development%20web.pdf
United Nations Development Program (UNDP), 2015. Human Development Report:Work for Human Development. United Nations Development Program.Accessed September 18th 2016, Available from: http://hdr.undp.org/sites/default/files/2015_human_development_report_1.pdf
Villa, F., Bagstad, K.J., Voigt, B., Johnson, G.W., Portela, R., Honzák, M., Batker, D.,2014. Methodology for adaptable and robust ecosystem services assessment.PloS One 9, e91001.
Vitousek, P.M., Aber, J.D., Howarth, R.W., Likens, G.E., Matson, P.A., Schindler, D.W.,Schlesinger, W.H., Tilman, D.G., 1997. Human alteration of the global nitrogencycle: sources and consequences. Ecol. Appl. 7 (3), 737–750.
Wood, S.L.R., DeClerck, F.A., 2015. Ecosystems and human well-being in theSustainable Development Goals. Front. Ecol. Environ. 13 (3), 123.
World Economic Forum (WEF), 2016. Insight Report: The Global Gender Report.World Economic Forum. Accessed June 14th 2016, Available from: https://www.weforum.org/reports/the-global-gender-gap-report-2016.