Embed Size (px)
Citation preview
DISTRIBUTIVE TRADE STATISTICS IN THE PHILIPPINES1 By
Romulo A.Virola & Rhea Ann F. Austria2 INTRODUCTION
In the Philippines, Distributive Trade, consisting of Wholesale Trade and Retail Trade, is the third largest major economic sector after manufacturing and agriculture and fishery. In 2004, it represented about 17 % of Gross Domestic Product (GDP) and 20 % of Total Employment; the shares of manufacturing and agriculture and fishery were 24 % and 30% and 19% and 10%, respectively. In the First Quarter 2005 Report of the Performance of the Economy, trade accounted for about 0.95 percentage point of the 4.6 growth of the GDP. It is further noted that starting 2001, distributive trade has been growing at a substantially faster rate when compared to the GDP. This is mainly attributed to the retail trade which comprises about seventy five percent (75 %) of the total trade sector. In fact, the importance of distributive trade in the Philippine economy has risen gradually from about 13% of GDP in the 1960s to the early 1980s, 15% in the late 1980s, 16% in the late 1990s and 17% at the turn of the century. In terms of employment, its share steadily increased from about 14% in 1987 to its current level of 20% in 2004.
Given the big role of Distributive Trade in the performance of the Philippine
economy, it behooves the Philippine Statistical System (PSS) to produce and disseminate high quality statistics on distributive trade. This paper presents important aspects of distributive trade statistics in the Philippines.
Scope and Classifications
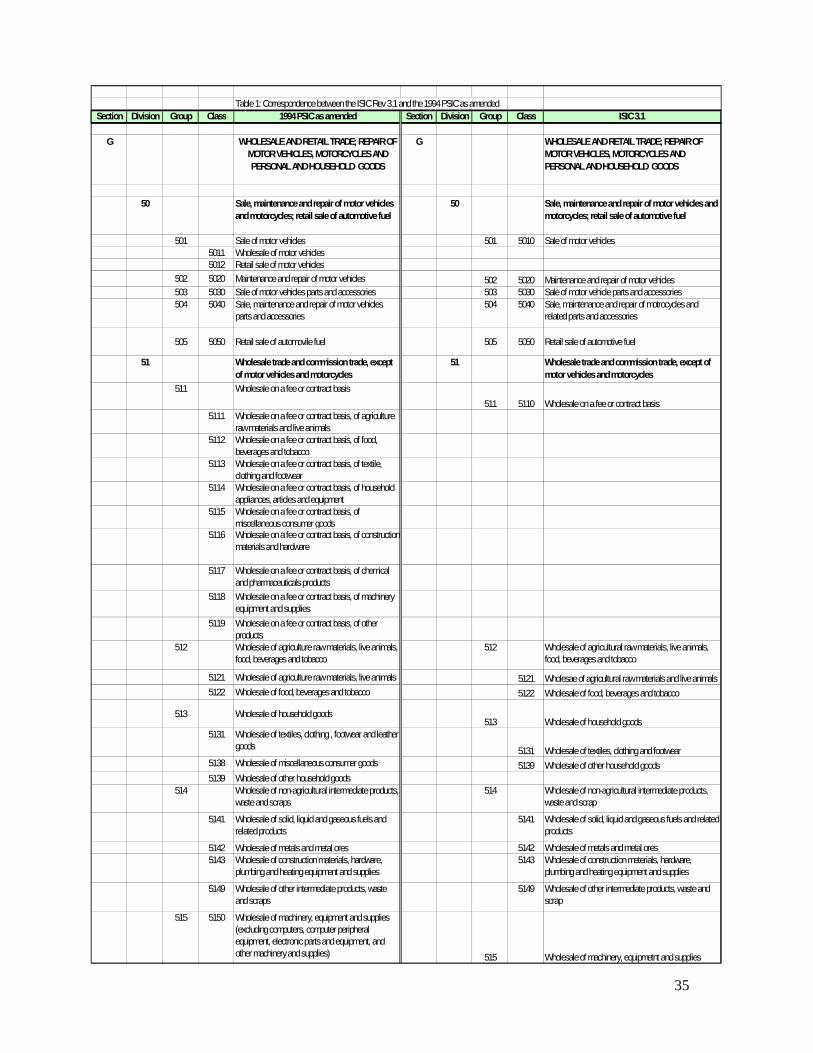
In the collection and dissemination of statistics on distributive trade, for its scope and coverage, the PSS adopts the 1994 Philippine Standard Industry Classification (PSIC) as amended.3 Basically, statistics on distributive trade in the Philippines are in accordance with the International Standard Industrial Classification of All Economic Acitivities (ISIC) Revision 3.1, expanded and elaborated to suit national priorities4.
1 Paper presented during the Meeting of the Expert Group on Distributive Trade Statistics held in New York, 22-25 August 2005 and organized by the United Nations Statistics Division. 2 Secretary General and Statistical Coordination Officer, respectively of the National Statistical Coordination Board of the Philippines. The authors acknowledge the assistance of Vivian R. Ilarina, Noel S. Nepomuceno, Louella R. Ragos, Cynthia S. Regalado and Amando G. Patio Jr. in the preparation of this paper. 3 The 1994 PSIC as amended is patterned after the ISIC Rev. 3.1 up to the 4-digit level but expands it to the 5-digit level to provide for more detailed groupings. It also highlights the emerging importance of the Information and Communications Technology (ICT) in the Philippine economy. For example, Group 515 ( wholesale of machinery, equipment and supplies) with three Classes: 5151 ( wholesale of computers, computer peripheral equipment and software ), 5152 ( wholesale of electronic and telecommunications parts and equipment) and 5159 ( wholesale of other machinery, equipment and supplies) has been collapsed into four Groups, 515, 516, 517 and 518. In addition, due to the expansion of call center activities in the economy, a 5-digit PSIC Code (74996) was created under Other business activities n.e.c. (7499). 4 See Table 1 for the correspondence between ISIC Rev 3.1 and the 1994 PSIC as amended for Section G
2
The 1994 PSIC, as amended, has 17 Major Divisions, just as the ISIC Rev. 3.1
has 17 Sections. Major Division (Section) G covers Wholesale and Retail Trade; Repair of Motor Vehicles, Motorcycles, Personal and Household Goods, and has three Divisions: 50 (Sale, maintenance and repair of motor vehicles and motorcycles; retail sale of automotive fuel); 51 (Wholesale trade and commission trade, except of motor vehicles and motorcycles); and 52 (Retail trade, except of motor vehicles and motorcycles, repair of personal and household goods), exactly the same as ISIC Rev. 3.1. However, as shown in Table 1 some groups have been articulated in greater detail as follows:
a) Group 501 has been divided into two classes: 5011 for Wholesale of motor vehicles
and 5012 for Retail sale of motor vehicles; b) Group 511 has been divided into 9 classes to differentiate the various commodities
being traded wholesale on a fee or contract basis; c) Four-digit levels 5151, 5152 and 5159 of ISIC Rev. 3.1 under Group 515
(Wholesale of machinery, equipment and supplies) have been elevated to the three-digit level 516, 517 and 518 to reflect growing importance of ICT;
d) Classes 5236, 5237 and 5238 have been added under 523 ( Other retail trade of new goods in specialized stores excluding computers, computer peripheral equipment and software); and
e) Groups 527, 528 and 529 have been added.
Consistent with ISIC Rev. 3.1, Wholesale Trade (Division 51) covers units which engage in the resale (sale without transformation) of new and used goods to retailers, to industrial, commercial, institutional or professional users, or to other wholesalers, or acting as agents or brokers in buying merchandise to, such persons or companies. The principal types of businesses included are merchant wholesalers, i.e., wholesalers who take title to the goods they sell, such as wholesale merchants or jobbers, industrial distributors, exporters, importers, terminal elevators, and cooperative buying associations, sales branches and sales offices (but not retail stores) which are maintained by manufacturing or mining units apart from their plants or mines for the purpose of marketing their products and which do not merely take orders to be filled by direct shipments from the plants or mines. Also included are merchandise and commodity brokers, commission merchants and agents and assemblers, buyers and cooperative assemblers, buyers and cooperative associations engaged in the marketing of farm products.
The division of Wholesale Trade excludes the following : Wholesale of motor
vehicles, caravans and motorcycles which is classified in group 501 (Sale of motor vehicles) or 504 (Sale, maintenance and repair of motorcycles and related parts and accessories); Activities of dealers and brokers of commodity futures contracts, and exchanges for trading in such contracts (classified under 681 - Activities auxiliary to financial intermediation, except insurance and pension funding); Renting and leasing of goods ( classified under 71 - Renting of machinery and equipment without operator and of personal and household goods) and Packing of solid goods and bottling of liquid or gaseous goods, including blending and filtering for third parties ( classified under 7495 -Packing activities).
3
Similarly, Retail Trade (Division 52) includes : the re-sale (sale without
transformation) of new and used goods to the general public for personal or household consumption or utilization, by shops, department stores, stalls, mail-order houses, hawkers and peddlers, consumer cooperatives, auction houses, etc. (Most retailers take title to the goods they sell, but some act as agents for a principal and sell either on consignment or on a commission basis); establishments engaged in selling to the general public, from displayed merchandise, products such as typewriters, stationery, paint or lumber, though these sales may not be for personal or household consumption or use only. The goods sold in this group are for obvious reasons limited to so called consumer goods. Accordingly, examples of goods not normally entering retail trade include cereal grains, ores, crude petroleum, industrial chemicals, iron and steel and industrial machinery and equipment. In some instances, some processing of the goods may be involved, but this should be only incidental to selling.
Under Retail Trade, distinction is made between sales by stores, in groups 521-
524, and sales by other methods, in group 525. Division 52 excludes : Sale of farmers' products by farmers (classified in
Divisions 01 to 04 of Major Division A - Agriculture, Hunting and Forestry); Manufacture and sale of goods (e.g., draperies, food) to the general public for personal or household consumption (generally classified as manufacturing, in Divisions15-37, even though such manufacture might be regarded as incidental to sale); Selling motor vehicles or other goods to institutional or industrial users only ( classified either in Division 50 - Sale of motor vehicles, motorcycles and their parts and of automotive fuel or in Division 51 - Wholesale trade and commission trade, except of motor vehicles and motorcycles); Sale of food and drinks for consumption on the premises ( classified in Group 552 - Restaurants, bars, canteens and other eating and drinking places) and Renting of personal and household goods to the general public ( classified in Group 713).
In the classification of the statistical units, the PSS is guided by the work of
the NSCB-created interagency Technical Committee on Statistical Standards and Classifications (TC-SSC)5. The TC-SSC recommends various standards and classification systems, one of which is the Philippine Standard Industrical Classification (PSIC), as well as policies on revisions and amendments of Philippine Standard Classification Systems6. In classifying statistical units therefore, the PSS adopts the rules stipulated in the 1994 PSIC as amended which basically follow the guidelines set forth in the ISIC Rev. 3.1. Thus, in general, the activity classification of a statistical unit is based on its principal activity and secondary activities are not considered. For establishments engaged in multiple activities, the “top down” method is used; statistical
5 The TC-SSC is chaired by the NSCB, vice-chaired by the National Statistics Office (NSO) with members from the Department of Trade and Industry, the Department of Science and Technology, the Department of Agriculture, the Department of Labor and Employment, the Commission on Elections, the Commission on Higher Education, the Tariff Commission, the NSCB and the NSO. 6 Under NSCB Resolution No. 1 Series of 2004 approved on 5 March 2004, revisions and/or amendments to the PSIC should be made within one year after the issuance of the revisions/amendments to international classification systems such as the ISIC.
4
units with a vertically integrated chain of activities are classified in the class indicated by the nature of the final products; units carrying out activities on a fee or contract basis (jobbers) are classified in the same class as units that produce for their own account and risk; units that repair or overhaul capital goods are classified in the same class as the units that produce the goods except for the following: the repair and maintenance of motor vehicles (503) and motorcycles (504), repair of personal and household goods (526), and repair and maintenance of computers and office equipment (726); and units engaged in e-commerce are classified according to their principal activity.
As it is not possible, in general to obtain information on value added for
individual products, the principal activity of a statistical unit is determined as an approximation using other criteria, such as ; (1) the proportion of the gross output of the unit that is attributable to the goods or services associated with these kinds of activity; (2) value of sales of those groups of products; and (3) employment according to the proportion of people engaged in these different kinds of activity. In practice, the criterion used is gross revenue/sales.
In the coding of data, PSIC codes up to the 5-digit level are used, but
published data, particularly for distributive trade, are tabulated only up to the 3-digit level.7 The level of detail generally reflects the importance of the sector and/or the demand of users.
Statistical and Reporting Units
For the surveys, censuses and administrative-based records on distributive trade, the statistical and reporting unit is, generally, the establishment. Consistent with the SNA 1993 definition, an establishment is defined as a recognizable economic unit under a single ownership or control, i.e., under a single legal entity, which engages in one or predominantly one kind of economic activity at a fixed single physical location.
For distributive trade, an establishment is a unit whose major portion of the gross
income or revenue is on trading of goods and products. Pseudo-establishments found in stalls, booths or stands that could easily transfer or disappear are not considered establishments. Also included are sari-sari stores with at least one paid employee.
Data Sources and Data Collection Methods
Distributive Trade statistics come from various censuses, surveys, administrative-based data, financial statements and registration forms of concerned agencies.
7 For coding the quinquennial Census of Philippine Business and Industry, 5-digit codes are used; for the Annual Survey of Philippine Business and Industry, generally, 3-digit codes are used but for some sectors, 4-digit codes are used; for the Quarterly Survey of Philippine Business and Industry, 5-digit codes are used for construction and 2-4 digits are used for the other sectors.
5
The PSS conducts periodic censuses and surveys of establishments8 to collect data on various economic variables. The agency responsible for the main sources of distributive trade data is the National Statistics Office (NSO). The NSO conducts a quinquennial Census of Philippines Business and Industry (CPBI), the Annual Survey of Philippine Business and Industry (ASPBI) and the Quarterly Survey of Philippine Business and Industry (QSPBI) 9.
In addition, the NSO and the Bureau of Agricultural Statistics (BAS)10 conduct
monthly price surveys such as the Survey of Retail Prices of Commodities for the Consumer Price Index (CPI), the Survey of Retail Prices of Commodities for the Retail Price Index (RPI), the Survey of Wholesale Prices of Commodities. The NSO compiles the Wholesale Price Index (WPI), and the RPI11. Price collection is undertaken during the first 22 days of the reference month. For RPI, food prices are collected weekly in 9 markets and for non-food, twice a month in 11 markets in the National Capital Region,
The NSO also compiles data on the flow of goods through airports, seaports and
railway stations in the country. These data on domestic trade are published as coastwise trade statistics, air trade statistics and rail trade statistics.
Other sources of data are financial statements from the Securities and Exchange
Commission (SEC) and the annual financial reports from the Commission on Audit (COA). The Department of Trade and Industry (DTI) also collects prices of commodities.
A. Surveys and Censuses of Establishments
For brevity, only the QSPBI will be described in greater detail.
CPBI, ASPBI and QSPBI
1.Reference Period
For the CPBI and the ASPBI, the reference period is the calendar year. For the QSPBI monthly data are collected for each of the calendar months of a quarter. The latest CPBI had 1999 as reference year while the latest ASPBI had 2003 as the reference year.
8 There have been discussions towards the conduct of enterprise surveys, but none has been conducted by the NSO so far. 9 These used to be the Census of Establishments, the Annual Survey of Establishments and the Quarterly Survey of Establishments. 10 Under the System of Designated Statistics of the NSCB, , the BAS is designated to collect prices for commodities in Agriculture while NSO is designated to collect prices for Non-Agriculture. 11 Separate indices are compiled for general WPI, general RPI and for WPI and RPI for construction materials.
6
2.Data Collection
For the CPBI, the NSO Provincial Office staff members personally deliver the questionnaires to the establishments and are to be collected within 30 days of their receipt of the form. Upon collection of the questionnaires, the NSO field staff manually edits the questionnaire for completeness, consistency and reasonableness of entries. At the central office further verification and coding of the questionnaires as well as imputation procedures are done. The verified forms are then batched into folios for data encoding.
For the ASPBI, personal delivery and collection of questionnaires is likewise
used. The delivery of the questionnaire to the respondent by the NSO provincial staff is at the rate of 3-5 establishments per day in rural areas and 6-8 establishments per day in urban areas and collected at the rate of 2 establishments per day. Each respondent establishment is given 30 days upon receipt to complete the questionnaire. In some cases, the respondent is interviewed or assisted by the field personnel in filling up the questionnaire and so the form is immediately collected. Callbacks are being done when establishments fail to submit on time or when further verification is needed.
Similar data collection procedures are followed for the QSPBI.
3.Sampling Design Features
The CPBI
The 2000 CPBI used a two-phase sampling design. The first large sample is for generating estimates at the provincial level, while the subsample is for estimating detailed statistics for the various industry sectors at the regional level. Two forms are used - one for the large sample and a more detailed one for the subsample.
The first phase sample is selected using a stratified systematic sampling procedure, with provinces and highly urbanized cities as the domains. The 5–digit PSIC and employment size (ATECODE) define the strata. For example, establishments in a province with employment size of 1 - 4 and classified under a five-digit PSIC form a stratum.
The second phase sample is drawn from the first phase samples of establishments with employment size of at least 20 workers, likewise using stratified systematic sampling procedure. This time, the domains will be the regions while ATECODE classification covers only three based on employment sizes of 20-49, 50-99 and 100 or greater.
Thus, a stratum in a region is defined by the PSIC code and the Group as defined above.
The 2000 CPBI covered 68,568 establishments for the large sample 15, 323 of
which are for trade .
7
The ASPBI
The design for the ASPBI is a one-stage stratified random sampling with employment size (ATE) as the stratification variable. Geographic domains for those establishments with ATE of 20 or more are the 17 administrative regions (including CALABARZON and MIMIROPA) while 148 industry sub-sectors or group of industry sub-sectors are the industry domains. For ATE of less than 20, the level of estimates are at the national level by 124 industry sub-sectors or groups of sub-sectors.
The sampled units include establishments which are either single
establishments, branch only or establishment and main office corresponding to Economic Organization ( EO ) 1, 2 and 3, respectively. Excluded are main offices and ancillary units other than main office ( EO = 4 or 5).
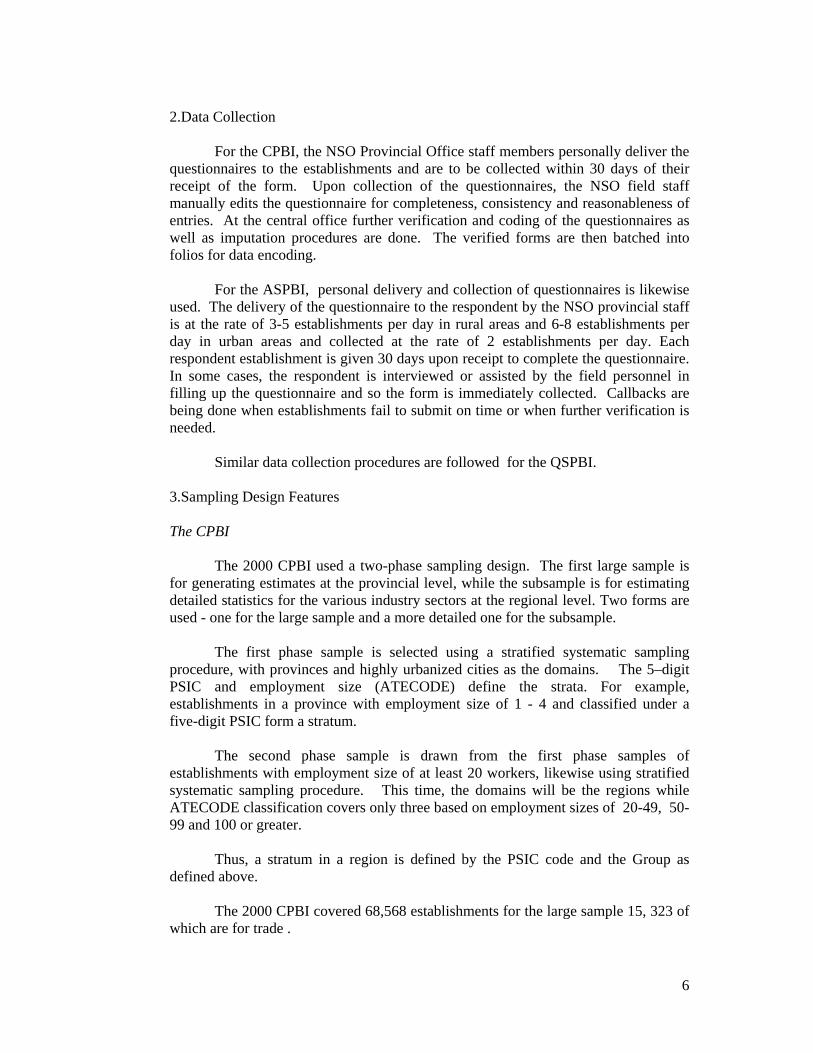
The ASPBI sample selection plan calls for the stratification of sampling units
by ATE, with the region and 3-digit or 4-digit PSIC as domains. For each stratum, establishments are selected using stratified simple random sampling ratios as specified below:
ATE Sampling Fraction (in %)
Wholesale Trade 1-9 1.00 10-19 5.00 20-49 10.00 50-99 25.00 100-199 100.00 200 and over 100.00
Retail Trade 1-9 2.00 10-19 5.00 20-49 10.00 50-99 25.00 100-199 100.00 200 and over 100.00
The total sample size for the 2003 ASPBI was 19,056 establishments, 4,434 of which are for trade.
The QSPBI
The 2004 QSPBI is a nationwide survey covering all establishments having an average total employment (ATE) of 20 or more, except those in the agriculture, hunting and forestry and fishing sectors.
8
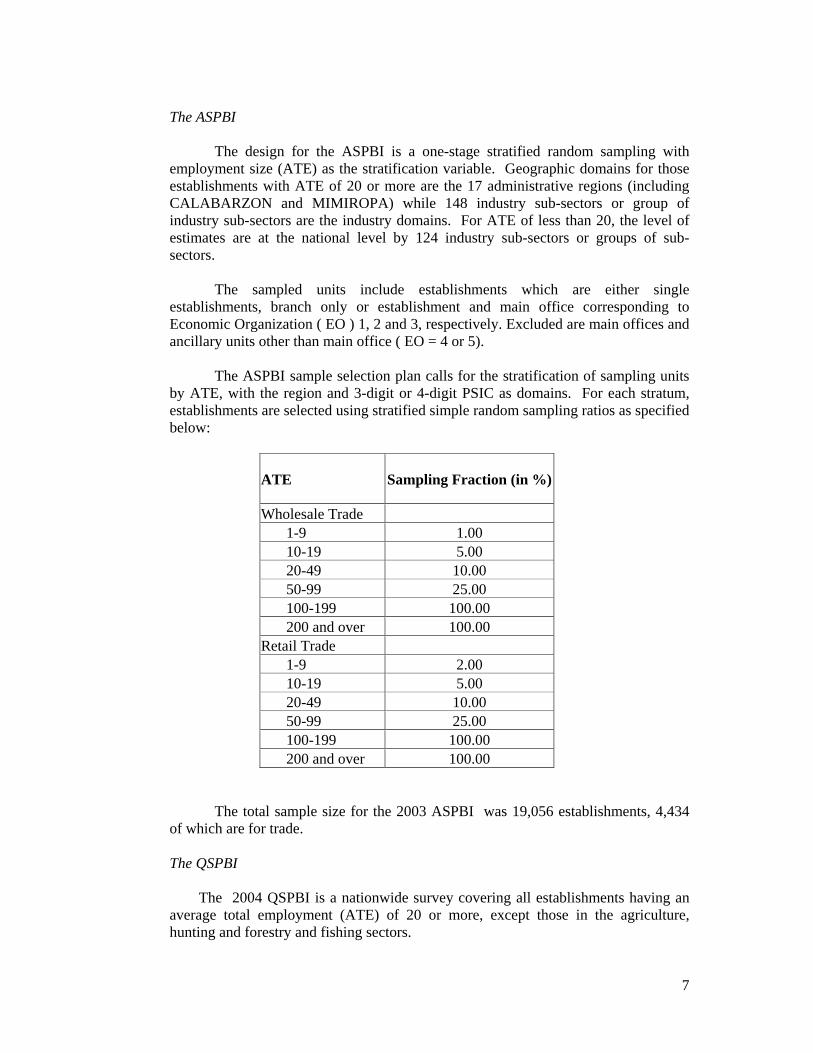
Specifically, the sectors covered are the following:
1994 PSIC
Description
C Mining and Quarrying D Manufacturing E Electricity, Gas and Water F Construction G Wholesale and Retail Trade; Repair of Motor Vehicles,
Motorcycles, Personal and Household Goods H Hotels and Restaurants I Transportation, Communications and Storage J Financial Intermediation K Real Estate, Renting and Business Services M Education N Health and Social Works O Other Community, Social and Personal Service
Activities
The survey does not cover the following:
a. Individual transportation units (i.e. launches, boats and bancas) operated by transport establishments
b. Tricycle, jeepney, calesa and pedicab operators c. Government postal and telegraph offices; d. Booking offices of foreign airlines e. Establishments engaged in letting and operating real estate such as
residential and non – residential buildings including rentals of land. f. All public schools g. All establishments engaged in public medical, dental and other health
services h. International organizations and other extraterritorial bodies like WHO,
UNDP, FAO, embassies and consulates and establishments within the compounds or areas considered part of these bodies
i. Business, professionals and labor organizations, homeowners associations and civic and religious organizations.
For some sectors such as construction; transport, communications and
storage; insurance and pre-need plan activities; real estate buying, developing, subdividing and selling; and investigation and security activities, the establishment is defined in operational terms as "the unit that is engaged in the production of the most homogeneous group of goods and services, usually at one location, but sometimes over a wider area, for which separate records are available that can provide data concerning the production of these goods and services and the materials, labor and physical resources used in this production."
9
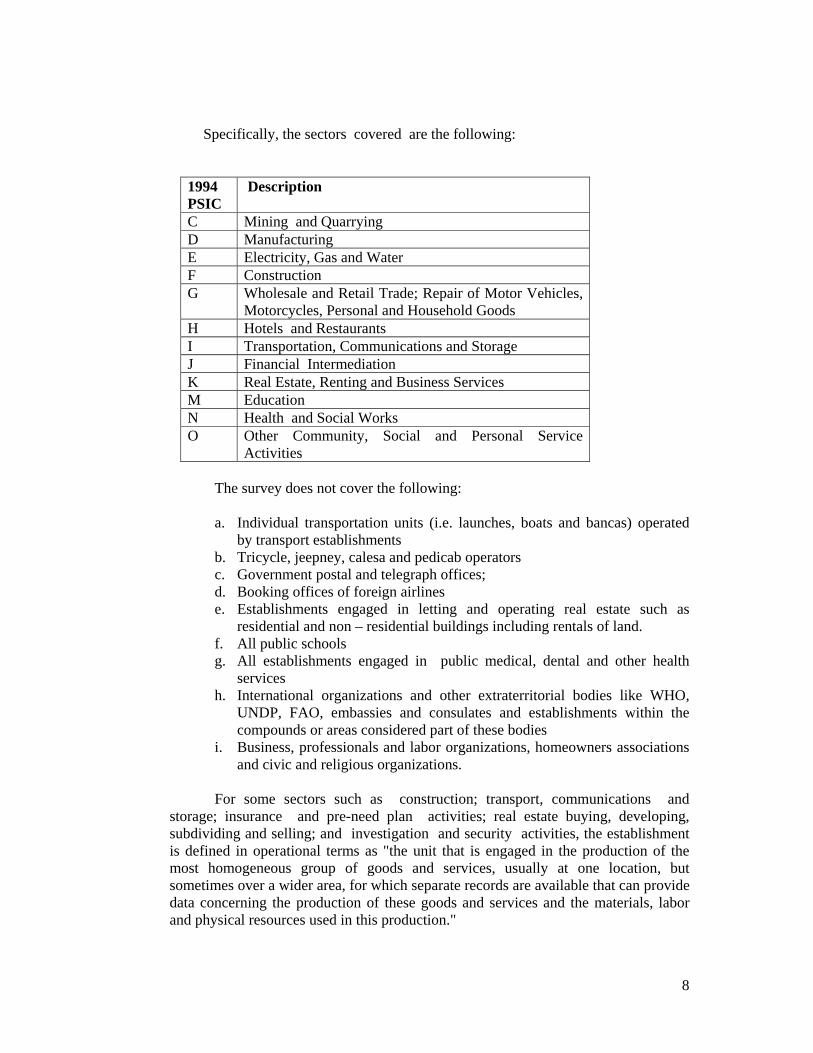
Size of Establishment
The size of an establishment is determined by its average total
employment (ATE). Listed below is the size classification used in the survey.
ATE Code Actual Employment
3 20 - 49 4 50 - 99 5 100 - 199 6 200 - 499 7 500 - 999 8 1,000 - 1,999 9 2,000 and over
Survey Frame The initial frame for the 2004 QSPBI was defined to be all
establishments with ATE 20 or more included in the final tabulation of the 1998 ASE for the 12 sectors covered by the QSPBI and adopted since the 2003 QSPBI. This is complemented with updates from other sources for the 2003 List of Establishments (LE).
The LE contains the following information about the establishments: • Name and address of establishment ( Business name ,TIN,
registered name, etc) • Description of main economic activity • Industry ( 1994 PSIC) code of main economic activity • Average total employment (ATE) • ATE size code • Number of paid employees • Economic organization (EO) • Legal organization • Name and address of main office ( for branch or ancillary unit) • Year started operation • LE indicator • Location of establishment • Location code • Update code However, only the following identification and classification items (
among the characteristics enumerated above) are used in the design of the QSPBI:
10
1. Name and address (business name) 2. Industry code (1994 PSIC) of main activity 3. ATE size code 4. Economic Organization (EO) 5. Legal Organization For all the sectors except construction and transportation,
communication and storage, and some subsectors of PSIC Code E, F and K, the establishments with the following economic organizations are included:
Single establishment (EO = 1) Branch only (EO = 2) Establishment and main office (EO = 3)
For the exceptions cited above, only the establishments with EO = 1, 3
and 4 are included: The 2004 QSPBI uses purposive sampling .
Geographic Domains The 17 administrative regions as approved under Executive Order no.
36 dated September 2001 (Providing for the Reorganization of the Administrative regions in Mindanao…) and Executive Order No. 103, dated 17 May 2002 (Dividing Region IV into Region IV-A and Region IV-B, transferring the province of Aurora to region III.) serve as the geographic domains for establishments with ATE of 20 and over. The geographic codes used are in accordance with NSCB Resolution No. 3, series of 2003, approving the Philippine Standard Geographic Code containing the latest updates on the official number of regions, provinces, cities and municipalities in the country.
Industry Strata
The industry strata used in the 2004 QSPBI followed that of the 1998
ASE. Grouping of sectors (3-digit PSIC) and subsectors (4 or 5 digit PSIC) was done to arrive at the industry strata for the different sectors.
Criteria for Selection of Key Industries In the Region
The industry sectors for the 2004 QSPBI are basically the same
industry strata determined for the 2003 QSPBI round. The selection of key industries was done separately for each of the 17 regions of the country
Initially, the key industries (sectors/sub-sectors, referred to as the
industry strata) in each of the regions was determined based on the industry’s importance measured in terms of the Value Added contribution to the sector’s total value added in the region. The sector/sub-sector in the
11
1998 ASE were ranked in descending order of the Value Added concentration ratio.
1. All industries with concentration ratio of 10 percent and above are included (certainty strata) if their cumulative total accounts for at least 80 percent of total value added of the region.
2. If cumulative total of the industries’ concentration is less than 80 percent, all industries with less than 10 percent concentration ratio are included until cumulative total is at least 80 percent.
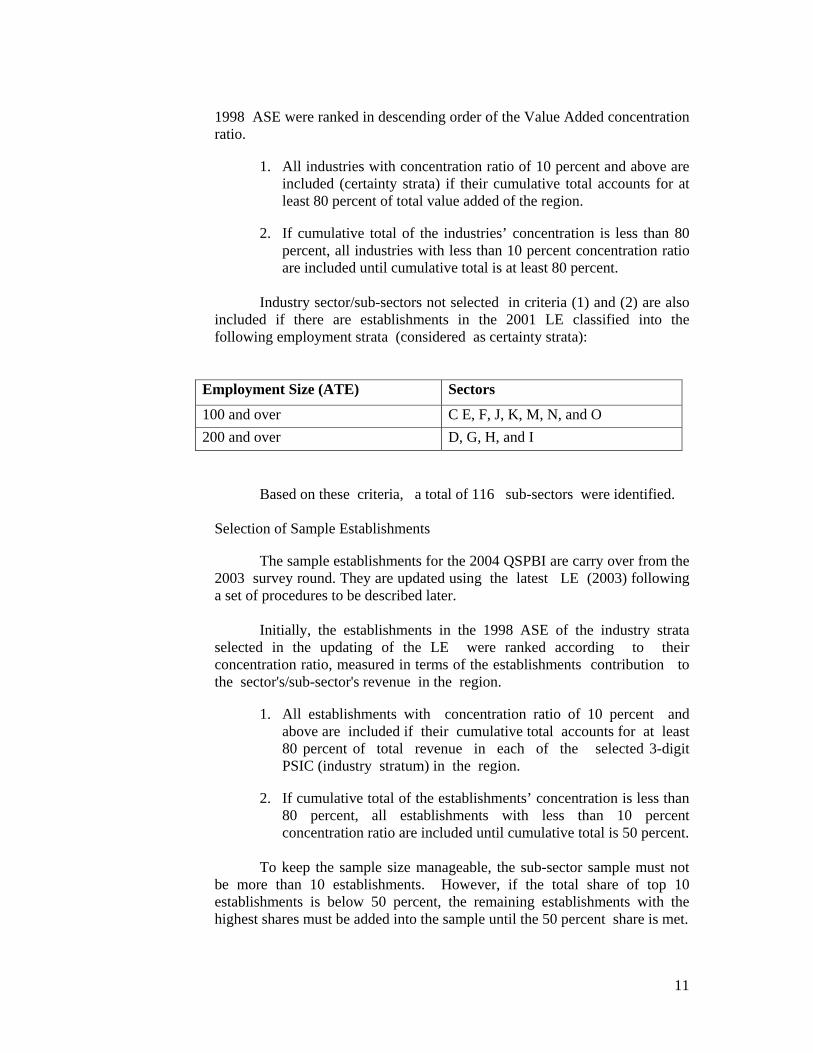
Industry sector/sub-sectors not selected in criteria (1) and (2) are also
included if there are establishments in the 2001 LE classified into the following employment strata (considered as certainty strata):
Employment Size (ATE) Sectors
100 and over C E, F, J, K, M, N, and O 200 and over D, G, H, and I
Based on these criteria, a total of 116 sub-sectors were identified.
Selection of Sample Establishments
The sample establishments for the 2004 QSPBI are carry over from the 2003 survey round. They are updated using the latest LE (2003) following a set of procedures to be described later.
Initially, the establishments in the 1998 ASE of the industry strata
selected in the updating of the LE were ranked according to their concentration ratio, measured in terms of the establishments contribution to the sector's/sub-sector's revenue in the region.
1. All establishments with concentration ratio of 10 percent and above are included if their cumulative total accounts for at least 80 percent of total revenue in each of the selected 3-digit PSIC (industry stratum) in the region.
2. If cumulative total of the establishments’ concentration is less than 80 percent, all establishments with less than 10 percent concentration ratio are included until cumulative total is 50 percent.
To keep the sample size manageable, the sub-sector sample must not
be more than 10 establishments. However, if the total share of top 10 establishments is below 50 percent, the remaining establishments with the highest shares must be added into the sample until the 50 percent share is met.
12
Establishments classified in the certainty strata for the industries are also included.
Based on the criteria described above and following the updating
procedures presented later, the 2004 QSPBI had a total of 4,129 sample establishments. For 2005, the QSPBI had a total of 4499 sample establishments, 619 of which are for trade; 322 establishments are for retail, 281 for wholesale and 16 for repair of motor vehicles and motorcycles.
Imputation Procedures
Reports of establishments undergo an evaluation procedure for acceptability. This is done by comparing the current quarter report with the previous quarter report. Reports are considered unacceptable if the increases in one variable say; employment does not correspond to the increase in other variables say, compensation and revenue. That is, the ratio of these reports for the employment, compensation and revenue variables should be within the range of 0.70 to 1.80 for non-industrial sectors (Sectors G, H, I, J, K, M, N, O); while 0.75 to 1.50 for industrial sectors (Sectors C, D, E and F). These are based on the evaluation of historical QSPBI reports from 2nd Quarter 2000 to 2nd Quarter 2003. Reports that deviate from these ranges are considered unacceptable, hence, validated with the establishment for correction or explanation.
Treatment of Non-Response
Not all sample establishments of course, respond to the survey. The non-responding samples (non-priority) do not undergo imputation. Reminder letters are sent to field offices to exert efforts in collecting the accomplished questionnaires of the non-responding samples.
Reports of establishments received after the 90-day deadline, however, are still reflected in the QSPBI database. These are excluded in the posting sheets submitted to NSCB for the current quarter, but considered in the reports for the succeeding quarters.
Imputation for Non-Responding Priority Samples
When a priority sample establishment fails to submit its report within 75 days after the reference quarter and the corresponding response rate for the sector is below 85 percent, imputation procedure is resorted to. The imputation procedure12 currently adopted is the unweighted historical imputation procedure where the previous quarter’s actual report is used as the imputed value. However, if an establishment failed to respond for consecutive quarters during the year, the following cases are considered:
12 The NSO is going to study how the current imputation method can be improved.
13
1. The establishment stopped its operation with no intention of reopening The establishment will still be retained as a sample, but no imputation will be done. This means that the values for the variables where index will be computed are equal to zero starting on the quarter where that establishment stopped its operation.
2. The establishment did not respond but still existing
Aside from sending reminder letters to field offices to exert efforts in collecting the accomplished questionnaires of the non-responding samples, personal follow-up (in case the sample establishment is located in NCR) is being done.
In cases where after all efforts have been exerted and still no response is received, the average of the responding establishments in the sector/sub-sector is used as the imputed value.
Updating of the List of Establishments (LE) of the Sample Establishments
In principle, the updating of the LE should be a regular process but this
has not been followed religiously because of resource constraints. Mostly, births are covered but deaths have not been monitored closely. Nonetheless, the NSO has come up with improvement plans for the updating of the LE. The most recent LE was conducted in September 2004 in preparation for the next CPBI. Processing of the LE results is ongoing.
The updating of sample establishments, both regular and priority, is
done annually before the start of the year’s survey round . Establishments that closed operations, cannot be located, and became out-of-scope for the survey are replaced. The replacement establishments for these samples are taken taken from the latest LE. They should belong to the stratum (region, industry sector/sub-sector and employment size) of the establishment which they will replace.
B. Administrative-Based Records on Establishments
Pursuant to the Corporation Code of the Philippines and the Revised Securities Act corporations are required to submit audited financial statements to the SEC. The SEC publishes statistics from the financial statements thru its annual publication of the Philippines Top 5000 Corporations, where the ranking is based on total revenue/sales.13
In addition to the SEC publication, the Commission on Audit (COA) publishes
annual reports coming from the Annual Financial Reports of the Government Owned 13 The Philippine Business Profiles and Perspectives, Inc. also published the Top 7000 Corporations, Business Profiles 1999-2000 with information similar to the SEC publication.
14
and Controlled Corporations (GOCCs). Two GOCCs that engage in trading are the National Food Authority and the Livelihood Corporation .
C. Price Surveys / Indices14
As cited previously, price data for Distributive Trade are collected by the NSO and the BAS. Wholesale and retail prices are gathered and used to compile the WPI and the RPI.
Wholesale price is the price of a commodity transacted in bulk for further
resale or processing. It is the actual spot transaction price usually by the wholesalers, distributors or marketing agents for large lots but net discounts, allowances and rebates. Retail price is the price at which a commodity is sold for spot in small quantities transaction. It covers transactions on cash basis in the open market. Excluded are black market prices of commodities which are considered “on sale”.
The 1998-based WPI covers only the National Capital Region (NCR), Cebu
City and Davao City. The market basket for the WPI consists of 397 items for NCR, 299 items for Cebu and 354 items for Davao. The weights were extracted from the 1994 Input-Output table. The 1978-based General RPI consists of 479 commodities while the RPI of Selected Construction Materials has 177 commodities. Both cover only the NCR. The commodities in the market baskets of these price indices are classified using the PSCC. For the WPI, the BAS collects the price data for agricultural commodities and prices of the other items are collected by the NSO. Price collection is during the first 22 days of the reference month. Three or more price quotations are collected depending on the variation of prices among commodities. For RPI, prices for food are collected weekly in 9 markets while for non-food items it is done twice a month with 11 markets surveyed; 7 markets for tobacco and 3 outlets for school supplies.
In addition to the price data being collected by the NSO and the BAS for price
indices, the DTI also collects price statistics thru its Price Watch/Bantay Presyo program. The DTI regional and provincial offices regularly monitor the prices of basic and prime commodities. Price Bulletins on the following goods are available: coffee, iodized salt, canned fish, detergent bar, laundry soap, construction material, processed milk and flour. The price bulletins for these commodities are disseminated weekly with a one-week time lag and with regional disaggregation on the DTI website at www.dti.gov.ph or www.business.gov.ph . The Bantay Presyo statistics are published weekly in a local newspaper, also with a time lag of one week.
Data Items and Definition
The CPBI, the ASPBI and the QSPBI of the NSO capture establishment-level data on 16, 15 and 7 major data items, respectively as shown in Table 2 . A more
14 See Virola, et. al., “Understanding and Improving the System of Price Statistics in the Philippines”.
15
complete list of the details of these data items including those that are not processed is shown in Annex A and the definitions are provided in Annex B.
For the data coming from the financial statements submitted to the SEC, the
list is given in Annex C. The financial statements typically include the following:
1. Balance Sheet which contains assets, liabilities and equity; 2. Income Statement which includes revenue, cost of goods sold, cost of sales, gross
profit, operating expenses, finance costs among others; 3. Statement of Cash Flows which includes cash flows from operating, investing and
financing activities; and 4. Statement of Changes in Equity.
The SEC publication on the top 5000 corporations includes firm level data on
sales, profits, assets, liabilities and equity in amount and annual growth rates. In addition, it groups the establishments by industry group at the Division level (2-digit PSICcode) and presents firm level data on sales, profits and share of profits as percentage of sales, assets and equity.
The COA data also come from financial statements and are therefore similar
to the SEC data. Indices and Performance Indicators
In addition to the retail and wholesale price indices being generated by the NSO, the NSCB publishes the Quarterly Economic Indices (QEI) of the Philippines15 to provide measures of growth in production, gross revenue, employment, and compensation in the various sectors of the economy. Specifically, these indicators were developed to guide users for more meaningful analysis and monitoring of the performance of the economy. The indices on compensation per employee for instance, are used as deflator in the PSNA, as bases for wage rate determination and for forecasting purposes. The quarterly indices for gross revenue, employment, compensation, and compensation per employee are estimated for the aggregate wholesale and retail trade.
The initial benchmark annual estimates for the aggregate sectoral gross
revenue, compensation and employment were computed for the year 1978, using the 1978 Census of Establishments (CE) as major data source. These were supplemented by available data from the National Accounts for sectoral gross value added as well as data from the 1978 Input-Output Industry Tables, which provided the 1978 structure by sector.
15 Discussions have been made between the NSCB and the NSO for the possible transfer of responsibility on the QEI from the NSCB to the NSO. Some changes on the QEI including the updating of the base year and procedures for the computation of the indices including the choice of the industries and the establishments to be considered have been proposed by the NSO.
16
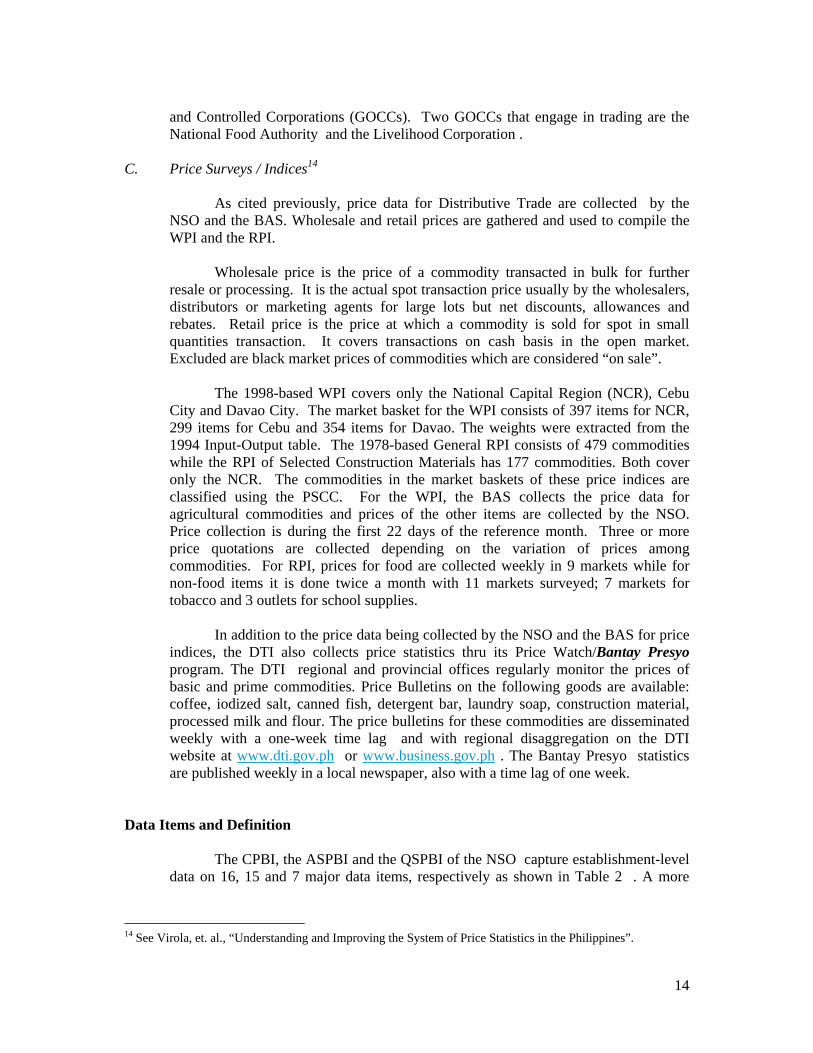
For estimating the quarterly indices on gross revenue, employment, compensation, and compensation per employee, the 1978 Quarterly Survey of Establishment (QSE) (currently known as the QSPBI) were used to come up with the quarterly breakdown of the annual levels. The corresponding indices for each sector in a given quarter were computed by calculating the ratio of the quarterly levels to the average quarterly values at base year 1978. For succeeding quarterly estimates, values are derived as the product of the relatives of the matched set of data from responding establishments for the sector, which are obtained from the QSPBI and the corresponding values for the previous quarter or the same quarter in the previous year, for services and industry sectors, respectively. The indices are derived as the ratio of the estimated values for a specific period to the base year levels. Thus,
Index on Gross Revenue
Similar procedures are followed for the Indexes on Compensation and
Employment. Total values for the aggregate sector are derived as the summation of the total
value estimates of subsectors covered by the sector. The computed index for the sector is then derived as the ratio to the corresponding base year level aggregates.
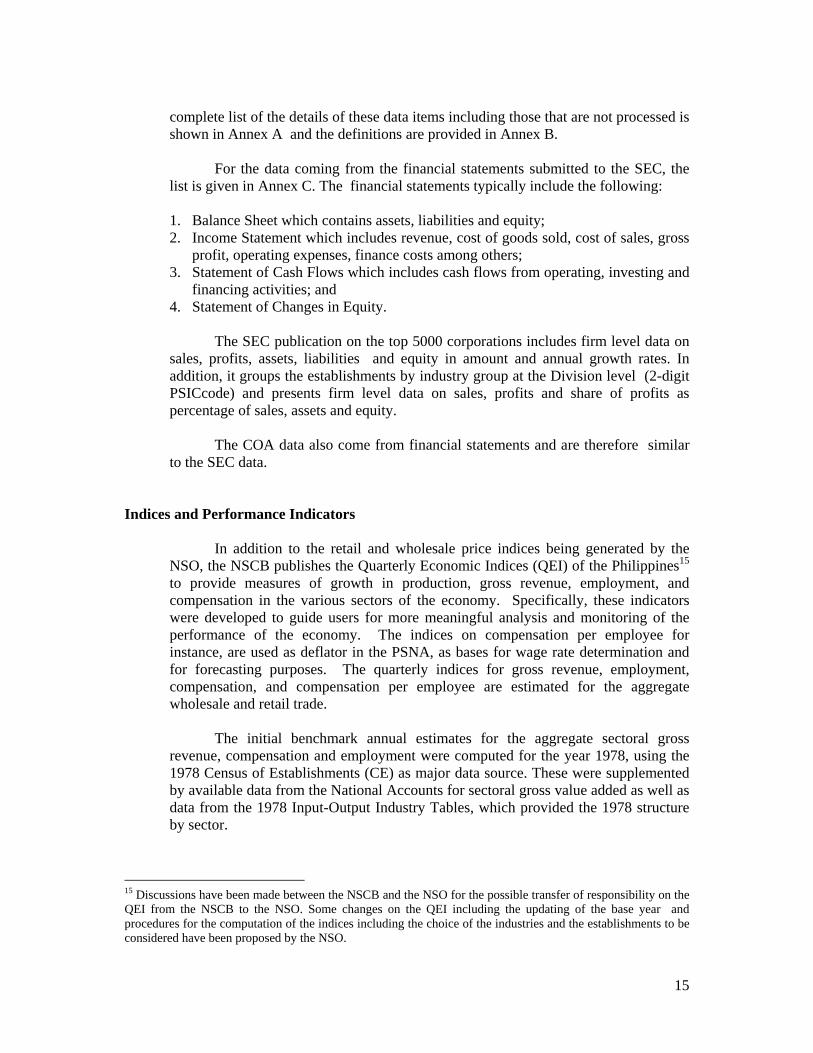
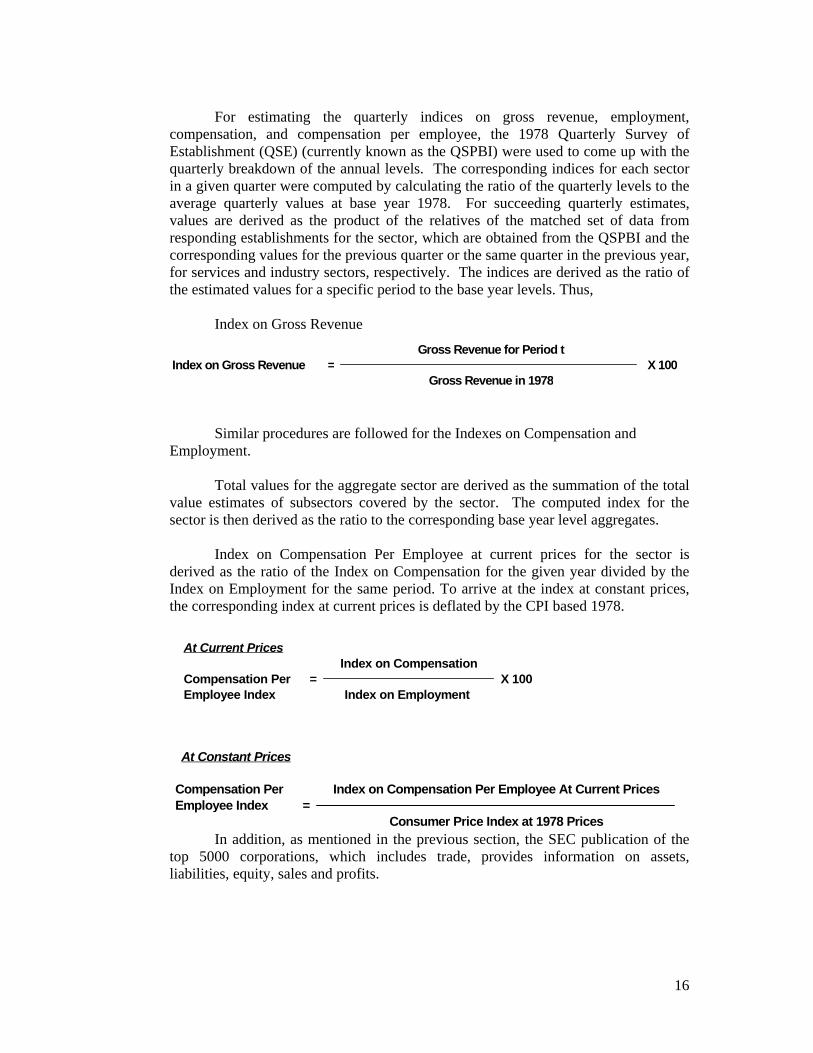
Index on Compensation Per Employee at current prices for the sector is
derived as the ratio of the Index on Compensation for the given year divided by the Index on Employment for the same period. To arrive at the index at constant prices, the corresponding index at current prices is deflated by the CPI based 1978.
In addition, as mentioned in the previous section, the SEC publication of the top 5000 corporations, which includes trade, provides information on assets, liabilities, equity, sales and profits.
Gross Revenue for Period tIndex on Gross Revenue = X 100
Gross Revenue in 1978
At Current PricesIndex on Compensation
Compensation Per = X 100Employee Index Index on Employment
At Constant Prices
Compensation Per Index on Compensation Per Employee At Current PricesEmployee Index =
Consumer Price Index at 1978 Prices
17
Distributive Trade Statistics and Compilation of the National Accounts
Distributive trade statistics including the price indices are used by the NSCB in the compilation of the PSNA. The general WPI (GWPI) and general RPI (GRPI) are being used to deflate the current estimates of Gross Value Added (GVA) of trade to come up with GVAs at constant prices. GWPI measures the changes in the price levels of commodities that flow into the wholesale trade intermediaries while GRPI measures the changes in the general level of prices at which retailers dispose of their goods to consumers or end-users.
As mentioned previously, distributive trade is the third largest major economic
sector in the Philippines, after manufacturing and agriculture and fishery. The quality of the estimates of the macroeconomic aggregates of the PSNA is therefore very much a function of the quality of the statistics on distributive trade. This is particularly so, since the GDP and GNP growth rates published by the NSCB are based on the estimates on the production side.
While the Philippines, thru the NSCB, has embarked on a series of activities
for the implementation of the 1993 SNA16, the compilation of the PSNA is still essentially based on the 1968 System of National Accounts using the 1977 PSIC.
GVA at current prices is estimated to be the aggregate GVAs of organized and
the unorganized sectors17. GVA = GVAo + GVAu For the benchmark estimates, the GVA for the organized sector is estimated
using the production approach and is summarized by the equation: GVAo = GO – II GO = GM + Rm + OACF GM = R – (Mp - ∆S) where GO = gross output GM = gross margin OACF = own account capital formation R = total receipt Rm = other receipt II = intermediate inputs Mp = cost of merchandise purchases ∆S = value of change in inventory.
16 The NSCB work program calls for the release of the 1993 SNA-based estimates in May 2006 at the earliest but the sequence of accounts does not include the financial accounts and the balance sheets. 17 For 2004, the share of the unorganized/informal sector to total GVA of Wholesale and Retail Trade combined was about 46 %.
18
These data are all available in the CPBI. For the unorganized sector, GVA is estimated using the employment
approach: GVAu = Eu * GVAs Eu = Elfs - Eo where Eu = employment for the unorganized sector GVAs = GVA per employee of small establishments derived from the ASPBI Elfs = no. of persons engaged in trading activity from the Labor Force
Survey (LFS)18 which covers employment in trade as a major activity and excludes those in trading as a secondary activity
Eo = total organized employment for both large and small trade establishments from the ASPBI. For the quarterly estimation, due to the unavailability of information on
intermediate inputs, extrapolation of the trend of the revenues from the QSPBI is used to get the GVA at current prices. To get the GVA at constant prices, single deflation is used using as deflators, the WPI for the wholesale trade and the RPI for retail trade.
The NSO provides posting sheets by sector/industry/sub-sector at
establishment level to deputized19 staff of the NSCB 45 days and 90 days after the reference quarter.
The posting sheets generated for all sectors except Agriculture, Hunting and
Forestry and Fishing include the following: Total Employment Paid Employment Total Compensation Gross revenue
Additional posting sheets generated for specific sectors are as follows:
Inventory (For Wholesale and Retail Trade) Capacity Utilization (For Manufacturing Sector) Production Value (For Manufacturing Sector )
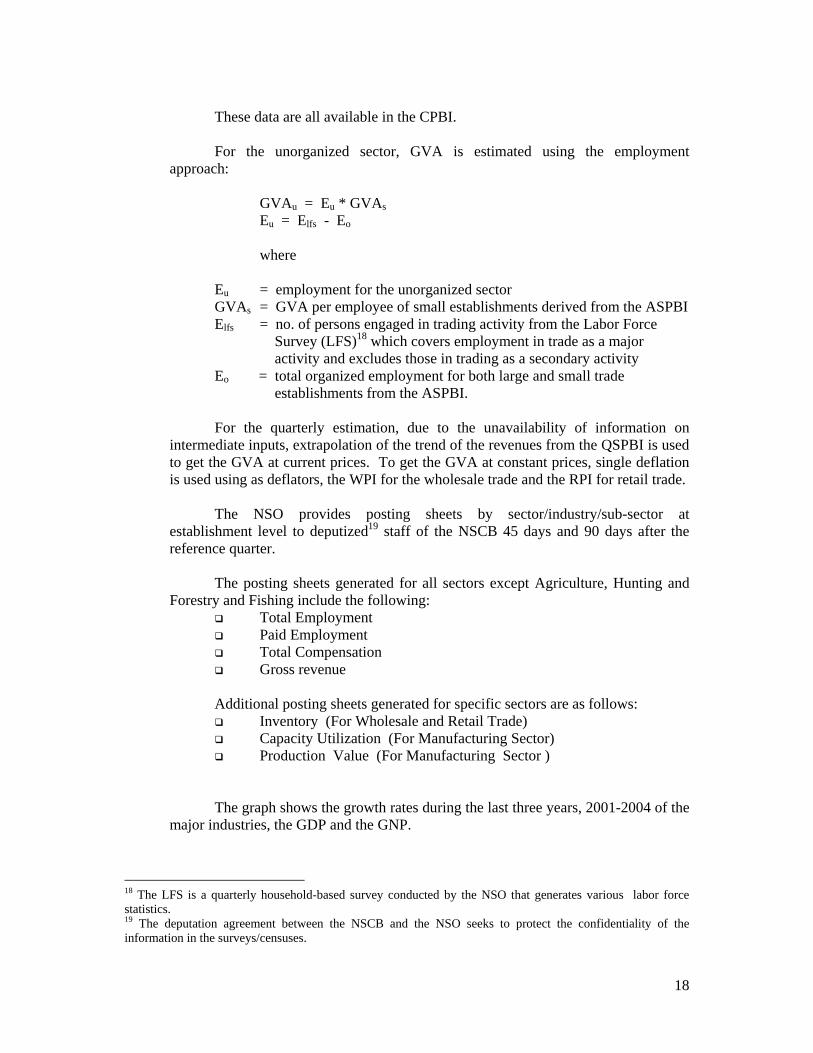
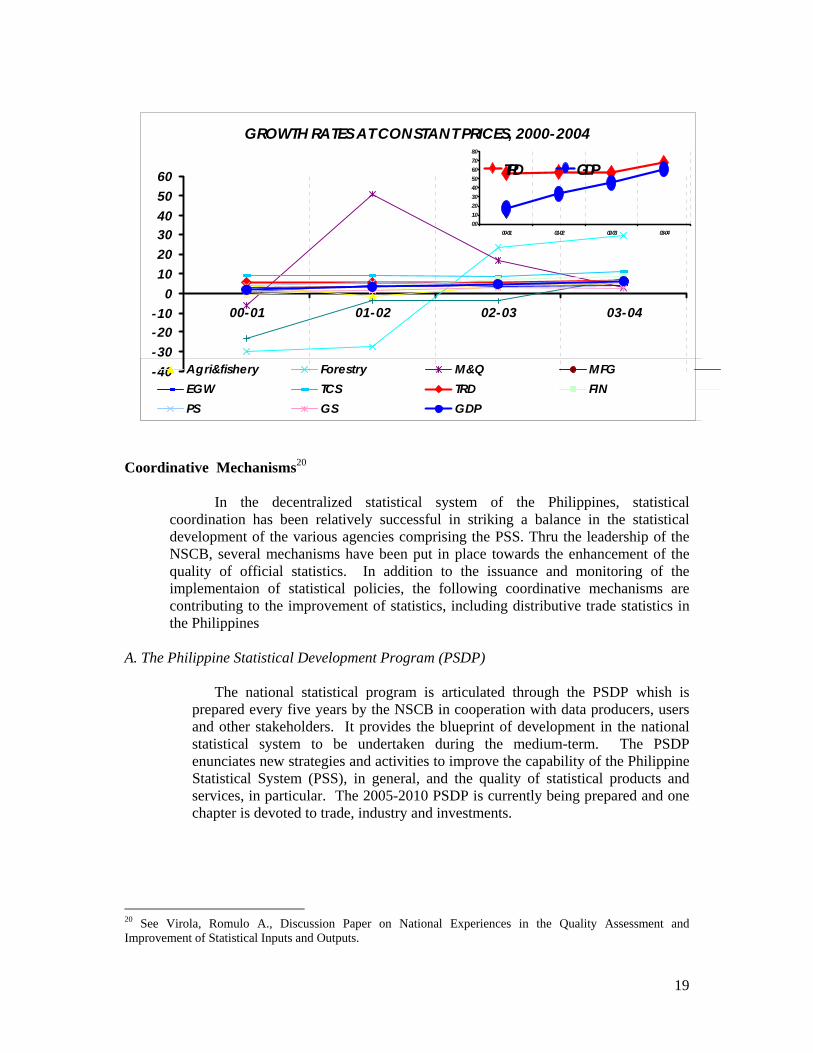
The graph shows the growth rates during the last three years, 2001-2004 of the
major industries, the GDP and the GNP.
18 The LFS is a quarterly household-based survey conducted by the NSO that generates various labor force statistics. 19 The deputation agreement between the NSCB and the NSO seeks to protect the confidentiality of the information in the surveys/censuses.
19
GROWTH RATES AT CONSTANT PRICES, 2000-2004
-40-30-20-10
0102030405060
00-01 01-02 02-03 03-04
Agri&fishery Forestry M&Q MFGEGW TCS TRD FINPS GS GDP
Coordinative Mechanisms20
In the decentralized statistical system of the Philippines, statistical coordination has been relatively successful in striking a balance in the statistical development of the various agencies comprising the PSS. Thru the leadership of the NSCB, several mechanisms have been put in place towards the enhancement of the quality of official statistics. In addition to the issuance and monitoring of the implementaion of statistical policies, the following coordinative mechanisms are contributing to the improvement of statistics, including distributive trade statistics in the Philippines
A. The Philippine Statistical Development Program (PSDP)
The national statistical program is articulated through the PSDP whish is
prepared every five years by the NSCB in cooperation with data producers, users and other stakeholders. It provides the blueprint of development in the national statistical system to be undertaken during the medium-term. The PSDP enunciates new strategies and activities to improve the capability of the Philippine Statistical System (PSS), in general, and the quality of statistical products and services, in particular. The 2005-2010 PSDP is currently being prepared and one chapter is devoted to trade, industry and investments.
20 See Virola, Romulo A., Discussion Paper on National Experiences in the Quality Assessment and Improvement of Statistical Inputs and Outputs.
0.01.02.03.04.05.06.07.08.0
00-01 01-02 02-03 03-04
TRD GDP
20
B. The System of Designated Statistics The system of designated statistics serves as a mechanism for the
identification and generation of the most critical and essential statistics for administrators, planners and policy-makers in the government and private sectors. It is also an important tool in addressing problems such as data gaps, duplication, delayed release and inaccessibility of important sets of statistics. Under the SDS, the quinquennial CPBI, the ASPBI and the QSPBI are all designated to the NSO with national and regional disaggregation of data. Both the CPBI and the ASPBI should have time lags of at most 2 years after the reference year for the preliminary results and 3 years for the final results. For the QSPBI, the corresponding time lags are 45 days and 60 days, after the reference quarter. The SDS also provides designation for the surveys on prices needed for the construction of the RPI and the WPI as well as for the generation of customs collection statistics.
C. The Technical and Subject-Matter Interagency Bodies
The NSCB is authorized to create inter-agency committees (IACs) and
technical committees (TCs) to assist it in the exercise of its functions. Among the functions of the committees are: 1) to assess and evaluate the quality, usefulness and timeliness of sectoral data and determine areas of duplication, discrepancies, and gaps; 2) to review the concepts, techniques and methodologies used in the collection, processing and reporting of data; and 3) to recommend an efficient and workable scheme for the allocation of agency responsibilities in the production of statistics. The existing committees related to trade is the IAC on Trade Statistics (IACTrS)21 and the TC on Price Statistics.
D. The Statistical Survey and Review Clearance System (SSRCS)
The Statistical Survey Review and Clearance System was implemented in
1988 to prescribe the evaluation of the technical aspects and instruments of statistical surveys and censuses. All inquiries, regardless of sample size and funding source and sponsored and/or to be conducted by the government at the national and/or subnational level, are covered by the system. The system is primarily aimed at ensuring sound design for data collection, minimizing response burden and eliminating unnecessary duplication of statistical data collection.
E. The Standard Classification System
Another vital function of the NSCB is to prescribe uniform standards and
classification systems in government statistics. These serve as instruments for promoting the comparability and consistency of statistics generated by data producers. The standard classification systems prescribed include the Philippine Standard Geographic Code, Philippine Standard Commodity Classification,
21 The IACTrS was just recently created by the NSCB thru Board Resolution No. 7 Series of 2004, approved on March 5, 2004.
21
Philippine Commodity Classification by Broad Economic Categories, Philippine Standard Industrial Classification, Philippine Standard Occupational Classification, and the Philippine Standard Classification of Education. While these classifications are patterned after the UN classifications systems, revisions are done to suit them to local conditions.
F. Coordination of the Subnational Statistical System
The coordination of the subnational statistical system is also a function
of the NSCB through its Regional Units and/or regional branches of the National Statistical Information Center in nine regions of the country. These NSCB units carry out the various coordination mechanisms previously discussed in order to improve data generation, dissemination and accessibility of statistics in the countryside or at the local level. In addition, they are responsible for the implementation by all local government units of the statistical policies formulated by the NSCB.
With the dwindling resources made available by and/or the lack of political
will of the national government to allocate resources for statistical activities, it becomes imperative to tap the local government units for the statistics needed for local development planning.
G. The National Statistics Month (NSM) / The National Convention on Statistics (NCS)
This month-long event (October) was initiated as a step towards insuring the
support of the public at large in improving and enhancing the quality and standard of statistics in the country. Another objective of the NSM is to promote, enhance and instill nationwide awareness and appreciation of the importance and value of statistics. For the last years, the culminating activity of the NSM has been the forging of memoranda of commitment/understanding among concerned institutions for the formulation of strategies and development and implementation of a plan of action to ensure the quality of the data pertaining to the theme. This year’s (16th NSM) theme is “Modernizing Agriculture and Fishery Through Quality Statistics.”
A National Convention on Statistics (NCS) is also held every three years to
provide a forum for exchanging ideas and experiences in the field of statistics and for discussing recent statistical development and prevailing issues and problems of the PSS. It further aims to elicit the cooperation and support of statisticians and professionals in related fields from the government, academe and private sector towards a more responsive statistical system. The next NCS will be held in October 2007.
H. The Performance Measurement Scheme for Statistical Agencies
To enhance the transparency in the operations of statistical offices and to
promote the public accountability of the PSS, the NSCB has initiated the formulation of a performance monitoring system for statistical offices in the
22
Philippines. The scheme seeks to determine the capabilities of agencies in responding to the needs of their clients and other stakeholders.
Issues and Concerns on Distributive Trade Statistics
Some of the issues arising in the trade sector include:
1. On the Coverage
By the very nature of the sector, in developing countries including the Philippines, there is a large amount of unorganized/informal sector trading activities taking place. Such activities like the following are not usually captured in censuses and surveys:
a. “Sari-Sari Stores” with no regular paid employees; b. Side walk vendors, ambulant peddlers, hawkers; c. Trading of cell phone cards purchased by dealers particularly those
households that serve as dealers; d. Purification of water done by water refilling stations;
e. Non-store retail selling like selling by vending machines; online buy and sell; house to house selling of goods; and
f. Trading activities done by members of the households which form part of their secondary source of income (e.g. an employee doing buy and sell).
This poses a challenge in the compilation of the PSNA as it is very difficult to
make adjustments for the noncoverage of these economic activities. In addition, the coverage of the QSPBI which is heavily used in the PSNA is
limited to establishments with ATE of 20 or more ( the ASPBI also covers establishments with ATE less than 20). Thus, the quarterly estimates of the PSNA may not be reflecting what is happening to small retailers and wholesalers.
2. On the Operational Definition of/Delineation Between Wholesale and Retail
While the PSIC is clear on the classification of establishments between
wholesale and retail, the operationalization of the delineation is not clearcut. The criterion being used by the NSO is on the basis of the activity that contributes the biggest or major portion of the gross income or revenue of the establishment. But this criterion is vague for some establishments and the proper classification is difficult to determine. Examnples are those big establishments classified as wholesalers (e.g. Price Smart, MACROs, PureGold, etc.) and at the same time doing retailing activities for which it is difficult to delineate the output from wholesaling and from retailing activities.
On the surface, this looks like an issue only on misallocation/wrong attribution
of output/gva to retailing/wholesaling. From practical national accounting considerations, especially for the quarterly estimates when extrapolation using
23
revenue trends is used, this affects the quality of the gva estimates of the components of distributive trade.
3. On the Retail and Wholesale Price Indices
The price Indices on Trade may not accurately reflect (see Figure 1 for the
inflation rates based on CPI, WPI and RPI) the current situation for the following reasons:
a. The RPI has an outdated base year of 1978; b. The General RPI covers only the National Capital Region while the
General WPI covers only the Metro Manila, Cebu City and Davao City, possibly contributing to some bias since the price indices are used as deflators in the PSNA.
c. The weights of the WPI are based on the the 1994 Input-Output Tables. d. On the quarterly economic indices and other performance indicators While improvement plans have been proposed by the NSO, as with the price
indices the QEI suffers from an outdated base year of 1978. In addition, while indicators on trade such as fixed capital formation, change
in stocks and trade margins for both wholesale and retail can be generated from survey/census and administrative data, these are not published or not published regularly.
4. On the dissemination/release of survey results
As previously mentioned, the CPBI, the QSPBI and the QSPBI are designated
statistics under the SDS with designated time lags. While the NSO has been able to provide the results for the QSPBI to the NSCB for purposes of the quarterly national accounts in accordance with the schedule stipulated under the SDS, the same cannot be said of the CPBI or the ASPBI.
5. On the decreasing response rates for the surveys The response rates to the QSPBI have suffered lately and this impacts on the
quality of the PSNA quarterly estimates. For trade, the response rate at estimation time has gone down to 44% during the Q1-2005 estimation period from 49% in Q1-2004 and 70% in Q2-2004.
6. On the use of Average Total Employment as measure of size/stratification
variable With the proliferation of subcontracting activities, the use of employment size
to stratify the establishments may no longer be as relevant as it used to.
24
7. On the updating of the List of Establishments Prior to the 2004 updating of the LE, the last systematic update was done in
1999 during the last census of establishments. Since 1999, it is not unlikely that the trade industry has expanded or its structure between wholesale and retail has changed.
With an outdated frame, the shift of establishments from trade to other type of
activities and vice-versa are not captured in the annual or quarterly surveys of establishments in a reasonably timely manner raising questions on the validity of the ASPBI and QSPBI results particularly for trade. For example, CALTEX which is classified in the establishment surveys as a petroleum refining company ( Manufacturing) has shifted to being an importer and trader of petroleum products since the Fourth Quarter of 2004. This contributes to the decline in the output of manufacturing and unless properly addressed by a corresponding adjustment in the trade sector will contribute to a decline in GDP.
8. On the administrative records
With the problems faced by the NSO in disseminating the results of the CPBI
and the ASPBI and even the QSPBI for some sectors, increasing use of administrative records should be resorted to. Unfortunately, while these admininistrative records are collected, many of them remain unprocessed.
9. On the computation of the contribution of the unorganized sector in the national
accounts The methodology used in the estimation of the contribution of the
informal/unorganized sector certainly needs to be improved, especially so for the trade sector where the contribution of the informal sector is relatively large.
25
ANNEX A
List of Data from the CPBI , ASPBI and QSPBI A. CPBI22
A.1. Processed Data
1. Number of Establishments
2. Average Employment for the Year (by type and sex or worker) 2.1. Total (and by Sex)
2.1.1 Paid employees 2.1.2 Unpaid workers 2.1.3 Managers and executives 2.1.4 Other paid employees
3. Compensation 3.1 Employer’s total compensation (and by Sex)
3.1.1. salaries and wages 3.1.2. other paid employees 3.1.3. employers contribution to SSS/GSIS and the
4. Revenue by Type 4.1. total
4.2 sales of goods 4.3 commissions and fees earned 4.4 repair and maintenance 4.5 value of industrial services done for others 4.6 value of non-industrial services done for others
4.6.1 Land 4.6.2 Building, spaces for business use 4.6.3 other rental income 4.6.4 other non-industrial services
4.7 interst income 4.8 other revenue
5. Costs 5.1. total 5.2. goods purchased for resale 5.3. materials and supplies purchased 5.4. fuel, lubricants, oils and greases purchased 5.5. electricity purchased 5.6 cost of industrial services done by others 5.7. cost of non-industrial services done for others
5.7.1. total 5.7.2. rental expenses
5.7.2.1 land 5.7.2.2 building / space for business use 5.7.2.3 other rental expense
5.7.3. non-industrial costs 5.8. interest expense 5.9. indirect taxes 5.10. research and experiment development activity 5.11. other costs
6. Gross Sale Additions to Fixed Assets 6.1. new fixed assets
22 CPBI is from the data items in the 2000 CPBI questionnaire
26
ANNEX A List of Data from the CPBI , ASPBI and QSPBI
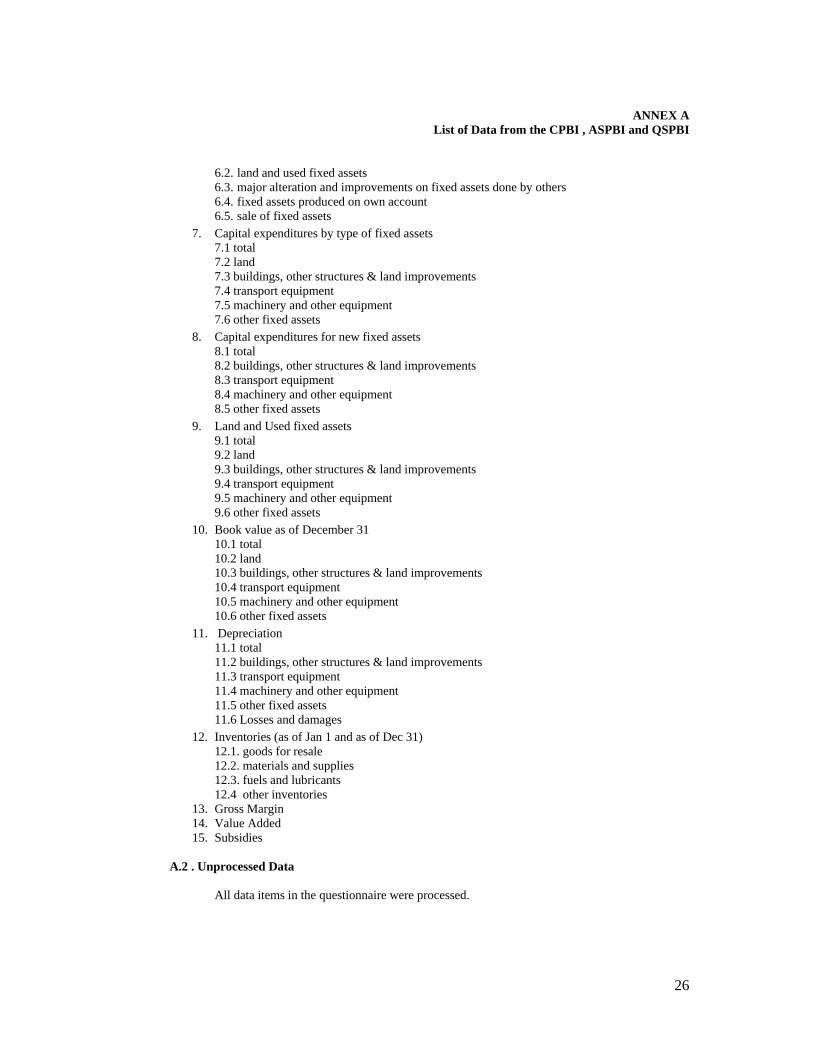
6.2. land and used fixed assets 6.3. major alteration and improvements on fixed assets done by others 6.4. fixed assets produced on own account 6.5. sale of fixed assets
7. Capital expenditures by type of fixed assets 7.1 total 7.2 land 7.3 buildings, other structures & land improvements 7.4 transport equipment 7.5 machinery and other equipment 7.6 other fixed assets
8. Capital expenditures for new fixed assets 8.1 total 8.2 buildings, other structures & land improvements 8.3 transport equipment 8.4 machinery and other equipment 8.5 other fixed assets
9. Land and Used fixed assets 9.1 total 9.2 land 9.3 buildings, other structures & land improvements 9.4 transport equipment 9.5 machinery and other equipment 9.6 other fixed assets
10. Book value as of December 31 10.1 total 10.2 land 10.3 buildings, other structures & land improvements 10.4 transport equipment 10.5 machinery and other equipment 10.6 other fixed assets
11. Depreciation 11.1 total 11.2 buildings, other structures & land improvements 11.3 transport equipment 11.4 machinery and other equipment 11.5 other fixed assets 11.6 Losses and damages
12. Inventories (as of Jan 1 and as of Dec 31) 12.1. goods for resale 12.2. materials and supplies 12.3. fuels and lubricants 12.4 other inventories
13. Gross Margin 14. Value Added 15. Subsidies
A.2 . Unprocessed Data
All data items in the questionnaire were processed.
27
ANNEX A List of Data from the CPBI , ASPBI and QSPBI
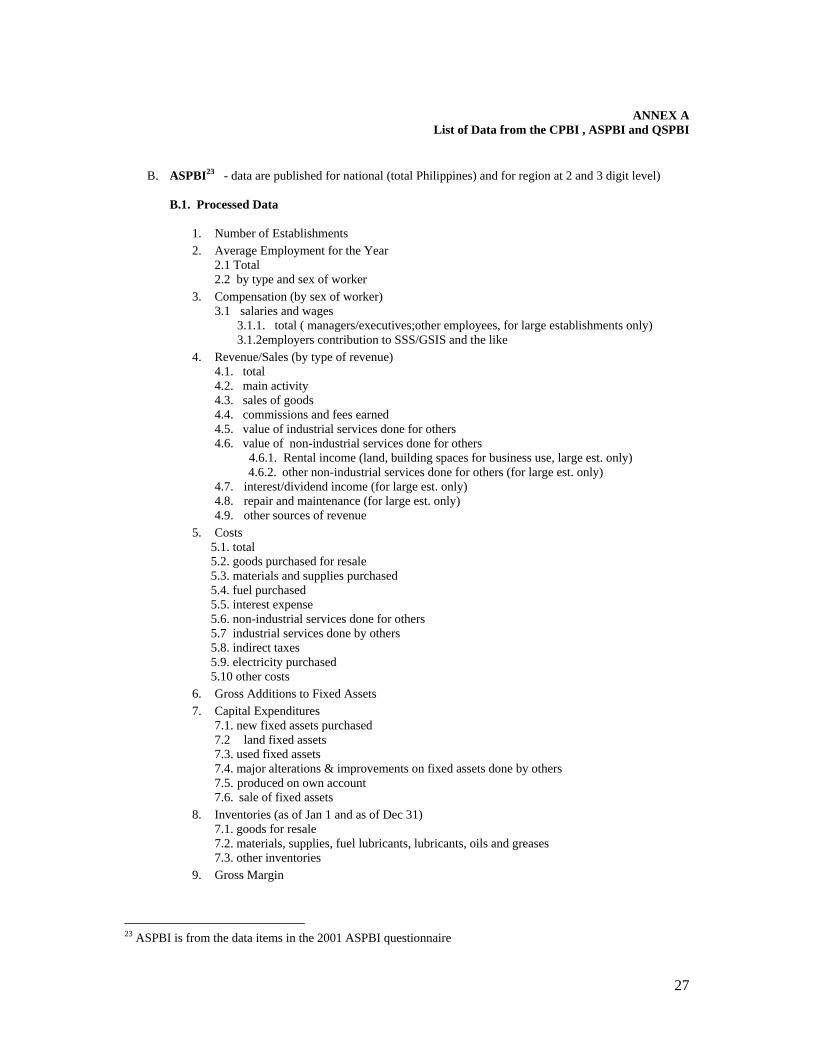
B. ASPBI23 - data are published for national (total Philippines) and for region at 2 and 3 digit level) B.1. Processed Data
1. Number of Establishments
2. Average Employment for the Year 2.1 Total 2.2 by type and sex of worker
3. Compensation (by sex of worker) 3.1 salaries and wages
3.1.1. total ( managers/executives;other employees, for large establishments only) 3.1.2employers contribution to SSS/GSIS and the like
4. Revenue/Sales (by type of revenue) 4.1. total 4.2. main activity 4.3. sales of goods 4.4. commissions and fees earned 4.5. value of industrial services done for others 4.6. value of non-industrial services done for others
4.6.1. Rental income (land, building spaces for business use, large est. only) 4.6.2. other non-industrial services done for others (for large est. only)
4.7. interest/dividend income (for large est. only) 4.8. repair and maintenance (for large est. only) 4.9. other sources of revenue
5. Costs 5.1. total 5.2. goods purchased for resale 5.3. materials and supplies purchased 5.4. fuel purchased 5.5. interest expense 5.6. non-industrial services done for others 5.7 industrial services done by others 5.8. indirect taxes 5.9. electricity purchased 5.10 other costs
6. Gross Additions to Fixed Assets
7. Capital Expenditures 7.1. new fixed assets purchased 7.2 land fixed assets 7.3. used fixed assets 7.4. major alterations & improvements on fixed assets done by others 7.5. produced on own account 7.6. sale of fixed assets
8. Inventories (as of Jan 1 and as of Dec 31) 7.1. goods for resale
7.2. materials, supplies, fuel lubricants, lubricants, oils and greases 7.3. other inventories
9. Gross Margin
23 ASPBI is from the data items in the 2001 ASPBI questionnaire
28
ANNEX A List of Data from the CPBI , ASPBI and QSPBI
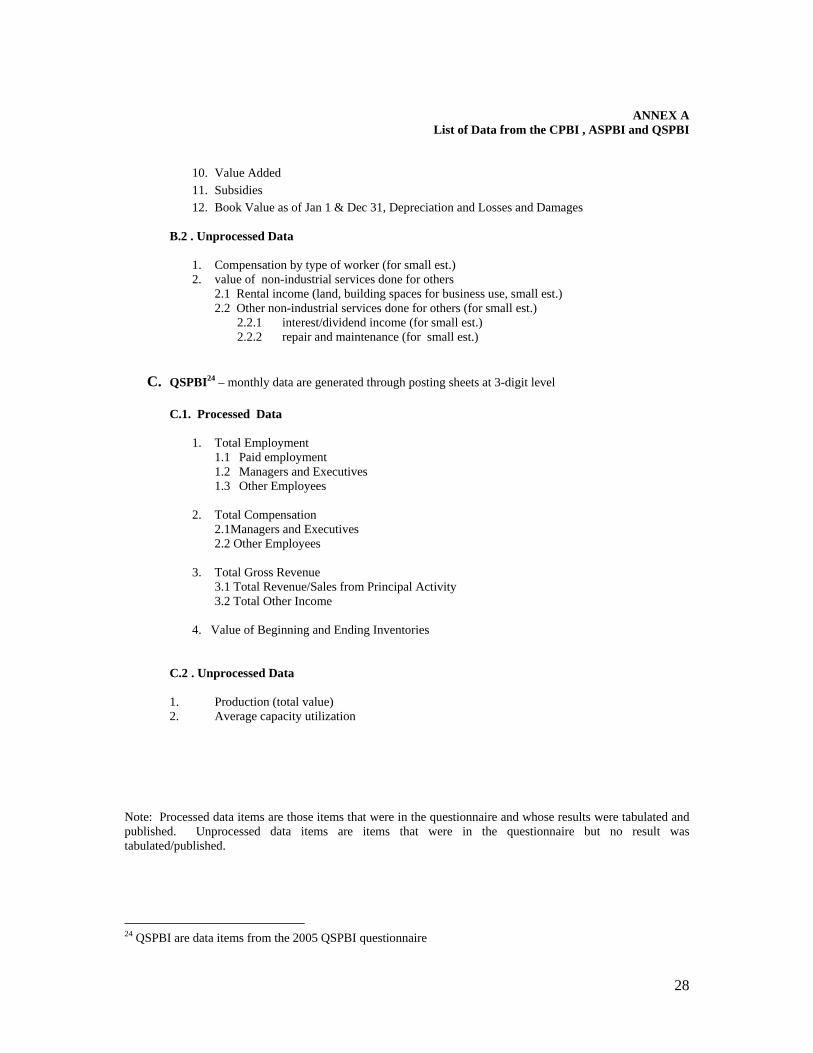
10. Value Added
11. Subsidies
12. Book Value as of Jan 1 & Dec 31, Depreciation and Losses and Damages
B.2 . Unprocessed Data
1. Compensation by type of worker (for small est.) 2. value of non-industrial services done for others
2.1 Rental income (land, building spaces for business use, small est.) 2.2 Other non-industrial services done for others (for small est.)
2.2.1 interest/dividend income (for small est.) 2.2.2 repair and maintenance (for small est.)
C. QSPBI24 – monthly data are generated through posting sheets at 3-digit level
C.1. Processed Data 1. Total Employment
1.1 Paid employment 1.2 Managers and Executives 1.3 Other Employees
2. Total Compensation 2.1Managers and Executives 2.2 Other Employees
3. Total Gross Revenue 3.1 Total Revenue/Sales from Principal Activity
3.2 Total Other Income 4. Value of Beginning and Ending Inventories
C.2 . Unprocessed Data
1. Production (total value) 2. Average capacity utilization
Note: Processed data items are those items that were in the questionnaire and whose results were tabulated and published. Unprocessed data items are items that were in the questionnaire but no result was tabulated/published.
24 QSPBI are data items from the 2005 QSPBI questionnaire
29
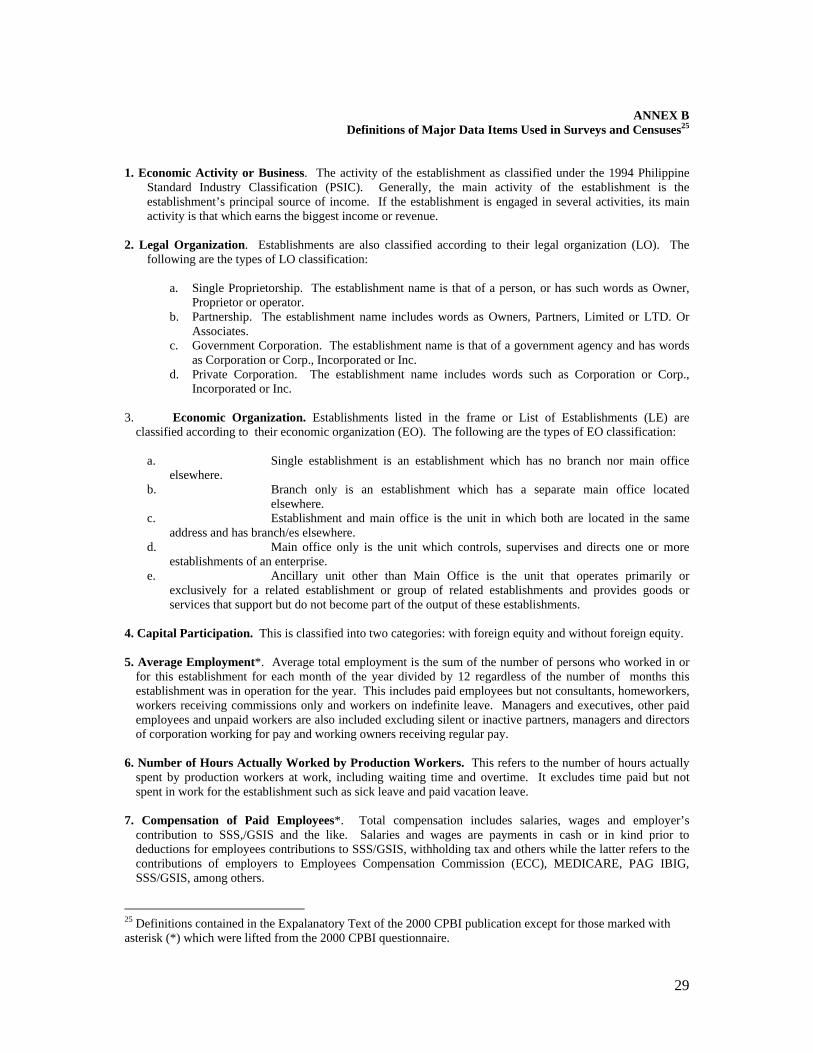
ANNEX B Definitions of Major Data Items Used in Surveys and Censuses25
1. Economic Activity or Business. The activity of the establishment as classified under the 1994 Philippine
Standard Industry Classification (PSIC). Generally, the main activity of the establishment is the establishment’s principal source of income. If the establishment is engaged in several activities, its main activity is that which earns the biggest income or revenue.
2. Legal Organization. Establishments are also classified according to their legal organization (LO). The
following are the types of LO classification:
a. Single Proprietorship. The establishment name is that of a person, or has such words as Owner, Proprietor or operator.
b. Partnership. The establishment name includes words as Owners, Partners, Limited or LTD. Or Associates.
c. Government Corporation. The establishment name is that of a government agency and has words as Corporation or Corp., Incorporated or Inc.
d. Private Corporation. The establishment name includes words such as Corporation or Corp., Incorporated or Inc.
3. Economic Organization. Establishments listed in the frame or List of Establishments (LE) are
classified according to their economic organization (EO). The following are the types of EO classification:
a. Single establishment is an establishment which has no branch nor main office elsewhere.
b. Branch only is an establishment which has a separate main office located elsewhere.
c. Establishment and main office is the unit in which both are located in the same address and has branch/es elsewhere.
d. Main office only is the unit which controls, supervises and directs one or more establishments of an enterprise.
e. Ancillary unit other than Main Office is the unit that operates primarily or exclusively for a related establishment or group of related establishments and provides goods or services that support but do not become part of the output of these establishments.
4. Capital Participation. This is classified into two categories: with foreign equity and without foreign equity. 5. Average Employment*. Average total employment is the sum of the number of persons who worked in or
for this establishment for each month of the year divided by 12 regardless of the number of months this establishment was in operation for the year. This includes paid employees but not consultants, homeworkers, workers receiving commissions only and workers on indefinite leave. Managers and executives, other paid employees and unpaid workers are also included excluding silent or inactive partners, managers and directors of corporation working for pay and working owners receiving regular pay.
6. Number of Hours Actually Worked by Production Workers. This refers to the number of hours actually
spent by production workers at work, including waiting time and overtime. It excludes time paid but not spent in work for the establishment such as sick leave and paid vacation leave.
7. Compensation of Paid Employees*. Total compensation includes salaries, wages and employer’s
contribution to SSS,/GSIS and the like. Salaries and wages are payments in cash or in kind prior to deductions for employees contributions to SSS/GSIS, withholding tax and others while the latter refers to the contributions of employers to Employees Compensation Commission (ECC), MEDICARE, PAG IBIG, SSS/GSIS, among others.
25 Definitions contained in the Expalanatory Text of the 2000 CPBI publication except for those marked with asterisk (*) which were lifted from the 2000 CPBI questionnaire.
30
ANNEX B Definitions of Major Data Items Used in Surveys and Censuses26
8. Revenue. Revenue includes cash received and receivables for goods sold and services rendered. Valuation is at producer’s prices (ex-establishment), net of discounts and allowances, including duties and taxes but excluding subsidies.
9. Subsidies. Subsidies refer to special grants in the form of financial assistance or tax exemption or tax
privilege received from the government to aid and develop an industry or production and to protect it against competition.
10. Costs. This refers to all expenses incurred during the year whether paid or payable. Valuation should be at
market price including taxes and other charges, net of discounts, rebates, returns and allowances. Goods and services received by the establishment from other establishments of the same enterprise are valued as though purchased.
11. Book Value. This is the initial or acquisition cost of fixed assets less accumulated depreciation charges. 12. Sale of Fixed Assets. This refers to the actual amount received/realized (not book value) from the sale of
fixed assets including the value of fixed assets transferred to other establishments of the same enterprise. 13. Capital Expenditures. Capital expenditures for fixed assets include cost of acquisition of new and used
fixed assets; fixed assets produced by the establishment for its own use; major alterations, additions and improvements to fixed assets, whether done by others or on own account. Fixed assets received from other establishments belonging to the same enterprise are valued as though purchased.
14. Inventories. Inventories refer to stocks of goods owned by or under the control of the establishment as
of fixed date, regardless of where the stocks are located. Valuation should be at current replacement cost in purchaser’s (market) prices. Replacement cost is the cost of an item in terms of its present price rather than its original cost.
15. Capacity Utilization. This is the ratio of total output to the maximum rated capacity. Rated capacity refers
to the largest volume of output possible at which the factory can operate with an acceptable degree of efficiency taking into consideration unavoidable losses of productive time (i.e. vacation, holiday and repair to equipment) and availability of raw materials.
26 Definitions contained in the Expalanatory Text of the 2000 CPBI publication except for those marked with asterisk (*) which were lifted from the 2000 CPBI questionnaire.
31
ANNEX C List of Data Items from the Securities and Exchange Commission27
Financial Statements Processed Data available for publication every year for Top 5000 corporations and with a lag time of one year.
1. Sales 2. Profits 3. Total Assets 4. Total Liabilities 5. Equity
Unprocessed Data
1. Income/Revenue a. Operating Income b. Training and School Income c. Income from construction d. Operating and Service Income e. Government Services f. Gov’t Business Operations g. Rent h. Miscellaneous i. Non-operating Income j. Dividends and Interest k. Dividends l. Interest Income m. Rent income n. Others o. Incidental income p. Gain on sale of stock q. Gain on sale of equipment / fixed assets r. Gain on fuel transfer s. Income from sale of non-operating property t. Income from sale of scrap u. Income from operation of trust fund v. Exchange of properties for shares w. Share from lacal sales and real estate tax x. Amortization of interest y. Forex gain z. Fines / penalties aa. Management / service fee bb. Discount amortization cc. others
2. Expenses
a. Cost of sales b. Dredging expense c. Donations, contributions and grants d. Operating expenses e. Interest
27 2003 Top 5000 Corporations for the processed items and Financial Statements for the unprocessed both by SEC
32
ANNEX C List of Data Items from the Securities and Exchange Commission28
f. Bank charges g. Interest and financial charges h. Taxes and licenses i. Personal services j. Salaries, allowances, employees compensation k. Salaries and wages l. Employees benefits m. Social security insurance premium n. 13th month pay o. bonus and incentives p. acceptance payable q. due to affiliates r. due to parent company s. due to national government t. deferred credits u. Dividends payable v. Other current liabilities w. Long-term liabilities x. Foreign loans y. Loans and advances payable z. Loans payable aa. Bonds / Notes Payable bb. Public debt cc. Payables to Phil. Government dd. Others ee. Deferred credits ff. Trust funds gg. Miscellaneous & deferred credits hh. Contingent liabilities ii. Advance from other companies jj. Subscription payable due to subsidiary kk. Other liabilities
3. Networth
a. Capital Stock b. Subscribed capital stock c. Appraisal surplus d. Donated surplus e. Contingent surplus f. Invested surplus g. Current surplus / Retained earnings (deficit) h. Miscellaneous Capital i. Inventories j. Temporary investments k. Advances to subsidiaries and project site l. Other current assets m. Long-term receivables n. Pre-payments and deposits o. Investments p. Fixed assets
28 2003 Top 5000 Corporations for the processed items and Financial Statements for the unprocessed both by SEC
33
ANNEX C List of Data Items from the Securities and Exchange Commission29
q. Land r. Land, land improvements s. Land improvements t. Land, building and structures u. Building v. Building & structures w. Building structures & building improvements x. Building & Structures & Progress y. Leasehold Improvements z. Leasehold improvements in Process aa. Real Estate bb. Plantataion crops cc. Construction in progress dd. Construction / furniture / books in process ee. Process units and facilities ff. Equipment, furnitures & fixtures gg. Others hh. Acc. Depreciation ii. Deferred charges jj. Contingent assets kk. Other Assets
4. Liabilities
a. Current liabilities b. Loans payable – current portion c. Loans and notes payable d. Notes payable e. Accrued interest payable f. Trust liabilities g. Depository liabilities h. Accounts payable i. Accounts payable & accrued liabilities j. Accrued expenses k. Director’s / officer’s allowance l. Allowances m. Uniform n. Medical o. Commutable allowance p. Life and retirement insurance q. Vacation / sick leave r. Overtime pay s. Pensions / Gartuities t. Provision for separation u. Training and personnel improvement v. Consultant and specialist fees w. Per diems, compensation x. Separation pay y. Longevity pay z. Other benefits aa. Personal services and labor overhead
29 2003 Top 5000 Corporations for the processed items and Financial Statements for the unprocessed both by SEC
34
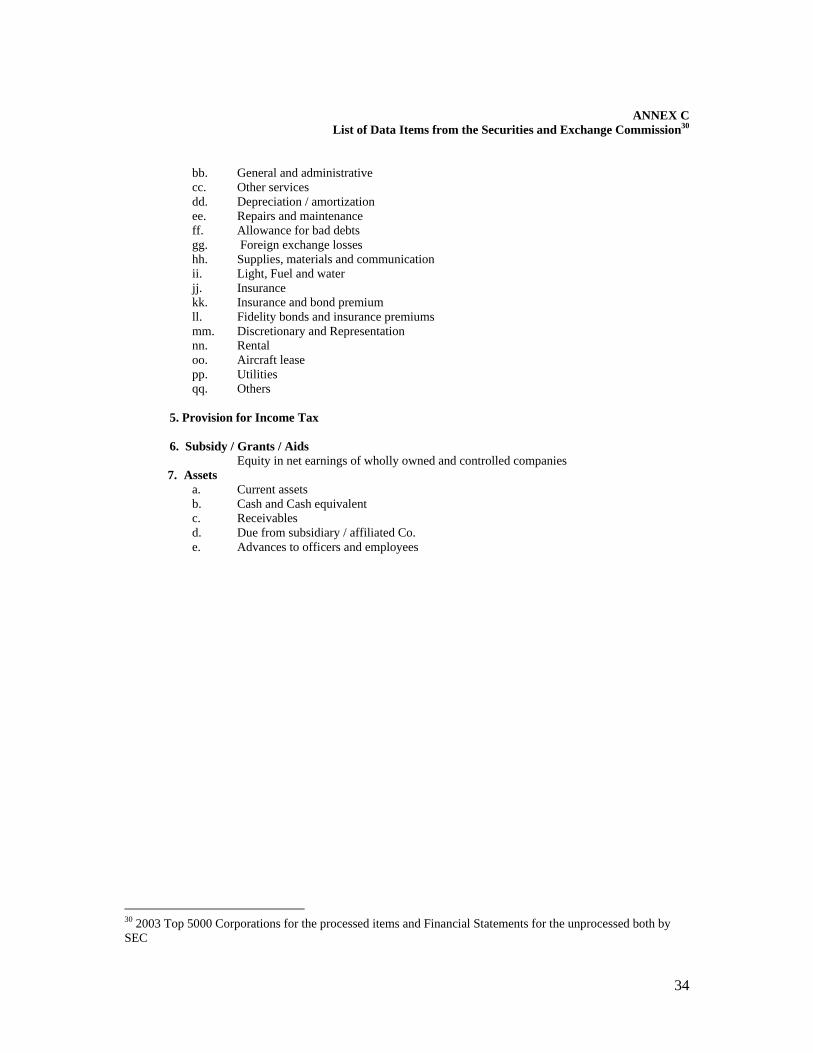
ANNEX C List of Data Items from the Securities and Exchange Commission30
bb. General and administrative cc. Other services dd. Depreciation / amortization ee. Repairs and maintenance ff. Allowance for bad debts gg. Foreign exchange losses hh. Supplies, materials and communication ii. Light, Fuel and water jj. Insurance kk. Insurance and bond premium ll. Fidelity bonds and insurance premiums mm. Discretionary and Representation nn. Rental oo. Aircraft lease pp. Utilities qq. Others
5. Provision for Income Tax 6. Subsidy / Grants / Aids
Equity in net earnings of wholly owned and controlled companies 7. Assets
a. Current assets b. Cash and Cash equivalent c. Receivables d. Due from subsidiary / affiliated Co. e. Advances to officers and employees
30 2003 Top 5000 Corporations for the processed items and Financial Statements for the unprocessed both by SEC
35
Table 1: Correspondence between the ISIC Rev 3.1 and the 1994 PSIC as amendedSection Division Group Class 1994 PSIC as amended Section Division Group Class ISIC 3.1
G WHOLESALE AND RETAIL TRADE; REPAIR OF MOTOR VEHICLES, MOTORCYCLES AND PERSONAL AND HOUSEHOLD GOODS
G WHOLESALE AND RETAIL TRADE; REPAIR OF MOTOR VEHICLES, MOTORCYCLES AND PERSONAL AND HOUSEHOLD GOODS
50 Sale, maintenance and repair of motor vehicles and motorcycles; retail sale of automotive fuel
50 Sale, maintenance and repair of motor vehicles and motorcycles; retail sale of automotive fuel
501 Sale of motor vehicles 501 5010 Sale of motor vehicles5011 Wholesale of motor vehicles5012 Retail sale of motor vehicles
502 5020 Maintenance and repair of motor vehicles 502 5020 Maintenance and repair of motor vehicles503 5030 Sale of motor vehicles parts and accessories 503 5030 Sale of motor vehicle parts and accessories504 5040 Sale, maintenance and repair of motor vehicles
parts and accessories504 5040 Sale, maintenance and repair of motrocycles and
related parts and accessories
505 5050 Retail sale of automovile fuel 505 5050 Retail sale of automotive fuel
51 Wholesale trade and commission trade, except of motor vehicles and motorcycles
51 Wholesale trade and commission trade, except of motor vehicles and motorcycles
511 Wholesale on a fee or contract basis511 5110 Wholesale on a fee or contract basis
5111 Wholesale on a fee or contract basis, of agriculture raw materials and live animals
5112 Wholesale on a fee or contract basis, of food, beverages and tobacco
5113 Wholesale on a fee or contract basis, of textile, clothing and footwear
5114 Wholesale on a fee or contract basis, of household appliances, articles and equipment
5115 Wholesale on a fee or contract basis, of miscellaneous consumer goods
5116 Wholesale on a fee or contract basis, of construction materials and hardware
5117 Wholesale on a fee or contract basis, of chemical and pharmaceuticals products
5118 Wholesale on a fee or contract basis, of machinery equipment and supplies
5119 Wholesale on a fee or contract basis, of other products
512 Wholesale of agriculture raw materials, live animals, food, beverages and tobacco
512 Wholesale of agricultural raw materials, live animals, food, beverages and tobacco
5121 Wholesale of agriculture raw materials, live animals 5121 Wholesae of agricultural raw materials and live animals5122 Wholesale of food, beverages and tobacco 5122 Wholesale of food, beverages and tobacco
513 Wholesale of household goods513 Wholesale of household goods
5131 Wholesale of textiles, clothing , footwear and leather goods 5131 Wholesale of textiles, clothing and footwear
5138 Wholesale of miscellaneous consumer goods 5139 Wholesale of other household goods5139 Wholesale of other household goods
514 Wholesale of non-agricultural intermediate products, waste and scraps
514 Wholesale of non-agricultural intermediate products, waste and scrap
5141 Wholesale of solid, liquid and gaseous fuels and related products
5141 Wholesale of solid, liquid and gaseous fuels and related products
5142 Wholesale of metals and metal ores 5142 Wholesale of metals and metal ores5143 Wholesale of construction materials, hardware,
plumbing and heating equipment and supplies5143 Wholesale of construction meterials, hardware,
plumbing and heating equipment and supplies
5149 Wholesale of other intermediate products, waste and scraps
5149 Wholesale of other intermediate products, waste and scrap
515 5150 Wholesale of machinery, equipment and supplies (excluding computers, computer peripheral equipment, electronic parts and equipment, and other machinery and supplies) 515 Wholesale of machinery, equipmetnt and supplies
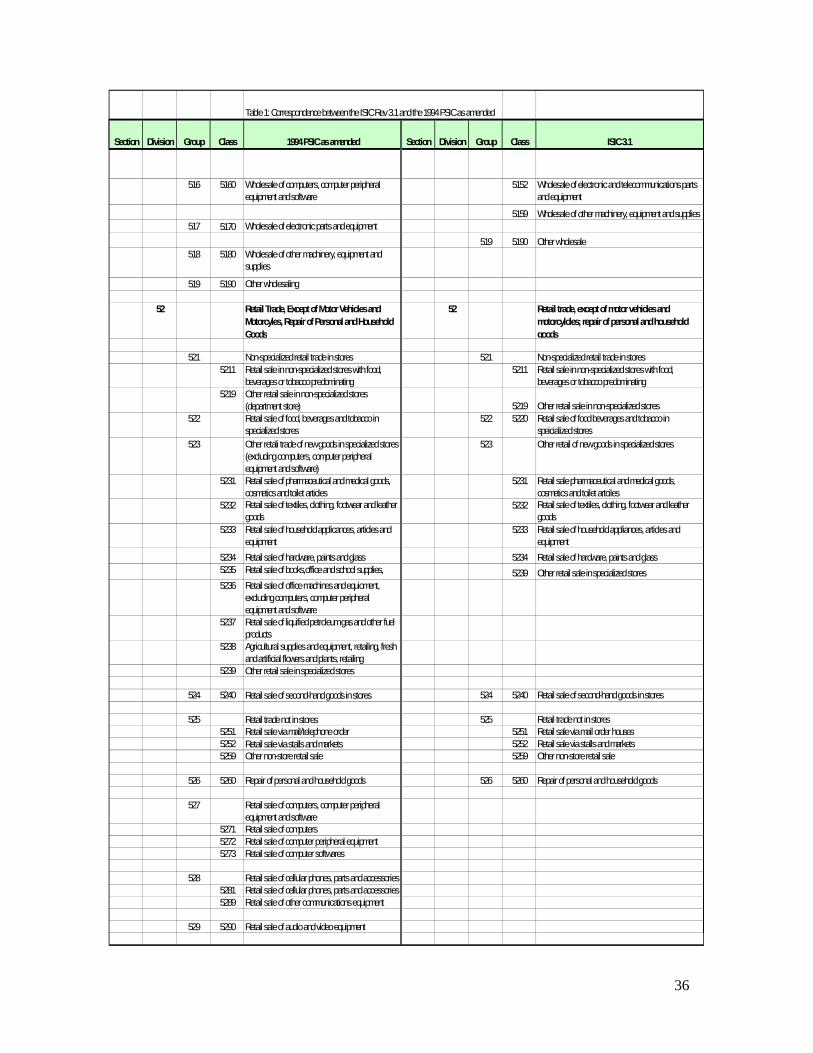
36
Table 1: Correspondence between the ISIC Rev 3.1 and the 1994 PSIC as amended
Section Division Group Class 1994 PSIC as amended Section Division Group Class ISIC 3.1
516 5160 Wholesale of computers, computer peripheral equipment and software
5152 Wholesale of electronic and telecommunications parts and equipment
5159 Wholesale of other machinery, equipment and supplies517 5170 Wholesale of electronic parts and equipment
519 5190 Other wholesale518 5180 Wholesale of other machinery, equipment and
supplies
519 5190 Other wholesaling
52 Retail Trade, Except of Motor Vehicles and Motorcyles, Repair of Personal and Household Goods
52 Retail trade, except of motor vehicles and motorcylcles; repair of personal and household goods
521 Non-specialized retail trade in stores 521 Non-specialized retail trade in stores5211 Retail sale in non-specialized stores with food,
beverages or tobacco predominating5211 Retail sale in non-specialized stores with food,
beverages or tobacco predominating5219 Other retail sale in non-specialized stores
(department store) 5219 Other retail sale in non-specialized stores522 Retail sale of food, beverages and tobacco in
specialized stores522 5220 Retail sale of food beverages and tobacco in
speicialized stores523 Other retali trade of new goods in specialized stores
(excluding computers, computer peripheral equipment and software)
523 Other retail of new goods in specialized stores
5231 Retail sale of pharmaceutical and medical goods, cosmetics and toilet articles
5231 Retail sale pharmaceutical and medical goods, cosmetics and toilet artciles
5232 Retail sale of textiles, clothing, footwear and leather goods
5232 Retail sale of textiles, clothing, footwear and leather goods
5233 Retail sale of household applicances, articles and equipment
5233 Retail sale of household appliances, articles and equipment
5234 Retail sale of hardware, paints and glass 5234 Retail sale of hardware, paints and glass5235 Retail sale of books,office and school supplies,
i l di d i5239 Other retail sale in specialized stores
5236 Retail sale of office machines and equioment, excluding computers, computer peripheral equipment and software
5237 Retail sale of liquified petroleum gas and other fuel products
5238 Agricultural supplies and equipment, retailing, fresh and artificial flowers and plants, retailing
5239 Other retail sale in specialized stores
524 5240 Retail sale of second-hand goods in stores 524 5240 Retail sale of second-hand goods in stores
525 Retail trade not in stores 525 Retail trade not in stores5251 Retail sale via mail/telephone order 5251 Retail sale via mail order houses5252 Retail sale via stalls and markets 5252 Retail sale via stalls and markets5259 Other non-store retail sale 5259 Other non-store retail sale
526 5260 Repair of personal and household goods 526 5260 Repair of personal and household goods
527 Retail sale of computers, computer peripheral equipment and software
5271 Retail sale of computers5272 Retail sale of computer peripheral equipment5273 Retail sale of computer softwares
528 Retail sale of cellular phones, parts and accessories5281 Retail sale of cellular phones, parts and accessories5289 Retail sale of other communications equipment
529 5290 Retail sale of audio and video equipment
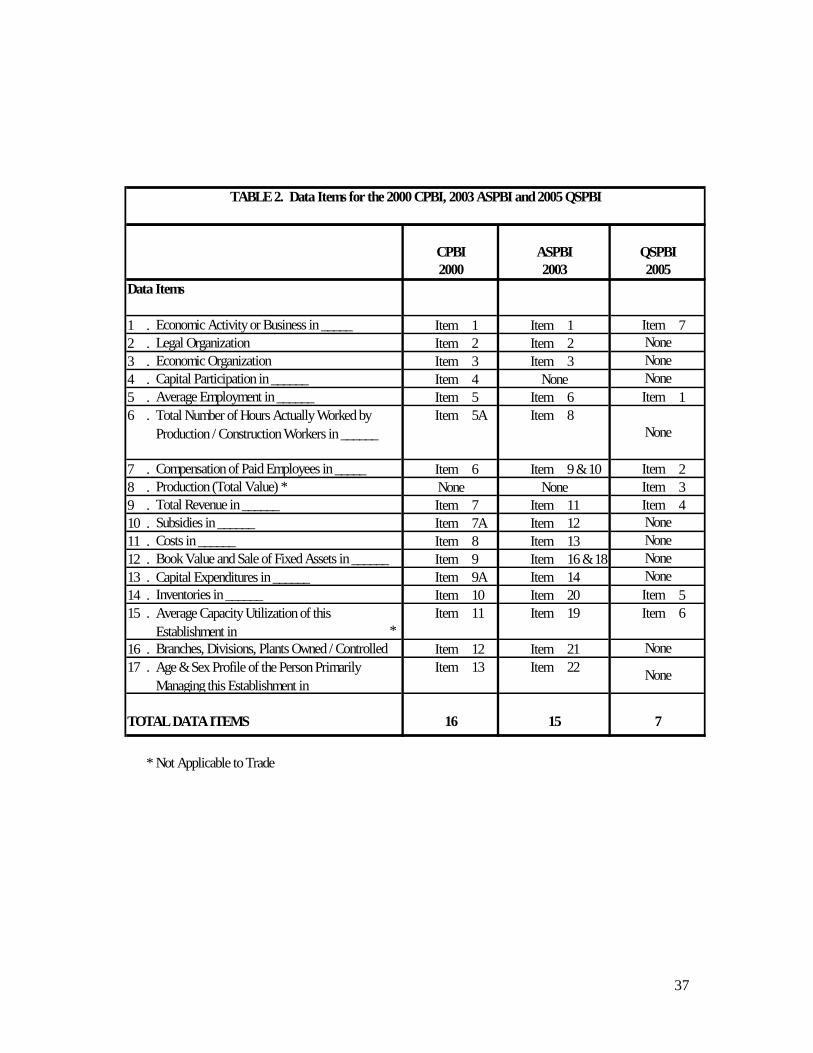
37
Data Items
1 . Economic Activity or Business in _____ Item 1 Item 1 Item 72 . Legal Organization Item 2 Item 23 . Economic Organization Item 3 Item 34 . Capital Participation in ______ Item 45 . Average Employment in ______ Item 5 Item 6 Item 16 . Total Number of Hours Actually Worked by
Production / Construction Workers in ______Item 5A Item 8
7 . Compensation of Paid Employees in _____ Item 6 Item 9 & 10 Item 28 . Production (Total Value) * Item 39 . Total Revenue in ______ Item 7 Item 11 Item 410 . Subsidies in ______ Item 7A Item 1211 . Costs in ______ Item 8 Item 1312 . Book Value and Sale of Fixed Assets in ______ Item 9 Item 16 & 1813 . Capital Expenditures in ______ Item 9A Item 1414 . Inventories in ______ Item 10 Item 20 Item 515 . Average Capacity Utilization of this
Establishment in *Item 11 Item 19 Item 6
16 . Branches, Divisions, Plants Owned / Controlled Item 12 Item 2117 . Age & Sex Profile of the Person Primarily
Managing this Establishment in Item 13 Item 22
TOTAL DATA ITEMS
* Not Applicable to Trade
16
TABLE 2. Data Items for the 2000 CPBI, 2003 ASPBI and 2005 QSPBI
None
15
None None
QSPBI2005
7
None
None
None
NoneNone
NoneNoneNoneNone
CPBI2000
None
ASPBI2003
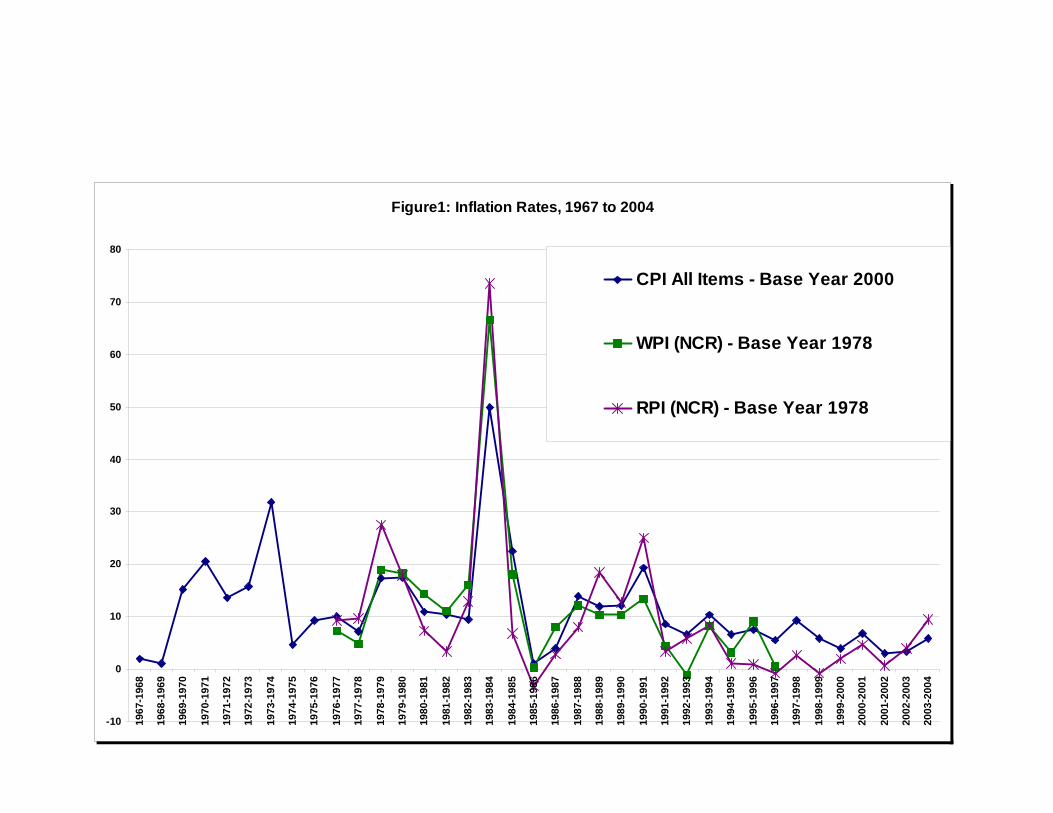
Figure1: Inflation Rates, 1967 to 2004
-10
0
10
20
30
40
50
60
70
80
1967
-196
8
1968
-196
9
1969
-197
0
1970
-197
1
1971
-197
2
1972
-197
3
1973
-197
4
1974
-197
5
1975
-197
6
1976
-197
7
1977
-197
8
1978
-197
9
1979
-198
0
1980
-198
1
1981
-198
2
1982
-198
3
1983
-198
4
1984
-198
5
1985
-198
6
1986
-198
7
1987
-198
8
1988
-198
9
1989
-199
0
1990
-199
1
1991
-199
2
1992
-199
3
1993
-199
4
1994
-199
5
1995
-199
6
1996
-199
7
1997
-199
8
1998
-199
9
1999
-200
0
2000
-200
1
2001
-200
2
2002
-200
3
2003
-200
4
CPI All Items - Base Year 2000
WPI (NCR) - Base Year 1978
RPI (NCR) - Base Year 1978
ACRONYMS ASE/ASPBI - Annual Survey of Establishments / Annual Survey of
Philippine Business and Industry ATE - Average Total Employment BAS - Bureau of Agricultural Statistics CE/CPBI - Census of Establishments / Census of Philippine Business
and Industry COA - Commission on Audit CPI - Consumer Price Index DTI - Department of Trade and Industry EO - Economic Organization GDP - Gross Domestic Product GNP - Gross National Product GOCC - Government-Owned and Controlled Corporation GVA - Gross Value Added IAC - Inter-Agency Committee IACTrS - Inter-Agency Committee on Trade Statistics ISIC - International Standard Industrial Classification of All
Economic Activities LE - List of Establishments LFS - Labor Force Survey NCR - National Capital Region NCS/NSM - National Convention on Statistics / National Statistics Month NSCB - National Statistical Coordination Board NSO - National Statistics Office PSDP - Philippine Statistical Development Program PSIC - Philippine Standard Industry Classification PSNA - Philippine System of National Accounts PSS - Philippine Statistical System QEI - Quarterly Economic Indices QSE/QSPBI - Quarterly Survey on Establishments / Quarterly Survey on
Philippine Business and Industry RPI - Retail Price Index SDS - System of Designated Statistics SEC - Securities and Exchange Commission SNA - System of National Accounts TC - Technical Committee TCSSC - Technical Committee on Statistical Standards and
Classifications WPI - Wholesale Price Index
40
REFERENCES [1] NATIONAL STATISTICAL COORDINATION BOARD, National Accounts of the
Philippines, various issues. [2] NATIONAL STATISTICAL COORDINATION BOARD, Philippine Standard
Industry Classification as amended. [3] NATIONAL STATISTICAL COORDINATION BOARD, Quarterly Economic
Indices of the Philippines, various issues. [4] NATIONAL STATISTICS OFFICE, Annual Survey of Philippine Business and
Industry, various issues. [5] NATIONAL STATISTICS OFFICE, Census of Philippine Business and Industry,
2000. [6] NATIONAL STATISTICS OFFICE, Quarterly Survey of Philippine Business and
Industry, various issues. [7] NATIONAL STATISTICS OFFICE, A Comparison of the General Wholesale Price
Index and General Retail Price Index. Presented on the Meeting of the Technical Working Group on Construction Materials, June 2005.
[8] SECURITIES AND EXCHANGE COMMISSION, Philippines Top 5000 Corporations, various issues.
[9] SYSTEM OF NATIONAL ACCOUNTS, 1993. [10] VIROLA, ROMULO A. Discussion Paper, National Experiences in the Quality [11] ASSESSMENT AND IMPROVEMENT OF STATISTICAL INPUTS AND
OUTPUTS, The Proceedings of Statistical Quality Seminar 2000, 6-8 December 2000, Jeju, Korea.
[12] VIROLA, ROMULO A., RAYMUNDO J. TALENTO, MINERVA D. MARTIN & RHEA JUNE S. LARA, Understanding and Improving the System of Price Statistics in the Philippines. Convention Papers, 9th National Convention on Statistics, EDSA Shangri-La Hotel, Mandaluyong City, Philippines, 4-5 October 2004.