Embed Size (px)
Citation preview
Diverse Communities – Exploring the Migrant and Refugee Experience
in New Zealand
Prepared by
Strategic Social Policy Group
July 2008
ISBN 978-0-478-33500-2 (Print) ISBN 978-0-478-33501-9 (Online)

1
Diverse Communities – Exploring the Migrant and Refugee Experience
in New Zealand Contents Introduction ........................................................................................................2 Chapter One: Statistical profile of the overseas-born
population in New Zealand ........................................................10 Chapter Two: Belonging ....................................................................................34 Chapter Three: Participation................................................................................46 Chapter Four: Inclusion......................................................................................61 Chapter Five: Recognition...............................................................................100 Chapter Six: Legitimacy.................................................................................110 Summary and conclusion ........................................................................................116
2
Introduction Why this report has been produced The Ministry of Social Development’s (MSD) Diverse Communities – Exploring the Migrant and Refugee Experience in New Zealand report brings together existing data and research findings on migrant and refugee outcomes in New Zealand, and highlights areas where those outcomes have potential impact on social cohesion. This is the first time in New Zealand that information of this kind has been brought together in one place. It is intended to help researchers and officials with planning for future areas of research. It may also be useful information for any future related policy work in this area. The report contains the most up-to-date data available, including data not previously published from the 2006 Census. This report describes issues in regard to settlement outcomes for migrants and refugees within the constraints of the available data.
New Zealand’s population is diverse reflecting waves of settlement over many centuries. Groups of migrants have included Polynesian settlers, Europeans such as the British and the Dutch, and people from the Pacific, East Asia (particularly China), and South Asia. The descendants of these people have lived in New Zealand for generations, some much longer than others. Ongoing migration flows up to the present time mean that New Zealand has populations of people born overseas who have migrated here, as well as diverse well-established communities who identify as New Zealanders. New Zealand also has a long history of accepting refugees, and currently has a quota for 750 refugees to move here each year. From the time following the arrival of Polynesians - who would go on to form the indigenous Māori population and its distinct culture - until about 1950, most people who migrated to New Zealand were from Britain and Ireland. There were also much smaller numbers of French, Dalmatians (many of whom worked in Northland’s gumfields) and Chinese (who were often gold miners in the Otago gold rush). Migrants also came to New Zealand from India from the 1800s. Many Dutch migrated to New Zealand in the 1950s; Pacific peoples in the 1960s and 1970s. Since 1986, after a reform to immigration policy, migration flows became more diverse. Since then, there has been a large flow of migrants from non-traditional source countries such as Korea, South Africa and Taiwan, significant increases in migrants from China and India as well as smaller flows from a number of Middle Eastern and African countries. Several waves of Pacific peoples and other Asian migrants, and those moving from countries such as Greece and Poland have also occurred since the immigration policy reforms of 1986. In terms of refugees, there were people who moved to New Zealand from Continental Europe post World War 2, a large in-flow of South East Asian refugees following the Vietnam war, and the arrival of refugees from diverse countries such as Somalia, Zimbabwe and Kosovo has been a feature since the early 1990s. Other settler societies including Australia, Canada, the United States (USA) and immigrant-receiving nations in Europe have also experienced similar culturally-diverse immigration flows as well as the challenges and benefits associated with the integration of migrants into society (McGrath et al 2005: 20).
3
Social cohesion – issues of definition At a broad level, a socially cohesive society can be viewed as one where people live together in harmony, where conflicts can be resolved and there is general support for government and the rule of law. The Committee for Social Cohesion (Council of Europe) defined it as "the capacity of a society to ensure the welfare of all its members, minimising disparities and avoiding polarisation. A cohesive society is a mutually supportive community of free individuals pursuing these common goals by democratic means”. Other approaches have been employed to delineate the concept of social cohesion, and there is no one approach that is universally recognised. The approach and definition used will often be relevant to the social and economic contexts in which the definition is being employed. Soroka et al (2006:7) outlined three common approaches.
• Social cohesion is rooted in shared values, a common sense of identity and a common body of norms adhered to by most people.
• Social cohesion requires widespread engagement and participation. This approach is based on the idea that, as contemporary societies are characterised by people who adhere to multiple identities and diverse values - common attitudes alone will not be sufficient to achieve social cohesion.
• Social cohesion is equated with social capital – a web of social networks and interpersonal trust that fosters cooperation between people and collective action.
Jane Jenson, a Canadian social theorist, mapped dimensions of social cohesion in the late 1990s. Jenson’s framework aligns with and extends the second approach to social cohesion outlined above. Jenson broke down the concept of social cohesion into the following dimensions, which were common themes across a number of earlier writings she examined (Jenson 1998):
• belonging (as opposed to isolation)
• participation (as opposed to non-involvement)
• inclusion (as opposed to exclusion)
• recognition (as opposed to rejection)
• legitimacy (as opposed to illegitimacy). This definition has been used in New Zealand by government officials in their work on settlement issues. It also formed the basis of the draft indicators framework to measure the impact of settlement outcomes on social cohesion (Peace et al 2005a), which this report uses as a base. MSD and the Reference Group (refer to page 6) agreed to use this framework to form the basis of this report. Why is it important to consider the relationship between settlement outcomes and social cohesion? People who were born overseas form an increasing proportion of New Zealand’s population. This has positive impacts such as filling gaps in the labour market and enriching connections, but there are also potential challenges to social cohesion that can arise through increased diversity. These challenges include impacts to economic and social wellbeing if some groups do not fare as well as others, and possible tension between different groups. In short, society is changing in significant ways due to the growth in the level of diversity, and it is therefore important to consider the relationship between settlement outcomes and social cohesion. It is also important to
4
consider this as a two-way relationship - immigration affects social cohesion and vice versa; and to be clear that immigration is not the only factor impacting on social cohesion. In 2006, 23% of people living in New Zealand were born overseas, which is in line with other settler societies such as Australia (24%) and Canada (18%). New Zealand continues to rely on immigration to replenish its labour and skills, contributing both to economic growth and to international trade. New Zealand also continues to accept refugees in accordance with its international commitments. There are many benefits that accrue to New Zealand from having a culturally diverse migrant population. For example, people with diverse linguistic and intercultural skills can help to maximise trade links with other countries, while cultural and ethnic diversity can contribute to innovative and productive workplaces, and can enrich everyday interactions and experiences (Singham 2006:37). A socially cohesive society gives New Zealand an edge in being able to attract skilled migrants at a time when there is increased global competition for labour. Social cohesion, particularly in terms of belonging and inclusion, also increases the likelihood of retaining migrants. Attracting and retaining migrants is increasingly important in a world where there is more mobility; New Zealand needs to maintain or increase the working-age population to buffer society against the ageing population. In 2006, the most common birthplace for overseas-born New Zealanders remained England by a significant margin over other birthplaces (more than 200,000 people). In terms of continents, Europe was most common by a margin of 70,000 people. However, New Zealand’s changed immigration flows since 1986 have resulted in people from a more diverse range of countries coming to live in New Zealand. In 2006, people who had migrated to New Zealand in the last 20 years from Asia outnumbered those who had migrated from Europe in the same time. Of people born overseas who had lived in New Zealand for 10 years or less in 2006, slightly more were from China than from England. A number of factors influence migrants’ and refugees’ settlement outcomes and the impact of settlement outcomes on social cohesion. Migrants who come to New Zealand differ from each other in terms of their education and skill levels, prior experiences, levels of English language proficiency, cultural background, ethnicity, personal motivation and attributes, and these will influence their settlement outcomes. The experiences of refugees are markedly different to that of migrants. Refugees generally have no choice about when and where they move to, will often have to leave family and friends behind very suddenly, and may have experienced persecution, war, torture, deprivation or civil unrest. Recent migrants may spend a considerable amount of their time finding a job and a place to live, learning how to access services, and in some cases, learning a new language (Ho et al 2000: 11). Consequently, they may have limited social networks, and little involvement with the non-migrant community. At all stages of settlement (and not limited to the first generation) migrants and refugees may experience negative attitudes or discrimination. This is particularly true for migrants who are “visibly different” (this includes dress appearance and symbols as well as skin colour). These negative experiences can lead migrants to feel excluded and unvalued. If left unresolved, these factors can impact negatively on social cohesion. Visible minority
The term “visible minority“ has been used by some countries, particularly Canada and occasionally in the United Kingdom, to denote “non-white” (and also non-aboriginal). In Canada, visible minorities are defined as "persons, other than aboriginal people who are non-
5
Caucasian in race or non-white in colour.” The term is generally used in reference to people who ‘look different’ and for that reason are potential subject to discrimination.
Karim H. Karim (1996) The Definition of Visible Minority: A Historical and Cultural Analysis Department of Canadian Heritage Some migrants experience poorer outcomes than other groups which can lead them to resent non-migrants. Poor outcomes may not be divisive if they are perceived to be the result of understandable circumstances, such as being new to New Zealand, or needing to learn English or upskill (Reitz and Banerjee 2007: 8). However, social cohesion can be put at risk if poor outcomes are consistently concentrated in a particular ethnic group, especially if they persist in subsequent generations. Migrants in this situation may feel that they have no opportunity to progress, leading to a feeling of not having a stake in society (Council of Europe 2005: 2). This can also hold for other visible minority groups, such as Māori, which also may perceive a lack of opportunity to progress. The situation may be exacerbated if migrants feel that they have not been given a “fair go”, for example, if they perceive discrimination has negatively affected their opportunities. Perceived discriminatory behaviour can lead to antagonism between groups (Reitz and Banerjee 2007: 8). In addition, the non-immigrant community may resent the public costs associated with support programmes for migrants who are disadvantaged. Conversely, the concentration of good economic and social outcomes within particular groups can also cause tension, especially if the people of a migrant or ethnic group live in the same area as each other and hence become more noticeable. Some people in the host community may view migrants as taking opportunities which they perceive as theirs, for example in terms of jobs, houses and businesses. Tensions may arise if host community groups perceive that newcomers are doing better than them, especially if established groups have experienced poorer outcomes for considerable periods of time. Over different periods there have been concerns aired about the impact of migrants on New Zealand society. These concerns tend to surface during periods of rapid social change (Soroka 2006: 2) such as large immigration flows over short periods of time. For example, in the 1970s there was a large influx of migrants to New Zealand from the Pacific, mainly to fill low-skilled employment vacancies. In the mid-1970s Pacific immigration was criticised and there was a campaign to find and deport Pacific Island overstayers in ‘dawn raids’ (Phillips 2007: 22). In the late 1990s, large Asian migration flows meant that the Asian population became more visible as it clustered together, especially in particular parts of Auckland. This led to some adverse media and political attention. However, it is not only visible migrants and their descendants who have suffered from negative reactions to their presence in New Zealand. British (white) migrants were harassed in the 1970s (Phillips 2007: 22). Despite these negative events, New Zealand compares relatively well with other countries in terms of migrant-related social cohesion. Social unrest on the scale of the 2005 Paris riots, the 2005 riots on Sydney’s beaches and local uprisings in the north of England in 2001 has not occurred in this country. However, as some occurrences in New Zealand demonstrate, social unrest similar to those overseas experiences of more recent times could also happen in this country. Examples include the divisions created during the Springbok tour of 1981, the anti-Vietnam war rallies in the 1960s and the occasional emergence of small-scale white supremacist groups in parts of New Zealand.
6
Social unrest is at the extreme end of a social cohesion problem. Less dramatic examples of social cohesion problems include:
• discrimination towards particular migrant groups
• a lack of participation by migrants in social, cultural and political life
• migrants belief that government institutions are not responsive to their needs. It is important to note again that migrant and refugee settlement is only one influence on social cohesion. Existing divisions, such as religious, ethnic or regional divisions can have more divisive impact on social cohesion than migration. Religious fundamentalism, racism which is not related to migration, and discrimination against particular groups in society for a variety of reasons can all contribute to a breakdown of social cohesion. Other factors that can impact on social cohesion in New Zealand include the Crown/Māori relationship, social and economic inequalities, ethnic and cultural intolerance and instances of social unrest. How can government have an impact on social cohesion? Government influences social cohesion in a number of ways, including assistance with settlement, immigration policy, employment policy, human rights legislation, justice policy and initiatives to improve intercultural relationships. More generic government programmes (which might also include areas such as employment and justice), while not aimed specifically at improving social cohesion, nevertheless can have a large impact. These include: encouraging economic growth; income redistribution through taxation and welfare; improving social and community wellbeing; social marketing; early childhood education; and schooling. However, much of what determines whether a society is cohesive depends on the nature of human relationships. Governments can help set the scene for greater tolerance and understanding, can establish systems and processes to respond to disruptions to social cohesion, but they also have limitations in terms of influencing the way individuals interact in a society. Examples of influences on social cohesion include:
• domestic events (examples include the Wellington Jewish cemetery desecrations, attacks on mosques in Auckland and Māori land disputes)
• the media’s portrayal of people and events, which can influence people’s perceptions of others
• attitudes and behaviours of some fundamentalist and white supremacist groups
• world events and people’s reaction to them (examples include the 11 September 2001 attacks in the USA, the 2002 and 2005 Bali bombings, and the depiction of the Prophet Mohammed in cartoons published internationally in 2005)
• the business sector’s approach to employing people from diverse backgrounds, and the ability of the labour market to incorporate newcomers. For example, in tighter job markets some employers may be more willing to employ immigrants than they would be otherwise.
Framework This report builds on the draft indicator framework for New Zealand on immigration and social cohesion developed by Peace, Spoonley, Butcher and O’Neill (2005). Using the framework set out in that paper, which is discussed in the following paragraphs, this report brings together current knowledge about issues facing migrants and refugees in New Zealand that relate to social cohesion. A reference
7
group comprising largely of people from government departments, academics and non-government organisations working in the area of immigration and research on migrants and refugees, provided valuable input on the material used. This group also gave critical feedback at various stages of the process. The report summarises findings from a wide range of sources, including official statistics, administrative data, surveys and qualitative research. The information available varies in terms of scale and scope. As will be seen in the report, there are differing levels of breadth of information available on outcomes that fit under each of the dimensions of social cohesion within the framework developed by Peace et al (2005). It is important to note there are different categories of migrants and refugees and that these different categories might have a bearing on settlement outcomes and integration. The current categories/streams are the Skilled Business Stream and Family Sponsored Stream1 and the International Humanitarian Stream2.
• Skilled Business Stream. This includes the Skilled Migrant Category (the main category in this stream), the Residence from Work categories and the Business Categories. The Skilled Migrant Category is a points-based policy allowing people to gain permanent residence if they have the skills, qualifications and experience to contribute economically and socially to New Zealand. The Business categories include Investor, Entrepreneur and Employees of Relocating Businesses categories. In November 2007, the 2005 Investor Category was replaced by the Active Investor Migrant policy. Under the new policy, investor migrants must actively contribute to New Zealand businesses, directly or indirectly.
• Family Sponsored Stream. This stream allows New Zealand citizens and residents to sponsor family members to live in New Zealand under certain circumstances. It includes spouses and partners, dependent children, parents, adult siblings and adult children of New Zealand residents and citizens.
• International Humanitarian Stream. Each year a number of people are accepted into New Zealand through the various categories within this stream, such as quota refugees (currently 750 people per year that the government is mandated to accept into New Zealand as part of its UN obligations), convention refugees (refugees who make successful claims for asylum status) and the Pacific Access Category (citizens accepted from Tonga, Tuvalu and Kiribati).
The report represents a first step in providing a picture of outcomes related to social cohesion for migrants and refugees in New Zealand. It tells a story of particular settlement outcomes using a variety of available data, in particular statistical data. It does not aim to offer detailed critical analysis of these outcomes for migrants and refugees as they relate to social cohesion, but rather the report is a step towards understanding these outcomes. This approach has meant that some important issues are not fully covered in this report. For example, while host community perspectives (including Māori perspectives) on migrants, refugees and immigration are touched on in part, this is not a key focus. We are also mindful that factors affecting social cohesion and issues for migrants and refugees, as well as host communities, are complex, nuanced and multi-faceted. What this report does provide is extensive information on outcomes for migrants and refugees, within the scope of available
1 From 2006/2007 Migration Trends report. 2 From www.immigration.co.nz
8
data, which can be used by those working in this area, such as researchers and academics. It will also be of general interest to a wider audience.
This report is intended to inform the future development of indicators in this area, help to identify gaps in the knowledge base, suggest potential areas for future research, and contribute to an understanding of social cohesion issues as they relate to migrants and refugees. Structure of the report The first chapter presents a demographic picture of the overseas-born population in New Zealand. It provides a good background overview of the population groups that are the focus for this report. Chapters 2 to 6 are organised around the five dimensions of social cohesion developed by Jenson (1998):
• belonging
• participation
• inclusion
• recognition
• legitimacy.
The report summarises findings of information available on the overseas-born population in relation to these five dimensions. Each chapter contains an overview which shows key findings related to that dimension followed by more detailed information. Each chapter concludes with ideas for possible future work along that particular dimension. Comparisons between the overseas-born population and the New Zealand-born population are made where information is available. A summary of each chapter and overall conclusions are included at the end of the report.
Limitations of the report As noted above, this report deals with migrants and refugees, and social cohesion is dependent on and impacted by many things other than migrants and refugees. The picture of diversity in this report is limited by the lack of comprehensive information available, and an obvious need to constrain the amount of detail in this one report. For example, other information which could be looked at in more detail includes outcomes for migrants and refugees at a regional and local level, host and migrant/refugee perceptions and interactions, comparisons with overseas experiences, and a consideration of outcomes for specific migrant groups which may have been under-researched to date. The second and subsequent generations may have similar experiences as the overseas-born. Some of those experiences may impact negatively on social cohesion. For example, the second and subsequent generation may also experience discrimination or find that their health, education and social outcomes remain below the New Zealand average despite a New Zealand upbringing. Some of the chapters do not include specific information on second and subsequent generation outcomes in this report. This is generally because few New Zealand data sources record the birthplace of parents or grandparents. As an example, census data does not differentiate between the different generations of New Zealand-born people, so it is difficult to differentiate outcomes for these groups, or to compare outcomes with New Zealand-born or first generation migrants at any robust level. While the census provides good information on birthplace and length of residence, sources outside the census are often based on insufficiently large samples to break down birthplace information or to focus on a particular ethnicity. The lack of data
9
means that proxies for overseas-born and New Zealand-born populations need to be used where there is no better alternative. The most common proxies used in this report are ethnic group and birthplace. The quantitative data presented in this report generally shows the average (or mean) value for the population group described. Within each population group there tends to be a diverse range of outcomes, which is obscured by the average or aggregated information. This is particularly true of large-spanning categories such as “Asian”. Outcomes for refugees can also vary widely, while also differing from other migrants and the New Zealand-born population. Wherever possible, this report provides outcomes for different groups at a country-specific level, to provide more information about the different groups of people in New Zealand. Social cohesion can also be viewed at different levels, for example, at the national or regional level or at the level of the community or neighbourhood. When judging the state of social cohesion it is useful to have information that reflects what is happening at the local or micro-level (Peace et al 2005b: 15). In some sections, the report cites a great deal of qualitative information (eg micro-level studies that examine the experiences of particular migrant groups). Qualitative information, such as studies on the experiences of different migrant groups, can be useful in providing an insight into migrants’ experiences, as well as their interactions and relationships with others. It can provide some depth to supplement quantitative information and a particular point of focus not available with national level data. The drawback of smaller qualitative studies is that information on the experiences of particular migrant groups may not accurately reflect the experiences of the wider group or of migrants in general. However, inclusion of both quantitative and qualitative information in this report means that the report paints a richer picture than would otherwise be possible. A person’s country of origin is only one factor which influences their outcomes. While this report focuses heavily in some places on birthplace and ethnic group, other factors such as gender, education levels, age, and individual characteristics all affect both individual outcomes and social cohesion. These other factors are also explored in this report where data is available. Finally, a disruption to social cohesion can be triggered by events that are unexpected or unpredictable such as a natural disaster. The report does not attempt to capture these ‘triggers’, although it may provide some insight into where there is a risk of divisions occurring.
10
Chapter One: A Statistical Profile of the Overseas-born Population of New Zealand Overview
• This section provides an overview of the demographic attributes of the overseas-born population that resides in New Zealand by drawing on census data.
• In 2006, overseas-born people comprise 23% of the New Zealand population – the highest since 1926.
• In 2005, New Zealand was estimated to have the fourth highest percentage of overseas-born people in the OECD.
• The overseas-born population: o has grown by 180,000 people between the 2001 and 2006 Censuses o increasingly comprises a higher percentage of people from countries
outside the United Kingdom (UK), such as China, India, South Africa and Korea
o who had been residing in New Zealand for less than 10 years in 2006, was comprised of 54% of people born in Asia, Africa and the Middle East, compared to Europe’s 23%
o from the UK is still significant and accounted for 26% of New Zealand’s resident approvals in 2006/2007 – double any other country.
• The overseas-born population increases ethnic and religious diversity. o In 2006, only 52% of the overseas-born population are European or
Mäori, while 32% are Asian. Only 3% of New Zealand-born population are Asian.
o Immigration since 1991 has led to significant increases in the Chinese, Indian, Korean, South African and Filipino ethnic groups.
o Non-Christian religions (Buddhist, Hindu, Muslim and Judaism) have experienced significant growth between 1991 and 2006, largely due to migration, but overall in 2006 these religions accounted for only 6% of people’s religious affiliations.
• The overseas-born population has a median age of 40 years compared to 33 years for New Zealand-born.
• “Feminised” migration flows from some Eastern European and Asian countries, contribute to a gender imbalance in the census population among people aged 25–44 years.
• Recent migrants aged 25–44 years are more likely to live in couple with children households or multi-family households than New Zealand-born people.
• In 2006, the overseas-born population were concentrated at higher levels in the Auckland and Wellington regions (52% and 11.4%) than the New Zealand-born population (26% and 11.2%).
o People born in Tonga, Fiji, India, Samoa, China, Korea and South Africa are highly concentrated in Auckland.
o Although regions outside Auckland and Wellington do not have concentrations of total migrants in excess of their percentage of the New Zealand-born population, some migrant groups, such as Japanese in Canterbury, are over-represented in these regions.
11
Introduction This section presents a range of demographic data to develop a picture of the overseas-born population that has migrated to, and continues to reside in, New Zealand. Birthplace, length of residence, ethnicity, religion, age and region of residence within New Zealand of the overseas-born population are some of the demographic characteristics examined. The majority of the demographic information in this chapter comes from the census. Immigration status is not recorded in the census, and for this reason being born overseas is used as a proxy for immigrants to New Zealand. Overseas-born is not a perfect proxy for immigrants, as the overseas-born population will also include:
• some people born overseas who are New Zealand citizens • migrants that have moved to New Zealand temporarily for a short-duration
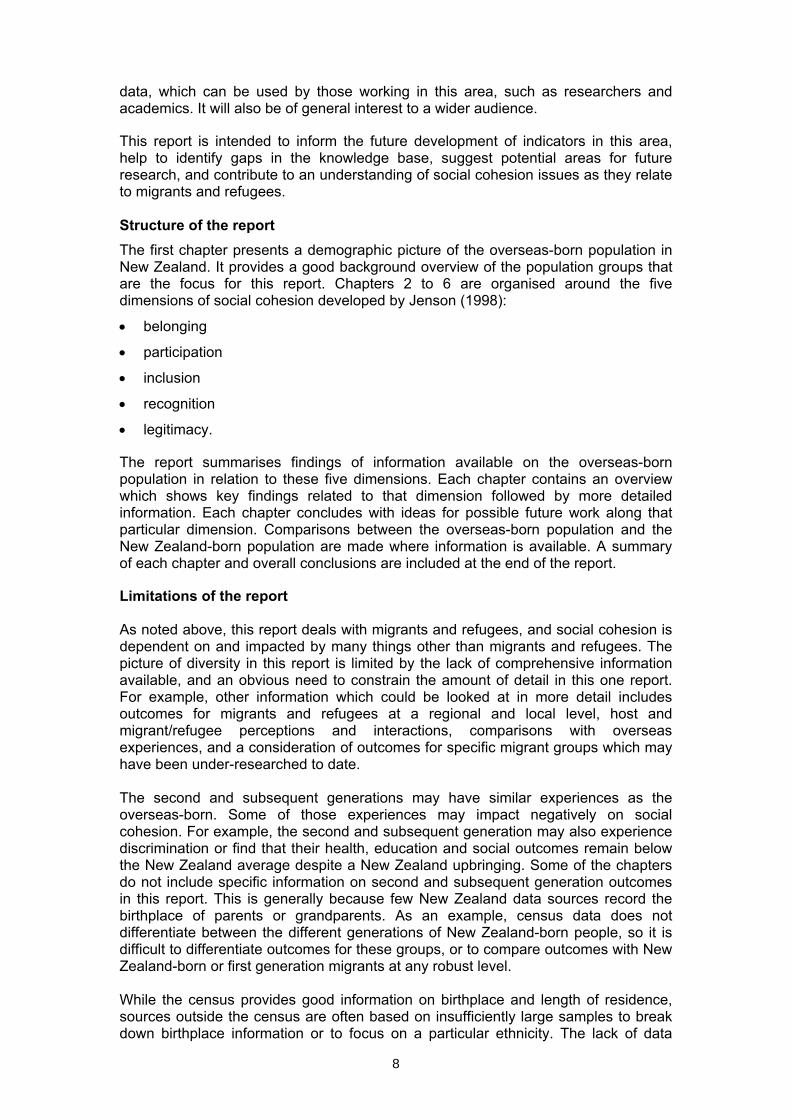
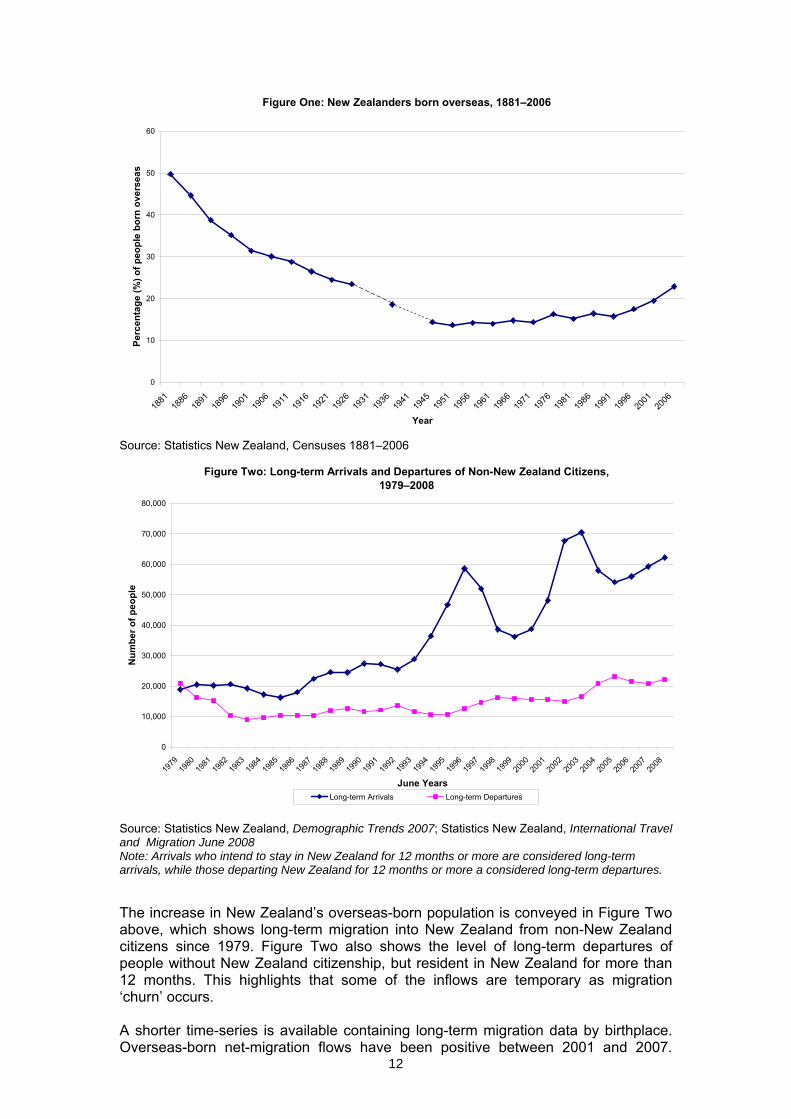
only. The census guidelines state that only people from overseas who are staying in New Zealand for more than 12 months should provide a New Zealand address and be considered in the ‘usually resident population’. Therefore, the usually resident population may include temporary migrants who intend to stay over one year for study or employment. It should be noted that the New Zealand-born population could also include people who have spent a very small amount of time in New Zealand, despite it being their birthplace. The overseas-born population The proportion of the New Zealand population born overseas has increased since 1991 from 15.8% to 22.9% in 2006.3 The increase is a result of higher net-migration of overseas-born people, particularly within the last 15 years. Almost two-thirds of the overseas-born population in 2006 had arrived in New Zealand within the last 20 years. The rest of this section provides further information on the growth of New Zealand’s overseas-born population. The proportion of New Zealand’s population born overseas was high during New Zealand’s first years of European settlement, but gradually fell until 1945, as seen in Figure One (next page). In the post-WWII years, the overseas-born population increased in terms of numbers, but remained steady as a percentage of the population due to expansion in the New Zealand-born population. Between 1971 and 1991 the overseas-born increased slightly, as a proportion of the population, but with some fluctuations. Since 1991, the overseas-born population has increased from 15.8% (570,000) to 22.9% (880,000) in 2006 – the highest level since 1926. Between 2001 and 2006 large immigration flows increased the overseas-born population by 180,000 people or 3.4 percentage points of the total New Zealand population (19.5% in 2001; 22.9% in 2006). A large proportion of people born overseas have been in New Zealand for 20 years or less. From the 2006 Census, 567,700 people, or 14% of the population, who resided in New Zealand had migrated to New Zealand since 1986. In 2005, New Zealand had the fourth highest percentage of overseas-born people in the Organisation for Economic Development (OECD), behind Luxembourg (33%), Australia (24%) and Switzerland (24%). The OECD data is based on population census data from around the year 2000 and then projected for 2005. Using 2006 Census data from Australia and New Zealand, New Zealand (22.9%) has a higher proportion of people born overseas than Australia (22.2%).
3 The percentages given are of those responding to the census birthplace question. In 2006, 188,000 people did not respond or gave an inadequate answer.
12
Figure One: New Zealanders born overseas, 1881–2006
0
10
20
30
40
50
60
1881
1886
1891
1896
1901
1906
1911
1916
1921
1926
1931
1936
1941
1945
1951
1956
1961
1966
1971
1976
1981
1986
1991
1996
2001
2006
Year
Perc
enta
ge (%
) of p
eopl
e bo
rn o
vers
eas
Source: Statistics New Zealand, Censuses 1881–2006
Figure Two: Long-term Arrivals and Departures of Non-New Zealand Citizens, 1979–2008
0
10,000
20,000
30,000
40,000
50,000
60,000
70,000
80,000
1979
1980
1981
1982
1983
1984
1985
1986
1987
1988
1989
1990
1991
1992
1993
1994
1995
1996
1997
1998
1999
2000
2001
2002
2003
2004
2005
2006
2007
2008
June Years
Num
ber o
f peo
ple
Long-term Arrivals Long-term Departures Source: Statistics New Zealand, Demographic Trends 2007; Statistics New Zealand, International Travel and Migration June 2008 Note: Arrivals who intend to stay in New Zealand for 12 months or more are considered long-term arrivals, while those departing New Zealand for 12 months or more a considered long-term departures. The increase in New Zealand’s overseas-born population is conveyed in Figure Two above, which shows long-term migration into New Zealand from non-New Zealand citizens since 1979. Figure Two also shows the level of long-term departures of people without New Zealand citizenship, but resident in New Zealand for more than 12 months. This highlights that some of the inflows are temporary as migration ‘churn’ occurs. A shorter time-series is available containing long-term migration data by birthplace. Overseas-born net-migration flows have been positive between 2001 and 2007.
13
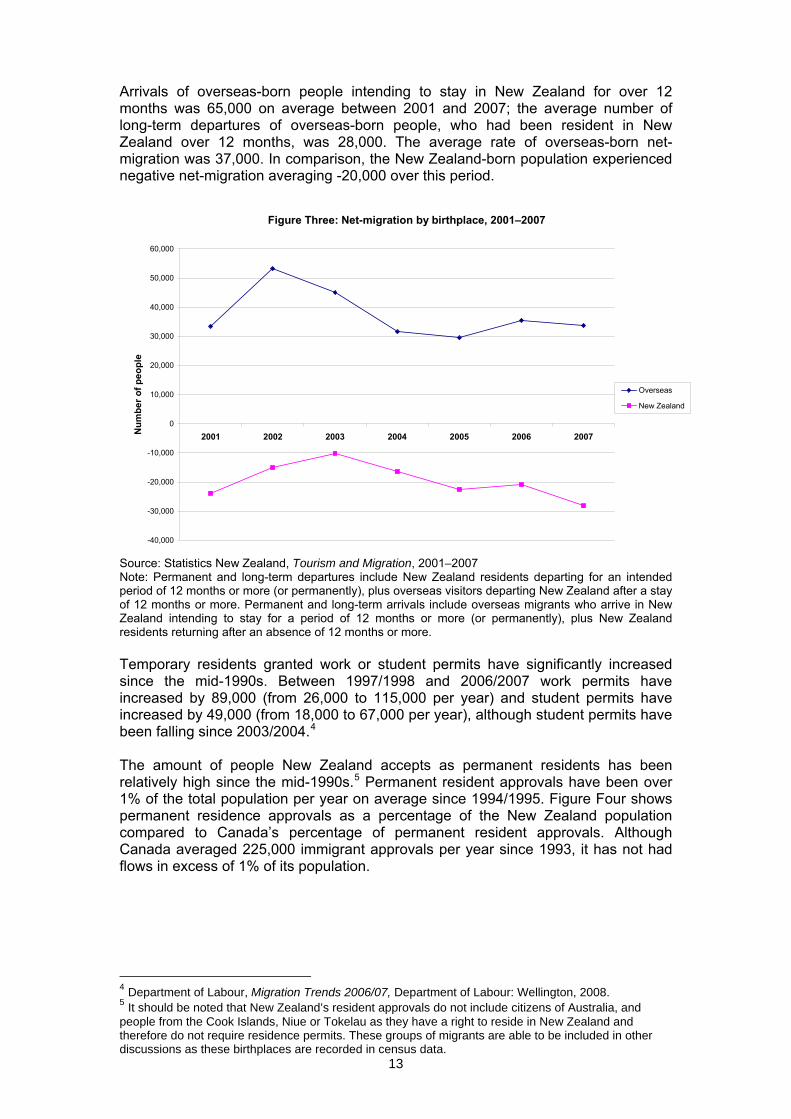
Arrivals of overseas-born people intending to stay in New Zealand for over 12 months was 65,000 on average between 2001 and 2007; the average number of long-term departures of overseas-born people, who had been resident in New Zealand over 12 months, was 28,000. The average rate of overseas-born net-migration was 37,000. In comparison, the New Zealand-born population experienced negative net-migration averaging -20,000 over this period.
Figure Three: Net-migration by birthplace, 2001–2007
-40,000
-30,000
-20,000
-10,000
0
10,000
20,000
30,000
40,000
50,000
60,000
2001 2002 2003 2004 2005 2006 2007Num
ber o
f peo
ple
Overseas
New Zealand
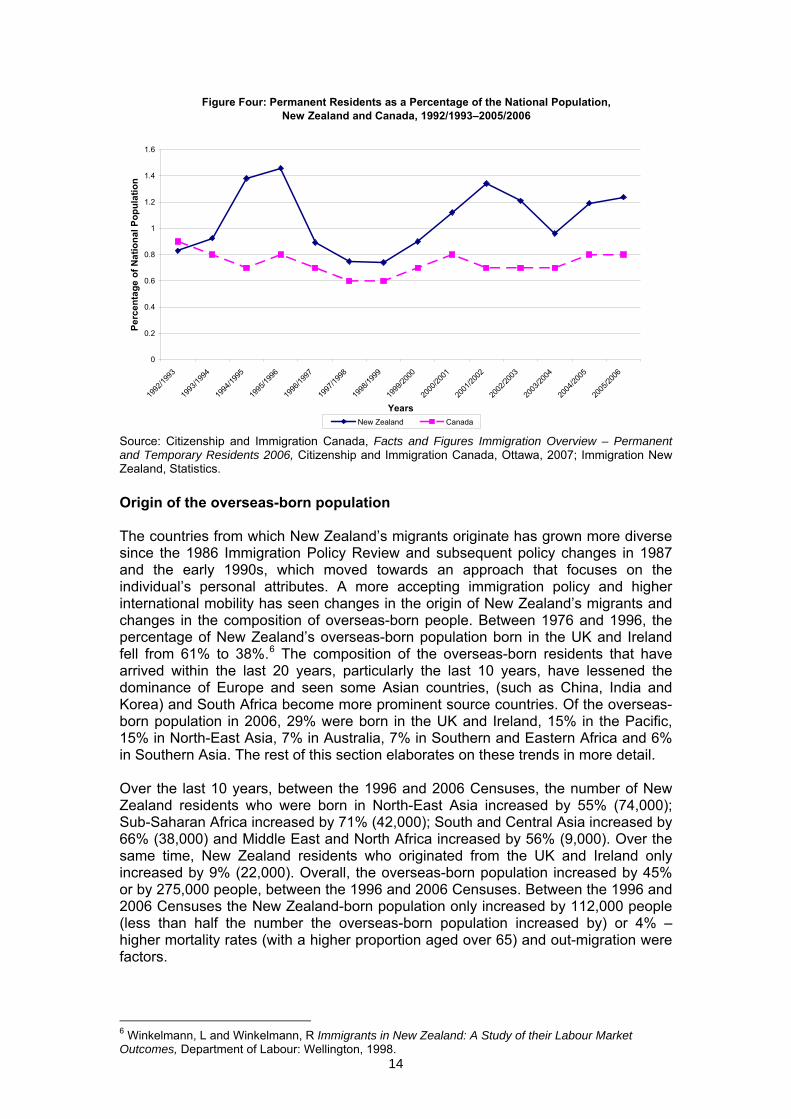
Source: Statistics New Zealand, Tourism and Migration, 2001–2007 Note: Permanent and long-term departures include New Zealand residents departing for an intended period of 12 months or more (or permanently), plus overseas visitors departing New Zealand after a stay of 12 months or more. Permanent and long-term arrivals include overseas migrants who arrive in New Zealand intending to stay for a period of 12 months or more (or permanently), plus New Zealand residents returning after an absence of 12 months or more. Temporary residents granted work or student permits have significantly increased since the mid-1990s. Between 1997/1998 and 2006/2007 work permits have increased by 89,000 (from 26,000 to 115,000 per year) and student permits have increased by 49,000 (from 18,000 to 67,000 per year), although student permits have been falling since 2003/2004.4 The amount of people New Zealand accepts as permanent residents has been relatively high since the mid-1990s.5 Permanent resident approvals have been over 1% of the total population per year on average since 1994/1995. Figure Four shows permanent residence approvals as a percentage of the New Zealand population compared to Canada’s percentage of permanent resident approvals. Although Canada averaged 225,000 immigrant approvals per year since 1993, it has not had flows in excess of 1% of its population.
4 Department of Labour, Migration Trends 2006/07, Department of Labour: Wellington, 2008. 5 It should be noted that New Zealand’s resident approvals do not include citizens of Australia, and people from the Cook Islands, Niue or Tokelau as they have a right to reside in New Zealand and therefore do not require residence permits. These groups of migrants are able to be included in other discussions as these birthplaces are recorded in census data.
14
Figure Four: Permanent Residents as a Percentage of the National Population, New Zealand and Canada, 1992/1993–2005/2006
0
0.2
0.4
0.6
0.8
1
1.2
1.4
1.6
1992
/1993
1993
/1994
1994
/1995
1995
/1996
1996
/1997
1997
/1998
1998
/1999
1999
/2000
2000
/2001
2001
/2002
2002
/2003
2003
/2004
2004
/2005
2005
/2006
Years
Perc
enta
ge o
f Nat
iona
l Pop
ulat
ion
New Zealand Canada Source: Citizenship and Immigration Canada, Facts and Figures Immigration Overview – Permanent and Temporary Residents 2006, Citizenship and Immigration Canada, Ottawa, 2007; Immigration New Zealand, Statistics. Origin of the overseas-born population The countries from which New Zealand’s migrants originate has grown more diverse since the 1986 Immigration Policy Review and subsequent policy changes in 1987 and the early 1990s, which moved towards an approach that focuses on the individual’s personal attributes. A more accepting immigration policy and higher international mobility has seen changes in the origin of New Zealand’s migrants and changes in the composition of overseas-born people. Between 1976 and 1996, the percentage of New Zealand’s overseas-born population born in the UK and Ireland fell from 61% to 38%.6 The composition of the overseas-born residents that have arrived within the last 20 years, particularly the last 10 years, have lessened the dominance of Europe and seen some Asian countries, (such as China, India and Korea) and South Africa become more prominent source countries. Of the overseas-born population in 2006, 29% were born in the UK and Ireland, 15% in the Pacific, 15% in North-East Asia, 7% in Australia, 7% in Southern and Eastern Africa and 6% in Southern Asia. The rest of this section elaborates on these trends in more detail. Over the last 10 years, between the 1996 and 2006 Censuses, the number of New Zealand residents who were born in North-East Asia increased by 55% (74,000); Sub-Saharan Africa increased by 71% (42,000); South and Central Asia increased by 66% (38,000) and Middle East and North Africa increased by 56% (9,000). Over the same time, New Zealand residents who originated from the UK and Ireland only increased by 9% (22,000). Overall, the overseas-born population increased by 45% or by 275,000 people, between the 1996 and 2006 Censuses. Between the 1996 and 2006 Censuses the New Zealand-born population only increased by 112,000 people (less than half the number the overseas-born population increased by) or 4% – higher mortality rates (with a higher proportion aged over 65) and out-migration were factors.
6 Winkelmann, L and Winkelmann, R Immigrants in New Zealand: A Study of their Labour Market Outcomes, Department of Labour: Wellington, 1998.
15
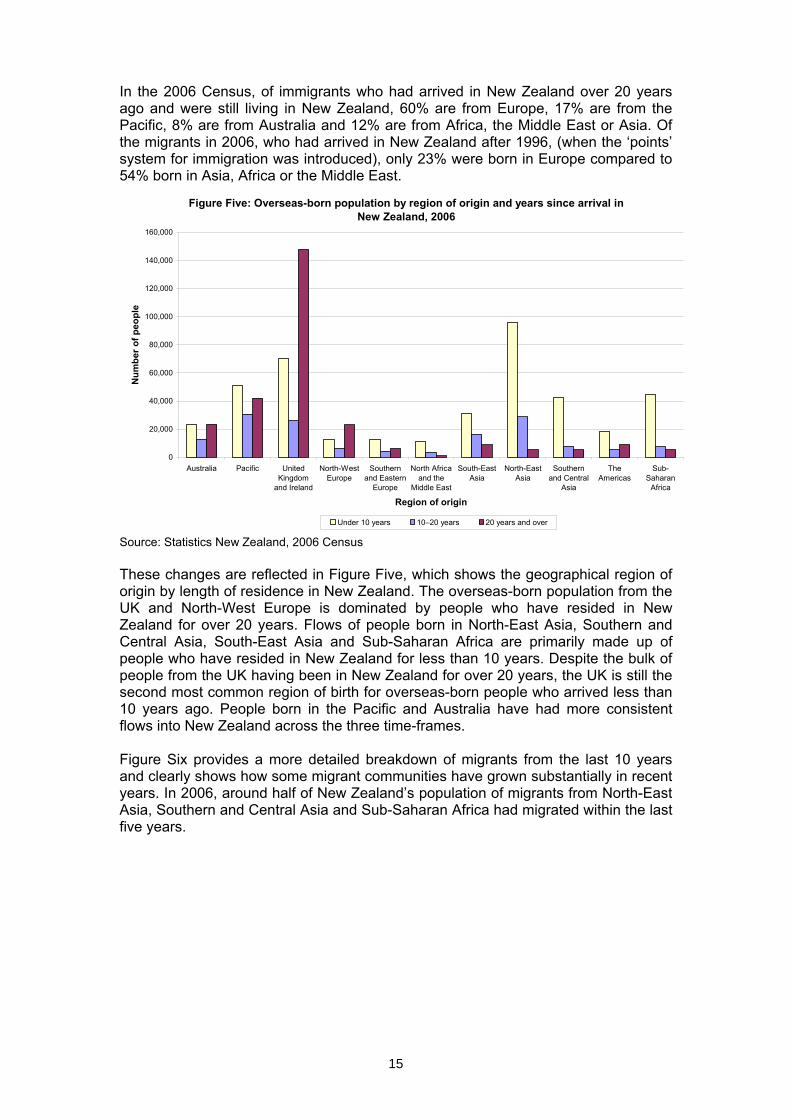
In the 2006 Census, of immigrants who had arrived in New Zealand over 20 years ago and were still living in New Zealand, 60% are from Europe, 17% are from the Pacific, 8% are from Australia and 12% are from Africa, the Middle East or Asia. Of the migrants in 2006, who had arrived in New Zealand after 1996, (when the ‘points’ system for immigration was introduced), only 23% were born in Europe compared to 54% born in Asia, Africa or the Middle East.
Figure Five: Overseas-born population by region of origin and years since arrival in New Zealand, 2006
0
20,000
40,000
60,000
80,000
100,000
120,000
140,000
160,000
Australia Pacific UnitedKingdom
and Ireland
North-WestEurope
Southernand Eastern
Europe
North Africaand the
Middle East
South-EastAsia
North-EastAsia
Southernand Central
Asia
TheAmericas
Sub-Saharan
Africa
Region of origin
Num
ber o
f peo
ple
Under 10 years 10–20 years 20 years and over
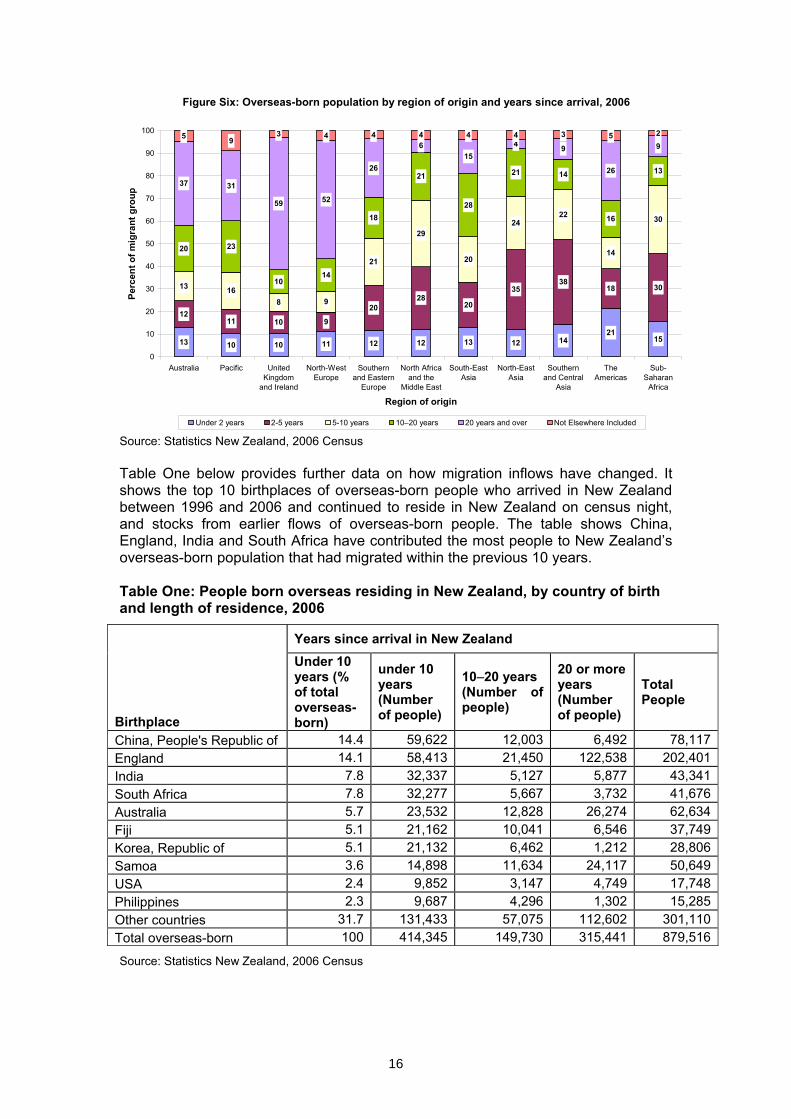
Source: Statistics New Zealand, 2006 Census These changes are reflected in Figure Five, which shows the geographical region of origin by length of residence in New Zealand. The overseas-born population from the UK and North-West Europe is dominated by people who have resided in New Zealand for over 20 years. Flows of people born in North-East Asia, Southern and Central Asia, South-East Asia and Sub-Saharan Africa are primarily made up of people who have resided in New Zealand for less than 10 years. Despite the bulk of people from the UK having been in New Zealand for over 20 years, the UK is still the second most common region of birth for overseas-born people who arrived less than 10 years ago. People born in the Pacific and Australia have had more consistent flows into New Zealand across the three time-frames. Figure Six provides a more detailed breakdown of migrants from the last 10 years and clearly shows how some migrant communities have grown substantially in recent years. In 2006, around half of New Zealand’s population of migrants from North-East Asia, Southern and Central Asia and Sub-Saharan Africa had migrated within the last five years.
16
Figure Six: Overseas-born population by region of origin and years since arrival, 2006
13 10 10 11 12 12 13 12 1421
15
1211 10 9
2028
20
3538
18 3013 168 9
21
29
20
2422
14
30
20 23
1014
18
21
28
21 14
16
1337 31
59 52
26
615
4 9
26
95 9
3 4 4 4 4 4 3 5 2
0
10
20
30
40
50
60
70
80
90
100
Australia Pacific UnitedKingdom
and Ireland
North-WestEurope
Southernand Eastern
Europe
North Africaand the
Middle East
South-EastAsia
North-EastAsia
Southernand Central
Asia
TheAmericas
Sub-Saharan
Africa
Region of origin
Perc
ent o
f mig
rant
gro
up
Under 2 years 2-5 years 5-10 years 10–20 years 20 years and over Not Elsewhere Included Source: Statistics New Zealand, 2006 Census Table One below provides further data on how migration inflows have changed. It shows the top 10 birthplaces of overseas-born people who arrived in New Zealand between 1996 and 2006 and continued to reside in New Zealand on census night, and stocks from earlier flows of overseas-born people. The table shows China, England, India and South Africa have contributed the most people to New Zealand’s overseas-born population that had migrated within the previous 10 years. Table One: People born overseas residing in New Zealand, by country of birth and length of residence, 2006
Years since arrival in New Zealand
Birthplace
Under 10 years (% of total overseas-born)
under 10 years (Number of people)
10–20 years (Number of people)
20 or more years (Number of people)
Total People
China, People's Republic of 14.4 59,622 12,003 6,492 78,117England 14.1 58,413 21,450 122,538 202,401India 7.8 32,337 5,127 5,877 43,341South Africa 7.8 32,277 5,667 3,732 41,676Australia 5.7 23,532 12,828 26,274 62,634Fiji 5.1 21,162 10,041 6,546 37,749Korea, Republic of 5.1 21,132 6,462 1,212 28,806Samoa 3.6 14,898 11,634 24,117 50,649USA 2.4 9,852 3,147 4,749 17,748Philippines 2.3 9,687 4,296 1,302 15,285Other countries 31.7 131,433 57,075 112,602 301,110Total overseas-born 100 414,345 149,730 315,441 879,516
Source: Statistics New Zealand, 2006 Census
17
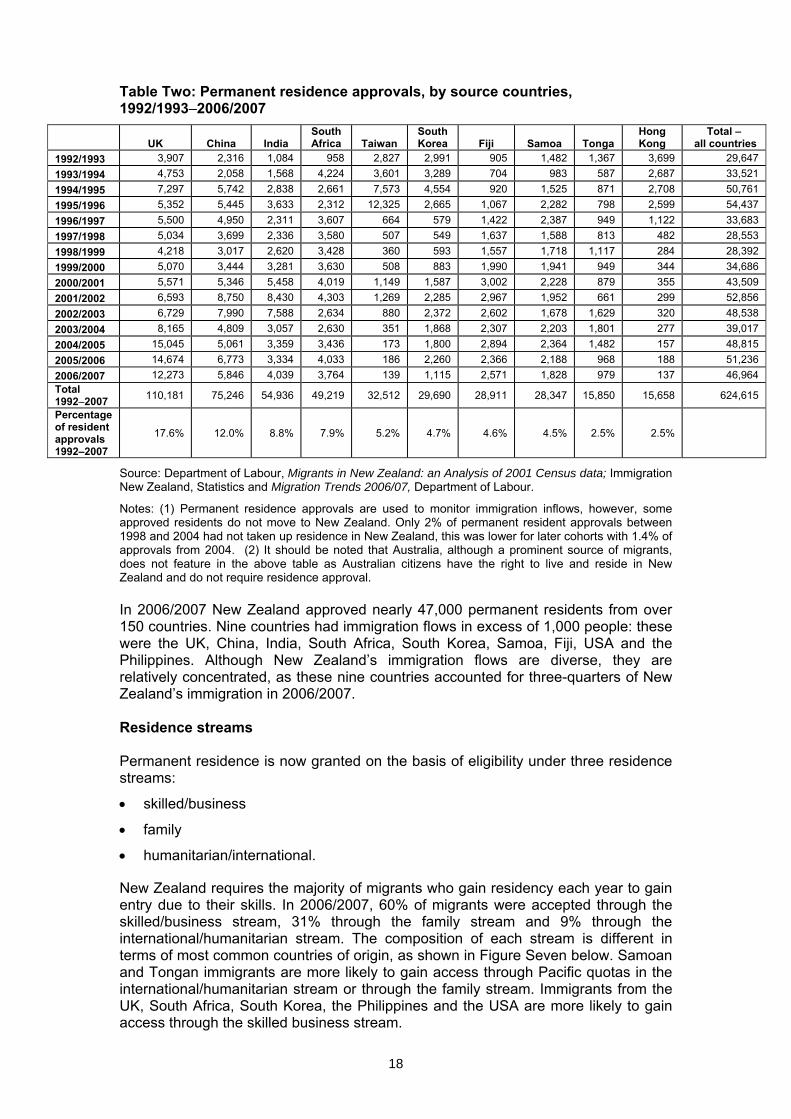
Inflows and outflows of the overseas-born population Higher levels of interconnectedness in terms of business and skills, technology improving travel and communications and more open immigration policies have aided inflows into New Zealand, but these factors can also aid people to be more transient. Inflows, in the form of permanent residents, into New Zealand, have been over 30,000 per year since 1992/1993, with the exception of 1997/1998 and 1998/1999. In the five years ending 2006/2007, on average 47,000 people were granted permanent residence in New Zealand per year. Although these flows are diverse, they are concentrated among a few countries. Temporary migrants have been increasing, particularly those in New Zealand for work. Transient global trends and other opportunities also see migrants leave New Zealand. It is estimated that 25% of migrants who moved to New Zealand in 1998 had been absent from New Zealand for over 6 months at the end of 2006. The following sections look at the inflows and outflows in more detail. Inflows Despite increasing diversity among permanent residence flows into New Zealand from countries such as China, India, South Africa Taiwan and South Korea migration from the UK still remains relatively strong. Since 2003/2004, when English skills were given a higher priority in the immigration points system, the UK has again been the biggest contributor to New Zealand’s immigration flows in terms of permanent resident approvals. In 2004/2005 the UK accounted for almost a third of New Zealand’s immigrants – triple any other country, while in 2005/2006 the UK accounted for 29% of all permanent residence approvals, and 26% in 2006/2007. Only in 1994/1995 and 1995/1996, where Taiwan had the highest permanent residence approvals, and 2001/2002 and 2002/2003, where China and India both had higher permanent residence approvals, has the UK been surpassed as New Zealand’s highest contributor of permanent residents. The Pacific countries of Samoa, Fiji and Tonga have also remained a steady contributor, in terms of numbers but have been surpassed by the new Asian contributors.
18
Table Two: Permanent residence approvals, by source countries, 1992/1993–2006/2007
UK China India South Africa Taiwan
South Korea Fiji Samoa Tonga
Hong Kong
Total – all countries
1992/1993 3,907 2,316 1,084 958 2,827 2,991 905 1,482 1,367 3,699 29,647 1993/1994 4,753 2,058 1,568 4,224 3,601 3,289 704 983 587 2,687 33,521 1994/1995 7,297 5,742 2,838 2,661 7,573 4,554 920 1,525 871 2,708 50,761 1995/1996 5,352 5,445 3,633 2,312 12,325 2,665 1,067 2,282 798 2,599 54,437 1996/1997 5,500 4,950 2,311 3,607 664 579 1,422 2,387 949 1,122 33,683 1997/1998 5,034 3,699 2,336 3,580 507 549 1,637 1,588 813 482 28,553 1998/1999 4,218 3,017 2,620 3,428 360 593 1,557 1,718 1,117 284 28,392 1999/2000 5,070 3,444 3,281 3,630 508 883 1,990 1,941 949 344 34,686 2000/2001 5,571 5,346 5,458 4,019 1,149 1,587 3,002 2,228 879 355 43,509 2001/2002 6,593 8,750 8,430 4,303 1,269 2,285 2,967 1,952 661 299 52,856 2002/2003 6,729 7,990 7,588 2,634 880 2,372 2,602 1,678 1,629 320 48,538 2003/2004 8,165 4,809 3,057 2,630 351 1,868 2,307 2,203 1,801 277 39,017 2004/2005 15,045 5,061 3,359 3,436 173 1,800 2,894 2,364 1,482 157 48,815 2005/2006 14,674 6,773 3,334 4,033 186 2,260 2,366 2,188 968 188 51,236 2006/2007 12,273 5,846 4,039 3,764 139 1,115 2,571 1,828 979 137 46,964 Total 1992–2007 110,181 75,246 54,936 49,219 32,512 29,690 28,911 28,347 15,850 15,658 624,615
Percentage of resident approvals 1992–2007
17.6% 12.0% 8.8% 7.9% 5.2% 4.7% 4.6% 4.5% 2.5% 2.5%
Source: Department of Labour, Migrants in New Zealand: an Analysis of 2001 Census data; Immigration New Zealand, Statistics and Migration Trends 2006/07, Department of Labour.
Notes: (1) Permanent residence approvals are used to monitor immigration inflows, however, some approved residents do not move to New Zealand. Only 2% of permanent resident approvals between 1998 and 2004 had not taken up residence in New Zealand, this was lower for later cohorts with 1.4% of approvals from 2004. (2) It should be noted that Australia, although a prominent source of migrants, does not feature in the above table as Australian citizens have the right to live and reside in New Zealand and do not require residence approval. In 2006/2007 New Zealand approved nearly 47,000 permanent residents from over 150 countries. Nine countries had immigration flows in excess of 1,000 people: these were the UK, China, India, South Africa, South Korea, Samoa, Fiji, USA and the Philippines. Although New Zealand’s immigration flows are diverse, they are relatively concentrated, as these nine countries accounted for three-quarters of New Zealand’s immigration in 2006/2007. Residence streams Permanent residence is now granted on the basis of eligibility under three residence streams:
• skilled/business
• family
• humanitarian/international.
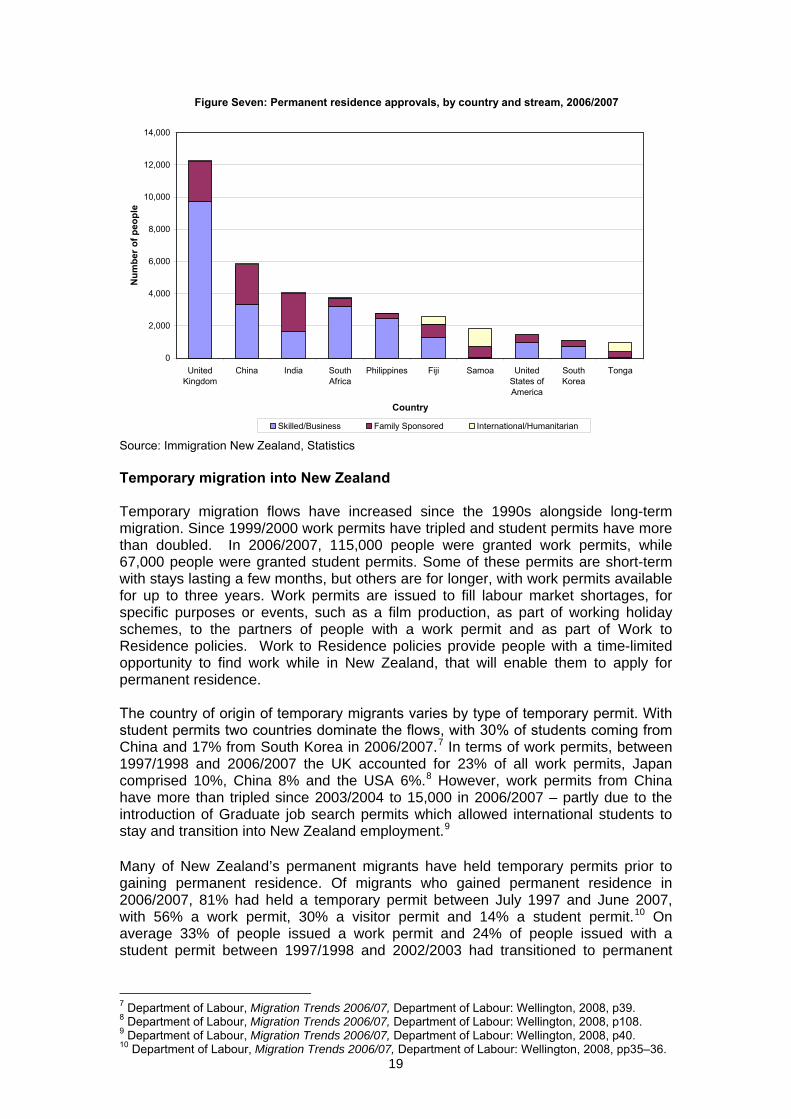
New Zealand requires the majority of migrants who gain residency each year to gain entry due to their skills. In 2006/2007, 60% of migrants were accepted through the skilled/business stream, 31% through the family stream and 9% through the international/humanitarian stream. The composition of each stream is different in terms of most common countries of origin, as shown in Figure Seven below. Samoan and Tongan immigrants are more likely to gain access through Pacific quotas in the international/humanitarian stream or through the family stream. Immigrants from the UK, South Africa, South Korea, the Philippines and the USA are more likely to gain access through the skilled business stream.
19
Figure Seven: Permanent residence approvals, by country and stream, 2006/2007
0
2,000
4,000
6,000
8,000
10,000
12,000
14,000
UnitedKingdom
China India SouthAfrica
Philippines Fiji Samoa UnitedStates ofAmerica
SouthKorea
Tonga
Country
Num
ber o
f peo
ple
Skilled/Business Family Sponsored International/Humanitarian Source: Immigration New Zealand, Statistics Temporary migration into New Zealand Temporary migration flows have increased since the 1990s alongside long-term migration. Since 1999/2000 work permits have tripled and student permits have more than doubled. In 2006/2007, 115,000 people were granted work permits, while 67,000 people were granted student permits. Some of these permits are short-term with stays lasting a few months, but others are for longer, with work permits available for up to three years. Work permits are issued to fill labour market shortages, for specific purposes or events, such as a film production, as part of working holiday schemes, to the partners of people with a work permit and as part of Work to Residence policies. Work to Residence policies provide people with a time-limited opportunity to find work while in New Zealand, that will enable them to apply for permanent residence. The country of origin of temporary migrants varies by type of temporary permit. With student permits two countries dominate the flows, with 30% of students coming from China and 17% from South Korea in 2006/2007.7 In terms of work permits, between 1997/1998 and 2006/2007 the UK accounted for 23% of all work permits, Japan comprised 10%, China 8% and the USA 6%.8 However, work permits from China have more than tripled since 2003/2004 to 15,000 in 2006/2007 – partly due to the introduction of Graduate job search permits which allowed international students to stay and transition into New Zealand employment.9 Many of New Zealand’s permanent migrants have held temporary permits prior to gaining permanent residence. Of migrants who gained permanent residence in 2006/2007, 81% had held a temporary permit between July 1997 and June 2007, with 56% a work permit, 30% a visitor permit and 14% a student permit.10 On average 33% of people issued a work permit and 24% of people issued with a student permit between 1997/1998 and 2002/2003 had transitioned to permanent
7 Department of Labour, Migration Trends 2006/07, Department of Labour: Wellington, 2008, p39. 8 Department of Labour, Migration Trends 2006/07, Department of Labour: Wellington, 2008, p108. 9 Department of Labour, Migration Trends 2006/07, Department of Labour: Wellington, 2008, p40. 10 Department of Labour, Migration Trends 2006/07, Department of Labour: Wellington, 2008, pp35–36.
20
residence by June 2007.11 In the LisNZ wave 1 survey, 55% of migrant respondents had been employed in New Zealand prior to gaining permanent residence, while only 12% had not been to New Zealand before gaining permanent residence.12 Thirty-two percent of total migrants, and 78 percent of business category migrants, had spent more than two years in New Zealand before gaining permanent residence. Out-migration People’s movements and settlement patterns have become more transitory in the last 20 years, particularly for people with high skills, who have increasing opportunities to migrate to a number of countries. A Department of Labour (DoL) study of permanent residents who arrived between 1998 and 31 December 2005 found 16% had subsequently left New Zealand and had been absent from New Zealand for longer than 6 months on 31 December 2006.13 The rate was 25% for migrants immigrating in 1998 and 6% for people who migrated in 2005, only 12–24 months previously. People migrating from Taiwan, Hong Kong, and Singapore between 1998 and 31 December 2005 have the highest rates of absence from New Zealand for longer than 6 months on 31 December 2006, with over a third being overseas. These three countries consistently have some of the highest migrant absence rates from New Zealand in 2006 for each year since 1998. In comparison, between 5% and 16% of migrants from South Africa, South Korea, Fiji, Samoa, Philippines, UK and India between 1998 and 2005 have been absent from New Zealand for more than 6 months on 31 December 2006. People who migrated from China between 1998 and 2005 had an absence rate from New Zealand of 23% on 31 December 2006. People who gained access to New Zealand through business categories between 1998 and 2005 also had a high rate of absence for 6 months or more as at 31 December 2006 - 29%, compared to 17% for skilled categories migrants while international/humanitarian stream migrants had the lowest levels of absence (8%). Example: South Koreans in New Zealand
Since 1991 the New Zealand population of South Korean-born people has increased significantly from 800 to 18,000 in 2006. However, even for this group which has experienced significant growth there has been out-migration. The DoL estimates that of people with South Korean nationality granted permanent residency between 1998 and 31 December 2005, 12.5% have been outside New Zealand for 6 months or more and have remained outside New Zealand as at December 2006. The absence rate is lower than the average absence rate for all people granted permanent residence over that time. However, for South Korean migrants who migrated to New Zealand in 1998 and 1999 the absence rates were around 20% by 31 December 2006.
By comparing census data from 2001 and 2006 of the number of people born in South Korea, an estimate of the out-migration rate for South Korean-born people who had arrived here between 1996 and 2001 can be established. In 2001, 9,000 people identified themselves as being born in South Korea and having moved to New Zealand since 1996; in 2006, 6,000 people identified themselves as being born in South Korea and having moved to New Zealand between 1996 and 2001. The change indicates that between 2001 and 2006 the number of South Korean migrants who moved to New Zealand between 1996 and 2001 reduced by a third. However, out-migration may not explain the entire decline and some of the group that did leave New Zealand could have been temporary migrants on student visas who did not intend to stay permanently.
In terms of long-term arrival and departure data, in 2004, 2005 and 2006 the net-migration of people born in South Korea has been negative, which supports out-migration as an explanation for the decline in South Korean-born people who moved to New Zealand between 1996 and 2001.
11 Department of Labour, Migration Trends 2006/07, Department of Labour: Wellington, 2008, p38. 12 Statistics New Zealand, Longitudinal Immigration Survey (LisNZ), Wave 1, 2008. 13 Department of Labour, Migration Trends 2006/07, Department of Labour: Wellington, 2008, p91 and 122.
21
Despite the outflows in the South Korean-born population, it has continued to increase, with a gain of 10,900 between 2001 and 2006. The information in this chapter up to this point has highlighted that people are immigrating to New Zealand from an increasingly diverse set of countries. The impacts of this on ethnic and religious diversity are discussed below. Ethnic diversity In the last 20 years New Zealand has become more ethnically diverse. Many ethnic groups have experienced rapid growth in New Zealand since 1991, although many of these are still relatively small groups, such as Koreans and Filipinos. Between 1991 and 2006, the Māori ethnic group actually had the biggest increase in terms of numbers of people, but its proportion of the population has not significantly increased and it is not expected to. Since recent migration has fuelled increases in Asian ethnic groups the majority of many Asian ethnic groups are born overseas. Many of the Asian population groups are expected to increase over the next 15 years, but many of these projections are based on high immigration assumptions. The Pacific population is also expected to modestly expand over the next 15 years, but because of natural increase from a relatively youthful population base that is predominately New Zealand-born. The section below highlights these trends in more detail. Increasingly diverse immigration flows and the fertility decisions of migrants have increased New Zealand’s ethnic diversity. In 2006 only 52% of the overseas-born population was European or Māori, while 32% was Asian. This is a stark comparison to the ethnic make up of the New Zealand-born population, with only 3% identifying as Asian. The following table sets out changes from 2001 to 2006 and projected changes in New Zealand’s four main ethnic groups between 2006 and 2026.
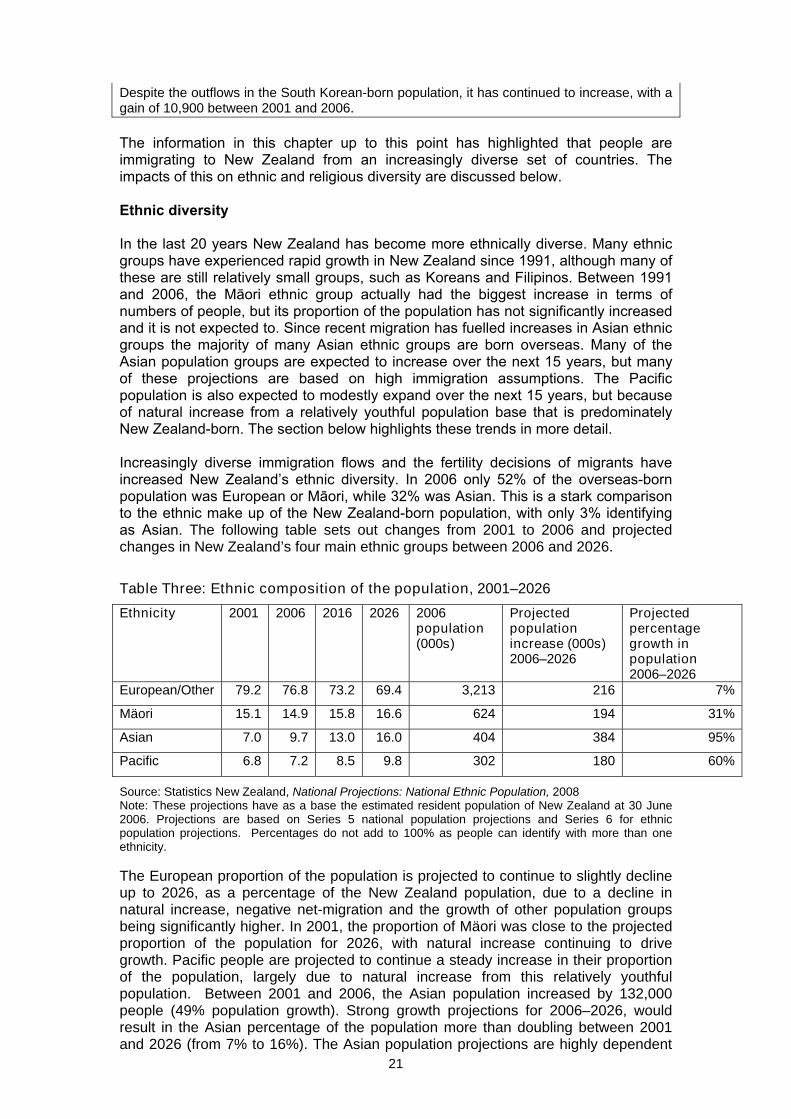
Table Three: Ethnic composition of the population, 2001–2026
Ethnicity 2001 2006 2016 2026 2006 population (000s)
Projected population increase (000s) 2006–2026
Projected percentage growth in population 2006–2026
European/Other 79.2 76.8 73.2 69.4 3,213 216 7%
Mäori 15.1 14.9 15.8 16.6 624 194 31%
Asian 7.0 9.7 13.0 16.0 404 384 95%
Pacific 6.8 7.2 8.5 9.8 302 180 60%
Source: Statistics New Zealand, National Projections: National Ethnic Population, 2008 Note: These projections have as a base the estimated resident population of New Zealand at 30 June 2006. Projections are based on Series 5 national population projections and Series 6 for ethnic population projections. Percentages do not add to 100% as people can identify with more than one ethnicity. The European proportion of the population is projected to continue to slightly decline up to 2026, as a percentage of the New Zealand population, due to a decline in natural increase, negative net-migration and the growth of other population groups being significantly higher. In 2001, the proportion of Mäori was close to the projected proportion of the population for 2026, with natural increase continuing to drive growth. Pacific people are projected to continue a steady increase in their proportion of the population, largely due to natural increase from this relatively youthful population. Between 2001 and 2006, the Asian population increased by 132,000 people (49% population growth). Strong growth projections for 2006–2026, would result in the Asian percentage of the population more than doubling between 2001 and 2026 (from 7% to 16%). The Asian population projections are highly dependent
22
on migration, with almost two-thirds of the projected population increase between 2006 and 2026 coming from net-migration. Migration projections can vary depending on changes in policy settings and opportunities within potential migrants’ existing countries of residence and in other potential destination countries.
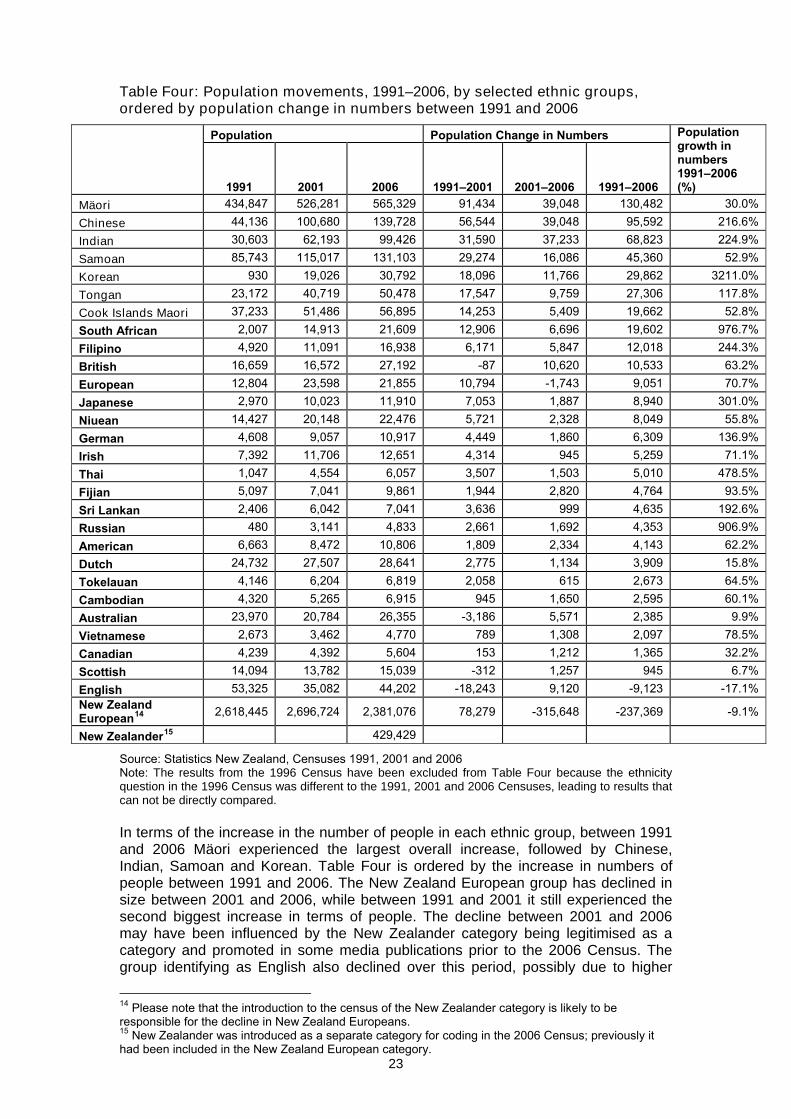
The ethnic populations in Table Three add to more than 100%. This is because Statistics New Zealand records each ethnic group that a person identifies with (currently up to six responses). In the 2006 Census, 10% of people reported having more than one ethnic group, an increase from 5% of people in 1991. It is projected that people with multiple ethnicities will increase further. People under 15 in the 2006 Census had higher levels of multiple ethnicity (20%) and 23% of live births in 2005 had multiple ethnicities. This trend reflects the complexity and fluidity of ethnicity as a concept. Of increasing importance to New Zealand’s population are the numbers of people in smaller ethnic groups within the Asian and Pacific ethnic groups. Table Four shows the increase in more-specifically-defined ethnic groups between 1991 and 2006. The Korean ethnic group experienced the largest population growth between 1991 and 2006. Ethnic groups, such as Russian, South African and Thai, also grew substantially between 1991 and 2006. In total, between the 1991 and 2006 Census, 11 of the ethnic groups in New Zealand more than doubled their populations.
23
Table Four: Population movements, 1991–2006, by selected ethnic groups, ordered by population change in numbers between 1991 and 2006
Population Population Change in Numbers
1991 2001 2006 1991–2001 2001–2006 1991–2006
Population growth in numbers 1991–2006 (%)
Mäori 434,847 526,281 565,329 91,434 39,048 130,482 30.0% Chinese 44,136 100,680 139,728 56,544 39,048 95,592 216.6% Indian 30,603 62,193 99,426 31,590 37,233 68,823 224.9% Samoan 85,743 115,017 131,103 29,274 16,086 45,360 52.9% Korean 930 19,026 30,792 18,096 11,766 29,862 3211.0% Tongan 23,172 40,719 50,478 17,547 9,759 27,306 117.8% Cook Islands Maori 37,233 51,486 56,895 14,253 5,409 19,662 52.8% South African 2,007 14,913 21,609 12,906 6,696 19,602 976.7% Filipino 4,920 11,091 16,938 6,171 5,847 12,018 244.3% British 16,659 16,572 27,192 -87 10,620 10,533 63.2% European 12,804 23,598 21,855 10,794 -1,743 9,051 70.7% Japanese 2,970 10,023 11,910 7,053 1,887 8,940 301.0% Niuean 14,427 20,148 22,476 5,721 2,328 8,049 55.8% German 4,608 9,057 10,917 4,449 1,860 6,309 136.9% Irish 7,392 11,706 12,651 4,314 945 5,259 71.1% Thai 1,047 4,554 6,057 3,507 1,503 5,010 478.5% Fijian 5,097 7,041 9,861 1,944 2,820 4,764 93.5% Sri Lankan 2,406 6,042 7,041 3,636 999 4,635 192.6% Russian 480 3,141 4,833 2,661 1,692 4,353 906.9% American 6,663 8,472 10,806 1,809 2,334 4,143 62.2% Dutch 24,732 27,507 28,641 2,775 1,134 3,909 15.8% Tokelauan 4,146 6,204 6,819 2,058 615 2,673 64.5% Cambodian 4,320 5,265 6,915 945 1,650 2,595 60.1% Australian 23,970 20,784 26,355 -3,186 5,571 2,385 9.9% Vietnamese 2,673 3,462 4,770 789 1,308 2,097 78.5% Canadian 4,239 4,392 5,604 153 1,212 1,365 32.2% Scottish 14,094 13,782 15,039 -312 1,257 945 6.7% English 53,325 35,082 44,202 -18,243 9,120 -9,123 -17.1% New Zealand European14 2,618,445 2,696,724 2,381,076 78,279 -315,648 -237,369 -9.1%
New Zealander15 429,429
Source: Statistics New Zealand, Censuses 1991, 2001 and 2006 Note: The results from the 1996 Census have been excluded from Table Four because the ethnicity question in the 1996 Census was different to the 1991, 2001 and 2006 Censuses, leading to results that can not be directly compared. In terms of the increase in the number of people in each ethnic group, between 1991 and 2006 Mäori experienced the largest overall increase, followed by Chinese, Indian, Samoan and Korean. Table Four is ordered by the increase in numbers of people between 1991 and 2006. The New Zealand European group has declined in size between 2001 and 2006, while between 1991 and 2001 it still experienced the second biggest increase in terms of people. The decline between 2001 and 2006 may have been influenced by the New Zealander category being legitimised as a category and promoted in some media publications prior to the 2006 Census. The group identifying as English also declined over this period, possibly due to higher
14 Please note that the introduction to the census of the New Zealander category is likely to be responsible for the decline in New Zealand Europeans. 15 New Zealander was introduced as a separate category for coding in the 2006 Census; previously it had been included in the New Zealand European category.
24
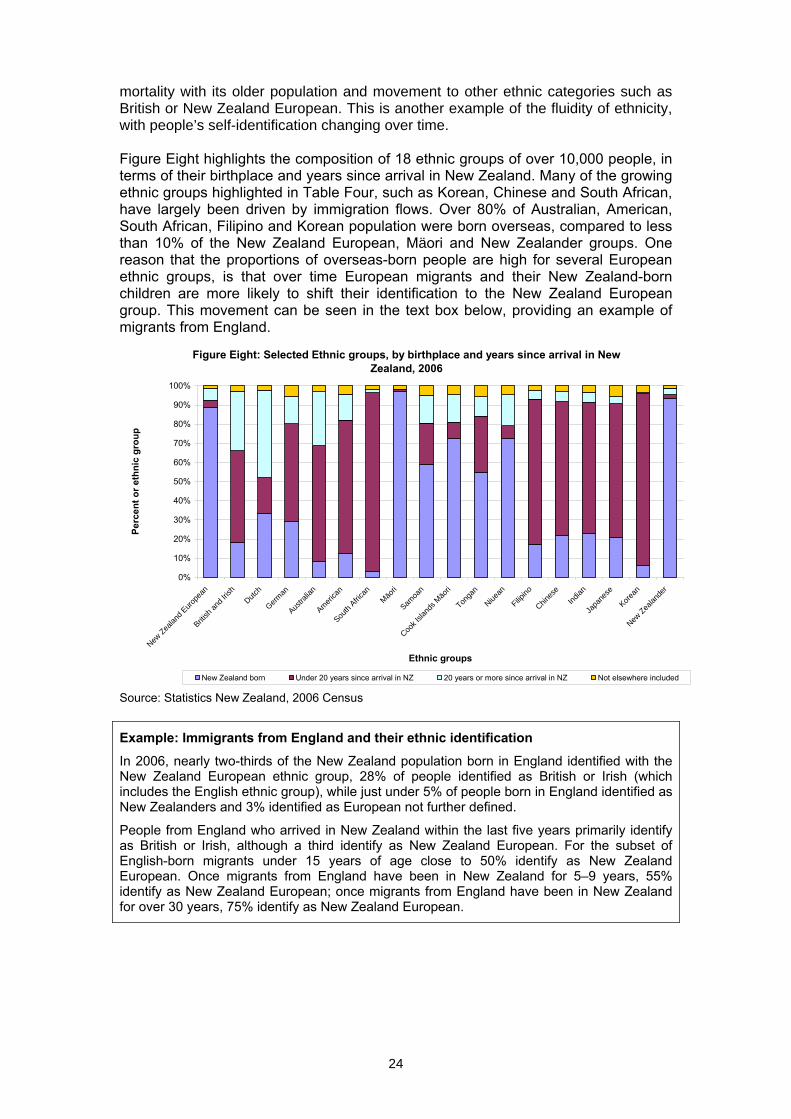
mortality with its older population and movement to other ethnic categories such as British or New Zealand European. This is another example of the fluidity of ethnicity, with people’s self-identification changing over time. Figure Eight highlights the composition of 18 ethnic groups of over 10,000 people, in terms of their birthplace and years since arrival in New Zealand. Many of the growing ethnic groups highlighted in Table Four, such as Korean, Chinese and South African, have largely been driven by immigration flows. Over 80% of Australian, American, South African, Filipino and Korean population were born overseas, compared to less than 10% of the New Zealand European, Mäori and New Zealander groups. One reason that the proportions of overseas-born people are high for several European ethnic groups, is that over time European migrants and their New Zealand-born children are more likely to shift their identification to the New Zealand European group. This movement can be seen in the text box below, providing an example of migrants from England.
Figure Eight: Selected Ethnic groups, by birthplace and years since arrival in New Zealand, 2006
0%
10%
20%
30%
40%
50%
60%
70%
80%
90%
100%
New Z
ealan
d Eur
opea
n
British
and
Irish
Dutch
Germ
an
Austra
lian
Amer
ican
South
Afri
can
Mäo
ri
Samoa
n
Cook I
sland
s Mäo
ri
Tonga
n
Niuea
n
Filipin
o
Chines
e
India
n
Japa
nese
Korea
n
New Z
ealan
der
Ethnic groups
Perc
ent o
r eth
nic
grou
p
New Zealand born Under 20 years since arrival in NZ 20 years or more since arrival in NZ Not elsewhere included
Source: Statistics New Zealand, 2006 Census Example: Immigrants from England and their ethnic identification
In 2006, nearly two-thirds of the New Zealand population born in England identified with the New Zealand European ethnic group, 28% of people identified as British or Irish (which includes the English ethnic group), while just under 5% of people born in England identified as New Zealanders and 3% identified as European not further defined.
People from England who arrived in New Zealand within the last five years primarily identify as British or Irish, although a third identify as New Zealand European. For the subset of English-born migrants under 15 years of age close to 50% identify as New Zealand European. Once migrants from England have been in New Zealand for 5–9 years, 55% identify as New Zealand European; once migrants from England have been in New Zealand for over 30 years, 75% identify as New Zealand European.
25
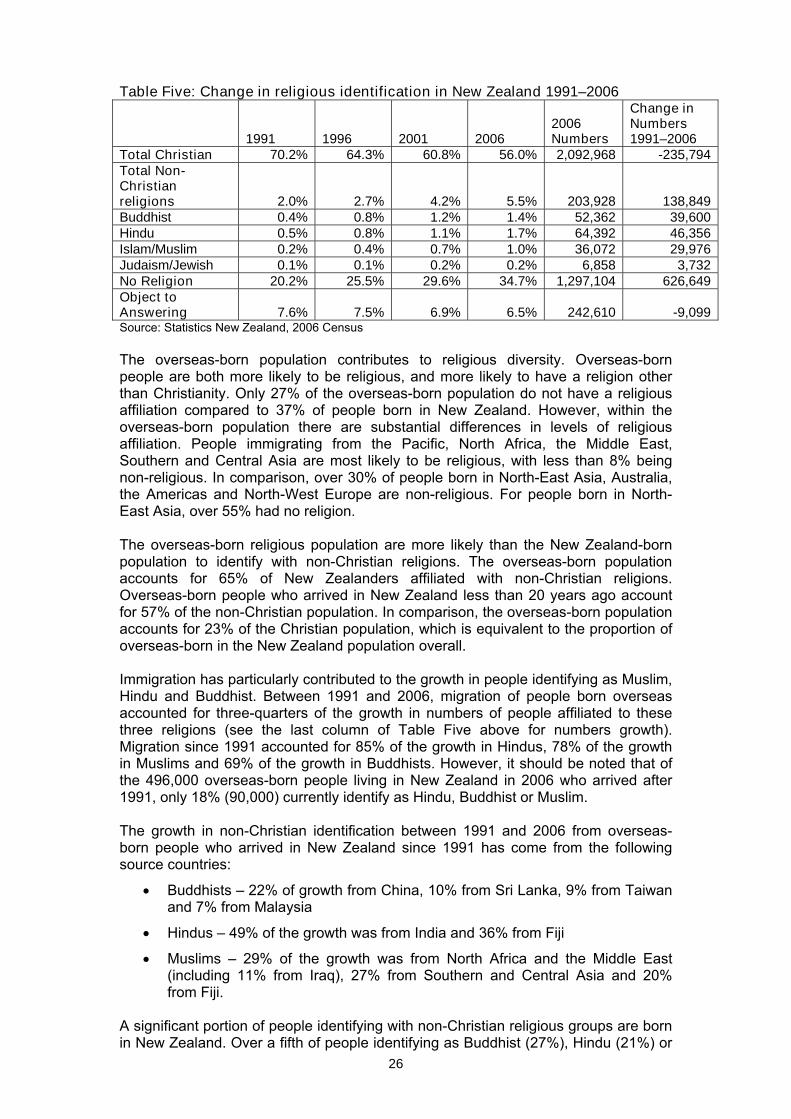
In contrast to the four Asian ethnic groups displayed in Figure Eight with a very low proportion of New Zealand-born people, among the four Pacific ethnic groups the majority were born in New Zealand. However, it should be noted that the majority of New Zealand-born people in Pacific ethnic groups are under 15 years of age. Within the Pacific working-age population aged 25-64 years, the percentage of New Zealand-born people is lower, ranging from 50% (Cook Island Maori) to 18% (Tongan). While most of the geographic regions and countries that correspond to particular ethnic groups are fairly predictable, such as Japanese from Japan and English from England, some groups such as Indian and Chinese have a more diverse range of contributory countries. People who identify as Chinese are born in China (52%), New Zealand (22%), Taiwan (7%), Malaysia (7%) and Hong Kong (4.5%). The flows of Chinese from China are higher among people who have been in New Zealand since 2001, as movements of Chinese people from Taiwan and Hong Kong have fallen away since the mid-1990s. In terms of people who identify as Indians, 40% are born in India, 28% are born in Fiji, 23% are born in New Zealand, 2.5% are born in South Africa, and under 2% are born in Malaysia. Religious diversity New Zealanders’ religious affiliations have traditionally been Christian, with increasing numbers since the 1970s stating that they have no religious affiliation. While the majority of New Zealanders still identify as Christian, there has been a decline. Christian identification fell from 70% of the population in 1991 to 56% of the population in 2006. The percentage of New Zealanders with no religion increased by 15% between 1991 and 2006; those with non-Christian religions almost tripled from 2% to 5.5%.16 The increase in non-Christian beliefs between 1991 and 2006 was due to the tripling of the Hindu population (to 64,000), the Buddhist population quadrupling (to 41,600), the Muslim population increasing six-fold (to 36,000) and the Jewish populations doubling (to 6,900). Despite the growth rates in these religions, non-Christian religions account for fewer than 6% of the New Zealand population, or 204,000 people. The section below elaborates on these trends and the impact of immigration on religious diversity. Table Five (next page) shows the religious affiliation of New Zealanders between the 1991 and 2006 Censuses, and the overall change in numbers. People who state that they have no religion grew the most in terms of people (627,000) between 1991 and 2006. Between 2001 and 2006, people who did not identify with any religion increased by almost 300,000. Since 1991 the decline in people identifying as Christian has been substantial, but over 90% of the decline occurred between 1991 and 2001.
16 Religious affiliation results from the 2001 and 2006 Censuses add to just over 100% as some people identify with more than one religion and this was recorded.
26
Table Five: Change in religious identification in New Zealand 1991–2006
1991 1996 2001 2006
2006 Numbers
Change in Numbers 1991–2006
Total Christian 70.2% 64.3% 60.8% 56.0% 2,092,968 -235,794 Total Non-Christian religions 2.0% 2.7% 4.2% 5.5% 203,928 138,849 Buddhist 0.4% 0.8% 1.2% 1.4% 52,362 39,600 Hindu 0.5% 0.8% 1.1% 1.7% 64,392 46,356 Islam/Muslim 0.2% 0.4% 0.7% 1.0% 36,072 29,976 Judaism/Jewish 0.1% 0.1% 0.2% 0.2% 6,858 3,732 No Religion 20.2% 25.5% 29.6% 34.7% 1,297,104 626,649 Object to Answering 7.6% 7.5% 6.9% 6.5% 242,610 -9,099 Source: Statistics New Zealand, 2006 Census The overseas-born population contributes to religious diversity. Overseas-born people are both more likely to be religious, and more likely to have a religion other than Christianity. Only 27% of the overseas-born population do not have a religious affiliation compared to 37% of people born in New Zealand. However, within the overseas-born population there are substantial differences in levels of religious affiliation. People immigrating from the Pacific, North Africa, the Middle East, Southern and Central Asia are most likely to be religious, with less than 8% being non-religious. In comparison, over 30% of people born in North-East Asia, Australia, the Americas and North-West Europe are non-religious. For people born in North-East Asia, over 55% had no religion. The overseas-born religious population are more likely than the New Zealand-born population to identify with non-Christian religions. The overseas-born population accounts for 65% of New Zealanders affiliated with non-Christian religions. Overseas-born people who arrived in New Zealand less than 20 years ago account for 57% of the non-Christian population. In comparison, the overseas-born population accounts for 23% of the Christian population, which is equivalent to the proportion of overseas-born in the New Zealand population overall. Immigration has particularly contributed to the growth in people identifying as Muslim, Hindu and Buddhist. Between 1991 and 2006, migration of people born overseas accounted for three-quarters of the growth in numbers of people affiliated to these three religions (see the last column of Table Five above for numbers growth). Migration since 1991 accounted for 85% of the growth in Hindus, 78% of the growth in Muslims and 69% of the growth in Buddhists. However, it should be noted that of the 496,000 overseas-born people living in New Zealand in 2006 who arrived after 1991, only 18% (90,000) currently identify as Hindu, Buddhist or Muslim. The growth in non-Christian identification between 1991 and 2006 from overseas-born people who arrived in New Zealand since 1991 has come from the following source countries:
• Buddhists – 22% of growth from China, 10% from Sri Lanka, 9% from Taiwan and 7% from Malaysia
• Hindus – 49% of the growth was from India and 36% from Fiji
• Muslims – 29% of the growth was from North Africa and the Middle East (including 11% from Iraq), 27% from Southern and Central Asia and 20% from Fiji.
A significant portion of people identifying with non-Christian religious groups are born in New Zealand. Over a fifth of people identifying as Buddhist (27%), Hindu (21%) or
27
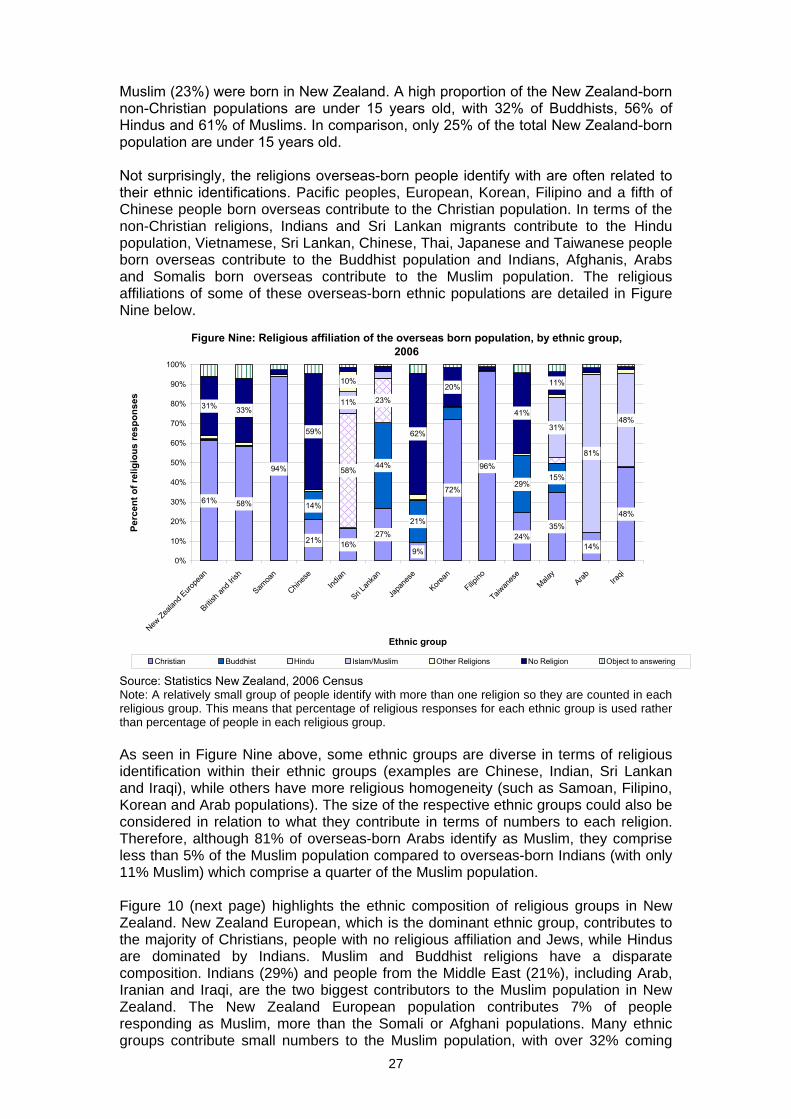
Muslim (23%) were born in New Zealand. A high proportion of the New Zealand-born non-Christian populations are under 15 years old, with 32% of Buddhists, 56% of Hindus and 61% of Muslims. In comparison, only 25% of the total New Zealand-born population are under 15 years old. Not surprisingly, the religions overseas-born people identify with are often related to their ethnic identifications. Pacific peoples, European, Korean, Filipino and a fifth of Chinese people born overseas contribute to the Christian population. In terms of the non-Christian religions, Indians and Sri Lankan migrants contribute to the Hindu population, Vietnamese, Sri Lankan, Chinese, Thai, Japanese and Taiwanese people born overseas contribute to the Buddhist population and Indians, Afghanis, Arabs and Somalis born overseas contribute to the Muslim population. The religious affiliations of some of these overseas-born ethnic populations are detailed in Figure Nine below.
Figure Nine: Religious affiliation of the overseas born population, by ethnic group, 2006
61% 58%
94%
21% 16%27%
9%
72%
96%
24%35%
14%
48%14%
44%
21%
29%15%
58%
23%
48%
81%
11%
31%
10% 11%
59%
33%31%
62%
20%
41%
0%
10%
20%
30%
40%
50%
60%
70%
80%
90%
100%
New Zea
land E
urope
an
British
and I
rish
Samoa
n
Chines
eInd
ian
Sri Lan
kan
Japa
nese
Korean
Filipino
Taiwan
ese
Malay
Arab Iraqi
Ethnic group
Perc
ent o
f rel
igio
us re
spon
ses
Christian Buddhist Hindu Islam/Muslim Other Religions No Religion Object to answering Source: Statistics New Zealand, 2006 Census Note: A relatively small group of people identify with more than one religion so they are counted in each religious group. This means that percentage of religious responses for each ethnic group is used rather than percentage of people in each religious group. As seen in Figure Nine above, some ethnic groups are diverse in terms of religious identification within their ethnic groups (examples are Chinese, Indian, Sri Lankan and Iraqi), while others have more religious homogeneity (such as Samoan, Filipino, Korean and Arab populations). The size of the respective ethnic groups could also be considered in relation to what they contribute in terms of numbers to each religion. Therefore, although 81% of overseas-born Arabs identify as Muslim, they comprise less than 5% of the Muslim population compared to overseas-born Indians (with only 11% Muslim) which comprise a quarter of the Muslim population. Figure 10 (next page) highlights the ethnic composition of religious groups in New Zealand. New Zealand European, which is the dominant ethnic group, contributes to the majority of Christians, people with no religious affiliation and Jews, while Hindus are dominated by Indians. Muslim and Buddhist religions have a disparate composition. Indians (29%) and people from the Middle East (21%), including Arab, Iranian and Iraqi, are the two biggest contributors to the Muslim population in New Zealand. The New Zealand European population contributes 7% of people responding as Muslim, more than the Somali or Afghani populations. Many ethnic groups contribute small numbers to the Muslim population, with over 32% coming
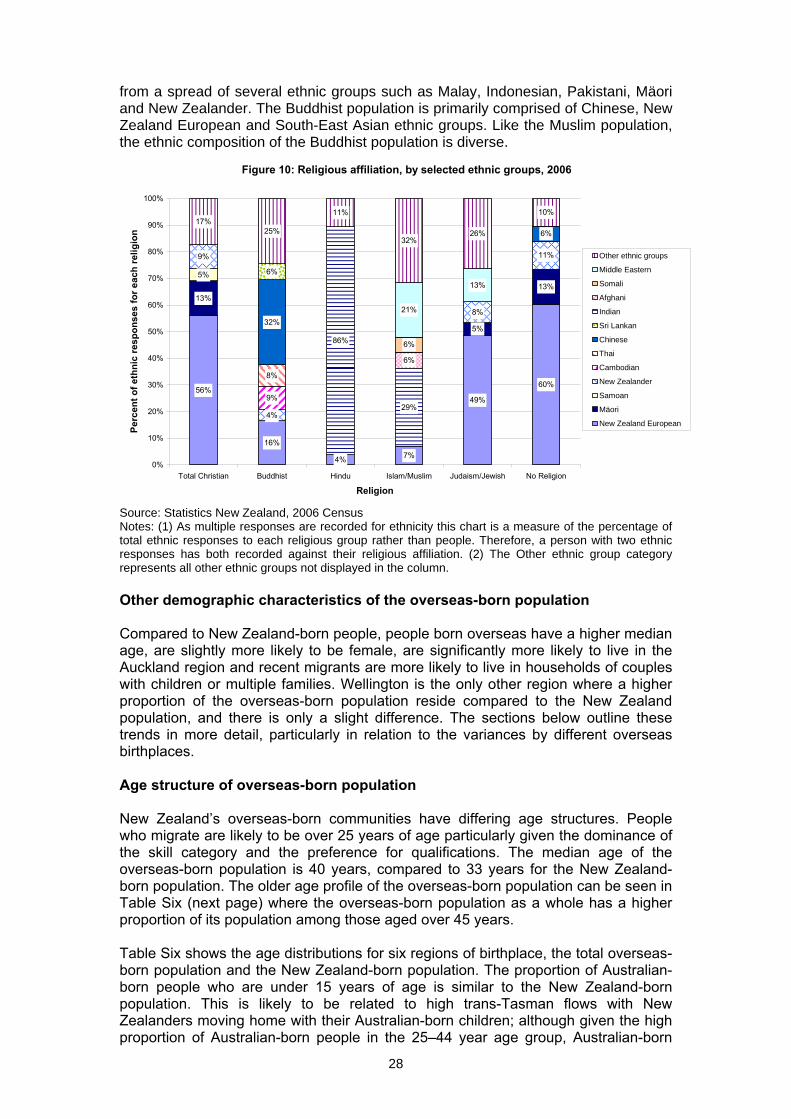
28
from a spread of several ethnic groups such as Malay, Indonesian, Pakistani, Mäori and New Zealander. The Buddhist population is primarily comprised of Chinese, New Zealand European and South-East Asian ethnic groups. Like the Muslim population, the ethnic composition of the Buddhist population is diverse.
Figure 10: Religious affiliation, by selected ethnic groups, 2006
56%
16%
4% 7%
49%
60%
17%25%
11%
32%26%
10%
13%
5%
13%
5%
11%
8%
4%
9%
9%
8%
6%
32%
6%
86%
29%
6%
6%
13%
21%
0%
10%
20%
30%
40%
50%
60%
70%
80%
90%
100%
Total Christian Buddhist Hindu Islam/Muslim Judaism/Jewish No Religion
Religion
Perc
ent o
f eth
nic
resp
onse
s fo
r eac
h re
ligio
n
Other ethnic groups
Middle Eastern
Somali
Afghani
Indian
Sri Lankan
Chinese
Thai
Cambodian
New Zealander
Samoan
Mäori
New Zealand European
Source: Statistics New Zealand, 2006 Census Notes: (1) As multiple responses are recorded for ethnicity this chart is a measure of the percentage of total ethnic responses to each religious group rather than people. Therefore, a person with two ethnic responses has both recorded against their religious affiliation. (2) The Other ethnic group category represents all other ethnic groups not displayed in the column. Other demographic characteristics of the overseas-born population Compared to New Zealand-born people, people born overseas have a higher median age, are slightly more likely to be female, are significantly more likely to live in the Auckland region and recent migrants are more likely to live in households of couples with children or multiple families. Wellington is the only other region where a higher proportion of the overseas-born population reside compared to the New Zealand population, and there is only a slight difference. The sections below outline these trends in more detail, particularly in relation to the variances by different overseas birthplaces. Age structure of overseas-born population New Zealand’s overseas-born communities have differing age structures. People who migrate are likely to be over 25 years of age particularly given the dominance of the skill category and the preference for qualifications. The median age of the overseas-born population is 40 years, compared to 33 years for the New Zealand-born population. The older age profile of the overseas-born population can be seen in Table Six (next page) where the overseas-born population as a whole has a higher proportion of its population among those aged over 45 years. Table Six shows the age distributions for six regions of birthplace, the total overseas-born population and the New Zealand-born population. The proportion of Australian-born people who are under 15 years of age is similar to the New Zealand-born population. This is likely to be related to high trans-Tasman flows with New Zealanders moving home with their Australian-born children; although given the high proportion of Australian-born people in the 25–44 year age group, Australian-born
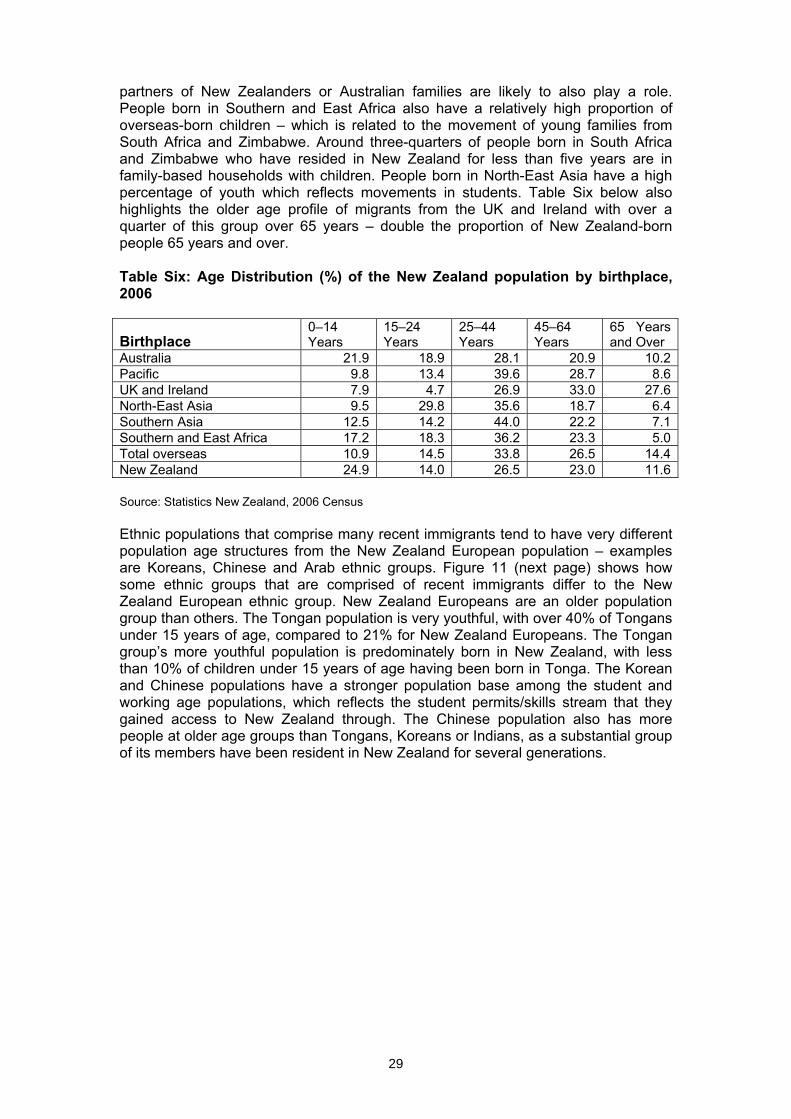
29
partners of New Zealanders or Australian families are likely to also play a role. People born in Southern and East Africa also have a relatively high proportion of overseas-born children – which is related to the movement of young families from South Africa and Zimbabwe. Around three-quarters of people born in South Africa and Zimbabwe who have resided in New Zealand for less than five years are in family-based households with children. People born in North-East Asia have a high percentage of youth which reflects movements in students. Table Six below also highlights the older age profile of migrants from the UK and Ireland with over a quarter of this group over 65 years – double the proportion of New Zealand-born people 65 years and over. Table Six: Age Distribution (%) of the New Zealand population by birthplace, 2006
Birthplace 0–14 Years
15–24 Years
25–44 Years
45–64 Years
65 Years and Over
Australia 21.9 18.9 28.1 20.9 10.2Pacific 9.8 13.4 39.6 28.7 8.6UK and Ireland 7.9 4.7 26.9 33.0 27.6North-East Asia 9.5 29.8 35.6 18.7 6.4Southern Asia 12.5 14.2 44.0 22.2 7.1Southern and East Africa 17.2 18.3 36.2 23.3 5.0Total overseas 10.9 14.5 33.8 26.5 14.4New Zealand 24.9 14.0 26.5 23.0 11.6 Source: Statistics New Zealand, 2006 Census Ethnic populations that comprise many recent immigrants tend to have very different population age structures from the New Zealand European population – examples are Koreans, Chinese and Arab ethnic groups. Figure 11 (next page) shows how some ethnic groups that are comprised of recent immigrants differ to the New Zealand European ethnic group. New Zealand Europeans are an older population group than others. The Tongan population is very youthful, with over 40% of Tongans under 15 years of age, compared to 21% for New Zealand Europeans. The Tongan group’s more youthful population is predominately born in New Zealand, with less than 10% of children under 15 years of age having been born in Tonga. The Korean and Chinese populations have a stronger population base among the student and working age populations, which reflects the student permits/skills stream that they gained access to New Zealand through. The Chinese population also has more people at older age groups than Tongans, Koreans or Indians, as a substantial group of its members have been resident in New Zealand for several generations.
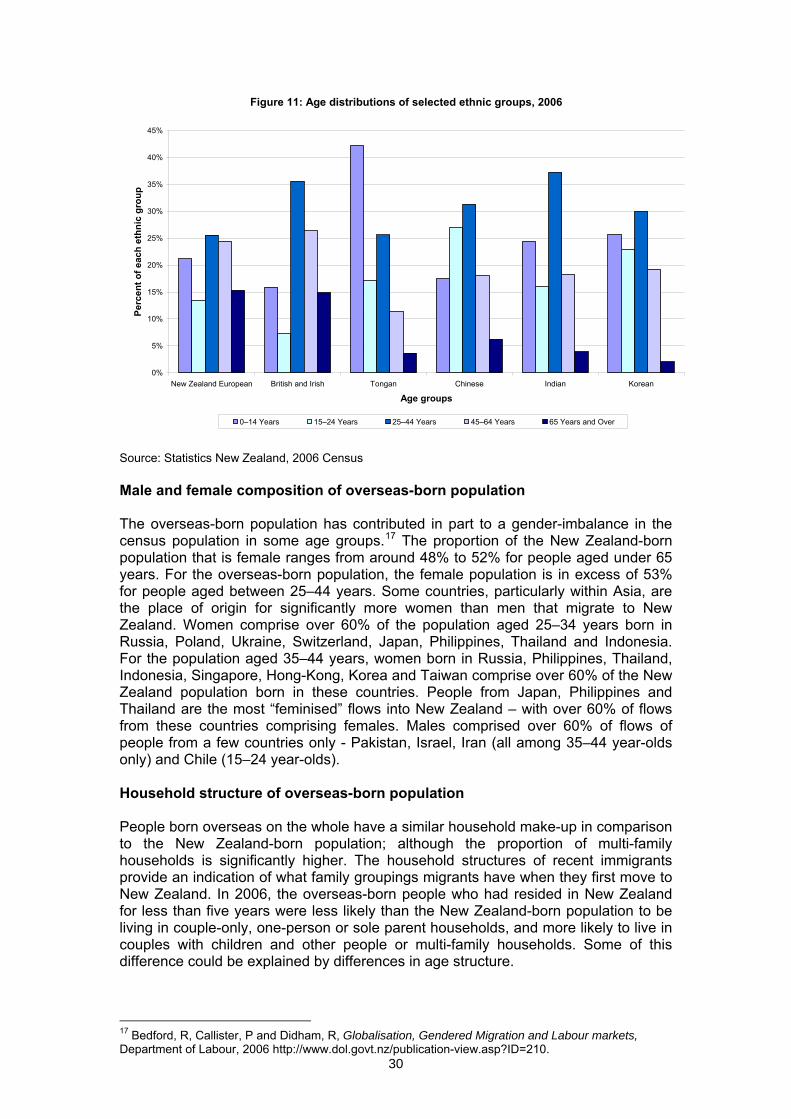
30
Figure 11: Age distributions of selected ethnic groups, 2006
0%
5%
10%
15%
20%
25%
30%
35%
40%
45%
New Zealand European British and Irish Tongan Chinese Indian Korean
Age groups
Perc
ent o
f eac
h et
hnic
gro
up
0–14 Years 15–24 Years 25–44 Years 45–64 Years 65 Years and Over Source: Statistics New Zealand, 2006 Census Male and female composition of overseas-born population The overseas-born population has contributed in part to a gender-imbalance in the census population in some age groups.17 The proportion of the New Zealand-born population that is female ranges from around 48% to 52% for people aged under 65 years. For the overseas-born population, the female population is in excess of 53% for people aged between 25–44 years. Some countries, particularly within Asia, are the place of origin for significantly more women than men that migrate to New Zealand. Women comprise over 60% of the population aged 25–34 years born in Russia, Poland, Ukraine, Switzerland, Japan, Philippines, Thailand and Indonesia. For the population aged 35–44 years, women born in Russia, Philippines, Thailand, Indonesia, Singapore, Hong-Kong, Korea and Taiwan comprise over 60% of the New Zealand population born in these countries. People from Japan, Philippines and Thailand are the most “feminised” flows into New Zealand – with over 60% of flows from these countries comprising females. Males comprised over 60% of flows of people from a few countries only - Pakistan, Israel, Iran (all among 35–44 year-olds only) and Chile (15–24 year-olds). Household structure of overseas-born population People born overseas on the whole have a similar household make-up in comparison to the New Zealand-born population; although the proportion of multi-family households is significantly higher. The household structures of recent immigrants provide an indication of what family groupings migrants have when they first move to New Zealand. In 2006, the overseas-born people who had resided in New Zealand for less than five years were less likely than the New Zealand-born population to be living in couple-only, one-person or sole parent households, and more likely to live in couples with children and other people or multi-family households. Some of this difference could be explained by differences in age structure.
17 Bedford, R, Callister, P and Didham, R, Globalisation, Gendered Migration and Labour markets, Department of Labour, 2006 http://www.dol.govt.nz/publication-view.asp?ID=210.
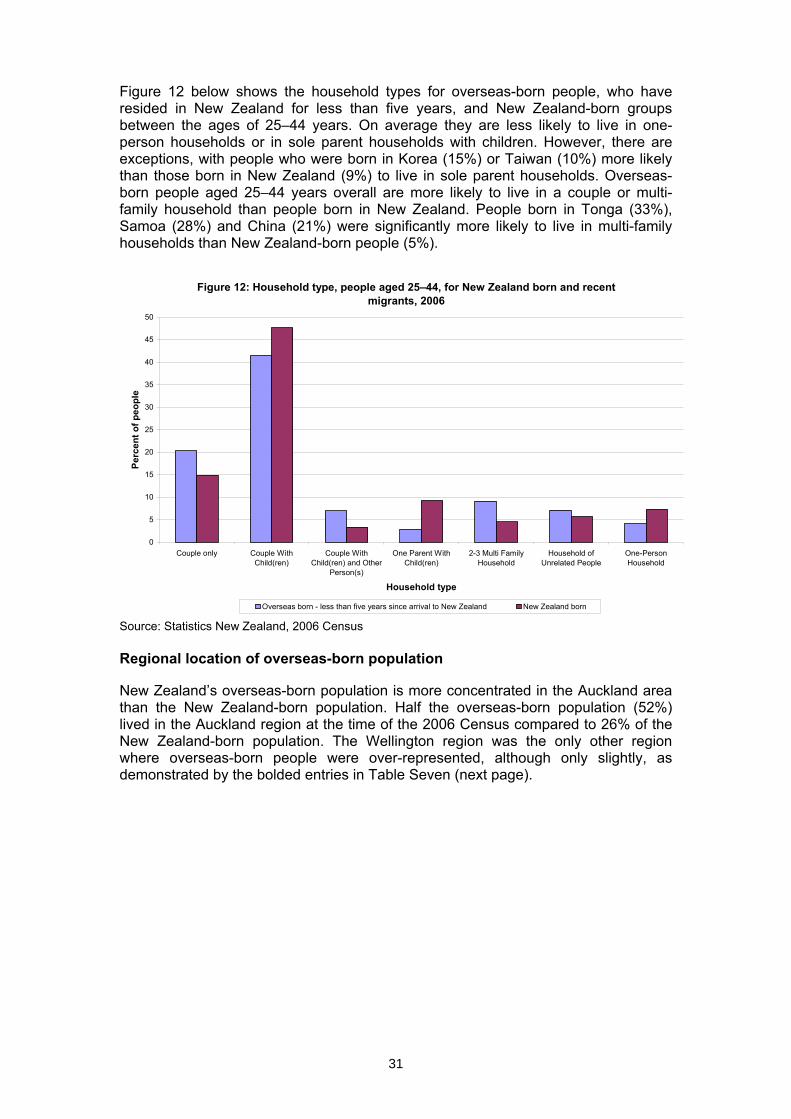
31
Figure 12 below shows the household types for overseas-born people, who have resided in New Zealand for less than five years, and New Zealand-born groups between the ages of 25–44 years. On average they are less likely to live in one-person households or in sole parent households with children. However, there are exceptions, with people who were born in Korea (15%) or Taiwan (10%) more likely than those born in New Zealand (9%) to live in sole parent households. Overseas-born people aged 25–44 years overall are more likely to live in a couple or multi-family household than people born in New Zealand. People born in Tonga (33%), Samoa (28%) and China (21%) were significantly more likely to live in multi-family households than New Zealand-born people (5%).
Figure 12: Household type, people aged 25–44, for New Zealand born and recent migrants, 2006
0
5
10
15
20
25
30
35
40
45
50
Couple only Couple WithChild(ren)
Couple WithChild(ren) and Other
Person(s)
One Parent WithChild(ren)
2-3 Multi FamilyHousehold
Household ofUnrelated People
One-PersonHousehold
Household type
Perc
ent o
f peo
ple
Overseas born - less than five years since arrival to New Zealand New Zealand born Source: Statistics New Zealand, 2006 Census Regional location of overseas-born population New Zealand’s overseas-born population is more concentrated in the Auckland area than the New Zealand-born population. Half the overseas-born population (52%) lived in the Auckland region at the time of the 2006 Census compared to 26% of the New Zealand-born population. The Wellington region was the only other region where overseas-born people were over-represented, although only slightly, as demonstrated by the bolded entries in Table Seven (next page).
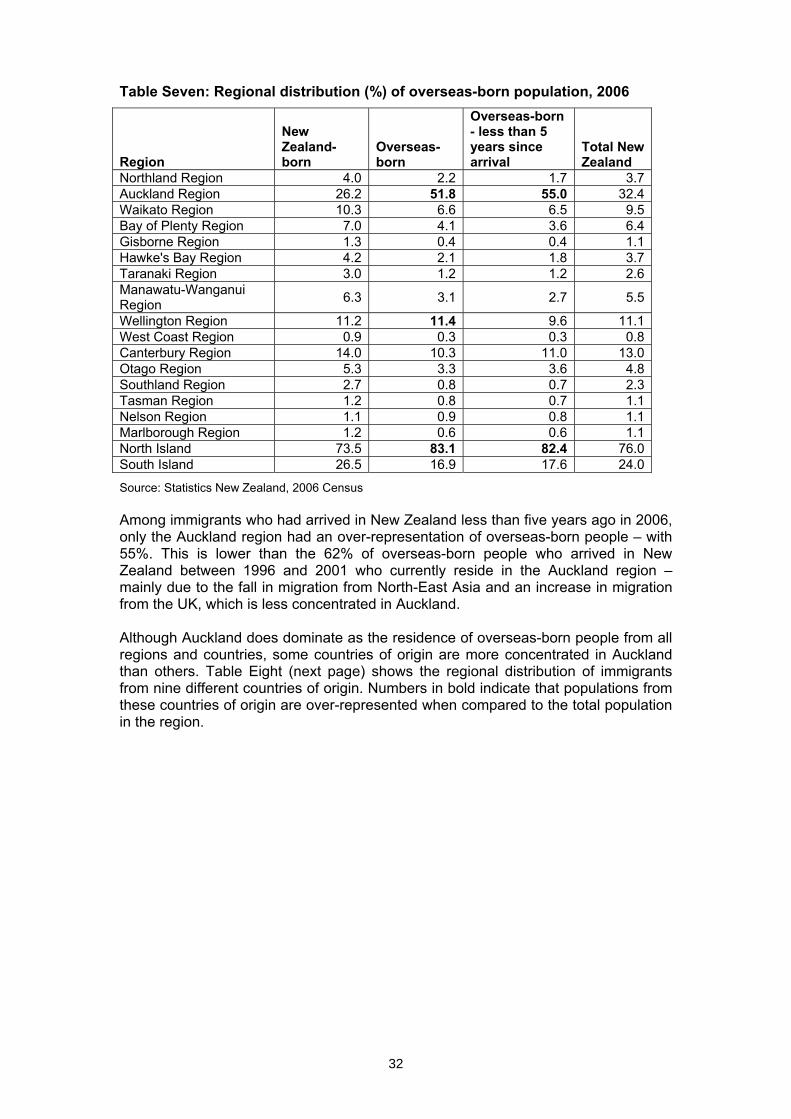
32
Table Seven: Regional distribution (%) of overseas-born population, 2006
Region
New Zealand-born
Overseas-born
Overseas-born - less than 5 years since arrival
Total New Zealand
Northland Region 4.0 2.2 1.7 3.7 Auckland Region 26.2 51.8 55.0 32.4 Waikato Region 10.3 6.6 6.5 9.5 Bay of Plenty Region 7.0 4.1 3.6 6.4 Gisborne Region 1.3 0.4 0.4 1.1 Hawke's Bay Region 4.2 2.1 1.8 3.7 Taranaki Region 3.0 1.2 1.2 2.6 Manawatu-Wanganui Region 6.3 3.1 2.7 5.5
Wellington Region 11.2 11.4 9.6 11.1 West Coast Region 0.9 0.3 0.3 0.8 Canterbury Region 14.0 10.3 11.0 13.0 Otago Region 5.3 3.3 3.6 4.8 Southland Region 2.7 0.8 0.7 2.3 Tasman Region 1.2 0.8 0.7 1.1 Nelson Region 1.1 0.9 0.8 1.1 Marlborough Region 1.2 0.6 0.6 1.1 North Island 73.5 83.1 82.4 76.0 South Island 26.5 16.9 17.6 24.0
Source: Statistics New Zealand, 2006 Census Among immigrants who had arrived in New Zealand less than five years ago in 2006, only the Auckland region had an over-representation of overseas-born people – with 55%. This is lower than the 62% of overseas-born people who arrived in New Zealand between 1996 and 2001 who currently reside in the Auckland region – mainly due to the fall in migration from North-East Asia and an increase in migration from the UK, which is less concentrated in Auckland. Although Auckland does dominate as the residence of overseas-born people from all regions and countries, some countries of origin are more concentrated in Auckland than others. Table Eight (next page) shows the regional distribution of immigrants from nine different countries of origin. Numbers in bold indicate that populations from these countries of origin are over-represented when compared to the total population in the region.
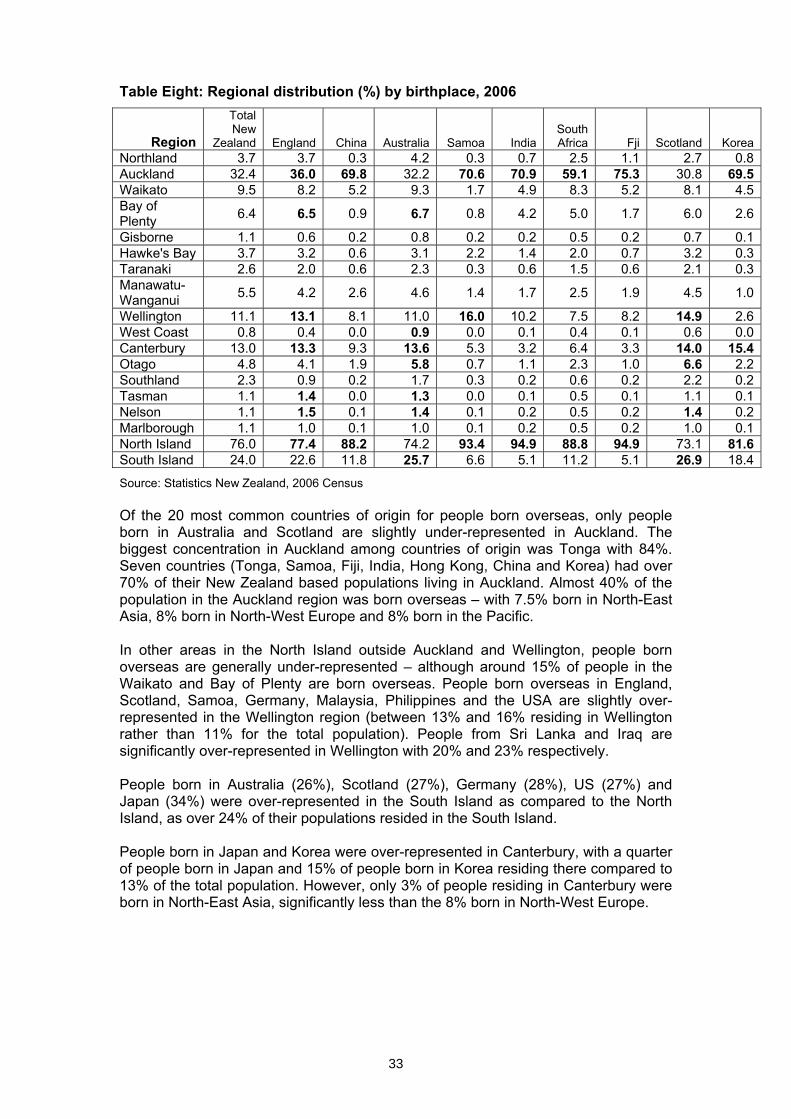
33
Table Eight: Regional distribution (%) by birthplace, 2006
Region
Total New
Zealand England China Australia Samoa India South Africa Fji Scotland Korea
Northland 3.7 3.7 0.3 4.2 0.3 0.7 2.5 1.1 2.7 0.8Auckland 32.4 36.0 69.8 32.2 70.6 70.9 59.1 75.3 30.8 69.5Waikato 9.5 8.2 5.2 9.3 1.7 4.9 8.3 5.2 8.1 4.5Bay of Plenty 6.4 6.5 0.9 6.7 0.8 4.2 5.0 1.7 6.0 2.6
Gisborne 1.1 0.6 0.2 0.8 0.2 0.2 0.5 0.2 0.7 0.1Hawke's Bay 3.7 3.2 0.6 3.1 2.2 1.4 2.0 0.7 3.2 0.3Taranaki 2.6 2.0 0.6 2.3 0.3 0.6 1.5 0.6 2.1 0.3Manawatu-Wanganui 5.5 4.2 2.6 4.6 1.4 1.7 2.5 1.9 4.5 1.0
Wellington 11.1 13.1 8.1 11.0 16.0 10.2 7.5 8.2 14.9 2.6West Coast 0.8 0.4 0.0 0.9 0.0 0.1 0.4 0.1 0.6 0.0Canterbury 13.0 13.3 9.3 13.6 5.3 3.2 6.4 3.3 14.0 15.4Otago 4.8 4.1 1.9 5.8 0.7 1.1 2.3 1.0 6.6 2.2Southland 2.3 0.9 0.2 1.7 0.3 0.2 0.6 0.2 2.2 0.2Tasman 1.1 1.4 0.0 1.3 0.0 0.1 0.5 0.1 1.1 0.1Nelson 1.1 1.5 0.1 1.4 0.1 0.2 0.5 0.2 1.4 0.2Marlborough 1.1 1.0 0.1 1.0 0.1 0.2 0.5 0.2 1.0 0.1North Island 76.0 77.4 88.2 74.2 93.4 94.9 88.8 94.9 73.1 81.6South Island 24.0 22.6 11.8 25.7 6.6 5.1 11.2 5.1 26.9 18.4
Source: Statistics New Zealand, 2006 Census Of the 20 most common countries of origin for people born overseas, only people born in Australia and Scotland are slightly under-represented in Auckland. The biggest concentration in Auckland among countries of origin was Tonga with 84%. Seven countries (Tonga, Samoa, Fiji, India, Hong Kong, China and Korea) had over 70% of their New Zealand based populations living in Auckland. Almost 40% of the population in the Auckland region was born overseas – with 7.5% born in North-East Asia, 8% born in North-West Europe and 8% born in the Pacific. In other areas in the North Island outside Auckland and Wellington, people born overseas are generally under-represented – although around 15% of people in the Waikato and Bay of Plenty are born overseas. People born overseas in England, Scotland, Samoa, Germany, Malaysia, Philippines and the USA are slightly over-represented in the Wellington region (between 13% and 16% residing in Wellington rather than 11% for the total population). People from Sri Lanka and Iraq are significantly over-represented in Wellington with 20% and 23% respectively. People born in Australia (26%), Scotland (27%), Germany (28%), US (27%) and Japan (34%) were over-represented in the South Island as compared to the North Island, as over 24% of their populations resided in the South Island. People born in Japan and Korea were over-represented in Canterbury, with a quarter of people born in Japan and 15% of people born in Korea residing there compared to 13% of the total population. However, only 3% of people residing in Canterbury were born in North-East Asia, significantly less than the 8% born in North-West Europe.
34
Chapter Two: Belonging
Belonging as a domain of social cohesion means having a sense of being part of a wider community; trusting others; having a sense of shared values and commitment to society, while also recognising that people can belong to and identify with many groups.
Overview
• This chapter on the dimension of ‘belonging’ explores four main areas: trust, attachment to identities, satisfaction with life in New Zealand, and intention of staying in New Zealand.
• Migrants’ and refugees’ sense of belonging is to some extent shaped by behaviours and attitudes towards them. Adopting what may be perceived as a New Zealand identity and maintaining existing ethnic and cultural identities are key issues. The concepts of migrants and refugees identifying with the wider community on one hand, and maintaining connections to others similar to themselves on the other, are not mutually exclusive.
• Little information is available in New Zealand on the levels of trust between newer migrants and people established in New Zealand society (including those born in New Zealand and those having lived here for many years). Research conducted in 2005 showed only a small percentage of people (8%) reporting that they couldn’t trust people who were born overseas.
• Migrants and refugees reported a good deal of satisfaction with life in New Zealand, but one of the major areas of dissatisfaction was in employment and difficulties in finding work.
• Although some migrants spend a lot of time out of New Zealand, with some returning to their home country for work and family purposes, around three-quarters of migrants interviewed for the DoL’s Migrant Experiences of New Zealand – Pilot Survey Report Longitudinal Immigration Survey: New Zealand18 (LisNZ) had intentions of staying in New Zealand. About half of the interviewees had encouraged other people to migrate to New Zealand. Amongst the refugee population interviewed, almost all who had been here for two years were intending to stay with many intending to sponsor another family member.
• With the increased opportunities available internationally, some migrants do not stay in New Zealand permanently but travel elsewhere. Other migrants may choose to return home or move to another country because they have not settled in New Zealand or do not have a sense of belonging.
Introduction A sense of belonging in society is commonly anchored in experiences within communities, whether the local community (neighbourhood), the workplace and professional associations, or other communities of interest (eg sports, cultural pursuits and leisure interests). A sense of belonging can occur through identification with a particular group (eg ethnic group) as well as at a national level. Belonging involves people sharing some set of common experiences, aspirations, norms, values and social attitudes, and feeling committed to the community or communities within which they lead their lives. Belonging is important for all humans and can be 18 The pilot study for the Longitudinal Immigration Survey NZ (LisNZ pilot) interviewed migrants at 6 and 18 months after residence and was undertaken to trial aspects of the survey development ‘in the field’ in preparation for the main Longitudinal Immigration Survey: New Zealand (LisNZ). The primary objective of the LisNZ is to provide reliable and authoritative data about migrants’ initial settlement experiences in New Zealand and the outcomes of immigration policies The main LisNZ survey is currently in progress and interviews a representative number of migrants at 6, 18, and 36 months after residence.
35
especially challenging for migrants and refugees during the early period of moving to a new country. For some people, achieving a sense of belonging can be a difficult and long process, and some never feel like they belong. The degree of openness and welcoming nature of communities are important factors that contribute to how quickly new migrants and refugees feel they belong in New Zealand, and influences migrants’ and refugees’ many important decisions (eg to stay or leave, to participate in the community or retreat into isolation). Belonging is heavily influenced by attitudes of established communities in New Zealand to new migrants and refugees. Participating in employment plays a significant role for many people in determining whether they feel as if they belong in society. Remaining unemployed can be a major barrier to a sense of belonging. Migrant employment outcomes, as well as other labour market outcomes, are considered in Chapter Four on inclusion. Feelings of belonging can also result from developing and maintaining active community contacts. The level of migrants’ social participation is discussed further in Chapter Three on participation. When migrants do not feel as though they belong in wider society, they may withdraw into sub-groups based on what they most strongly identify with (ethnic, religious, cultural, sexual or political), or otherwise experience isolation and alienation. Belonging to a sub-group may be positive from the perspective of connecting with others who are alike, or who have shared similar experiences which may increase feelings of confidence and well-being. These are important factors when settling into any new environment, and may be especially important during the early stages of moving to a new country. Factors relevant to belonging Some psychological measures of identity (both national and ethnic) used in New Zealand include subscales of belonging, which indicate whether migrants feel that they belong in New Zealand. For instance, a subset of data from the International Comparative Study of Ethno-cultural Youth (ICSEY) shows that 17% of young people in New Zealand agree with the statement ‘I don’t feel that I belong in New Zealand’ (Ward, 2007b).
This chapter includes four factors relevant to the concept of belonging:
• Attachment to identities: indicates which groups migrants feel close to and where they feel they belong.
• Trust in others: can underpin the development of positive relationships (Ministry of Social Development 2006: 118).
• Satisfaction with life in New Zealand: is positively correlated to a sense of belonging. Migrants are more likely to state that they are satisfied with life in New Zealand if they feel that they belong.
• Intention of staying in New Zealand: provides a partial indicator of belonging given that there are numerous factors that influence migrants’ decision to stay or leave New Zealand.
36
Attachment to identities
When people claim an identity, they recognise who it is that they share values, experiences and beliefs with, and conversely who they consider to be different (Calhoun 1994: 20). When people choose or affiliate with a particular identity it reflects which group they relate to more than others. People do not necessarily hold their cultural or ethnic identity as most important. People can have more than one identity at any one time and these identities can change over time and in different contexts. Some people may ‘privilege’ or use certain identities more in particular contexts than others. Identifying with the wider community may indicate a relatively strong sense of belonging. Conversely, maintaining a strong attachment to an exclusive group at the expense of other groups may have negative implications for social cohesion. International Social Survey Programme – National Identity Survey 2003
In the International Social Survey Programme’s National Identity survey in 2003 (Gendell 2003), people were asked to consider their sense of belonging to New Zealand and their ethnic group.19 Most respondents (58%) thought of themselves only as New Zealanders, or as a New Zealander first and a member of an ethnic group second (28%). Ten percent of respondents identified with their ethnic group first and New Zealand second; and 1% identified with their ethnic group only. This survey is a household-based survey (i.e. it covers everyone) rather than a migrant one so needs to be considered in this context. The International Comparative Study of Ethno-cultural Youth data shows that migrant young people identify more strongly with their ethnic group than the national group, although the DoL report (Ward, 2007a) shows that by the second generation, there are no significant differences between strength of ethnic and national identity.
When coming into a new culture, migrants and refugees may experience a sense of loss (Ho et al 1999: 24), which can create difficulty in finding a place to belong in a new environment. Arriving in a new culture and adjusting to what may be an unpredictable future can be made easier by retaining familiar traditions and practices (Bihi 1999: 103). Migrants and refugees who participated in the LisNZ20 and Refugee Voices: A Journey Towards Resettlement21 (Refugee Voices) generally felt that maintaining their cultural identity was important (NZIS 2004a: 110, NZIS 2004: 324). While maintaining a “home” cultural identity may be beneficial, there is evidence that too strong an affiliation with an overseas cultural identity, together with a weak link to New Zealand culture, can result in a lack of participation in the host society (Ho et al 1999: 24). Maintaining an original cultural or ethnic identity and learning about a new culture are not mutually exclusive. Being “doubly-attached”, i.e. attached to one’s own cultural or ethnic identity and to the culture of a new country, can help foster a sense of belonging and be beneficial for migrants’ wellbeing. In a study of young people in New Zealand, retaining an ethnic identity together with taking on a new national
19 The International Social Survey Programme is undertaken in New Zealand as a mail out self-complete survey with a sample of just over 1000. 20 The pilot study for the Longitudinal Immigration Survey NZ (LisNZ pilot) interviewed migrants at 6 and 18 months after residence and was undertaken to trial aspects of the survey development ‘in the field’ in preparation for the main Longitudinal Immigration Survey: New Zealand (LisNZ). The primary objective of the LisNZ is to provide reliable and authoritative data about migrants’ initial settlement experiences in New Zealand and the outcomes of immigration policies The main LisNZ survey is currently in progress and interviews a representative number of migrants at 6, 18, and 36 months after residence. 21 Three hundred and ninety eight refugees were interviewed for the Refugee Voices research into the resettlement experiences of refugees in New Zealand. The first group, recently arrived refugees, consisted of Quota, Convention and Family Reunion refugees who were interviewed after six months in New Zealand (209 people) and then again at two years (162 people). The second group, established refugees, included Quota refugees who had been in New Zealand for around five years (189 people).
37
identity were associated with better school adjustment, educational achievement and wellbeing, including high levels of self-esteem and life satisfaction (Ward and Lin 2005: 161). The Pacific Island Families Study, a prospective investigation of a cohort of 1398 Pacific infants born during the year 2000 and their parents, identified that mothers with high cultural orientation toward Pacific and New Zealand identity as well as those engaging significantly with Pacific Island cultural norms were least likely to suffer post-natal depression. These findings suggest that retention of traditional Pacific identity and culture serve a protective role with respect to postpartum psychological disorder (Abbott and Williams: 2006). While some young people may feel that growing up in “two different worlds” is a source of tension (Ip 1996: 14), integrating both original and new identities was the approach favoured by the young people who took part in the Ward and Lin (2005) study. This approach was also considered by New Zealand European / Pakeha young people as the one that migrants should adopt (Ward and Lin 2005: 163). The same favoured approach has been found for adults. Ward and Masgoret’s (2004) survey of 500 New Zealanders found that a large majority of participants (83%) agreed that immigrants should retain their original culture while also adopting New Zealand culture. Refugees want to be seen as New Zealanders
Butcher et al’s (2006) study of migrants’ experiences of discrimination found that refugees, in particular, expressed their desire to be seen as “New Zealanders”. For example, one participant noted:
We are not…[just] Somalian, you know, we are New Zealanders. …we are keeping our culture. Everyone has a culture…we have [a] good culture…[but] we have to believe that we are New Zealanders and [New Zealanders] have to accept that we belong to them.
Samoan New Zealand-born identity
Many New Zealand-born Samoans experience a dilemma of identity. In Samoan communities they may not be considered ‘Samoan enough’. In the wider New Zealand community Samoans have been taunted as ‘not New Zealanders’, ‘coconuts’, or ‘FOBs’ (fresh off the boat).
Many New Zealand-born Samoans may react by taking on a Pacific Island (PI) identity – combining elements of their parents’ customs and society with urban influences. The PI identity provides a broader identity than ‘Samoan’ and has been adopted by mainly younger, New Zealand-born Pacific Islanders, who feel a greater bond with one another than do their island-born elders.
PI identity is a phenomenon of young people. When they mature and have their own children, Samoans tend to return to their ethnic identity.
Misatauveve Melani Anae ‘Samoans’, Te Ara – the Encyclopaedia of New Zealand updated 21 December 2006 URL : http://www.TeAra.govt.nz/NewZealanders/NewZealandPeoples/Samoans/en
As noted earlier, more inclusive attitudes towards people can create an environment that makes people more at ease in attaching themselves to new identities, and facilitates the expression of diverse identities, as well as their sense of belonging. In Ho’s (1995) study of 283 Hong Kong Chinese adolescents, she found that adolescents’ feelings of being marginalised could be moderated if New Zealanders’ attitudes towards the maintenance of minority cultural identity were positive.
38
People who are hostile toward particular groups can create a more difficult environment for people to feel that they belong, or to integrate into New Zealand society (Bihi 1999: 110). Where people perceive negative attitudes and discrimination, they are more likely to retreat to their own communities (Ward and Lin 2005: 166). New Zealanders’ attitudes towards migrants and refugees, including discriminatory attitudes, are discussed further in Chapter Five on recognition. Asian migrant adolescents
In Bartley’s (2004) study of 121 Asian migrant adolescents who migrated to New Zealand with their parents, other people’s reactions to the participants affected their subjective feelings of whether they belonged (Bartley 2004: 165). One participant noted (Bartley 2004: 165):
I think other people’s reactions are quite important, because even if you feel like you really, really belong here, like some Asians were born in New Zealand, I’m guessing they might not feel like they really belong here, because other people’s reactions to them would think, ‘You’re still an Asian,’ and sometimes they do things like otherwise, like being told to go home, when it is their home, they were born here. So, yeah, that’s very important. To feel like you really belonged, I think the society, other people, have to accept you, to make you feel like you really belonged.
Many of the participants felt that there were boundaries that impeded or prevented them from being accepted by the host society as belonging and, therefore, considered that the goal of belonging was just one in a range of possibilities including going back to their country of origin or moving to another country (Bartley 2004: 165).
Migrants and the Treaty of Waitangi
Some migrants and refugees are concerned about where they fit within a Treaty-based society (Ip 2005) and feel excluded by discourses on the Treaty (Rasanathan 2005). McGrath et al (2005) found, in their study Engaging Asian Communities in New Zealand, that participants had a range of perceptions about where they fit in relation to the Treaty of Waitangi. Some participants felt that the Treaty was presented as a Māori/Pakeha issue therefore the Treaty had no relevance to them (McGrath et al 2005: 28). Other migrants such as some Pacific peoples, think of themselves not as tauiwi (foreigners) but as ‘cousins’. Different understandings of the Treaty are also prevalent in the New Zealand-born population. Quality of Life Survey 2006 – Local Communities (Belonging)
The Quality of Life Survey measures people’s overall quality of life. Participants in the survey are residents of twelve City Council areas in New Zealand, and there is an additional sample of the remainder of New Zealand to provide a national picture.
The 2006 survey found that about 59% of the New Zealand-born population agreed or strongly agreed that they felt a sense of community with others in their local neighbourhood, compared with about 61% of the overseas-born.
39
Trust in others Trust in others is an important indicator of how people feel about members of their community. If people trust each other, they tend to be more willing to interact and engage with each other, facilitating the formation of positive relationships and a sense of belonging. A high level of trust makes dealings between people easier; people are more likely to employ or do business with people they trust. There is very little information in New Zealand on the level of trust between migrants and the wider community. Quality of Life Survey 2006 - Trust
The 2006 survey asked residents about how trusting people are.
The overseas-born population and the New Zealand-born population gave similar responses to the question of how trusting they thought people are. Almost 76% of participants who were born overseas thought that people could usually or almost always be trusted, compared with 73% of the New Zealand-born. New Zealand Values Survey 2005
The New Zealand Values Survey is part of a wider World Values Study that is conducted in many countries throughout the world. The Values Survey covers a range of topics including people's values relating to economic, social and political matters. The 2005 New Zealand survey asked people about their level of trust towards people from specific groups.
• Only 8% of participants said that they did not trust very much, or did not trust at all, people from other countries living in New Zealand.
Satisfaction with life in New Zealand Migrants’ views on whether they feel satisfied with life in New Zealand provide an indication of their sense of belonging to their community and to New Zealand. If people feel included in the society they live in then they will more likely be satisfied with their life and feel that they belong. The International Comparative Study of Ethno-cultural Youth research, as described earlier in this chapter, included results that show that life satisfaction is predicted by integration, English language proficiency and low levels of discrimination. The first wave of the Longitudinal Immigration Survey:New Zealand (LisNZ) found that the majority of migrants interviewed were satisfied with life in New Zealand (Statistics NZ 2008). Ninety-three percent of migrants surveyed by the DoL reported feeling satisfied or very satisfied with their life in New Zealand at six months following take up of permanent residence in New Zealand. Pacific migrants felt the highest levels of satisfaction overall, with 96% reporting feeling satisfied or very satisfied. Overall, the three main reasons migrants gave as to why they liked living in New Zealand were: New Zealand’s climate and natural beauty (77%), New Zealand’s friendly people or relaxed pace of life (63%), and the ability to achieve one’s desired lifestyle (62%). While these three reasons were preferred by skilled (principal and secondary) and family partner migrants, other migrants’ preferences differed based on immigration approval category. Job opportunities (66%), the educational system and educational opportunities (66%) were the top reasons given by Pacific migrants, and having family in New Zealand was a positive factor for family parent migrants (71%). Similarly, many of the refugees who had spent two years in New Zealand and were interviewed for Refugee Voices, said that they felt settled. The main reasons given were that they considered New Zealand a peaceful and safe place, and because they
40
found New Zealanders to be kind and friendly (NZIS: 334). Both migrants and refugees said that one of their greatest dislikes about New Zealand was the difficulty in finding work (NZIS 2004:100; NZIS 2004a:335). Other dislikes reported by migrants interviewed in the first wave of the LisNZ survey were: high taxes or difficulties understanding the tax system (36%), distance of New Zealand from home and family (34%), and the cost of health services (28%). A 2007 academic paper on identity, acculturation and adaptation in migrant youth shows that they compare favourably to other youth in terms of adaptation (life satisfaction, psychological symptoms, school adjustment and behavioural problems). Despite experiencing more discrimination than New Zealand Europeans, migrant youth are on the whole well-adapted and satisfied with life. There are differences, however, across ethnic groups. This research also shows that integrated young people (those who maintain their culture of heritage as well as adopting a New Zealand culture) are the best adjusted (Ward 2007b). Refugee Services The RMS (Refugee and Migrant Service) Refugee Resettlement’s Volunteer Support Worker programme is an NZQA-registered course and unique for being the only national programme of its type in the world. The programme was featured at the 2007 Global Tripartite consultations on refugee resettlement in Geneva, and is regarded as a model of international best practice. RMS has also produced an audio-visual production ‘Belonging is a Feeling’ which is used by a growing number of resettlement countries around the globe to support their efforts to promote similar community engagement. The ‘Refugee Voices’ research, which is cited in this report, identifies RMS as the primary source of support and linkage into the community for many refugees. Intention of staying in New Zealand Two indicators of whether migrants feel like they belong in New Zealand are whether they intend to encourage other family and friends to immigrate here, and whether they intend to remain in New Zealand. With global competition for skilled migrants and greater mobility enabled by enhanced transportation and communication links, migration for some may occur more than once. Experiences and intentions of refugees will be different to those of migrants, for example because some refugees cannot choose where they move to. Many migrants have strong intentions to stay in New Zealand. The LisNZ survey in wave 1, reported that 84% of migrants intended to live in New Zealand permanently (defined as five years or more)22. After 12 months, 71% of participants in the Department of Labour’s 2005 survey of skilled migrants planned to live in New Zealand for at least five years or longer (Badkar 2007: 57). After two years, almost all refugees (98%) in the Refugee Voices survey stated that they felt settled and intended to stay in New Zealand (NZIS 2004: 345). Family reunification was of primary importance to many refugees interviewed for Refugee Voices, with many intending to sponsor family to come to New Zealand (NZIS 2004: 145). Overall around half of migrants interviewed at 18 months for the LisNZ pilot survey reported that they had already encouraged others to apply for residence in New Zealand (NZIS 2004a: 114). It is common for migrants to come to New Zealand in a temporary capacity before deciding to move permanently. Likewise, International students who move to New
22 Statistics New Zealand, Longitudinal Immigration Survey (LisNZ), Wave 1, 2008.
41
Zealand for education may then decide they wish to stay. Over half of the international students interviewed by the Ministry of Education (MoE) planned to remain in New Zealand after completing their current course of study. Periods of absence from New Zealand can be an indicator of a lack of sense of belonging and of not having a strong attachment to New Zealand, although this is not necessarily the case. Migrants, like many New Zealand-born people, will spend time out of the country. Global trends indicate that migration is now less permanent and more dynamic than previously. Migrants often spend time out of the country for a variety of reasons, such as to meet business commitments or to visit family and friends overseas (DoL 2006: 89). In search of a better future
Ho et al’s (1996) report on a 1995 survey of 500 Chinese and Korean adolescent migrant students found that many students were motivated to seek employment overseas to gain more enriching life experiences and better career opportunities, with a view to returning to New Zealand after some years. This trend is similar to the motivation for “overseas experience” among European New Zealanders. Others indicated they may not leave if they could find suitable employment in New Zealand.
Young migrant aspirations Bartley’s (2004) study of 121 Asian migrant adolescents found:
• just over a quarter (28%) indicated a preference for remaining in New Zealand, while nearly 45% indicated a preference for returning to their country of origin
• no interview participants felt that New Zealand was their permanent home – they expressed a considerable degree of flexibility about their future prospects
• some talked of going back to their country of origin as they thought getting a job would be easier there, they would enjoy a higher social status and they expected to be able to fit in
• others stated a desire to remain in New Zealand because their fluency in their original language had declined too much to be able to return to their country of origin. The people had got used to living in New Zealand and the prospect of moving to a third country would mean a new adjustment process
• others mentioned the possibility of on-migration, to Australia, the US or other parts of Asia.
Some migrant families who fail to secure suitable employment may adopt a strategy where one partner will return to their country of origin to work or do business, leaving their spouses and children in New Zealand, often referred to as “astronaut” migration (DoL 2000: 3, Ho 2002: 154).
42
Hong Kong Chinese families in the new millenium
Ho (2002) used longitudinal survey data to explore the dynamics of some Hong Kong Chinese families that settled in New Zealand in the early 1990s. She found that the ‘astronaut’ family that was common in the early 1990s was no longer common in the new millennium. In 2000, twenty-four of the families first surveyed in 1992 had a range of family outcomes:
• six families who were re-surveyed maintained a nuclear family structure over the eight years
• in four families older “astronauts” had reunited with their spouse and children in New Zealand
• two families had all their members relocate back to Hong Kong
• eight families had their members spread across New Zealand and Hong Kong
• four families had extended their family networks beyond Hong Kong and New Zealand.
Despite high levels of satisfaction with life in New Zealand as reported by adult migrants (LisNZ survey discussed previously), New Zealand also loses some migrants permanently. Some reasons for this permanent migration include migrants not intending to stay permanently, being unable to find work, global labour markets and competition for skilled labour, family and business commitments outside of New Zealand, difficulty in settling and a lack of sense of belonging, and other expectations of New Zealand not being met (Shorland 2006: 89). People on the Move: A Study of Migrant Movement Patterns to and from New Zealand
The Department of Labour’s 2006 study of migrant movement patterns to and from New Zealand examined the non-return rates (defined as remaining outside of New Zealand for at least 12 months) at 31 December 2004 of migrants approved between 1998 and 2003. The study found that the rate of non-return for the 1998 cohort was 19% - the rates of non-return were similar for each cohort. The nationalities with the highest rates of non-return were Taiwan (38%), Singapore (24%) and Hong Kong (24%). Migrants from these countries were also the most likely to be long-term absent from New Zealand (defined as a spell of absence for six months or longer). Migrants from Canada and the USA also had comparatively high rates of non-return (22% and 17% respectively). Overall, the rate of non-return was highest for the Skilled/Business Stream and lowest for the International/Humanitarian Stream.
Future plans of Koreans in Christchurch
Chang et al (2006) interviewed 36 Korean migrants for the Families Commission report Korean Migrant Families in Christchurch: Expectations and Experiences. Chang et al found that of those participants in the study who planned to leave New Zealand, most did not intend to go back to Korea. Instead they thought they would go to Australia or the US, particularly after their children had finished their high school education. One participant in the study said that some Koreans who cannot get a job and are unhappy in Christchurch wait until their children have finished their education and then leave.
Although it seemed to be rare, the study found that some people had heard of families returning to Korea because they found it too hard to survive financially in New Zealand. One participant said New Zealand was good in terms of education but did not really provide jobs. Her siblings all either went back to Korea or migrated to other countries to find jobs after they graduated. Another said that 80% of her friends had left New Zealand for Australia, Canada or Korea, mainly because it was hard to get a job in New Zealand. However, they said they wanted to return to New Zealand when they had children or decided to settle down. It seemed many Koreans felt that they could not return to Korea, as this would mean a loss of face.
43
Citizenship Citizenship could be considered an indicator of attachment to New Zealand and intention to remain. However, the relationship between citizenship and belonging is not straightforward due to the effects of the incentives linked to citizenship laws and rights. Some countries’ citizenship laws do not permit dual citizenship and given the ample rights for New Zealand permanent residents, some migrants may be encouraged to maintain their current citizenship rather than relinquish it in order to gain New Zealand citizenship. New Zealand’s citizenship laws bestow permanent residents with many of the same rights as New Zealand citizens, including voting, and permits dual citizenship. One of the few additional benefits of New Zealand citizenship are travel related; the internationally accepted New Zealand passport and also easy access to Australia – therefore ironically citizenship could be a step taken in order to leave New Zealand in some circumstances. As a result, citizenship alone should not be considered a reliable indicator of immigrants’ identification with the host society or marking the completion of the migration process and becoming a New Zealander.23 In terms of examining citizenship uptake there is no definitive New Zealand data that accurately tracks a specific migrant cohort from their arrival and monitors their citizenship uptake. However, comparing aggregate numbers of permanent residence approvals to aggregate numbers of citizenship approvals once migrants are eligible for citizenship (after three years prior to 2005 in New Zealand) a rough snapshot of citizenship uptake can be established. A study that compared numbers of permanent resident approvals in 1992 and 1993 with subsequent citizenship approvals found that citizenship approvals in 1995 and 1996, the first years these permanent residents would be eligible for citizenship, totalled 50% of the permanent resident flows in 1992 and 1993.24 The study also highlighted that 25% of those granted citizenship in 1996 had been resident for over 6.5 years, although the median length of residence was 3.6 years. Therefore, this data indicates that over half of all citizenship approvals in 1996 were from people who had moved to New Zealand between 3 and 4 years earlier in 1993. Comparing permanent residency approvals from 1994 to 2002 with citizenship applications from 1997 to 2005 indicates that 56% of migrants from 1994 to 2002 had gained New Zealand citizenship.25 There is a variance in the citizenship uptake for different source countries. Some of the variance may relate to immigration from some countries being weighted towards the earlier period thus giving migrants more opportunity to become citizens, while some may be dependent on the citizenship laws of their source countries. Migrants moving on to other countries before they are able to qualify for citizenship could also decrease citizenship uptake of these flows of permanent residents in New Zealand. Intangible benefits of New Zealand citizenship, such as feeling part of New Zealand or pride will also be a factor for some people but distinguishing this from other motivations is not possible from this quantitative data. India and Tonga did not permit dual citizenship between 1994 and 2002, which is reflected in the lower citizenship take-up rates for permanent residents from these countries. Comparing numbers of permanent residents to people granted citizenship suggests less than 40% of people migrating from Tonga and India between 1994 and 2002 transitioned to citizenship by the end of 2005. In comparison, 75% of people who migrated from Samoa and 64% of people from Sri Lanka, where both permit
23 Burke, Kerry, 1986, “Review of Immigration Policy,” Appendix to the Journals of the House of Representatives 1986–87 p44. 24 Thompson, D., 1997, “Comparison of New Zealand residence approvals and New Zealand citizen applications,” Report prepared for New Zealand Immigration Service, Wellington. 25 Statistics New Zealand, Tourism and Migration, 2000–2005 releases.
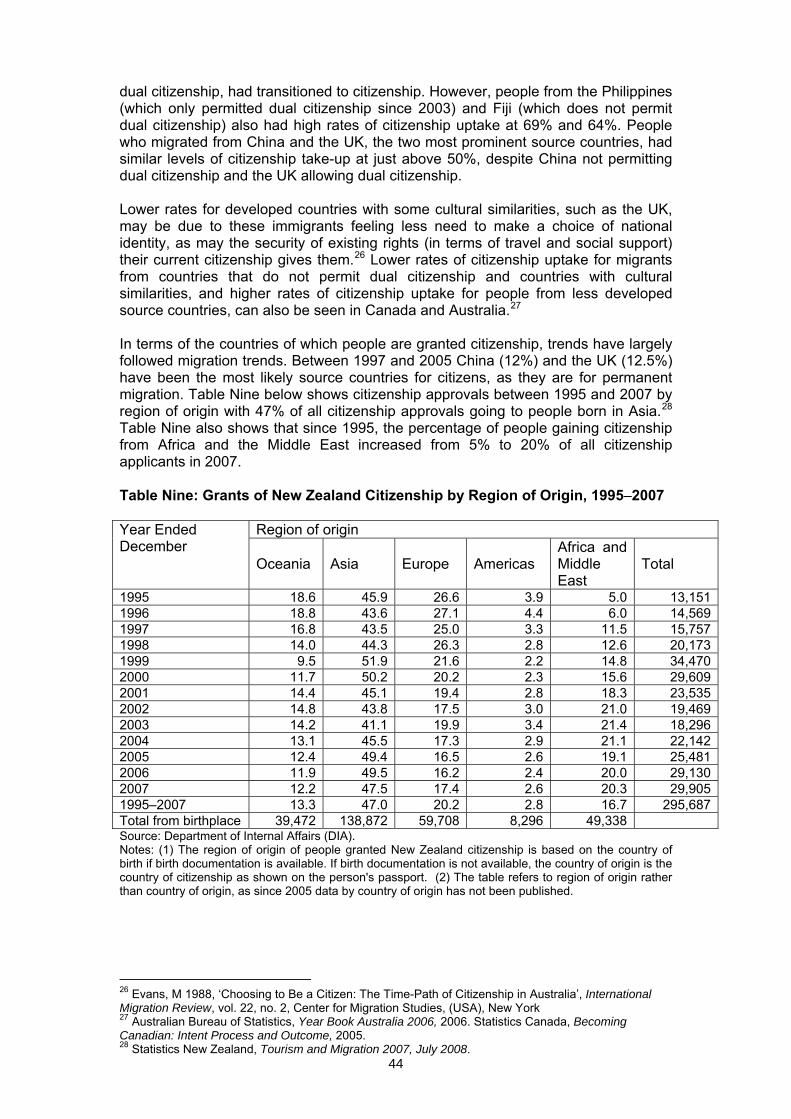
44
dual citizenship, had transitioned to citizenship. However, people from the Philippines (which only permitted dual citizenship since 2003) and Fiji (which does not permit dual citizenship) also had high rates of citizenship uptake at 69% and 64%. People who migrated from China and the UK, the two most prominent source countries, had similar levels of citizenship take-up at just above 50%, despite China not permitting dual citizenship and the UK allowing dual citizenship. Lower rates for developed countries with some cultural similarities, such as the UK, may be due to these immigrants feeling less need to make a choice of national identity, as may the security of existing rights (in terms of travel and social support) their current citizenship gives them.26 Lower rates of citizenship uptake for migrants from countries that do not permit dual citizenship and countries with cultural similarities, and higher rates of citizenship uptake for people from less developed source countries, can also be seen in Canada and Australia.27 In terms of the countries of which people are granted citizenship, trends have largely followed migration trends. Between 1997 and 2005 China (12%) and the UK (12.5%) have been the most likely source countries for citizens, as they are for permanent migration. Table Nine below shows citizenship approvals between 1995 and 2007 by region of origin with 47% of all citizenship approvals going to people born in Asia.28 Table Nine also shows that since 1995, the percentage of people gaining citizenship from Africa and the Middle East increased from 5% to 20% of all citizenship applicants in 2007. Table Nine: Grants of New Zealand Citizenship by Region of Origin, 1995–2007
Region of origin Year Ended December
Oceania Asia Europe Americas Africa and Middle East
Total
1995 18.6 45.9 26.6 3.9 5.0 13,151 1996 18.8 43.6 27.1 4.4 6.0 14,569 1997 16.8 43.5 25.0 3.3 11.5 15,757 1998 14.0 44.3 26.3 2.8 12.6 20,173 1999 9.5 51.9 21.6 2.2 14.8 34,470 2000 11.7 50.2 20.2 2.3 15.6 29,609 2001 14.4 45.1 19.4 2.8 18.3 23,535 2002 14.8 43.8 17.5 3.0 21.0 19,469 2003 14.2 41.1 19.9 3.4 21.4 18,296 2004 13.1 45.5 17.3 2.9 21.1 22,142 2005 12.4 49.4 16.5 2.6 19.1 25,481 2006 11.9 49.5 16.2 2.4 20.0 29,130 2007 12.2 47.5 17.4 2.6 20.3 29,9051995–2007 13.3 47.0 20.2 2.8 16.7 295,687 Total from birthplace 39,472 138,872 59,708 8,296 49,338 Source: Department of Internal Affairs (DIA). Notes: (1) The region of origin of people granted New Zealand citizenship is based on the country of birth if birth documentation is available. If birth documentation is not available, the country of origin is the country of citizenship as shown on the person's passport. (2) The table refers to region of origin rather than country of origin, as since 2005 data by country of origin has not been published.
26 Evans, M 1988, ‘Choosing to Be a Citizen: The Time-Path of Citizenship in Australia’, International Migration Review, vol. 22, no. 2, Center for Migration Studies, (USA), New York 27 Australian Bureau of Statistics, Year Book Australia 2006, 2006. Statistics Canada, Becoming Canadian: Intent Process and Outcome, 2005. 28 Statistics New Zealand, Tourism and Migration 2007, July 2008.
45
What could be explored further? Some overseas research is showing that the second generation have less sense of belonging than their first generation migrant parents, so this could be an important topic for future research in the New Zealand context. Other research areas could include: the process of establishing a sense of belonging, including self-identification as a New Zealander; more direct assessment of the extent to which migrants feel they belong; and an assessment of the acceptance of diverse cultural groups by the host community in New Zealand.
46
Chapter Three: Participation Participation as a domain of social cohesion includes involvement in social activities, in community groups and organisations, and in economic, cultural, political and civic life (such as voting in elections or participating in consultation or submission processes).
Overview
• The focus for the theme of ‘participation’ is on social connectedness, and participation in social and civic affairs. Some discussion of English language proficiency is also included.
• Activities and actions such as joining clubs, participating in cultural and arts events, undertaking volunteer work outside the home (this can also be undertaken for other reasons such as a stepping stone to a job and cultural expectations) are ways for newcomers to become integrated in the wider society. Levels of volunteer work undertaken by migrants are similar to those of New Zealand-born people with some variations based on birthplace and age.
• Being able to connect with others, form friendships and relationships, as well as maintain links with families and friends overseas, are important elements of migrants’ and refugees’ settlement experiences. Issues around making friends and barriers to connecting have been highlighted in this chapter, including access to telecommunications.
• The level of political engagement of migrants may be influenced by people’s experiences before they move to New Zealand. There is little data available to show level of voter turnout by different migrant and ethnic groups in New Zealand. However it is worth noting that New Zealand is one of the few countries that enable migrants and refugees to vote as permanent residents as well as citizens.
Introduction
Participation involves having and exercising the opportunity to:
• contribute to neighbourhood, community and national life
• influence decisions that affect everyone (eg by participating in local governance and consultation processes, and voting in local body and national elections).
Participation in employment is a key way in which migrants take part in the wider community and extend their social networks. Migrant employment and other labour market outcomes are covered in Chapter Four on inclusion.
Effective participation can be challenging for new migrants depending on:
• their legal status in New Zealand, since some important activities require migrants to have certain pre-requisites (eg need to be a permanent resident to be able to vote in local and national elections)
• their need to ‘come up to speed’ with current social and political issues – be it in their new neighbourhood or in national politics
• their English language proficiency, which can especially affect the ability to participate in the wider community.
47
If migrants do not get the opportunity to fully participate in economic, social and cultural life, they may experience loneliness and isolation, and be at risk of social alienation. Factors relevant to participation
This chapter reviews:
• Social connectedness: This comes from participation within immediate social groups or in the wider community, including making friends, involvement in clubs, cultural and volunteering activities and access to telecommunications
• Participation in political and civic affairs: Active political and civic participation can be a precursor to representation on, for example, school boards of trustees, or in local or national government. Voting is also an important marker of participation. Political and civic representation is discussed in Chapter Five on recognition.
• English language proficiency: The importance of English language as an aspect of being able to participate is highlighted in this chapter (further discussion of English language is covered in Chapter Four on inclusion).
The role of schools and early childhood education
“Schools play a vital role in helping the children of migrants and refugees understand their new country and connect with the wider host community” (Auckland Regional Settlement Strategy ARSS goal 5 p.45). Early childhood education also provides a foundation for learning and social interaction.
The OECD publication Where Immigrants Succeed: A Comparative Review of Performance and Engagement in PISA 2003 (OECD 2007) provides information on the level of ‘segregation’ in terms of the schools immigrant and New-Zealand-born students attend. In New Zealand, more than 30% of second-generation students attend schools where at least half of the students are immigrants (defined as both first and second-generation students). The clustering of first-generation students in New Zealand schools is less pronounced: more than 20% of first-generation students are in schools where at least half of the students are immigrants. The OECD concluded that the size of the immigrant student population in a particular school was not significantly associated with the size of the performance difference between immigrant and New Zealand students.
The MoE collects school roll data and data on participation in early childhood education by ethnicity. Ethnicity data is also collected by schools for exclusions, stand-downs, suspensions and expulsions (i.e. young people who do not participate in school). MoE data in these areas has not been analysed for this report.
48
The link between social capital and ethnic diversity
The Social Capital Benchmark Survey (2000) in the US suggests that ethnic diversity tends to reduce social solidarity and social capital (social networks and norms of trust) in a society and to increase social isolation, at least in the short-term post-immigration, until new or more encompassing identities are formed. A Canadian researcher, Helliwell (2003) has challenged these findings. Helliwell found that the links between social capital and diversity depend on the institutional context – specifically whether immigration policy is assimilation-focused29 (eg US and France) or integration-focused (eg Canada).30
Social connectedness People who have recently arrived in New Zealand may postpone joining wider social networks and clubs until they have organised other things like finding employment and suitable accommodation (Trlin et al 1999: 109). Migrants may firstly look to their own community for support during the initial stages of settlement. This is also true of people generally who move within New Zealand. Developing links within one’s own community can help maintain identity and culture and provide support. However, having very strong links only to one’s own community can hinder the connecting process to the wider society (Ho et al 1999:30). Transnational linkages
Many migrants maintain strong links with their countries of origin while also feeling well-settled in New Zealand. These ‘transnational’ linkages help migrants maintain their original culture and remain informed about activities and events in their home countries (Spoonley et al 2004:177). Maintaining strong links with family and friends overseas may provide an important avenue of support for migrants adjusting to life in a new country and can also give people the confidence in their own identity to then engage with wider society. However, some migrants may depend so heavily on their links to their country of origin that it hampers their participation in their new community (Spoonley 2004:237).
Quality of Life Survey 2006
The 2006 survey provides information on the types of contact people have with others in their neighbourhood and whether people feel lonely or isolated:
• around 94% of overseas-born people (compared to 96% New Zealand-born) had some positive contact (such as a nod or saying hello) with people in their neighbourhood over the last 12 months; and almost 74% (around 72% New Zealand-born) had positive contact (such as a visit or asking each other for small favours), so figures were similar between the two population groups.
• almost 22% of overseas-born people feel lonely either most of the time or sometimes (compared to about 15% New Zealand-born). A higher reported percentage of feeling lonely by the overseas-born may indicate a number of things such as missing wider family, friends, culture and other things of familiarity, as well as current living conditions.
29 Assimilation-focused refers to an adaptation strategy whereby the migrant, or migrant group, takes on the customs, values and social attributes of the host society to the extent that the migrant becomes behaviourally indistinguishable from the majority. 30 Integration may be defined as a process by which the migrant, or migrant group, becomes an active member of the host society, yet simultaneously maintains their ethnic identities.
49
Barriers to connecting with the wider community Many migrants form support networks and make friends, both with members of their own community and with the wider community through neighbours, work, school and joining clubs. However, connecting with the wider society is not always easy. For example, migrants who come from non-English speaking backgrounds, migrant mothers at home with children, older migrants and teenagers, among others, may find it more difficult to form social networks (Ho et al 2000: 31), particularly outside their own community groups. As a consequence, their participation in society may be limited and they may be more at risk of experiencing loneliness and isolation. Perspectives of recent arrivals from East Asia
Lidgard’s (1996) report on in-depth interviews with 42 recent East Asian migrants to New Zealand found that some women mentioned difficulties they experienced in trying to become part of the community. One woman from Hong Kong said, “new immigrants don’t really want to stick together but if they feel unwelcome they do”. Migrants in Lidgard’s study felt that few channels existed to act as bridges into the local society and that New Zealand people did not seem to understand this need.
English language proficiency One of the major influences on the ease with which migrants are able to make friends in New Zealand, especially with people outside their own community group, is their level of English language proficiency. It is also an important influence on labour market outcomes which is discussed further in Chapter Four on inclusion. Proficiency in English provides a means of learning about society and engenders a sense of being part of that society (Fletcher 1999: 52). A lack of English language ability may result in some migrants relying heavily on their own ethnic group for social interactions. For some community members, everyday life can be lived almost entirely within their own ethnic community (Smith 1996: 208). Other barriers to connecting with the wider community include lack of confidence, transportation difficulties, a lack of suitable venues for socialising and a lack of resources (Ho et al 2000: 31). Several studies have recognised the important part that English language proficiency plays in influencing migrants’ labour market outcomes (Winkelmann and Winkelmann 1998, Boyd 2003, Fletcher 1999, DIA 1996, Henderson et al 2006). For example, in High Hopes the DIA (1996: 42) found that migrants who were fluent in English when they arrived in New Zealand were more likely than other respondents to be employed in the field in which they were qualified. Winkelmann and Winkelmann’s study of the labour market position of migrant cohorts using 1981, 1991 and 1996 Census data (1998: 63) found that the incomes of migrants proficient in English exceeded those of similar migrants who were non-proficient by approximately 37%.
Migrants who want to improve their English language skills may decide to take time out from looking for employment in order to take up English language courses. At the same time, migrants have reported that they find that interaction in the workplace is one of the most useful means of improving English (White et al 2002: 151).
50
Employers’ concerns about English language proficiency
Some employers have reported concerns about migrants’ English language proficiency. These concerns include the ability to follow instructions and safety manuals, the level of customer service, and the time it takes to train migrants whose first language is not English (McLaren and Spoonley 2005: 27). However, a DoL report on employer attitudes to skilled migrants (Wallis and BRC Marketing and Social Research Ltd 2006: 58) found that “90% of employers reported that the job performance of the migrants they had hired was not affected by difficulties with the English language.” Migrants and refugees may have motivations for learning English which are not associated with finding a job. English language proficiency (ELP) is important for social and psychological wellbeing, and a MoE report shows that international students with better English language proficiency had more friends and were more satisfied with their life in New Zealand. However, some barriers to people learning English include differences in teaching/learning styles and their self-confidence. Other settlement issues such as housing, employment and family situation can also impact on language acquisition. Just over half of the migrants interviewed in the LisNZ pilot survey (NZIS 2004a: 23) said that English was the language or one of the languages they spoke best at six months after residence uptake. Migrants from Europe, South Africa, North America (ESANA) had the strongest English language skills overall (likely due to English being a language of education in those countries) and migrants from North Asia had the weakest. Only around one in 10 migrants who spoke English as a second language rated their English language ability more highly at 18 months than when they were first interviewed at six months (NZIS 2004a: 24). Findings from the LisNZ wave 1 survey of migrants six months after their arrival provide information on English language ability by immigration category. Consistent with immigration policy requirements, skilled category migrants, both principal and secondary applicants, had the best English ability with over 70% describing English as the language they spoke best. Business and family (parent) category migrants reported the lowest English language ability. Fifty-one percent of family (parent) migrants and 42% of Business migrants describe their English language skills as moderate or poor.31 Findings from Refugee Voices (NZIS 2004: 191) indicate that refugees’ English language ability improved after time spent in New Zealand. On a self-rated assessment of English language ability, seventeen percent of recently arrived refugees could speak English well or very well on arrival, which improved to 43% at two years. Convention refugees had better English on arrival than other refugees with 41% stating that they could speak English well or very well, improving to 75% after two years. Quota refugees reported the lowest levels of English language ability, with 46% stating that they could not speak English well at two years. On a regional basis, refugees from South Asia reported being the most proficient in English (NZIS 2004: 192). The 2006 Census asks people to list the languages they can hold an everyday conversation in, including English.32 In 2006, 25–54 year old33 migrants born in Korea, Samoa and China were the least likely to be able to converse using English in
31 Statistics New Zealand, Longitudinal Immigration Survey (LisNZ), Wave 1, 2008. 32 The results for this census question are self-reported and a wide range of competency is captured in the measure. 33 Outcomes for the population aged 25–54 are examined in order to exclude children who may not have developed English skills, and so that English language use can be linked to the working-age population and their employment status.
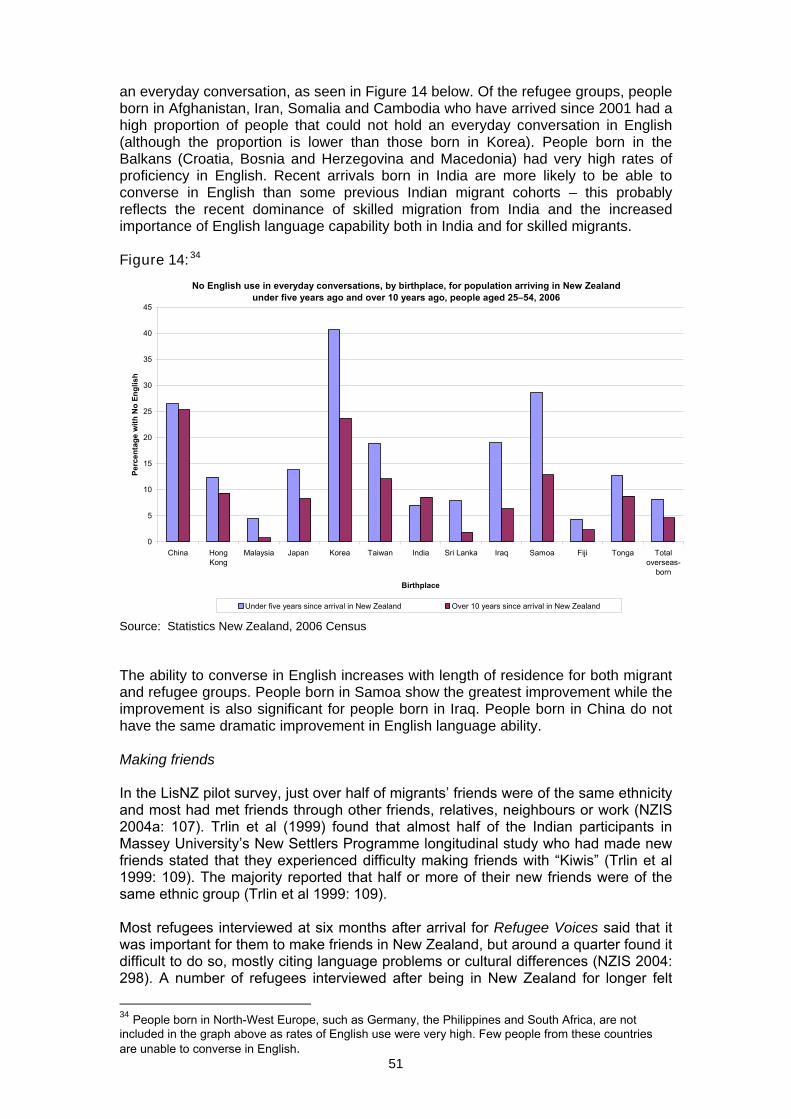
51
an everyday conversation, as seen in Figure 14 below. Of the refugee groups, people born in Afghanistan, Iran, Somalia and Cambodia who have arrived since 2001 had a high proportion of people that could not hold an everyday conversation in English (although the proportion is lower than those born in Korea). People born in the Balkans (Croatia, Bosnia and Herzegovina and Macedonia) had very high rates of proficiency in English. Recent arrivals born in India are more likely to be able to converse in English than some previous Indian migrant cohorts – this probably reflects the recent dominance of skilled migration from India and the increased importance of English language capability both in India and for skilled migrants. Figure 14:34
No English use in everyday conversations, by birthplace, for population arriving in New Zealand under five years ago and over 10 years ago, people aged 25–54, 2006
0
5
10
15
20
25
30
35
40
45
China HongKong
Malaysia Japan Korea Taiwan India Sri Lanka Iraq Samoa Fiji Tonga Totaloverseas-
born
Birthplace
Perc
enta
ge w
ith N
o En
glis
h
Under five years since arrival in New Zealand Over 10 years since arrival in New Zealand
Source: Statistics New Zealand, 2006 Census The ability to converse in English increases with length of residence for both migrant and refugee groups. People born in Samoa show the greatest improvement while the improvement is also significant for people born in Iraq. People born in China do not have the same dramatic improvement in English language ability. Making friends In the LisNZ pilot survey, just over half of migrants’ friends were of the same ethnicity and most had met friends through other friends, relatives, neighbours or work (NZIS 2004a: 107). Trlin et al (1999) found that almost half of the Indian participants in Massey University’s New Settlers Programme longitudinal study who had made new friends stated that they experienced difficulty making friends with “Kiwis” (Trlin et al 1999: 109). The majority reported that half or more of their new friends were of the same ethnic group (Trlin et al 1999: 109). Most refugees interviewed at six months after arrival for Refugee Voices said that it was important for them to make friends in New Zealand, but around a quarter found it difficult to do so, mostly citing language problems or cultural differences (NZIS 2004: 298). A number of refugees interviewed after being in New Zealand for longer felt
34 People born in North-West Europe, such as Germany, the Philippines and South Africa, are not included in the graph above as rates of English use were very high. Few people from these countries are unable to converse in English.
52
that their improved English made it easier to make friends outside of their own ethnic group (NZIS 2004: 299). However, a number of participants said it was difficult to make friends outside their ethnic group because they did not spend much time with people outside their own community (NZIS 2004: 307). Making friends is not a one-way process – friendship between migrants and New Zealanders requires effort to connect on both sides. Ward and Masgoret’s (2004) survey found that although New Zealanders have very little contact with immigrants, 94% said that they felt comfortable interacting with members of other ethnic groups. Research conducted on migrant youth and friendship shows that migrant young people have more ethnic friends and spend more time with members of their own ethnic groups than their New Zealand peers, while contact with New Zealanders increases over generations (Ward, 2007a, b). International student experiences making friends in New Zealand
A MoE (2004) survey The Experiences of International Students in New Zealand: Report on the Results of the National Survey found that increasing contact and developing friendships with New Zealanders were sources of concern for international students. One in four students said they had no interactions with New Zealanders in social settings, and 35% reported that they had no New Zealand friends. Seventy percent of the international students wanted to have more New Zealand friends, and findings confirmed that increased contact with New Zealanders was related to positive academic, social and psychological outcomes for international students.
About one in three students found their language skills an impediment to making New Zealand friends; and New Zealanders' attitudes and behaviours toward international students were also seen as important. Less than half of the students believed that New Zealanders had positive attitudes toward international students, and one in three believed that international students often experience discrimination in New Zealand. The actual incidence of discrimination was reported to be low, but New Zealand students were cited as the most common source of unfair treatment.
Making friends in Christchurch
Chang et al’s (2006) report on Koreans in Christchurch found that Koreans easily met other Koreans, through work, through church and through existing family and friends. “It’s so easy, you go to church and you meet everybody,” said one participant.
All of the Koreans who participated in the study wanted to know more New Zealanders and were disappointed that they had not achieved this. “I wanted to know exactly (how) New Zealand people live, you know?” said one person, and another explained that he had told his children that it was up to them as new migrants to try to understand Kiwi culture.
Many made purposeful efforts to meet New Zealanders. They joined New Zealand churches and squash, tennis, golf and fishing clubs, volunteered at their children’s schools, public libraries and Age Concern, and went to night classes.
Almost all of the informants with children who attended primary school in New Zealand said they had made friends with the parents of their children’s school friends. Many Korean children did not seem to have trouble making Kiwi friends.
The researchers were told that New Zealanders are polite and friendly enough people in general, but they do not want to become close to Korean people and get to know them well. One girl said the New Zealanders at her high school were kind and friendly in class, but they never met up much outside of school. One woman said it was easy enough to meet New Zealanders, but “I want to get to know [people] heart-to-heart”. She found this very hard because of the language barrier and because of cultural differences, and she felt lonely. Others said it was hard to make Kiwi friends because New Zealanders already had their families and friends here. It was much easier to become friends with Koreans or migrants from other countries, because they, too, might be feeling a bit lonely.
53
Joining clubs and groups Many groups and associations in New Zealand have been established on behalf of particular ethnic or migrant community groups. These associations can help people foster links and find support within their own communities, as well as support their cultural identity. However, joining more ‘mainstream’ groups or clubs can be an important avenue for migrants and the host community to forge connections with people from other groups (Lovelock and Trlin 2007: 40). The LisNZ pilot survey found that, at 18 months after arrival, almost 60% of migrants belonged to clubs or groups, most commonly religious groups, followed by sports clubs. North Asians were less likely to belong to clubs or groups than migrants from other regions (NZIS 2004a: 108). Twenty-nine percent of skilled migrants in a recent DoL survey said that they were not part of any social network or club in New Zealand 12 months after residence approval (Badkar 2007: 53). Refugee Voices found that in some cases participants were not familiar with what clubs or groups meant in the New Zealand context – belonging to a club or group in their country of origin may have been considered elitist (NZIS 2004: 302). Speaking English and having an income were cited as things that made joining groups easier (NZIS 304). Refugees who were more established in New Zealand were more likely to belong to a club or group (ethnic and religious groups were the most popular) than more recent arrivals (NZIS 2004: 307). Participation in physical activity by Somali women
There can be barriers to participation in physical activity for migrants and refugees, particularly among women who are caring for children. Cultural and religious practices may also create barriers to physical activity.
Guerin et al’s (2003) study of 100 Somali women living in Hamilton highlighted several barriers to their access to fitness and exercise opportunities. Many of the women cited transportation and child care as barriers to participation in community centre and gym exercise classes (Guerin et al 2003: 95). Many also wanted a private place to exercise that was culturally “safe” and where they could be free from concerns about being subject to derogatory comments or discrimination (Guerin et al 2003: 95). The women gained many social benefits from participating in physical activity. They were able to develop stronger relationships among themselves, and the gym classes gave them the opportunity to interact with other women in the community (Guerin et al 2003: 97).
Participating in cultural and arts activities
Participation in cultural activities is an important way to enhance connections between people in the same cultural group, as well as to provide the opportunity for people to express their cultural identity. Attendance at cultural events and engagement in cultural activities by both migrant and host communities can provide opportunities for increased interaction and connections between different ethnic groups and understanding of different cultures (Statistics New Zealand 2006: 37, Creative New Zealand et al 2007: 17). While attendance at others’ cultural activities may increase people’s awareness of other cultures, this may have no meaningful ongoing impact; but it may provide a stepping stone to further personal contact and/or deeper understanding.
The Statistics New Zealand Cultural Experiences Survey (2002) provides information on attendance and participation in ethnic community activities, such as food fairs or film evenings. The survey also provides information on the attendance at a cultural performance of ethnic song or dance which includes festivals like the Pasifika festival
54
and the Chinese New Year Lantern Festival. Main findings from the survey include those set out in the following table35:
Ethnic community activities Cultural performance of ethnic song or dance
Those most likely to attend or participate in ethnic community activities belonged to the Indian ethnic group (44%), followed by Pacific peoples (39%), other non-European and non-Māori ethnic groups (36%) and Chinese (33%). The figures could indicate that these groups are attending or participating in activities that are related to their own ethnicity, but it is not possible to determine this.
Pacific peoples were more likely (51%) than any other group to have attended a performance and the New Zealand European/Pakeha group were least likely to attend (11%).
The Māori and New Zealand European/Pakeha groups were the least likely to have attended ethnic community activities at 20% and 14%. However, New Zealand European/Pakeha still accounted for 61% of the audience of those who attended (11% Māori).
A high proportion of attendees were either New Zealand European/Pakeha or Māori.
Attendance was higher among people in main urban areas, especially in Auckland and Wellington, reflecting the larger communities in these regions.
Attendance was higher in the main urban areas.
Among those who had not attended an ethnic community activity in the last 12 months, the most commonly cited barrier was that they were not available locally, although 6% said it was because they had no links with ethnic groups.
The fact that performances were not available locally was most often cited as a barrier to not attending any performance.
Volunteer work outside the home Volunteering can connect people in new and often unexpected ways to people from different backgrounds or different parts of society. It can provide a way for migrants to make a visible contribution to society, meet people from outside their own community, encourage them to share information about their own culture or country of origin with others and learn about their new country. The data below show the percentage of migrants who are undertaking volunteering compared with the New Zealand-born population. Census data does not enable us to determine whether people are engaging in activities that are for the benefit of people within their own community groups or for people from other groups. It may be that many migrants who undertake volunteer work spend a considerable amount of time supporting members of their own community, especially in settlement-related activities. Migrants may also engage in volunteering in order to gain work experience, become more familiar with the New Zealand work environment or practise their English language skills.
35 In the Cultural Experiences Survey, ethnic community activities and cultural performance of ethnic dance or song excluded New Zealand European/Pakeha and Māori activities or performances and religious activities. Survey participants (aged 15 years and over) were asked whether they had attended or participated in at least one ethnic community activity or cultural performance in the year before the survey.
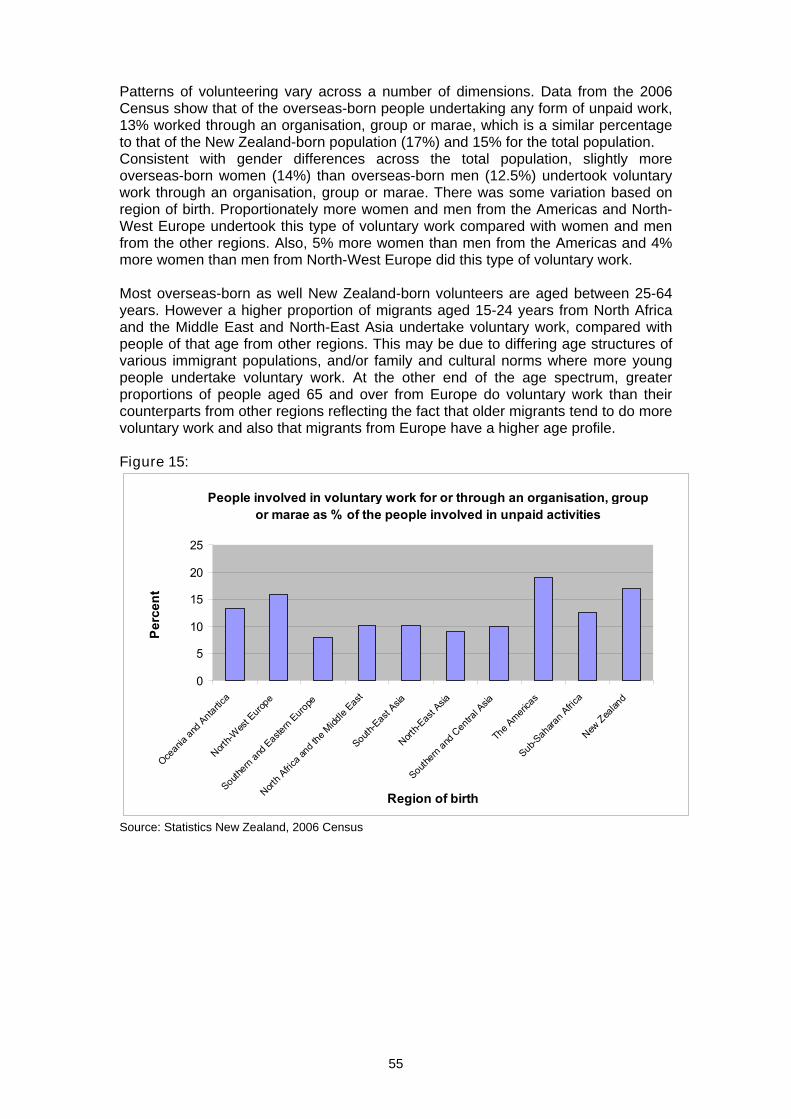
55
Patterns of volunteering vary across a number of dimensions. Data from the 2006 Census show that of the overseas-born people undertaking any form of unpaid work, 13% worked through an organisation, group or marae, which is a similar percentage to that of the New Zealand-born population (17%) and 15% for the total population. Consistent with gender differences across the total population, slightly more overseas-born women (14%) than overseas-born men (12.5%) undertook voluntary work through an organisation, group or marae. There was some variation based on region of birth. Proportionately more women and men from the Americas and North-West Europe undertook this type of voluntary work compared with women and men from the other regions. Also, 5% more women than men from the Americas and 4% more women than men from North-West Europe did this type of voluntary work. Most overseas-born as well New Zealand-born volunteers are aged between 25-64 years. However a higher proportion of migrants aged 15-24 years from North Africa and the Middle East and North-East Asia undertake voluntary work, compared with people of that age from other regions. This may be due to differing age structures of various immigrant populations, and/or family and cultural norms where more young people undertake voluntary work. At the other end of the age spectrum, greater proportions of people aged 65 and over from Europe do voluntary work than their counterparts from other regions reflecting the fact that older migrants tend to do more voluntary work and also that migrants from Europe have a higher age profile. Figure 15:
People involved in voluntary work for or through an organisation, group or marae as % of the people involved in unpaid activities
0
5
10
15
20
25
Ocean
ia and
Antartic
a
North-W
est E
urope
Southern
and E
aster
n Europe
North A
frica a
nd th
e Midd
le Eas
t
South-E
ast Asia
North-E
ast A
sia
Southe
rn and
Cen
tral A
sia
The A
merica
s
Sub-S
ahara
n Afric
a
New Zea
land
Region of birth
Perc
ent
Source: Statistics New Zealand, 2006 Census
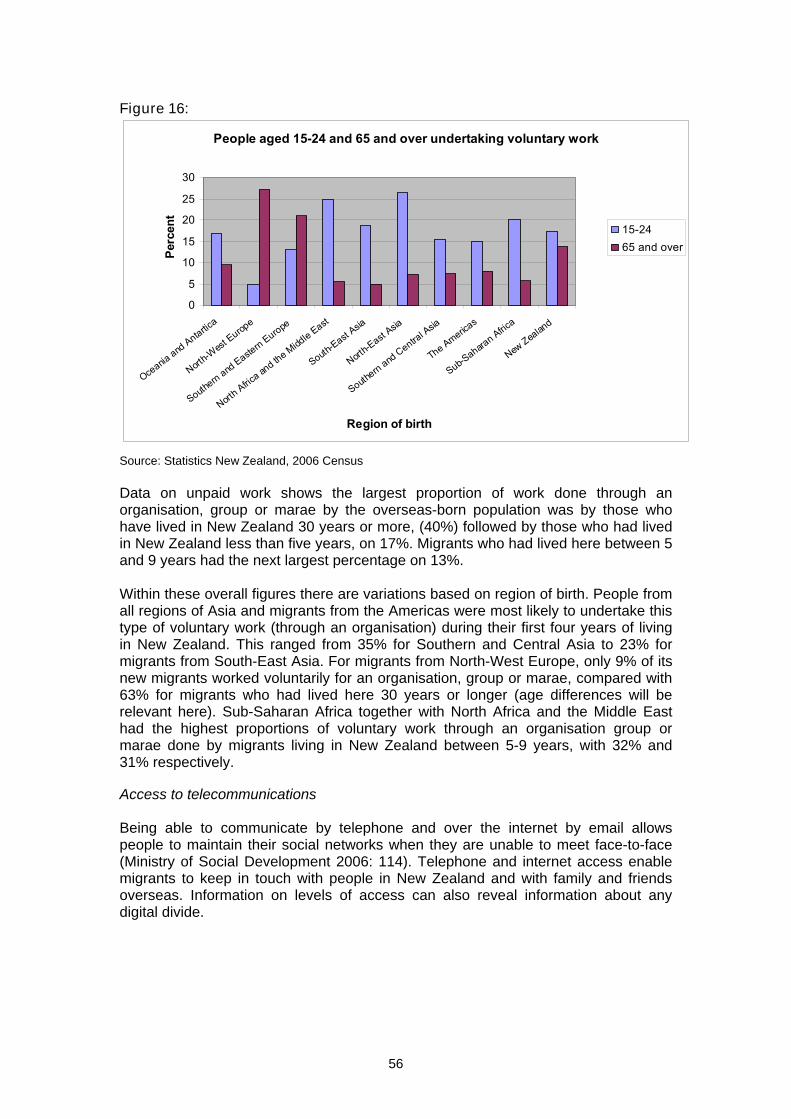
56
Figure 16:
People aged 15-24 and 65 and over undertaking voluntary work
0
5
10
15
20
25
30
Oceania and Antartic
a
North-W
est Europ
e
Southern and Easte
rn Europe
North A
frica a
nd the Middle East
South-East A
sia
North-E
ast Asia
Southern and
Central A
sia
The Americas
Sub-Sahara
n Africa
New Zea
land
Region of birth
Perc
ent
15-2465 and over
Source: Statistics New Zealand, 2006 Census Data on unpaid work shows the largest proportion of work done through an organisation, group or marae by the overseas-born population was by those who have lived in New Zealand 30 years or more, (40%) followed by those who had lived in New Zealand less than five years, on 17%. Migrants who had lived here between 5 and 9 years had the next largest percentage on 13%. Within these overall figures there are variations based on region of birth. People from all regions of Asia and migrants from the Americas were most likely to undertake this type of voluntary work (through an organisation) during their first four years of living in New Zealand. This ranged from 35% for Southern and Central Asia to 23% for migrants from South-East Asia. For migrants from North-West Europe, only 9% of its new migrants worked voluntarily for an organisation, group or marae, compared with 63% for migrants who had lived here 30 years or longer (age differences will be relevant here). Sub-Saharan Africa together with North Africa and the Middle East had the highest proportions of voluntary work through an organisation group or marae done by migrants living in New Zealand between 5-9 years, with 32% and 31% respectively. Access to telecommunications Being able to communicate by telephone and over the internet by email allows people to maintain their social networks when they are unable to meet face-to-face (Ministry of Social Development 2006: 114). Telephone and internet access enable migrants to keep in touch with people in New Zealand and with family and friends overseas. Information on levels of access can also reveal information about any digital divide.
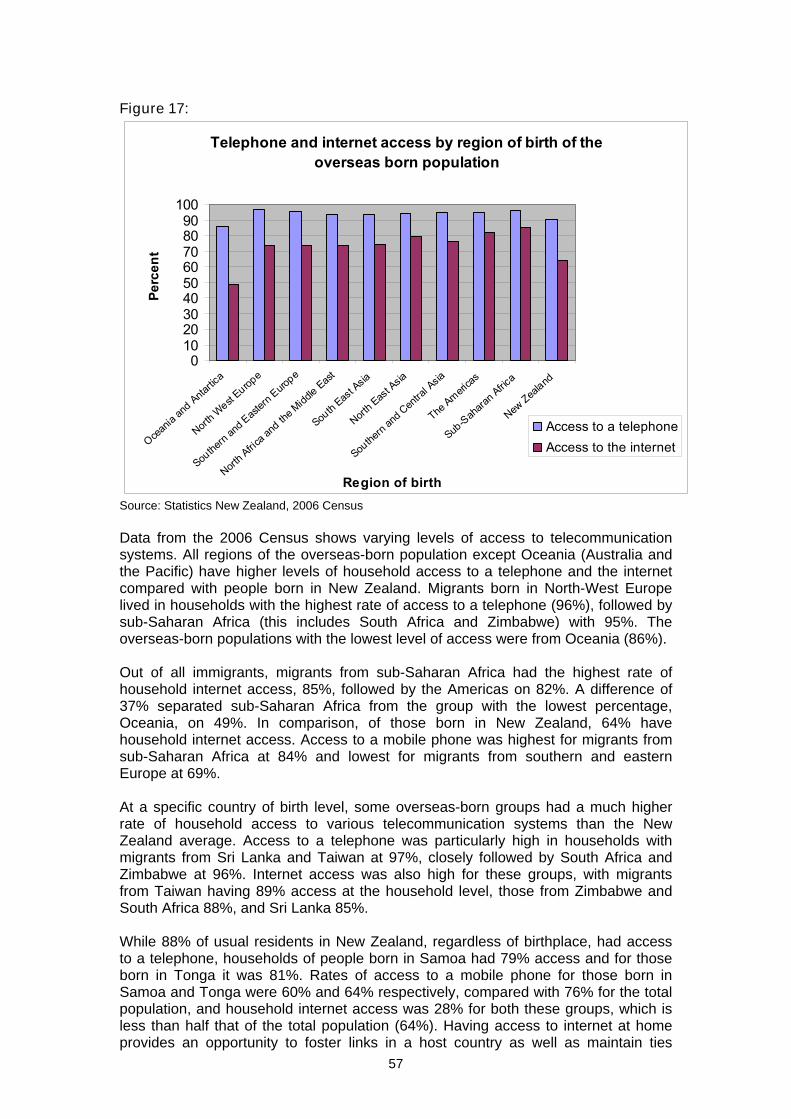
57
Figure 17:
Telephone and internet access by region of birth of the overseas born population
0102030405060708090
100
Ocean
ia an
d Anta
rtica
North W
est Europ
e
Southe
rn an
d Eas
tern E
urope
North A
frica a
nd th
e Midd
le Eas
t
South
East A
sia
North E
ast A
sia
Southe
rn an
d Cen
tral A
sia
The Ameri
cas
Sub-S
ahara
n Afric
a
New Zea
land
Region of birth
Perc
ent
Access to a telephoneAccess to the internet
Source: Statistics New Zealand, 2006 Census Data from the 2006 Census shows varying levels of access to telecommunication systems. All regions of the overseas-born population except Oceania (Australia and the Pacific) have higher levels of household access to a telephone and the internet compared with people born in New Zealand. Migrants born in North-West Europe lived in households with the highest rate of access to a telephone (96%), followed by sub-Saharan Africa (this includes South Africa and Zimbabwe) with 95%. The overseas-born populations with the lowest level of access were from Oceania (86%). Out of all immigrants, migrants from sub-Saharan Africa had the highest rate of household internet access, 85%, followed by the Americas on 82%. A difference of 37% separated sub-Saharan Africa from the group with the lowest percentage, Oceania, on 49%. In comparison, of those born in New Zealand, 64% have household internet access. Access to a mobile phone was highest for migrants from sub-Saharan Africa at 84% and lowest for migrants from southern and eastern Europe at 69%. At a specific country of birth level, some overseas-born groups had a much higher rate of household access to various telecommunication systems than the New Zealand average. Access to a telephone was particularly high in households with migrants from Sri Lanka and Taiwan at 97%, closely followed by South Africa and Zimbabwe at 96%. Internet access was also high for these groups, with migrants from Taiwan having 89% access at the household level, those from Zimbabwe and South Africa 88%, and Sri Lanka 85%. While 88% of usual residents in New Zealand, regardless of birthplace, had access to a telephone, households of people born in Samoa had 79% access and for those born in Tonga it was 81%. Rates of access to a mobile phone for those born in Samoa and Tonga were 60% and 64% respectively, compared with 76% for the total population, and household internet access was 28% for both these groups, which is less than half that of the total population (64%). Having access to internet at home provides an opportunity to foster links in a host country as well as maintain ties
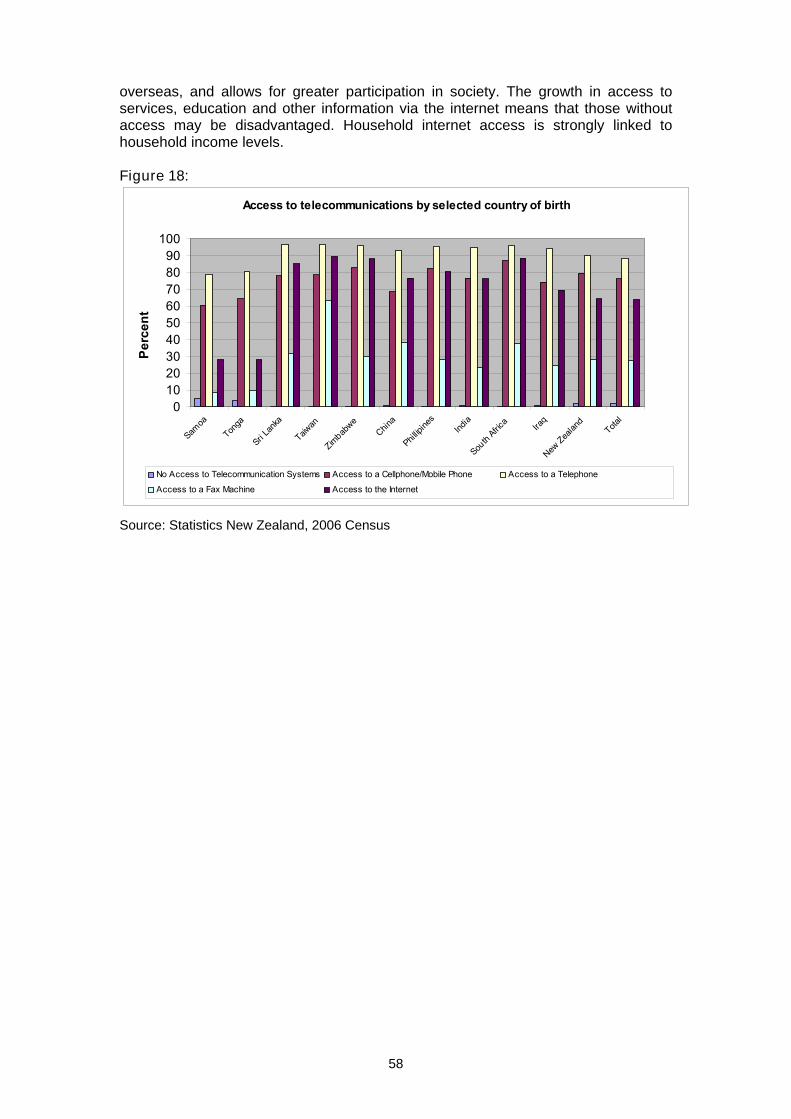
58
overseas, and allows for greater participation in society. The growth in access to services, education and other information via the internet means that those without access may be disadvantaged. Household internet access is strongly linked to household income levels. Figure 18:
Access to telecommunications by selected country of birth
0102030405060708090
100
Samoa
Tonga
Sri Lan
ka
Taiwan
Zimbab
weChin
a
Phillip
ines
India
South
Africa Ira
q
New Zea
land
Total
Perc
ent
No Access to Telecommunication Systems Access to a Cellphone/Mobile Phone Access to a Telephone
Access to a Fax Machine Access to the Internet
Source: Statistics New Zealand, 2006 Census
59
Participation in political and civic affairs Levels of engagement in the political process, particularly voter turnout, provide an indication of the extent to which migrants feel part of the political process and also the extent to which they trust political institutions (Ministry of Social Development 2006: 71). Migrants’ pre-arrival experiences may influence their level of participation in political processes. For example, some migrants do not come from countries with democratic processes and may have been exposed to corruption or oppression, while others come from countries that are more similar to New Zealand. Taiwanese political aspirations
Ip M (2003) found that, compared with other Chinese groups, migrants from mainland China tended to be less ready to get involved in politics, and Hong Kong people seemed apolitical as a community. Their differences can be explained by their diverse experiences in homeland politics. While the China cohort might be just as highly educated and professionally qualified, and while the Hong Kong cohort might be just as astute in business and trading, neither group has had the first-hand knowledge or experience of a democratic process in their country of origin. It was left to the Taiwanese to play pivotal roles in the Chinese community political rallies during the general election campaigns of 1993, 1996 and 1999.
The report cited above does not include information on voter turnout of migrants, and there is very little available on the levels of political engagement of different ethnic or migrant groups in New Zealand society (Electoral Commission 2005). One factor that may make it easier for migrants and refugees to participate in the political process is that New Zealand is one of the few countries in the world that allows people with permanent resident status to vote (i.e. citizenship is not required). Some migrants, however, may not realise that having residency means they are able to vote. The Electoral Commission provides its services in multiple languages to promote awareness of the political process. Political participation extends beyond voting in local and national elections. Migrants in New Zealand are involved in other aspects of the political and civic processes, including participating in central and local government consultations, preparing submissions on proposed legislation and local government proposals, and encouraging government agencies to engage more actively with refugee and migrant communities in policy development and service delivery.36
36 The doctoral thesis ‘Political participation of Asian New Zealanders: A case study of ethnic Chinese and Korean New Zealanders’ by Shee Jeong Park is a useful further reference.
60
ChangeMakers Refugee Forum
The Changemakers Refugee Forum is a pan-refugee group set up in Wellington in 2005 to:
• build the capacity of refugee communities
• build the capacity of NGOs, the private sector and government agencies to be able to work more effectively with people with refugee backgrounds
• undertake advocacy and research on refugee issues
• develop and implement projects and services that support refugees and people with refugee backgrounds.
Since its inception, the ChangeMakers Refugee Forum has been involved in activities such as:
• partnering with other organisations to provide submissions on proposed legislation
• contributing to the 2006 Wellington Regional Action Plan for Refugee Health and Well-Being.
What could be explored further Further research on participation could examine which migrant groups are having difficulty connecting with the wider society, including issues of age, gender and regional variation. It would also be useful to know more about why New Zealanders report having little contact with migrants. Ways in which to increase contact across ethnic groups, voting behaviours, and variations in civic and social participation across ethnic and migrant groups could also be topics for further research.
61
Chapter Four: Inclusion
Inclusion, as a domain of social cohesion, means promoting equality of opportunity in order to achieve a similar distribution of outcomes between groups and across society as a whole, for example, in the areas of labour market participation, income, education, health and housing.
Overview Inclusion outcomes in terms of housing, employment, income, education and health are critical to migrants’ wellbeing and provide an indication of whether migrant and settlement policies are adequate for contributing to positive outcomes for migrants and New Zealand. Labour market outcomes –employment and income In 2006, employment rates for people born overseas, as with other New Zealand population groups, were very positive. • The employment and unemployment rates for people born overseas have
improved since 1996 and 2001, particularly for migrants with less than 5 years residence.
• Only migrants with less than one year’s residence and migrants born in some countries (such as North-East Asian countries, Samoa and Tonga) had employment rates 15 percentage points below the New Zealand-born employment rate.
• Full-time employed prime working-age people born overseas have a slightly lower median income level than New Zealand-born equivalents.
• Once resident for five years or more, people born overseas from 11 out of 20 high volume source countries with Bachelors degrees or higher qualifications, have incomes on par with New Zealand-born people with similar qualification levels.
• Of concern is that some groups of migrants are unable to attain employment that matches their qualifications. For example, migrants from China, Korea and North Africa and the Middle East have high unemployment rates while some other groups, such as Indians, have high employment rates but their incomes do not reflect the income of other groups with similar qualification levels.
• Although English skills tend to increase employability, many people born in non-English speaking countries, such as people born in the Philippines and Sri Lanka, achieve good outcomes.
• The second generation and people born overseas who move to New Zealand as children generally have good employment and income outcomes compared to their New Zealand-born equivalents.
• People born in North-East Asia, particularly Korea, have high rates of self-employment and of running businesses that employ others.
• Working-age migrants with less than 10 years residence comprise less than 5% of working-age beneficiaries.
Education • Overall there is little performance difference in PISA37 assessments between
immigrants and New Zealand-born secondary school students. • People born overseas are on average more qualified than New Zealand-born
people as people born overseas comprise 40% of the prime working-age population with Bachelors degrees or higher, despite only comprising 26% of the prime working-age population.
37 The Programme for International Student Assessment (PISA) is an internationally recognised standardised assessment developed by participating countries and administered to 15 year olds in schools.
62
Home ownership • Home ownership can indicate a commitment to a community, but some migrants
could purchase houses and not feel settled or even reside outside of New Zealand.
• People born in North-West Europe are the only group of people born overseas that are more likely to own a home rather than rent.
• Refugee groups often report difficulties in finding suitable accommodation. Health • Possible isolation, lack of social networks and lack of access to services through
knowledge or English skills put migrants at risk of poor health outcomes. • First generation Asian migrants have better health than New Zealand-born
Asians, but their health advantage diminishes with time spent in New Zealand. Introduction Quality employment, education, health and housing are all important if migrants are to realise their aspirations alongside their New Zealand-born counterparts. It can take time for new migrants to adjust to life in a new country and to establish themselves both economically and socially. At least in the initial stages of settlement, this may mean that migrants’ outcomes are worse than those of the New Zealand-born. Some migrants will have very good outcomes, at times better than those born in New Zealand. However, other migrants struggle to achieve similar outcomes to those born in New Zealand, even after having been in the country for a long period of time. Impacts and long-term effects of belonging to a group that has poorer outcomes also apply to those born in New Zealand and in some respects can be more problematic. If poor outcomes persist, particularly across generations, this can lead to disenfranchisement, resulting in a lack of social cohesion (Reitz and Banerjee 2007: 2). The outcomes of the second generation are crucial to social cohesion. The second generation will have experienced advantages in terms of going to school in New Zealand, learning and using English in school and society and becoming familiar with the job market, which may have been barriers for their parents. As such, if the second generation do not fare as well in this new environment, there is a risk of poor outcomes persisting across generations of migrants, with the potential for this to impact on social cohesion. Due to limitations in the data, this report does not focus on the labour market outcomes of the second generation to any great extent. However, some information is provided on the education outcomes of the second generation, and on unemployment outcomes and income levels beyond the first generation of migrants by using proxies. Factors that are relevant to inclusion Inclusion in the labour market is a key means for migrants to establish their independence and autonomy in a new country. Although people generally migrate to New Zealand for lifestyle reasons, employment is a key component of inclusion. This chapter focuses primarily on employment due to the data available. Economic conditions on arrival have a strong bearing on migrants’ labour market outcomes (Aslund and Rooth 2007: 440), including the rate at which migrants ‘converge’ with New Zealand-born workers in terms of earnings and employment. Current skill shortages also influence the types of employees that are in demand. Migrants’ chances of getting jobs will depend on their skills and the willingness of
63
employers to hire migrants where they may not have done so previously. A tighter job market may mean that employers are more willing to employ someone from a different background.
This chapter reviews barriers to employment and employer attitudes which can affect migrants’ labour market outcomes. The chapter also provides information on the following outcomes for the overseas-born population that are compared, where possible, with those of the New Zealand-born:
• employment
• status in employment
• unemployment
• occupation
• income levels
• compulsory, tertiary and community education
• home ownership
• health. Barriers to employment The barriers that migrants face in relation to employment in New Zealand have been well-documented (Butcher et al 2006, Ho et al 2000, Oliver 2000, McGrath et al 2005, Lidgard 1996, Ho and Lidgard 1996, Boyer 1996, DIA 1996, Basnayake 1999) and include:
• discrimination
• lack of English language proficiency or a non-New Zealand accent
• lack of New Zealand work experience
• difficulty getting overseas qualifications recognised
• lack of social networks and knowledge about how the New Zealand labour market operates.
Employment barriers specific to refugees include limited access to relevant education and skill development opportunities prior to arrival in New Zealand and past traumatic experiences which can result in lowered self-confidence and poor health (DoL 2007). Studies have also found that refugee women, in particular, have reported that employers often had issues with the way that they dress (Guerin et al 2004: 67, NZIS 2004: 309). Guerin et al (2004: 70) also found that the largely informal nature of refugees’ employment in their country of origin did not translate well to a New Zealand context. It should be noted, that although some people experience barriers to employment, 62% of LisNZ survey migrants who were employed, or who had sought employment in New Zealand, experienced no difficulty in finding employment.38 • Discrimination
Inappropriate selective hiring of people with certain characteristics is difficult to prove, as an employer may simply be using certain characteristics as a proxy for a particular ability (which can still be problematic), or it may be the case that other characteristics that are not observed directly account for employer preference (OECD 2007: 50), rather than outright discrimination. New Zealand studies have
38 Statistics New Zealand, Longitudinal Immigration Survey (LisNZ), Wave 1, 2008
64
shown that employment agencies and migrants themselves report that migrants experience discrimination both in the process of looking for employment and in the workplace (DIA 1996, Basnayake 1999, Butcher et al 2006, Chang et al 2006, Diego and Podsiadlowski 2006, Podsiadlowski 2006). The Equal Employment Opportunities Trust (2000: 11) found that human resource practitioners and recruitment consultants believed that people with a non-New Zealand accent and who were from a different culture were among those most likely to face discrimination.. Basnayake’s survey (1999: 24) of Sri Lankan migrants’ experiences looking for work found that just under half reported being discriminated against while job hunting. Several respondents cited ethnicity, skin colour, accent and foreign name as the nature of the discrimination both during their job search and while in employment (Basnayake 1999: 23 and 24). Only 6.5% of LisNZ survey migrants, who were employed, or who had tried to find employment since gaining residence, identified discrimination towards migrants as a difficulty in finding employment. In addition, only 2% of migrants identified discrimination based on age, gender or religion as a difficulty for them in finding employment.39
• Lack of English language proficiency or a non-New Zealand accent
A migrant’s level of English language proficiency can influence all aspects of the employment process, including CV preparation, presentation over the telephone, performance during job interviews and ability to perform the job itself. Several studies have recognised the important part that English language proficiency plays in influencing migrants’ labour market outcomes (Winkelmann and Winkelmann 1998, Boyd 2003, Fletcher 1999, DIA 1996, Henderson et al 2006). For example, in High Hopes the DIA (1996: 42) found that migrants who were fluent in English when they arrived in New Zealand were more likely than other respondents to be employed in the field in which they were qualified. A non-New Zealand accent can also be a barrier to obtaining employment (Henderson et al 2006). Henderson et al (2006) found in their survey of organisations involved in the recruitment and/or employment of professionals that some employers had very high expectations of English language proficiency by requiring skilled migrants who wanted to work in their field of expertise to have both native-speaker fluency and a New Zealand accent (Henderson et al 2006: 47).
As noted earlier in the report, migrants who feel that they need to improve their English language skills may take time out from looking for employment in order to take up English language courses. However, migrants have reported that they find that interaction in the workplace is one of the most useful means of improving English (White et al 2002: 151).
Concerns about English language proficiency
Some employers have reported concerns about migrants’ English language proficiency. Concerns include the ability to follow instructions and safety manuals, the level of customer service and the time it takes to train migrants whose first language is not English (McLaren and Spoonley 2005: 27). However, a DoL report on employer attitudes to skilled migrants (Wallis and BRC Marketing and Social Research Ltd 2006:58) found that “90% of employers reported that the job performance of the migrants they had hired was not affected by difficulties with the English language.” • Lack of New Zealand work experience
New Zealand work experience and qualifications are often preferred by employers and can act as a barrier to work for many migrants (Henderson 2003: 156, Firkin 2004: 45, Podsiadlowski 2006, 12, 15). This can act as a vicious circle - if migrants are consistently denied employment opportunities owing to their lack
39 Statistics New Zealand, Longitudinal Immigration Survey (LisNZ), Wave 1, 2008
65
of New Zealand experience, it makes it difficult for them to obtain the experience required. Lack of New Zealand work experience was identified as a difficulty in finding employment by 22% of migrants in the LisNZ survey, who were employed or who had sought employment in New Zealand. It was the most prevalent identified difficulty in finding employment, with the next most prevalent being identified by less than 8% of respondents.40
• Difficulty getting overseas qualifications recognised
Studies have found that some migrants experience difficulty in getting overseas qualifications recognised in New Zealand. (Butcher et al 2006: 22, North et al 1999, Boyer 1996: 68, McLaren and Spoonley 2005: 37, Ho and Lidgard 1996: 129, DIA 1996). Skills or experience not being recognised by New Zealand employers was identified as a difficulty for finding employment by 7% of migrants in the LisNZ survey who were employed or who had sought employment in New Zealand. Also, 22% of migrants who had been employed in New Zealand identified having overseas qualifications recognised helped them find employment.41
• Lack of social networks and knowledge of the New Zealand labour market
Being able to draw on local social networks is often an important way to source potential job opportunities in New Zealand (NZIS 2004a:59, NZIS 2004:226). Migrants may be at a disadvantage in this regard, especially if they have recently arrived in New Zealand and have not had the opportunity to develop links with people. Migrants may also lack knowledge of how the New Zealand labour market operates in terms of how to go about job searching (Podsiadlowski 2007, 26). Twenty-one percent of LisNZ survey migrants, who had been employed in New Zealand, identified contacts made through friends and family as factors that helped them find employment. Social networks were particularly helpful for Pacific access category migrants in finding employment (49%).42
Employer attitudes Employer attitudes towards migrants can influence decisions about whether to employ them. Attitudes can create barriers or be a positive factor in supporting migrants and refugees participating in the labour force. New Zealand employers have reported high levels of satisfaction with migrant staff for the following reasons (Wallis and BRC Marketing and Social Research Ltd 2006:54, Podsiadlowski 2006,9, McLaren and Spoonley 2005:26, DoL 2006:54, Watts and Trlin 1999:128, Spoonley and Davidson 2004:36):
• they are highly motivated, hardworking, conscientious and reliable
• they possess skills that a New Zealand resident would not possess
• they contribute to the organisation’s knowledge. On the other hand some studies have found that employers sometimes equate the following characteristics with ‘risk’: cultural difference; overseas qualifications and experience that an employer is not familiar with; high training costs; being a non-native English speaker, or having a non-New Zealand accent; and where potential employees had little knowledge of New Zealand or its workplace culture (Podsiadlowski 2006,12 Henderson 2003:156, McIntyre et al 2003:16, Oliver 2000:30, EEO Trust 2000:15, DoL 2007:5).
40 Statistics New Zealand, Longitudinal Immigration Survey (LisNZ), Wave 1, 2008 41 Statistics New Zealand, Longitudinal Immigration Survey (LisNZ), Wave 1, 2008 42 Statistics New Zealand, Longitudinal Immigration Survey (LisNZ), Wave 1, 2008
66
The risk averse behaviours of employers
Research carried out to inform the Auckland Regional Settlement Strategy found that risk-averse behaviours, especially of small businesses, could be compounded by the lack of skills and resources to (DoL 2007: 5):
• screen job applicants from diverse language and cultural backgrounds and accurately assess their work preparedness
• invest in inducting new employees from diverse language and cultural backgrounds and different employment cultures and environments to adapt to the New Zealand small business workplace
• avoid the risks and impacts of taking on staff who may later prove to be unsuitable.
It is possible that at times of skill shortages in the labour market employers may be more willing to take on migrants with characteristics that are perceived to be ‘risky’. In contrast, employers may prefer to employ local-born workers when the economy is stagnant and competition for positions is high (Watts and Trlin 1999:129, OECD 2007:44). Strategies to cope with employment difficulties Migrants adopt a range of strategies to cope with employment difficulties. These include:
• Temporary underemployment If migrants cannot find employment that utilises their skills, they may opt for jobs that are well below their skill level. This phenomenon is known as underemployment. Underemployment can be temporary and used as a stepping stone to more suitable employment. However, it can be a problem if it becomes permanent (Boyer 1996:71) or when retraining opportunities are limited or not available, and preclude someone from going back to their profession. While numerous studies have noted that certain migrant groups experience problems of underemployment (Diego, Fischer and Podsiadlowski 2007, Friesen and Ip 1997:9, Henderson 2003:155, Ho 2003:177, Chang et al 2006, North et al 1999, Podsiadlowski 2007, Watts and Trlin 2000), the Degrees of Difference study found that underemployment in low-skilled work was usually only a transitional experience for qualified migrants (Statistics New Zealand 2004: 21).
• Self employment Migrants may choose to start their own businesses if they have experienced difficulties in obtaining employment (Ho et al 1997:19, Ho et al 1998:282, Trlin et al 2004). However, North and Trlin’s (2004) study of self-employed migrants found that their reasons for entering into self-employment were broadly similar to those of New Zealanders starting up their own businesses, for example, a desire for autonomy and independence and greater control over working hours.
• ESOL study or study for New Zealand qualifications
Some migrants undertake study to upgrade qualifications, improve English or obtain New Zealand qualifications to improve their chances of obtaining employment (Badkar 2007:50, RV 2004:215, Trlin et al 1999:114).
67
• Return or onward migration or “astronauting”
Migrants may choose to return to their country of origin or migrate to a third country to seek better employment opportunities. Alternatively, some migrants have an “astronaut” arrangement, whether by choice or financial necessity, where the chief earner in the family returns to the country of origin to work while the rest of the family continues to live in New Zealand (Aye and Guerin 2001, Lidgard 1996:33, Trlin et al 2004, Ho 2003, Boyer 1996:73, Ho et al 1997).
Employment Employment influences all areas of material and social wellbeing. It provides migrants with a route to establishing financial independence and is a key determinant of income and standard of living. It helps migrants to extend their social networks, particularly beyond their own communities. It can help foster a sense of belonging in New Zealand and having a stake in the country. Good migrant employment outcomes are also important from the point of view of the receiving society. Analysis of 2006 Census data continues to support previous analyses of data, which found that qualifications, birthplace, length of residence and English skills have an influence on migrants’ labour market outcomes. The prime working-age population (25–54 years) is predominantly used for the employment analysis.43 Analysis of 2006 census data in the sections below generally includes those countries that have significant overseas-born populations in New Zealand. The countries selected make up 80% of the overseas-born prime working-age population.
Census 2006 employment snapshot
At the time of the 2006 Census, 68.6% of working-age (15–64 years) people who were born overseas were employed, compared to 76.2% of the New Zealand-born working-age population. The employment gap between the New Zealand-born working-age population and the overseas-born working-age population was slightly higher for females (8%) than males (7%). The employment rate for prime working-age people (25–44 years) born overseas is 76.4%, compared to 82.2% for New Zealand-born prime working-age people.
43 Focusing on the prime working-age population reduces the impact tertiary students and other temporary working holiday migration flows may have on the analysis when the focus is on the employment outcomes of more permanent migrants. In terms of 15–24 year-olds, in 2001, 28% of those in the labour force were studying full-time – see Statistics New Zealand, Degrees of Difference: The Employment of University Qualified Immigrants in New Zealand, (Statistics New Zealand: Wellington), 2004.
68
Employment rate44 by years since arrival to New Zealand Migrants tend to have worse employment outcomes than New Zealand-born workers in the first years after arriving in New Zealand (NZIS 2004a, Winkelmann and Winkelmann 1998, Trlin et al 2004). The impact of length of residence is not surprising considering that the early years are often a period of adjustment with a number of tasks needing to be undertaken, such as looking for work, upgrading qualifications and improving English skills, if necessary, and finding suitable accommodation. However, length of residence had less of an impact on migrants’ employment outcomes in the 2006 Census than in previous censuses. In 2006, only working-age people who had been resident less than one year had significantly lower rates of employment (20 percentage points lower) than the New Zealand-born. The employment rates of the overseas-born resident between one and 10 years were 6–7 percentage points lower than for the New Zealand-born. People who arrived in New Zealand more than 20 years ago had similar employment rates as the New Zealand-born. In the 2001 and 1996 Censuses, length of residence had more of an impact on employment rates than in the 2006 Census. In 1996, the employment rate was 16 percentage points higher for migrants who had been resident for 5–9 years compared to those who had been resident for less than 5 years. In 2001, the difference was 8 percentage points, while in 2006 it was 3 percentage points. Employment outcomes by region and country of origin
People born in the UK, Europe, North America, Australia and Southern Asia have employment rates higher than the overseas-born average. Table 1045 shows that people born in China, Hong Kong, Japan, Korea, Samoa, Taiwan and Tonga, even after being resident in New Zealand for 5–9 years, have employment rates 15 percentage points below those of the New Zealand-born population. This gap partially closes for these migrants once they have resided in New Zealand for more than 10 years. Poor employment outcomes that persist over time are a concern given that employment outcomes are important for living standards.
44 Number of people employed as a percentage of the total population within a selected age range. 45 The 19 overseas birthplaces in the table comprise 20% of the prime working-age population, and 80% of the overseas-born prime working-age population.
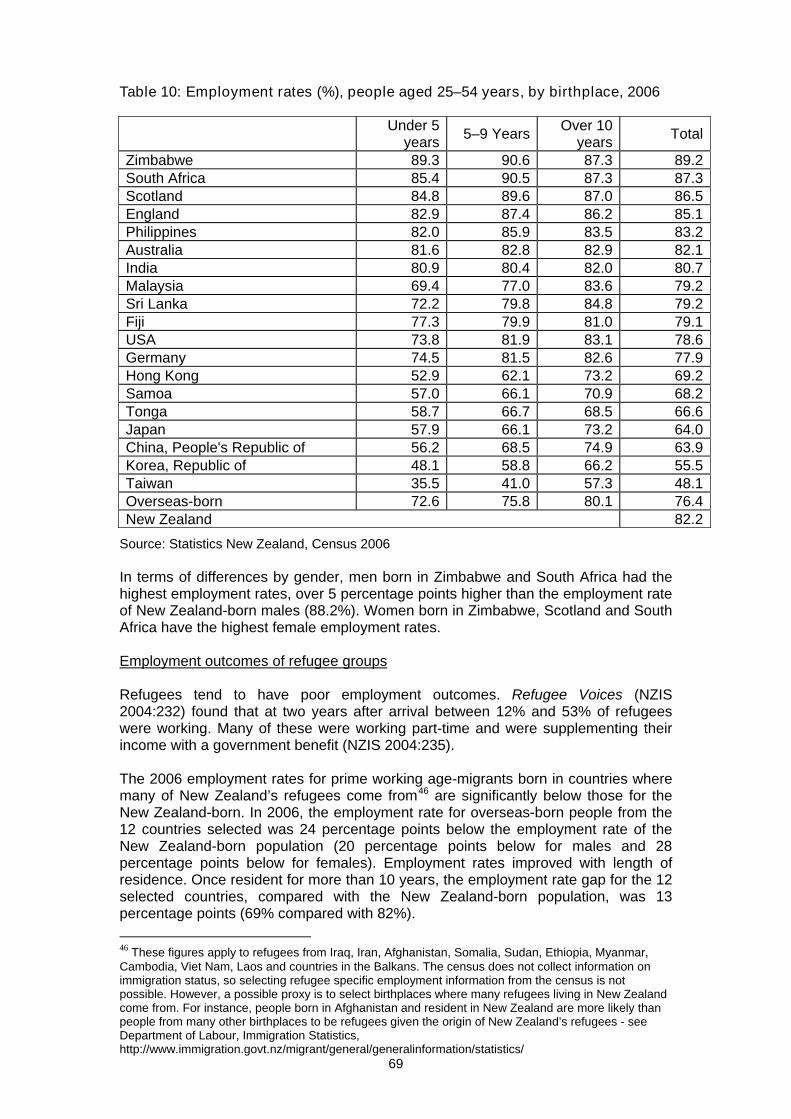
69
Table 10: Employment rates (%), people aged 25–54 years, by birthplace, 2006
Under 5
years 5–9 Years
Over 10 years
Total
Zimbabwe 89.3 90.6 87.3 89.2 South Africa 85.4 90.5 87.3 87.3 Scotland 84.8 89.6 87.0 86.5 England 82.9 87.4 86.2 85.1 Philippines 82.0 85.9 83.5 83.2 Australia 81.6 82.8 82.9 82.1 India 80.9 80.4 82.0 80.7 Malaysia 69.4 77.0 83.6 79.2 Sri Lanka 72.2 79.8 84.8 79.2 Fiji 77.3 79.9 81.0 79.1 USA 73.8 81.9 83.1 78.6 Germany 74.5 81.5 82.6 77.9 Hong Kong 52.9 62.1 73.2 69.2 Samoa 57.0 66.1 70.9 68.2 Tonga 58.7 66.7 68.5 66.6 Japan 57.9 66.1 73.2 64.0 China, People's Republic of 56.2 68.5 74.9 63.9 Korea, Republic of 48.1 58.8 66.2 55.5 Taiwan 35.5 41.0 57.3 48.1 Overseas-born 72.6 75.8 80.1 76.4 New Zealand 82.2
Source: Statistics New Zealand, Census 2006 In terms of differences by gender, men born in Zimbabwe and South Africa had the highest employment rates, over 5 percentage points higher than the employment rate of New Zealand-born males (88.2%). Women born in Zimbabwe, Scotland and South Africa have the highest female employment rates. Employment outcomes of refugee groups Refugees tend to have poor employment outcomes. Refugee Voices (NZIS 2004:232) found that at two years after arrival between 12% and 53% of refugees were working. Many of these were working part-time and were supplementing their income with a government benefit (NZIS 2004:235). The 2006 employment rates for prime working age-migrants born in countries where many of New Zealand’s refugees come from46 are significantly below those for the New Zealand-born. In 2006, the employment rate for overseas-born people from the 12 countries selected was 24 percentage points below the employment rate of the New Zealand-born population (20 percentage points below for males and 28 percentage points below for females). Employment rates improved with length of residence. Once resident for more than 10 years, the employment rate gap for the 12 selected countries, compared with the New Zealand-born population, was 13 percentage points (69% compared with 82%).
46 These figures apply to refugees from Iraq, Iran, Afghanistan, Somalia, Sudan, Ethiopia, Myanmar, Cambodia, Viet Nam, Laos and countries in the Balkans. The census does not collect information on immigration status, so selecting refugee specific employment information from the census is not possible. However, a possible proxy is to select birthplaces where many refugees living in New Zealand come from. For instance, people born in Afghanistan and resident in New Zealand are more likely than people from many other birthplaces to be refugees given the origin of New Zealand’s refugees - see Department of Labour, Immigration Statistics, http://www.immigration.govt.nz/migrant/general/generalinformation/statistics/
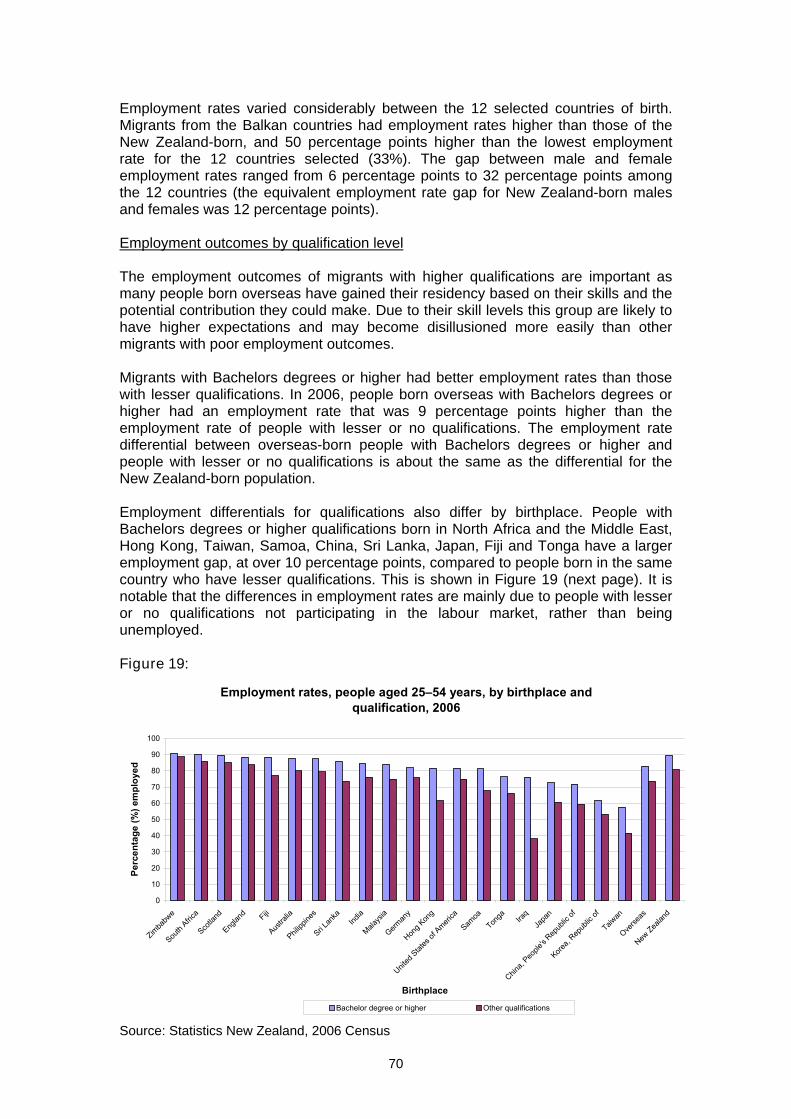
70
Employment rates varied considerably between the 12 selected countries of birth. Migrants from the Balkan countries had employment rates higher than those of the New Zealand-born, and 50 percentage points higher than the lowest employment rate for the 12 countries selected (33%). The gap between male and female employment rates ranged from 6 percentage points to 32 percentage points among the 12 countries (the equivalent employment rate gap for New Zealand-born males and females was 12 percentage points). Employment outcomes by qualification level The employment outcomes of migrants with higher qualifications are important as many people born overseas have gained their residency based on their skills and the potential contribution they could make. Due to their skill levels this group are likely to have higher expectations and may become disillusioned more easily than other migrants with poor employment outcomes. Migrants with Bachelors degrees or higher had better employment rates than those with lesser qualifications. In 2006, people born overseas with Bachelors degrees or higher had an employment rate that was 9 percentage points higher than the employment rate of people with lesser or no qualifications. The employment rate differential between overseas-born people with Bachelors degrees or higher and people with lesser or no qualifications is about the same as the differential for the New Zealand-born population. Employment differentials for qualifications also differ by birthplace. People with Bachelors degrees or higher qualifications born in North Africa and the Middle East, Hong Kong, Taiwan, Samoa, China, Sri Lanka, Japan, Fiji and Tonga have a larger employment gap, at over 10 percentage points, compared to people born in the same country who have lesser qualifications. This is shown in Figure 19 (next page). It is notable that the differences in employment rates are mainly due to people with lesser or no qualifications not participating in the labour market, rather than being unemployed. Figure 19:
Employment rates, people aged 25–54 years, by birthplace and qualification, 2006
0
10
20
30
40
50
60
70
80
90
100
Zimba
bwe
South
Africa
Scotla
nd
Englan
d Fiji
Austra
lia
Philipp
ines
Sri Lan
kaInd
ia
Malays
ia
German
y
Hong K
ong
United
Stat
es of
America
Samoa
Tonga Ira
qJa
pan
China,
People
's Rep
ublic
of
Korea,
Repub
lic of
Taiwan
Overse
as
New Zea
land
Birthplace
Perc
enta
ge (%
) em
ploy
ed
Bachelor degree or higher Other qualifications
Source: Statistics New Zealand, 2006 Census
71
New Zealand-born people with Bachelors degrees or higher have an employment rate of 89.5%, compared to 82.9% for people born overseas. Overall, females born overseas with tertiary qualifications experience a bigger employment gap when compared to their New Zealand-born equivalents than overseas-born males face. People with Bachelors degrees or higher qualifications born in Zimbabwe, South Africa, the UK, Australia or the Philippines had an employment rate in excess of, or similar to, the employment rate of the New Zealand-born population with such qualifications. People born in North-East Asia, North Africa and the Middle East and Tonga experienced the biggest employment gap to New Zealand-born people with these higher qualifications. The employment gap between people born in New Zealand and overseas with Bachelors degrees or higher qualifications narrows as migrants’ years of residence in New Zealand increase. Data from the 1996 and 2001 Censuses showed that migrants’ employment rates did not catch up with the similarly-qualified New Zealand-born population even after five to 10 years living in New Zealand (Boyd 2003:8, Spoonley 2003:14). In 2006, this finding was still correct - as people’s time in New Zealand increased from less than 5 years to 5–9 years, the employment rate of the overseas-born population with tertiary qualifications increased from 78.4% to 83.5%. This increase halved the employment differential to the New Zealand population. The employment gap was still 6 percentage points after 5–9 years in residence. The employment rate for people with over 10 years residence (89.0%) was very similar to the New Zealand-born rate (89.5%). Employment outcomes by English language proficiency47 In the 2006 Census, people born overseas aged 25–54 years with English skills, are significantly more likely than those without English skills to be in employment (80% compared to 52%). The effect of English skills on employment was also confirmed in the LisNZ survey, which interviewed migrants 6 months after taking up permanent residency. Migrants who rated their English language skills as moderate or poor had a labour participation rate and employment rate almost 30 percentage points below migrants with better English skills.48 For some migrant groups the impact of a lack of English skills on employment is less when compared to their fellow countrymen with English skills. Of countries included in Figure 14 (in the Participation chapter)49, the difference in employment rates between those who could converse in English and those who could not was smallest for those born in China, Korea, Samoa and Japan. This may partly reflect poorer employment outcomes for people from these birthplaces in general, work opportunities within the migrant communities, high levels of self-employment for people born in Korea and China (both negating the need for English in the workplace), or a willingness to undertake work where communication skills are less important. For people born in India, Sri Lanka, Taiwan and Hong Kong, a lack of English skills had a strong impact on their employment rates. The ability to converse in English also had a significant bearing on the probability of employment for people aged 25–54 years born in countries where many of New Zealand’s refugees come from. The employment rate for people without English from the refugee-producing countries selected50 was half the rate for people from these countries with English skills.
47 Information on the English language ability of migrants is also available from Refugee Voices (NZIS 2004: 191) and the LisNZ pilot survey (Longitudinal Income Survey New Zealand) (NZIS 2004a: 23). 48 Statistics New Zealand, Longitudinal Immigration Survey (LisNZ), Wave 1, 2008. 49 These countries are: China, Hong Kong, Malaysia, Japan, Korea, Taiwan, India, Sri Lanka, Iraq, Samoa, Fiji and Tonga. 50 These refugee contributing countries comprise: Iraq, Iran, Afghanistan, Somalia, Sudan, Ethiopia, Myanmar, Cambodia, Viet Nam, Laos and countries in the Balkans.
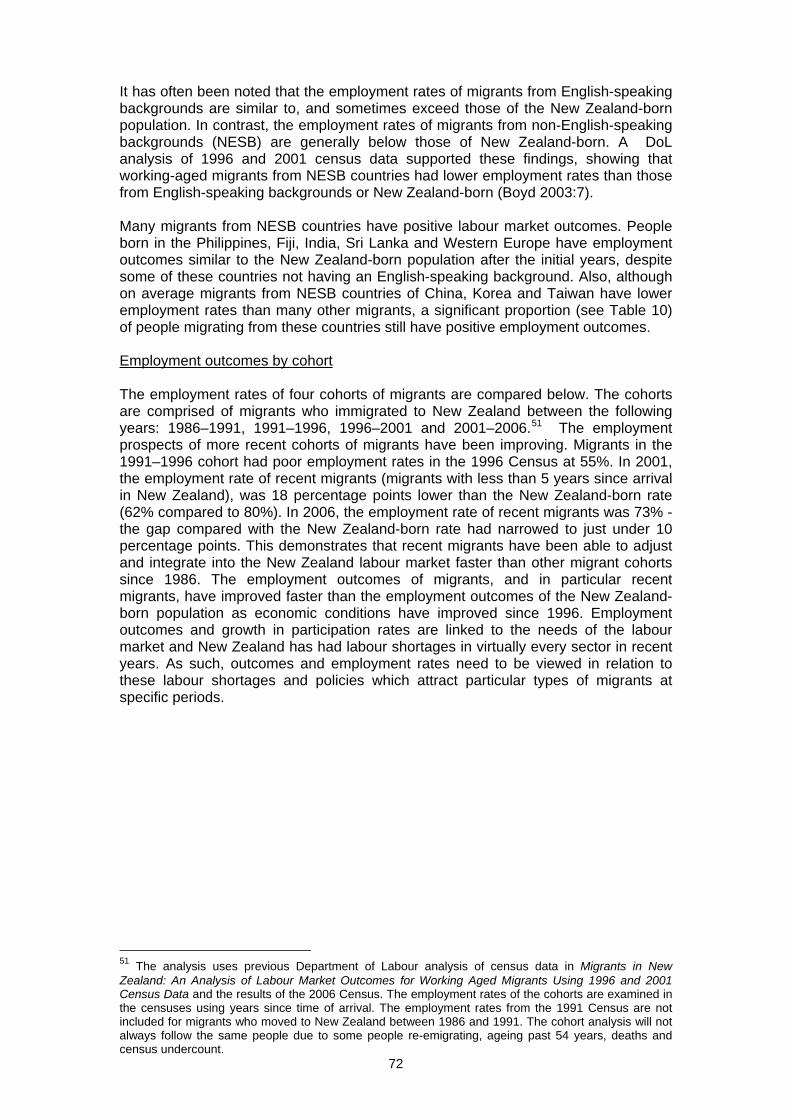
72
It has often been noted that the employment rates of migrants from English-speaking backgrounds are similar to, and sometimes exceed those of the New Zealand-born population. In contrast, the employment rates of migrants from non-English-speaking backgrounds (NESB) are generally below those of New Zealand-born. A DoL analysis of 1996 and 2001 census data supported these findings, showing that working-aged migrants from NESB countries had lower employment rates than those from English-speaking backgrounds or New Zealand-born (Boyd 2003:7). Many migrants from NESB countries have positive labour market outcomes. People born in the Philippines, Fiji, India, Sri Lanka and Western Europe have employment outcomes similar to the New Zealand-born population after the initial years, despite some of these countries not having an English-speaking background. Also, although on average migrants from NESB countries of China, Korea and Taiwan have lower employment rates than many other migrants, a significant proportion (see Table 10) of people migrating from these countries still have positive employment outcomes. Employment outcomes by cohort The employment rates of four cohorts of migrants are compared below. The cohorts are comprised of migrants who immigrated to New Zealand between the following years: 1986–1991, 1991–1996, 1996–2001 and 2001–2006.51 The employment prospects of more recent cohorts of migrants have been improving. Migrants in the 1991–1996 cohort had poor employment rates in the 1996 Census at 55%. In 2001, the employment rate of recent migrants (migrants with less than 5 years since arrival in New Zealand), was 18 percentage points lower than the New Zealand-born rate (62% compared to 80%). In 2006, the employment rate of recent migrants was 73% - the gap compared with the New Zealand-born rate had narrowed to just under 10 percentage points. This demonstrates that recent migrants have been able to adjust and integrate into the New Zealand labour market faster than other migrant cohorts since 1986. The employment outcomes of migrants, and in particular recent migrants, have improved faster than the employment outcomes of the New Zealand-born population as economic conditions have improved since 1996. Employment outcomes and growth in participation rates are linked to the needs of the labour market and New Zealand has had labour shortages in virtually every sector in recent years. As such, outcomes and employment rates need to be viewed in relation to these labour shortages and policies which attract particular types of migrants at specific periods.
51 The analysis uses previous Department of Labour analysis of census data in Migrants in New Zealand: An Analysis of Labour Market Outcomes for Working Aged Migrants Using 1996 and 2001 Census Data and the results of the 2006 Census. The employment rates of the cohorts are examined in the censuses using years since time of arrival. The employment rates from the 1991 Census are not included for migrants who moved to New Zealand between 1986 and 1991. The cohort analysis will not always follow the same people due to some people re-emigrating, ageing past 54 years, deaths and census undercount.
73
Figure 20:
Employment rates, 25–54 year-olds, New Zealand born and cohorts of people born overseas born, 1996, 2001 and 2006
0
10
20
30
40
50
60
70
80
90
1986–1991 1991–1996 1996–2001 2001–2006
Overseas born Overseas born New Zealand born
Perc
ent o
f peo
ple
1996
2001
2006
5–9 Years 0–5
Years
0–5 Years
0–5 Years
5–9 Years
5–9 Years
10–14 Years
10–14 Years
15–19 Years
Sources: Statistics New Zealand, 2006 Census; Boyd, C (2003) Migrants in New Zealand: An Analysis of Labour Market Outcomes for Working Aged Migrants using 1996 and 2001 Census Data Department of Labour. Between 1996 and 2006, the employment rate of the New Zealand-born population has grown by 5 percentage points, compared to 7 percentage points for the total overseas-born population, 40 percentage points for the 1991–1996 cohort of migrants and 33 percentage points for recent migrants with less than 5 years residence. The employment rate of recent migrants in 2006 (73%) is so high that it is similar to the employment rates of migrants who have been in New Zealand for 5–9 years (76%) and 10–14 years (77%). It should be noted that in 1981 and 1986 people born overseas had employment rates on par with the New Zealand-born, and recent migrants only had employment rates a few percentage points lower.52 This overall trend of general improvement in terms of employment of the overseas-born holds for a number of migrant groups including migrants born in South and Central Asia, South-East Asia, North-East Asia, Eastern Europe, Africa and South and Central America and the Pacific. The trend of increasing employment by cohort is less pronounced for people born in other regions, largely because their employment rates are generally very similar compared to the New Zealand-born. For instance, recent migrants born in the UK and Ireland had higher employment rates than the New Zealand-born in the 1996, 2001 and 2006 Censuses, so scope for further improvement was limited. The improved employment prospects of recent migrants may enable them to continue improving their labour market and other outcomes through the economic benefits and social networks gained through employment, as their time in New Zealand increases. These migrants collectively have experienced less employment-related adversity than previous cohorts, however, economic conditions combined with migrant characteristics have assisted. The impact of a deterioration of economic conditions on these migrants’ employment rates will provide an insight into how
52 Winkelmann, L and Winkelmann, R, Immigrants in New Zealand: A Study of their Labour Market Outcomes, (Department of Labour: Wellington), 1998, p66.
74
migrants are treated in the New Zealand labour market - in terms of whether they are seen as a short-term fix or have long-term value. Status in Employment Status in employment refers to the distinction between paid employees, employers (who are self-employed and also employ others) and people who are self-employed. The data indicates differences in the pattern of employment based on length of time in New Zealand. Within the paid employee category, percentages are much higher for the overseas-born population within the first five years of arriving in New Zealand than for any other time period. All regions of origin show this pattern. There is a corresponding increase in the proportion of migrants working as self-employed or employers for those who have lived in New Zealand longer than five years. These shifts in employment status could indicate people setting up their own businesses, perhaps following a short period in the country getting established and feeling more knowledgeable and confident about the New Zealand market-place. It could also suggest individuals who were under-employed as paid workers branching out into a new employment status. Paid employees Three quarters (76%) of the paid workforce in New Zealand in 2006 were paid employees, as seen in Table 11 (next page). This figure was slightly lower for the overseas-born population at 75%. People born in Sub-Saharan Africa had the highest proportion working as paid employees (84%) and North-East Asia the lowest on 66%. At a country of birth level, many countries had over 80% of their employed migrants to New Zealand in the paid employee category. Migrants from the Philippines had a particularly high percentage (91%) of paid employees - significantly higher than the national average. People born in Sri Lanka, Tonga, Zimbabwe, Samoa and Fiji also had high rates of people working as paid employees. In contrast, people born in Korea had slightly less than 42% of workers as paid employees.
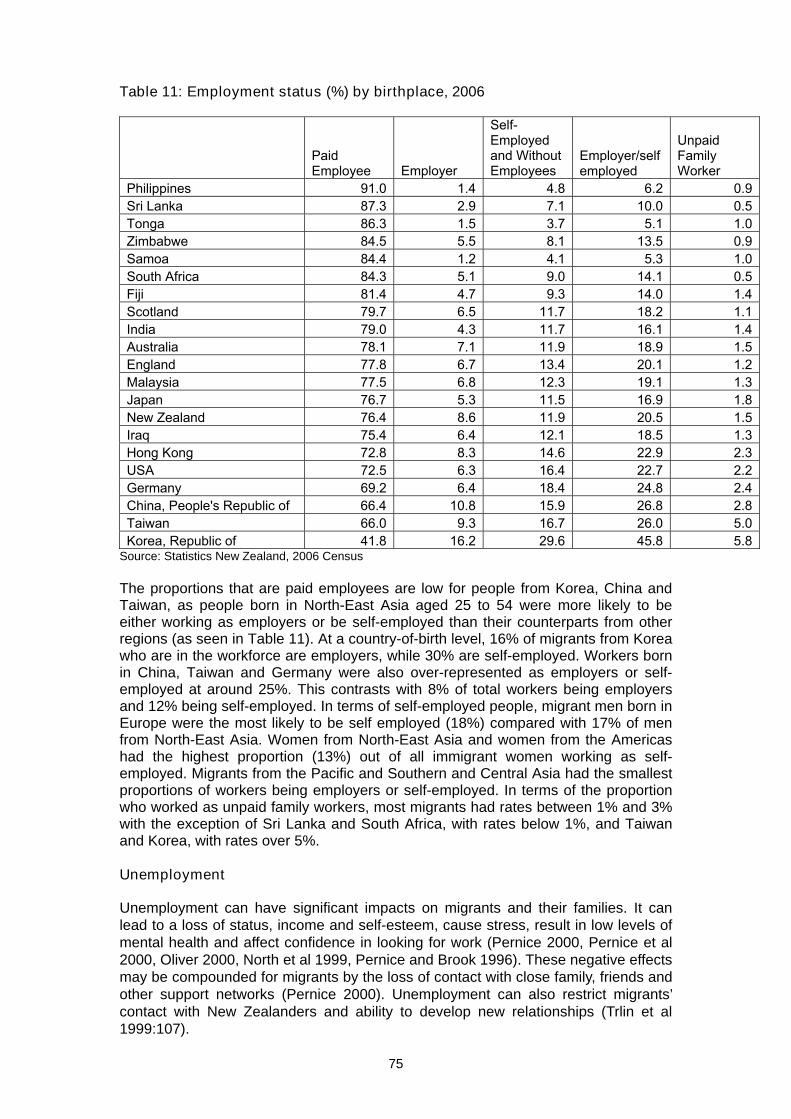
75
Table 11: Employment status (%) by birthplace, 2006
Paid Employee Employer
Self-Employed and Without Employees
Employer/self employed
Unpaid Family Worker
Philippines 91.0 1.4 4.8 6.2 0.9Sri Lanka 87.3 2.9 7.1 10.0 0.5Tonga 86.3 1.5 3.7 5.1 1.0Zimbabwe 84.5 5.5 8.1 13.5 0.9Samoa 84.4 1.2 4.1 5.3 1.0South Africa 84.3 5.1 9.0 14.1 0.5Fiji 81.4 4.7 9.3 14.0 1.4Scotland 79.7 6.5 11.7 18.2 1.1India 79.0 4.3 11.7 16.1 1.4Australia 78.1 7.1 11.9 18.9 1.5England 77.8 6.7 13.4 20.1 1.2Malaysia 77.5 6.8 12.3 19.1 1.3Japan 76.7 5.3 11.5 16.9 1.8New Zealand 76.4 8.6 11.9 20.5 1.5Iraq 75.4 6.4 12.1 18.5 1.3Hong Kong 72.8 8.3 14.6 22.9 2.3USA 72.5 6.3 16.4 22.7 2.2Germany 69.2 6.4 18.4 24.8 2.4China, People's Republic of 66.4 10.8 15.9 26.8 2.8Taiwan 66.0 9.3 16.7 26.0 5.0Korea, Republic of 41.8 16.2 29.6 45.8 5.8
Source: Statistics New Zealand, 2006 Census The proportions that are paid employees are low for people from Korea, China and Taiwan, as people born in North-East Asia aged 25 to 54 were more likely to be either working as employers or be self-employed than their counterparts from other regions (as seen in Table 11). At a country-of-birth level, 16% of migrants from Korea who are in the workforce are employers, while 30% are self-employed. Workers born in China, Taiwan and Germany were also over-represented as employers or self-employed at around 25%. This contrasts with 8% of total workers being employers and 12% being self-employed. In terms of self-employed people, migrant men born in Europe were the most likely to be self employed (18%) compared with 17% of men from North-East Asia. Women from North-East Asia and women from the Americas had the highest proportion (13%) out of all immigrant women working as self-employed. Migrants from the Pacific and Southern and Central Asia had the smallest proportions of workers being employers or self-employed. In terms of the proportion who worked as unpaid family workers, most migrants had rates between 1% and 3% with the exception of Sri Lanka and South Africa, with rates below 1%, and Taiwan and Korea, with rates over 5%. Unemployment
Unemployment can have significant impacts on migrants and their families. It can lead to a loss of status, income and self-esteem, cause stress, result in low levels of mental health and affect confidence in looking for work (Pernice 2000, Pernice et al 2000, Oliver 2000, North et al 1999, Pernice and Brook 1996). These negative effects may be compounded for migrants by the loss of contact with close family, friends and other support networks (Pernice 2000). Unemployment can also restrict migrants’ contact with New Zealanders and ability to develop new relationships (Trlin et al 1999:107).
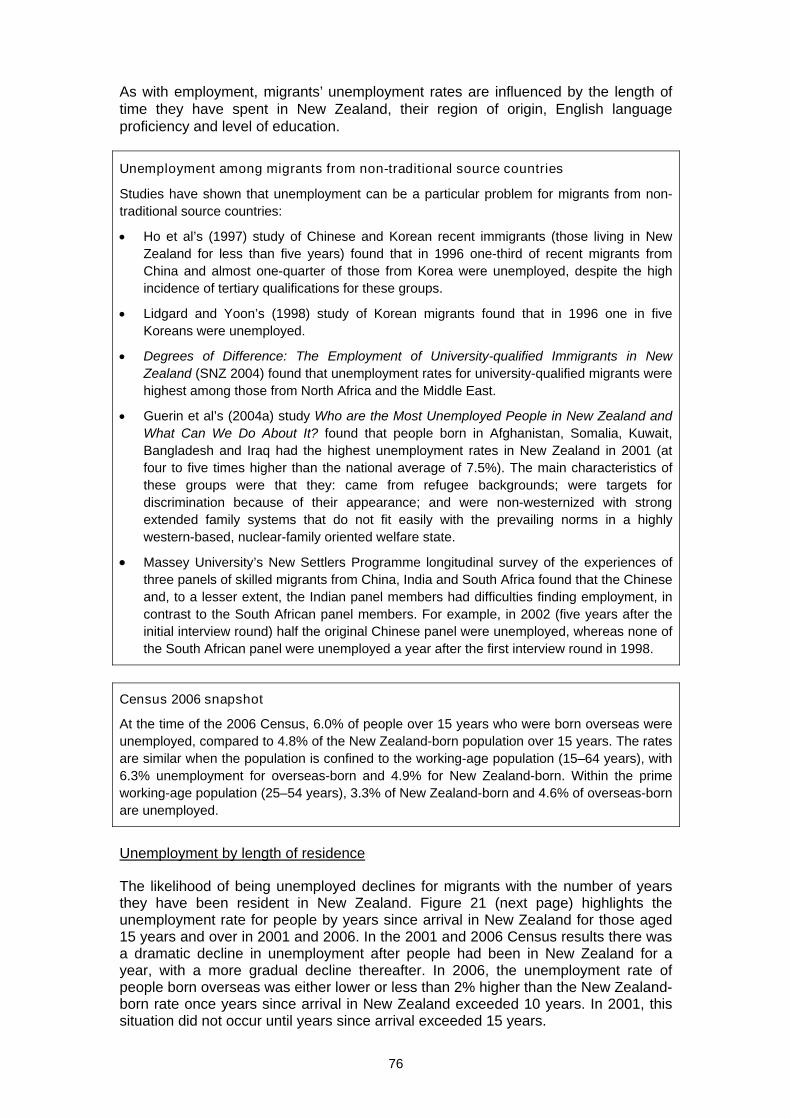
76
As with employment, migrants’ unemployment rates are influenced by the length of time they have spent in New Zealand, their region of origin, English language proficiency and level of education.
Unemployment among migrants from non-traditional source countries
Studies have shown that unemployment can be a particular problem for migrants from non-traditional source countries:
• Ho et al’s (1997) study of Chinese and Korean recent immigrants (those living in New Zealand for less than five years) found that in 1996 one-third of recent migrants from China and almost one-quarter of those from Korea were unemployed, despite the high incidence of tertiary qualifications for these groups.
• Lidgard and Yoon’s (1998) study of Korean migrants found that in 1996 one in five Koreans were unemployed.
• Degrees of Difference: The Employment of University-qualified Immigrants in New Zealand (SNZ 2004) found that unemployment rates for university-qualified migrants were highest among those from North Africa and the Middle East.
• Guerin et al’s (2004a) study Who are the Most Unemployed People in New Zealand and What Can We Do About It? found that people born in Afghanistan, Somalia, Kuwait, Bangladesh and Iraq had the highest unemployment rates in New Zealand in 2001 (at four to five times higher than the national average of 7.5%). The main characteristics of these groups were that they: came from refugee backgrounds; were targets for discrimination because of their appearance; and were non-westernized with strong extended family systems that do not fit easily with the prevailing norms in a highly western-based, nuclear-family oriented welfare state.
• Massey University’s New Settlers Programme longitudinal survey of the experiences of three panels of skilled migrants from China, India and South Africa found that the Chinese and, to a lesser extent, the Indian panel members had difficulties finding employment, in contrast to the South African panel members. For example, in 2002 (five years after the initial interview round) half the original Chinese panel were unemployed, whereas none of the South African panel were unemployed a year after the first interview round in 1998.
Census 2006 snapshot
At the time of the 2006 Census, 6.0% of people over 15 years who were born overseas were unemployed, compared to 4.8% of the New Zealand-born population over 15 years. The rates are similar when the population is confined to the working-age population (15–64 years), with 6.3% unemployment for overseas-born and 4.9% for New Zealand-born. Within the prime working-age population (25–54 years), 3.3% of New Zealand-born and 4.6% of overseas-born are unemployed.
Unemployment by length of residence
The likelihood of being unemployed declines for migrants with the number of years they have been resident in New Zealand. Figure 21 (next page) highlights the unemployment rate for people by years since arrival in New Zealand for those aged 15 years and over in 2001 and 2006. In the 2001 and 2006 Census results there was a dramatic decline in unemployment after people had been in New Zealand for a year, with a more gradual decline thereafter. In 2006, the unemployment rate of people born overseas was either lower or less than 2% higher than the New Zealand-born rate once years since arrival in New Zealand exceeded 10 years. In 2001, this situation did not occur until years since arrival exceeded 15 years.
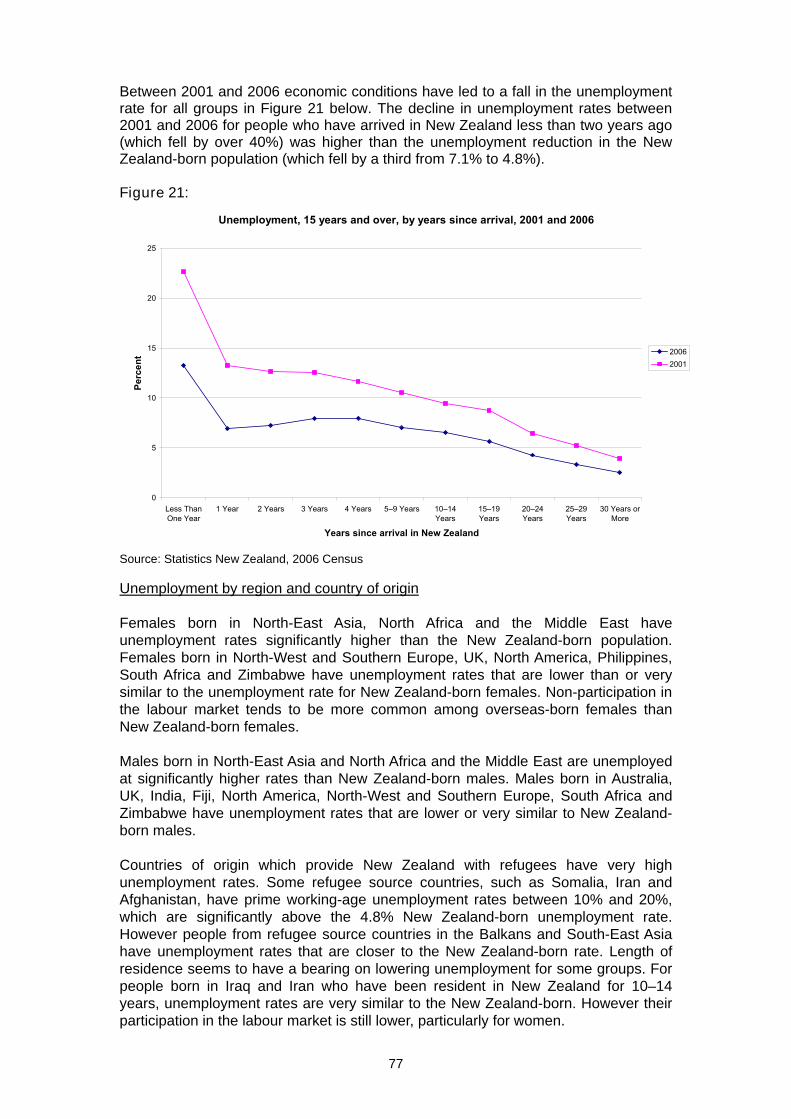
77
Between 2001 and 2006 economic conditions have led to a fall in the unemployment rate for all groups in Figure 21 below. The decline in unemployment rates between 2001 and 2006 for people who have arrived in New Zealand less than two years ago (which fell by over 40%) was higher than the unemployment reduction in the New Zealand-born population (which fell by a third from 7.1% to 4.8%). Figure 21:
Unemployment, 15 years and over, by years since arrival, 2001 and 2006
0
5
10
15
20
25
Less ThanOne Year
1 Year 2 Years 3 Years 4 Years 5–9 Years 10–14Years
15–19Years
20–24Years
25–29Years
30 Years orMore
Years since arrival in New Zealand
Perc
ent 2006
2001
Source: Statistics New Zealand, 2006 Census Unemployment by region and country of origin Females born in North-East Asia, North Africa and the Middle East have unemployment rates significantly higher than the New Zealand-born population. Females born in North-West and Southern Europe, UK, North America, Philippines, South Africa and Zimbabwe have unemployment rates that are lower than or very similar to the unemployment rate for New Zealand-born females. Non-participation in the labour market tends to be more common among overseas-born females than New Zealand-born females. Males born in North-East Asia and North Africa and the Middle East are unemployed at significantly higher rates than New Zealand-born males. Males born in Australia, UK, India, Fiji, North America, North-West and Southern Europe, South Africa and Zimbabwe have unemployment rates that are lower or very similar to New Zealand-born males. Countries of origin which provide New Zealand with refugees have very high unemployment rates. Some refugee source countries, such as Somalia, Iran and Afghanistan, have prime working-age unemployment rates between 10% and 20%, which are significantly above the 4.8% New Zealand-born unemployment rate. However people from refugee source countries in the Balkans and South-East Asia have unemployment rates that are closer to the New Zealand-born rate. Length of residence seems to have a bearing on lowering unemployment for some groups. For people born in Iraq and Iran who have been resident in New Zealand for 10–14 years, unemployment rates are very similar to the New Zealand-born. However their participation in the labour market is still lower, particularly for women.
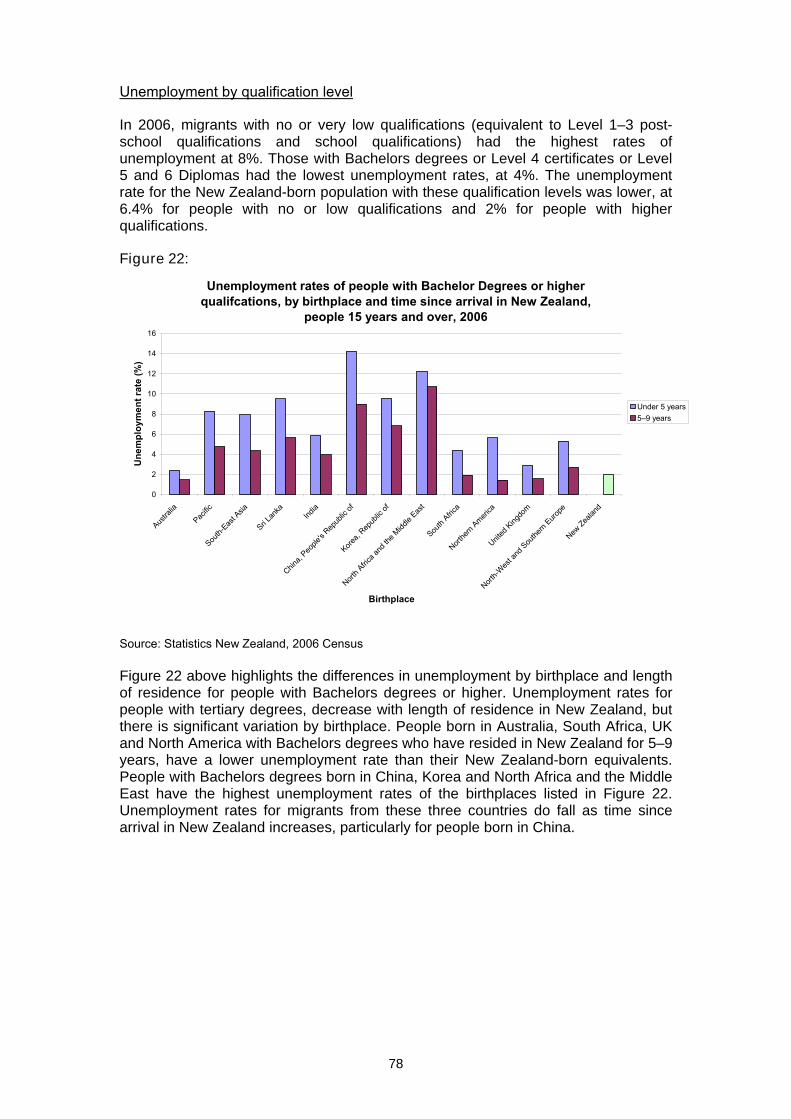
78
Unemployment by qualification level
In 2006, migrants with no or very low qualifications (equivalent to Level 1–3 post-school qualifications and school qualifications) had the highest rates of unemployment at 8%. Those with Bachelors degrees or Level 4 certificates or Level 5 and 6 Diplomas had the lowest unemployment rates, at 4%. The unemployment rate for the New Zealand-born population with these qualification levels was lower, at 6.4% for people with no or low qualifications and 2% for people with higher qualifications.
Figure 22:
Unemployment rates of people with Bachelor Degrees or higher qualifcations, by birthplace and time since arrival in New Zealand,
people 15 years and over, 2006
0
2
4
6
8
10
12
14
16
Austra
lia
Pacific
South-
East A
sia
Sri Lan
kaInd
ia
China,
People
's Rep
ublic
of
Korea,
Repub
lic of
North A
frica a
nd th
e Midd
le Eas
t
South
Africa
Northe
rn Ameri
ca
United
King
dom
North-W
est a
nd S
outhe
rn Euro
pe
New Zea
land
Birthplace
Une
mpl
oym
ent r
ate
(%)
Under 5 years5–9 years
Source: Statistics New Zealand, 2006 Census
Figure 22 above highlights the differences in unemployment by birthplace and length of residence for people with Bachelors degrees or higher. Unemployment rates for people with tertiary degrees, decrease with length of residence in New Zealand, but there is significant variation by birthplace. People born in Australia, South Africa, UK and North America with Bachelors degrees who have resided in New Zealand for 5–9 years, have a lower unemployment rate than their New Zealand-born equivalents. People with Bachelors degrees born in China, Korea and North Africa and the Middle East have the highest unemployment rates of the birthplaces listed in Figure 22. Unemployment rates for migrants from these three countries do fall as time since arrival in New Zealand increases, particularly for people born in China.
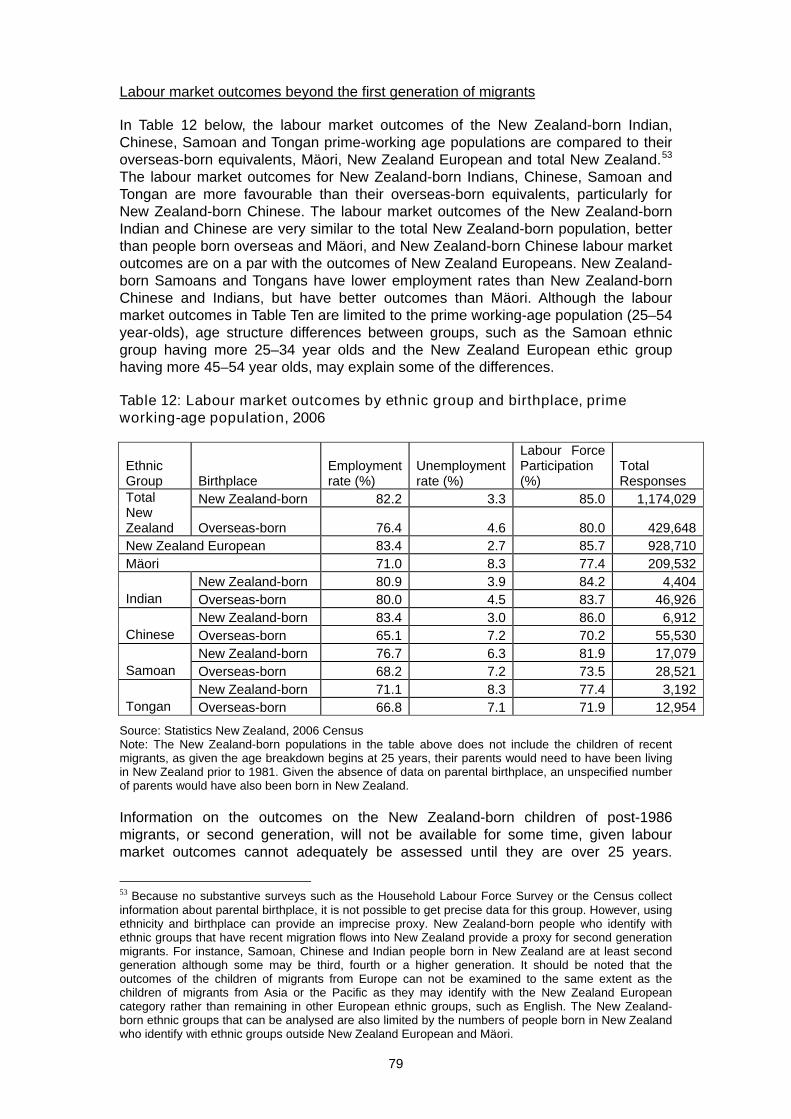
79
Labour market outcomes beyond the first generation of migrants
In Table 12 below, the labour market outcomes of the New Zealand-born Indian, Chinese, Samoan and Tongan prime-working age populations are compared to their overseas-born equivalents, Mäori, New Zealand European and total New Zealand.53 The labour market outcomes for New Zealand-born Indians, Chinese, Samoan and Tongan are more favourable than their overseas-born equivalents, particularly for New Zealand-born Chinese. The labour market outcomes of the New Zealand-born Indian and Chinese are very similar to the total New Zealand-born population, better than people born overseas and Mäori, and New Zealand-born Chinese labour market outcomes are on a par with the outcomes of New Zealand Europeans. New Zealand-born Samoans and Tongans have lower employment rates than New Zealand-born Chinese and Indians, but have better outcomes than Mäori. Although the labour market outcomes in Table Ten are limited to the prime working-age population (25–54 year-olds), age structure differences between groups, such as the Samoan ethnic group having more 25–34 year olds and the New Zealand European ethic group having more 45–54 year olds, may explain some of the differences.
Table 12: Labour market outcomes by ethnic group and birthplace, prime working-age population, 2006
Ethnic Group Birthplace
Employment rate (%)
Unemployment rate (%)
Labour Force Participation (%)
Total Responses
New Zealand-born 82.2 3.3 85.0 1,174,029 Total New Zealand Overseas-born 76.4 4.6 80.0 429,648 New Zealand European 83.4 2.7 85.7 928,710 Mäori 71.0 8.3 77.4 209,532
New Zealand-born 80.9 3.9 84.2 4,404 Indian Overseas-born 80.0 4.5 83.7 46,926
New Zealand-born 83.4 3.0 86.0 6,912 Chinese Overseas-born 65.1 7.2 70.2 55,530
New Zealand-born 76.7 6.3 81.9 17,079 Samoan Overseas-born 68.2 7.2 73.5 28,521
New Zealand-born 71.1 8.3 77.4 3,192 Tongan Overseas-born 66.8 7.1 71.9 12,954
Source: Statistics New Zealand, 2006 Census Note: The New Zealand-born populations in the table above does not include the children of recent migrants, as given the age breakdown begins at 25 years, their parents would need to have been living in New Zealand prior to 1981. Given the absence of data on parental birthplace, an unspecified number of parents would have also been born in New Zealand.
Information on the outcomes on the New Zealand-born children of post-1986 migrants, or second generation, will not be available for some time, given labour market outcomes cannot adequately be assessed until they are over 25 years.
53 Because no substantive surveys such as the Household Labour Force Survey or the Census collect information about parental birthplace, it is not possible to get precise data for this group. However, using ethnicity and birthplace can provide an imprecise proxy. New Zealand-born people who identify with ethnic groups that have recent migration flows into New Zealand provide a proxy for second generation migrants. For instance, Samoan, Chinese and Indian people born in New Zealand are at least second generation although some may be third, fourth or a higher generation. It should be noted that the outcomes of the children of migrants from Europe can not be examined to the same extent as the children of migrants from Asia or the Pacific as they may identify with the New Zealand European category rather than remaining in other European ethnic groups, such as English. The New Zealand-born ethnic groups that can be analysed are also limited by the numbers of people born in New Zealand who identify with ethnic groups outside New Zealand European and Mäori.
80
However, information does exist on the “one and a half generation”. The “one and a half generation” describes the children who migrate with their parents when they are still young. The “one and a half generation” analysed here are people who migrated to New Zealand when they were 15 years or younger, between 1981 and 1996 (less than 25 years ago).54 Of the 22,000 people in this group, who are now aged 25–34 years, 77% are employed, just one percentage point lower than the New Zealand-born employment rate for people of the same age. People in this group born in Korea, Taiwan, Tonga and Samoa had the largest difference from the New Zealand-born people aged 25–34 years (between 6 and 14 percentage points below). Within this “one and a half generation”, people born in Malaysia, Philippines, South Africa and Sri Lanka had the highest employment rates (7 percentage points higher than the New Zealand-born). People born in England, China, India and Australia, four of the current biggest contributors to New Zealand’s overseas-born population, also had employment rates higher than New Zealand-born group aged 25–34 years.
Although census information on the labour market outcomes of migrants’ children is limited, indications are that they generally have positive outcomes. However, there are some concerns with the outcomes for children from migrant groups from some regions such as the Pacific, whose outcomes are on average not as favourable
Occupations Occupational group distributions will likely reflect skills-based immigration policies and the need for particular qualifications and experience to obtain work in certain jobs, and possibly class-based differences. The occupations migrants work in may reflect or disguise the proportion of people who may be working in an area that is inconsistent with their skills, experience, overseas qualifications and preferred occupations. This is an important consideration for social cohesion because if too many people work in occupations or jobs that do not use their specialist skills and knowledge out of financial necessity, this can give rise to frustration and a sense of marginalisation. At the time of the 2006 Census, the most common occupation group for the overseas-born population was professional (19% for all age groups increasing to 22% for the 25–54 year age group), compared with legislators, administrators and managers as the most common occupation for people born in New Zealand. The occupational distribution of the overseas-born population varies by region of birth. The region with the highest concentration within the professional category was sub-Saharan Africa (which includes South Africa and Zimbabwe) with 29%, followed by The Americas on 28%. The regions with the lowest concentration in the professionals group were North-East Asia on 14% and Oceania on 13%. Similar distributions can be seen in the technicians and associated professionals category: Sub-Saharan Africa and The Americas had the highest proportions in this category with South-East Asia and Oceania the lowest. North-East Asia and South-East Asia had the highest percentages of all the regions in the sales and services workers category with 20% and 15% respectively. Sub-Saharan Africa had the lowest (7%), followed by North-West Europe (9%). Proportionately more of the overseas-born population from Oceania than any other region work in the plant, machine operators and assemblers category (14%) and the labourers and related elementary services workers category (10%). These were also the most common categories for this regional population group.
54 The comparison was made by selecting people from the census aged 25–34 years, born overseas, who moved to New Zealand within the last 25 years when they were around 15 years old or less – this provides a proxy of the “one and a half generation” for analysis purposes.
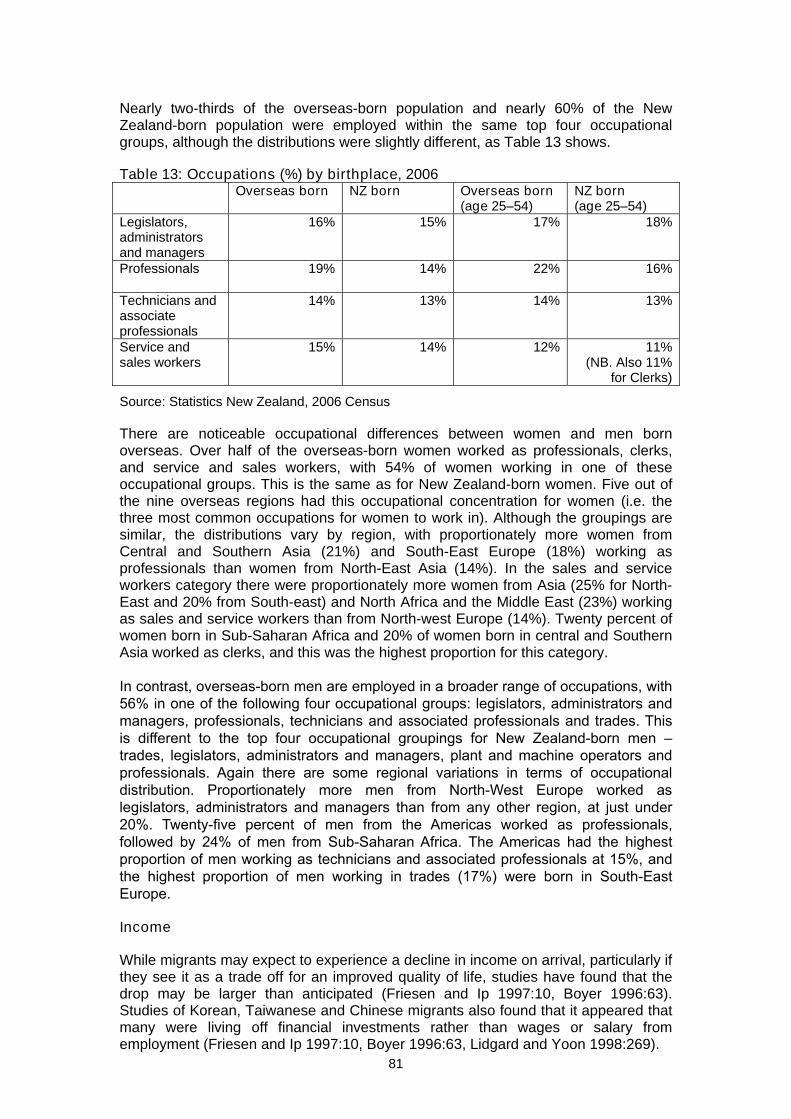
81
Nearly two-thirds of the overseas-born population and nearly 60% of the New Zealand-born population were employed within the same top four occupational groups, although the distributions were slightly different, as Table 13 shows. Table 13: Occupations (%) by birthplace, 2006 Overseas born NZ born Overseas born
(age 25–54) NZ born (age 25–54)
Legislators, administrators and managers
16% 15% 17% 18%
Professionals 19% 14% 22% 16%
Technicians and associate professionals
14% 13% 14% 13%
Service and sales workers
15% 14% 12% 11% (NB. Also 11%
for Clerks)
Source: Statistics New Zealand, 2006 Census
There are noticeable occupational differences between women and men born overseas. Over half of the overseas-born women worked as professionals, clerks, and service and sales workers, with 54% of women working in one of these occupational groups. This is the same as for New Zealand-born women. Five out of the nine overseas regions had this occupational concentration for women (i.e. the three most common occupations for women to work in). Although the groupings are similar, the distributions vary by region, with proportionately more women from Central and Southern Asia (21%) and South-East Europe (18%) working as professionals than women from North-East Asia (14%). In the sales and service workers category there were proportionately more women from Asia (25% for North-East and 20% from South-east) and North Africa and the Middle East (23%) working as sales and service workers than from North-west Europe (14%). Twenty percent of women born in Sub-Saharan Africa and 20% of women born in central and Southern Asia worked as clerks, and this was the highest proportion for this category. In contrast, overseas-born men are employed in a broader range of occupations, with 56% in one of the following four occupational groups: legislators, administrators and managers, professionals, technicians and associated professionals and trades. This is different to the top four occupational groupings for New Zealand-born men – trades, legislators, administrators and managers, plant and machine operators and professionals. Again there are some regional variations in terms of occupational distribution. Proportionately more men from North-West Europe worked as legislators, administrators and managers than from any other region, at just under 20%. Twenty-five percent of men from the Americas worked as professionals, followed by 24% of men from Sub-Saharan Africa. The Americas had the highest proportion of men working as technicians and associated professionals at 15%, and the highest proportion of men working in trades (17%) were born in South-East Europe.
Income
While migrants may expect to experience a decline in income on arrival, particularly if they see it as a trade off for an improved quality of life, studies have found that the drop may be larger than anticipated (Friesen and Ip 1997:10, Boyer 1996:63). Studies of Korean, Taiwanese and Chinese migrants also found that it appeared that many were living off financial investments rather than wages or salary from employment (Friesen and Ip 1997:10, Boyer 1996:63, Lidgard and Yoon 1998:269).
82
The LisNZ pilot survey (NZIS 2004a:90) found that, at 18 months after residence, 10% of Skilled/Business principal applicants said they were earning $10,000 or less, compared with about half of migrants entering under different categories. Skilled migrants tend to earn good incomes, with a DoL survey finding that 75% of skilled principal applicants were earning more than the average salary for full time workers in New Zealand55 (Wallis 2006:24). According to the same survey, 52% of skilled migrants were earning over $50,000 (Wallis 2006:24). Refugee Voices (NZIS 2004:255) found that the majority of participants in their study earned less than $30,000 per annum. Many earned less than $10,000 and supplemented their wage with a government benefit. However, migrants or refugees from developing countries may receive large increases in income compared to what they would have otherwise earned in their country of origin. For example, McKenzie et al (2006:18) found that Tongan migrants who secured a place in the Pacific Access Category lottery to enter New Zealand had a 263% increase in income from migrating, compared to those who were unsuccessful in the ballot. However, differences in costs of living between the countries need to be considered as well as other factors such as relative incomes in New Zealand and whether there are expectations that migrants will send money back to the countries they’ve left.
Census 2006 snapshot
At the time of the 2006 Census, the median income of prime working-age (25–54 years) people who were born overseas was $30,500, compared to $34,600 of the New Zealand-born prime working-age population (gap of $4,100). In terms people within the prime working-age population employed full-time, the median income for overseas-born was $39,300 compared to $42,200 (gap of $2,900)
The analysis of migrant income levels based on census data56 focuses on prime working-age people, as for the employment analysis. An additional qualifier of full-time employment57 is used, so as to diminish the effect of poorer employment rates (which are already covered in the employment section) and reduce the variation due to hours of work. Analysis based on income from people in full-time employment allows the earnings differential to be the focus, rather than incomes simply reflecting poorer employment outcomes. The gap in median income for full-time employed overseas-born females is slightly less than the gap for males, when compared to their New Zealand-born equivalents. The median income of overseas-born females is $35,500 compared to $37,500 for New Zealand-born. For males, median incomes are $43,100 for overseas-born and $46,000 for New Zealand-born. People born overseas are slightly more likely to have low incomes with 30% having incomes below $30,000 compared to 23% for New Zealand-born. Annual incomes in excess of $70,000 are about equally as likely for New Zealand-born (15.6%) and overseas-born (14.8%).
55 Wallis’ report (2006) noted that, according to Statistics New Zealand’s Quarterly Employment Survey (March 2005 quarter), New Zealanders earned on average $41,000 for a 52 week period (based on average weekly earnings of New Zealanders in full time employment of $794.83). The New Zealand Income survey (June 2004 quarter) reported that New Zealanders’ average weekly income was $757.00 per week ($39,000 for a 52 week period). Wallis’ report found that 75% of the skilled principal applicants in its analysis were earning $40,001 or more annually from their main jobs. 56 Income in the census is measured as nominal pre- tax, total personal annual income. It therefore includes income from work, income from other sources, and income from government transfer payments. The Census captures income data in bands rather than in exact dollars. 57 In the census, people are classified as being in full-time employment if they usually work over 30 hours a week.
83
In 1981 and 1986, full-time employed migrants had slightly higher median incomes than the New Zealand-born population (Winkelmann and Winkelmann 1998:235). The ratio of overseas-born median income to New Zealand-born median income fell from above 1 in 1986 to 0.96 in 1996. Between 1996 and 2006, the ratio declined again to 0.93. Income by length of residence Median income increases with length of residence. Male migrants who immigrated between 1991 and 1996 (10–14 years residence) have the same median income as New Zealand-born males (both $46,000), while overseas-born females who arrived 10–14 years ago still have a slightly lower median income ($36,200) than their New Zealand-born equivalents ($37,500). In terms of earning distribution, 35% of migrants who arrived in New Zealand less than 5 years ago, earned under $30,000 in 2006. This proportion declines with residence, to 29% after 10–14 years, but it is still higher than the New Zealand-born proportion of 24%. The proportion of the overseas-born with incomes over $70,000 increases with residence from 12% for under 5 years to 19% for 10–14 years. The proportion of overseas-born people with earnings over $70,000 exceeds or is similar to the proportion of the New Zealand-born (16%) once migrants have resided here for more than 5 years. Income by birthplace Median income varies significantly by birthplace. For the birthplaces examined as part of Table 14 (next page), they range from 60% of the New Zealand-born median income (Korea) to 20% above the New Zealand-born level of median income (South Africa, Scotland and England). India, the Philippines and Fiji had good employment rates and, in the case of the Philippines and India, very highly qualified migrants. However, people born in these countries did not appear to carry these advantages through to their income levels. It is unclear what the proportion is who were working in occupations consistent with their field of study, but underemployment could be one explanation. People born in Malaysia and Sri Lanka had similar employment and education outcomes to people born in India and the Philippines, but carried this advantage through to their median income levels. People born in Korea, China, Japan, Taiwan and Samoa and Tonga, had lower median incomes than other groups. For the Pacific countries, lower qualifications and a younger age structure will contribute to their lower incomes. Pacific people gain access to New Zealand primarily through family and the Pacific quota, and thus do not meet the qualification requirements that most migrants, who gain access through the skills category, meet. The higher rates of self-employment of people born in China, Korea and Taiwan will influence their income levels to a certain extent, given the opportunity this provides to structure earnings. Underemployment due to employer attitudes towards qualifications and experience may also be a factor influencing income levels. The ratio of the overseas-born median income to the New Zealand-born median income increases with the length of residence, as seen in Table 14. Eleven birthplaces, including India and the Philippines, have median incomes at 0.9 of the median New Zealand-born rate, or higher, after 5–9 years residence. Five migrant birthplaces have higher median incomes than the New Zealand-born with under 5 years residence. These higher median incomes are a continuation of a trend from earlier censuses.
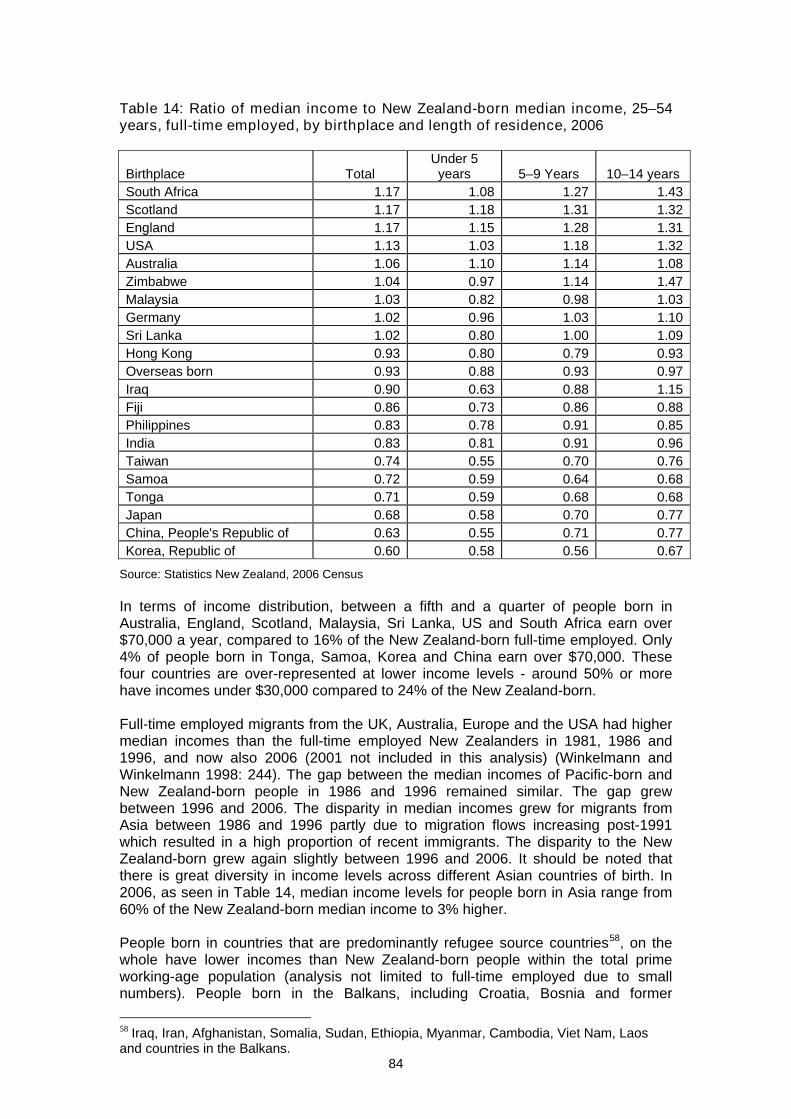
84
Table 14: Ratio of median income to New Zealand-born median income, 25–54 years, full-time employed, by birthplace and length of residence, 2006
Birthplace Total Under 5 years 5–9 Years 10–14 years
South Africa 1.17 1.08 1.27 1.43 Scotland 1.17 1.18 1.31 1.32 England 1.17 1.15 1.28 1.31 USA 1.13 1.03 1.18 1.32 Australia 1.06 1.10 1.14 1.08 Zimbabwe 1.04 0.97 1.14 1.47 Malaysia 1.03 0.82 0.98 1.03 Germany 1.02 0.96 1.03 1.10 Sri Lanka 1.02 0.80 1.00 1.09 Hong Kong 0.93 0.80 0.79 0.93 Overseas born 0.93 0.88 0.93 0.97 Iraq 0.90 0.63 0.88 1.15 Fiji 0.86 0.73 0.86 0.88 Philippines 0.83 0.78 0.91 0.85 India 0.83 0.81 0.91 0.96 Taiwan 0.74 0.55 0.70 0.76 Samoa 0.72 0.59 0.64 0.68 Tonga 0.71 0.59 0.68 0.68 Japan 0.68 0.58 0.70 0.77 China, People's Republic of 0.63 0.55 0.71 0.77 Korea, Republic of 0.60 0.58 0.56 0.67
Source: Statistics New Zealand, 2006 Census In terms of income distribution, between a fifth and a quarter of people born in Australia, England, Scotland, Malaysia, Sri Lanka, US and South Africa earn over $70,000 a year, compared to 16% of the New Zealand-born full-time employed. Only 4% of people born in Tonga, Samoa, Korea and China earn over $70,000. These four countries are over-represented at lower income levels - around 50% or more have incomes under $30,000 compared to 24% of the New Zealand-born. Full-time employed migrants from the UK, Australia, Europe and the USA had higher median incomes than the full-time employed New Zealanders in 1981, 1986 and 1996, and now also 2006 (2001 not included in this analysis) (Winkelmann and Winkelmann 1998: 244). The gap between the median incomes of Pacific-born and New Zealand-born people in 1986 and 1996 remained similar. The gap grew between 1996 and 2006. The disparity in median incomes grew for migrants from Asia between 1986 and 1996 partly due to migration flows increasing post-1991 which resulted in a high proportion of recent immigrants. The disparity to the New Zealand-born grew again slightly between 1996 and 2006. It should be noted that there is great diversity in income levels across different Asian countries of birth. In 2006, as seen in Table 14, median income levels for people born in Asia range from 60% of the New Zealand-born median income to 3% higher. People born in countries that are predominantly refugee source countries58, on the whole have lower incomes than New Zealand-born people within the total prime working-age population (analysis not limited to full-time employed due to small numbers). People born in the Balkans, including Croatia, Bosnia and former
58 Iraq, Iran, Afghanistan, Somalia, Sudan, Ethiopia, Myanmar, Cambodia, Viet Nam, Laos and countries in the Balkans.
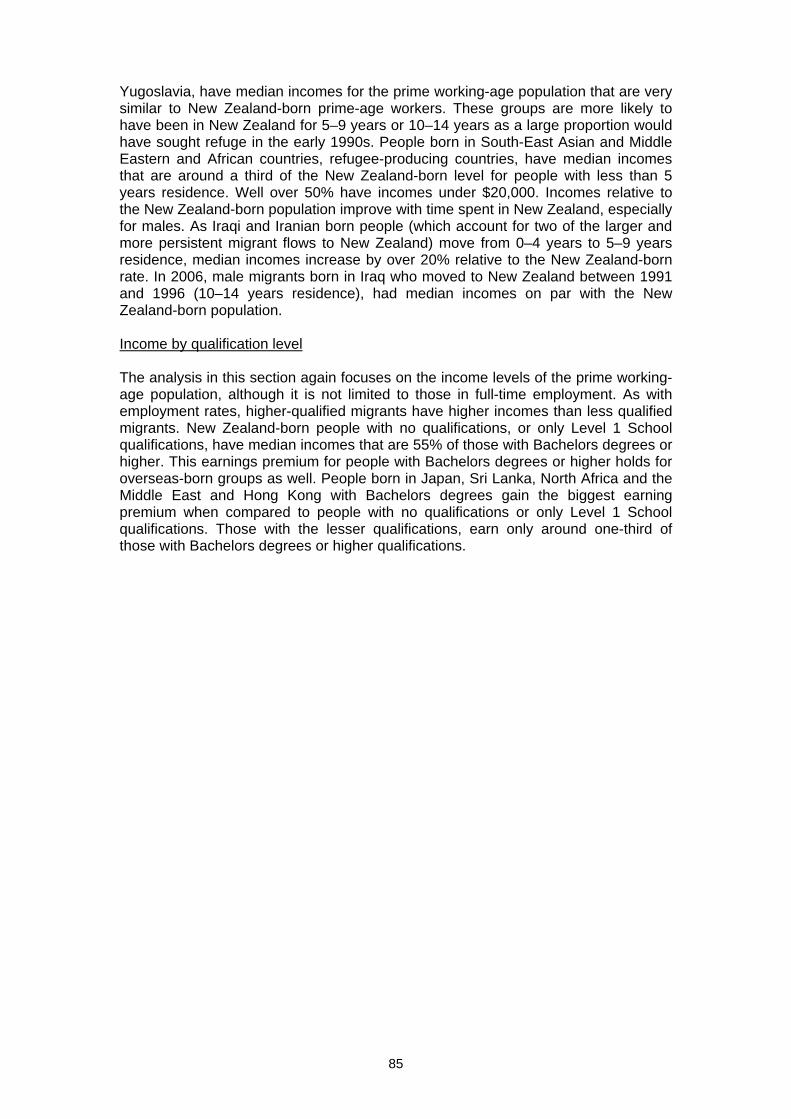
85
Yugoslavia, have median incomes for the prime working-age population that are very similar to New Zealand-born prime-age workers. These groups are more likely to have been in New Zealand for 5–9 years or 10–14 years as a large proportion would have sought refuge in the early 1990s. People born in South-East Asian and Middle Eastern and African countries, refugee-producing countries, have median incomes that are around a third of the New Zealand-born level for people with less than 5 years residence. Well over 50% have incomes under $20,000. Incomes relative to the New Zealand-born population improve with time spent in New Zealand, especially for males. As Iraqi and Iranian born people (which account for two of the larger and more persistent migrant flows to New Zealand) move from 0–4 years to 5–9 years residence, median incomes increase by over 20% relative to the New Zealand-born rate. In 2006, male migrants born in Iraq who moved to New Zealand between 1991 and 1996 (10–14 years residence), had median incomes on par with the New Zealand-born population. Income by qualification level The analysis in this section again focuses on the income levels of the prime working-age population, although it is not limited to those in full-time employment. As with employment rates, higher-qualified migrants have higher incomes than less qualified migrants. New Zealand-born people with no qualifications, or only Level 1 School qualifications, have median incomes that are 55% of those with Bachelors degrees or higher. This earnings premium for people with Bachelors degrees or higher holds for overseas-born groups as well. People born in Japan, Sri Lanka, North Africa and the Middle East and Hong Kong with Bachelors degrees gain the biggest earning premium when compared to people with no qualifications or only Level 1 School qualifications. Those with the lesser qualifications, earn only around one-third of those with Bachelors degrees or higher qualifications.
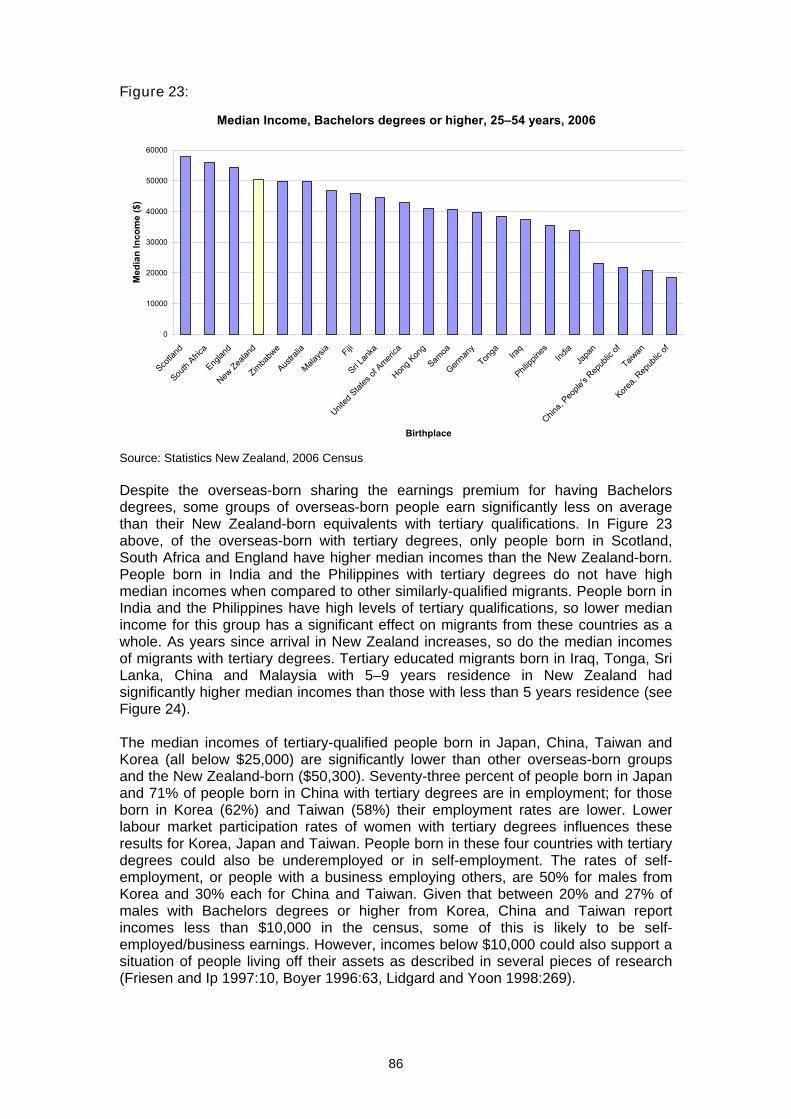
86
Figure 23:
Median Income, Bachelors degrees or higher, 25–54 years, 2006
0
10000
20000
30000
40000
50000
60000
Scotla
nd
South
Africa
Englan
d
New Zea
land
Zimba
bwe
Austra
lia
Malays
ia Fiji
Sri Lan
ka
United
Stat
es of
Ameri
ca
Hong K
ong
Samoa
German
y
Tonga Ira
q
Philipp
ines
India
Japa
n
China,
People
's Rep
ublic
of
Taiwan
Korea,
Repub
lic of
Birthplace
Med
ian
Inco
me
($)
Source: Statistics New Zealand, 2006 Census Despite the overseas-born sharing the earnings premium for having Bachelors degrees, some groups of overseas-born people earn significantly less on average than their New Zealand-born equivalents with tertiary qualifications. In Figure 23 above, of the overseas-born with tertiary degrees, only people born in Scotland, South Africa and England have higher median incomes than the New Zealand-born. People born in India and the Philippines with tertiary degrees do not have high median incomes when compared to other similarly-qualified migrants. People born in India and the Philippines have high levels of tertiary qualifications, so lower median income for this group has a significant effect on migrants from these countries as a whole. As years since arrival in New Zealand increases, so do the median incomes of migrants with tertiary degrees. Tertiary educated migrants born in Iraq, Tonga, Sri Lanka, China and Malaysia with 5–9 years residence in New Zealand had significantly higher median incomes than those with less than 5 years residence (see Figure 24). The median incomes of tertiary-qualified people born in Japan, China, Taiwan and Korea (all below $25,000) are significantly lower than other overseas-born groups and the New Zealand-born ($50,300). Seventy-three percent of people born in Japan and 71% of people born in China with tertiary degrees are in employment; for those born in Korea (62%) and Taiwan (58%) their employment rates are lower. Lower labour market participation rates of women with tertiary degrees influences these results for Korea, Japan and Taiwan. People born in these four countries with tertiary degrees could also be underemployed or in self-employment. The rates of self-employment, or people with a business employing others, are 50% for males from Korea and 30% each for China and Taiwan. Given that between 20% and 27% of males with Bachelors degrees or higher from Korea, China and Taiwan report incomes less than $10,000 in the census, some of this is likely to be self-employed/business earnings. However, incomes below $10,000 could also support a situation of people living off their assets as described in several pieces of research (Friesen and Ip 1997:10, Boyer 1996:63, Lidgard and Yoon 1998:269).
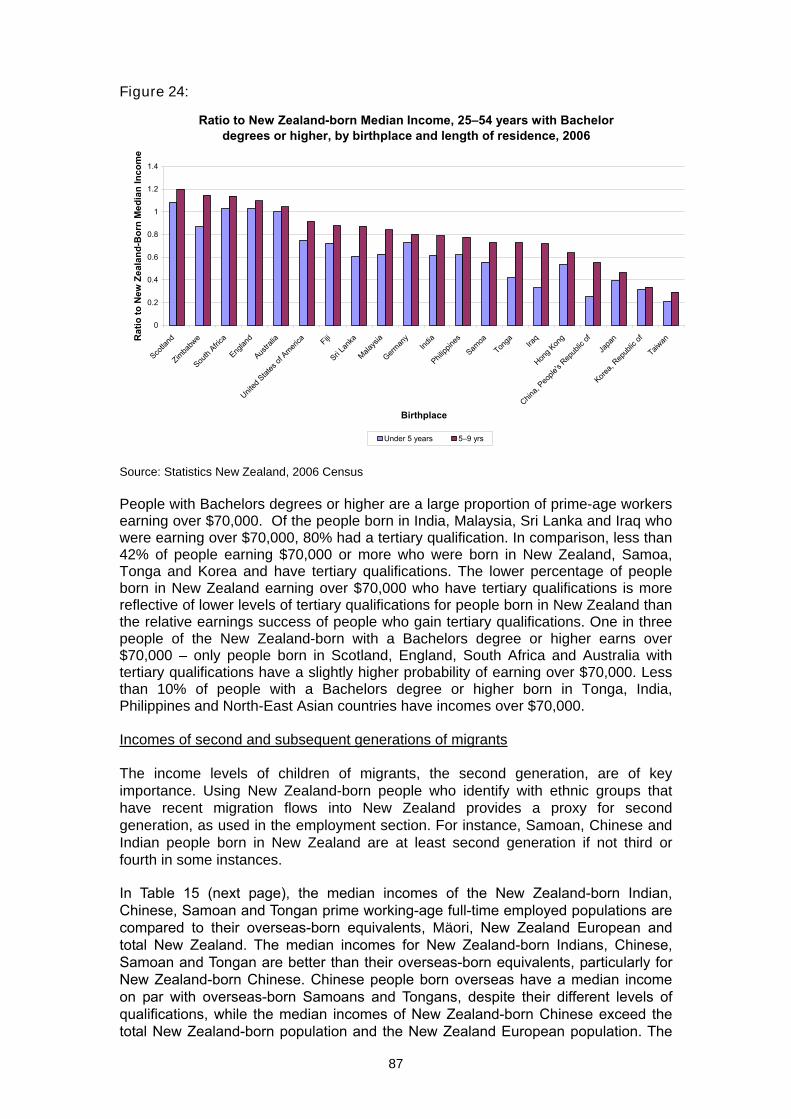
87
Figure 24:
Ratio to New Zealand-born Median Income, 25–54 years with Bachelor degrees or higher, by birthplace and length of residence, 2006
0
0.2
0.4
0.6
0.8
1
1.2
1.4
Scotla
nd
Zimba
bwe
South
Africa
Englan
d
Austra
lia
United
Stat
es of
Ameri
ca Fiji
Sri Lan
ka
Malays
ia
German
yInd
ia
Philipp
ines
Samoa
Tonga Ira
q
Hong K
ong
China,
People
's Rep
ublic
of
Japa
n
Korea,
Repub
lic of
Taiwan
Birthplace
Rat
io to
New
Zea
land
-Bor
n M
edia
n In
com
e
Under 5 years 5–9 yrs
Source: Statistics New Zealand, 2006 Census People with Bachelors degrees or higher are a large proportion of prime-age workers earning over $70,000. Of the people born in India, Malaysia, Sri Lanka and Iraq who were earning over $70,000, 80% had a tertiary qualification. In comparison, less than 42% of people earning $70,000 or more who were born in New Zealand, Samoa, Tonga and Korea and have tertiary qualifications. The lower percentage of people born in New Zealand earning over $70,000 who have tertiary qualifications is more reflective of lower levels of tertiary qualifications for people born in New Zealand than the relative earnings success of people who gain tertiary qualifications. One in three people of the New Zealand-born with a Bachelors degree or higher earns over $70,000 – only people born in Scotland, England, South Africa and Australia with tertiary qualifications have a slightly higher probability of earning over $70,000. Less than 10% of people with a Bachelors degree or higher born in Tonga, India, Philippines and North-East Asian countries have incomes over $70,000. Incomes of second and subsequent generations of migrants The income levels of children of migrants, the second generation, are of key importance. Using New Zealand-born people who identify with ethnic groups that have recent migration flows into New Zealand provides a proxy for second generation, as used in the employment section. For instance, Samoan, Chinese and Indian people born in New Zealand are at least second generation if not third or fourth in some instances.
In Table 15 (next page), the median incomes of the New Zealand-born Indian, Chinese, Samoan and Tongan prime working-age full-time employed populations are compared to their overseas-born equivalents, Mäori, New Zealand European and total New Zealand. The median incomes for New Zealand-born Indians, Chinese, Samoan and Tongan are better than their overseas-born equivalents, particularly for New Zealand-born Chinese. Chinese people born overseas have a median income on par with overseas-born Samoans and Tongans, despite their different levels of qualifications, while the median incomes of New Zealand-born Chinese exceed the total New Zealand-born population and the New Zealand European population. The
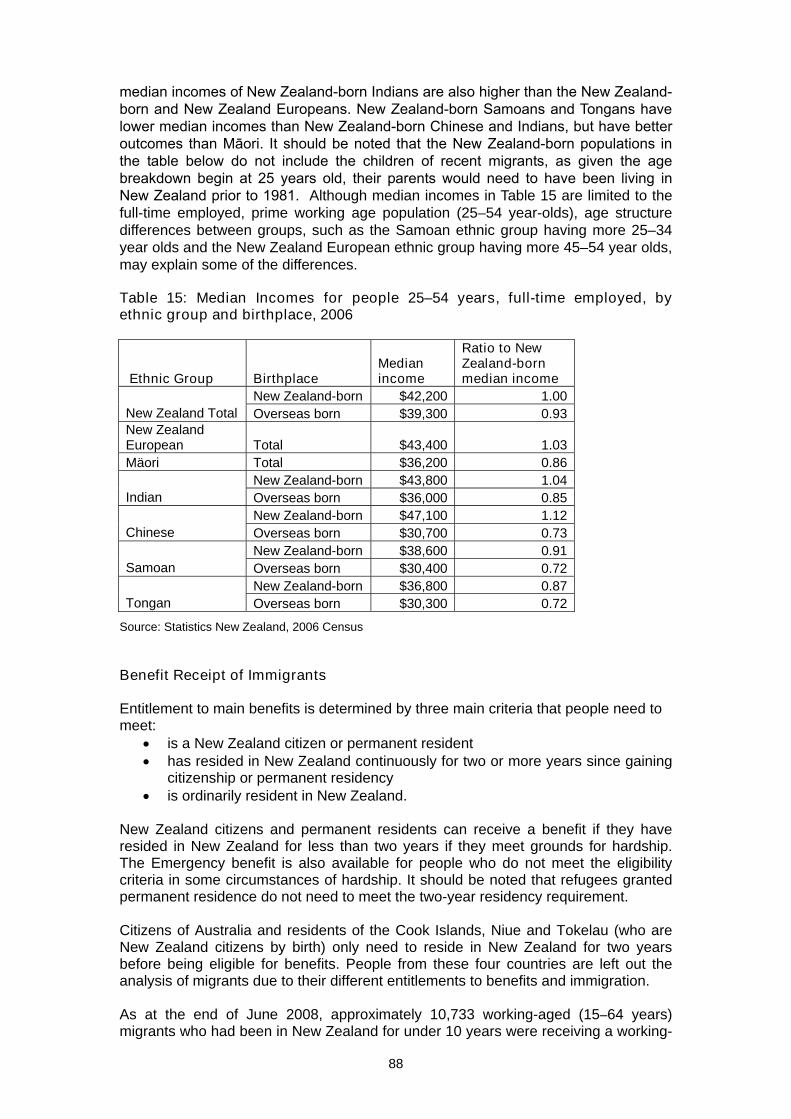
88
median incomes of New Zealand-born Indians are also higher than the New Zealand-born and New Zealand Europeans. New Zealand-born Samoans and Tongans have lower median incomes than New Zealand-born Chinese and Indians, but have better outcomes than Māori. It should be noted that the New Zealand-born populations in the table below do not include the children of recent migrants, as given the age breakdown begin at 25 years old, their parents would need to have been living in New Zealand prior to 1981. Although median incomes in Table 15 are limited to the full-time employed, prime working age population (25–54 year-olds), age structure differences between groups, such as the Samoan ethnic group having more 25–34 year olds and the New Zealand European ethnic group having more 45–54 year olds, may explain some of the differences.
Table 15: Median Incomes for people 25–54 years, full-time employed, by ethnic group and birthplace, 2006
Ethnic Group Birthplace Median income
Ratio to New Zealand-born median income
New Zealand-born $42,200 1.00 New Zealand Total Overseas born $39,300 0.93 New Zealand European Total $43,400 1.03 Mäori Total $36,200 0.86
New Zealand-born $43,800 1.04 Indian Overseas born $36,000 0.85
New Zealand-born $47,100 1.12 Chinese Overseas born $30,700 0.73
New Zealand-born $38,600 0.91 Samoan Overseas born $30,400 0.72
New Zealand-born $36,800 0.87 Tongan Overseas born $30,300 0.72
Source: Statistics New Zealand, 2006 Census
Benefit Receipt of Immigrants Entitlement to main benefits is determined by three main criteria that people need to meet:
• is a New Zealand citizen or permanent resident • has resided in New Zealand continuously for two or more years since gaining
citizenship or permanent residency • is ordinarily resident in New Zealand.
New Zealand citizens and permanent residents can receive a benefit if they have resided in New Zealand for less than two years if they meet grounds for hardship. The Emergency benefit is also available for people who do not meet the eligibility criteria in some circumstances of hardship. It should be noted that refugees granted permanent residence do not need to meet the two-year residency requirement. Citizens of Australia and residents of the Cook Islands, Niue and Tokelau (who are New Zealand citizens by birth) only need to reside in New Zealand for two years before being eligible for benefits. People from these four countries are left out the analysis of migrants due to their different entitlements to benefits and immigration. As at the end of June 2008, approximately 10,733 working-aged (15–64 years) migrants who had been in New Zealand for under 10 years were receiving a working-
89
age benefit. Of these, 31% were on a sickness benefit, 29% received the Domestic Purposes Benefit (DPB), 11% were on the unemployment benefit and 9% received an Emergency benefit. These compositions are different to the total working-age population, where the DPB (37%) and Invalid’s benefit (32 %) dominate ahead of the Sickness benefit (18%) and Unemployment related benefit (7%). Of recent migrants (under 10 years residence) on a working-age benefit, 53% had been receiving a benefit for less than 12 months. Migrants with less than 10 years residence who are born in China comprised 11% of the migrants on benefits compared to 10% born in Samoa, 8% born in Fiji, 7% each were born in India and Iraq, 5% from the UK, 4% each born in Somalia and Tonga and 3.% born in Afghanistan. Sixty-five percent of migrants on working-age benefits with less than 10 years residence are in the Auckland metropolitan Work and Income region. The next highest region is Wellington with 11% of migrants on working-age benefits. The dominance of Auckland is to be expected given that Auckland is the dominant region for migrant settlement. Working-age migrants with 10 years residence or less comprise only 4.2% of the working-age population receiving income support in June 2008. In 2006, people born overseas (excluding people born in Australia, Cook Islands, Niue and Tokelau) resident in New Zealand for less than 10 years within the working-age population comprised 11% of the total New Zealand working-age population. Therefore, this would suggest that migrants with less than 10 years residence are under-represented in the New Zealand working-age population that receive benefits. The under-representation of migrants with residence for less than 10 years among the beneficiary population reflects that the majority of migrants enter New Zealand due to their skills, and there are restrictions on benefit entitlement for new migrants. Although recent migrants are under-represented in terms of being on benefits, working-age migrants born overseas do comprise 37% of people on Emergency benefits, 13% of people receiving Unemployment Benefit Training related benefit, 7% of people receiving Unemployment related benefits, including Hardship, 7% of people receiving Sickness related benefits, 4% of people receiving the DBP and 1% of people on the Invalids benefit. Although Work and Income does not collect data on migration status, it does collect some information on refugees, due to refugees having different eligibility criteria. Refugees comprise 18% of migrants with less than 10 years residence on benefits. Working-age refugees who are receiving benefits are most likely to receive the sickness benefit (33%) followed by an Unemployment Benefit Training related benefit (20%), an Unemployment related benefit (13%), Emergency benefit (13%) and DPB related benefit (13%). Of the 1,900 refugees with less than 10 years residence in New Zealand who are on benefits, 53% have been receiving the benefit for less than one year.
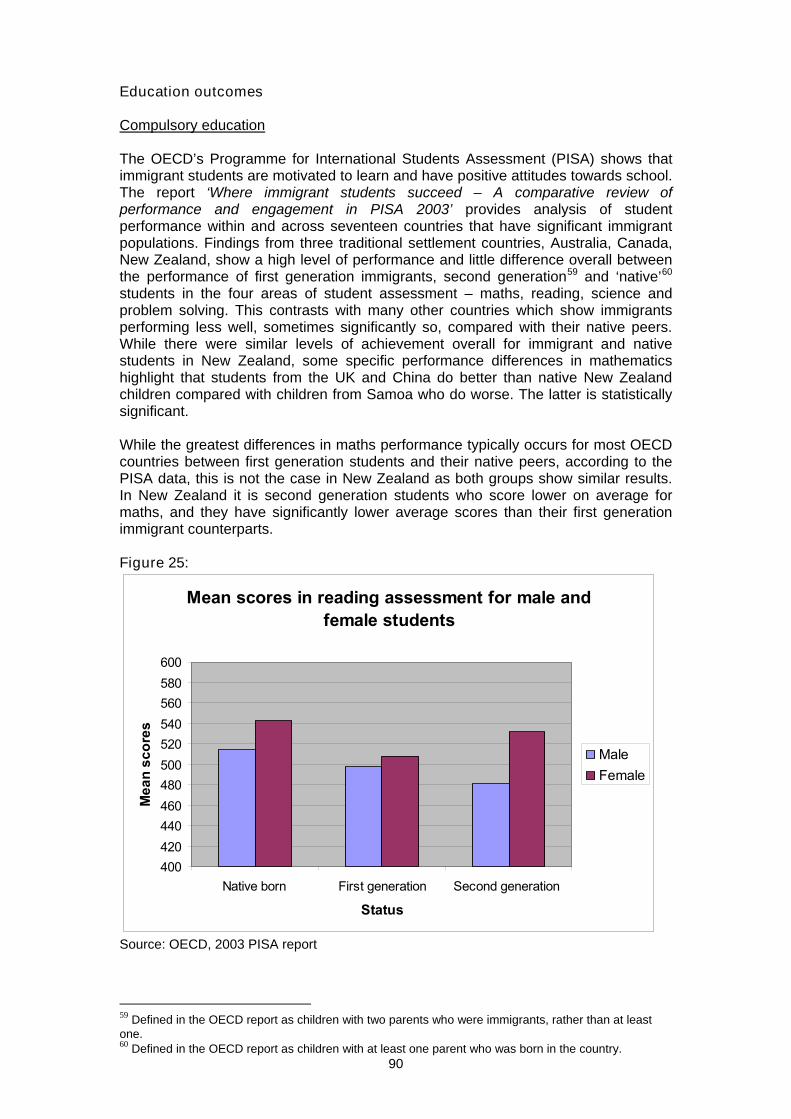
90
Education outcomes Compulsory education The OECD’s Programme for International Students Assessment (PISA) shows that immigrant students are motivated to learn and have positive attitudes towards school. The report ‘Where immigrant students succeed – A comparative review of performance and engagement in PISA 2003’ provides analysis of student performance within and across seventeen countries that have significant immigrant populations. Findings from three traditional settlement countries, Australia, Canada, New Zealand, show a high level of performance and little difference overall between the performance of first generation immigrants, second generation59 and ‘native’60 students in the four areas of student assessment – maths, reading, science and problem solving. This contrasts with many other countries which show immigrants performing less well, sometimes significantly so, compared with their native peers. While there were similar levels of achievement overall for immigrant and native students in New Zealand, some specific performance differences in mathematics highlight that students from the UK and China do better than native New Zealand children compared with children from Samoa who do worse. The latter is statistically significant. While the greatest differences in maths performance typically occurs for most OECD countries between first generation students and their native peers, according to the PISA data, this is not the case in New Zealand as both groups show similar results. In New Zealand it is second generation students who score lower on average for maths, and they have significantly lower average scores than their first generation immigrant counterparts. Figure 25:
Mean scores in reading assessment for male and female students
400420440460480500520540560580600
Native born First generation Second generation
Status
Mea
n sc
ores
MaleFemale
Source: OECD, 2003 PISA report
59 Defined in the OECD report as children with two parents who were immigrants, rather than at least one. 60 Defined in the OECD report as children with at least one parent who was born in the country.
91
In terms of reading assessment across the observed OECD countries there are noticeable trends in performance difference between females and males, with first generation, second generation and native female students all outperforming corresponding male as seen in Figure 25 above. This followed similar findings in 2000. In New Zealand the differences are particularly high for second generation female students, with 50 points separating second generation female and male students. Reading performance for male and female students overall is similar for both first and second generation students. Results for science performance show a significant difference between first generation migrants and second generation students, with second generation students scoring on average 27 points lower than first generation students. In problem-solving, first generation immigrant students have very similar scores to native New Zealand students and outperform second generation students by about 35 points. One of the main contributors to success for first and second generation students is being able to speak the same language at home and school. Gaps in performance between native students and first and second generation students tend to be much larger when the language spoken at home is different from the language school is taught in. Although there are observable differences in student performance in New Zealand based on whether English is spoken at home, the differences are much smaller for first generation immigrants. The differences in New Zealand are also much lower than the OECD average for this group. Second generation students in New Zealand have similar assessment results to the OECD average, showing significant performance differences between those students who speak English at home compared with those who normally speak another language at home. Taking maths as an example, second generation students speaking English at home are 25 points ahead of second generation peers who do not speak English at home most of the time. In addition the scores for second generation immigrants are particularly low in maths. Tertiary and adult education Participation Increasing skills and knowledge provide migrants with the tools to engage in society more widely, and also increase chances of finding employment. In 2006, nearly 500,000 students were enrolled with a tertiary education provider in New Zealand.61 Over three-quarters (77%) were New Zealand citizens, 13% were permanent residents and the remainder were international students. Of the students enrolled in 2006 who were New Zealand citizens, 72% had European ethnicity, 22% Māori ethnicity, 6% Pacific and 6% Asian. The latter were mostly broken down to Chinese (3%), Samoan (3%), Cook Island (1.5%), Indian (1.4%), and Other Asian (2%) ethnic groups.62 Students with New Zealand citizenship who had Indian and Other Asian ethnicities had the largest numerical increase in enrolment numbers from 2005 to 2006, with an increase of 147 and 156 respectively. Enrolled students with New Zealand citizenship will include some first generation and all second generation migrants. Tertiary-enrolled students with permanent residence status have a different ethnic makeup. In 2006, 28% of these students identified as European, 24% as Chinese,
61 Data relates to students enrolled at any time during the year with a tertiary education provider in formal qualifications of greater than 0.03 EFTS. 62 Students who identify with more than one ethnic group have been counted in each group. Consequently, the sum of the students in each group may not add to the total.
92
14% as Other Asian, 15% as Other, 2% as Indian and 9% with a Pacific ethnicity, primarily Samoan, Tongan and Fijian. Some changes in ethnic group identification for students with permanent residence are noticeable during the period 1997–2006. There was a 7% decrease in the percentage of students in the Chinese ethnic group between 1997 and 2006, from 31% to just over 24%. There has been a steady decrease in this percentage each year over this nine-year period, apart from a slight increase between 1997-1998. In contrast, and with some small fluctuations, the percentage of students in the Other Asia category has been increasing each year, growing by nearly 4% between 1997 and 2006. Those identifying as European had a smaller overall decrease over that period of 2%. Since 1997, student enrolments in tertiary education for those with permanent residence have increased every year except for 2006. The largest numerical decreases in student enrolments between 2005 and 2006 occurred for Indian (-814) and Other Asian (-419) students. There are no current data on the number of students from refugee backgrounds enrolled in tertiary education who are New Zealand citizens or permanent residents, although these people will be subsumed within the ethnic data. Of refugees surveyed who had been in New Zealand for around five years, the main type of study being undertaken was at secondary school level. However, refugees were also taking tertiary courses in computer studies, nursing, science, business, hairdressing, interpreting and carpentry (NZIS 2004a). Information on tertiary study shows that close to 132,000 students completed a tertiary course in 2005. Of these 97,000 were New Zealand citizens, 20,000 were permanent residents and nearly 15,000 were international students. The vast majority of students completing a tertiary course had European (69%) or Māori ethnicity (23%). Of the other ethnic group distributions for students completing a tertiary course in 2005, 5% belonged to a Pacific ethnic group, 4% had Chinese ethnicity, 2% were Other Asian and 1% identified as Indian ethnicity. As with enrolments data, there was a broader distribution of ethnic groups among students completing a tertiary course who had permanent residence, with far fewer having European ethnicity (19%). Thirty one percent of students had Chinese ethnicity, 18% Other Asian, 14% Indian and 12% were in the Other ethnic group. Qualification levels New Zealand’s overseas-born population are on average better qualified than the New Zealand-born population. In 2006, overseas-born people represented 26% of prime working-age people (25–54 year-olds) but held 40% of qualifications of Bachelors degrees or higher for that group. In 2006, 25% of the overseas-born population living in New Zealand, who were aged between 25–54 years had a Bachelors degree or higher, compared to 17% of the New Zealand-born population. Recent migrants are even more qualified, with 37% of people who arrived in New Zealand less than 15 years ago having a Bachelors degree or higher. Migrants resident for less than five years in 2006 are slightly more qualified than those who migrated in the five years prior to the 2001 and 1996 Census respectively. Only 15% of overseas-born prime working-age people identify as having no qualifications, compared to 35% of New Zealand-born. Out of the 19 countries analysed throughout this chapter, only people born in Samoa and Tonga are more likely than people born in New Zealand to have no qualifications. In terms of Level 4 Certificates or Level 5 and 6 Diplomas, people born overseas are slightly less likely than New Zealand-born people to have these qualifications. The higher levels of qualifications of overseas-born people can be explained by New Zealand’s immigration policy focus on skills. The difference between the overseas-born and New Zealand-born population also occurs among the younger age-groups. Twenty-two percent of New Zealand-born
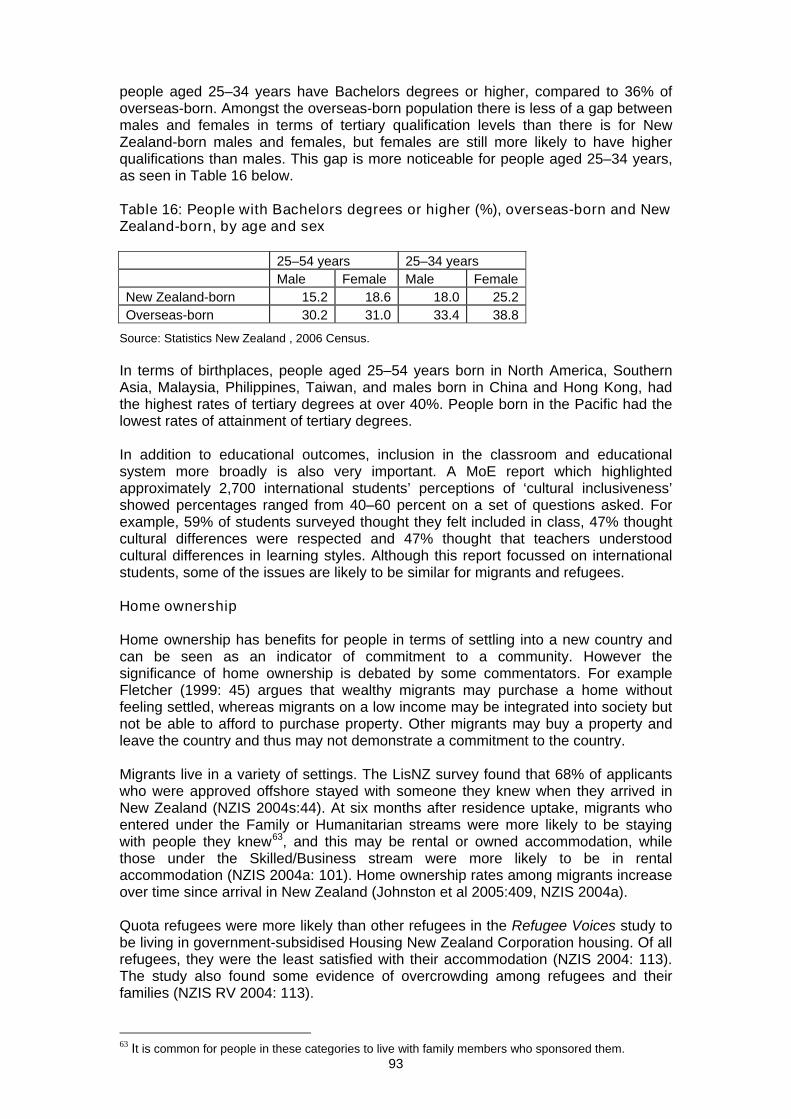
93
people aged 25–34 years have Bachelors degrees or higher, compared to 36% of overseas-born. Amongst the overseas-born population there is less of a gap between males and females in terms of tertiary qualification levels than there is for New Zealand-born males and females, but females are still more likely to have higher qualifications than males. This gap is more noticeable for people aged 25–34 years, as seen in Table 16 below. Table 16: People with Bachelors degrees or higher (%), overseas-born and New Zealand-born, by age and sex 25–54 years 25–34 years Male Female Male Female New Zealand-born 15.2 18.6 18.0 25.2 Overseas-born 30.2 31.0 33.4 38.8
Source: Statistics New Zealand , 2006 Census. In terms of birthplaces, people aged 25–54 years born in North America, Southern Asia, Malaysia, Philippines, Taiwan, and males born in China and Hong Kong, had the highest rates of tertiary degrees at over 40%. People born in the Pacific had the lowest rates of attainment of tertiary degrees. In addition to educational outcomes, inclusion in the classroom and educational system more broadly is also very important. A MoE report which highlighted approximately 2,700 international students’ perceptions of ‘cultural inclusiveness’ showed percentages ranged from 40–60 percent on a set of questions asked. For example, 59% of students surveyed thought they felt included in class, 47% thought cultural differences were respected and 47% thought that teachers understood cultural differences in learning styles. Although this report focussed on international students, some of the issues are likely to be similar for migrants and refugees. Home ownership Home ownership has benefits for people in terms of settling into a new country and can be seen as an indicator of commitment to a community. However the significance of home ownership is debated by some commentators. For example Fletcher (1999: 45) argues that wealthy migrants may purchase a home without feeling settled, whereas migrants on a low income may be integrated into society but not be able to afford to purchase property. Other migrants may buy a property and leave the country and thus may not demonstrate a commitment to the country. Migrants live in a variety of settings. The LisNZ survey found that 68% of applicants who were approved offshore stayed with someone they knew when they arrived in New Zealand (NZIS 2004s:44). At six months after residence uptake, migrants who entered under the Family or Humanitarian streams were more likely to be staying with people they knew63, and this may be rental or owned accommodation, while those under the Skilled/Business stream were more likely to be in rental accommodation (NZIS 2004a: 101). Home ownership rates among migrants increase over time since arrival in New Zealand (Johnston et al 2005:409, NZIS 2004a). Quota refugees were more likely than other refugees in the Refugee Voices study to be living in government-subsidised Housing New Zealand Corporation housing. Of all refugees, they were the least satisfied with their accommodation (NZIS 2004: 113). The study also found some evidence of overcrowding among refugees and their families (NZIS RV 2004: 113).
63 It is common for people in these categories to live with family members who sponsored them.
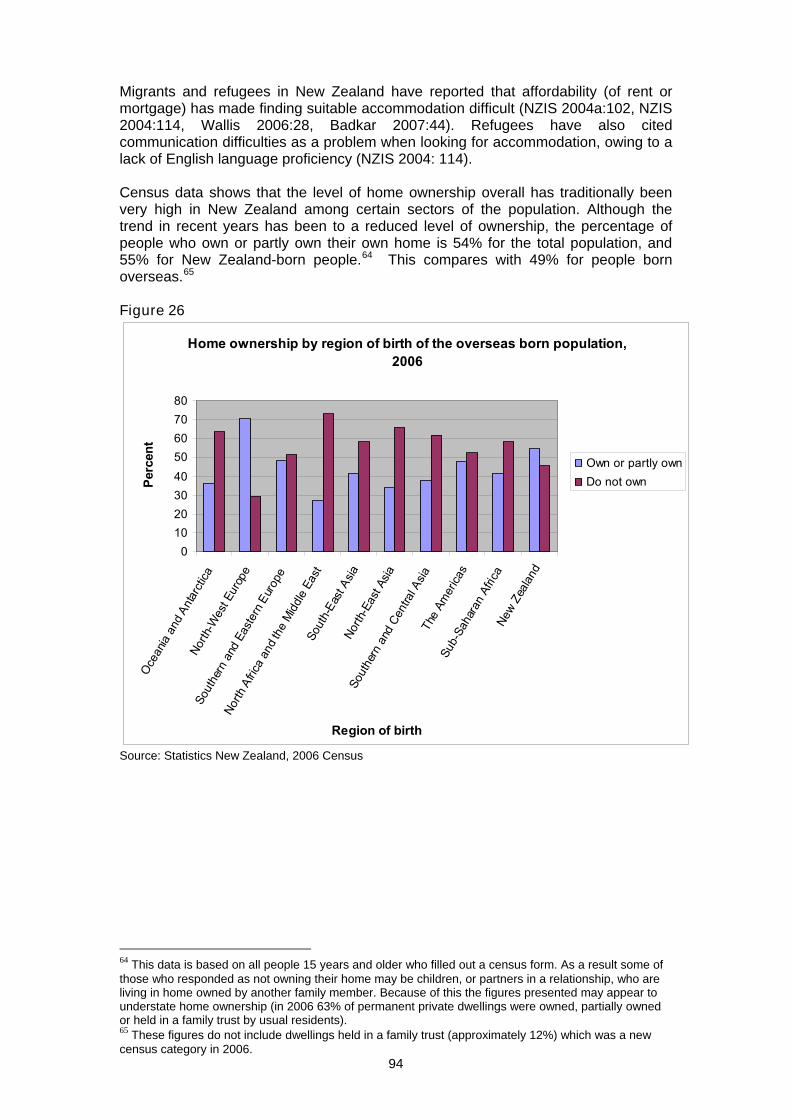
94
Migrants and refugees in New Zealand have reported that affordability (of rent or mortgage) has made finding suitable accommodation difficult (NZIS 2004a:102, NZIS 2004:114, Wallis 2006:28, Badkar 2007:44). Refugees have also cited communication difficulties as a problem when looking for accommodation, owing to a lack of English language proficiency (NZIS 2004: 114). Census data shows that the level of home ownership overall has traditionally been very high in New Zealand among certain sectors of the population. Although the trend in recent years has been to a reduced level of ownership, the percentage of people who own or partly own their own home is 54% for the total population, and 55% for New Zealand-born people.64 This compares with 49% for people born overseas.65 Figure 26
Home ownership by region of birth of the overseas born population, 2006
01020304050607080
Oce
ania
and
Antar
ctica
North
-Wes
t Eur
ope
Sout
hern
and
Eas
tern
Eur
ope
North
Afri
ca a
nd th
e M
iddle
Eas
tSo
uth-
East
Asia
North
-Eas
t Asia
Sout
hern
and
Cen
tral A
siaTh
e Am
erica
sSu
b-Sa
hara
n Af
rica
New
Zeal
and
Region of birth
Perc
ent
Own or partly ownDo not own
Source: Statistics New Zealand, 2006 Census
64 This data is based on all people 15 years and older who filled out a census form. As a result some of those who responded as not owning their home may be children, or partners in a relationship, who are living in home owned by another family member. Because of this the figures presented may appear to understate home ownership (in 2006 63% of permanent private dwellings were owned, partially owned or held in a family trust by usual residents). 65 These figures do not include dwellings held in a family trust (approximately 12%) which was a new census category in 2006.
95
Levels of home ownership by birthplace of the overseas population, as illustrated in Figure 26 is highest among people born in North-West Europe, at 70%. This is considerably higher, in some instances two or nearly three times higher, than for migrants from other regions. Migrants from North-West Europe are the only group of the overseas-born population of whom more people own the home they live in rather than rent it. Home ownership rates vary by length of time in New Zealand, with ownership rates being much lower during the first five years after immigration. No region of the overseas-born population groups has more than 50% ownership rates during their first five years in New Zealand. Among the first five years group, highest rates are for immigrants from North-West Europe which, at 46%, is significantly higher than those of groups from any other region. The home ownership rate for people born in England and Scotland living in New Zealand less than 5 years was just over 50%. This contrasts to North Africa and the Middle East on 13%, and Asia and Oceania on 21%. Although Figure 27 (next page) shows data for selected countries only, it provides a good visual illustration of the scale of difference in ownership rates for some migrants. Rates are particularly low for the overseas populations from the Pacific, refugee source countries (as illustrated here by Iraq), and many parts of Asia. There is an obvious link between affordability and home ownership rates. Migrants and refugees from countries on the lower end of this graph tend to have low incomes while migrants from countries at the higher end of the home ownership continuum have higher incomes.
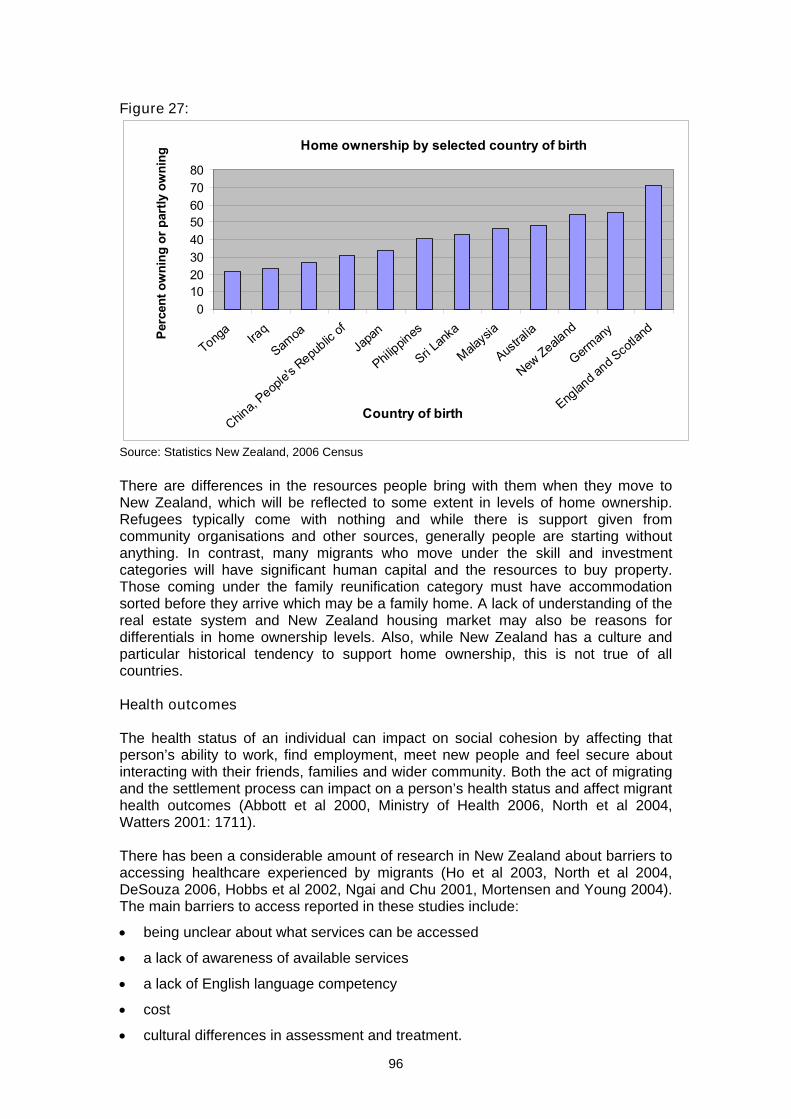
96
Figure 27:
Home ownership by selected country of birth
01020304050607080
Tonga
Iraq
Samoa
China,
People's
Republic
of
Japa
n
Philippin
es
Sri Lan
ka
Malaysi
a
Austra
lia
New Zeala
nd
German
y
Englan
d and S
cotla
nd
Country of birth
Perc
ent o
wni
ng o
r par
tly o
wni
ng
Source: Statistics New Zealand, 2006 Census
There are differences in the resources people bring with them when they move to New Zealand, which will be reflected to some extent in levels of home ownership. Refugees typically come with nothing and while there is support given from community organisations and other sources, generally people are starting without anything. In contrast, many migrants who move under the skill and investment categories will have significant human capital and the resources to buy property. Those coming under the family reunification category must have accommodation sorted before they arrive which may be a family home. A lack of understanding of the real estate system and New Zealand housing market may also be reasons for differentials in home ownership levels. Also, while New Zealand has a culture and particular historical tendency to support home ownership, this is not true of all countries. Health outcomes The health status of an individual can impact on social cohesion by affecting that person’s ability to work, find employment, meet new people and feel secure about interacting with their friends, families and wider community. Both the act of migrating and the settlement process can impact on a person’s health status and affect migrant health outcomes (Abbott et al 2000, Ministry of Health 2006, North et al 2004, Watters 2001: 1711). There has been a considerable amount of research in New Zealand about barriers to accessing healthcare experienced by migrants (Ho et al 2003, North et al 2004, DeSouza 2006, Hobbs et al 2002, Ngai and Chu 2001, Mortensen and Young 2004). The main barriers to access reported in these studies include:
• being unclear about what services can be accessed
• a lack of awareness of available services
• a lack of English language competency
• cost
• cultural differences in assessment and treatment.
97
Certain risk factors result in migrants and refugees being more likely to experience negative health outcomes, including (Abbott 1997:55):
• enduring a major trauma (especially relevant for refugees)
• being isolated from their families and communities
• being unable to speak the language of the host country
• being underemployed or unemployed
• experiencing a reduction in socioeconomic status. These risk factors can affect the health outcomes of migrants differently, depending on factors such as their immigration status, their age, and their prior health status.
Examples of types of migrants and refugees at risk of poorer health outcomes
• Refugees and asylum seekers are at particularly high risk, because they usually come from countries where the prevalence of infectious diseases is high (Ministry of Health 2001). Moreover, the health care systems from refugees’ countries of origin are often ill-equipped to manage these health issues adequately (Ministry of Health 2001, NZIS 2004: 160). Refugees and asylum seekers have been found to have high mental health needs. Hobbs et al (2002: 3) noted that 38% of the 900 asylum seekers who sought health screening reported having symptoms or a history of symptoms that related to a psychological illness.66 As refugees are generally more likely to be exposed to traumatic events prior to resettlement, they tend to report a higher rate of Post Traumatic Stress Disorder (PTSD) and major depression (Abbott 1997: 257) than other migrants.
• A study of Chinese migrants found that people in the 26–35 year-old age group self-reported more health problems than any other age group (Abbott et al 2000: 54). However, this may be due to having more health awareness and so a greater likelihood to report more problems.
Refugee Voices and the LisNZ pilot survey provide some information on migrants’ health self-ratings. Refugee Voices found that most participants felt that their health had either got better or stayed the same since arrival in New Zealand (RV 2004:183). Improved health was associated with feeling safe and secure in New Zealand and experiencing less stress (RV 2004:183). Worse health was reported to be due to factors including concern about family overseas or developing a medical condition such as asthma in New Zealand (RV 2004:183). Participants in the LisNZ study reported having good to excellent health both at six months and 18 months after residence uptake (LisNZ 2004:35).
Asian health outcomes
The Asian Health Chart Book 2006 (Ministry of Health 2006) notes that recent or first-generation Asian migrants have better health status than New Zealand-born or long-term Asian migrants for the majority of the health indicators examined, but that their initial health advantage diminishes over time.
Abbott et al (2000) also found that health outcomes for the Chinese migrants in their study did not improve over time, contrary to what was expected. Migrants who had resided in New Zealand for five or more years had worse health outcomes than migrants who had been in the country for less time.
66 The Auckland screening clinic examined only 27 percent of all the asylum seekers in New Zealand for the period 1999–2000. As a result of the small proportion of asylum-seekers that were screened, it is not possible to generalise these statistics for all asylum-seekers in New Zealand during this time.
98
Many studies relating to the health status of migrants in New Zealand focus on mental health issues.
The mental health status of Tongan migrants to New Zealand
For some groups of people, moving to a new country may bring better mental health than if they had stayed in their country of origin (Stillman et al 2006).
Stillman et al (2006) considered the mental health status of Tongans who moved to New Zealand. They based their findings on data derived from a migrant lottery programme to New Zealand for Tongan migrants. The mental health status of Tongans who were successful in the lottery was compared to those who were unsuccessful. The study found that migration to New Zealand had a positive impact on the mental health status of Tongans who were selected in the lottery. This was particularly true for females and for those who had poorer mental health initially.
Some of the factors associated with having recently migrated can have a negative impact on migrants’ mental levels, including (Pernice and Brook 1996, Ho et al 2003:25–30):
• the disruption of support networks
• lacking close friends
• being unemployed
• experiencing language difficulties
• spending the majority of one’s time with people of the same ethnic group
• experiencing discrimination, in particular. There are also particular types of mental health issues or stress related conditions which affect refugees, such as Post Traumatic Stress Disorder (PTSD). Mental health issues are relevant to social cohesion from the perspective of groups and individuals who may not, due to their particular health condition, have a sense of belonging and be able to participate in society. Also, if societies or communities become less socially cohesive and migrants/refugees experience discrimination and antagonisms by others, this may be a contributing factor for mental health issues. What could be explored further Some research questions which arise from this chapter include: • employment issues for Chinese, Korean, Tongan, Samoan and refugee migrants • qualitative research and further analysis of underemployment of some qualified
recent migrants, in terms of type of qualification, current occupation, previous occupation and English skills
• reasons that motivate North-East Asian migrants to become self-employed or employers over paid employees
• information on second generation migrants will be increasingly relevant as the children on migrants post-1986 move into the workforce and more accurate data is needed rather than proxies
• asset wealth of migrants, which may negate adverse income outcomes. Other topics that might usefully be explored further could be how older migrants fare, criminal justice issues, and Pacific peoples outcomes in tertiary education. A range of health outcomes for migrants and refugees, physical and mental, might also offer
99
useful places for further exploration, along with a consideration of the social determinants of health. The World Health Organisation’s (WHO) Commission on Social Determinants of Health is currently working on producing a report overviewing existing global knowledge of indigenous health. While the focus is on indigenous populations, similar issues are likely to face immigrant communities. John Walden of Massey University has co-authored a paper titled ‘An Overview of the existing Knowledge on the social determinants of Indigenous health and well being in Australia and New Zealand’ to contribute to the WHO work. Additional areas could be inclusion in the health and education domains, inclusion and well-being, and migrants’ and refugees’ perceptions of being included.
100
Chapter Five: Recognition Recognition as a domain of social cohesion means that people value diversity, accept and respect differences, including the different opinions and values of the many cultures that make up New Zealand, and encourage protection from discrimination and harassment.
Overview
• This chapter reviews the dimension of ‘recognition’ and explores four themes in particular: representation in national and local government and other bodies; first language retention; prevalence in migrant media; and attitudes and discrimination.
• There is little information available to show the level of migrant representation in national and local government and other bodies, but using ethnic data instead showed that there is significant under-representation of groups other than New Zealand European/Pakeha and Māori at all levels of government and leadership.
• Maintaining and passing on one’s language to the next generation is important for cultural preservation and well being, but whether first language use can support or impede social cohesion is less clear. People born in New Zealand are far less likely to be able to speak the first language (excluding English) of their ethnic group than those born overseas, and those under 25 years are less likely to speak their ethnic language than their parents.
• Migrant media may support settlement outcomes through the provision of information and the recognition of diverse groups, but may impact on groups connecting and having a greater appreciation of the wider society. The Journalists Training Organisation’s website has a useful section on diversity, including the representation of Pacific and ethnic journalists in newsrooms and journalism schools, and complaints to the media. There is acknowledgement that diversity within mainstream journalism can be improved.
• Some survey data shows that host community responses to migrants are generally positive, and that people think it is a good thing for New Zealand to be a nation made up of diverse groups. However this data also revealed that around 20% of survey participants had negative attitudes to immigrants and immigration in terms of concerns about: risk of culture being diluted, newcomers gaining more power, and perceptions that migrants and refugees take jobs away from established New Zealanders.
Introduction Recognition means receiving a measure of public acknowledgement and affirmation of the difference that immigrants represent and the positive contributions these differences make to the country. Without a respect for difference, discrimination is more likely and social cohesion may be at risk. However, there are limits to the extent that any society can positively recognise and affirm diverse cultural practices. There is also a need for migrants to recognise New Zealand values. For example, an activity that is acceptable, or commonplace, in some locations from which migrants may leave, such as female circumcision, may be abhorrent or unacceptable in the New Zealand culture. Therefore respect for difference has limits. It is also important to recognise that focusing too closely on difference can result in people failing to recognise the things they have in common. The arrival of new migrants can result in both positive forms of recognition (eg valuing new ideas, cultural celebrations and greater connectedness with the world),
101
and negative forms of recognition, when we struggle to appreciate or accommodate diversity. People who are visibly different, for example in terms of skin colour or dress, are susceptible to experiencing negative forms of recognition and discrimination. Those whose cultural practices are considered to be outside the norm, as well as those who speak in a language unfamiliar to others, are also susceptible to negative reactions. Negative reactions to difference have the potential to alienate groups from each other, provoke aggression towards others. They can give rise to problems with social cohesion. Factors relevant to recognition
This chapter reviews:
• Representation in national and local government and other bodies
Representation levels are partially a proxy for the extent to which a group’s contribution to society is recognised and acknowledged. As there is little data on migrant representation, ethnicity data is used instead.
• First language retention and the prevalence of migrant media
Both of these factors provide indicators of social cohesion that are somewhat ambiguous. On one hand, first language use and a high degree of migrant media may indicate that there is an acceptance of migrants being able to retain and express their identity. On the other hand, they may indicate that migrants are interacting with more narrowly-defined groups (in the case of first language use), or that mainstream media is not catering to migrant needs.
• Attitudes and discrimination
These factors illustrate the extent of negative forms of recognition. There is no one measure that indicates the prevalence of discrimination in New Zealand. This section canvasses the information available on New Zealanders’ attitudes towards migrants and the level and type of discrimination experienced by migrants.
Representation in national and local government and other bodies Representation in political and civic life, including being elected to local or national government, a school board of trustees or District Health Board, is key to recognition in a society. There is currently very little information on the level of migrant representation in national and local government and other bodies. Available data shows that there is significant under-representation of ethnic groups other than New Zealand European and Māori at all levels. Representation at a national level Nine MPs in the 2005–2007 Parliament indicate in their Parliamentary biographies that they were born overseas. Six noted that they were born in the UK, some migrating to New Zealand at a young age. Others were born in Asia or the Pacific, such as Ashraf Choudhary (Pakistan) and Pansy Wong (China). In terms of ethnicity, the proportion of Pacific and Asian people in Parliament compares poorly with the proportion of these ethnic groups in the general population (Parliamentary Library 2005:7).
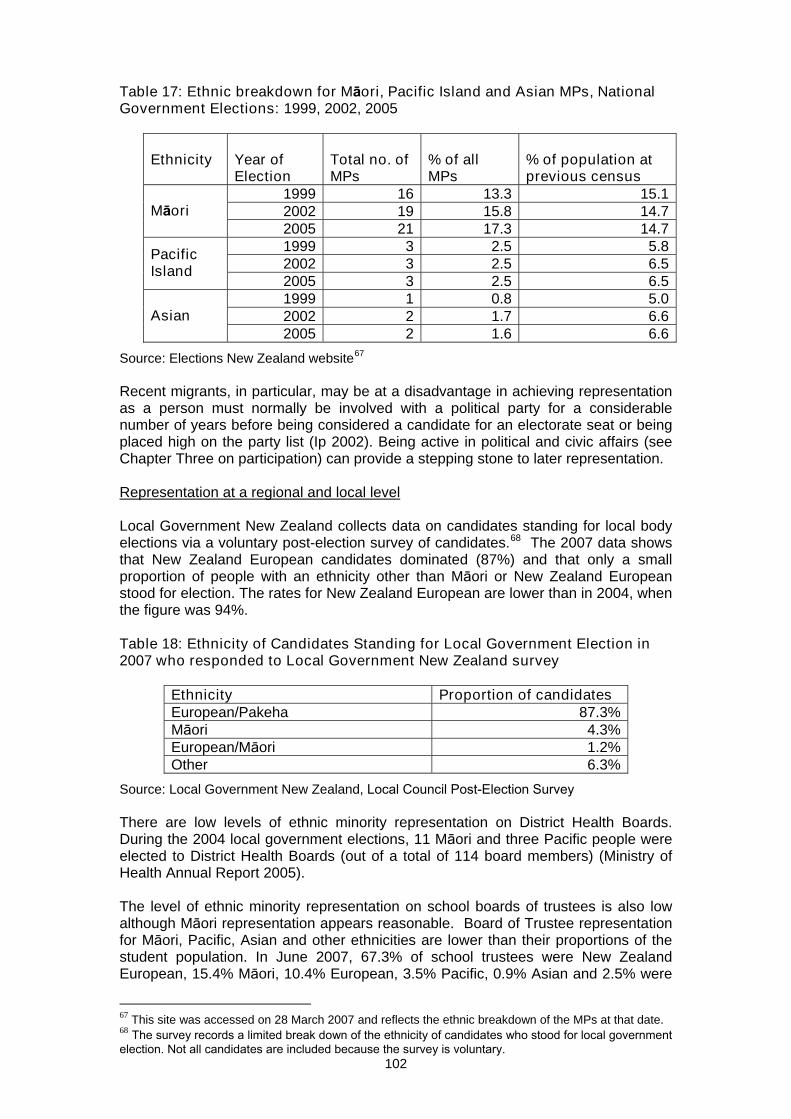
102
Table 17: Ethnic breakdown for Māori, Pacific Island and Asian MPs, National Government Elections: 1999, 2002, 2005
Ethnicity
Year of Election
Total no. of MPs
% of all MPs
% of population at previous census
1999 16 13.3 15.1 2002 19 15.8 14.7
Māori
2005 21 17.3 14.7 1999 3 2.5 5.8 2002 3 2.5 6.5
Pacific Island
2005 3 2.5 6.5 1999 1 0.8 5.0 2002 2 1.7 6.6
Asian
2005 2 1.6 6.6
Source: Elections New Zealand website67 Recent migrants, in particular, may be at a disadvantage in achieving representation as a person must normally be involved with a political party for a considerable number of years before being considered a candidate for an electorate seat or being placed high on the party list (Ip 2002). Being active in political and civic affairs (see Chapter Three on participation) can provide a stepping stone to later representation. Representation at a regional and local level Local Government New Zealand collects data on candidates standing for local body elections via a voluntary post-election survey of candidates.68 The 2007 data shows that New Zealand European candidates dominated (87%) and that only a small proportion of people with an ethnicity other than Māori or New Zealand European stood for election. The rates for New Zealand European are lower than in 2004, when the figure was 94%. Table 18: Ethnicity of Candidates Standing for Local Government Election in 2007 who responded to Local Government New Zealand survey
Ethnicity Proportion of candidates European/Pakeha 87.3% Māori 4.3% European/Māori 1.2% Other 6.3%
Source: Local Government New Zealand, Local Council Post-Election Survey There are low levels of ethnic minority representation on District Health Boards. During the 2004 local government elections, 11 Māori and three Pacific people were elected to District Health Boards (out of a total of 114 board members) (Ministry of Health Annual Report 2005). The level of ethnic minority representation on school boards of trustees is also low although Māori representation appears reasonable. Board of Trustee representation for Māori, Pacific, Asian and other ethnicities are lower than their proportions of the student population. In June 2007, 67.3% of school trustees were New Zealand European, 15.4% Māori, 10.4% European, 3.5% Pacific, 0.9% Asian and 2.5% were
67 This site was accessed on 28 March 2007 and reflects the ethnic breakdown of the MPs at that date. 68 The survey records a limited break down of the ethnicity of candidates who stood for local government election. Not all candidates are included because the survey is voluntary.
103
of other ethnicities (Ministry of Education, 2007). In terms of the success rate for parent Board of Trustee candidates, 80% of New Zealand European candidates were elected compared to around 70% of Māori, European, Pacific and Other ethnicity candidates. Only 52% of Asian candidates (42 out of 85) were elected. In Love Chile’s (2002) study of black African refugees, none of the refugees who participated in the study were on a school board of trustees, parent-teacher association, or governing board of any community organisation except for ones associated with their own country or tribal community (Chile 2002: 360). First language use Maintaining the first language of one’s ethnic group and passing it on to the next generation is perceived as important to cultural and personal wellbeing (Harrison 2000 cited in Statistics New Zealand 2004). Communities in New Zealand support first language use and retention in a number of ways, including starting schools for language maintenance and pre-school community language nests, as well as community broadcasting. It is arguable whether social cohesion is improved by first language use. as relying solely on communicating in the first language of one’s ethnic group can reduce migrants’ interaction with the wider community, thereby potentially limiting social cohesion, while maintaining one’s first language can strengthen one’s sense of self, helping with interactions with others. In the 2006 Census the proportion of people who stated they could hold everyday conversations in the first language of their ethnic groups varied widely between ethnic groups, from 16 percent of Cook Island Maori to 84 percent for Koreans. There was little change between 2001 and 2006 in the proportion of people who could speak their first language, although there were slight increases for Tongan, Indian and Korean ethnic groups and slight decreases for most Pacific and European ethnic groups. Those who were born in New Zealand were much less likely to speak the first language of their ethnic group than those who were born overseas. In all ethnic groups, young people were less likely than older people to be able to hold a conversation about everyday thing in the first language of their ethnic group. In Pacific and Asian ethnic groups, females were slightly more likely than males to speak the first language of their ethnic group, and the reverse was true for most European ethnic groups. In the 2006 Census 2.2% of people who said they could have a conversation about everyday things in at least one language could not speak English. This was similar to 2001 (1.8%). The number of people who can speak two or more languages increased by nearly 20% between the 2001 and 2006 Censuses and by 43% between 1996 and 2006, reflecting the growing diversity of New Zealand society.
Migrant youth and first language use
Watts et al’s (2002) study of migrant youth who came from non-English-speaking backgrounds found that over three-quarters of participants reported that they used mainly their ethnic (first) language at home when speaking with their parents, although less than half spoke their ethnic language with their siblings (which shows the influence of English). In this context English might be a preferred language for private conversations which parents might not understand.
104
Migrant media Migrant media can help in the settlement process by providing contacts and information for migrants and refugees in their own language (Spoonley and Trlin 2004). It can also contribute to cultural and language maintenance. As with first language use, the prevalence and use of migrant media provides a mixed picture of social cohesion. Heavy reliance on migrant media may impede connections being made with what is happening in the wider community. An increase in migrant media could also be a response to migrants not feeling that their interests are adequately represented via mainstream media or that they believe that mainstream media is not providing an accurate picture of migrants or immigration issues. The box below provides information on some ethnic media sources in New Zealand. There are likely to be newer sources in addition to those highlighted. Other important sources for material on the media are the Journalists Training Organisation’s website (www.journalismtraining.co.nz) and the Race Relations Report, an annual report by the Human Rights Commission focusing on the state of race relations in New Zealand. These sources provide useful information on the representation of minority ethnic groups as journalists in newsrooms and journalism schools, what is being done to improve representation and complaints to the media. An historic landmark in reporting diversity occurred in 2006, with the joint statement by media executives and religious leaders after their meeting with the Human Rights Commission following publication of the cartoons of the Prophet Mohammed. The joint statement affirmed the importance of freedom of the media and that such freedom also comes with responsibilities. These include: sensitivity to diverse cultures and beliefs, and recognition of the diversity within cultures and beliefs; responsibility to inform the community about diverse cultures and beliefs; provision of dialogue and channels of communication between the media and faith communities.
Ethnic minority and migrant media in New Zealand
• New Zealand has 1,300 hours of ethnic radio programming each week in over 60 languages on 17 radio stations (Ministry for Culture and Heritage 2004).
• There are more than 30 newspapers and magazines that cater to Asian (both migrant and New Zealand-born) community needs in New Zealand (Spoonley and Trlin 2004).
• There are programmes on TV1 that focus on Asian and Pacific communities: for example, Asia Down Under and Tagata Pasifika (Spoonley and Trlin 2004).
• The internet has more recently become an important media source for migrant communities (Spoonley and Trlin 2004).
• Sky broadcasts TV and radio channels in New Zealand with programme suppliers coming from mainstream media from many different countries, including China, Hong Kong, Taiwan and Japan.
• Access radio stations operating on reserved frequencies provide air time on a non-profit basis to a range of minority groups in the community. In 2003 there were 11 Access radio stations operating in New Zealand. Wellington Access Radio currently broadcasts more than 120 different programmes per month (most on a weekly or fortnightly basis) in over 30 languages. The frequency is also used by Samoan Capital Radio which broadcasts 38 hours of programming each week.
• The Pacific radio network Niu FM was created to contribute to reducing disparities and building the capacity of Pacific communities. It has a wide appeal and has made headway towards being an important vehicle of communication for Pacific peoples (Ministry for Culture and Heritage and Ministry of Pacific Island Affairs 2004). The network is accessible to 85% of the Pacific population from Whangarei to Invercargill (Human Rights Commission 2006).
105
• Radio Tarana was established in 1996 and is New Zealand’s first fulltime commercial ethnic radio station. A 2005 Nielsen media survey reported the station drawing in 5% of Auckland radio listeners, and being the first Asian Radio Broadcaster to be officially rated in Auckland’s mainstream radio market. This station provides more local content than a number of other stations which focus on issues from ‘back home’ (2004 AC Nielsen Radio Ratings).
Attitudes and discrimination An absence of discrimination enables people from all social groups to participate more easily in society and be included in terms of opportunities and activities in social, economic and political areas of their life. People who have negative attitudes or are discriminatory toward other social groups (such as ethnic or religious groups) can create a more challenging environment for people from those groups to express and retain their identities. Discrimination can also impact negatively on people’s health, particularly their mental health (Pernice and Brook 1996). Discriminatory attitudes and behaviours are seriously problematic, and can affect outcomes in key areas like employment, education, housing and health. They can be driven by various factors, and be present at an individual, group or institutional level. People have different reasons for perceiving it is all right to negatively discriminate against other ethnic groups. For one person it may be their personal past experience of a person in that group. For another it might be reports of criminal activity or criminal convictions by a person of a particular ethnicity. Some people may be operating out of a set of internalised stereotypes, or institutions may be perpetuating discriminatory practices embedded over a long period of time, some not realising that this is the case. Sometimes discriminatory and racist attitudes and behaviours of particular groups are extremely entrenched and resistant to change. Discriminatory attitudes and behaviours can lead to tensions, social unrest and have the potential to be divisive and undermine social cohesion. Although migrants are often the recipients of discrimination, it is a complex issue as the reverse can sometimes occur where migrants hold stereotyped and racist attitudes toward indigenous and other populations. As such, these attitudes may be applied to Māori and other groups in New Zealand. Attitudes towards migrants On the whole, New Zealanders hold fairly positive views towards migrants. In Ward and Masgoret’s (2006) survey, 88% of people thought that it was a good thing for society to be made up of people from different races, religions and cultures. Seventy-eight percent thought that it was important to accept a wide variety of cultures in New Zealand and the same proportion though that immigration made an important contribution to New Zealand. One of the important findings from this survey was that the more contact New Zealanders have with immigrants, the more positive their attitudes toward them and the more likely they are to support current immigration policy. Quality of Life Survey 2006 – Culture and Identity
53% of participants in the Quality of Life survey thought that the fact that New Zealand is becoming home for an increasing number of people with different lifestyles and cultures from different countries made their local area a better or a much better place to live.
There was some feeling of threat and competition from migrants, however, as the following examples from the Quality of Life survey show:
106
• 23% of research participants thought that allowing immigrant cultures to thrive means that New Zealand culture is weakened
• 29% of research participants agreed that the more political power immigrants obtain, the more difficult it is for New Zealanders already living here
• 27% agreed with the statement that immigrants take jobs away from locals. While the results from this survey appear to lay a solid foundation for an environment that accepts other cultures and is receptive to migrants, there is evidence that the level of acceptance may be dependent on where migrants come from. For example, a National Business Review Phillip Fox poll in 2004, revealed that 45% of those questioned thought there were too many Asian migrants, 39% thought that there were too many Pacific migrants, and 39% thought that there were too many migrants from the Middle East (O’Hare, 2004). Ward and Masgoret’s (2006) survey shows that New Zealanders had the most favourable perceptions of migrants from Australia, followed by Great Britain and South Africa. Migrants from Asia (India, China) and the Pacific (Samoa) were viewed less favourably, but not significantly different from each other. Migrants from Sub-Saharan Africa (Somalia) were viewed least favourably among these groups. Ward and Masgoret (2006) found that more positive attitudes and endorsement of immigration policies tended to be found in those who were younger, female, non-Māori, had higher levels of education and income, were overseas-born and spoke languages other than English and Māori. Māori had more negative attitudes toward migrants than European/Pakeha and were more likely to exclude or reject migrants and to see them as a source of threat. Māori were also more likely to see immigration numbers as too high. The New Zealand Values Study 2005
In 2005 the New Zealand Values Study asked New Zealanders what kinds of people they would not like to live next door to. Māori and Pacific peoples were specified by 4% of respondents as people they would not like to live next door to. Three percent did not want to live next door to someone from another race and 6% did not want to live next door to migrants or foreign workers. New Zealand does reasonably well on this indicator of tolerance, in terms of comparisons to other OECD countries.69 The proportion of New Zealanders who did not want to live next door to someone from another race is the second lowest in the OECD, while for migrants or foreign workers New Zealand is the seventh lowest in the OECD. However, lower percentages of Australians and Canadians reported that they would not like to live near migrants or foreign workers.
In the same study, 36% of people wanted the government to place strict limits on who can come to New Zealand while 58% thought the government should let people come as long as there are jobs available. New Zealanders put less emphasis on strict limits on immigration and more on the availability of jobs than several central European countries.70 In addition, in the study, 54% of respondents believed that when jobs were scarce, employers should give priority to New Zealanders over migrants.
69 For comparisons to the OECD the 1998 New Zealand Values Study (which is part of the World Values Survey) was used, which had virtually identical results for dislike of people from another race and immigrants or foreign workers as neighbours from the 2005 survey. It was compared against results from the World Values Survey 1999–2001. An earlier survey wave was used for Australia (1995), Switzerland and Norway (both 1996). 70 For instance, in the 1999–2001 World Values Survey Over 50 percent of Danes, Germans and Dutch people wanted strict limits on immigrants rather than immigration targets that were dependent on job availability.
107
Level of discrimination towards migrants Discrimination occurs when a person is treated differently from another person in the same or similar circumstances (Human Rights Commission). There is a difference between prejudicial attitudes and discriminatory behaviour. Prejudicial attitudes will not necessarily lead to discriminatory behaviour (Reitz and Banerjee 2007) but the two tend to co-exist (Butcher et al 2006:7). Discrimination occurs when negative attitudes or prejudice turns into action. Better data collection is required to measure the level of discrimination in New Zealand (Human Rights Commission 2004:47). However, there is evidence that discrimination is under-reported by migrants in New Zealand. Butcher et al (2006:4) found that, “laying a complaint requires a degree of confidence and understanding of the host society which is not the case for all immigrants and refugees, especially those from a non-English speaking background”. Chile (2002: 362) noted that many refugees may not know about the avenues available to report instances of discrimination, or have the language skills to do so. Chile (2002: 362) also notes that refugees may believe that reporting discrimination will impact negatively on their residence status or ability to sponsor family to New Zealand. The DoL also thought that discrimination may have been under-reported by refugees in Refugee Voices (NZIS RV:310). In terms of perceived discrimination (Human Rights Commission 2006):
• 72% of New Zealanders considered that Asians were subject to a great deal or some discrimination (down from 78% in the 2004 survey)
• 70% felt immigrants were subject to a great deal or some discrimination (similar to 72% in 2004)
• 63% believed refugees were subject to a great deal or some discrimination (down from 70% in 2004) (Human Rights Commission 2004 and 2006).
The LisNZ pilot survey (NZIS 2004a:111) found that around one in five migrants reported experiencing discrimination while in New Zealand.
There is evidence that visible ethnic minorities (eg black African, Asian) may bear the brunt of discriminatory action in New Zealand. The LisNZ pilot survey found that migrants from Asia were more likely to report experiencing discrimination than those from other regions, although Pacific migrants were the least likely to report discrimination (NZIS:111). Butcher et al’s (2006) research found that migrants and refugees who were from visible ethnic minority groups faced formidable barriers gaining employment in New Zealand. Chile’s research on black African refugees (2002) also found that access to employment was hindered because black African migrants, “look different, dress differently and speak differently”.
Evidence of prejudice against Muslims, particularly Muslim women (partly due to their distinctive dress), has also been found in New Zealand studies (Bihi 1999:115; Chile 2002:362). Butcher et al (2006:29) found that discrimination against Muslims and migrants from the Middle East increased after the 2001 terrorist attacks in the US but also that this was not unique to New Zealand. Youth who were interviewed for the International Comparative Study of Ethno-cultural Youth (ICSEY) project reported discrimination at low to moderate levels, and this varied across ethnic groups. Those from Korea reported significantly more discrimination than all other groups, with the rank ordering from high to low being Korean, Chinese, Samoan, Indian, white South African and British (presumably white
108
British). However, statistical analyses indicated that there were no significant differences across each of the comparisons. Types of discrimination and harassment reported by migrants Discrimination and harassment take different forms, some of which are subtle, but can still contribute to a sense of feeling excluded from society (Butcher et al 2006:28). Butcher et al’s (2006) study of the discrimination experienced by migrants in New Zealand found that most participants experienced more subtle kinds of discrimination. Examples of subtle discrimination towards migrants include (Butcher et al 2006, McGrath et al 2005):
• the atmosphere in a conversation or room changing when a migrant entered
• assumptions held by people about migrants that influenced their behaviour toward them
• a perception of being deliberately misunderstood in cafes and supermarkets, “in order to humiliate”.
Other forms of discrimination or harassment are more overt such as people making racist remarks, migrants having stones or eggs thrown at them, or being laughed at because of poor pronunciation (McGrath et al 2005, Chang et al 2006). Several studies have found that migrants report experiencing discrimination most frequently in relation to employment (Butcher et al 2006, Dunstan et al 2004, Chang et al 2006). Ward and Masgoret’s 2007 paper demonstrates that recruitment agencies are more likely to invite a New Zealand-born candidate (with a New Zealand European name) for further contact or interview than a China-born candidate with equivalent educational qualifications and work experience. An important aspect of this study was that English language proficiency (as presented in written communication) was the same for both applicants, undermining the argument that language (as opposed to discrimination) underpins the reluctance to hire new migrants. Discrimination in relation to employment has been discussed in Chapter Four on inclusion. In relation to accessing goods and services, Butcher et al’s (2006) study found that participants reported discrimination in relation to education (eg schools being cross-culturally unaware) and housing (eg a perception that landlords are reluctant to let their property to some migrant groups). Migrants have also reported discrimination while shopping (NZIS 2004:111, Butcher et al 2006).
Migrants sometimes experience discrimination by the general public and in their neighbourhood. In the case of migrants, for example, some have reported being told by others that they are not wanted in New Zealand and to ‘go home’ or to ‘go back where you came from’ (Chang et al 2006, NZIS 2004). However, the participants in Butcher et al’s (2006) study reported that, apart from a few cases of verbal harassment, they had largely positive experiences in their neighbourhood.71 Where neighbourhood interactions were found to be difficult, reasons given included that New Zealanders tended to be reserved or lacked of understanding of migrant backgrounds. The Race Relations Report (an annual report on the state of race relations in New Zealand) contains a chapter on discrimination, including instances of hate crime and an analysis of complaints made to the Commission.
71 This finding is consistent with Quality of Life 2006 survey data, outlined in chapter three on participation, which found that a very high proportion of the overseas-born (as well as the New Zealand-born) had some positive contact with people in their neighbourhood over the last 12 months.
109
What could be explored further It would be useful to have more robust information on the level of discrimination that occurs in different life situations (eg school, neighbourhood, workplace, shopping) to determine where the most significant issues lie. Other topics for future research could include inter-group perceptions and relations, including mutual trust, and generational changes recognition. Another interesting research area would be to explore why certain groups, such as Pacific peoples are less likely to report discrimination/harassment. As research is showing that the more contact New Zealanders have with migrants the more positive attitudes they have toward migrants, additional research to investigate ways in which contact may be increased might be a fruitful study.
110
Chapter Six: Legitimacy
Legitimacy as a domain of social cohesion is about protection of civil and political rights and building and maintaining confidence in public and other institutions, including those that act to protect rights and interests and mediate conflicts.
Overview
• This chapter looks at the theme of ‘legitimacy’ and two aspects in particular: confidence in state institutions and representation of migrants in mass media.
• Little data is available to show the level of trust and confidence in state institutions, but a number of bodies have been established in both the public and private sphere to investigate complaints, and New Zealand has legislation to protect human rights, such as the Bill of Rights and Human Rights Act. One relevant area of feedback the Law Commission received in its research on the courts system was that people thought the Eurocentric nature of the (courts) system caused particular difficulties for certain groups, including minority cultures.
• Although there is little direct information available on migrants and refugees opinion on state institutions, there will be a link between responsiveness to needs and people feeling confident. Initiatives in recent years have shown government response at a lot of levels, such as Māori and Pacific cultural responsiveness programmes and the more recent Ethnic Perspectives in Policy framework, which was designed to ensure minority perspectives are considered when developing policy.
• Some research is showing that migrants and refugees are reasonably satisfied with key institutions such as health, education, and police, although there are some areas of concern such as barriers to accessing health services and difficulties in obtaining employment following completion of school.
• The media is a key player in influencing perceptions about a range of groups and shaping the nature of public understanding and engagement in this area. Research into representations of migrants and refugees in the print media between 1997 and 2003 showed some particular types of reporting during these years. These ranged from strains on infrastructure and services, economic costs of migrants leaving New Zealand, and distinguishing fraudulent from genuine refugees. This was balanced, particularly from 2000, with editors and journalists reporting the benefits of immigration and challenges faced by newcomers in settling into a new country.
Introduction Social cohesion depends in part on maintaining the legitimacy of those institutions that act to resolve conflict (eg the courts system) as well as on the effective functioning of other public institutions (eg social services and the tax system). However it is not just public institutions that rely on legitimacy. Other areas of social and economic life that depend on legitimacy to function effectively include:
• community and voluntary sector organisations
• the labour market
• the media. In order to maintain legitimacy in institutions, people must perceive them to act fairly, resolve disputes in a just manner and allocate resources fairly across different
111
groups. High levels of confidence and trust in a particular institution can also indicate a high level of legitimacy. Migrants’ perceptions of New Zealand institutions and practices are being formed even before they arrive in the country. Migrants may expect local institutions to operate similarly to those in their home countries. Alternatively, their experiences of New Zealand’s immigration system, for example, may provide the basis for their expectations of wider New Zealand society (e.g. an efficient immigration process may lead a new migrant to conclude that official tasks are done quickly in New Zealand). Where migrants’ confidence and trust in New Zealand institutions is low, it will affect their willingness to participate fully in New Zealand society. Factors relevant to legitimacy This chapter reviews:
• Confidence in state institutions
There is little direct evidence that exists to gauge migrants’ levels of confidence and trust in state institutions. However, the responsiveness of institutions and migrants’ reported satisfaction with institutions will be relevant and are explored in this section.
• Representation of migrants in the mass media The media plays an important role in shaping people’s perceptions of migrants. This section explores how the mainstream media portrays migrants.
Confidence in state institutions If people have trust in institutions, particularly in those that work to resolve conflict, they may be more likely to use these institutions to resolve their differences, or work through their problems or grievances (which could result in any tension being diffused) rather than resort to other means of doing so. Low levels of trust and confidence in institutions can lead to the withdrawal of support for institutions or practices and, at the extreme end, may affect the willingness of the public, for example, to pay taxes or comply with the law. It may also mean that people decide to resolve conflict or grievances by taking matters into their own hands which, in turn, could exacerbate tension. Confidence in institutions that protect civil and political rights A number of public bodies have been established to investigate complaints and facilitate mediation in New Zealand, in both the public and private sectors. Examples include courts and tribunals, the Commerce Commission, the Office of the Ombudsman, the Human Rights Commission and the Police. Bodies such as school Boards of Trustees are also involved at times in resolving conflict. It is important that people believe that these institutions are fair, impartial and accessible. In New Zealand, the Human Rights Act 1993 and the New Zealand Bill of Rights Act 199072 both protect the right to be free from discrimination. Mechanisms to enforce this right include the courts and Human Rights Commission mediation processes. Complaints against discrimination can also be made under legislation relating to mental health, broadcasting and employment relations. Little information is available on public confidence levels in these institutions. The Law Commission has, however, investigated what it considered was required for the
72 The Bill of Rights Act 1990 reflects the content of the International Covenant on Civil and Political Rights promulgated by the United Nations.
112
court system to win and retain the confidence of New Zealanders. Of particular relevance for migrants was that the Law Commission saw cultural responsiveness as a key aspect of accessibility to the court system. Feedback the Commission received indicated that people thought the Eurocentric culture of the courts caused particular difficulties for some groups, including those from minority cultures (Law Commission 2004: 6). Confidence in other key state institutions Migrants’ and refugees attitudes and level of trust and confidence in government are often significantly influenced by their experience of government in their home country, which varies greatly (Reilly and Cullen 2006:45). Previous negative experiences of government can have long-lasting effects and result in a general distrust of government departments and officials (Watts 1999:20). On the other hand, people may have a greater degree of confidence in the institutions of their new country if they see demonstrable positive differences compared with those in their country of origin. While there is no direct evidence on migrants’ and refugees’ level of confidence in state institutions, an important factor in gaining the confidence of migrants is the extent to which government is responsive to their needs. Government agencies in New Zealand have recognised the need for services to be responsive towards the communities they serve. At first, the focus on cultural responsiveness in government agencies was in relation to Māori and later Pacific peoples. More recently there has also been an emphasis on the responsiveness of government towards minority cultures. In 2002, the Office of Ethnic Affairs developed Ethnic Perspectives in Policy for policy analysts to use as a tool to help ensure that ethnic perspectives are taken into account as policy advice and services are developed. In relation to migrants, Watts’ (1999) study examined public sector service provision for migrants from non-English-speaking backgrounds (NESB). The study found that 35 of the 157 participating organisations (22%) had explicit policies concerning special service provision for NESB clients.
Influencing policy development
Research carried out to inform the Auckland Regional Settlement Strategy found that migrants and refugees reported the following challenges to becoming meaningfully engaged in policy development:
• a lack of co-ordination between agencies
• consultation processes that lack credibility and are not representative
• poor use of existing knowledge, skill and expertise within migrant and refugee communities.
113
EEO Progress in the Public Service
The State Services Commission publication EEO Progress in the Public Service 2000-2004: The Data Stories shows:
• The number of Pacific public servants rose from 6.3% of the Public Service in 2000 to 7.1% in 2004. However, the number of Pacific senior managers was low, and decreased between 2000 and 2004.
• The number of Asian public servants almost doubled between 2000 and 2004, and the proportion rose from 3.3% to 4.7% of the Public Service. The proportion of Asian senior managers remained low, and decreased.
• The proportion of the ‘Other’ ethnic groups (including Arabs, Iranians, Somalis and Latin Americans) in the Public Service was 1.8% in 2004. The proportion of the ‘Other’ ethnic groups in senior management was generally higher than that of the Māori, Pacific and Asian groups.
Some studies have found that migrants report being generally satisfied with particular government services in New Zealand. Over fifty percent of those who participated in the Department of Labour’s 2005 survey of skilled migrants survey rated INZ’s service as good or very good (Badkar 2007:41). Many participants in Refugee Voices when asked what they liked most about New Zealand said, among other things, that they liked having access to government services, or that government services in New Zealand were good (NZIS 2004:334). Many refugees also reported being satisfied with the healthcare they received in New Zealand. Migrants have also reported being satisfied with New Zealand’s education system. Eighty-five percent of the participants in the Department of Labour’s 2005 survey of skilled migrants were very satisfied or satisfied with their children’s schooling (Badkar 2007:47). Most parents who participated in the LisNZ pilot survey were also very satisfied with their child’s school (NZIS 2004:100). While most migrants and refugees were positive about their children’s schooling, some refugees expressed the following concerns in research carried out to inform the Auckland Regional Settlement Strategy, (NZIS 2007 :3):
• refugee youth leaving school without qualifications and insufficiently prepared for the workforce
• the ability of parents of refugee children with poor English skills to become involved in their children’s education.
Perceptions of the New Zealand Police
In 2006 the New Zealand Police contracted UMR Research to explore “what the New Zealand public want and expect from their police in the 21st century” (UMR Research 2007). UMR Research found that people generally perceive the Police as a well-regarded institution which attracts a considerable amount of public goodwill. However, some groups, including new migrants (as well as younger Pacific people, Māori and those who live in Auckland), rated the Police below average in terms of their performance. The report found that perceptions of higher victimisation from crime and lower levels of Police responsiveness were commonly cited factors in these ratings. The report concluded that their results lent tentative support to overseas findings that ethnic minorities (and young people) tend to have below-average levels of trust and confidence in police agencies.
North et al (2004) in their study about health services in New Zealand found that skilled migrants were positive overall about their access to and the standard of health services and the conduct of health professionals. However, several other studies have found that migrants do experience barriers in accessing health services. These barriers were discussed in Chapter Four on inclusion. Migrants may also experience
114
similar barriers when accessing other government services, such as a lack of English language proficiency, being unclear of entitlements, a lack of awareness of available services, as well as a lack of cultural responsiveness, coordination and collaboration between agencies. Representation of migrants in the mass media The media has the potential to serve as a bridge between cultures (United Nations 2007:30). Good quality information in the public domain is said to be an essential pre-condition to quality democratic debate (Spoonley and Trlin 2004:1). The media plays a key role in terms of (Spoonley and Trlin 2004:1):
• determining the nature of public discussion and public and personal understanding
• creating and distributing images about New Zealand communities
• influencing perceptions of people who do not come into contact with a range of diverse peoples within their own communities.
Spoonley and Trlin (2004) provide a comprehensive account of how the print media has portrayed migrants and immigration issues between 1993 and 2003. Spoonley and Trlin’s content analysis begins with coverage of the “Asian invasion” articles which first appeared in Auckland in 1993. The articles portrayed negative stereotypes of Asian migrants and were a catalyst for the politicisation of immigration (although such politicisation was not new). In the mid-1990s a key theme in the media was the pressure placed on infrastructure and services by Asian immigration. By the late 1990s there was more concern with the economic costs of Asian migrants who were leaving New Zealand. According to the study, more balanced reporting about Asian migrants occurred from 2000. Editors, columnists and feature writers often provided a counterpoint to any negative news reporting by, for example, criticising New Zealanders’ negative reactions to immigration issues, outlining some of the difficulties of settlement, and providing context to understanding immigration issues. Spoonley and Trlin’s study found that refugees featured in print media during the period of analysis mainly after 1997. Coverage included discussions on fraudulent as opposed to genuine refugees and asylum seekers (these terms were often confused). There was also evidence of different groups of refugees being treated differently in the media. For example, refugees from the former Yugoslavia received more sympathetic press than those from Somalia. Other key themes in the media during the period of analysis included the difficulties of migrants being able to obtain employment and the prevalence of crime committed by migrants, particularly Asian migrants. The continued immigration to New Zealand of Europeans (eg British and North Americans) was not reflected as an issue by the media. South Africans, also a significant migrant group since the mid-1990s, received little media coverage. Spoonley and Trlin concluded (2004:61):
While the mid-1990s provided some undesirable examples of stereotypical reporting, the media performance overall has improved to the extent that it has provided more nuanced and detailed coverage of immigrants and immigration. However…There is still a tendency to use crude all-inclusive labels such as ‘Asian’ for particular individuals and groups when there are significant cultural, linguistic and economic differences between groups. There is a tendency to focus on negative elements – criminal behaviour, for example – that contribute to a problematising of immigration, even though this is counterbalanced by more positive reporting. And there is too often a focus on immigrants from Asia, rather than the full range of immigrants who arrive in New Zealand.
115
Recent research in New Zealand shows that a primary predictor of New Zealanders’ more negative attitudes toward immigrants and immigration relates to feelings of threat and competition, and that these can be exacerbated when migrants are perceived to be sharing the same resources (eg jobs or community resources). A study using fictitious media messages demonstrated more negative attitudes toward immigrants when they were presented in the articles as doing well and succeeding in the job market. These attitudes were largely associated with feelings of threat and competition over resources (i.e. that immigrants succeed at the expense of New Zealanders already living here) (Masgoret, Esses and Ward 2004). What could be explored further There is little information on migrants’ confidence in institutions that protect civil and political rights in New Zealand or their confidence in government in general. It would be useful to have further information in this area, including whether migrants use conflict resolution institutions to resolve conflict or grievances. Migrants have reported being generally satisfied with particular government services in New Zealand, although there continue to be barriers to access, so exploration of these barriers would be useful research topics. The effects of media messages on perceptions of migrants could be another fruitful avenue for further research.
116
Summary and Conclusion The state of social cohesion in New Zealand is an ongoing story as our population mix changes, and people’s attitudes and values also change. The sense people have of themselves and others, groups they belong to and communities they live in can be fluid and shift, adding to the evolving story. Rapid social changes in terms of diversity over recent years and the predictions of this continuing, has a large bearing on issues of social cohesion, as distinct and diverse groups aim to belong, be present and participate in society. These changes are also connected to that of understanding more about our national identity – that which tells us more about ‘who we are’ and about the uniqueness of New Zealand and New Zealanders. Whether social cohesiveness is built, maintained, damaged or destroyed depends to a large extent on people’s interactions with each other and their attitudes towards each other, especially those they consider to be different from themselves. It is as much about host community responses to diverse newcomers as it is to newcomers adapting into the society they are moving into, and acknowledging that this engagement will shape society in new and different ways. Cohesive societies are also ones where there is effort to promote the same opportunities for all and reduce social exclusion, both for migrant and host communities. The ongoing fostering of social and economic opportunities for everyone to participate in society will go a long way to supporting the well being of groups and reduce the likelihood of disruptions to social cohesion. This report has focused on outcomes for migrants and refugees in New Zealand and the relationship between those outcomes and social cohesion, as well as looking at the interface between the migrant and New Zealand-born community using available data sources. As discussed in the Introduction chapter, this report has built on the draft social cohesion and immigration indicator framework developed by Peace et al (2005). The data included in the report shows that migrant outcomes differ depending on many factors such as immigration status, length of time since arrival in New Zealand, country of origin and English language proficiency. The report described the way migrant outcomes impact on the following dimensions of social cohesion: belonging (eg satisfaction with life in New Zealand); participation (eg making friends); inclusion (eg discrimination in employment, accessing quality employment, income level, educational attainment, access to health care); recognition (eg representation in national and local government) and legitimacy (eg access to government services). The report took a particular focus on employment as having a strong impact on three of the dimensions: belonging, participation and inclusion. The sections below summarise key findings under each dimension of social cohesion and point to gaps in information. There is much more information available on certain topics, such as employment, so each chapter has concluded by highlighting areas for further research. Belonging The section on belonging explored the areas of trust, attachment to identities, satisfaction with life in New Zealand and migrants’ intention to remain in New Zealand. High levels of trust between migrant and host communities can provide the basis for positive inter-group relationships, enhancing social cohesion. There is little evidence
117
available on the level of trust between these groups in New Zealand. However, the evidence that is available suggests that there is a good platform for building positive relationships between these communities. This is because a low proportion of people report not trusting those from other countries. Many migrants report that they want to maintain both their original culture and ethnic identity and also feel a sense of belonging to New Zealand. This is positive for migrants’ wellbeing and is also the approach that most New Zealanders would like migrants to adopt. At the same time, migrants have reported that negative attitudes of New Zealanders to their presence can derail their sense of being a New Zealander and consequently their sense of belonging in New Zealand. Migrants generally report being satisfied with their life in New Zealand, an indirect indicator of a sense of belonging. There was also positive feedback from migrants and refugees about encouraging family members to move to New Zealand as well as their personal intention to stay in New Zealand – an indirect measure of having a sense of belonging. Further research in this area could consider the factors that contribute to migrants having a sense of belonging in New Zealand, and the factors that hinder their developing a sense of belonging and feeling of being a New Zealander. Other areas of research could include an assessment of the acceptance of diverse cultural identities in New Zealand and exploring the issues of multiple identities in migrants. Participation Social connectedness, and participation in social and civic affairs were the key themes discussed in this section. Although some migrants report difficulty making friends in New Zealand, particularly with those outside their own ethnic group, barriers such as a lack of English language proficiency should become less significant as migrants become more established. On a positive note, New Zealanders have reported being comfortable interacting with migrants (although they also reported having little contact with migrants). There is little information available on migrants’ civic and political engagement and it would be valuable to have further information in this area. However, the fact that New Zealand allows permanent residents to vote (rather than requiring citizenship for voting rights which is normal in the majority of OECD countries) may encourage participation. Further research in this area could examine which migrant groups are having difficulty connecting with the wider society, including issues of age, gender and regional variation. It would also be useful to know more about why New Zealanders report having little contact with migrants. Ways in which to increase contact across ethnic groups; voting behaviours; variations in civic and social participation across ethnic and migrant groups could also be topics for further research. Inclusion There was much more data available applicable to the theme of ‘inclusion’ than any of the other themes. The areas discussed in this chapter were: employment, unemployment, occupation, income levels, compulsory, tertiary and adult education, home ownership and health. Despite many employers reporting high levels of satisfaction with migrant employees, many migrants face a number of (well-documented) barriers to employment in New
118
Zealand. Some of these are more understandable than others. For example, certain occupations may require a level of English language proficiency that is beyond some migrants’ capability, particularly when they first arrive in the country. However, in several studies migrants have reported being discriminated against when searching for paid employment and in the workplace itself, although the extent of employment discrimination is difficult to gauge. Discrimination in employment can damage migrants’ prospects of feeling included in society, as employment is an important means for migrants to establish themselves in a new country. Many factors influence migrants’ labour market outcomes. Census 2006 data shows that employment outcomes for more recent cohorts are better than for previous cohorts (including for those from countries with a non-English-speaking background). Census data also indicates that the labour market outcomes of second generation migrants are fairly positive (although data is limited in this area). Migrants are generally more qualified than their New Zealand-born counterparts, although this is not always turned into an advantage in the labour market. The income levels for North-East Asian migrants are not very high despite their high qualification levels. Migrants from English-speaking background countries tend to have higher incomes than those from non-English-speaking background countries, particularly within the first five years of residence. Migrant students tend to do well at school in comparison to many of their New Zealand-born counterparts, although outcomes on average are less positive for students who do not speak English at home. This positive finding bodes well for young migrants to make positive contributions to society in future. Home ownership rates for migrants from North-West Europe are high. People born in the Pacific, Iraq and many parts of Asia have lower home ownership rates. It is difficult to generalise on the health outcomes of migrants compared with the New Zealand-born. However, refugees’ pre-arrival experiences often mean that they are at a particular risk of poor health outcomes, including poor mental health outcomes. Factors often experienced during the settlement process (eg disruption of support networks and not having close friends, being unemployed, experiencing language difficulties, experiencing discrimination) can affect the mental health of migrants. Conversely, the migration experience may contribute to positive health outcomes for some, through resultant improvements to their specific life situation. Further research in this area could include inclusion in education and health domains; inclusion and well-being and migrants’ perceptions or feelings of inclusion. Recognition The key themes explored under the dimension of ‘recognition’ were: representation in national and local government and other bodies; first language retention; prevalence in migrant media; and attitudes and discrimination. There is little information available on the level of migrant representation in national and local government and other bodies. However, significant under-representation of ethnic groups other than European/Pakeha and Māori at all levels exists. Whether social cohesion is improved by use of the first language of one’s ethnic group is hard to determine as relying primarily on communicating in one’s first language will reduce migrants’ interaction with the wider community, thereby potentially limiting social cohesion.
119
There has been a growth in migrant media over the years, providing information for and on behalf of ethnic groups. Whether migrant media contributes to social cohesion is also difficult to determine for similar reasons to use of first language. Research indicates that New Zealanders hold fairly positive views of migrants and diversity, forming a good platform for a receptive New Zealand environment. At the same time, there is evidence that New Zealanders have more favourable attitudes towards certain groups than others. Groups who are more visibly different tend to experience more negative attitudes. Migrants have reported experiencing discrimination in New Zealand, however, the level of discrimination, the pervasiveness of it, and the impacts it has on individual and group outcomes are difficult to determine. It would be useful to have further information on the level of discrimination towards migrants in New Zealand, whether migrants experience less discrimination as they become more established, and to what extent their children continue to experience discrimination. Employment is often reported by migrants as being a major area of discrimination. It would be useful to have more robust information on the level of discrimination that occurs in different life situations (eg school, neighbourhood, workplace, shopping) to determine where the most significant issues lie. Other topics for future research could include intergroup perceptions and relations, including mutual trust. Legitimacy These two areas were the focus of the section on legitimacy: confidence in state institutions and representation of migrants in mass media. There is little information on migrants’ confidence in institutions that protect civil and political rights in New Zealand or their confidence in government in general. It would be useful to have further information in this area, including whether migrants use conflict resolution institutions to resolve conflict or grievances. Migrants have reported being generally satisfied with particular government services in New Zealand, although there continue to be barriers to access. The media plays an important role in how migrants are seen by the wider community and how public (and private) debates about migrants are shaped. Some studies have found that over recent years print media has tended to focus on negative stories about migrants and immigration, but this has been balanced to some degree by positive reporting. More recently, there have been increasing numbers of positive news stories and television programmes that focus on fostering a better understanding of different cultures, race relations and immigration. As noted above, the information gathered in this report indicates that English language proficiency, employment and discrimination are key factors that influence migrant outcomes in New Zealand and can impact on social cohesion. While there is considerably more research to be done in this area, the findings set out in this report provide a valuable contribution to understanding the factors that influence social cohesion in New Zealand.
120
Concluding comments Processes of settlement and outcomes for migrants and refugees can be thought about in terms of social and economic well-being, social interactions, community relations, forging links and positive relations between groups, as well as considering disparities, social exclusion and inequalities. All these issues have a significant bearing on the ability of society to be socially cohesive, and apply to both host and migrant groups. The promotion and maintenance of social cohesion is dependent on the responses of host communities to a range of diverse peoples as well as newcomers fitting into the country. It is a two-way process. Social cohesion is a complex multi-layered phenomenon and there are many factors to consider in determining whether a society or community is cohesive. The position of migrants and refugees is but one component. As stated in the introduction, the intention in this report was to present indicators of outcomes of migrants and refugees in New Zealand along five particular dimensions of social cohesion. The focus was bringing together data and information which can be linked to social cohesion, and to suggest further avenues for exploration and research.
121
References Abbott M. (1997). Refugees and Migrants. In P. M. Ellis & S. C. D. Collings (Eds.), Mental health in New Zealand from a public health perspective. Wellington: Ministry of Health Abbott, M. W., Wong, S., Williams, M., Au, M. K., & Young, W. (2000). Recent Chinese migrants' health, adjustment to life in New Zealand and primary health care utilization. Journal of Disability and Rehabilitation, 22(1/2), 43-56 Anae M ‘Samoans’, Te Ara – the Encyclopaedia of New Zealand updated 21 December 2006 Aslund O and Rooth D (2007) Do When and Where Matter? Initial Labour Market Conditions and Immigrant Earnings The Economic Journal, vol 117 (March): 422-448 Aydemir A, Chen W and Corak M (2007) The Socio-economic Mobility of the Children of Canadian Immigrants Paper presented at the Population Association of New Zealand 2007 Biennial Conference “Looking into the Future: People, Diversity and Social Outcomes” 3 and 4 July 2007, Wellington Aye A and Guerin B (2001) Astronaut Families: A Review of their Characteristics, Impact on Families and Implications for Practice in New Zealand New Zealand Journal of Psychology, Vol 30(1), June 2001: 9 Badkar J (2007) Life in New Zealand: Settlement Experiences of Skilled Migrants Department of Labour Bartley A (2004) Contemporary Asian Migration to New Zealand: Challenging the Settler Paradigm in Spoonley P and Macpherson C (eds) Tangata Tangata: The Changing Ethnic Contours of New Zealand (2004) Thomson/Dunmore Press, Victoria, Australia: 157-174 Basnayake A (1999) Employment experiences of Sri Lankan Migrants in New Zealand. Equal Employment Opportunities Trust Bedford, R, Callister, P and Didham, R, Globalisation, Gendered Migration and Labour markets, Department of Labour, 2006. Berger-Schmitt, R Social Cohesion as an Aspect of the Quality of Societies: Concept and Measurement European Commission, EU Reporting Working Paper No.14 Beson-Rea M, Haworth N and Rawlinson S (1998) The Integration of Highly Skilled Migrants into the Labour Market: Implications for New Zealand Business New Zealand Immigration Service Bihi A (1999) Cultural Identity, Adaptation and Wellbeing of Somali Refugees in New Zealand Unpublished research paper in partial fulfilment of Master of Development Studies, Victoria University of Wellington Borjas G (2006) Making it in America: Social Mobility in the Immigrant Population National Bureau of Economic Research, Working Paper 12088 Boyd C (2003) Migrants in New Zealand: An Analysis of Labour Market Outcomes for Working Aged Migrants using 1996 and 2001 Census Data Department of Labour
122
Boyer T (1996) Problems in Paradise: Taiwanese Immigrants to Auckland, New Zealand Asia Pacific Viewpoint, Vol 37(1), April 1996: 59-79 Butcher A, Spoonley P and Trlin (2006) A Being Accepted: The Experience of Discrimination and Social Exclusion by Immigrants and Refugees in New Zealand Occasional Publication No. 13, New Settlers Programme, Massey University, Palmerston North Calhoun C (1994) Social Theory and the Politics of Identity Blackwell: Oxford Canadian Council on Social Development (2000) Social Cohesion in Canada: Possible Indicators – Highlights Social Cohesion Network (Department of Canadian Heritage, Department of Justice) Chang S, Morris C and Vokes R (2006) Korean Migrant Families in Christchurch: Expectations and Experiences Report to the Families Commission Chile L (2002) The imported underclass: poverty and social exclusion of African Citizenship and Immigration Canada, Facts and Figures Immigration Overview – Permanent and Temporary Residents 2005, Citizenship and Immigration Canada, Ottawa, 2006 Council of Europe (2004) A New Strategy for Social Cohesion European Committee for Social Cohesion Council of Europe (2005) Concerted Development of Social Cohesion Indicators Council of Europe Creative New Zealand (2006) New Zealanders and the Arts: Attitudes, Attendance and Participation in 2005 Creative New Zealand Creative New Zealand, Auckland City Council and ASB Community Trust (2007) Asian Aucklanders and the Arts: Attitudes, Attendance and Participation in 2006 Department of Internal Affairs (1996) High Hopes: A Survey of Training and Employment Issues for Recent Immigrants in New Zealand Information Series Number 2, Ethnic Affairs Service, Department of Internal Affairs Department of Internal Affairs (2005) New Zealand Citizenship in Context Department of Internal Affairs Department of Labour (2000) Astronaut Families and Cosmonaut Couples Department of Labour Department of Labour (2003) Migrants in New Zealand: an Analysis of 2001 Census data, Department of Labour, Wellington Department of Labour (2003) Migrants in New Zealand: An analysis of Labour Market Outcomes for Working-aged migrants using 1996 and 2001 Census data, Department of Labour, Wellington Department of Labour (2005) Migration Trends 2004/05, Department of Labour, Wellington Department of Labour (2006) Migration Trends 2005/06, Department of Labour, Wellington
123
Department of Labour (2007) Goal Two - Auckland Regional Settlement Strategy Employment, Department of Labour, Wellington Department of Labour (2008) Migration Trends 2006/07, Department of Labour, Wellington DeSouza R (2006) Sailing in a New Direction: Multicultural Mental Health in New Zealand Australian e-Journal for the Advancement of Mental Health 5(2) http://www.auseinet.com/journal/vol5iss2/desouza.pdf accessed 16 November 2006 Diego, M.S, and Podsiadlowski A (2006)…Paper presented at the XVIII Congress of the International Association of Cross-Cultural Psychology, July 2006, Spetses, Greece Diego, M.S, Fischer, R and Podsiadlowski A (2007)…Paper presented at the XVIII Congress of the International Association of Cross-Cultural Psychology, July 2006, Spetses, Greece Dunstan S, Dibbley R and Shorland P (2004) Refugee Voices: A Journey Towards Resettlement. New Zealand Immigration Service, Department of Labour. Wellington Electoral Commission (2005) Briefing to Incoming Minister Electoral Commission accessed 21 November 2006 at http://www.elections.org.nz/administration/ec-bim-2005.html Equal Employment Opportunities Trust (2000) Recruiting Talent: A Research Report Equal Employment Opportunities Trust Evans, M (1988) ‘Choosing To Be A Citizen: The Time-Path of Citizenship in Australia’, International Migration Review, Vol 22, no 2, Center for Migration Studies, (USA), New York Firkin P (2004) ‘New Zealand Experience(s)’: Biographical Narratives of Professional Migrants on Working in New Zealand Massey University, Labour Dynamics Research Programme, Research Report Series 2004/2 Fletcher M (1999) Migrant Settlement: A Review of the Literature and its Relevance to New Zealand New Zealand Immigration Service Friesen W and Ip M (1997) New Chinese New Zealanders: Profile of a Transnational Community In W. Friesen et al., East Asian New Zealanders: Research on New Migrants. Aotearoa/New Zealand Migration Research Network Research Paper. Auckland: Massey University, Albany Campus, 3-19 Gendell P, (2003) International Social Survey Programme, National Identity Module, 2003 Guerin B, Abdi A, & Guerin P (2003) Experiences with the medical and health systems for Somali refugees living in Hamilton New Zealand Journal of Psychology, Vol 32(1): 27-32 Guerin B, Guerin P, Diiriye R O, Abdi A (2004) Living in a Close Community: The Everyday Life of Somali Refugees University of Waikato Migration Research Group Guerin B, Guerin P, Diirye R and Abdi A (2004) What Skills do Somali Refugees Bring with Them? Labour, Employment and Work in New Zealand, Proceedings of
124
the Eleventh Conference, 22 and 23 November 2004, Victoria University of Wellington Guerin B, Guerin P, Omar Diiriye R, & Yates S, (2004) Somali conceptions and expectations concerning mental health: some guidelines for mental health professionals, New Zealand Journal of Psychology, Vol 33(2)” 59-67 Guerin P, Diiriye R, Corrigan C, Guerin B (2003) Physical Activity Programs for Refugee Somali Women: Working Out in a New Country Women and Health vol 38(1): 2003 Guerin P, Ho E and Bedford R (2004a) Who are the Most Unemployed People in New Zealand and What Can We Do About It? Labour, Employment and Work in New Zealand, Proceedings of the Eleventh Conference, 22 and 23 November 2004, Victoria University of Wellington Harrison B, “Passing on the language: Heritage language diversity in Canada” in Canadian Social Trends Statistics Canada, Autumn 2000: 14–19. Published by Statistics Canada, 2000 Helliwell J (2003) The Role of Government and Stakeholders, Immigration and Social Capital: Issue Paper, University of British Colombia Henderson A (2003) Untapped Talents: The Employment and Settlement Experiences of Skilled Chinese in New Zealand chapter in Ip M (ed) (2003) Unfolding History, Evolving Identity: The Chinese in New Zealand Auckland University Press Henderson A, Trlin A and Watts N (2006) English Language Proficiency and the Recruitment and Employment of Professional Immigrants in New Zealand New Settlers Programme Occasional Publication No. 11, New Settlers Programme, Massey University, Palmerston North Ho E (1995) Chinese or New Zealander? Differential Paths of Adaptation of Honk Kong Chinese Adolescent Immigrants in New Zealand New Zealand Population Review 21 (1&2) Ho E (2002) Multi-local Residence, Transnational Networks: Chinese ‘Astronaut’ Families, NZ Asian and Pacific Migration Journal, Vol 11: 145-164. Ho E (2003) Reluctant Exiles or Roaming Transnationals: The Hong Kong Chinese in New Zealand chapter in Ip M (ed) (2003) Unfolding History, Evolving Identity: The Chinese in New Zealand Auckland University Press Ho E and Lidgard J (1996) Give us a Chance: The Employment Experiences of New Settlers from East Asia Labour, Employment and Work in New Zealand, Proceedings of the Seventh Conference 28 and 29 November 1996, Victoria University of Wellington Ho E, Bedford R and Goodwin J (1997) ‘Astronaut’ Families: A Contemporary Migration Phenomenon Asia-Pacific Migration Research Network, Department of Sociology, Massey University at Albany, North Shore Ho E, Bedford R and Goodwin J (1998) Self-Employment Among Chinese Immigrants in New Zealand Labour, Employment and Work in New Zealand, Proceedings of the Eighth Conference 26 and 27 November 1998, Victoria University of Wellington
125
Ho E, Chen Y Y and Bedford R (1999) Integrating Dual Identities: The Experience of New Chinese New Zealanders presented at New Zealand Conference of ASCADAPI: Conference for the study of overseas Chinese last accessed 22 June 2006 Ho E, Chen Y-Y, Kim S-N and Young J (1996) In Search of a Better Future: Report of a Survey on Post-School Education and Employment Choices Among Asian Adolescent Migrants Population Studies Centre Discussion Paper No 17, September 1996, University of Waikato Ho E, Cheung E, Bedford C and Leung P (2000) Settlement Assistance Needs of Recent Migrants Migration Research Group, University of Waikato, report commissioned by the New Zealand Immigration Service Ho E, Goodwin J, Bedford R and Spragg B (1997) Migrants in the Workforce: A Preliminary Comparison of the Experiences of Chinese and Korean Recent Immigrants in 1991 and 1996 Briefing paper prepared for the participants at the Population Conference, Wellington 12014 November 1997 Ho, E., Au, S., Bedford, R, & Cooper, J. (2003). Mental health issues for Asians in New Zealand: a literature review. Wellington: Mental Health Commission. Hobbs M, Moor C, Wansbrough T and Calder L (2002) The health status of asylum seekers screened by Auckland Public Health in 1999 and 2000 The New Zealand Medical Journal, 115 (1160), 1-7? Hulse and Stone (2006) Housing, Housing Assistance and Social Cohesion Australian Housing and Urban Research Institute Human Rights Commission (2004) Human Rights in New Zealand Today: Nga Tika Tangata o Te Motu Human Rights Commission Human Rights Commission (2006) Omnibus Survey Results February 2006 Human Rights Commission Discrimination and Complaints Guide at http://www.hrc.co.nz/home/hrc/unlawfuldiscriminationcomplaints/unlawfuldiscriminationcomplaints.php accessed 29 March 2007 Ip M (2005) Our Treaty Too? A Chinese View Paper presented at “Human Rights, the Treaty of Waitangi and Asian Communities – A Symposium”, School of Asian Studies, The University of Auckland, Human Rights Commission, 13 November 2005 Ip M (1996) Dragons on the Long White Cloud: The Making of Chinese New Zealanders Tandem Press Ip M (2002) Chinese Political Participation in New Zealand – the Role of Taiwanese Immigrants School of Asian Studies, University of Auckland – steven young website Ip M (2003) “Seeking the Last Utopia: The Taiwanese in New Zealand” in Ip M (ed) Unfolding History, Evolving Identity: The Chinese in New Zealand Auckland University Press Ip M and Pang D (2005) New Zealand Chinese Identity: Sojourners, Model Minority and Multiple Identities in Liu J, McCreanor T, McIntosh T, and Teaiwa T (eds) (2005) New Zealand Identities: Departures and Destinations Victoria University Press: 174-190
126
Jenson J (1998) Mapping Social Cohesion: The State of Canadian Research Canadian Policy Research Network Study No. F03 Johnston R, Trlin A, Henderson A, North N and Skinner M (2005) Housing Experience and Settlement Satisfaction: Recent Chinese, Indian and South African Skilled Immigrants to New Zealand Housing Studies, Vol 20(3), May 2005: 401-421 Karim H Karim (1996) The Definition of Visible Minority: A Historical and Cultural Analysis Department of Canadian Heritage Kudos Organisational Dynamics Ltd (2000) Asian Community Needs, Lifestyle and Interaction with Auckland City Council: With a Particular Focus on Migrant Communities Research Report to Auckland City Council Law Commission (2004) Delivering Justice for All: A Vision for New Zealand Courts and Tribunals Report 85 Lidgard J (1996) East Asian Migration to Aotearoa/New Zealand: Perspectives of Some New Arrivals Population Studies Centre Discussion Paper No. 12, University of Waikato Lidgard J and Yoon H (1998) The Employment Experiences of Recent Korean Immigrants in New Zealand Labour, Employment and Work in New Zealand, Proceedings of the Eighth Conference, 26 and 27 November 1998, Victoria University of Wellington Local Government New Zealand, Elected Members Survey, Wellington: Local Government Survey, 2004 Lovelock K and Trlin A (2007) Voluntary Associations and Immigrants: A Survey of Host Society Associations in Auckland and Wellington Occasional Publication No. 16, New Settlers Programme, Massey University, Palmerston North McGrath T, Butcher A, Pickering J, & Smith H, Engaging Asian Communities in New Zealand, Asia New Zealand Foundation, 2005 McIntyre K, Ramasamy R and Sturrock F (2003) Summary Report: Evaluation of Migrant Pilot Projects in Auckland North, Auckland Central, Waikato and Central Regions 2002 Centre for Social Research and Evaluation, Ministry of Social Development McKenzie D, Gibson J and Stillman S (2006) How Important is Selection? Experimental vs. Non-experimental Measures of the Income Gains from Migration Motu Working Paper 06-02, Motu Economic and Public Policy Research McLaren E and Spoonley P (2005) Employment and Skills: North Shore City, Waitakere City and the Rodney District Working Paper No. 15 Labour Market Dynamics Research Programme, Massey University, Albany and Palmerston North Macpherson C (2004) From Pacific Islanders to Pacific People and Beyond in Spoonley P, Macpherson C and Pearson P (eds) Tangata Tangata: The Changing Ethnic Contours of New Zealand (2004) Thomson/Dunmore Press, Victoria, Australia: 135-156 Ministry for Culture and Heritage, Evaluation of the impact of the pilot national Pacific radio network – Niu FM, Wellington: Ministry for Culture and Heritage, 2004
127
Ministry of Education (2004) The Experiences of International Students in New Zealand: Report on the Results of a National Survey Ministry of Education Ministry of Education (2006) Tertiary Education Enrolments -2006 Ministry of Education Ministry of Education, Boards of Trustees Elections Analysis 04, Wellington: Ministry of Education, 2004. Ministry of Education (2007) Results of the School Board of Trustees Elections: 2007 Wellington: Ministry of Education Ministry of Health, The Annual Report 2004/05 including The Health and Independence Report, Wellington: Ministry of Health, 2005. Ministry of Health. (2006). Asian Health Chart Book 2006. Wellington: Ministry of Health. Ministry of Pacific Island Affairs, Pacific Media Contacts Wellington: Ministry of Pacific Island Affairs, last updated 6 June 2006
Ministry of Social Development (2006) The Social Report 2006 Ministry of Social Development Mintrom M and True J (2004) Framework for the Future: Equal Employment Opportunities in New Zealand Human Rights Commission Mortensen and Young N (2004) Caring for Refugees in Emergency Departments in New Zealand Nursing Praxis in New Zealand 20(2) New Zealand Immigration Service (2004) Refugee Voices: A Journey Towards Resettlement Department of Labour New Zealand Immigration Service (2004a) Longitudinal Immigration Survey: New Zealand – Pilot Survey Report Department of Labour New Zealand Immigration Service (2007) Auckland Regional Settlement Strategy, Department of Labour New Zealand Parliament Members of Parliament: Current MPs New Zealand Parliament website, http://www.parliament.nz/en-NZ/MPP/MPs/MPs/ accessed 29 March 2007 New Zealand Police, Working Together with Ethnic Communities: Police Ethnic Strategy Towards 2010, Wellington: New Zealand Police, 2004. Ngai and Chu, Chinese Social Workers Interest Group of ANZASW (2001) Issues and Service Needs of Chinese Communities Social Work Review North N and Trlin A (2004) Immigrants in business: A study of self-employed immigrants and their businesses in New Zealand, Occasional Publication No. 10, New Settlers Programme, Massey University, Palmerston North North N, Trlin A, & Henderson A (2004) Asian and Other Skilled Immigrants’ Self-reported Illnesses in the First Four Years of Settlement in New Zealand, in Tse A, Thapliyal A, Garg S, Lim G, & Chatterji M, (2004) Proceedings of the Inaugural International Asian Health Conference: Asian Health and Wellbeing, Now and into
128
the Future The University of Auckland, School of Population Health: 38-56 North N, Trlin and Singh R (1999) Characteristics and Difficulties of Unregistered Immigrant Doctors in New Zealand New Zealand Population Review, Vol 25 (1999): 133-143 OECD (2006) From Immigration to Integration: Local Approaches OECD Observer Policy Brief November 2006, OECD OECD (2006) Where Immigrant Students Succeed: A Comparative Review of Performance and Engagement in PISA 2003 OECD OECD (2007) Jobs for Immigrants – Labour Market Integration in Australia, Denmark, Germany and Sweden OECD OECD, International Migration Outlook 2006, OECD: Paris, 2006 Oliver P (2000) Employment for Professional Migrants to New Zealand – Barriers and Opportunities prepared for Work and Income by the Centre for Operational Research and Evaluation O’Hare N (2004) ‘The unfriendly isles’, New Zealand Listener, Vol. 195 Parliamentary Library (2005) Final Results 2005 General Election Briefing Note, Parliamentary Library Peace R, Paul S, Butcher A and O’Neill D (2005) Immigration and Social Cohesion: Developing an Indicator Framework for Measuring the Impact of Settlement Policies in New Zealand Centre for Social Research and Evaluation, Ministry of Social Development Peace R, Spoonley P, Butcher A, & O’Neill D, Immigration and Social Cohesion: Developing an indicator framework for measuring the impact of settlement polices in New Zealand, (Prepared for) Centre for Social Research and Evaluation (CSRE), Working Paper 01/05, 2005. Pernice R and Brook J (1996). Refugees' and Immigrants' Mental Health: Association of Demographic and Post-immigration Factors The Journal of Social Psychology, Vol 136(4): 511-519 Pernice R (2000) Problems Fitting in One Cause of Migrants’ Ills New Zealand Doctor, 22 November 2000: 22 Pernice R, Trlin A, Henderson A and North N (2000) Employment and Mental Health of Three Groups of Immigrants to New Zealand New Zealand Journal of Psychology, Vol 29(1):24-34 Phillips J (2007) “History of immigration”, Te Ara – Encyclopaedia of New Zealand, Ministry of Culture and Heritage, updated 9 January 2007, www.TeAra.govt.nz/NewZealanders/NewZealandPeoples/HistoryOfImmigration/en Podsiadlowski A (2006) Issues of migrant employment. Findings and conclusions for the Wellington region. Paper presented at Pathways, circuits and crossroads. New public good research on population, migration and community dynamics seminar, May 2007, Welligton, New Zealand.
129
Podsiadlowski A (2007) Managing culturally diverse workforces . Issues of recruitment and selection. Paper presented at Pathways, circuits and crossroads. New public good research on population, migration and community dynamics seminar, May 2007, Welligton, New Zealand Quality of Life Project (2005) Quality of Life in New Zealand’s Largest Cities 2004 Quality of Life Project and the Ministry of Social Development: New Zealand Quality of Life Project (2007) Quality of Life Survey 2006: National Report Quality of Life Project and the Ministry of Social Development: New Zealand Rajulton F, Ravanera Z and Beaujot R (2003) How Cohesive are Canadian CMAs? A Measure of Social Cohesion Using the National Survey of Giving, Volunteering, and Participating Population Studies Centre, University of Western Ontario, Paper presented at the Statistics Canada 2003 Economics Conference, 12-13 May 2003, Ottawa Rasanathan K (2005) Across the Post-colonial Divide: Reflections on the Treaty of Waitangi Paper presented at “Human Rights, the Treaty of Waitangi and Asian Communities – A Symposium”, School of Asian Studies, The University of Auckland, Human Rights Commission, 13 November 2005 Refugees in New Zealand Asia Pacific Viewpoint, Vol 43(3): 355-366. Reilly P and Cullen R (2006) Information Privacy and Trust in Government: A Citizen-based Perspective State Services Commission Reitz J and Banerjee R (2007) “Racial Inequality, Social Cohesion and Policy Issues in Canada” in Banting K, Courchene T and Seidle F (eds) (2007) Belonging? Diversity, Recognition and Shared Citizenship in Canada Institute for Research on Public Policy. Montreal. Canada Rose E, Huakau J, Sweetsur P and Casswell S Social Values: A Report from the New Zealand Values Study 2005 The Centre for Social and Health Outcomes Research and Evaluation, Massey University: Auckland Shorland P (2006) People on the Move: A Study of Migrant Movement Patterns to and from New Zealand Department of Labour Singham M (2006) Multiculturalism in New Zealand – the need for a new paradigm Aotearoa Ethnic Network Journal, vol 1(1) Smith H (1996) English Language Acquisition in the Lao Community of Wellington: Recommendations for Refugee Groups Social Policy Journal of New Zealand, July 1996 (6): 200 – 215 Soroka S, Johnston R and Banting K (2006) Ties that Bind? Social Cohesion and Diversity in Canada Institute for Research on Public Policy. Montreal, Canada. Monograph December 2006 Spoonley P (2004) “Transnational New Zealand: Immigrants and Cross-border Connections and Activities” in Spoonley P, Macpherson C and Pearson D (2004) Tangata Tangata: The Changing Ethnic Contours of New Zealand Thomson Spoonley P and Davidson C (2004) “The Changing World of Work” in Spoonley P, Dupuis A and de Bruin A (eds) (2004) Work and Working in Twenty-first Century New Zealand Dunmore Press, Palmerston North
130
Spoonley P, & Trlin A, Immigration, Immigrants and the Media: Making Sense of Multicultural New Zealand, Palmerston North: New Settler Programme, Massey University, 2004 State Services Commission (2005) EEO Progress in the Public Service 2000-2004: The Data Stories State Services Commission Statistics New Zealand (2004) Degrees of Difference: The Employment of University-qualified Immigrants in New Zealand Statistics New Zealand Statistics New Zealand (2005) National Projections: National Ethnic Population (Series 5 national projections and series 6 ethnic projections) Statistics New Zealand Statistics New Zealand (2006) Cultural Indicators for New Zealand: Statistics New Zealand Statistics New Zealand (2008) Longitudinal Immigration Survey (LisNZ), Wave 1 Statistics New Zealand Statistics New Zealand (2008) Tourism and Migration, 2001-2007 Statistics New Zealand Statistics New Zealand (2008) Demographic Trends 2007 Statistics New Zealand Statistics New Zealand (2008) International Travel and Migration: June 2008 Statistics New Zealand Statistics New Zealand (2008) National Projections: National Ethnic Population Statistics New Zealand Statistics New Zealand, 1991, 1996, 2001 and 2006 Census Stillman, S., McKenzie, D., & Gibson, J. (2006). Migration and mental health: Evidence from a natural experiment. Hamilton: University of Waikato Trlin A, Henderson A and North N (1999) Effects of Unemployment among Skilled Immigrants from India New Zealand Population Review Vol 25, 99-117 Trlin A, Henderson A and North N (2004) Skilled Chinese and Indian Immigrant Workers chapter in Spoonley P, Dupuis A and de Bruin A (eds) (2004) Work and Working in Twenty-first Century New Zealand, Dunmore Press: Palmerston North UMR Research (2007) What the New Zealand Public Want and Expect from their Police in the 21st Century UMR and New Zealand Police: Wellington United Nations (2006) Alliance of Civilisations: Report of the High-level Group United Nations: New York URL : http://www.TeAra.govt.nz/NewZealanders/NewZealandPeoples/Samoans/en Walker M, Udy K and Pole N (1996) Adult Literacy in New Zealand: Results from the International Adult Literacy Survey Ministry of Education Wallis R (2006) Skilled Migrants in New Zealand: A Study of Settlement Outcomes Department of Labour
131
Wallis R and BRC Marketing and Social Research Ltd (2006) Skilled Migrants in New Zealand: Employers’ Perspectives Department of Labour Ward C and Lin E-Y Immigration, Acculturation and National Identity in New Zealand in Liu J, McCreanor T, McIntosh T, and Teaiwa T (eds) (2005) New Zealand Identities: Departures and Destinations Victoria University Press:155-173 Ward C and Masgoret A (2004) Immigrant Employment: A Study of Recruitment Agencies’ Responses to New Zealand and Chinese Candidates Victoria University of Wellington, Centre for Applied Cross-Cultural Research Ward C and Masgoret A-M (2004) Telephone Survey – New Zealanders’ Attitudes Towards Immigrants and Immigration presentation of the major findings presented at the New Directions, New Settlers, New Challenges FRST end-users seminar in April 2004 Ward C and Masgoret A-M (2006) Attitudes toward immigrants, immigration and multiculturalism in New Zealand: A social psychological analysis. International Migration Review Ward C (2007a) The Experiences of Migrant Youth: A Generational Analysis report prepared for Department of Labour Ward C (2007b) Identity, acculturation and adaptation in migrant youth. Paper presented at Pathways, Circuits and Crossroads: New Research on Population, Migration and Community Dynamics End-users conference. Wellington Watters, C. (2001). Emerging paradigms in the mental health care of refugees. Social Science and Medicine, 52, 1709-1718. Watts N (1999) Public Sector Provision for Immigrants from a Non-English-Speaking Background Public Sector Vol 22(4): 20-23 Watts, Noel, White, Cynthia and Trlin, Andrew (2002) Young Migrant Settlement Experiences and Issues in New Zealand: Two Perspectives, New Settlers Programme Occasional Publication No.6, Palmerston North: New Settlers Programme, Massey University Watts N and Trlin A (1999) Cultural Resources of Immigrants and International Business in New Zealand New Zealand Population Review, vol 25 (November): 119-132’ Watts N and Trlin A (2000) Diversity as a Productive Resource: Employment of Immigrants of Non-English-Speaking Backgrounds in New Zealand Social Policy Journal of New Zealand Vol 15: 87-101 White C, Watts N and Trlin A (2002) New Zealand as an English-Language Learning Environment: Immigrant Experiences, Provider Perspectives and Social Policy Implications Social Policy Journal of New Zealand, Vol 18, June 2002: 148-162 Winkelmann, L and Winkelmann, R Immigrants in New Zealand: A Study of their Labour Market Outcomes, Department of Labour: Wellington, 1998 Yee B (2003) Coping with Insecurity: Everyday Experiences of Chinese New Zealanders in Ip M (ed) (2003) Unfolding History, Evolving Identity: The Chinese in New Zealand Auckland University Press: 215-235