Embed Size (px)
Citation preview

340.151217
340Edvo-Kit #340
DNA InformaticsExperiment Objective:
In this experiment, students will explore the popular bioninformatics tool BLAST. First they will read sequences from autoradiographs of automated gel runs. The resulting data will then be analyzed using publicly available databases and BLAST to identify genes and gene products.
See page 2 for storage instructions.
SAMPLE LITERATURE
Please
refer
to in
cluded
weblin
k for c
orrect
versi
on.

Experiment Components & Requirements
Page
Experiment Components 2
Experiment Requirements 3
Background Information 4
Experiment Procedures
Guide to using BLASTN 6
Exercises 11
Study Questions 14
Instructor's Guidelines 15
Answers to Exercises 16
Answers to Study Questions 17
EDVOTEK and The Biotechnology Education Company are registered trademarks of EDVOTEK, Inc.
Experiment can be stored at room temperature.
This experiment contains a total of 3 sets of 4 autoradiographs from gel run sequencing. Students can use any sequence database to perform the activities in this lab. For purposes of simplification we have chosen to illustrate with a database offered by the NCBI.
COMPONENTS
• 3setsof4Autoradiographs REQUIREMENTS
• ComputerwithInternetaccess• WhiteLightBox*
* A white light box is recommended. The EDVOTEK White Light Gel Visualization System (Cat. # 552) is well-suited for this lab. An autoradiograph may also be placed on an overhead projector and shown to the whole class.
Table of Contents
DNA Informatics EDVO-Kit #340
1.800.EDVOTEK • Fax 202.370.1501 • [email protected] • www.edvotek.com
2
Duplication of any part of this document is permitted for non-profit educational purposes only. Copyright © 2000-2015 EDVOTEK, Inc., all rights reserved. 340.151217
DNA Informatics EDVO-Kit #340

Background Information
BIOINFORMATICS AS A MODERN CORNERSTONE OF BIOLOGY
DNA sequencing technology allows for the analysis of DNA at the nucleo-tide level. Nucleotides are the monomer building blocks of DNA (Figure 1). Each deoxynucleotide (dNTP) comprises three basic parts: a phosphate group, a deoxyribose sugar, and a nitrogen-containing base (adenine, cytosine, guanine, or thymine). The 3’ hydroxyl group on the sugar of one nucleotide forms a covalent bond with the 5’ phosphate group of its neighbor. The nature of this bond results in remarkably stable strands with a distinct polarity, making DNA ideal for genetic information storage.
Automated and high-throughput sequencing methods have made generat-ing sequence information vastly more efficient. For example, the human genome, which consists of around three billion nucleotides, initially took over a decade to sequence but can now be completed in less than a day. As a result there is a great emphasis not only on generating sequence data but also on storing and analyzing the data. Bioinformatics represents the intersection of computer science and biology, involving any mathematical or computing approach that advances our understanding of biological pro-cesses. One major goal in bioinformatics is to develop computer programs that enable efficient access to and management of large data sets. Other
methods aim to de-velop new algorithms (mathematical for-mulas) and statistical measures that assess relationships among members of large data sets. These programs often include pattern recognition, data mining, machine learning, and visualization.
THE SANGER METHOD OF DNA SEQUENCING
Chain termination sequencing, often called Sanger sequenc-ing, allows researchers to generate long DNA reads of a target sequence, also known as the template. The DNA template is combined with DNA primer, the DNA poly-merase I enzyme (DNA Pol I), and a mixture of two types of free nucleotides, deoxynucleotides (dNTPs) and dideoxy-nucleotides (ddNTPs). Importantly, one of the dNTPs is often labeled with radioactive phosphorus-32 or sulfur-35 to allow for visualization of the DNA fragments at later stages of the experiment. During the sequencing reaction, DNA Pol I copies the DNA template by adding dNTPs to the primer to form a complementary strand of DNA. Occasionally, the DNA Pol I will instead add a ddNTP to the DNA strand. This ddNTP
Figure 1: Structure of DNA
Figure 2:NucleotideStructure
5'
PO
O
O CH2
O --
4'
O
OH H
3' 2'
1'
G, A, T, or C Base
Growing DNA Chain
Point of Addition of the Next Nucleotide
Deoxynucleotide(dNTP)
5'
PO
O
O CH2
O --
4'
O
H H
3' 2'
1'
G, A, T, or C Base
Growing DNA Chain
Dideoxynucleotide(ddNTP)
Chain Synthesis Stops, No 3' OH
HH H
DNA InformaticsEDVO-Kit #340
3
1.800.EDVOTEK • Fax 202.370.1501 • [email protected] • www.edvotek.com
Duplication of any part of this document is permitted for non-profit educational purposes only. Copyright © 2000-2015 EDVOTEK, Inc., all rights reserved. 340.151217
DNA InformaticsEDVO-Kit #340
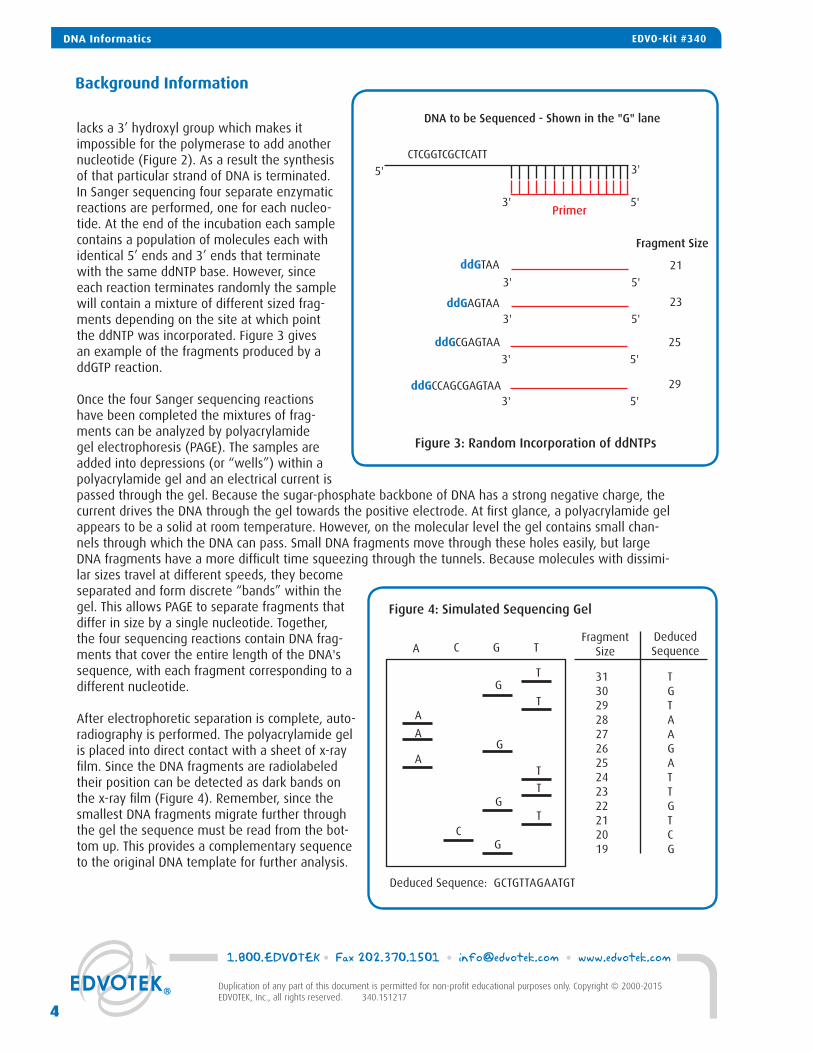
lacks a 3’ hydroxyl group which makes it impossible for the polymerase to add another nucleotide (Figure 2). As a result the synthesis of that particular strand of DNA is terminated. In Sanger sequencing four separate enzymatic reactions are performed, one for each nucleo-tide. At the end of the incubation each sample contains a population of molecules each with identical 5’ ends and 3’ ends that terminate with the same ddNTP base. However, since each reaction terminates randomly the sample will contain a mixture of different sized frag-ments depending on the site at which point the ddNTP was incorporated. Figure 3 gives an example of the fragments produced by a ddGTP reaction.
Once the four Sanger sequencing reactions have been completed the mixtures of frag-ments can be analyzed by polyacrylamide gel electrophoresis (PAGE). The samples are added into depressions (or “wells”) within a polyacrylamide gel and an electrical current is passed through the gel. Because the sugar-phosphate backbone of DNA has a strong negative charge, the current drives the DNA through the gel towards the positive electrode. At first glance, a polyacrylamide gel appears to be a solid at room temperature. However, on the molecular level the gel contains small chan-nels through which the DNA can pass. Small DNA fragments move through these holes easily, but large DNA fragments have a more difficult time squeezing through the tunnels. Because molecules with dissimi-lar sizes travel at different speeds, they become separated and form discrete “bands” within the gel. This allows PAGE to separate fragments that differ in size by a single nucleotide. Together, the four sequencing reactions contain DNA frag-ments that cover the entire length of the DNA's sequence, with each fragment corresponding to a different nucleotide.
After electrophoretic separation is complete, auto-radiography is performed. The polyacrylamide gel is placed into direct contact with a sheet of x-ray film. Since the DNA fragments are radiolabeled their position can be detected as dark bands on the x-ray film (Figure 4). Remember, since the smallest DNA fragments migrate further through the gel the sequence must be read from the bot-tom up. This provides a complementary sequence to the original DNA template for further analysis.
Background Information
5'
Figure 4: Simulated Sequencing Gel
A TC GDeduced Sequence
Fragment Size
A
T
C
G
A
AG
G
G
T
T
T
T
31 T30 G29 T 28 A 27 A 26 G 25 A 24 T 23 T 22 G 21 T 20 C 19 G
Deduced Sequence: GCTGTTAGAATGT
Primer3' 5'
3'
Fragment Size
3' 5'
21ddGTAA
3' 5'
23ddGAGTAA
3' 5'
25ddGCGAGTAA
3' 5'
29ddGCCAGCGAGTAA
DNA to be Sequenced - Shown in the "G" lane
CTCGGTCGCTCATT
Figure 3: Random Incorporation of ddNTPs
1.800.EDVOTEK • Fax 202.370.1501 • [email protected] • www.edvotek.com
4
Duplication of any part of this document is permitted for non-profit educational purposes only. Copyright © 2000-2015 EDVOTEK, Inc., all rights reserved. 340.151217
DNA Informatics EDVO-Kit #340
Background Information
SEQUENCE COMPARISON USING BLAST
Data from DNA sequencing is of limited value unless it is converted to biologically useful information, making bioinformatics a critical part of DNA sequencing. After collecting DNA sequence data, molecular biologists will often search public databases for similar sequences. Comparing sequences can lead to the identification of genes and other conserved sequence patterns. In addition, sequence comparison can be used to establish functional, structural, and evolutionary relationships among genes. Another potential ben-efit is that sequence comparison provides a reliable method for inferring the biological functions of newly sequenced genes.
One of the largest and most influential databases is known as GenBank. This free, open source database contains over a trillion nucleotide bases of publically available sequence data. Each entry in GenBank contains a sequence and a unique accession number, as well as supporting bibliographic and biological annotations such as author references and taxonomic data. The NCBI (National Center for Biotechnology Information) oversees and maintains the entire database, but each entry is submitted directly by individual laboratories. Direct submission has allowed the database to keep pace with the rapid growth in sequence data production. However, it also means that heterogeneity in entry quality exists, especially in the cer-tainty of each nucleotide’s identity and in the extent of attached annotation. The impact of this uncertainty can vary depending on the goals of the study, the physical properties of the DNA region(s), and the chosen sequencing method. To address this, GenBank classifies the sequence information based on the sequencing strategy used to obtain the data.
Associated with this database is the Basic Local Alignment Search Tool, or BLAST. The BLAST program finds regions of local similarity between a user’s DNA sequence and sequences in the GenBank database. In BLAST terminology, the user’s input sequence is known as the query sequence, sequences in the database are known as target sequences, and sequences with similarities to the input sequence are hits. The user can draw inference about the putative molecular function of the query sequence by looking at the hits. Similarities between hits suggest homology, the existence of shared ancestry between the genes. In ad-dition, BLAST can be used to identify unknown species, locate known protein domains, and find potential chromosome locations.
BLAST takes a heuristic approach to the problem of searching through such a mammoth database of target sequences. This means the program takes shortcuts in order to find sequence matches in a reasonable time frame. These shortcuts are based on the assumption that biologically similar sequences will contain short identical stretches of sequences. The entire database is scanned for the presence of these short stretches, and sequences containing two stretches within a preset distance are set aside. These sequences are then locally aligned with the query sequence to see if the nucleotide order beyond the two stretches matches. By searching the GenBank database this way BLAST can return results very quickly, although it sacrifices some accuracy and precision.
This exercise introduces students to bioinformatics through the analysis of sequencing data. In order to gain experience in database searching, students will use the free service offered by the NCBI. At pres-ent, GenBank comprises several databases including the GenBank and EMBL (European Molecular Biology Laboratory) nucleotide sequences, the non-redundant GenBank complementary DNA translations (protein sequences), and the EST (expressed sequence tags) database. These exercises will involve using BLASTN to compare nucleotide sequences.
5
1.800.EDVOTEK • Fax 202.370.1501 • [email protected] • www.edvotek.com
Duplication of any part of this document is permitted for non-profit educational purposes only. Copyright © 2000-2015 EDVOTEK, Inc., all rights reserved. 340.151217
DNA InformaticsEDVO-Kit #340

Guide to Using BLASTN
1. Type: www.ncbi.nlm.nih.gov to log on to the NCBI web page. 2. On the top left of the screen click on the drop down menu “Resources”.3. Click on “Data and Software”, then click on “BLAST” (Basic Local Alignment Search Tool).
4. On the new BLAST Home screen select “nucleotide blast” which is the first opinion under the Basic BLAST list.
DNA Informatics EDVO-Kit #340
1.800.EDVOTEK • Fax 202.370.1501 • [email protected] • www.edvotek.com
6
Duplication of any part of this document is permitted for non-profit educational purposes only. Copyright © 2000-2015 EDVOTEK, Inc., all rights reserved. 340.151217
DNA Informatics EDVO-Kit #340

Guide to Using BLASTN, continued
6. Enter the nucleotide sequence into the large box in the “Enter Query Sequence” section; be careful to type the following sequence exactly:
ggcaactgcccaaagtgtgatccagcctgtctcaacagaa
5. On the new screen make sure the tab selected is “blastn”.
7. Under “Choose Search Set” make sure that “Others (nr etc.)” is selected and that “Nucleotide collection (nr/nt)” is highlighted in the dropdown menu. The remaining entries should be left blank.
7
1.800.EDVOTEK • Fax 202.370.1501 • [email protected] • www.edvotek.com
Duplication of any part of this document is permitted for non-profit educational purposes only. Copyright © 2000-2015 EDVOTEK, Inc., all rights reserved. 340.151217
DNA InformaticsEDVO-Kit #340

Guide to Using BLASTN, continued
8. Under “Program Selection” select “High similar sequence (megablast)”.
9. Click on the blue “BLAST” query box.
10. Once the “BLAST” query box has been clicked you will be assigned an ID#. Record this number so you can check your results at a later time.
11. Examine the BLASTN search report. The report includes: a. Search Summary Report that shows an overview of the BLASTN search parameters.
1.800.EDVOTEK • Fax 202.370.1501 • [email protected] • www.edvotek.com
8
Duplication of any part of this document is permitted for non-profit educational purposes only. Copyright © 2000-2015 EDVOTEK, Inc., all rights reserved. 340.151217
DNA Informatics EDVO-Kit #340

Guide to Using BLASTN, continued
b. Graphic Summary section that shows the alignment of database matches to the query sequence. The color of the boxes corresponds to the score of the alignment with red representing the highest alignment scores.
c. Description section that shows all the sequences in the database with significant sequence homology to our sequence. By default the results are sorted according to the E-value but you can click on the column header to sort the results by different categories. Notice that there can be several different entries with identical high scores.
9
1.800.EDVOTEK • Fax 202.370.1501 • [email protected] • www.edvotek.com
Duplication of any part of this document is permitted for non-profit educational purposes only. Copyright © 2000-2015 EDVOTEK, Inc., all rights reserved. 340.151217
DNA InformaticsEDVO-Kit #340

Guide to Using BLASTN, continued
d. Alignment section that shows alignment blocks for each BLAST hit. Each alignment block begins with a sum-mary that includes the Max score and expected value, sequence identity, the number of gaps in the alignment, and the orientation of the query sequence relative to the subject sequence.
12. Select a sequence to focus on in-depth. You can do this by clicking on a colored bar in the graphic section, clicking on the sequence name in the description section, or scrolling down to the alignment section. Then click on the sequence ID. This brings up additional information about the subject sequence, including the gene name, the genus and species of origin, and articles written about the gene. After performing this search, one of the top hits should be Bos taurus epidermal growth factor receptor (EGFR), mRNA. Sequence ID: ref|XM_002696890.3|. If top hit does not match, try re-entering the sequence. Be sure to double check the search parameters before the BLASTN searching.
1.800.EDVOTEK • Fax 202.370.1501 • [email protected] • www.edvotek.com
10
Duplication of any part of this document is permitted for non-profit educational purposes only. Copyright © 2000-2015 EDVOTEK, Inc., all rights reserved. 340.151217
DNA Informatics EDVO-Kit #340

EXERCISE 1
Familiarize yourself with the autoradiograph by reading the DNA sequence for sample #1.
1. Start at the arrow and read up the gel for 20 nucleotides. Record the DNA sequence. Submit it to NCBI using the BLASTN program.
2. Start at the arrow and read up the gel for 30 nucleotides. Record the DNA sequence. Submit it to NCBI using the BLASTN program.
A few notes on reading a sequencing gel:
• Eitherenterthesequencedirectlyintothequeryboxorwritethesequencedownonapieceofpaperand then enter it.
• Itiscriticalthatyoudonotconfuselaneswhenreadingthesequence.ThegelcontainstheA,C,G,Tlanes from left to right.
• Readingasequencegelrequiresthatyoureadthenucleotidesinthe5’—>3’direction.Thiscanbeac-complished by reading “up” the gel (from the bottom of the gel to the top).
• Noticethatforthemostpartthatthespacingandintensityofmostofthebandsisfairlyconstant.Ignorelightly colored bands and choose only the darker ones. Occasionally the sequence will be dark and all four lanes will be of relatively similar intensity. This is called a DNA sequencing compression and is com-mon when there are stretches of G and C’s. This type of pattern should be treated as an ambiguous posi-tion (see next note).
• Ifanexactbandatapositionisambiguous,youcanenteranNwhichdenotesthatitcouldbeeitherA,C, G or T.
Results to be obtained for autoradiograph 1:
a. Do the BLASTN results for the first and second search resemble each other?
b. Whatisthenameofthisgene?
c. Whatorganism’sDNAwaslikelysequencedinthisexercise?
Exercises
DNA InformaticsEDVO-Kit #340
11
1.800.EDVOTEK • Fax 202.370.1501 • [email protected] • www.edvotek.com
Duplication of any part of this document is permitted for non-profit educational purposes only. Copyright © 2000-2015 EDVOTEK, Inc., all rights reserved. 340.151217
DNA InformaticsEDVO-Kit #340

EXERCISE 2
Now that you have familiarity with the entry and submission process, read the DNA sequence analysis from the autoradiograph corresponding to number 2. Notice that it is sometimes difficult to judge the spacing and strongest intensity of the band in each lane and therefore you need to use your best judgment.
1. Begin the exercise by reading the DNA sequence for sample number 2 approximately 6 cm from the bottom of the strip. The first 12 nucleotides should be: 5’...GGACGACGGTAT...3’.
2. Submit the sequence to NCBI using the BLASTN program.
3. After receiving the BLASTN results, scroll down to the alignment section and look at the entries that have nucleotide matches with your query sequence.
Some more notes on reading a sequencing gel and interpreting BLAST results:
• RememberthatDNAsequenceisalwaysenteredinthe5’—>3’direction.
• DNAisdoublestrandedandcontainsatop(5’—>3’)andbottom(3’—>5’)strand(sometimesthiscorrespondstothecodingandnoncodingstrands).Whenaquerysequenceissearchedagainstthedatabasebothstrandsof the query are examined. The entered sequence is known as the plus strand and reverse complement of this sequence is known as the minus strand.
• Asageneralrule,identicalnucleotidesequencespanninggreaterthan21bpbetweentwosamplesusuallyindicates that the sequences are related or identical.
Results to be obtained for autoradiograph 2:
a. Whatisthenameofthisgene?
b. Whatstranddoesthematchedquerysequencerepresent?Whatstranddoesthehitsequencerepresent?
EXERCISE 3
1. Read the DNA sequence from sample number 3. Start at the bottom of the strip and record the DNA sequence.
2. Submit the sequence to NCBI using the BLASTN program.
3. Click on the GenBank accession number of a sequence hit to access further information about the DNA se-quence and/or gene.
Results to be obtained for autoradiograph 3:
a. Whatisthenameofthisgene?
b. Approximately how many base pairs does this gene have?
Exercises, continued
1.800.EDVOTEK • Fax 202.370.1501 • [email protected] • www.edvotek.com
12
Duplication of any part of this document is permitted for non-profit educational purposes only. Copyright © 2000-2015 EDVOTEK, Inc., all rights reserved. 340.151217
DNA Informatics EDVO-Kit #340

EXERCISE 4
This section demonstrates the interaction of two proteins encoded by two genes. Protein-protein interactions play a fundamental role in virtually every process in a living cell.
For example, signals from the exterior of a cell are mediated to the inside of that cell by the protein-protein interactions of the signaling molecules. This process, called signal transduction, is of central importance in many biological processes such as cell division and cytoskeleton formation. In this exercise, we will use DNA sequences to characterize two human genes.
1. Read the DNA sequence obtained from sample number 4. Start at the bottom of the strip and record the DNA sequence for around 30 base pairs.
2. Next, move approximately a third of the way up the strip (~14cm) and read a portion of this section of the DNA sequence.
3. For this exercise limit the database search to human genes. To do this go to “Choose Search Set” and select “Human genomic + transcript”. See Guide to Using BLASTN step 7.
4. Submit each sequence section individually to the BLASTN program.
5. Once you have identified the name of these two genes, perform a general Internet search to collect more information about the two proteins.
Results to be obtained for autoradiograph 4:
a. ThissamplecontainstwoDNAsequences(frombottomsectionandstartingfromthemiddlesection).Whatare the corresponding names of these genes?
b. Whatarethefunctionsofthetwoproteinsencodedbythesegenes?
c. How do these two proteins interact in a living cell?
Exercises, continued
13
1.800.EDVOTEK • Fax 202.370.1501 • [email protected] • www.edvotek.com
Duplication of any part of this document is permitted for non-profit educational purposes only. Copyright © 2000-2015 EDVOTEK, Inc., all rights reserved. 340.151217
DNA InformaticsEDVO-Kit #340

Study Questions
1. WhatisDNAsequencing?
2. Whatdoeseachbandintheautoradiographrepresent?
3. WhatisBLAST?Whyisitconsideredabioinformaticstool?
DNA Informatics EDVO-Kit #340
1.800.EDVOTEK • Fax 202.370.1501 • [email protected] • www.edvotek.com
14
Duplication of any part of this document is permitted for non-profit educational purposes only. Copyright © 2000-2015 EDVOTEK, Inc., all rights reserved. 340.151217
DNA Informatics EDVO-Kit #340

Instructor's Guide
15
1.800.EDVOTEK • Fax 202.370.1501 • [email protected] • www.edvotek.com
Duplication of any part of this document is permitted for non-profit educational purposes only. Copyright © 2000-2015 EDVOTEK, Inc., all rights reserved. 340.151217
INSTRUCTOR'S GUIDEEDVO-Kit #340 DNA Informatics
Below are the answers obtained by performing a BLASTN search with the sequences provided with this kit as of its publication (2015). Because the GenBank database is constantly being revised, we recommend that you run the below sequences through GenBbank prior to performing this lab with your students. If you observe difference in the answers, please contact Edvotek® Technical Support at 1-800-EDVOTEK or [email protected]
#1 sequence (20 nucleotides) 5’....ACAAATAGTTACCTTGGAAC.....3’
#1 sequence (30 nucleotides) 5’.... ACAAATAGTTACCTTGGAACATCAAACGTG....3’
#2 sequence 5’...GGACGACGGTATGGAATAGAGAGGAAGTTCCTC...3’
#3 sequence 5’...GATTTGTAATGTAAGTGAATAAGGAATACCATCTA...3’
#4 sequence (bottom) 5’... CAGCTTGGGTGGTCATATGGCCATGGAG...3’
#4 sequence (middle) 5’...GAGACGGAGCTGTAGGTAAAACTTGCCTACTGATCAGTT...3’

Please refer to the kit insert for the Answers to
Study Questions