Embed Size (px)
Citation preview
NBER WORKING PAPER SERIES
DO FOOD STAMPS CAUSE OBESITY? EVIDENCE FROM IMMIGRANT EXPERIENCE
Neeraj Kaushal
Working Paper 12849http://www.nber.org/papers/w12849
NATIONAL BUREAU OF ECONOMIC RESEARCH1050 Massachusetts Avenue
Cambridge, MA 02138January 2007
I thank Robert Kaestner, Jane Waldfogel, Robert LaLonde, Darren Lubotsky, Robin Newberger, InasRashad, and seminar participants at University of Chicago and Columbia University School of SocialWork for their very useful comments. This project was funded by a USDA Food Assistance Researchgrant from the Joint Center for Poverty Research, Northwestern University/University of Chicago.The Research Data Center of the National Center for Health Statistics allowed me to use their researchfacilities to conduct part of the analysis, for which I thank them. The views expressed herein are thoseof the author(s) and do not necessarily reflect the views of the National Bureau of Economic Research.
© 2007 by Neeraj Kaushal. All rights reserved. Short sections of text, not to exceed two paragraphs,may be quoted without explicit permission provided that full credit, including © notice, is given tothe source.
Do Food Stamps Cause Obesity? Evidence from Immigrant ExperienceNeeraj KaushalNBER Working Paper No. 12849January 2007JEL No. H0,I0,I3,I31
ABSTRACT
I use changes in immigrant eligibility for food stamps under the 1996 federal law and heterogeneousstate responses to set up a natural experiment research design to study the effect of food stamps onBody Mass Index (BMI) of adults in immigrant families. I find that in the post-1996 period food stampsuse by foreign-born unmarried mothers with a high school or lower education was 10 percentage pointshigher in states with substitute programs than in states that implemented the federal ban. However,this increase in FSP participation was not associated with any statistically significant difference inBMI. I find that FSP participation was associated a statistically insignificant 0.3 percent increase inBMI among low-educated unmarried mothers.
Neeraj KaushalColumbia UniversitySchool of Social Work1255 Amsterdam AvenueNew York, NY 10027and [email protected]
2
Introduction The nature of nutritional risk faced by low-income families in the US appears to be shifting from
food insecurity to obesity. Prevalence of obesity is high among members of low-income families
(Surgeon General 2001). In a survey of New York City shelters, Luder et al. (1990) found that 39 percent
of the homeless people were obese. Obesity poses high risk for serious diet related chronic diseases and
is the second most common cause of mortality in the country (Surgeon General 2001). In accord with
changes in nutritional risks, public health concern has also shifted from eliminating food insecurity
towards lowering prevalence of obesity.
The primary objective of a nutrition program like Food Stamps is to reduce food insecurity and
meet the nutritional needs of low-income families. Can it cause obesity? The answer is yes if
participants spent a larger proportion of their incomes on food than they would have if in place of food
stamps they received cash. Monthly vouchers of food stamps have been found to affect quantity and
frequency of food consumption, with periods of high consumption immediately following voucher receipt
(Wilde and Ranney 2000, Shapiro 2003).1 Whitmore (2002) finds that between 20 to 30 percent of food
stamps recipients would spend less on food than their food stamp benefit amount if they received cash
instead of stamps. Increased expenditure on food, however, may not necessarily cause obesity. Food
stamps may help poor families buy healthier food based on lean meat, fresh vegetables and fruits, which
may lower obesity. Participation in the Food Stamps Program (FSP) also lowers food insecurity (Borjas
2004, Krueger 2004).2 Therefore, it should lower stress related with food insecurity and if stress causes
obesity, participation in the FSP may also lower obesity (Alaimo et al. 2002, Laitinen and Sovio 2002).
Whether participation in the FSP improves quality of food consumed, and lowers food insecurity
and obesity, or whether it has the unintended consequence of increasing obesity is an issue of serious
public health concern. If the FSP, on which the Federal government spends around $27 billion a year, is a
1 Shapiro (2003) found that caloric intake declines by 10 to 15 percent over the food stamp month, implying preference for immediate consumption. 2 Borjas (2003) found that a 10 percentage point cut in the fraction of the population that received public assistance increased the fraction of food-insecure households by about 5 percentage points.
3
cause of obesity, the program needs to be redesigned to discourage purchase of meals that are
nutritionally inferior, or even be replaced by a cash program that does not lead to distortion in food
consumption.
Previous studies have found that participation in the FSP is associated with obesity among
women in low-income families (Townsend et al. 2001; Gibson 2003, 2004; Chen et al. 2005). The
positive correlation between obesity and use of food stamps could be because individuals who participate
in the FSP are poor and more likely to face food insecurity, consume poor quality food and therefore be
obese (Alaimo et al. 2001). It could also be an outcome of participation in the FSP. Previous research
has not been able to adequately purge the effect of individual circumstances, such as food insecurity
resulting from poverty from the decision to participate in the FSP (Frongillo 2003). To measure the
“causal” effect of food stamps on obesity, we need a plausibly random change in FSP participation that is
unrelated to individual circumstances or societal changes in consumption patterns.
This paper uses changes in immigrant eligibility for the FSP under the 1996 Personal
Responsibility and Work Opportunity Reconciliation Act (PRWORA) and state responses to the federal
law to set up a natural experiment research design to study the effect of food stamps on Body Mass Index
(BMI) of adults in low-income immigrant families. The 1996 federal law denied immigrants access to
food stamps, resulting in a sharp decline in their food stamps participation. In response to PRWORA, a
number of states started substitute FSPs for immigrants who entered the country before the enactment of
the federal policy and a few even provided benefits to new arrivals. If FSP participation leads to obesity,
in the post-PRWORA period prevalence of obesity among immigrants should decline in states that
implemented the federal ban as compared to states that instituted substitute FSPs. Federal law
subsequently restored FSP eligibility to certain groups of pre-PRWORA arrivals. The decline in food
stamps use was also larger among the post-PRWORA arrivals. By the above logic if FSP causes obesity,
the decline in obesity should be greater among newly arrived immigrants. I examine the effect of these
changes in eligibility for the FSP on food stamps participation and BMI of adults in low-income
immigrant families. I use the National Health Interview Survey (NHIS) and the March Current
4
Population Survey (CPS) and apply a two-sample instrumental variables research design to estimate the
association between food stamps participation and BMI of foreign-born adults. Heterogeneous state
responses to the 1996 federal ban are used to instrument for food stamps participation.
There is no previous research on the effect of the FSP on prevalence of obesity among
immigrants, a fast growing demographic group that constitutes over 12 percent of the nation’s population,
and a fifth of its poor. Research suggests that length of residency in the US increases obesity particularly
among low-income immigrants (Gordon-Larsen et al. 2003). This paper will, therefore, also address a
related issue of whether increased prevalence of obesity among low-income immigrants with longer
residency in the US is associated with participation in the FSP.
PRWORA and Immigrant Eligibility to the FSP
Immigrant eligibility for food stamps in the US has undergone several changes over the past
decade. Before August 1996, all legal low-income immigrants were eligible for food stamps. The 1996
PRWORA denied foreign-born non-citizens access to the FSP. However, eight states initiated substitute
FSPs for immigrants who were ineligible under Federal law (Carmody and Dean 1998; Zimmerman and
Tumlin 1999, Gigliotti 2004).3 Seventeen states, including these eight, started substitute programs for
children and elderly among the pre-1996 arrivals. The 1997 Balanced Budget Act restored eligibility to
some vulnerable groups, who were in the country when the 1996 law was enacted. These groups
consisted of the elderly, children under 18, persons with disabilities and refugees and asylees.4 Finally, in
July 2002, the Farm Security and Rural Investment Act (FSRIA) restored Food Stamps eligibility to all
immigrant children; immigrants with disabilities as well as all those in the country for at least five years.
Restoring eligibility under FSRIA, however, has increased participation only marginally.
3 These eight states were: CT, ME, MA, MN, NE, RI, WA and WI. 4 The federal initiative was followed by Illinois and New Jersey allowing Food Stamps to the parents of children receiving food stamps, provided they entered the US before 1996; California extending the benefit to all legal immigrants.
5
As expected, food stamps use by foreign-born adults fell dramatically since 1996. In 1995, 19
percent of the foreign-born adults with a high school or lower education received food stamps; by 2001,
the proportion was reduced to 8 percent.5 During the same period, food stamps use by the US born adults
with a high-school or lower education declined from 15 to 10 percent. Currie and Grogger (2001) find
that among low-income families, 20 percent of the decline in FSP participation can be attributed to lower
unemployment and 30 percent to the 1996 welfare reform. Although PRWORA did not alter FSP
eligibility rules for US citizens, it raised the transaction cost of obtaining food stamps for welfare leavers,
discouraging them to apply for food stamps even when eligible.6 Since 1996, able-bodied adults without
dependents are also subject to stiff work requirements limiting their participation in the FSP to three to six
months unless they are enrolled in a work or training activity.
Like natives, immigrant participation in the FSP was affected by lower unemployment, minimum
work requirements and higher transaction costs. They were also affected by a fourth factor: the special
provision in PRWORA that denied immigrants food stamps, and its chilling effect that created an
atmosphere of fear and confusion among immigrants, inducing them not to apply for benefits even when
eligible (Fix and Passel 1999; Kaushal and Kaestner 2005). Surveys by the National Health Law Program
and the National Immigration Law Center indicate that fear of deportation from the US discouraged
immigrants from obtaining public benefits even when eligible (Schlosberg and Wiley 1998).
Methodology
Food Stamps Eligibility and Obesity
The hypothesis underlying this empirical analysis is straightforward: changes in federal and state
eligibility rules for food stamps caused a random change in food stamps utilization among immigrants.
This may have induced immigrants to change quantity, quality and frequency of food consumption, which
5 Author’s computation based on March Current Population Surveys. 6 Since state welfare agencies also administer the FSP, the transaction cost of obtaining food stamps is high for welfare leavers than non-leavers. Zedlewski and Brauner (1999) find that the decline in food stamps participation was higher among welfare leavers than others.
6
may have affected their Body Mass Index (BMI is defined as weight in kilograms divided by the square
of height measured in meters). I begin the analysis by first estimating the effect of changes in federal and
state eligibility rules for immigrants on their FSP participation using the March Current Population
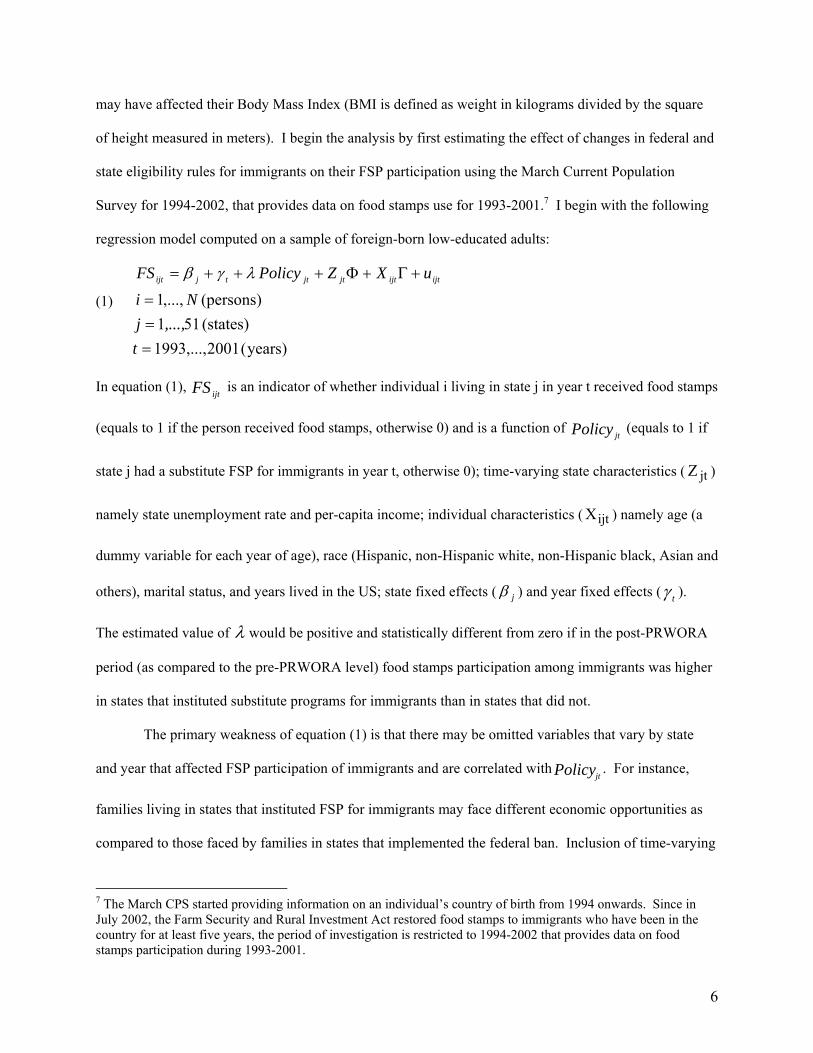
Survey for 1994-2002, that provides data on food stamps use for 1993-2001.7 I begin with the following
regression model computed on a sample of foreign-born low-educated adults:
(1)
)years(2001,...,1993(states) 511(persons),...,1
===
+Γ+Φ+++=
t,...,j
NiuXZPolicyFS ijtijtjtjttjijt λγβ
In equation (1), ijtFS is an indicator of whether individual i living in state j in year t received food stamps
(equals to 1 if the person received food stamps, otherwise 0) and is a function of jtPolicy (equals to 1 if
state j had a substitute FSP for immigrants in year t, otherwise 0); time-varying state characteristics ( jtZ )
namely state unemployment rate and per-capita income; individual characteristics ( ijtX ) namely age (a
dummy variable for each year of age), race (Hispanic, non-Hispanic white, non-Hispanic black, Asian and
others), marital status, and years lived in the US; state fixed effects ( jβ ) and year fixed effects ( tγ ).
The estimated value of λ would be positive and statistically different from zero if in the post-PRWORA
period (as compared to the pre-PRWORA level) food stamps participation among immigrants was higher
in states that instituted substitute programs for immigrants than in states that did not.
The primary weakness of equation (1) is that there may be omitted variables that vary by state
and year that affected FSP participation of immigrants and are correlated withjtPolicy . For instance,
families living in states that instituted FSP for immigrants may face different economic opportunities as
compared to those faced by families in states that implemented the federal ban. Inclusion of time-varying
7 The March CPS started providing information on an individual’s country of birth from 1994 onwards. Since in July 2002, the Farm Security and Rural Investment Act restored food stamps to immigrants who have been in the country for at least five years, the period of investigation is restricted to 1994-2002 that provides data on food stamps participation during 1993-2001.
7
state characteristics such as state unemployment rate and per capita income are expected to control for
some of these effects.
To control for unobserved time-varying factors contemporaneous with the variablejtPolicy , I
adopt a difference-in-difference research design. This approach involves selecting a target group, i.e. a
group most affected by the policy change, and a comparison group, which is similar to the target group
but unaffected by the policy. An equation similar to equation (1) is estimated for the target and
comparison groups. Since FSP eligibility rules for the comparison group are unchanged, the estimated
coefficient for variable jtPolicy ( Cλ ) for this group captures the effect of omitted variables. To
eliminate the effect of these omitted variables, I subtract Cλ from the estimated value of the coefficient
for jtPolicy ( TRλ ) for the target group and arrive at the difference-in-difference estimate. The
identifying assumption of the research design is that in the post-PRWORA period, unobserved differences
between states that instituted substitute programs and states that did not, have the same effect on the target
and comparison groups, after controlling for state and time fixed effects. The difference-in-difference
estimate is given by:
(2) CTRmpDD λλλ −==
The DD estimate in equation (2) can also be obtained in one step using the following regression:
(3)
ijtijtjt
jtmpmtpttjttjijt
uXZ
TrPolicyTrTrPostPostPolicyFS~~~
)*(*~~~
+Γ+Φ
+++++++= λλλλλγβ
There are two additional variables in equation (3) as compared to equation (1): Tr is a dummy variable
indicating whether an individual belongs to the target group comprising of low-educated immigrants
and tPost , an indicator for whether an observation is taken from the post-PRWORA period.
Equation (3) is relatively restrictive as compared to equation (2) in that it restricts the effect of
other explanatory variables to be the same for the target and comparison groups. In reality, in the
empirical analysis, I allow the effect of individual characteristics to be different for the two groups. The
8
effect of state unemployment rate, per capita income and state and year fixed effects are restricted to be
the same as statistical tests allow the restriction. Note that equation (3) allows the effect of PRWORA to
be different for the target and comparison groups (measured by variable Postt *Tr). This allows for
controlling unobserved factors contemporaneous with PRWORA that may have affected the two groups
differently.
Since food stamps dependence varies by gender, all analysis is done separately for men and
women. I also repeat the analysis restricting the target and comparison groups to low-educated unmarried
mothers, as they are a highly vulnerable group, most likely to be in poverty and as shown later in this
analysis, foreign-born unmarried mothers were most affected by the special immigrant provisions in
PRWORA.
In equation (3), the difference-in-difference coefficient is given by mpλ and should be positive
and significant if immigrant food stamps participation increased in states that instituted substitute
programs as compared to those that implemented the federal ban. It is the estimate for mpλ that
motivates the second part of the analysis, i.e. whether random changes in FSP participation affected
individual BMI. In the empirical analysis, an equation similar to (3) is used to estimate the effect of
changes in immigrant eligibility for food stamps on their BMI using the National Health Interview Survey
for 1993-2001 and is given by equation (4).
(4)
ijtijtjt
jtmpmtpttjttjijt
uXZ
TrPolicyTrTrPostPostPolicyBm
ˆˆˆ)*(ˆˆ*ˆˆˆˆˆ
+Γ+Φ
+++++++= λλλλλγβ
In equation (4) ijtBm denotes the log BMI of individual i living in state j in year t, and symbol ^ is used
to distinguish coefficients in equation (3) from those in equation (4).8
Selection and validity of treatment and comparison group 8 I also repeated the analysis with BMI as the outcome, and the estimated coefficients were similar. Since it is easier to interpret the effect on log BMI, I have elected to present estimates for log BMI for most of the analysis.
9
The soundness of the difference-in-difference research design depends on the validity of the
target and comparison groups. The target of the special provisions in PRWORA is low-income
immigrant families who are at high risk of being on food stamps. I use education as a proxy for income
and select low-educated (education≤12 years of schooling) foreign-born adults as the target group.
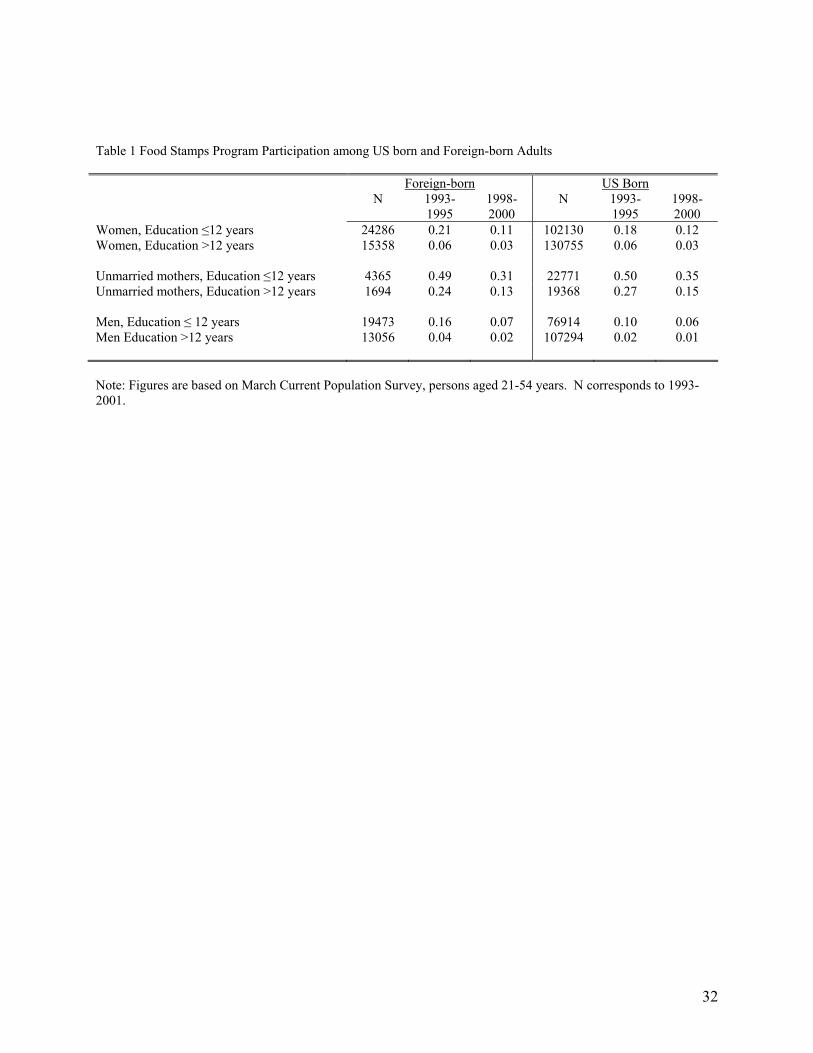
According to the March CPS, during 1993-1995, three years prior to PRWORA, 21 percent of the
foreign-born low-educated women, 49 percent of the foreign-born low-educated unmarried mothers and
16 percent of the low-educated foreign-born men received food stamps.9 During 1998-2000, after the
implementation of welfare reform, all the three groups registered a sharp decline in FSP participation with
the decline being greater among low-educated unmarried mothers (Table 1).
Low-educated natives are similar to the target group in terms of their dependence on food stamps.
In the pre-PRWORA period, 18 percent of low-educated native women, 50 percent of the low-educated
native unmarried mothers and 10 percent of the low-educated native men received food stamps (Table 1).
More importantly, during the period of the study, their eligibility for the FSP was relatively unchanged.
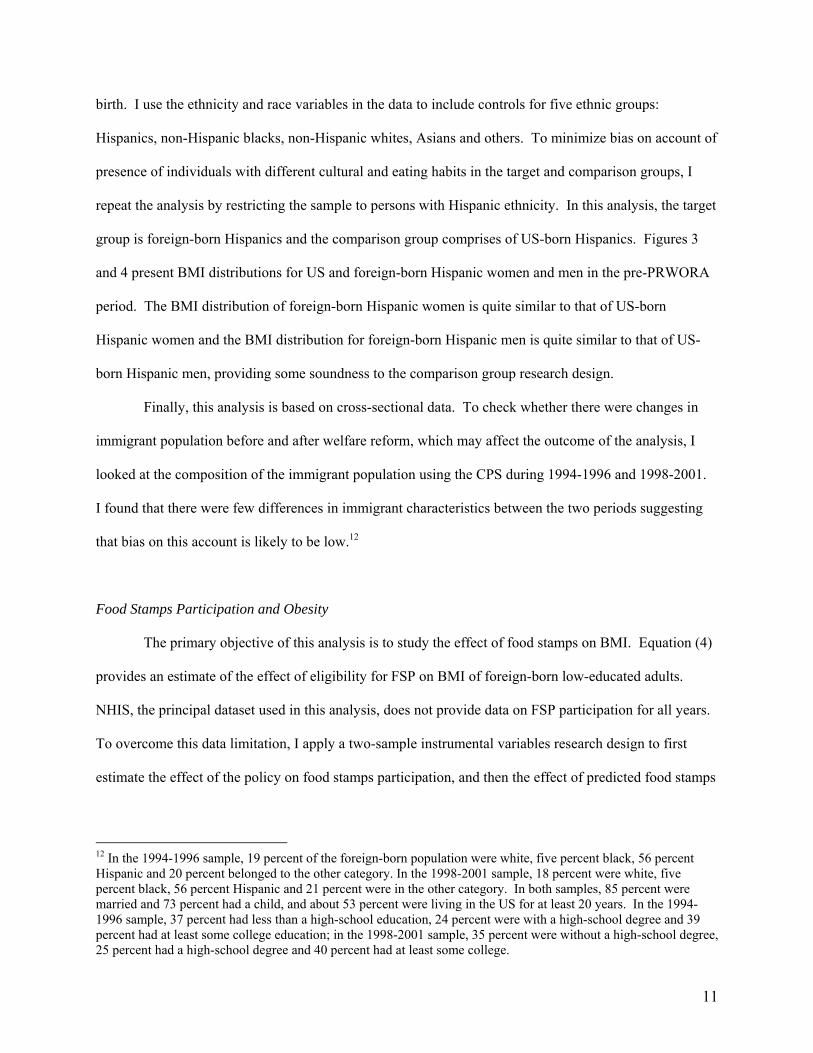
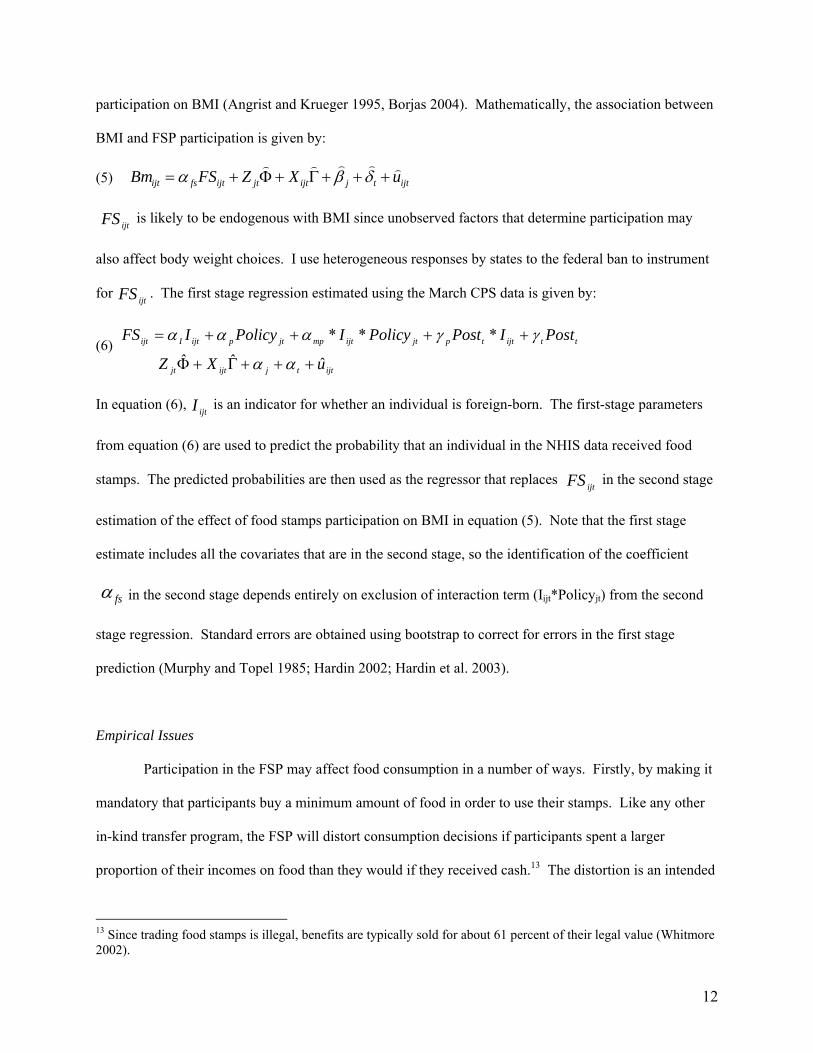
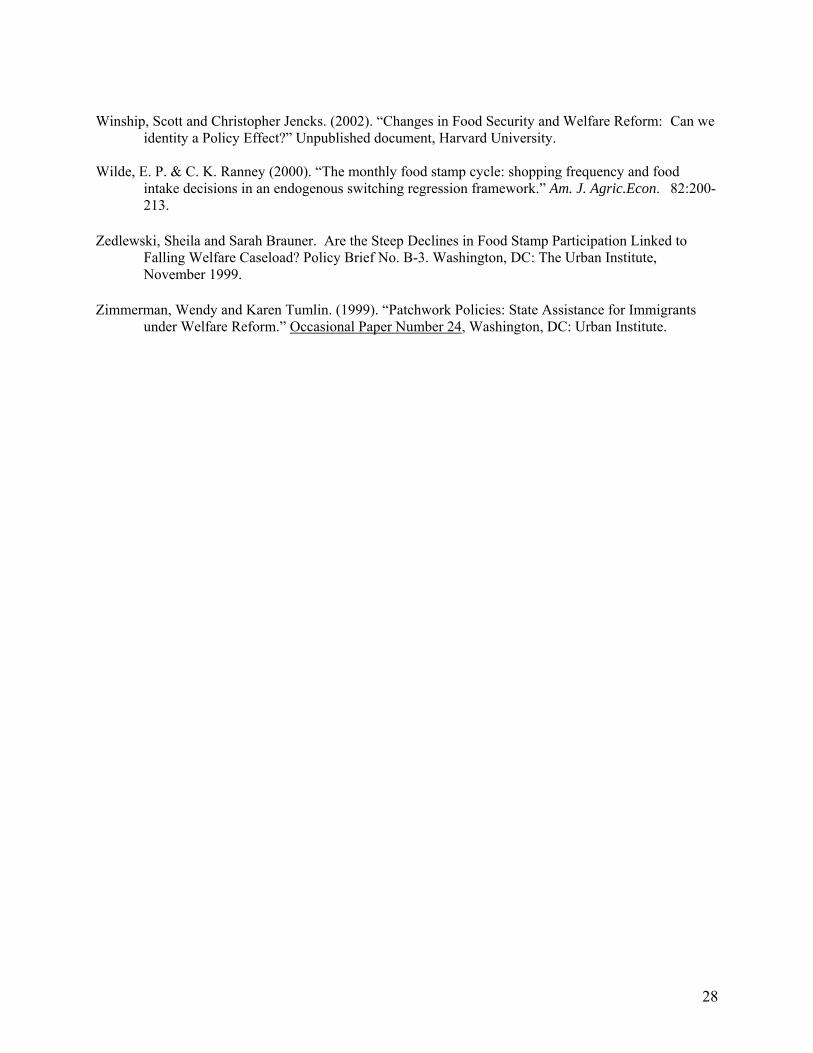
Figures 1 and 2 present BMI distribution for the target and comparison groups of women and men
in the pre-PRWORA period (1992-1995). BMI distribution of foreign-born low-educated women (men)
are quite similar to the BMI distribution of native low-educated women (men), providing some evidence
that the comparison group approach is appropriate to examine the effect of food stamps eligibility on
BMI.10
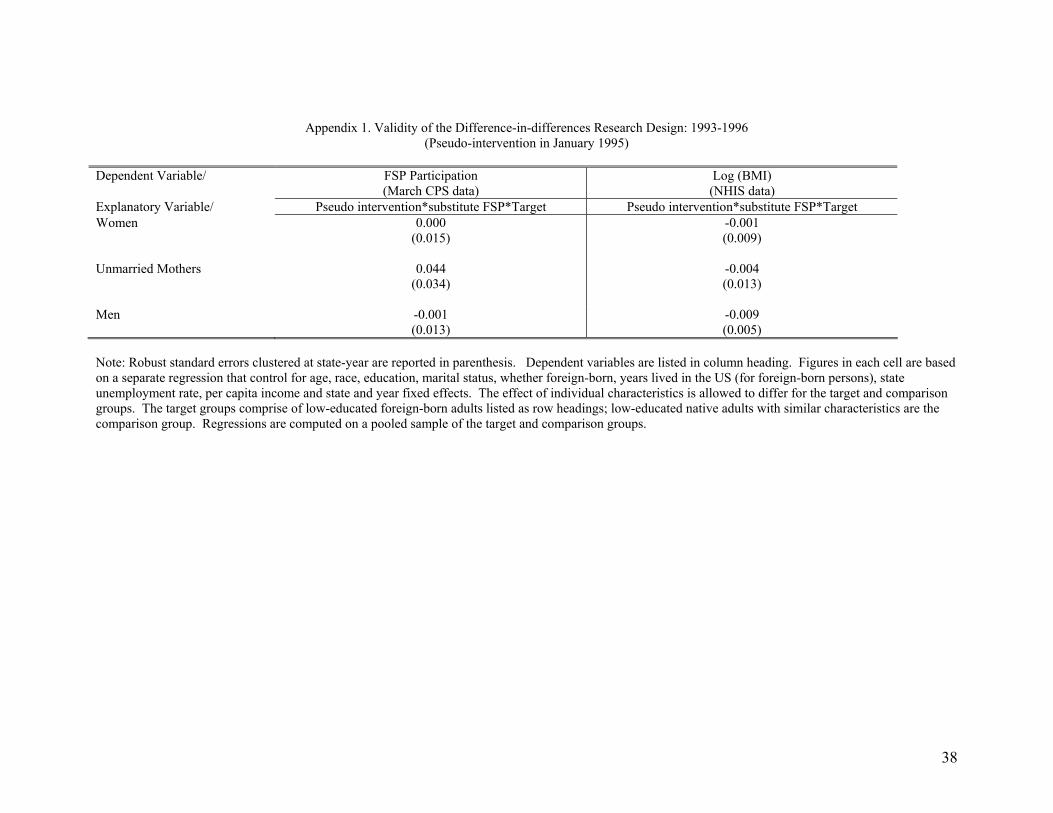
To further test the validity of the research design, I use the March CPS for 1994-1997 (that
provides food stamps participation for 1993-1996) and National Health Interview Survey for 1993-1996
and conduct a placebo test with a pseudo policy intervention dated January 1995. Similar models as
9 FSP participation is restricted to families with a total gross income no more than 130 percent of the federal poverty line, with a net family income less than or equal to federal poverty line and household assets less than $2000. 10 The seemingly small differences at the higher ends of the distributions for the target and comparison groups, however, make the identifying assumptions in difference-in-difference analysis more restrictive for outcomes like obesity. I did the analysis with two other outcomes: whether obese or overweight; and whether underweight. The findings are similar to those obtained using log BMI as outcome. For space considerations, I do not present results with these two outcomes.
10
outlined in equations (3) and (4) are computed with food stamps participation and log BMI as outcomes
using the above target and comparison group. Of interest is the coefficient on the interaction term
between three variables: a dummy variable indicating whether the observation is taken from the post-
intervention period, a dummy variable indicating a respondent’s membership to the target group and a
dummy variable indicating whether the respondent lives in a state that had a substitute food stamp
program for immigrants in the post-1996 period. Since there was no change in immigrant eligibility for
food stamps during this period, the coefficient for the triple interaction term should be zero. Appendix 1
has the result of this analysis and shows that the coefficient is indeed modest and statistically insignificant
for both outcomes for foreign-born low-educated unmarried mothers, women and men. This provides
some validity to the research design.
As a second test, I use variation in the severity of PRWORA towards immigrants by duration of
their stay in the US to study if trends in BMI were different for recent immigrants than for those who have
been in the country for more than five years. As mentioned earlier, while federal policy denied food
stamps to all immigrants, a number of states restored benefits to immigrants who have been in the country
for at least five years. By the end of 1998, Federal government had also restored food stamps eligibility
to certain vulnerable populations of pre-1996 immigrants. Besides, PRWORA did not change eligibility
rules for foreign-born US citizens, who continued to be eligible for the FSP, just like the US born.11 By
law, legal permanent residents can apply for citizenship five years after receiving the permanent resident
status. Therefore, among the foreign-born who have been in the country for more than five years, a
substantial proportion were eligible for food stamps in the post-PRWORA period either on account of
their citizenship status or due to subsequent changes in federal and state policies. Thus, if FSP
participation increased obesity, denial of food stamps under PRWORA should have lowered BMI of
newly arrived immigrants by a larger proportion than the BMI of “older” immigrants.
Another issue relates to the influence of country/region of origin on consumption patterns. NHIS,
the primary data used in this analysis, does not provide information on a respondent’s country/region of 11 The NHIS data do not identify whether a respondent is citizen for most years covered by this study.
11
birth. I use the ethnicity and race variables in the data to include controls for five ethnic groups:
Hispanics, non-Hispanic blacks, non-Hispanic whites, Asians and others. To minimize bias on account of
presence of individuals with different cultural and eating habits in the target and comparison groups, I
repeat the analysis by restricting the sample to persons with Hispanic ethnicity. In this analysis, the target
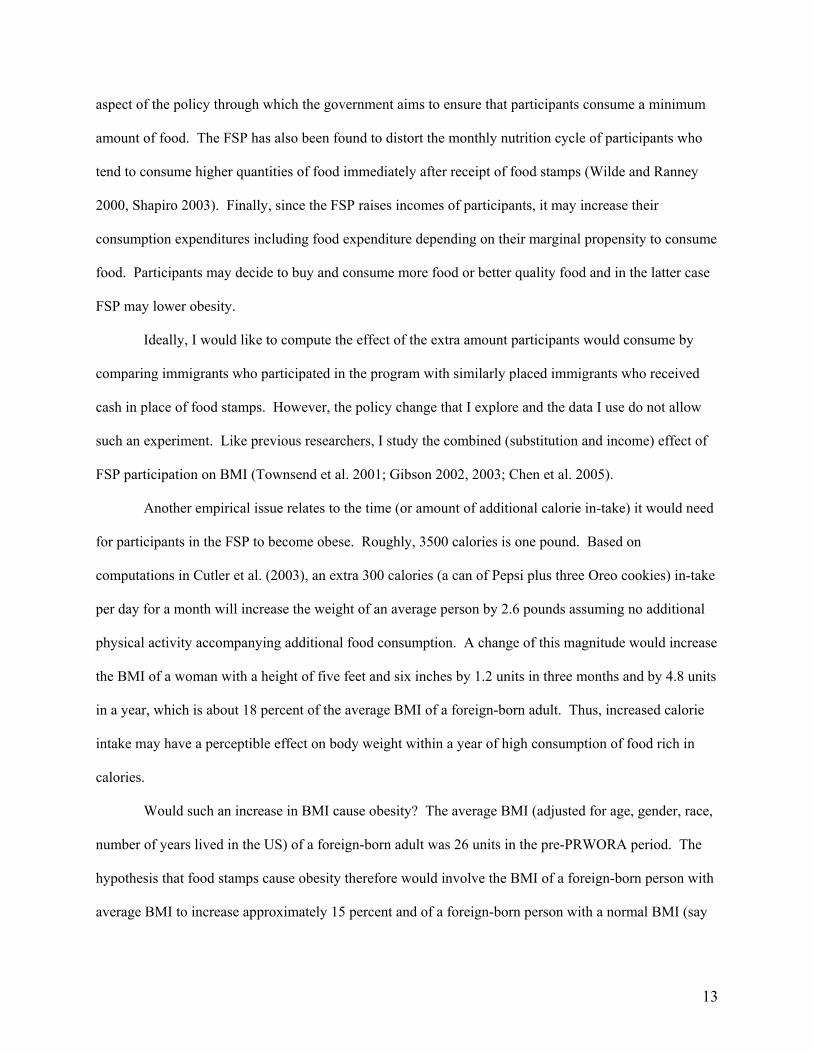
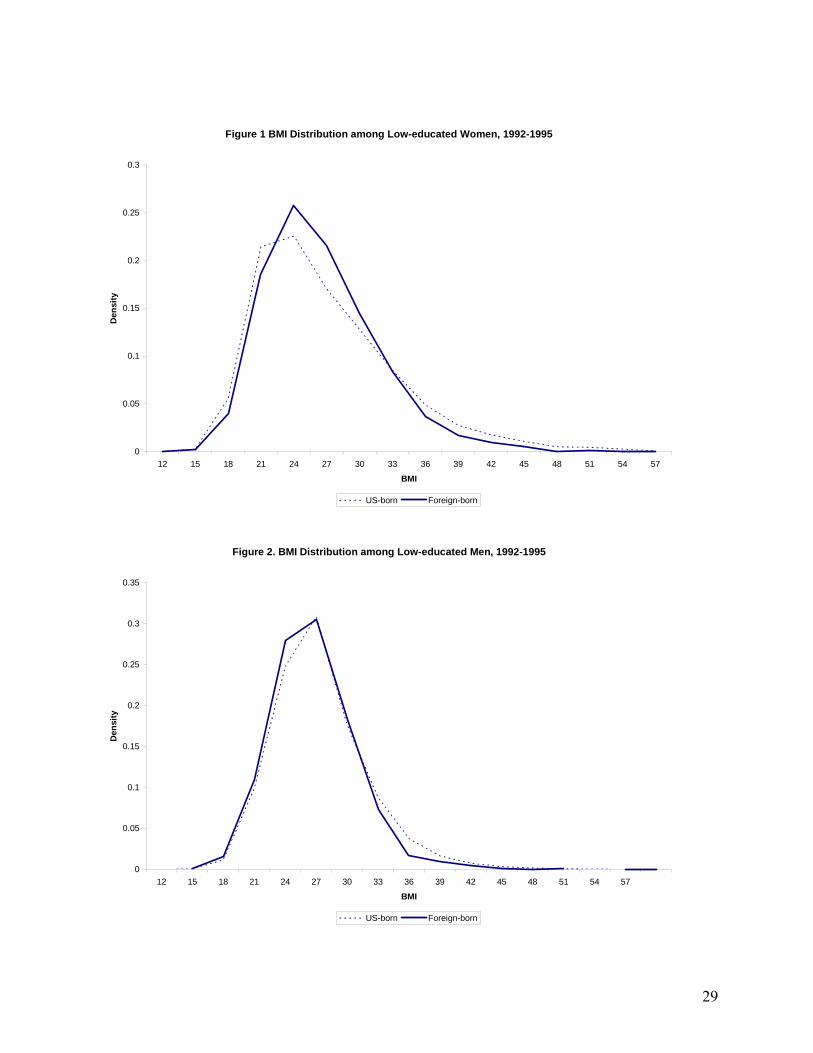
group is foreign-born Hispanics and the comparison group comprises of US-born Hispanics. Figures 3
and 4 present BMI distributions for US and foreign-born Hispanic women and men in the pre-PRWORA
period. The BMI distribution of foreign-born Hispanic women is quite similar to that of US-born
Hispanic women and the BMI distribution for foreign-born Hispanic men is quite similar to that of US-
born Hispanic men, providing some soundness to the comparison group research design.
Finally, this analysis is based on cross-sectional data. To check whether there were changes in
immigrant population before and after welfare reform, which may affect the outcome of the analysis, I
looked at the composition of the immigrant population using the CPS during 1994-1996 and 1998-2001.
I found that there were few differences in immigrant characteristics between the two periods suggesting
that bias on this account is likely to be low.12
Food Stamps Participation and Obesity
The primary objective of this analysis is to study the effect of food stamps on BMI. Equation (4)
provides an estimate of the effect of eligibility for FSP on BMI of foreign-born low-educated adults.
NHIS, the principal dataset used in this analysis, does not provide data on FSP participation for all years.
To overcome this data limitation, I apply a two-sample instrumental variables research design to first
estimate the effect of the policy on food stamps participation, and then the effect of predicted food stamps
12 In the 1994-1996 sample, 19 percent of the foreign-born population were white, five percent black, 56 percent Hispanic and 20 percent belonged to the other category. In the 1998-2001 sample, 18 percent were white, five percent black, 56 percent Hispanic and 21 percent were in the other category. In both samples, 85 percent were married and 73 percent had a child, and about 53 percent were living in the US for at least 20 years. In the 1994-1996 sample, 37 percent had less than a high-school education, 24 percent were with a high-school degree and 39 percent had at least some college education; in the 1998-2001 sample, 35 percent were without a high-school degree, 25 percent had a high-school degree and 40 percent had at least some college.
12
participation on BMI (Angrist and Krueger 1995, Borjas 2004). Mathematically, the association between
BMI and FSP participation is given by:
(5) ijttjijtjtijtfsijt uXZFSBm )))))+++Γ+Φ+= δβα
ijtFS is likely to be endogenous with BMI since unobserved factors that determine participation may
also affect body weight choices. I use heterogeneous responses by states to the federal ban to instrument
for ijtFS . The first stage regression estimated using the March CPS data is given by:
(6) ijttjijtjt
ttijttpjtijtmpjtpijtIijt
uXZ
PostIPostPolicyIPolicyIFS
ˆˆˆ***
+++Γ+Φ
++++=
αα
γγααα
In equation (6), ijtI is an indicator for whether an individual is foreign-born. The first-stage parameters
from equation (6) are used to predict the probability that an individual in the NHIS data received food
stamps. The predicted probabilities are then used as the regressor that replaces ijtFS in the second stage
estimation of the effect of food stamps participation on BMI in equation (5). Note that the first stage
estimate includes all the covariates that are in the second stage, so the identification of the coefficient
fsα in the second stage depends entirely on exclusion of interaction term (Iijt*Policyjt) from the second
stage regression. Standard errors are obtained using bootstrap to correct for errors in the first stage
prediction (Murphy and Topel 1985; Hardin 2002; Hardin et al. 2003).
Empirical Issues
Participation in the FSP may affect food consumption in a number of ways. Firstly, by making it
mandatory that participants buy a minimum amount of food in order to use their stamps. Like any other
in-kind transfer program, the FSP will distort consumption decisions if participants spent a larger
proportion of their incomes on food than they would if they received cash.13 The distortion is an intended
13 Since trading food stamps is illegal, benefits are typically sold for about 61 percent of their legal value (Whitmore 2002).
13
aspect of the policy through which the government aims to ensure that participants consume a minimum
amount of food. The FSP has also been found to distort the monthly nutrition cycle of participants who
tend to consume higher quantities of food immediately after receipt of food stamps (Wilde and Ranney
2000, Shapiro 2003). Finally, since the FSP raises incomes of participants, it may increase their
consumption expenditures including food expenditure depending on their marginal propensity to consume
food. Participants may decide to buy and consume more food or better quality food and in the latter case
FSP may lower obesity.
Ideally, I would like to compute the effect of the extra amount participants would consume by
comparing immigrants who participated in the program with similarly placed immigrants who received
cash in place of food stamps. However, the policy change that I explore and the data I use do not allow
such an experiment. Like previous researchers, I study the combined (substitution and income) effect of
FSP participation on BMI (Townsend et al. 2001; Gibson 2002, 2003; Chen et al. 2005).
Another empirical issue relates to the time (or amount of additional calorie in-take) it would need
for participants in the FSP to become obese. Roughly, 3500 calories is one pound. Based on
computations in Cutler et al. (2003), an extra 300 calories (a can of Pepsi plus three Oreo cookies) in-take
per day for a month will increase the weight of an average person by 2.6 pounds assuming no additional
physical activity accompanying additional food consumption. A change of this magnitude would increase
the BMI of a woman with a height of five feet and six inches by 1.2 units in three months and by 4.8 units
in a year, which is about 18 percent of the average BMI of a foreign-born adult. Thus, increased calorie
intake may have a perceptible effect on body weight within a year of high consumption of food rich in
calories.
Would such an increase in BMI cause obesity? The average BMI (adjusted for age, gender, race,
number of years lived in the US) of a foreign-born adult was 26 units in the pre-PRWORA period. The
hypothesis that food stamps cause obesity therefore would involve the BMI of a foreign-born person with
average BMI to increase approximately 15 percent and of a foreign-born person with a normal BMI (say
14
22 units) to rise by over 36 percent. However, for an overweight adult a much smaller increase in BMI
may cause obesity.
Data
The primary dataset used in the analysis is the National Health Interview Survey (NHIS) for the
years 1992-2001. NHIS is a continuing nationwide survey of the U.S. civilian non-institutionalized
population. During a year, the survey is conducted on a sample of 36,000 to 47,000 households,
including 92,000 to 125,000 persons. I restrict the analysis to men and women aged 21-54 years. Before
1997, from every household a respondent provided data on the height and weight of every adult person in
the household. Due to considerations about the accuracy of information on height and weight, the sample
of analysis for 1990-1996 is restricted to self-reports of the respondents, and respondents’ report on their
family members are excluded from the analysis. Since 1997, information on height, weight and BMI is
available for a randomly selected adult per household, who is told to complete the Sample Adult Module
of the survey. Self-reported measures of height and weight suffer from reporting bias. Following
previous research all regressions adjust for age and gender to minimize reporting bias (Kuczmarski 2001).
One strength of the NHIS dataset is that it provides information on whether a respondent is
foreign-born and how long he/she has lived in the U.S. Unfortunately, NHIS do not provide data on
whether a foreign-born person is citizen for all the years used in this analysis. Therefore, it is not possible
to control for a respondent’s citizenship status. This limitation is partly overcome by controlling for the
number of years lived in the U.S. since citizenship is highly correlated with duration of residence in the
US. NHIS do not provide a foreign-born person’s country of birth, but it provides detailed information on
his/her ethnicity, which is used to define the following ethnic groups: non-Hispanic black, non-Hispanic
white, Hispanic, Asian and others.
NHIS provides a rich set of demographic variables that are used to define the target and
comparison groups and to construct control variables. Variables on family relationships are used to
identify women with children less than 18. Because of confidentiality and disclosure rules, the National
15
Center for Health Statistics does not provide state identifiers in the public use NHIS data. State identifiers
were obtained from National Center for Health Statistics to complete the analysis.14
One limitation of NHIS is that it does not provide information on respondents’ FSP participation
for all the years covered by this study. As mentioned, I use the March CPS data for 1994-2002 (that
provides information on food stamps participation for 1993-2001) to study the effect of immigrant
eligibility under state and federal programs on FSP participation.
State of residence indicators are used to merge the following information with NHIS and March
CPS: state and federal FSP eligibility policy with regard to immigrants, state unemployment rate and real
per-capita income. The data on immigrant eligibility for food stamps are drawn from Zimmermann and
Tumlin (1999) and the State Documentation Project of the Center on Budget and Policy Priorities
(www.cbpp.org).
Results
Descriptive analysis
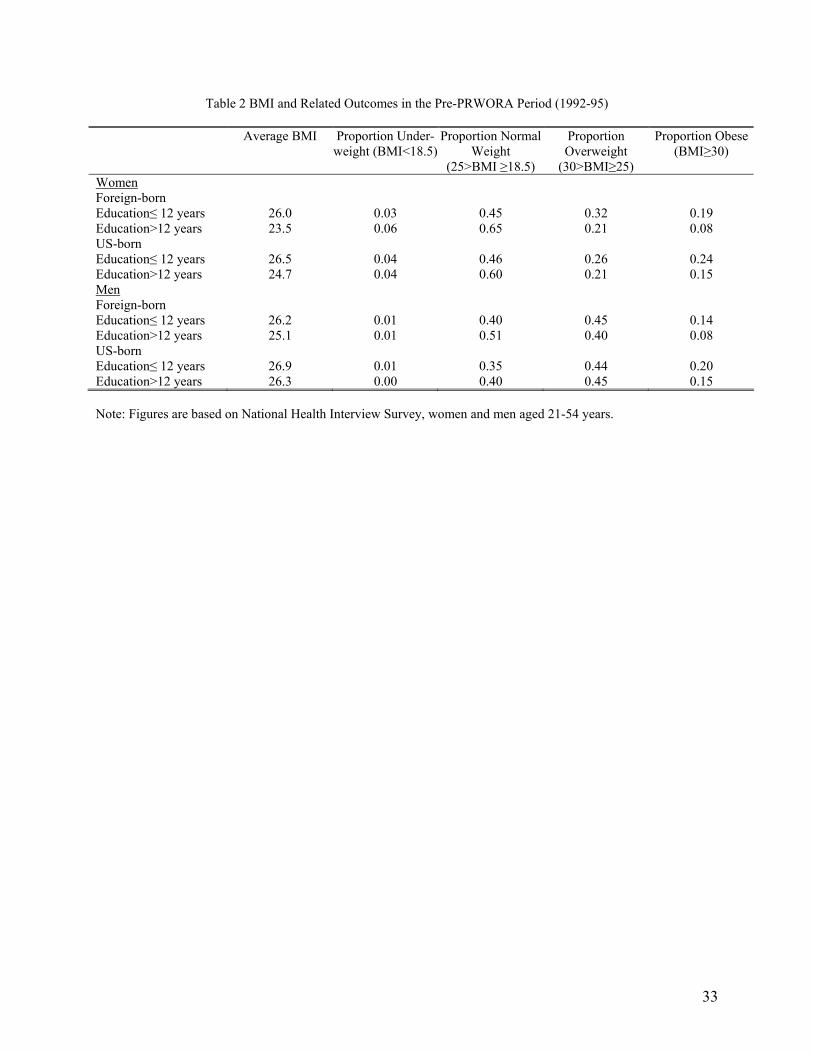
Table 2 provides descriptive statistics on BMI and related outcomes for various demographic
groups in the pre-PRWORA period. A number of points merit comment. One, among foreign-born
women those with a higher education are more likely to be underweight. Among men, foreign-born as
well as US-born, and native women, a tiny proportion is under-weight but there is no apparent correlation
between education and the propensity to be underweight. Two, for foreign-born and US born, men as
well as women, the other three BMI related outcomes, normal weight, overweight and obesity, are
correlated with education. For instance, for all the four groups, proportion with normal weight increased
with education, and prevalence of obesity and overweight decreased as education increased. And finally,
US born women (and men) are more likely to be obese as compared to foreign-born women (men) with
corresponding education levels.
14 I thank the Research Data Center, NCHS for providing the state identifiers to complete the analysis.
16
In short, Table 2 suggests that obesity and overweight are more likely to exist in low-income
families, and that among foreign-born women, prevalence of being underweight is higher among the high-
educated than the low-educated. The need for FSP is, therefore, less pressing if the aim is simply to
eliminate prevalence of underweight in low-income families. But food stamps may enable poor families
to buy better quality food, which may lower obesity. At the same time it is likely that food stamps may
increase frequency and quantity of food consumed without affecting quality, which may increase
prevalence of obesity among the poor (Gibson 2002, Chen et al. 2005; Townsend et al. 2001).
Trends in FSP participation
I begin by first examining the effect of PRWORA on FSP participation since it is the causal link
between PRWORA and declines in FSP participation among immigrants that has motivated this study.
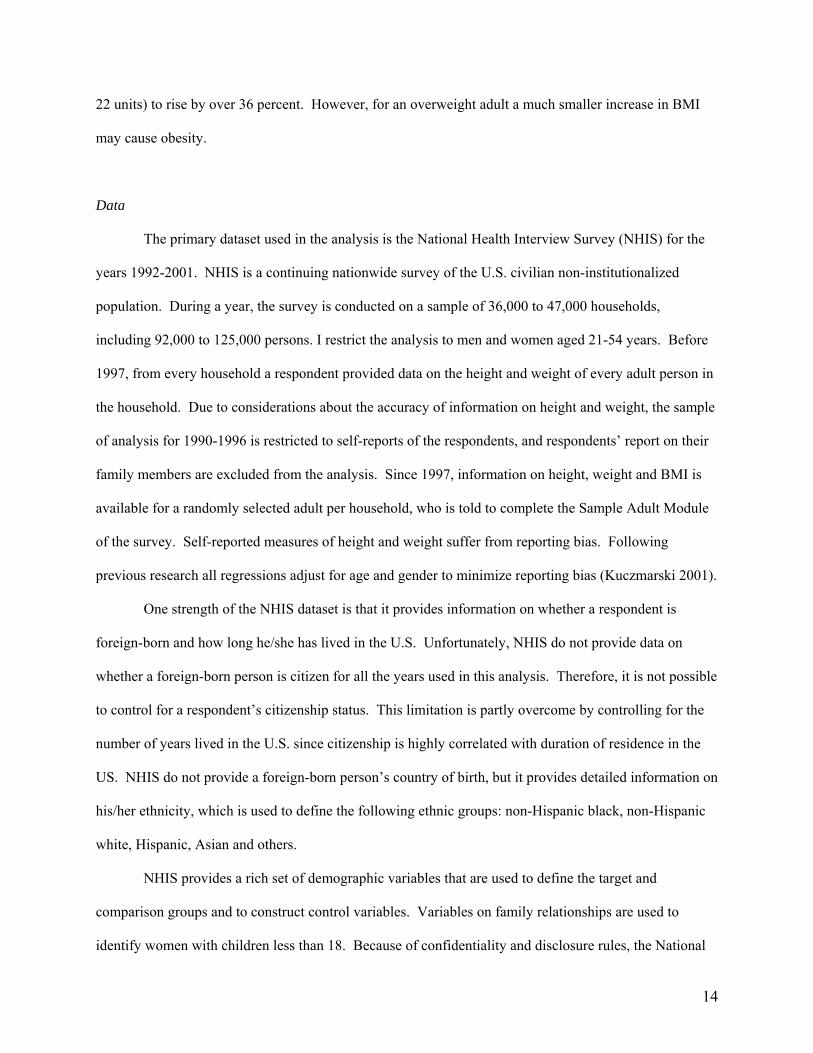
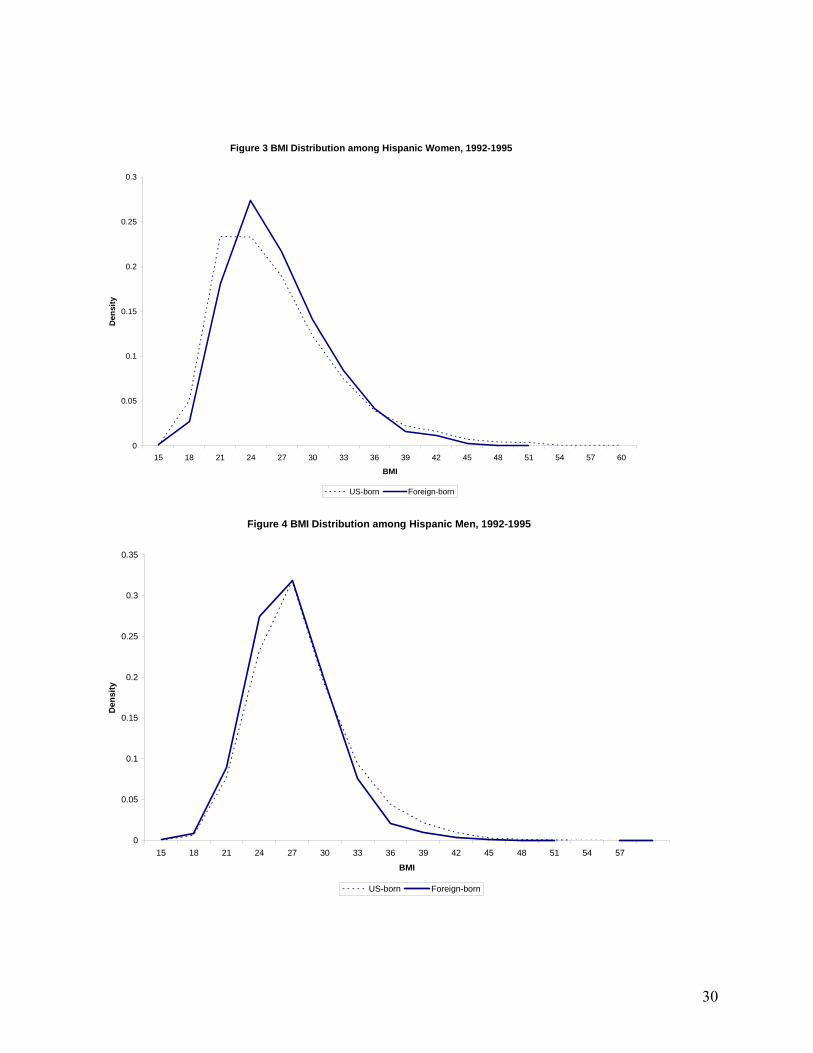
Figure 5 presents trends in food stamps participation in households headed by low-educated (with a high-
school or lower education) foreign-born and US-born adults, based on the March series of the CPS, and
shows that PRWORA was associated with a decline in immigrant dependence on food stamps. In 1993,
FSP participation among the foreign-born was about four percentage points higher than FSP participation
among the US-born. Both groups experienced a decline after 1995, but the decline was steeper for
foreign-born adults. As a result, by 2000, low-educated US-born adults were two percentage points more
likely to use food stamps than low-educated foreign-born adults; and the gap between the two groups has
remained at this level during 2000-2003.
Figure 6 presents the trend in FSP participation for unmarried low-educated mothers, a highly
vulnerable group, of whom about 50 percent received food stamps in the pre-PRWORA period.
Participation among the US-born group declined steadily during 1993-2000 and has been rising since
then. In comparison, FSP participation among foreign-born unmarried mothers increased during 1993-
1995, followed by a sharp decline during 1996-2001 and a modest rise since 2001. During 1993-1995,
before the enactment of PRWORA, foreign-born and US-born low-educated unmarried mothers had
roughly the same level of food stamps participation. During 2001-2003, five years after the
17
implementation of PRWORA, US-born, low-educated unmarried mothers were nine percentage points
more likely to receive food stamps as compared to foreign-born low-educated unmarried mothers. Did
the decline in FSP participation resulting from changes in immigrant eligibility affect their BMI? Next, I
examine this issue using multivariate regression models.
Multivariate analysis
I first examine the pre- versus post-PRWORA trend in average BMI of various demographic
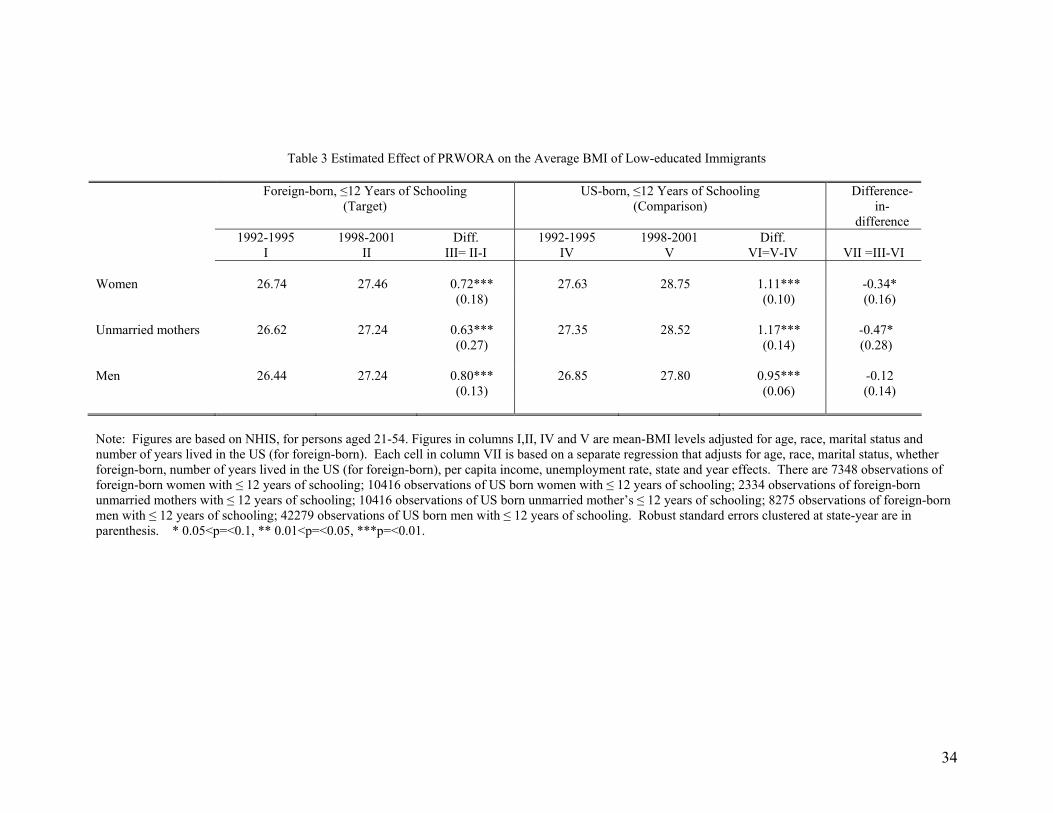
groups defined by nativity and education, using the NHIS data. Columns labeled I to VI in Table 3
present average BMI (adjusted for age, education, ethnicity, marital status, and for the foreign-born, the
number of years lived in the US) of the target and comparison groups, averaged for four years before
PRWORA (1992-1995) and four years after the policy change (1998-2001) and the difference in these
rates between the two periods. Column labeled VII presents the difference-in-difference estimates based
on regressions that include controls for state unemployment rate, state per capita income, state and year
fixed effects, in addition to the demographic controls mentioned above. Difference-in-difference
estimates are based on separate regressions. In these regressions, the effects of unemployment rate, per
capita income, state and year effects are restricted to be the same for the target and comparison groups.
However, unrestricted DD estimates can be computed by simply subtracting the pre- to post PRWORA
change in BMI for the comparison groups from the pre- to post PRWORA change in BMI for the target
groups.
Row 1 shows that in the post-PRWORA period, the average BMI of foreign-born low-educated
women increased by 2.7 percent (0.72 BMI units). During this period, the average BMI of low-educated
U.S. born women increased by 4 percent (1.11 BMI units). The resulting DD estimate is a statistically
significant 1.3 percent (-0.34 units) decline in BMI.
Low-educated, foreign-born unmarried mothers are more likely to be poor and therefore more
likely to be dependent on food stamps. As noted in Table 1 and Figure 6, this group also experienced a
sharp decline in FSP participation in the post-PRWORA period. Row 2 in Table 3 suggests that like all
18
women, low-educated unmarried mothers too experienced increase in BMI after PRWORA. Again, the
increase was relatively lower (2.4 percent or 0.63 BMI units) for the target group of foreign-born
unmarried mothers than for the comparison group of US born unmarried mothers (4.3 percent or 1.17
units). The difference-in-difference estimate indicates that PRWORA was associated a statistically
significant 1.8 percent decline in average BMI of foreign-born unmarried mothers with a high-school or
lower education with US-born unmarried mothers with similar education as comparison.
Row 3 in Table 3 presents the analysis for foreign-born men. As in the case of women, BMI of
men too was rising during the nineties. Also, similar to the experience of women, the rise in BMI among
foreign-born men with a high school or lower education was slightly less than the increase experienced by
native men with similar education. The difference-in-difference estimates suggest that PRWORA was
associated with a statistically insignificant 0.5 percent decline in the average BMI of low-educated
foreign-born men.
To sum up, analysis in Table 3 suggests that PRWORA was associated with a decline in BMI of
low-educated foreign-born women with low-educated native women as the comparison group, and the
decline was higher in absolute terms (point estimate) when the sample of analysis was restricted to
unmarried mothers. In the analysis on foreign-born men, PRWORA was associated with modest and
statistically insignificant effect on BMI.
PRWORA changed immigrant eligibility for a number of means-tested programs, including cash
welfare, food stamps and Medicaid. Previous research shows that the decline in dependence on means-
tested programs was greater for immigrants than natives (Fix and Haskins 2002; Kaestner and Kaushal
2006). Estimates presented in Table 3 could be on account of these other changes. To isolate the effect
of FSP participation from the effect of these other factors, I now examine if trends in immigrant BMI
differed in states that created substitute FSP for immigrants as compared to states that observed the
federal ban, using models outlined in equations (3) and (4).
Food Stamps Eligibility, Participation and BMI
19
In this analysis, I compare the difference-in-difference estimate for the target group in states that
created substitute programs for foreign-born persons with the difference-in-difference estimate for the
target group that lived in states that banned food stamps to immigrants. Since the effect of eligibility on
BMI is expected to operate through changes in FSP participation, I first study the effect of state and
federal policies on food stamps participation, and then on BMI. The analysis is based on equations (3)
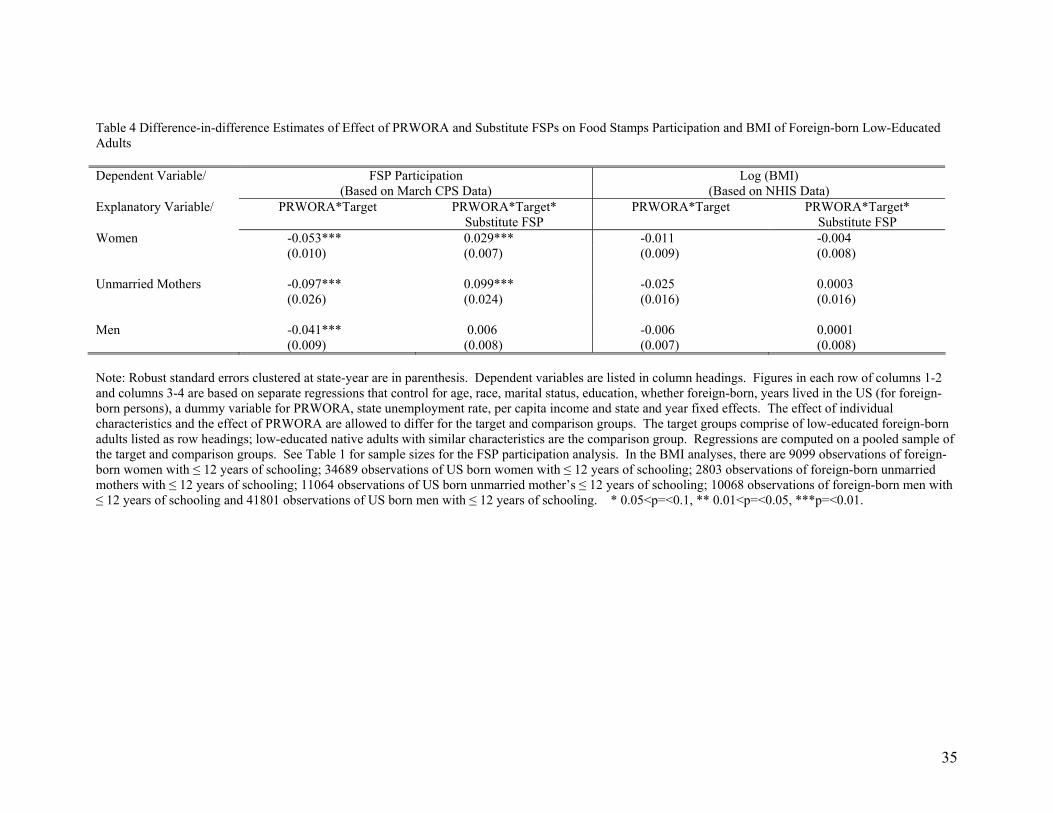
and (4). Columns 1 and 2 of Table 4 present the results for FSP participation and columns 3 and 4 have
the results for log BMI.
Figures in each row of columns 1-2 and columns 3-4 are based on separate regressions that
control for age, race, education, whether foreign-born, years lived in the US (for foreign-born persons),
whether the observation is taken from the post-PRWORA period, state unemployment rate and per capita
income and state and year fixed effects. The effect of individual characteristics is allowed to differ for the
target and comparison groups. Regressions are computed on a pooled sample of the target and
comparison groups. Row 1 of the Table presents the results for women. In row 2, the sample of women
is restricted to unmarried mothers, and row 3 has the results for men. Low-educated native adults with
characteristics similar to the target groups are the groups of comparison.
The coefficient for the double interaction term PRWORA (indicator for whether an observation is
taken from the post-PRWORA period) and Target (indicating whether a respondent belongs to the target
group) is negative for all groups, and suggests that in the post-PRWORA period, FSP participation of the
target group declined as compared to that of the comparison group. The double interaction term captures
the effect of PRWORA as well as other contemporaneous factors that affected the target and comparison
groups differently.
Figures in column 2 suggest that with low-educated native women as comparison, in the post-
PRWORA period, FSP participation of low-educated foreign-born women is three percentage points
higher in states that started substitute FSPs for immigrants as compared to states that continued with the
federal ban. FSP participation of unmarried low-educated foreign-born mothers is 10 percentage points
higher in states with substitute FSPs as compared to states that denied immigrants food stamps, with
20
unmarried low-educated native mothers as comparison. The corresponding number is a statistically
insignificant 0.6 percentage point when the sample of analysis comprises of men.
Columns 3-4 present the analysis on BMI using the NHIS data. Column 3 provides estimates of
the effect of PRWORA (and other correlated factors) on the BMI of the target group, and these estimates
are modest and statistically insignificant for all the three target groups viz. low-educated, foreign-born
women, unmarried mothers and men. Figures in column 4 provide the estimated effect of substitute state
FSP on immigrant BMI and these estimates are also modest and statistically insignificant. The point
estimates suggest that among low-educated foreign-born women, a 2.9 percentage point increase in FSP
participation is associated with a 0.4 percent decline in BMI. In the analysis on unmarried mothers, a 10
percentage point increase in FSP participation is associated with a 0.03 percent increase in BMI. Among
low-educated foreign-born men a 0.6 percentage point increase in food stamps use is associated with a
0.01 percent increase in BMI.
To sum up, the above analysis suggests that while eligibility for FSP is associated with
statistically significant rise in FSP participation of low-educated, foreign-born women, in particular
unmarried mothers, the estimated coefficients of the association between eligibility and BMI are
relatively small and statistically insignificant.
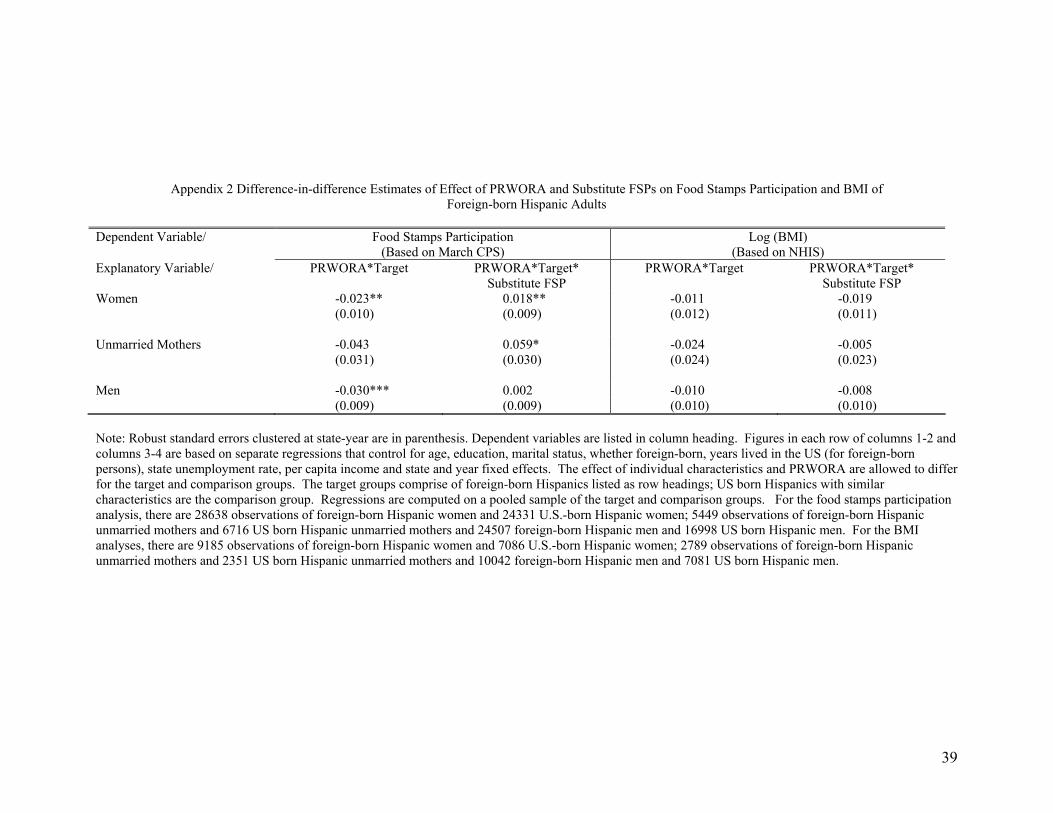
One possible source of bias in the above analysis could arise from differences in country/region
of origin among the target and comparison groups and such differences may cause even similar time-
varying factors to exert a different effect on the BMI of groups with different cultural and ethnic
backgrounds. To overcome this bias, I repeat the analysis in Table 4 by restricting the target and
comparison groups to persons of Hispanic origin. Due to sample size considerations, the target groups in
this analysis are not restricted to the low-educated. Again, the analysis is done for three groups, women,
unmarried mothers and men. This analysis has all the controls of the analysis in Table 4, and is presented
in Appendix 2. These results suggest that in the post-PRWORA period, among foreign-born Hispanic
women FSP participation is a statistically significant 1.8 percentage point higher in states with a
substitute program than in states without such program; and among foreign-born unmarried Hispanic
21
mothers, FSP participation is a statistically significant 5.9 percentage points higher in states with a
substitute program than others. The corresponding figure for foreign-born Hispanic men is a statistically
insignificant 0.2 percentage point increase. The estimated effect of food stamps eligibility on BMI is
negative for all the three target groups (foreign-born Hispanic women, unmarried mothers and men), but
statistically insignificant, with large standard errors. These findings reject the hypothesis that food stamps
increase BMI of foreign-born Hispanics.
To gain further insight into the relationship between food stamps eligibility and BMI, I use
variation in the severity of PRWORA towards immigrants by duration of their stay in the US and examine
if trends in BMI were different among recent immigrants and earlier arrivals. The results of this analysis
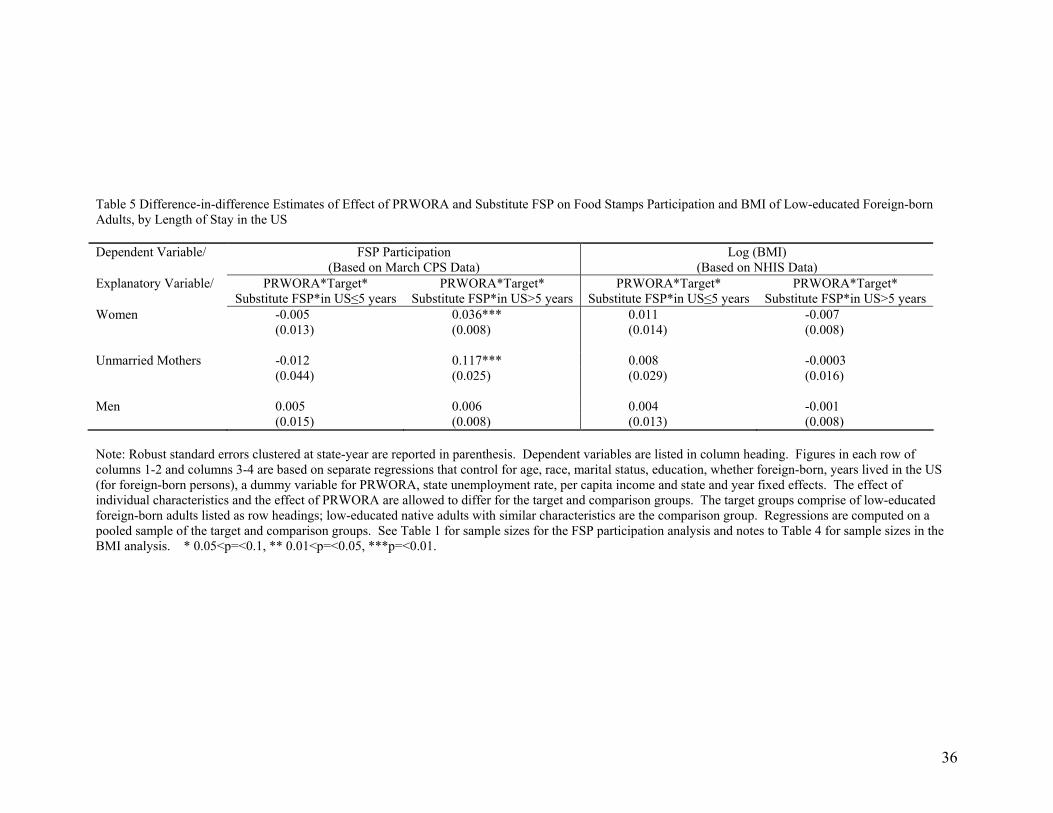
are in Table 5, and show that the target groups of recent immigrants living in states with a substitute FSP
are no more likely to receive food stamps than the target group of recent immigrants living in states that
implemented the federal ban. However, among low-educated immigrant women who have been in the
country for at least five years, those living in states with substitute programs for immigrants are 3.6
percentage points more likely to receive food stamps than those living in states that banned food stamps
to immigrants. Among unmarried mothers who have been in the country for at least five years, those
living in states with a substitute program are 12 percentage points more likely to receive food stamps.
These differences in estimated increases in FSP participation between recent and earlier arrivals,
however, do not translate into significant differences in BMI. For instance, a 3.6 percentage point
increase in FSP participation among low-educated women who have been in the US for at least five years
is associated with a 0.7 percent decline in BMI, and a 12 percentage points increase in FSP participation
among low-educated, unmarried mothers who have been in the country for at least five years is associated
with a 0.03 percent decline in BMI. In men’s analysis, the estimated coefficients for FSP participation
and BMI are modest and statistically insignificant for both recent and older immigrants.
In short, the analysis in Table 5 confirms the findings in Table 4 and Appendix 2 that FSP
participation has a modest and statistically insignificant effect on individual BMI.
22
Food Stamps Participation and Obesity
In the analysis so far I estimated the effect of food stamps eligibility on obesity. To examine the
effect of FSP participation on obesity, I now use a two sample instrumental variables model outlined in
equations (5) and (6). I restrict the sample in this analysis to unmarried mothers because the estimated
effects of PRWORA and substitute programs on food stamps utilization of the other groups comprising of
low-educated men and women are relatively small in size resulting in insufficient variations in FSP use
that are unlikely to yield meaningful results. As mentioned, the March CPS data is used to estimate the
first stage parameters using equation (6). These first stage parameters are then used to predict probability
of food stamps participation among the US-born and foreign-born populations in the National Health
Interview Survey data, which is then used as a regressor in the second stage estimation of the effect of
food stamps participation on log BMI.
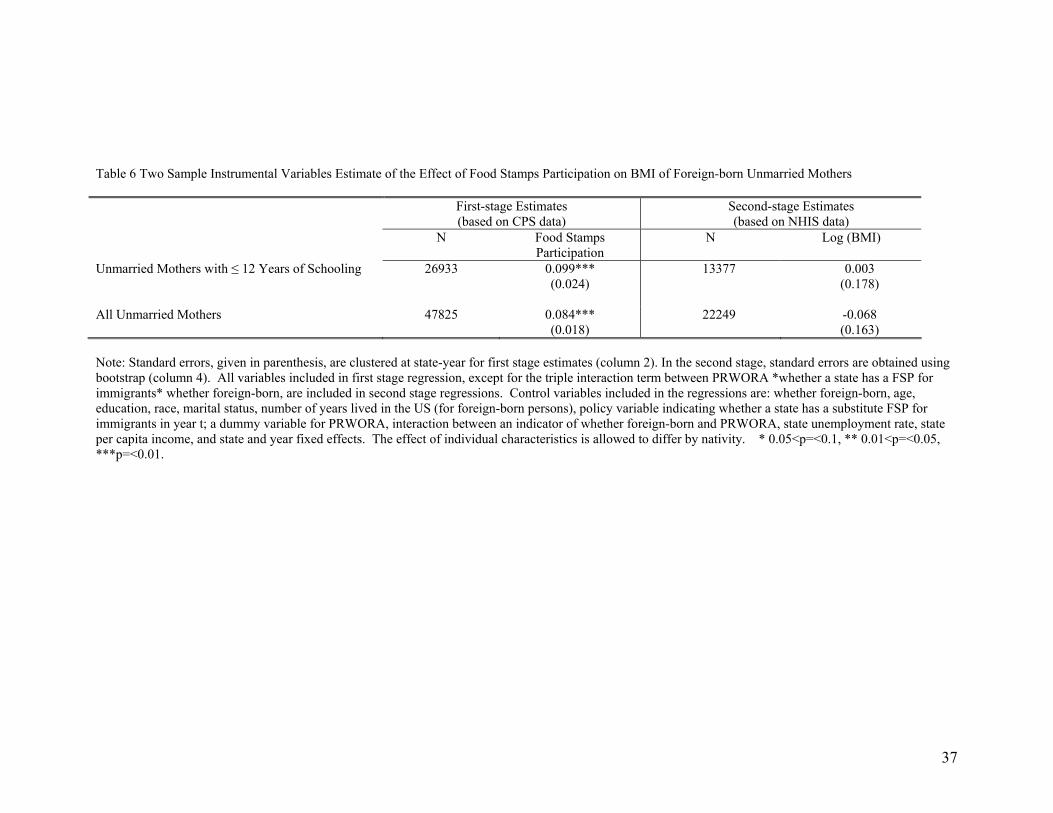
Table 6 has the results of this analysis. All variables included in the first stage regression, except
for the triple interaction term between PRWORA *whether a state has a FSP for immigrants* foreign-
born, are included in the second stage regressions. Control variables included in the regressions are:
whether foreign-born, age, education, race, marital status, years lived in the US (for foreign-born
persons), policy variable indicating whether a state has a substitute FSP for immigrants in year t; an
indicator for PRWORA, interaction of foreign-born with PRWORA; state unemployment rate, state per
capita income, and state and year fixed effects. Individual characteristics are allowed to differ by nativity.
Standard errors, given in parenthesis, are clustered at state-year for first stage estimates (column 2). In
the second stage, standard errors are obtained using bootstrap to correct for errors in the first stage
prediction (column 4).
Due to sample size consideration, these estimates are first computed on all unmarried mothers
and followed by an analysis restricting samples to unmarried mothers with a high-school or lower
education. The first stage results suggest that in the post-PRWORA period foreign-born
unmarried mothers are 8.3 percentage points more likely to receive food stamps in states that
23
instituted substitute FSP for immigrants than in states that implemented the federal ban; and
unmarried foreign-born mothers with a high-school or lower education are 10 percentage points
more likely to receive food stamps in states that instituted food stamps programs for immigrants
than in states with the federal ban.
Estimates from the second stage regressions suggest that food stamps participation is associated
with a statistically insignificant 6.8 percent decline in average BMI of unmarried mothers. When the
sample is restricted to unmarried mothers with a high-school or lower education, the analysis suggests
that FSP participation is associated with a statistically insignificant 0.3 percent increase in BMI. This
estimate is the same as the reduced form estimate obtained in the difference-in-difference analysis in
Table 4 (coefficient on the effect on log BMI ÷ coefficient on the effect on FSP participation= 0.0003 ÷
0.099). Notice that restricting the sample to low-educated unmarried mothers changed the point estimate,
but the standard error remained relatively unchanged. These estimates reject the hypothesis that food
stamps participation causes a person with an average BMI to become obese. For instance, the adjusted
average BMI of low-educated foreign-born unmarried mothers was about 26.8 units in the pre-PRWORA
and it would need about 12 percent increase in BMI in the case of an unmarried mother with average BMI
to become obese. Estimated coefficients from this analysis are of smaller magnitude, and suggest that
food stamps have relatively modest effects on individual BMI.
Conclusion
In this paper, I investigate whether participation in the FSP causes obesity. I use changes in
immigrant eligibility for food stamps under the 1996 welfare law and heterogeneous state responses to the
federal law to set up a natural experiment research design to study the effect of food stamps on Body
Mass Index (BMI) of adult immigrants. I find that while PRWORA was associated with a 1.3 percent
decline in the BMI of foreign-born low-educated women and a 1.8 percent decline in the BMI of foreign-
born low-educated unmarried mothers, these declines are unrelated to changes in FSP participation.
24
The analysis shows that in the post-PRWORA period food stamps use by foreign-born low-
educated women is three percentage points higher in states that created a substitute food stamps program
(FSP) for immigrants than in states that implemented the federal ban. The difference in FSP participation
among men living in states with substitute programs versus other states is negligible. Among low-
educated foreign-born unmarried mothers, FSP use is 10 percentage points higher in states with substitute
programs than in states with the federal ban. However, these increases in FSP participation are associated
with negligible and statistically insignificant changes in BMI. Among foreign-born Hispanics (with US
born Hispanics as the comparison group), the analysis suggests that food stamps eligibility is associated
with negative, but statistically insignificant effects on BMI.
PRWORA and state responses were more severe on recently arrived immigrants (arrived ≤five
years ago). I use this variation in policy towards immigrants by duration of their stay in the US and
examine if trends in BMI were different among recent immigrants versus earlier arrivals. The analysis
shows that severity of policy did affect food stamps utilization. While low-educated recent arrivals living
in states with a substitute FSP were no more likely to receive food stamps than those living in states that
implemented the federal ban, eligibility increased participation for earlier arrivals. Among low-educated
immigrant women in the US for at least five years, those living in states with substitute programs were
four percentage points more likely to receive food stamps than those living in states with the federal ban.
Among unmarried mothers who have been in the country for at least five years, those living in states with
a substitute program were 12 percentage points more likely to receive food stamps than those living in
states with the federal ban. These differences in FSP participation, however, do not translate into
statistically significant differences in BMI.
I also apply a two-sample instrumental variables research design to estimate the association
between food stamps participation and BMI. Federal and state level changes in immigrant food stamps
eligibility in 1996 are used to instrument for food stamps participation. I find that FSP participation is
associated with a statistically insignificant 6.8 percent decline in BMI of unmarried mothers and a
statistically insignificant 0.3 percent increase in BMI of low-educated unmarried mothers. These findings

25
suggest that the FSP is not associated with any large sized effects on BMI to cause a person with normal
weight (18.5≤BMI<25) or with the average BMI (about 26 units) to become obese.
Previous research (Townsend et al. 2001; Gibson 2003, 2004; Chen et al. 2005) that found
evidence in support of the hypothesis that food stamps cause obesity treated FSP participation as
exogenous which may have resulted in selection bias. The positive correlation between obesity and use
of food stamps may be because individuals who participate in the FSP are poor and more likely to face
food insecurity, consume poor quality food and therefore be obese. I study random changes in FSP
utilization caused by changes in federal and state eligibility criterion for immigrants, and therefore
arguably, I control for individual characteristics more effectively than previous research. The findings of
my research suggest that eligibility for the FSP can be decided without excessive concern about its
adverse effect on BMI. Further this research also suggests that the observed increase in prevalence of
obesity among immigrants with their duration of residence in the US is unrelated to FSP participation.
26
References
Alaimo, K., Olson, C. M. & Frongillo, E. A. (2001) “Food insufficiency and U. S. school-age children’s cognitive, academic, and psychosocial development.” Pediatrics 108:44-53. Alaimo, K., Olson, C. M. & Frongillo, E. A. (2002) “Family food insufficiency, but not low family income, is positively associated with dysthymia and suicide symptoms in adolescents.” J. Nut. 132:719-725. Angrist, Joshua D & Krueger, Alan B. (1995) "Split-Sample Instrumental Variables Estimates of the Return to Schooling," Journal of Business & Economic Statistics, American Statistical Association, vol. 13(2), pages 225-35, April. Borjas, G. (2004) “Food insecurity and public assistance.” Journal of Public Economics, 88:1421-1443. Carmody, Kelly and and Stacy Dean. (1998). “New Federal Food Stamp Restoration for Legal Immigrants: Implications and Implementation.” Center on Budget and Policy Priorities, Washington, DC. Chen, Z., S.T. Yen and D. B. Eastwood. (2005). “Effects of Food Stamp Participation on Body Weight and Obesity.” Amer. J. Agr. Econ. 87 (Number 5, 2005): 1167-1173. Currie, Janet and Jeffrey Grogger. (2001) “Explaining Recent Declines in Food Stamps Program Participation,” in Brookings Papers on Urban Affairs, William Gale and Janet Rothenberg-Pack (eds), 203-244. Cutler, D.M., E.L. Glaeser, and J. M. Shapiro. (2003). “Why have Americans become more obese?” Journal of Economic Perspectives 17 (3), 93-118 (Summer). Fix, Michael and Jeffrey Passel. (1999). “Trends in Noncitizens’ and Citizens’ Use of Public Benefits Following Welfare Reform: 1994-97.” Urban Institute, Washington, DC. Fix, Michael and Haskins Ron (2002) “Welfare Benefits for Non-citizens.” Welfare Reform and Beyond Policy Brief No. 15. The Brookings Institution, Washington, DC. Frongillo, E.A. (2003). “Understanding Obesity and Program Participation in the Context of Poverty and Food Insecurity.” J. Nut. 133: 2117-2118. Gibson, Daine (2003). Food Stamp Program Participation is Positively Related to Obesity in Low Income Women.” J.Nut. 133:2225-2231. Gibson, Daine (2004). Long-Term Food Stamp Program Participation is Differentially Related to Overweight in Young Girls and Boys.” J.Nut. 134:372-379. Gigliotti, Katherine (2004). “Food Stamp Access for Immigrants: How States Have Implemented the 2002 Farm Bill Restoration.” National Conference of State Legislatures. The Forum for America’s ideas. Gordon-Larsen P., Harris KM, Popkin BM. (2003) “Acculturation and overweight related behaviors among Hispanic Immigrants to the US: the National Longitudinal Study of Adolescent Health.” Soc Sci Med. 18:1028-1035.
27
James W. Hardin. (2002). "The Robust Variance Estimator for Two-stage Models,” Stata Journal, StataCorp LP, vol. 2(3), pages 253-266, August. James W. Hardin & Henrik Schmeidiche & Raymond J. Carroll. (2003). "Instrumental variables, bootstrapping, and generalized linear models," Stata Journal, StataCorp LP, vol. 3(4), pages 351-360, December.
Kaestner, Robert and Neeraj Kaushal. (2006). “Welfare reform and immigrants: Does the five year ban matter?” in Research in Labor Economics. (forthcoming).
Kaushal, Neeraj and Robert Kaestner. (2005). “Welfare Reform and Health Insurance of Immigrants.” Health Services Research Volume 40, Number 3, June 2005, pp. 697-722(26).
Krueger, Patrick M. "To Help or To Harm? Food Stamp Receipt and Mortality Risk Prior to the 1996 Welfare Reform Act" Social Forces, Volume 82, Number 4, June 2004, pp. 1573-1599.
Kuczmarski MF, Kuczmarski RJ, Najjar M. (2001)“Effects of age on validity of self-reported height, weight, and body mass index: Findings from the Third National Health and Nutrition Examination Survey, 1988-1994.” Journal of the American Dietetic Association,101(1):28-34. Luder, E., E. Ceysens-Okada and A. Loren-Roth et al. (1990). “Health and Nutrition Surveys in a Group of Urban Homeless Adults”, Journal of the American Dietetic Association, 90: 1387-1392. Laitinen, J., Ek, E. & Sovio, U. (2002) Stress-related eating and drinking behavior and body mass index and predictors of this behavior. Prev. Med. 34:29-39. Meyer, Bruce and James X. Sullivan (2004). "The Effects of Welfare and Tax Reform: The Material Well-Being of Single Mothers in the 1980s and 1990s" Journal of Public Economics 88: 1387-1420. Murphy, Kevin M & Topel, Robert H. (1985). “Estimation and Inference in Two-Step Econometric Models.” Journal of Business and Economic Statistics, American Statistical Association, vol. 3(4), pages 370-79, October. Schlosberg C. and Dinah Wiley. (1998). “The Impact of INS Public Charge Determinants on Immigrant Access to Health Care.” http://www.healthlaw.org/pubs/19980522publiccharge.html Shapiro, JM. (2005). “Is there a daily discount rate? Evidence from the food stamp nutrition cycle” Journal of Public Economics, 89, 303-325. Surgeon General (2001). “The Surgeon General’s Call to Action To Prevent and Decrease Overweigth and Obesity.” US Department of Health and Human Services, Public Health Service, Office of the Surgeon General, Rockville, MD.
Townsend, M., Peerson, J., Love, B., Achterberg, C. & Murphy, S. (2001) Food insecurity is positively related to overweight in women. J. Nutr. 131:1738-1745. Whitmore, D. (2002). “What are food stamps worth?” Princeton University Industrial Relations Section Working Paper. 468, July 2002.
28
Winship, Scott and Christopher Jencks. (2002). “Changes in Food Security and Welfare Reform: Can we identity a Policy Effect?” Unpublished document, Harvard University. Wilde, E. P. & C. K. Ranney (2000). “The monthly food stamp cycle: shopping frequency and food intake decisions in an endogenous switching regression framework.” Am. J. Agric.Econ. 82:200- 213.
Zedlewski, Sheila and Sarah Brauner. Are the Steep Declines in Food Stamp Participation Linked to Falling Welfare Caseload? Policy Brief No. B-3. Washington, DC: The Urban Institute, November 1999.
Zimmerman, Wendy and Karen Tumlin. (1999). “Patchwork Policies: State Assistance for Immigrants under Welfare Reform.” Occasional Paper Number 24, Washington, DC: Urban Institute.
29
Figure 1 BMI Distribution among Low-educated Women, 1992-1995
0
0.05
0.1
0.15
0.2
0.25
0.3
12 15 18 21 24 27 30 33 36 39 42 45 48 51 54 57
BMI
Den
sity
US-born Foreign-born
Figure 2. BMI Distribution among Low-educated Men, 1992-1995
0
0.05
0.1
0.15
0.2
0.25
0.3
0.35
12 15 18 21 24 27 30 33 36 39 42 45 48 51 54 57
BMI
Den
sity
US-born Foreign-born
30
Figure 3 BMI Distribution among Hispanic Women, 1992-1995
0
0.05
0.1
0.15
0.2
0.25
0.3
15 18 21 24 27 30 33 36 39 42 45 48 51 54 57 60
BMI
Den
sity
US-born Foreign-born Figure 4 BMI Distribution among Hispanic Men, 1992-1995
0
0.05
0.1
0.15
0.2
0.25
0.3
0.35
15 18 21 24 27 30 33 36 39 42 45 48 51 54 57
BMI
Den
sity
US-born Foreign-born
31
Figure 5 Trend in Food Stamps Participation among Low-educated Adults(Proportion of families headed by persons with a high-school or lower education,
March CPS)
0.05
0.07
0.09
0.11
0.13
0.15
0.17
0.19
0.21
1 2 3 4 5 6 7 8 9 10 11
US-born Foreign-born Figure 6 Trend in Food Stamps Participation among Unmarried, Low-educated Mothers
(Proportion of families headed by unmarried mothers with a high-school or lower education, March CPS)
0.2
0.25
0.3
0.35
0.4
0.45
0.5
0.55
1993 1994 1995 1996 1997 1998 1999 2000 2001 2002 2003
US-born Foreign-born
32
Table 1 Food Stamps Program Participation among US born and Foreign-born Adults
Foreign-born US Born N 1993-
1995 1998-2000
N 1993-1995
1998-2000
Women, Education ≤12 years 24286 0.21 0.11 102130 0.18 0.12 Women, Education >12 years 15358 0.06 0.03 130755 0.06 0.03
Unmarried mothers, Education ≤12 years 4365 0.49 0.31 22771 0.50 0.35 Unmarried mothers, Education >12 years
1694 0.24 0.13 19368 0.27 0.15
Men, Education ≤ 12 years 19473 0.16 0.07 76914 0.10 0.06 Men Education >12 years 13056 0.04 0.02 107294 0.02 0.01
Note: Figures are based on March Current Population Survey, persons aged 21-54 years. N corresponds to 1993-2001.
33
Table 2 BMI and Related Outcomes in the Pre-PRWORA Period (1992-95)
Average BMI Proportion Under-weight (BMI<18.5)
Proportion Normal Weight
(25>BMI ≥18.5)
Proportion Overweight
(30>BMI≥25)
Proportion Obese(BMI≥30)
Women Foreign-born Education≤ 12 years 26.0 0.03 0.45 0.32 0.19 Education>12 years 23.5 0.06 0.65 0.21 0.08 US-born Education≤ 12 years 26.5 0.04 0.46 0.26 0.24 Education>12 years 24.7 0.04 0.60 0.21 0.15 Men Foreign-born Education≤ 12 years 26.2 0.01 0.40 0.45 0.14 Education>12 years 25.1 0.01 0.51 0.40 0.08 US-born Education≤ 12 years 26.9 0.01 0.35 0.44 0.20 Education>12 years 26.3 0.00 0.40 0.45 0.15 Note: Figures are based on National Health Interview Survey, women and men aged 21-54 years.
34
Table 3 Estimated Effect of PRWORA on the Average BMI of Low-educated Immigrants
Foreign-born, ≤12 Years of Schooling (Target)
US-born, ≤12 Years of Schooling (Comparison)
Difference-in-
difference 1992-1995 1998-2001 Diff. 1992-1995 1998-2001 Diff. I II III= II-I IV V VI=V-IV VII =III-VI Women 26.74 27.46 0.72*** 27.63 28.75 1.11*** -0.34* (0.18) (0.10) (0.16)
Unmarried mothers 26.62 27.24 0.63*** 27.35 28.52 1.17*** -0.47* (0.27) (0.14) (0.28)
Men 26.44 27.24 0.80*** 26.85 27.80 0.95*** -0.12 (0.13) (0.06) (0.14) Note: Figures are based on NHIS, for persons aged 21-54. Figures in columns I,II, IV and V are mean-BMI levels adjusted for age, race, marital status and number of years lived in the US (for foreign-born). Each cell in column VII is based on a separate regression that adjusts for age, race, marital status, whether foreign-born, number of years lived in the US (for foreign-born), per capita income, unemployment rate, state and year effects. There are 7348 observations of foreign-born women with ≤ 12 years of schooling; 10416 observations of US born women with ≤ 12 years of schooling; 2334 observations of foreign-born unmarried mothers with ≤ 12 years of schooling; 10416 observations of US born unmarried mother’s ≤ 12 years of schooling; 8275 observations of foreign-born men with ≤ 12 years of schooling; 42279 observations of US born men with ≤ 12 years of schooling. Robust standard errors clustered at state-year are in parenthesis. * 0.05<p=<0.1, ** 0.01<p=<0.05, ***p=<0.01.
35
Table 4 Difference-in-difference Estimates of Effect of PRWORA and Substitute FSPs on Food Stamps Participation and BMI of Foreign-born Low-Educated Adults Dependent Variable/
FSP Participation (Based on March CPS Data)
Log (BMI) (Based on NHIS Data)
Explanatory Variable/ PRWORA*Target PRWORA*Target* Substitute FSP
PRWORA*Target PRWORA*Target* Substitute FSP
Women -0.053*** 0.029*** -0.011 -0.004 (0.010) (0.007) (0.009) (0.008)
Unmarried Mothers -0.097*** 0.099*** -0.025 0.0003 (0.026) (0.024) (0.016) (0.016)
Men -0.041*** 0.006 -0.006 0.0001 (0.009) (0.008) (0.007) (0.008) Note: Robust standard errors clustered at state-year are in parenthesis. Dependent variables are listed in column headings. Figures in each row of columns 1-2 and columns 3-4 are based on separate regressions that control for age, race, marital status, education, whether foreign-born, years lived in the US (for foreign-born persons), a dummy variable for PRWORA, state unemployment rate, per capita income and state and year fixed effects. The effect of individual characteristics and the effect of PRWORA are allowed to differ for the target and comparison groups. The target groups comprise of low-educated foreign-born adults listed as row headings; low-educated native adults with similar characteristics are the comparison group. Regressions are computed on a pooled sample of the target and comparison groups. See Table 1 for sample sizes for the FSP participation analysis. In the BMI analyses, there are 9099 observations of foreign-born women with ≤ 12 years of schooling; 34689 observations of US born women with ≤ 12 years of schooling; 2803 observations of foreign-born unmarried mothers with ≤ 12 years of schooling; 11064 observations of US born unmarried mother’s ≤ 12 years of schooling; 10068 observations of foreign-born men with ≤ 12 years of schooling and 41801 observations of US born men with ≤ 12 years of schooling. * 0.05<p=<0.1, ** 0.01<p=<0.05, ***p=<0.01.
36
Table 5 Difference-in-difference Estimates of Effect of PRWORA and Substitute FSP on Food Stamps Participation and BMI of Low-educated Foreign-born Adults, by Length of Stay in the US Dependent Variable/
FSP Participation (Based on March CPS Data)
Log (BMI) (Based on NHIS Data)
Explanatory Variable/ PRWORA*Target* Substitute FSP*in US≤5 years
PRWORA*Target* Substitute FSP*in US>5 years
PRWORA*Target* Substitute FSP*in US≤5 years
PRWORA*Target* Substitute FSP*in US>5 years
Women -0.005 0.036*** 0.011 -0.007 (0.013) (0.008) (0.014) (0.008)
Unmarried Mothers -0.012 0.117*** 0.008 -0.0003 (0.044) (0.025) (0.029) (0.016)
Men 0.005 0.006 0.004 -0.001 (0.015) (0.008) (0.013) (0.008) Note: Robust standard errors clustered at state-year are reported in parenthesis. Dependent variables are listed in column heading. Figures in each row of columns 1-2 and columns 3-4 are based on separate regressions that control for age, race, marital status, education, whether foreign-born, years lived in the US (for foreign-born persons), a dummy variable for PRWORA, state unemployment rate, per capita income and state and year fixed effects. The effect of individual characteristics and the effect of PRWORA are allowed to differ for the target and comparison groups. The target groups comprise of low-educated foreign-born adults listed as row headings; low-educated native adults with similar characteristics are the comparison group. Regressions are computed on a pooled sample of the target and comparison groups. See Table 1 for sample sizes for the FSP participation analysis and notes to Table 4 for sample sizes in the BMI analysis. * 0.05<p=<0.1, ** 0.01<p=<0.05, ***p=<0.01.
37
Table 6 Two Sample Instrumental Variables Estimate of the Effect of Food Stamps Participation on BMI of Foreign-born Unmarried Mothers
First-stage Estimates
(based on CPS data) Second-stage Estimates (based on NHIS data)
N Food Stamps Participation
N Log (BMI)
Unmarried Mothers with ≤ 12 Years of Schooling 26933 0.099*** 13377 0.003 (0.024) (0.178)
All Unmarried Mothers 47825 0.084*** 22249 -0.068 (0.018) (0.163)
Note: Standard errors, given in parenthesis, are clustered at state-year for first stage estimates (column 2). In the second stage, standard errors are obtained using bootstrap (column 4). All variables included in first stage regression, except for the triple interaction term between PRWORA *whether a state has a FSP for immigrants* whether foreign-born, are included in second stage regressions. Control variables included in the regressions are: whether foreign-born, age, education, race, marital status, number of years lived in the US (for foreign-born persons), policy variable indicating whether a state has a substitute FSP for immigrants in year t; a dummy variable for PRWORA, interaction between an indicator of whether foreign-born and PRWORA, state unemployment rate, state per capita income, and state and year fixed effects. The effect of individual characteristics is allowed to differ by nativity. * 0.05<p=<0.1, ** 0.01<p=<0.05, ***p=<0.01.
38
Appendix 1. Validity of the Difference-in-differences Research Design: 1993-1996 (Pseudo-intervention in January 1995)
Dependent Variable/
FSP Participation (March CPS data)
Log (BMI) (NHIS data)
Explanatory Variable/ Pseudo intervention*substitute FSP*Target Pseudo intervention*substitute FSP*Target Women 0.000 -0.001 (0.015) (0.009)
Unmarried Mothers 0.044 -0.004 (0.034) (0.013)
Men -0.001 -0.009 (0.013) (0.005) Note: Robust standard errors clustered at state-year are reported in parenthesis. Dependent variables are listed in column heading. Figures in each cell are based on a separate regression that control for age, race, education, marital status, whether foreign-born, years lived in the US (for foreign-born persons), state unemployment rate, per capita income and state and year fixed effects. The effect of individual characteristics is allowed to differ for the target and comparison groups. The target groups comprise of low-educated foreign-born adults listed as row headings; low-educated native adults with similar characteristics are the comparison group. Regressions are computed on a pooled sample of the target and comparison groups.
39
Appendix 2 Difference-in-difference Estimates of Effect of PRWORA and Substitute FSPs on Food Stamps Participation and BMI of Foreign-born Hispanic Adults
Dependent Variable/
Food Stamps Participation (Based on March CPS)
Log (BMI) (Based on NHIS)
Explanatory Variable/ PRWORA*Target PRWORA*Target* Substitute FSP
PRWORA*Target PRWORA*Target* Substitute FSP
Women -0.023** 0.018** -0.011 -0.019 (0.010) (0.009) (0.012) (0.011)
Unmarried Mothers -0.043 0.059* -0.024 -0.005 (0.031) (0.030) (0.024) (0.023)
Men -0.030*** 0.002 -0.010 -0.008 (0.009) (0.009) (0.010) (0.010) Note: Robust standard errors clustered at state-year are in parenthesis. Dependent variables are listed in column heading. Figures in each row of columns 1-2 and columns 3-4 are based on separate regressions that control for age, education, marital status, whether foreign-born, years lived in the US (for foreign-born persons), state unemployment rate, per capita income and state and year fixed effects. The effect of individual characteristics and PRWORA are allowed to differ for the target and comparison groups. The target groups comprise of foreign-born Hispanics listed as row headings; US born Hispanics with similar characteristics are the comparison group. Regressions are computed on a pooled sample of the target and comparison groups. For the food stamps participation analysis, there are 28638 observations of foreign-born Hispanic women and 24331 U.S.-born Hispanic women; 5449 observations of foreign-born Hispanic unmarried mothers and 6716 US born Hispanic unmarried mothers and 24507 foreign-born Hispanic men and 16998 US born Hispanic men. For the BMI analyses, there are 9185 observations of foreign-born Hispanic women and 7086 U.S.-born Hispanic women; 2789 observations of foreign-born Hispanic unmarried mothers and 2351 US born Hispanic unmarried mothers and 10042 foreign-born Hispanic men and 7081 US born Hispanic men.