Embed Size (px)
Citation preview
1
Do University Entrepreneurship Programs Promote Entrepreneurship?
Yong Suk Leea* Chuck Eesleyb
Stanford University Stanford University
March 30, 2017
Abstract Recently, many universities have developed programs to promote student entrepreneurship. However, relatively little is known about the impacts of such university initiatives. This paper examines how Stanford University’s entrepreneurship initiatives affected entrepreneurial activity using the Stanford Innovation Survey, a unique survey that asks the entrepreneurship activities of Stanford degree-holders. We examine Stanford University’s two major initiatives that were established in the mid 1990s - the Stanford Center for Entrepreneurial Studies at the Business School and the Stanford Technology Venture Program at the Engineering School. OLS regressions find that program participation is positively related to entrepreneurship activities. However, selection of more entrepreneurial students into program participation hinders causal interpretation. We utilize the fact that the initiatives were implemented at the school level, i.e., only students in the respective schools were primarily affected by each program, to examine the programs’ impacts. Using the introduction of each school’s program as an instrument for program participation, we find that the business school program has a negative to zero impact on entrepreneurship. Participation in the engineering school program has no impact on entrepreneurship. However, the business school initiative decreases the probability that the startup fails and increases firm revenue. Overall, the findings imply that university entrepreneurship programs may not increase entrepreneurship, but help students to better identify their potential as entrepreneurs and improve the quality of entrepreneurship. Keywords: University entrepreneurship education, entrepreneurship, program evaluation
a Freeman Spogli Institute for International Studies, Stanford University, Stanford CA 94305 (email: [email protected]) b Department of Management Science and Engineering, Stanford University, Stanford CA 94305 (email: [email protected]) We thank Paul Oyer, Manuel Adelino, David Robinson, Josh Lerner and participants at the NBER Entrepreneurship and Economic Growth conference for comments.
2
1. Introduction
Though many universities have been incorporating entrepreneurship related courses and programs
into their curriculums, relatively little is known about the impacts of such university initiatives. This
paper examines two questions fundamental to entrepreneurship education - whether university
entrepreneurship programs affect (1) the decision to become an entrepreneur and (2) the performance of
start-ups. Ex-ante it is not clear how university entrepreneurship programs would affect the rate of
entrepreneurship and the performance of newly created businesses. If university education programs
improve entrepreneurial ability, such programs could result in higher rates of entrepreneurship as well as
better start-up performance. However, if students tend to overestimate their entrepreneurial ability ex-
ante, and university entrepreneurship programs enable students to better assess their own entrepreneurial
ability, entrepreneurship education may deter some students from entering into entrepreneurship. The
main objective of this paper is to empirically examine how university entrepreneurship programs affect
entrepreneurial choice and startup performance. By doing so, we hope to provide a better understanding
of the role university education plays in promoting entrepreneurship.
Specifically, we use the Stanford University Innovation Survey, a survey that asks about the
entrepreneurship related activities of Stanford degree-holders, to examine the entrepreneurship
consequences of Stanford University’s two major entrepreneurship programs that were founded in the
mid 1990s – the Stanford Technology Venture Program (STVP) at the Engineering School and the Center
for Entrepreneurial Studies (CES) at the Business School. The OLS regressions indicate that program
participation is positively and significantly related to various measures of entrepreneurial activity.
However, the main challenge of estimating the causal impact of entrepreneurship programs is that
program participation is not random - more entrepreneurial students are more likely to participate in the
entrepreneurship courses offered by the university. We utilize the fact that the initiatives were
implemented at the school level, i.e., the business school and the engineering school, and that primarily
students in each school were affected by the respective entrepreneurship programs. This enables us to use
the introduction of each school’s program as an instrument for program participation.
We find strong evidence of a first stage – the introduction of university entrepreneurship
programs increase student participation primarily for students in the respective schools. The participation
rate is substantially higher in the business school’s entrepreneurship program than in the engineering
school’s program. Cross-enrollment into the business school’s entrepreneurship program by students from
the other schools is minimal, though less so for the engineering school’s program. We use a difference in
difference framework to estimate the first stage and reduced form using students from the other schools as
the control group. Inference hinges on the assumption that student characteristics do not change
differentially within each school after the introduction of the entrepreneurship programs. We find no
3
evidence that demographic characteristics, such as race, gender, and nationality, as well as, parental
entrepreneurship, an important determinant of entrepreneurship, change in each school after program
introduction. Given that we find no evidence of selection based on these variables, student characteristics
in each school do not seem to have changed significantly after each program was introduced.
The 2SLS estimates indicate that the business school program decreases, or at most has no effect
on entrepreneurship. The engineering school initiative has no effect on entrepreneurship. The negative
effects we find from the business school program implies that entrepreneurship courses could be helping
students to better identify whether they are of the entrepreneurial type or not, and ultimately deter certain
students from pursuing entrepreneurship. We also examine whether program participation affects the
characteristics and performance of startups after graduation. In particular, we examine whether program
participation affects the timing to founding after graduation, the probability of survival, revenue, number
of employees, and whether the startup successfully exited through an IPO or acquisition. The main
finding here is that the business school initiative seems to increase the probability of survival and startup
revenue of surviving firms. Again, we find no significant impact on firm performance from the
engineering school program. Overall, the results imply that business school entrepreneurship programs
may decrease the entrepreneurship rate, but improve the quality of entrepreneurship in terms of survival
and firm revenue. The program enables students to better identify their potential as an entrepreneur, and
ultimately results in better startup quality of eventual entrepreneurs. The null effect of entrepreneurship
programs on entrepreneurship is quite robust. Though we are not able to identify the exact channels, the
increase in performance is likely due to the program (1) deterring students with low entrepreneurial
ability from pursuing entrepreneurship, and (2) increasing entrepreneurial ability. Lastly, general
entrepreneurship education that targets a broader spectrum of startups, rather than one that solely focuses
on technology startups, may be more effective in reducing the uncertainty in entrepreneurial ability or
improving startup performance. However, we note that the effects we find here are the average effects at
the school level over several years. There still may have been specific teachers, courses, or programs that
had significant influences on entrepreneurship. We pursue these aspects further in future research.
The findings of this paper are closely related to Lerner and Malmendier (2013). They utilize the
random assignment of peers in business school sections to examine how peers affect entrepreneurial
decisions and find that higher share of entrepreneurial peers decrease entrepreneurship. Similar to
education programs, peers with entrepreneurship experience help students learn about their own
entrepreneurial abilities. Howell (2016) examines entrepreneurial learning in the context of venture
competitions. She finds that negative feedback deters entrepreneurs from pursuing their ventures.
Whether it is from university entrepreneurship programs, peers with entrepreneurship experience, or
4
negative feedback from venture competitions, the process of learning about one’s own entrepreneurial
ability seems to mitigate overconfidence in starting a new venture.
Fairlie et al. (2015) use a randomized control trial to examine a large-scale entrepreneurship
training program and find no lasting effect on entrepreneurship and business performance. Graevenitz et
al. (2010) find that a compulsory entrepreneurship course at the university level decreases student
intention to start a business and improves self–assessed entrepreneurial skill. Hsu et al. (2007), examine
entrepreneurship patterns of MIT alumni, but they do not focus on entrepreneurship programs. Eesley et
al. (2016) examine alumni of China’s Tsinghua University and show that emphasis on entrepreneurship
improves student awareness on the importance of patents.
Also related is the literature that evaluates the impact of public efforts to promote
entrepreneurship. Lerner (1999, 2002) examines government initiatives to increase innovation and
entrepreneurship. Hsu et al. (2007) compares the effect of VC and SBA funding and Brander, Du, and
Hellmann (2014) examines the effect of public venture capital. These analyses overall also point in the
direction of little and uneven effects of public support for entrepreneurship. The paper proceeds as
follows. The next section describes the Stanford University Entrepreneurship Initiatives and the alumni
survey. Section 3 lays out the estimation and identification strategy. Section 4 presents some descriptive
patterns and the empirical results and Section 5 concludes.
2. Stanford University Entrepreneurship Initiatives and the Alumni Survey
2.1 The Center for Entrepreneurial Studies and the Stanford Technology Venture Program
Stanford University is well known for its supportive environment for student and faculty
entrepreneurship. The stories of the founding of Hewlett-Packard and Google are two among many
prominent examples. In recent decades, Stanford University further expanded and formalized its support
for entrepreneurship and established two programs - the Center for Entrepreneurial Studies and the
Stanford Technology Venture Program- in the mid 1990s. The Center for Entrepreneurial Studies (CES)
was founded in 1996 at the Graduate School of Business to address the needs facing entrepreneurs and the
entrepreneurial community. The program utilizes the expertise on campus and Silicon Valley to provide
courses and networking opportunities, as well as support research. For students, the CES offers a variety
of courses and experiential learning that touch upon all aspects of entrepreneurship. The courses cover
topics ranging from management, finance, technology, law, education, design, etc. However, the courses
are primarily accessible to business school students only. Furthermore, students have the opportunity to
take experiential learning classes where they can learn the day-to-day activities of a start-up and test out
new business concepts. The Stanford Technology Venture Program (STVP) is the entrepreneurship center
founded in 1995 at the Engineering School. Similarly, STVP offers courses and extracurricular programs
5
to students as well as supporting research on high-technology entrepreneurship. In addition to offering
entrepreneurship related courses to engineering students, STVP houses several fellowship programs
where students can obtain in-depth knowledge and first-hand experience of technology start-ups.
However, the courses offered through STVP are more focused on technology ventures, and the range of
courses offered by STVP is smaller compared to the CES.
2.2 The Stanford University Innovation Survey
The main objective of the Stanford University Innovation Survey was to document the economic
impact Stanford Alumni have played in terms of entrepreneurship and innovation. However, what makes
the survey particularly useful for analysis is its coverage of all students regardless of entrepreneurship
status. One of the main challenges entrepreneurship data face is the fact that data is often only available
for those who enter into entrepreneurship or become publicly listed. Especially, when one relies on
administrative data, information on those who do not become entrepreneurs or do not go public are hard
to collect. A benefit of the Stanford Innovation Survey is its coverage of all Stanford students regardless
of entrepreneurship status. Hence, this survey is unlikely to suffer from success bias compared to most
datasets that condition on venture capital funding or an initial public offering. Also, since the surveyed
alumni are not selected based on successful entry into entrepreneurship, unlike samples that focus on
innovators or venture-backed founders, the results do not suffer from biases due to sampling on the
dependent variable. Prior studies have found samples of alumni from research universities (MIT,
Stanford, Harvard and Chicago) useful in making theoretical contributions regarding how the broader
social environment influences entrepreneurs (Dobrev and Barnett 2005, Lazear 2004, Burt 2001, Roberts
1991, Hsu et al. 2007, Roberts and Eesley 2009). Results based on this type of sample may generalize to
other samples of selective-admission college-educated alumni.
The survey was conducted over a well-defined population of comparable individuals in multiple
industries, and it was administered through official university channels and hence more trustworthy to the
respondents. By surveying the entire population (all living alumni who graduated between the 1930s and
2010s), we were able to poll all alumni who could have founded a firm. The 2011 survey generated
27,783 individual responses for a response rate of 19.5%. The response rates are similar across gender,
departments, and graduation year. If we take graduates from 1933-1971, the response rate was 22% and
graduates from 1972-2010, the response rate was 18 percent, indicating that older graduates were not less
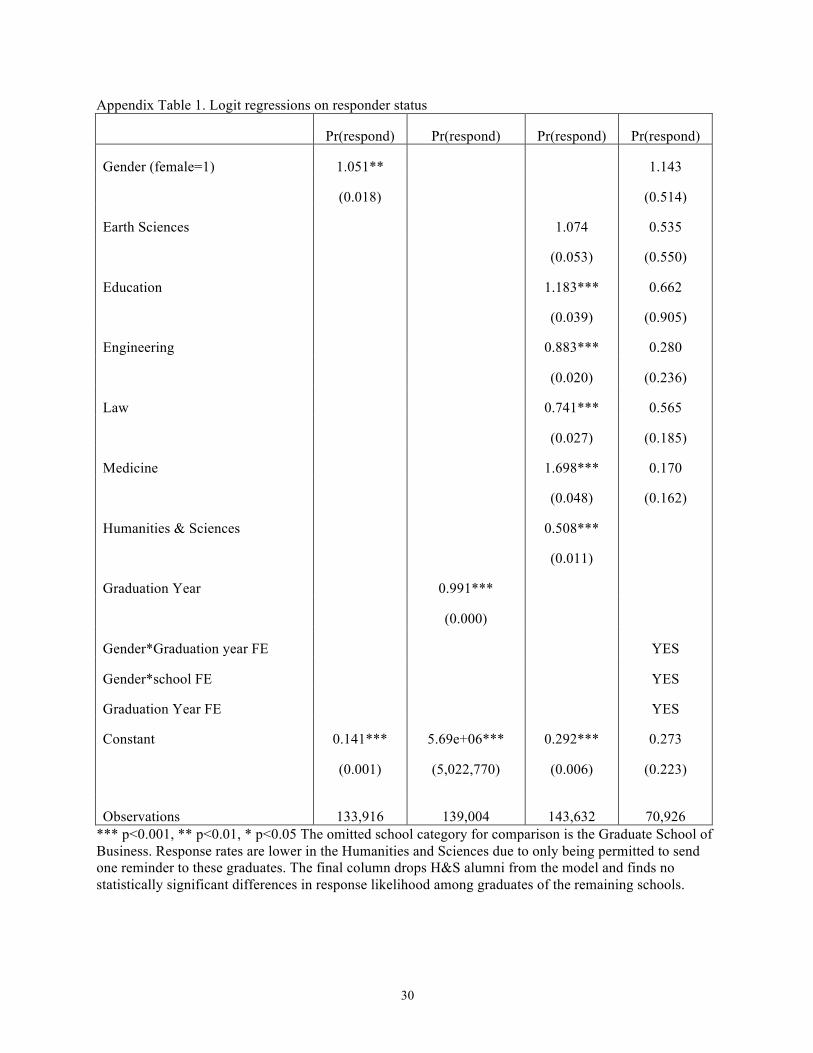
likely to respond. Appendix Table 1 shows a multivariate regression predicting response to further assess
response rate characteristics among the alumni sample. The dependent variable is equal to one if the
individual responded to the survey and zero otherwise. Due to the large sample size, some variables are
statistically significant. The first column indicates that women were 5.1% more likely to respond than
6
men overall. Those in more recent graduation years were 0.9% less likely to respond. Graduates of the
Education and Medical schools were more likely to respond and those from Law and Engineering were
less likely to respond. Finally, we include fixed effects for graduation year, and a full set of interactions
between gender and graduation year and school. In this model, we do not detect significant differences for
the main effects of gender and school (see Eesley and Miller, 2012 for more detailed benchmarking and
response rate analyses). Out of the respondents, nearly 8,000 reported being entrepreneurs who founded
any type of organization (for-profit or non-profit) and 4,290 said they had founded an incorporated
business. The Stanford survey not only asks one’s entrepreneurship status, but also whether one invested
in start-ups as an angel investor or venture capitalist. Responses include data on 2,798 individuals who
were early employees (16 percent of the alumni), 349 venture capital investors, and 2,572 angel investors.
Some 3,600 respondents, 18 percent, said they had been on a private company board of directors. The
survey also collected information on when each startup was created and whether it failed, or exited
through an IPO or was acquired by another firm. The survey asks about performance measures, i.e., the
revenue and number of employees in the most recent year the firm was alive. When available, these
figures are verified by matching the firm names to the Dun and Bradstreet database. We examine the
performance of each entrepreneur’s first start-up when these measures are available.
Other valuable information include whether the respondent’s parent had any entrepreneurship
experience. The literature has found parental entrepreneurship status to be one of the strongest
determinants of entrepreneurship in different countries. The survey also asks how optimistic the
respondent is. In particular, it asks respondents to rate the degree to which one agrees with the statement:
“Overall, I expect more good things to happen to me than bad.” We use these variables and age, ethnicity,
gender, and nationality variables to control for the underlying characteristics of the respondent. In the
empirical analysis we focus on students who graduated from Stanford on or after 1980 to minimize recall
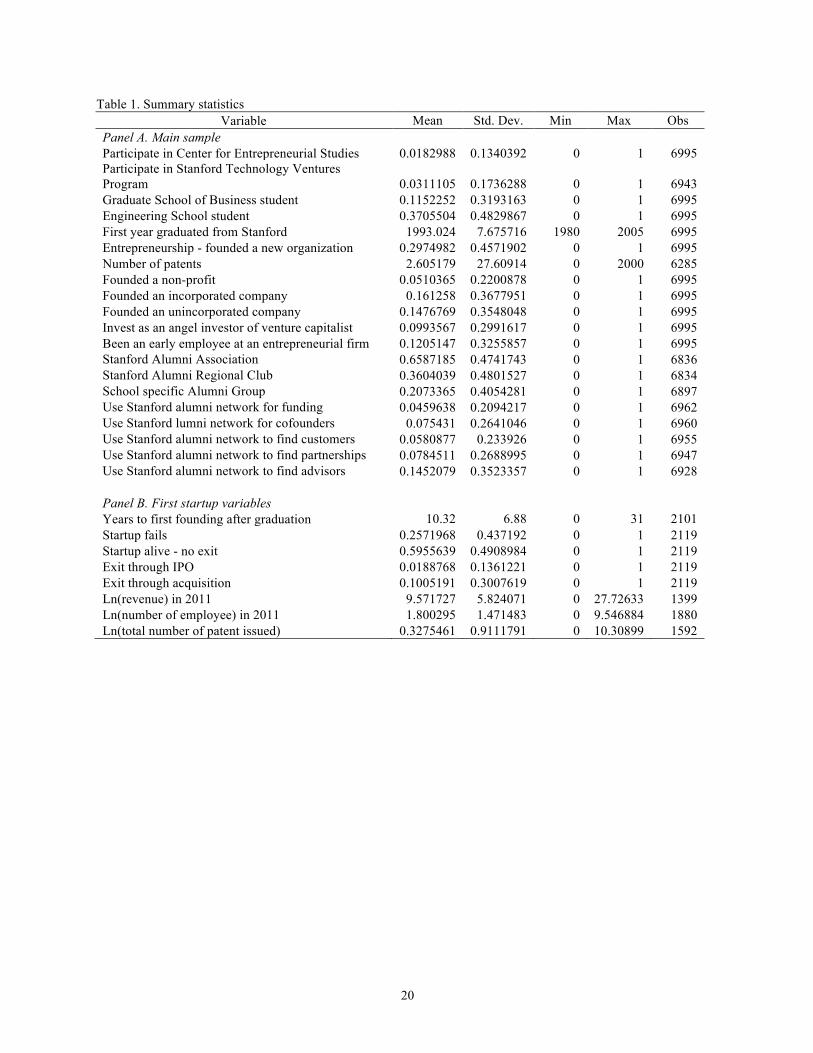
bias and on or before 2005 to provide some time for entrepreneurship activity. Table 1 presents summary
statistics of the main variables.
3. Estimation and Identification Strategy
The base regression framework is the following:
𝑦!"# = 𝛼 + 𝛽𝑃𝑟𝑜𝑔!"# + X!"#π + 𝜇! + 𝜃! + 𝜀!"# (1)
where 𝑦!"# represents the entrepreneurship status of or startup performance of Stanford University alumni
i who attended school j and graduated in year k. 𝑃𝑟𝑜𝑔!"# is a dummy variable indicating participation in
the either the CES or STVP. In some specifications we include both program dummies. X!"# is the vector
of control variables that include the foreign dummy, gender dummy, parental entrepreneurship dummy,
and the age fixed effects. Also included are a dummy variable for students who participate in both
7
programs and a dummy variable for students who were Stanford undergraduates that became business
school graduates at Stanford University. 𝜇! is the set of school fixed effects, i.e., dummy variables
indicating whether the student attended the business school, engineering school, medical school, etc. We
control for Stanford cohort specific effects non-parametrically by including Stanford graduation year
fixed effects 𝜃!. The main coefficient of interest is 𝛽, which captures the effect of the entrepreneurship
programs on the outcome of interest. When the dependent variable is binary, we still estimate equation (1)
in a linear regression model to facilitate comparison with the 2SLS results. Estimation using a non-linear
probability model returns similar results.
We are interested in the causal effect of the entrepreneurship programs on entrepreneurship status
and innovation. However, equation (1) suffers from endogeneity. Students who were thinking of
becoming an entrepreneur would likely have enrolled in the classes and programs offered by the
University’s entrepreneurship programs. To deal with endogeneity, we instrument program participation
with program availability. Specifically, the Center for Entrepreneurial Studies (CES) was established in
1996, and new sets of courses on entrepreneurship became available to students in the latter cohorts.
Students who attended the GSB after the CES was established could take entrepreneurship related courses
unlike their earlier cohorts or students from other schools. Other students in the university could only take
GSB courses, if the instructor approved. However, as we show later, participation by students from other
schools was minimal.
We use an instrumental variable strategy where we instrument program participation with the
GSB dummy interacted with the dummy for cohorts who graduated Stanford on 1997 or after. Since
school fixed effects and cohort fixed effects are included, the variation used to generate the plausibly
exogenous variation in program participation is the difference in program participation of only the GSB
students before and after CES was introduced. Critical to the validity of this assumption is that students
who graduated from the GSB after the program was introduced were no different than students who
graduated before. If more entrepreneurial students started to attend Stanford University and the GSB
because entrepreneurship programs became available, the identifying assumption would be violated. We
provide evidence that this was not the case, especially for the CES, in the empirical analysis.
In practice, we perform the following 2SLS regression where the first stage is
𝑃𝑟𝑜𝑔!"# = 𝛼 + 𝛽𝐺𝑆𝐵! ∗ 𝑃𝑜𝑠𝑡1997! + 𝛾𝐺𝑆𝐵! ∗ 𝑇𝑖𝑚𝑒!!!""# ∗ 𝑃𝑜𝑠𝑡1997! + X!π + 𝜇! + 𝜃! + 𝜀!"#
and the second stage is the same as equation (1) but now with predicted program participation
𝑦!"# = 𝛼 + 𝛽Prog! + X!π + 𝜇! + 𝜃! + 𝜀!"# .
The 𝐺𝑆𝐵! ∗ 𝑡𝑖𝑚𝑒! ∗ 𝐷!!!""# term flexibly captures increasing student participation rates as the program
becomes more established over the years. 𝑇𝑖𝑚𝑒!!!""# is simply a linear time trend normalized at 1997.
8
In the robustness, we also use a more succinct version with 𝐺𝑆𝐵! ∗ 𝑃𝑜𝑠𝑡1997! as the
instrumental variable, as well as a version where we use the full set of interaction terms to flexibly
capture the difference in program roll out over the years. In such specifications, the first stage is
𝑃𝑟𝑜𝑔!"# = 𝛼 + 𝛽!𝐺𝑆𝐵! ∗ 𝐶𝑜ℎ𝑜𝑟𝑡!!
+ X!π + 𝜇! + 𝜃! + 𝜀!"#
Similarly, when we examine the effect of the engineering school initiative we perform the same
regressions but instead instrument STVP participation with 𝐸𝑁𝐺! ∗ 𝑃𝑜𝑠𝑡1998!, the engineering school
dummy interacted with the post 1998 dummy, and 𝐸𝑁𝐺! ∗ 𝑇𝑖𝑚𝑒!!!""# ∗ 𝑃𝑜𝑠𝑡1998!. We note that when
we examine the effects of the CES and STVP separately, the control group is students from the other
schools, i.e., students from the other five schools of Stanford University.
4. Empirical Results
4.1 Descriptive patterns
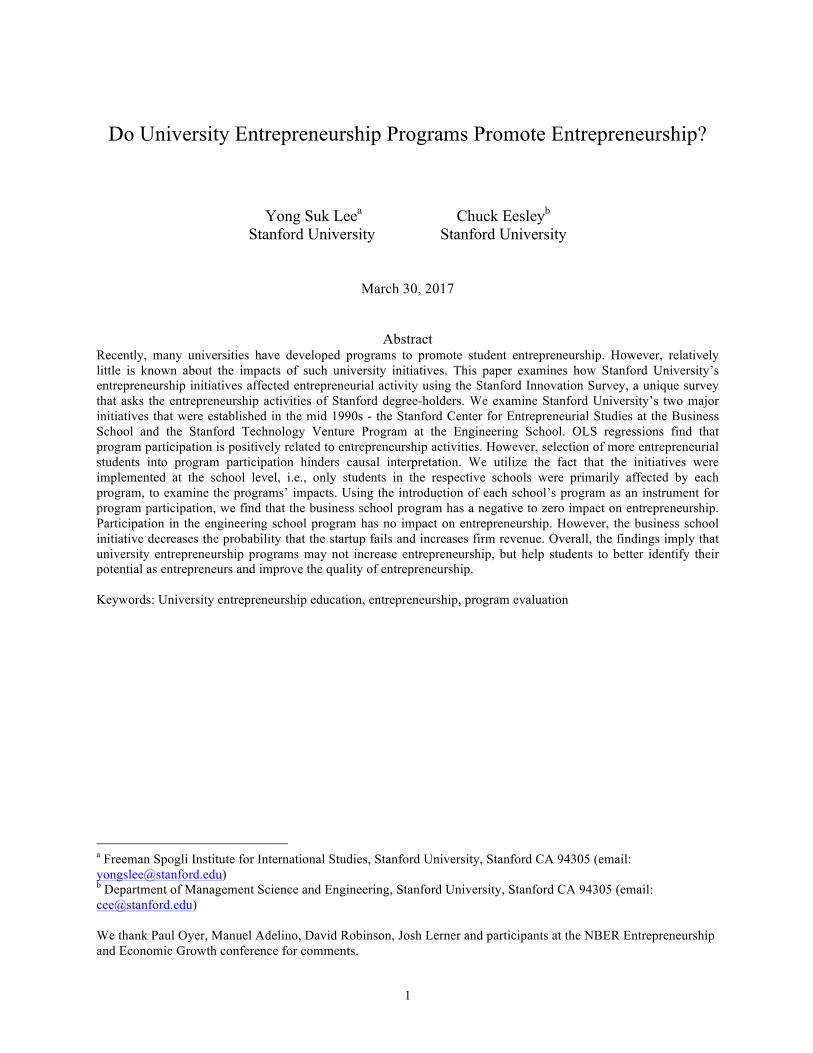
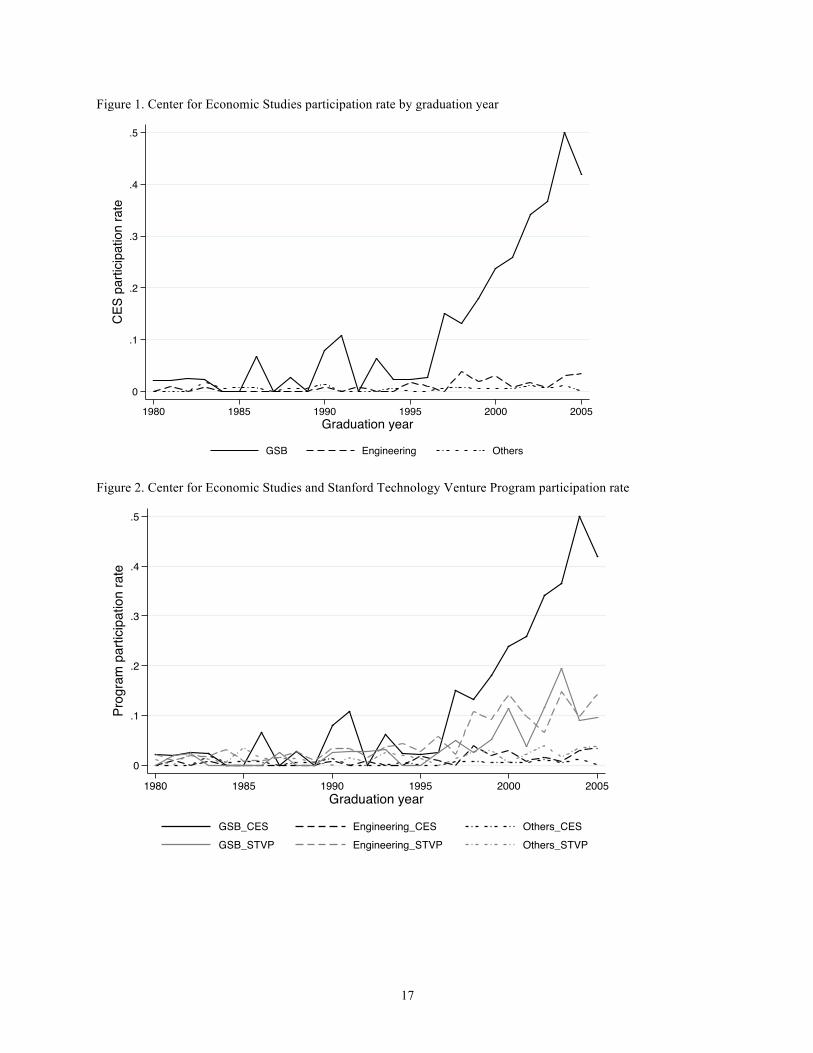
Figure 1 illustrates the participation rate in CES by cohort among three different groups – those
who graduated from the business school, engineering school, and the other schools grouped in one
category. Participation in the CES jumps up starting with the 1997 graduating cohort. Recall the CES was
introduced in the 1996-7 academic year. Hence it seems natural that CES participation rises with the 1997
graduating cohorts. The fact that participation is not zero among the earlier cohorts implies that those who
graduated earlier could participate in the CES program not just when they were students. Indeed there are
programs where alumni can participate in the CES. Given that many alumni remain in Silicon Valley for
their careers, this is very likely. What is noteworthy is that participation among students from other
schools remains very low. This property of the CES lends itself as a good design to compare the effect of
CES participation using a difference in difference framework.
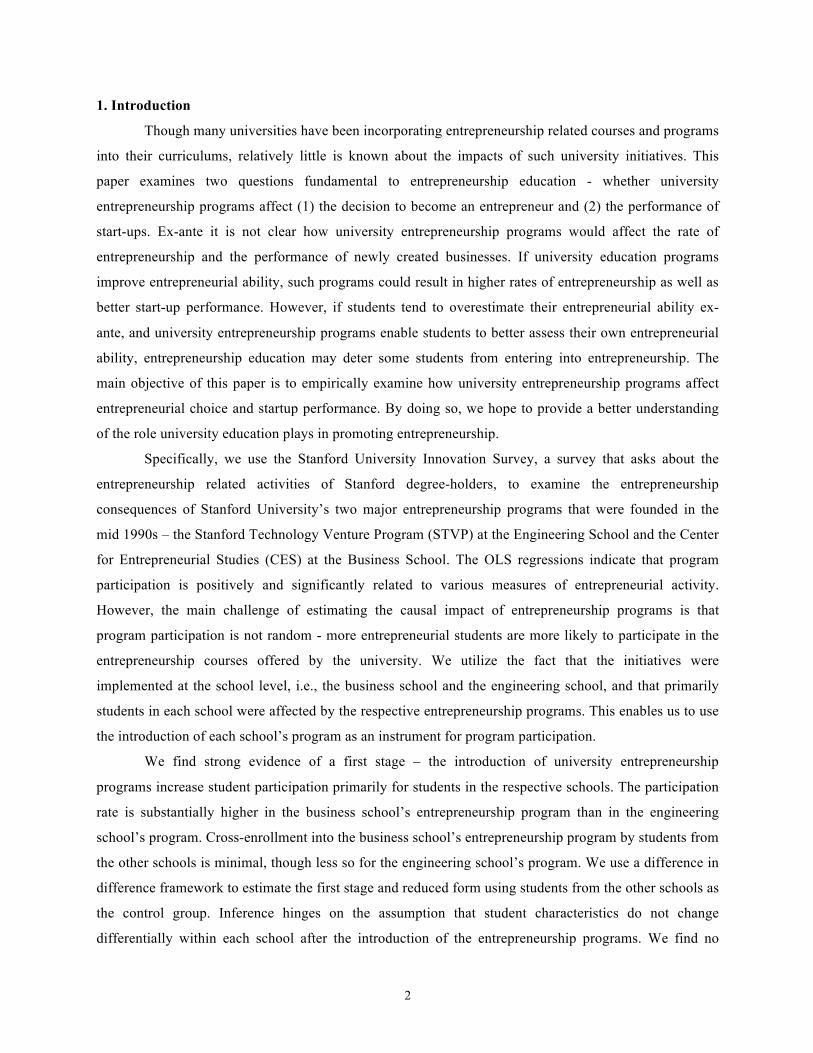
Figure 2 overlays the participation rate in STVP. Participation in STVP jumps for the engineering
school students starting with the 1998 cohort. However, the increase in participation is substantially
smaller in magnitude compared to the CES participation among business school students. Also, business
school students participate in the STVP program, notably starting with the 2000 cohorts.
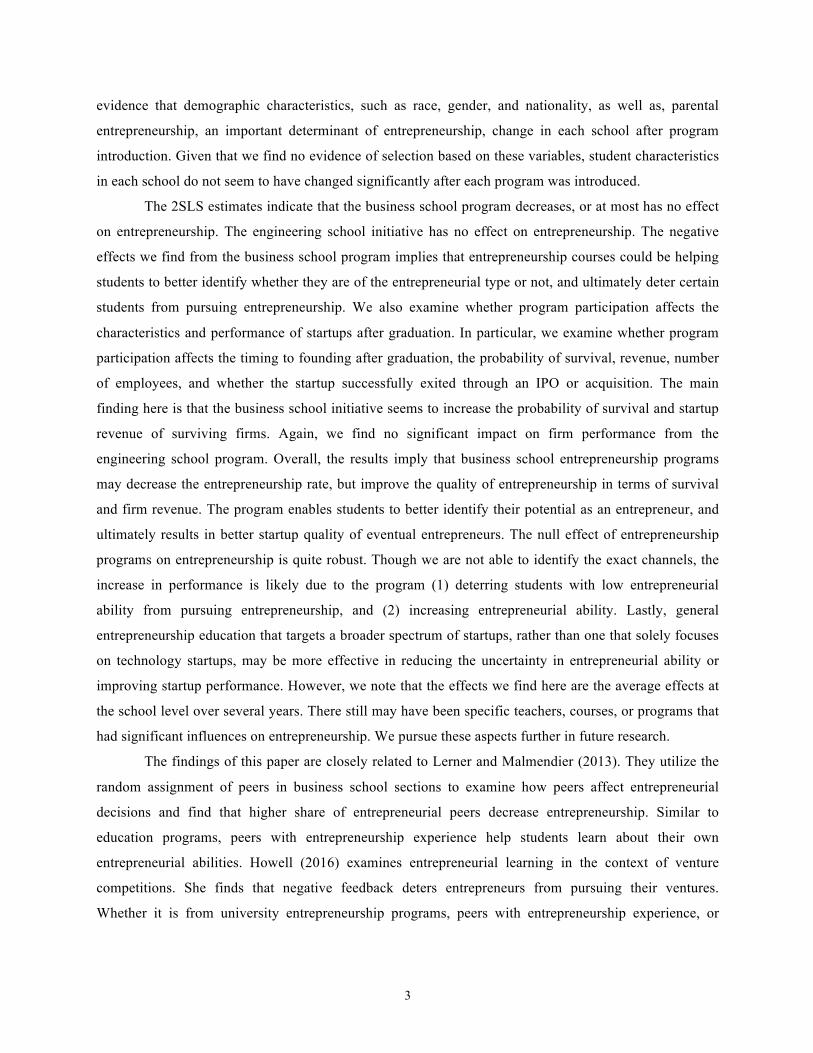
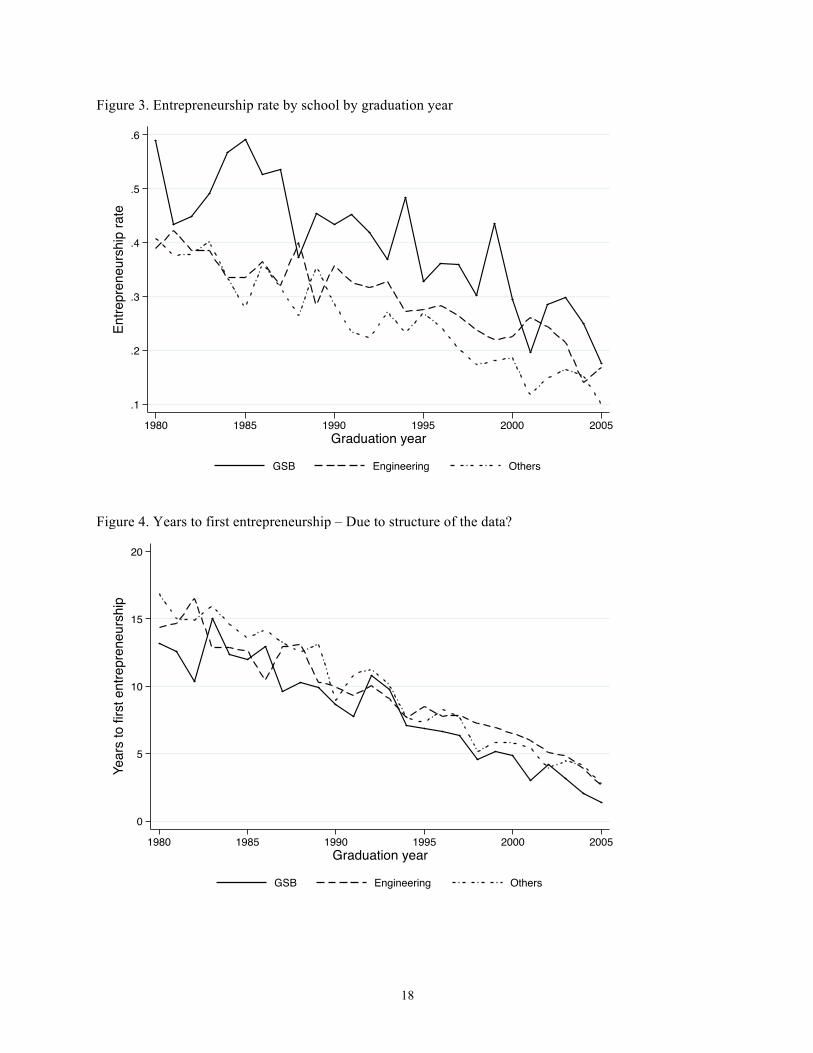
Figure 3 illustrates the entrepreneurship rate since the 1980s. The entrepreneurship rate hovers
around 0.4 to 0.5 among the 1980s cohort and declines afterwards. The business school students in
general have a higher entrepreneurship rate than those from the other schools. The trends across all three
school categories seem similar after the mid 1990s. Figure 4 presents years to first entrepreneurship after
graduation. There is a declining trend across all three schools, indicating that students that become
entrepreneurs are starting sooner. Starting in the mid-1990s business school students seem to be starting
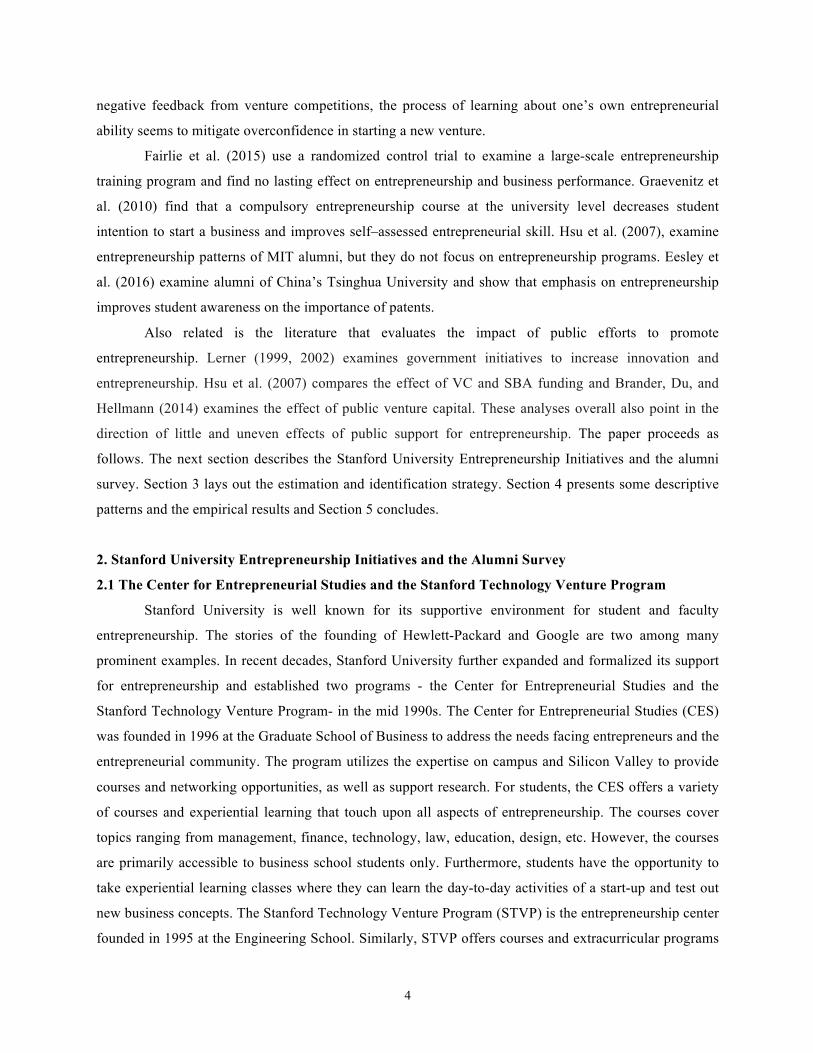
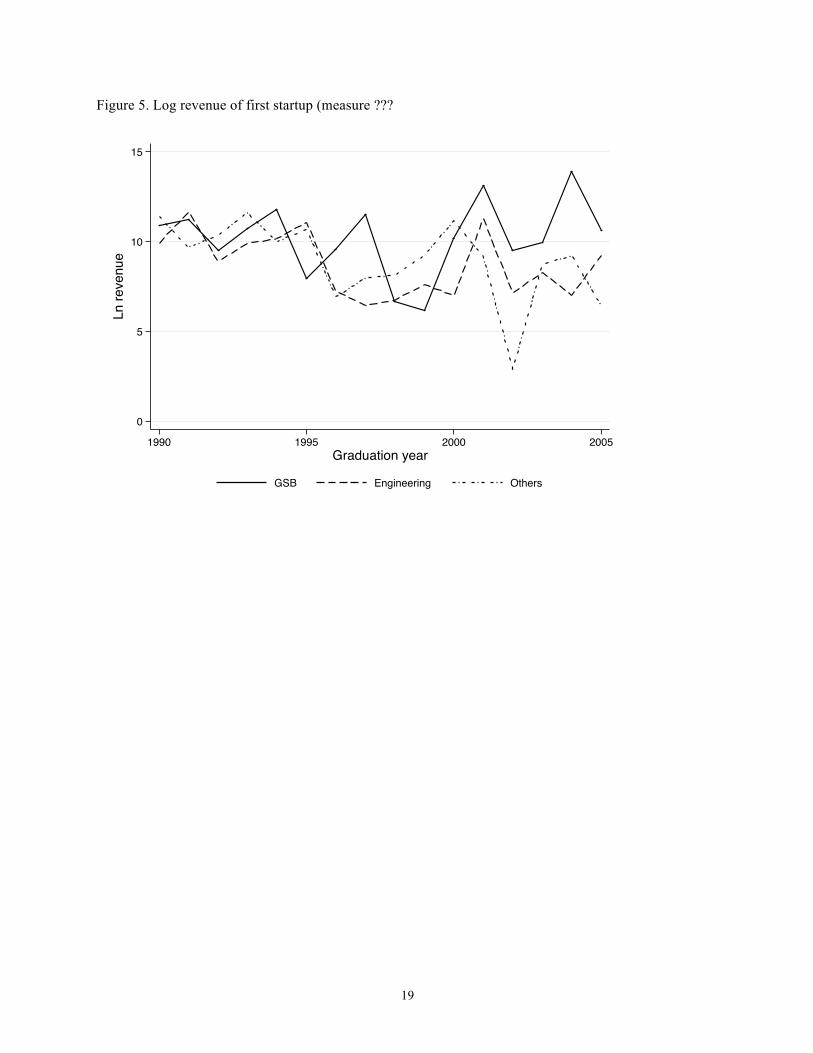
startups earlier than students from the other schools. Figure 5 examines the log revenue in 2011 for
9
surviving startups. Revenue generally declines in firms created by more recent graduates from the
engineering and other schools. However, revenue remains steady, and actually, seems to increase with
cohort among business school students. Overall, the figures indicate that CES participation rose
substantially among business school graduates after the mid 1990s, and that years to first startup and
revenue of first startup by business school graduates may have diverged from graduates from the other
schools. In the following sections, we examine whether these patterns are statistically meaningful.
4.2. Results on Entrepreneurship
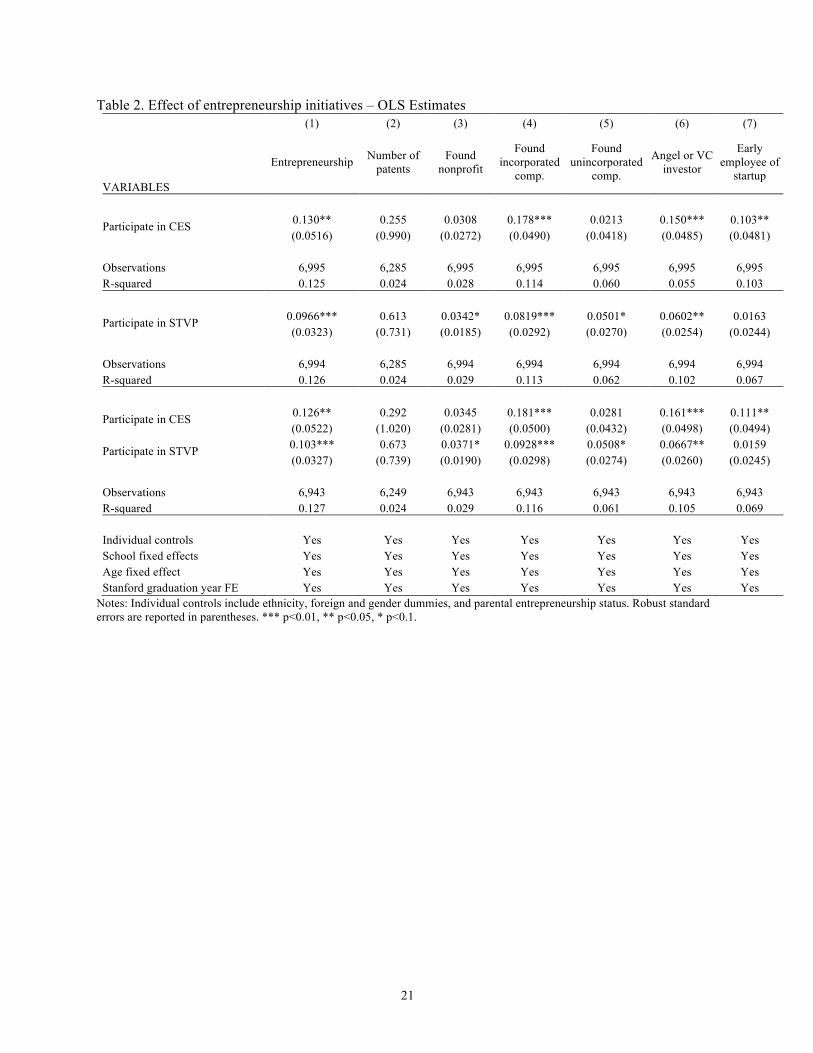
Table 2 examines the relationship between program participation and various measures of
entrepreneurship in an OLS framework. Column (1) examines entrepreneurship, defined as the founding
of any new organization. CES and STVP participation are related to about a 13 percent and 10 percent
higher entrepreneurship rate. Both estimates are statistically significant at the 5 percent level. However,
we find no effect on the number of patents. In terms of the type of organization that is being found, the
strongest effect is on incorporated companies. We also find that program participation in either program is
positively associated with becoming an angel or VC investor. CES participation is strongly related to
becoming an early employee of a startup as well. The OLS regressions in Table 2 all control for ethnicity
(white, black, Asian, Hispanic, and other), foreign citizenship, gender, and parental entrepreneurship
status, and include cohort, school, and age fixed effects. We also control for the small number of students
who participate in both programs and students who were Stanford University undergraduates and business
school graduates. However, the OLS estimates are likely biased upwards because of individual level
omitted variables. Students with high entrepreneurial ability and motivation are likely to participate in the
entrepreneurship programs even among students in the same cohort in the same school. Our identification
strategy aims to alleviate endogeneity by taking advantage of the fact that students from the business
schools were exposed to the entrepreneurship program after 1996 but students from the other schools
were not able to participate in these programs (other than in rare cases where students petitioned to take
classes). Stanford University’s business school admits only graduate students and aims to retain
exclusivity even within campus by limiting cross enrollment (which helps the Graduate School of
Business retain its cachet and justify the high tuition costs). In other words, we utilize a difference in
difference framework to examine how take-up in the CES changed among Stanford students and then
ultimately to entrepreneurship and innovation related activities. We employ a similar strategy to estimate
the impact of STVP.
Figures 1 and 2 visually present how participation in the CES and STVP evolved across different
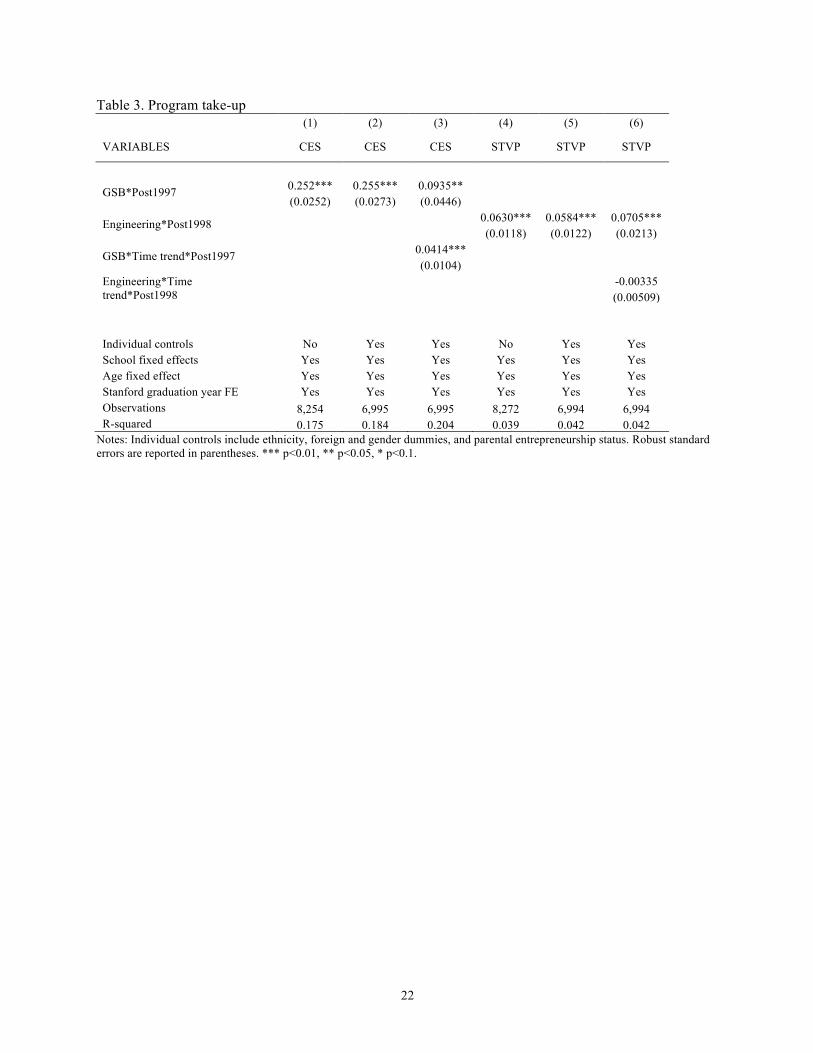
schools. In Table 3 columns (1) and (2), we present estimates from a regression of CES participation on
the business school graduate dummy interacted with the post 1997 dummy. School, age, and graduating
10
year fixed effects are included in column (1), and column (2) additionally controls for the individual
characteristics. The coefficient estimate is significant at 0.255, indicating that on average 25.5 percent of
the business school (GSB) students participated in the CES program after its introduction. However, as
figure 1 indicates, the jump is not a step function. Participation jumps up a bit initially and continues to
increase over the years. This reflects both the growth of the program curriculum, increasing advertisement
from the school, and student interest. Hence, in column (3) we capture this trend by additionally including
a GSB specific time interacted with the post 1997 dummy. The initial jump is reduced to about 9 percent
and participation increases each year by about 4 percentage points. In columns (4) to (6) we examine
STVP participation. STVP participation among engineering students is smaller in magnitude, at about 6
percent, after program introduction. And as column (6) indicates the coefficient estimates on the
engineering school specific time trend is indistinguishable from zero. Table 3 presents the first stage of
the 2SLS regression strategy and the results confirm that there is a strong and significant first stage effect
of program introduction on program participation. We use the variables in column (3) and (6) as the base
specification for the instrumental variable strategy, but also use a simpler version of the instrumental
variable, i.e., school dummy interacted with the post dummy, and a more complicated version, i.e., school
dummy interacted with year dummies, as robustness checks.
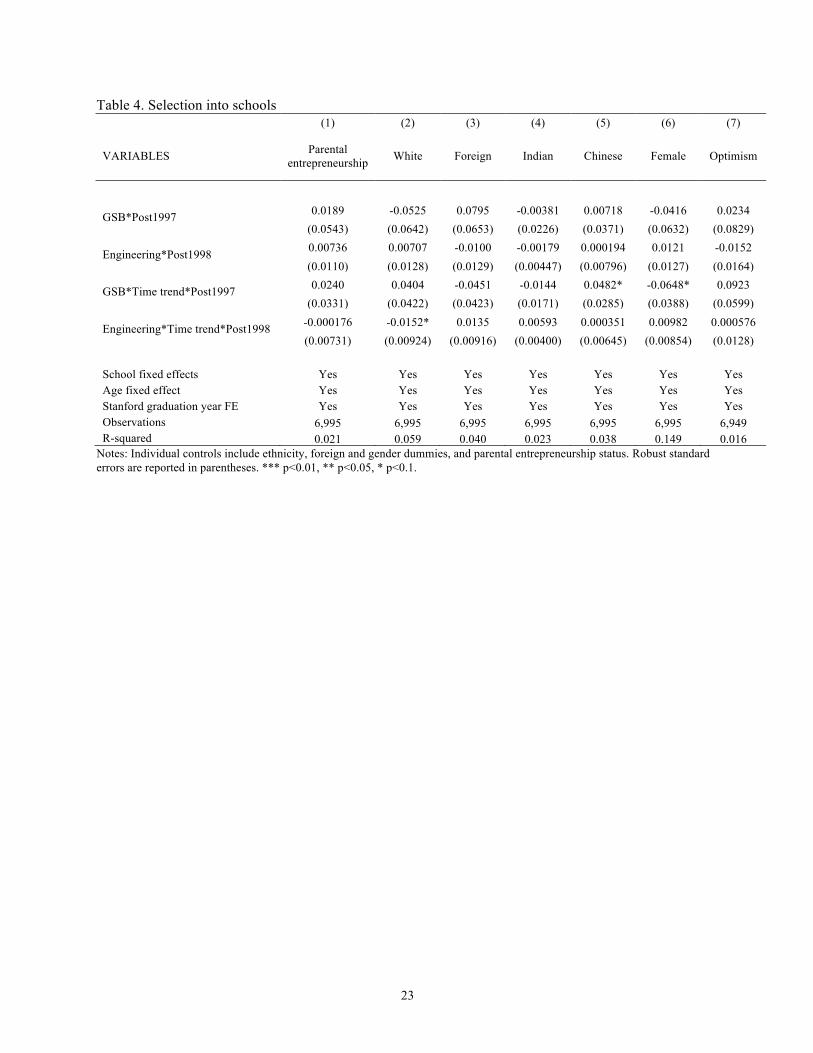
The identification assumption that uses the Table 3 results as the first stage of the 2SLS
regression requires that unobserved student characteristics that affect entrepreneurship did not change
differentially before and after the programs were introduced in the relevant schools. In Table 4 we
examine this for a set of observable individual characteristics. In column (1) we examine whether parental
entrepreneurship changed differentially with the introduction of the program across schools. The literature
has found that parental entrepreneurship is a strong determinant of entrepreneurial choice. We find no
significant differences in parental entrepreneurship status between the GSB students before and after
1997, or the engineering school students before and after 1998. In columns (2) to (6), we examine the
share of white students, foreign students, Indian students, and Chinese students. Indian and Chinese
students have played an important role in Silicon Valley entrepreneurship as highlighted by Saxenian
(1999). None of the coefficient estimates are significant at the 5 percent level. Finally, in column (7) we
examine a measure of optimism. We use the answers to the statement, “Overall, I expect more good
things to happen to me than bad”, in a 1 to 5 scale. Again, there is no evidence of any jump or differential
trend among students entering the GSB or Engineering School. Table 4 results indicate that selection is
unlikely to be a major concern in the first stage results of Table 3.
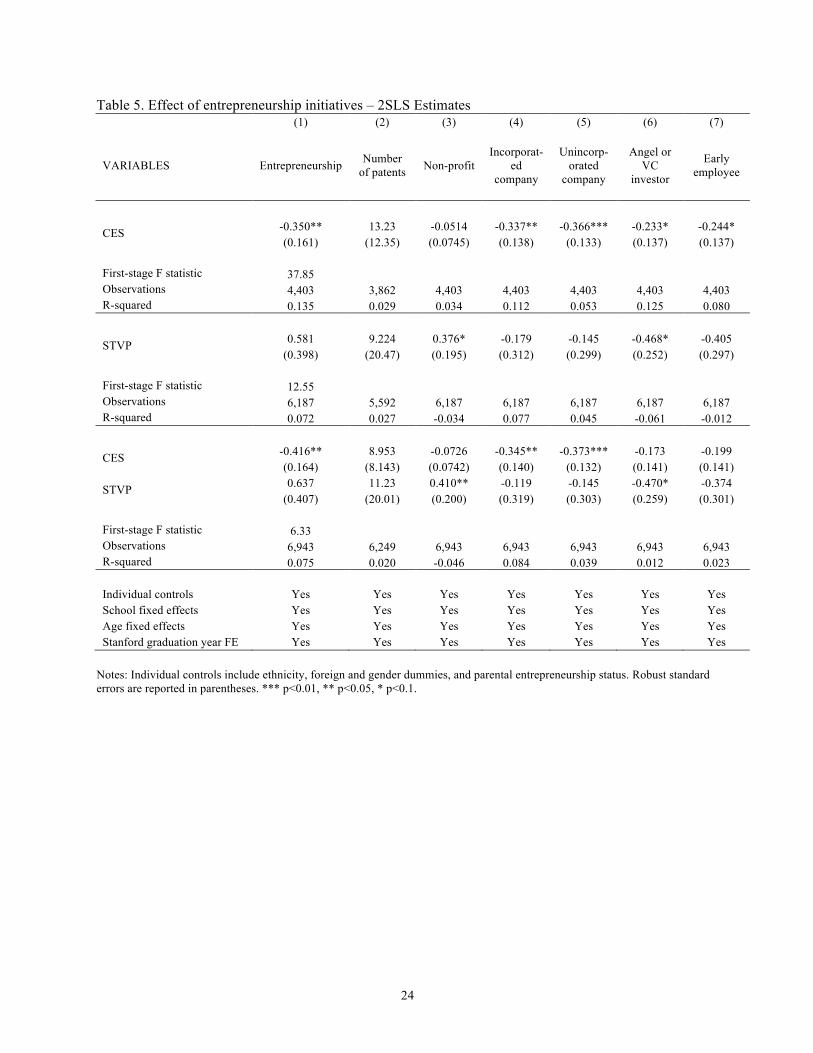
Table 5 presents the 2SLS results. In Panel A, we instrument CES participation with the business
school interacted with the post 1997 dummy. Now we find a negative effect of CES program on
entrepreneurship. Participation in CES results in a 35 percent reduction in the probability of
11
entrepreneurship. The 2SLS estimates represents the local average treatment effect, i.e., the impact of
those who participate in the CES program only because it was available. Panel B indicates that the impact
of STVP on entrepreneurship is not significant. In Panel C, we examine the impact of CES and STVP in
the same regression and use both sets of instrumental variables. The large negative result for CES
remains. The negative impact of CES holds for both the startup of incorporated and unincorporated firms,
as well as future investor status or becoming an early employee in a startup. There is some evidence that
participation in the STVP increases the probability of founding a non-profit.
The finding that entrepreneurship education reduces the incidence of entrepreneurship likely
reflects that these programs enable students to better realize whether he or she is of the entrepreneurial
type. If this is the case, one would expect to see better startup performance by those who eventually
decide to become entrepreneurs.
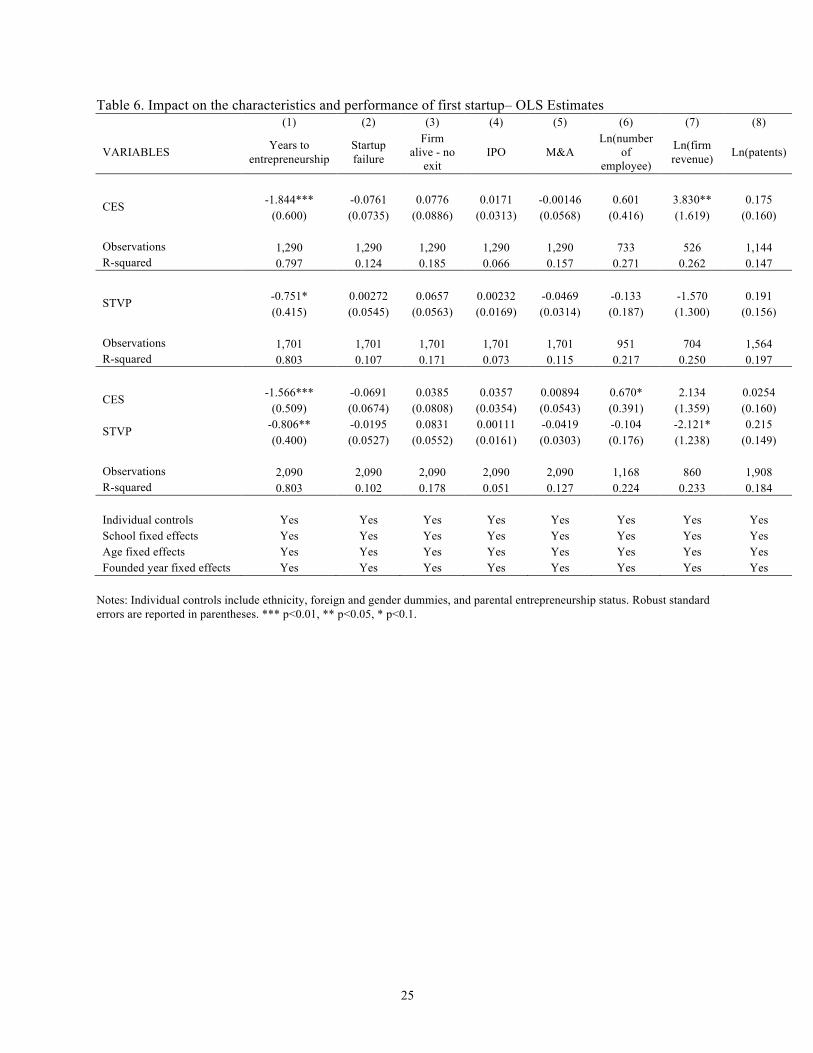
4.3. Results on the Characteristics and Performance of Startups
We next examine how the university entrepreneurship programs affect the characteristics and
performance of the first startup after graduation. In particular, we examine the time to first startup,
probability of failure, survival as a private entity, successful exit through an IPO or M&A, number of
employees, revenue, and patenting. These results are conditional on entrepreneurship, hence reflect the
impact that the programs directly have on these outcomes as well as the selection effect induced by the
programs, i.e., the program may have induced potentially low entrepreneurial ability students to not
pursue entrepreneurship. We first examine OLS results in Table 6. The CES program is associated with
about 1.8 year reduction in the timing to first startup and considerably larger revenue among firms that
were alive by the time of the survey. The STVP program is not systematically related to any of the firm
characteristics or performance measures, other than weakly reducing the timing to startup by about 0.75
year.
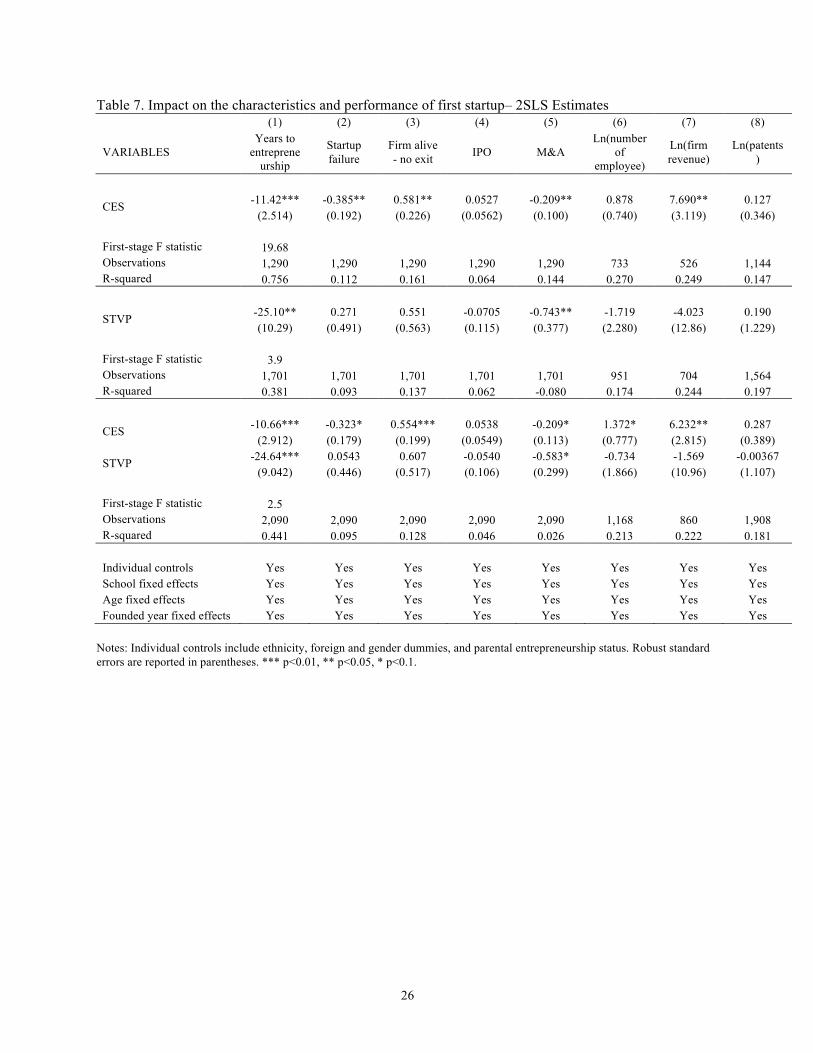
Table 7 presents the 2SLS estimates. The impact of both programs on time to startup becomes
larger in magnitude to -11 years for the CES and -25 years for the STVP. Focusing on the CES effects,
we find that participation in the CES decreases the probability of failure by 38.5%, increases the
probability that a firm remains private and alive by 58%, and reduces the probability that the firm will be
acquired by 21%. Also, the log revenue of the startup in the year of survey increases substantially by 7.7.
On the other hand, other than a reduction in M&A of the startup, there is no significant impact of STVP
on firm performance. Could perhaps include a discussion note that these may be upper bounds on the
estimate due to the high quality of the network, instruction and reputation at Stanford and location in
Silicon Valley. Also, students at this early stage in their careers may experience a relatively bigger boost
even relative to similar training provided to older, more experienced individuals who already have an

12
extensive social network and industry experience. If we are to find an effect of such programs, then at the
earlier stages of individuals careers may be a more promising place to look.
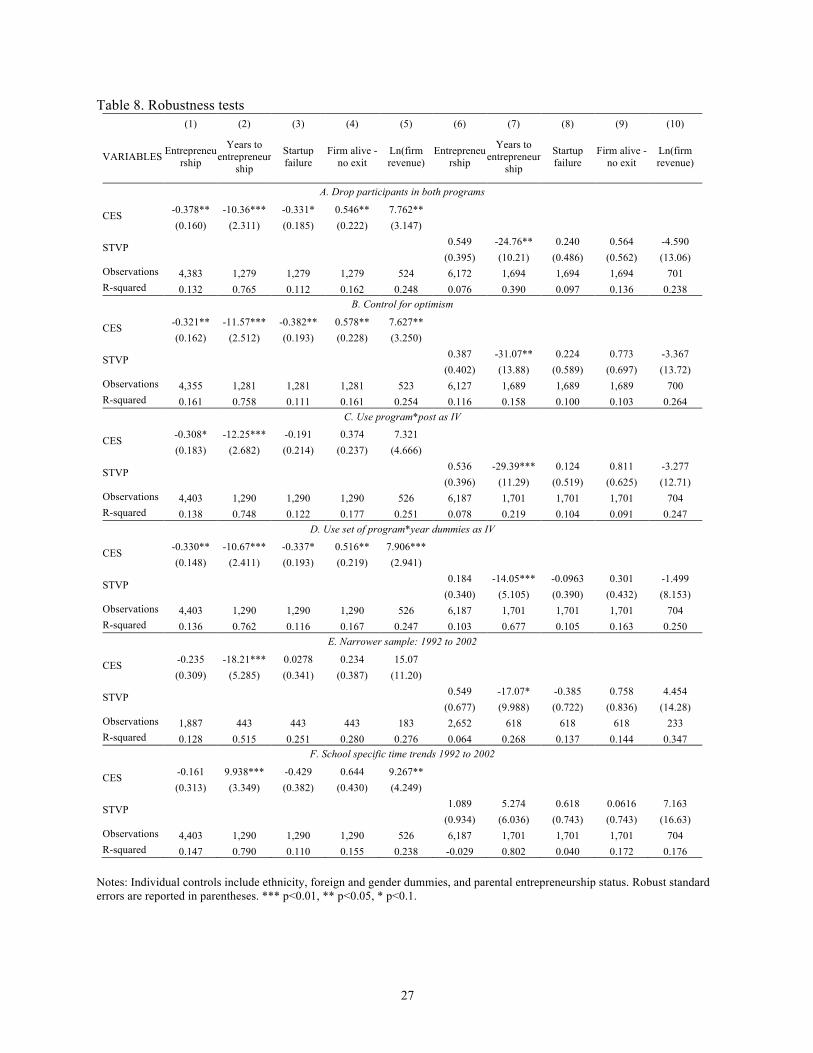
In Table 8 we examine the robustness of the results. In Panel A, we drop respondents who had
participated in both programs and in Panel B we add an additional control for our measure of optimism.
The estimates are very similar to those above. In Panels C and D, we use different instrumental variables.
In Panel C we use just the program dummy interacted with the post year dummy. In Panel D, we use the
program dummy interacted with the set of post year dummies. Again, the results are similar qualitatively
and in magnitude. Lastly, we use a narrower sample in Panel E, i.e., only respondents who graduated
between 1992 and 2002. Using the narrower sample allows us to focus on the years around the
introduction of the new initiatives. However, we lose statistical power as the sample becomes smaller.
The signs of the coefficient estimates in Panel E are generally the same to what we found before.
However, only the coefficient estimate on years to entrepreneurship is statistically significant.
Finally, another concern with our base specification is that there might be unobserved school
specific factors that change over the years and affect entrepreneurial activities at the school level. Since
we cannot include school-time specific dummy variables, we instead control for school specific time
trends, i.e., each school dummy interacted with graduation year in Panel F. Including this time trend
allows us to capture unobserved school specific factors in a particular way, but only through the restricted
parametric linear form. The effect of CES on entrepreneurship in column (1) is still negative and nearly
halves in magnitude, but is no longer statistically significant. However, the impact on years to
entrepreneurship is now positive at 10 years and statistically significant. This indicates that the results on
years to entrepreneurship are very sensitive to the different model specifications. The column (4) results
on probability of firms staying private is positive at 0.64, which is similar to the previous estimates, and
just misses the 10 percent significance cut off. The impact on firm revenue is also similar to before and
significant at the 5% level.
Overall, the 2SLS results from Table 7 and Table 8 imply that CES participation does not
increase the rate of entrepreneurship and may actually decrease entrepreneurship. However, the negative
or null impact on entrepreneurship results in better performance of startups. Startups are more likely to
stay alive and surviving startups tend to perform better.
We further explore which margins might be at work to increase firm performance. Many factors
including, financing, industry, or networking could affect firm performance. The survey collects data on
one of the respondent’s startups. If the respondent founded multiple startups, the survey randomly asks
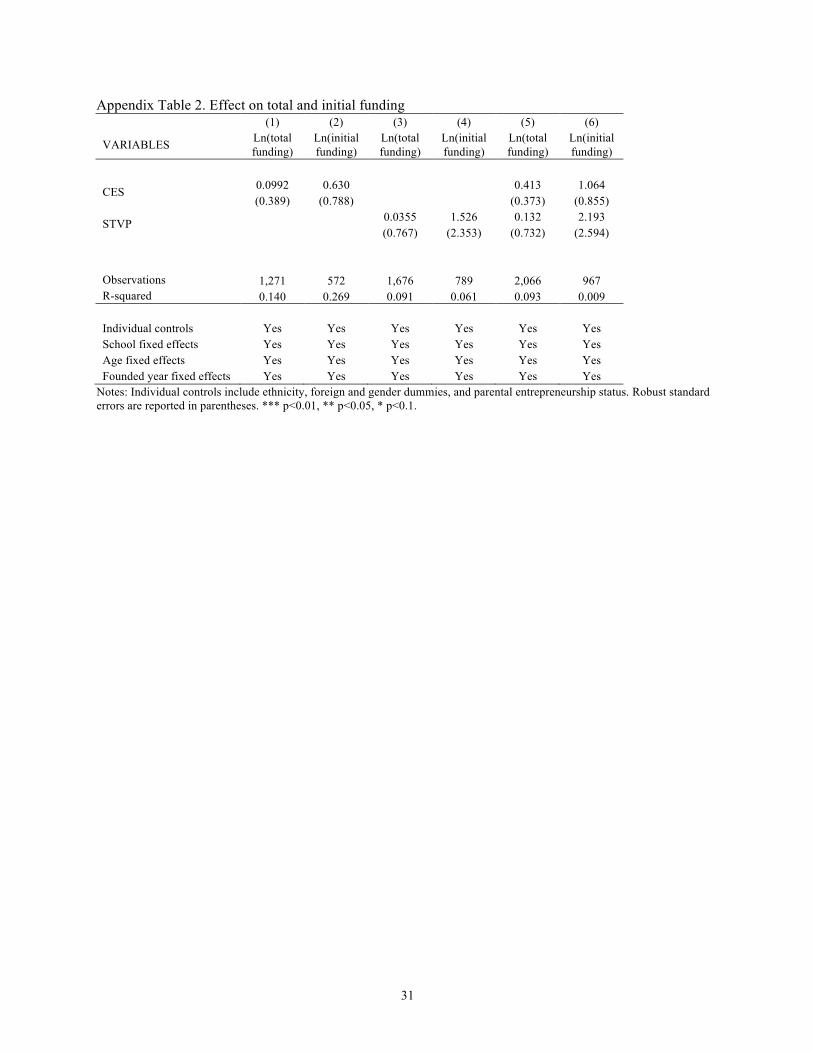
the respondent additional details about one firm. We examine the information on financing, in particular,
total financing up till the survey date and initial financing, but find no significant results. These results are
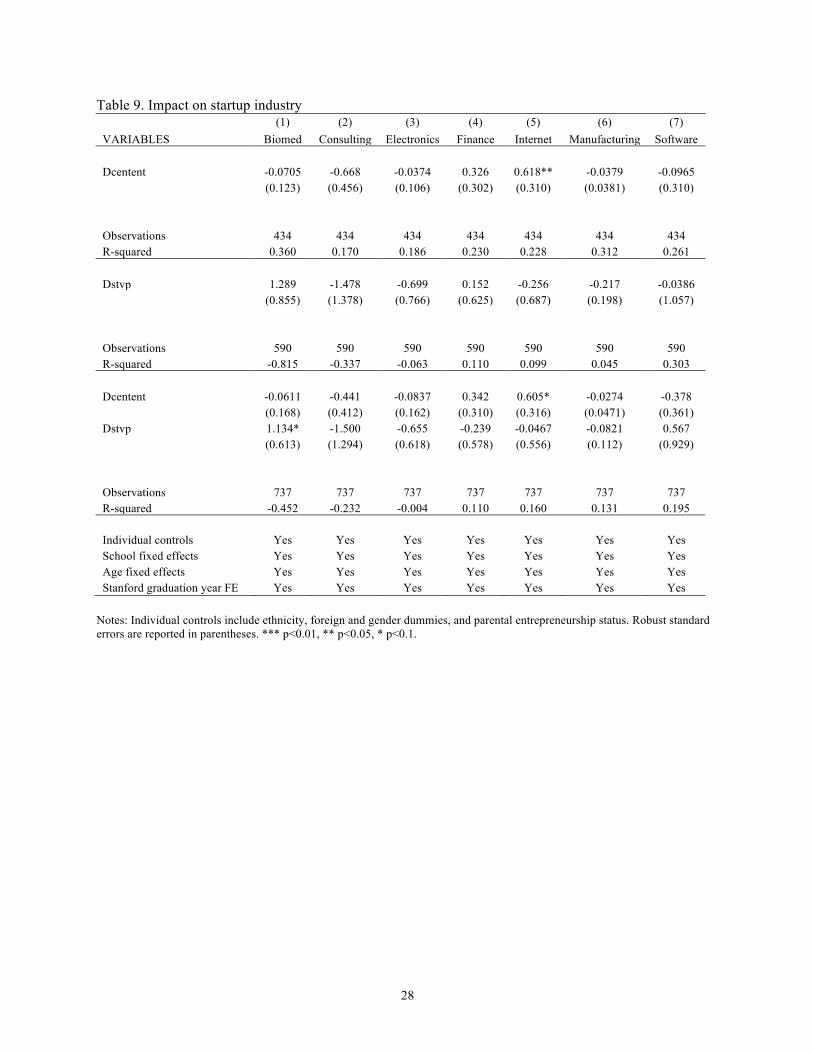
presented in Appendix Table 2. We also examine industry choice and networking activity. The 2SLS
13
results in Table 9 indicate that CES participation increases startup of internet related businesses. We do
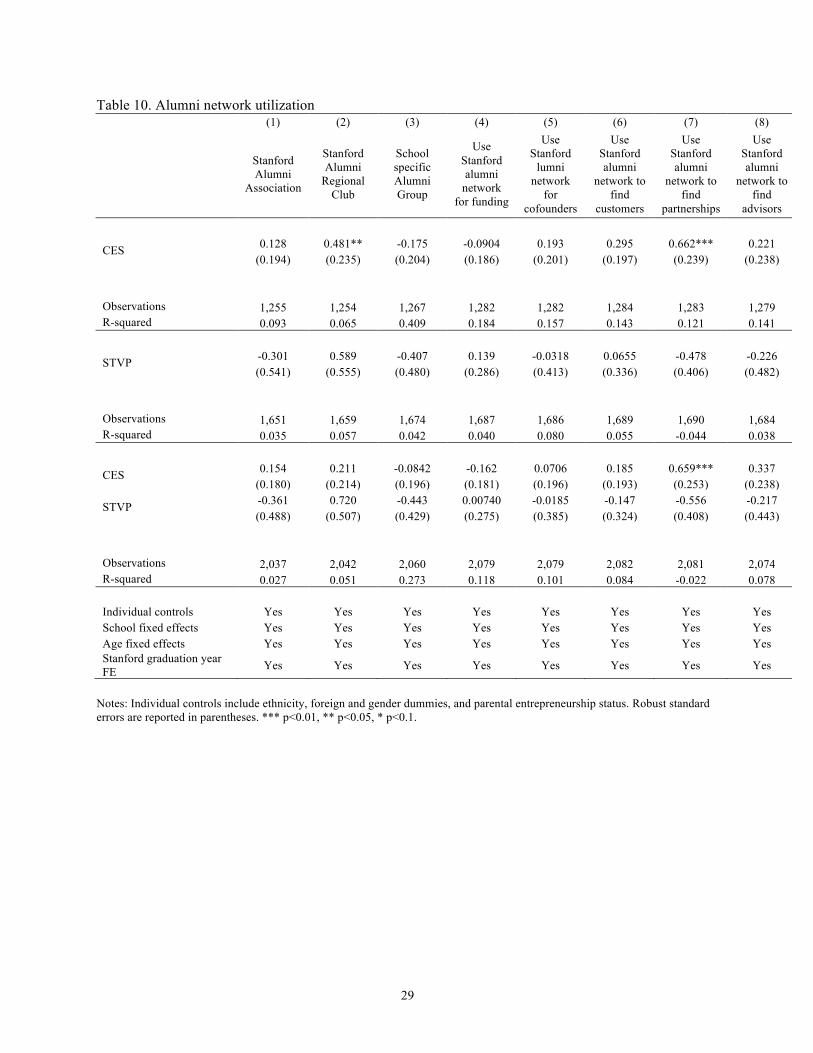
not find any significant impact of STVP on the industry type of startups. Lastly, we find that CES
participation significantly increases utilization of Stanford alumni networks via regional alumni clubs and
to find business partnerships.
5. Conclusion
Entrepreneurship education programs and university entrepreneurship centers have proliferated
over the past decade. Prior literature analyzing the impact of such programs, has been sparse, providing
little in the way of quantitative assessments of their impact on students and alumni. Related work
examining the social influence of classmates with entrepreneurial experience, venture competitions,
compulsory entrepreneurship courses, and non-university entrepreneurship training programs show
somewhat mixed results (Lerner and Malmendier, 2013; Graevenitz et al., 2010). Yet, this work suggests
that such programs may reduce entrepreneurship rates and have little impact on venture performance
(Fairlie et al., 2015; Howell, 2016). However, such pioneering work leaves open the question of whether
such results are due to the educational content, structure of the programs, small numbers of observations,
or whether more formalized entrepreneurship centers may exhibit a more positive impact on students and
alumni.
This paper contributes to this increasingly important area of literature by examining two major
entrepreneurship initiatives at Stanford University and their influence on entrepreneurial activity among
alumni. We find that program participation is positively associated with entrepreneurial activities. Yet,
when self-selection of more entrepreneurial students into these programs is taken into account, we find
that these programs have a negative to zero impact on entrepreneurship. We do find, however, that the
business school initiative resulted in a decreased probability of startup failure and increased firm revenue.
These findings suggest that university entrepreneurship programs may provide important feedback on
students’ potential as entrepreneurs. By weeding out lower quality ventures and increasing social
networking among regional alumni, university entrepreneurship programs may improve the quality of
those who decide to start firms. Thus, we also contribute by showing suggestive evidence for regional
networking with fellow alumni for partnerships, advice, or other resources as an important, previously
overlooked mechanism in university entrepreneurship programs. Future work may also wish to examine
entrepreneurial behavior in the context of larger organizations in addition to founding new ventures.
Many of the students who participate in these programs do not go on to create startups, yet they may act
in an entrepreneurial way within the context of established organizations. This type of outcome has not
been previously explored, yet the possibility is suggested by our findings that related career choices such
as being an early employee or investor also appear to be associated with participation in the programs.
14
Relative to prior work on university entrepreneurship and alumni, we examine entrepreneurial
actions rather than intentions (Graevenitz et al., 2010) and we examine entrepreneurial activity related to
coursework rather than driven by social influence (Lerner and Malmendier, 2013). Relative to the work
on business training or venture feedback (Fairlie et al., 2015; Howell, 2016), we find some positive
impacts of university entrepreneurship education. This difference in results may be due to the greater
length or depth of engagement in the university programs relative to business training or venture
competitions. Some of the difference could also be due to a bigger learning impact in the younger
university sample. It could also be due to differences in the content and structure of these programs as
well as the ability to network among university alumni. Future work is merited to explore these issues in
greater detail given the different outcomes between university entrepreneurship programs and other
business training or competition formats. In conclusion, if university students and alumni entrepreneurs
are the next generation of potential entrepreneurs, such university entrepreneurship initiatives may play an
important role in funneling the winds of creative destruction (Schumpeter, 1942).
15
References
Blanchflower, David G., and Andrew J. Oswald. ”What Makes An Entrepreneur?” Journal of Labor Economics: 26-60.
Brander, James A., Qianqian Du, and Thomas Hellmann. 2015. “The Effects of Government-Sponsored Venture Capital: International Evidence.” Review of Finance, 19(2): 571-618.
Duflo, Esther. 2001. “Schooling and Labor Market Consequences of School Construction in Indonesia: Evidence from an Unusual Policy Experiment Schooling and Labor Market Consequences of School Construction in Indonesia: Evidence from an Unusual Policy Experiment.” American Economic Review, 91(4): 795-813.
Djankov, S., Y. Qian, G. Roland, E. Zhuravskaya. 2007. What makes a successful entrepreneur? evidence from brazil. Working Paper 0104, Center for Economic and Financial Research.
Eesley, C.; J.B. Li, and D. Yang. 2016. Does Institutional Change in Universities Influence High-Tech Entrepreneurship?: Evidence from China’s Project 985. Organization Science, Volume: 27, Number: 2 (March-April): 446-461. Eesley, Charles E. and William Miller. 2012. “Impact: Stanford University Economic Impact via Innovation and Entrepreneurship.”
Fairlie, Robert W. 1999. “The Absence of the African-American Owned Business: An Analysis of the Dynamics of Self-Employment,” Journal of Labor Economics, 17(1): 80-108
Fairlie, Robert W., and Alicia M. Robb. 2007. “Behind the GATE Experiment: Evidence on Effects of and Rationales for Subsidized Entrepreneurship Training,” American Economic Journal: Economic Policy. 7(2): 125-161.
Fairlie, Robert W., Dean Karlan, Jonathan Zinman, 2015. “The Absence of the African-American Owned Business: An Analysis of the Dynamics of Self-Employment,” Journal of Labor Economics, 17(1): 80-108
Graevenitz, Georg von, Dietmar Harhoff, and Richard Weber. 2010. “The Effects of Entrepreneurship Education.” Journal of Economic Behavior & Organization, 76: 90-112.
Hsu, David; Roberts, E.B.; Eesley, Charles. 2007. Entrepreneurs from Technology-Based Universities: Evidence from MIT. Research Policy 36, 768-788.
Huber, Laural Rosendahl, Randolph Sloof, and Mirjam Van Praag. 2014. “The Effect of Early Entrepreneurship Education: Evidence from a Field Experiment.” European Economic Review, 72: 76-97.
Hurst, Erik, and Benjamin Wild Pugsley. ”What Do Small Businesses Do?” Brookings Papers on Economic Activity: 73-118.
Lazear, Edward P. 2005. ”Entrepreneurship.” Journal of Labor Economics, 23: 649-80.
Lee, Yong Suk. ”Entrepreneurship, Small Businesses, and Economic Growth in Cities.” Journal of Economic Geography, forthcoming.
16
Lerner, Josh. 1999. “The Government as Venture Capitalist: The Long-Run Effects of the SBIR Program.” Journal of Business, 72: 285-318. Lerner, Josh. 2002. “When Bureaucrats Meet Entrepreneurs: The Design of Successful ‘Public Venture Capital’ Programs.” Economic Journal, 112(477): 73-84. Lerner, Josh, and Ulrike Malmendier. 2013. “With a Little Help from My (Random) Friends: Success and Failure in Post-Business School Entrepreneurship.” Review of Financial Studies, 26(10): 2411-2452. Saxenian, AnnaLee. Silicon Valley’s New Immigrant Entrepreneurs. San Francisco: Public Policy Institute of California, 1999.
Schumpeter, J., 1942. Creative destruction. Capitalism, socialism and democracy, pp.82-5.
17
Figure 1. Center for Economic Studies participation rate by graduation year
Figure 2. Center for Economic Studies and Stanford Technology Venture Program participation rate
0
.1
.2
.3
.4
.5CE
S pa
rticip
atio
n ra
te
1980 1985 1990 1995 2000 2005Graduation year
GSB Engineering Others
0
.1
.2
.3
.4
.5
Prog
ram
par
ticip
atio
n ra
te
1980 1985 1990 1995 2000 2005Graduation year
GSB_CES Engineering_CES Others_CESGSB_STVP Engineering_STVP Others_STVP
18
Figure 3. Entrepreneurship rate by school by graduation year
Figure 4. Years to first entrepreneurship – Due to structure of the data?
.1
.2
.3
.4
.5
.6En
trepr
eneu
rshi
p ra
te
1980 1985 1990 1995 2000 2005Graduation year
GSB Engineering Others
0
5
10
15
20
Year
s to
firs
t ent
repr
eneu
rshi
p
1980 1985 1990 1995 2000 2005Graduation year
GSB Engineering Others
19
Figure 5. Log revenue of first startup (measure ???
0
5
10
15
Ln re
venu
e
1990 1995 2000 2005Graduation year
GSB Engineering Others
20
Table 1. Summary statistics Variable Mean Std. Dev. Min Max Obs
Panel A. Main sample Participate in Center for Entrepreneurial Studies 0.0182988 0.1340392 0 1 6995 Participate in Stanford Technology Ventures Program 0.0311105 0.1736288 0 1 6943 Graduate School of Business student 0.1152252 0.3193163 0 1 6995 Engineering School student 0.3705504 0.4829867 0 1 6995 First year graduated from Stanford 1993.024 7.675716 1980 2005 6995 Entrepreneurship - founded a new organization 0.2974982 0.4571902 0 1 6995 Number of patents 2.605179 27.60914 0 2000 6285 Founded a non-profit 0.0510365 0.2200878 0 1 6995 Founded an incorporated company 0.161258 0.3677951 0 1 6995 Founded an unincorporated company 0.1476769 0.3548048 0 1 6995 Invest as an angel investor of venture capitalist 0.0993567 0.2991617 0 1 6995 Been an early employee at an entrepreneurial firm 0.1205147 0.3255857 0 1 6995 Stanford Alumni Association 0.6587185 0.4741743 0 1 6836 Stanford Alumni Regional Club 0.3604039 0.4801527 0 1 6834 School specific Alumni Group 0.2073365 0.4054281 0 1 6897 Use Stanford alumni network for funding 0.0459638 0.2094217 0 1 6962 Use Stanford lumni network for cofounders 0.075431 0.2641046 0 1 6960 Use Stanford alumni network to find customers 0.0580877 0.233926 0 1 6955 Use Stanford alumni network to find partnerships 0.0784511 0.2688995 0 1 6947 Use Stanford alumni network to find advisors 0.1452079 0.3523357 0 1 6928 Panel B. First startup variables Years to first founding after graduation 10.32 6.88 0 31 2101 Startup fails 0.2571968 0.437192 0 1 2119 Startup alive - no exit 0.5955639 0.4908984 0 1 2119 Exit through IPO 0.0188768 0.1361221 0 1 2119 Exit through acquisition 0.1005191 0.3007619 0 1 2119 Ln(revenue) in 2011 9.571727 5.824071 0 27.72633 1399 Ln(number of employee) in 2011 1.800295 1.471483 0 9.546884 1880 Ln(total number of patent issued) 0.3275461 0.9111791 0 10.30899 1592
21
Table 2. Effect of entrepreneurship initiatives – OLS Estimates (1) (2) (3) (4) (5) (6) (7)
VARIABLES
Entrepreneurship Number of patents
Found nonprofit
Found incorporated
comp.
Found unincorporated
comp.
Angel or VC investor
Early employee of
startup
Participate in CES 0.130** 0.255 0.0308 0.178*** 0.0213 0.150*** 0.103** (0.0516) (0.990) (0.0272) (0.0490) (0.0418) (0.0485) (0.0481)
Observations 6,995 6,285 6,995 6,995 6,995 6,995 6,995 R-squared 0.125 0.024 0.028 0.114 0.060 0.055 0.103
Participate in STVP 0.0966*** 0.613 0.0342* 0.0819*** 0.0501* 0.0602** 0.0163 (0.0323) (0.731) (0.0185) (0.0292) (0.0270) (0.0254) (0.0244)
Observations 6,994 6,285 6,994 6,994 6,994 6,994 6,994 R-squared 0.126 0.024 0.029 0.113 0.062 0.102 0.067
Participate in CES 0.126** 0.292 0.0345 0.181*** 0.0281 0.161*** 0.111** (0.0522) (1.020) (0.0281) (0.0500) (0.0432) (0.0498) (0.0494)
Participate in STVP 0.103*** 0.673 0.0371* 0.0928*** 0.0508* 0.0667** 0.0159 (0.0327) (0.739) (0.0190) (0.0298) (0.0274) (0.0260) (0.0245)
Observations 6,943 6,249 6,943 6,943 6,943 6,943 6,943 R-squared 0.127 0.024 0.029 0.116 0.061 0.105 0.069 Individual controls Yes Yes Yes Yes Yes Yes Yes School fixed effects Yes Yes Yes Yes Yes Yes Yes Age fixed effect Yes Yes Yes Yes Yes Yes Yes Stanford graduation year FE Yes Yes Yes Yes Yes Yes Yes
Notes: Individual controls include ethnicity, foreign and gender dummies, and parental entrepreneurship status. Robust standard errors are reported in parentheses. *** p<0.01, ** p<0.05, * p<0.1.
22
Table 3. Program take-up (1) (2) (3) (4) (5) (6)
VARIABLES CES CES CES STVP STVP STVP
GSB*Post1997 0.252*** 0.255*** 0.0935** (0.0252) (0.0273) (0.0446)
Engineering*Post1998 0.0630*** 0.0584*** 0.0705*** (0.0118) (0.0122) (0.0213)
GSB*Time trend*Post1997 0.0414*** (0.0104)
Engineering*Time trend*Post1998
-0.00335 (0.00509)
Individual controls No Yes Yes No Yes Yes School fixed effects Yes Yes Yes Yes Yes Yes Age fixed effect Yes Yes Yes Yes Yes Yes Stanford graduation year FE Yes Yes Yes Yes Yes Yes Observations 8,254 6,995 6,995 8,272 6,994 6,994 R-squared 0.175 0.184 0.204 0.039 0.042 0.042
Notes: Individual controls include ethnicity, foreign and gender dummies, and parental entrepreneurship status. Robust standard errors are reported in parentheses. *** p<0.01, ** p<0.05, * p<0.1.
23
Table 4. Selection into schools (1) (2) (3) (4) (5) (6) (7)
VARIABLES Parental entrepreneurship White Foreign Indian Chinese Female Optimism
GSB*Post1997 0.0189 -0.0525 0.0795 -0.00381 0.00718 -0.0416 0.0234 (0.0543) (0.0642) (0.0653) (0.0226) (0.0371) (0.0632) (0.0829)
Engineering*Post1998 0.00736 0.00707 -0.0100 -0.00179 0.000194 0.0121 -0.0152 (0.0110) (0.0128) (0.0129) (0.00447) (0.00796) (0.0127) (0.0164)
GSB*Time trend*Post1997 0.0240 0.0404 -0.0451 -0.0144 0.0482* -0.0648* 0.0923 (0.0331) (0.0422) (0.0423) (0.0171) (0.0285) (0.0388) (0.0599)
Engineering*Time trend*Post1998 -0.000176 -0.0152* 0.0135 0.00593 0.000351 0.00982 0.000576 (0.00731) (0.00924) (0.00916) (0.00400) (0.00645) (0.00854) (0.0128)
School fixed effects Yes Yes Yes Yes Yes Yes Yes Age fixed effect Yes Yes Yes Yes Yes Yes Yes Stanford graduation year FE Yes Yes Yes Yes Yes Yes Yes Observations 6,995 6,995 6,995 6,995 6,995 6,995 6,949 R-squared 0.021 0.059 0.040 0.023 0.038 0.149 0.016
Notes: Individual controls include ethnicity, foreign and gender dummies, and parental entrepreneurship status. Robust standard errors are reported in parentheses. *** p<0.01, ** p<0.05, * p<0.1.
24
Table 5. Effect of entrepreneurship initiatives – 2SLS Estimates (1) (2) (3) (4) (5) (6) (7)
VARIABLES Entrepreneurship Number of patents Non-profit
Incorporat-ed
company
Unincorp-orated
company
Angel or VC
investor
Early employee
CES -0.350** 13.23 -0.0514 -0.337** -0.366*** -0.233* -0.244* (0.161) (12.35) (0.0745) (0.138) (0.133) (0.137) (0.137)
First-stage F statistic 37.85 Observations 4,403 3,862 4,403 4,403 4,403 4,403 4,403 R-squared 0.135 0.029 0.034 0.112 0.053 0.125 0.080
STVP 0.581 9.224 0.376* -0.179 -0.145 -0.468* -0.405 (0.398) (20.47) (0.195) (0.312) (0.299) (0.252) (0.297)
First-stage F statistic 12.55 Observations 6,187 5,592 6,187 6,187 6,187 6,187 6,187 R-squared 0.072 0.027 -0.034 0.077 0.045 -0.061 -0.012
CES -0.416** 8.953 -0.0726 -0.345** -0.373*** -0.173 -0.199 (0.164) (8.143) (0.0742) (0.140) (0.132) (0.141) (0.141)
STVP 0.637 11.23 0.410** -0.119 -0.145 -0.470* -0.374 (0.407) (20.01) (0.200) (0.319) (0.303) (0.259) (0.301)
First-stage F statistic 6.33 Observations 6,943 6,249 6,943 6,943 6,943 6,943 6,943 R-squared 0.075 0.020 -0.046 0.084 0.039 0.012 0.023 Individual controls Yes Yes Yes Yes Yes Yes Yes School fixed effects Yes Yes Yes Yes Yes Yes Yes Age fixed effects Yes Yes Yes Yes Yes Yes Yes Stanford graduation year FE Yes Yes Yes Yes Yes Yes Yes
Notes: Individual controls include ethnicity, foreign and gender dummies, and parental entrepreneurship status. Robust standard errors are reported in parentheses. *** p<0.01, ** p<0.05, * p<0.1.
25
Table 6. Impact on the characteristics and performance of first startup– OLS Estimates (1) (2) (3) (4) (5) (6) (7) (8)
VARIABLES Years to entrepreneurship
Startup failure
Firm alive - no
exit IPO M&A
Ln(number of
employee)
Ln(firm revenue) Ln(patents)
CES -1.844*** -0.0761 0.0776 0.0171 -0.00146 0.601 3.830** 0.175 (0.600) (0.0735) (0.0886) (0.0313) (0.0568) (0.416) (1.619) (0.160)
Observations 1,290 1,290 1,290 1,290 1,290 733 526 1,144 R-squared 0.797 0.124 0.185 0.066 0.157 0.271 0.262 0.147
STVP -0.751* 0.00272 0.0657 0.00232 -0.0469 -0.133 -1.570 0.191 (0.415) (0.0545) (0.0563) (0.0169) (0.0314) (0.187) (1.300) (0.156)
Observations 1,701 1,701 1,701 1,701 1,701 951 704 1,564 R-squared 0.803 0.107 0.171 0.073 0.115 0.217 0.250 0.197
CES -1.566*** -0.0691 0.0385 0.0357 0.00894 0.670* 2.134 0.0254 (0.509) (0.0674) (0.0808) (0.0354) (0.0543) (0.391) (1.359) (0.160)
STVP -0.806** -0.0195 0.0831 0.00111 -0.0419 -0.104 -2.121* 0.215 (0.400) (0.0527) (0.0552) (0.0161) (0.0303) (0.176) (1.238) (0.149)
Observations 2,090 2,090 2,090 2,090 2,090 1,168 860 1,908 R-squared 0.803 0.102 0.178 0.051 0.127 0.224 0.233 0.184 Individual controls Yes Yes Yes Yes Yes Yes Yes Yes School fixed effects Yes Yes Yes Yes Yes Yes Yes Yes Age fixed effects Yes Yes Yes Yes Yes Yes Yes Yes Founded year fixed effects Yes Yes Yes Yes Yes Yes Yes Yes
Notes: Individual controls include ethnicity, foreign and gender dummies, and parental entrepreneurship status. Robust standard errors are reported in parentheses. *** p<0.01, ** p<0.05, * p<0.1.
26
Table 7. Impact on the characteristics and performance of first startup– 2SLS Estimates (1) (2) (3) (4) (5) (6) (7) (8)
VARIABLES Years to
entrepreneurship
Startup failure
Firm alive - no exit IPO M&A
Ln(number of
employee)
Ln(firm revenue)
Ln(patents)
CES -11.42*** -0.385** 0.581** 0.0527 -0.209** 0.878 7.690** 0.127 (2.514) (0.192) (0.226) (0.0562) (0.100) (0.740) (3.119) (0.346)
First-stage F statistic 19.68 Observations 1,290 1,290 1,290 1,290 1,290 733 526 1,144 R-squared 0.756 0.112 0.161 0.064 0.144 0.270 0.249 0.147
STVP -25.10** 0.271 0.551 -0.0705 -0.743** -1.719 -4.023 0.190 (10.29) (0.491) (0.563) (0.115) (0.377) (2.280) (12.86) (1.229)
First-stage F statistic 3.9 Observations 1,701 1,701 1,701 1,701 1,701 951 704 1,564 R-squared 0.381 0.093 0.137 0.062 -0.080 0.174 0.244 0.197
CES -10.66*** -0.323* 0.554*** 0.0538 -0.209* 1.372* 6.232** 0.287 (2.912) (0.179) (0.199) (0.0549) (0.113) (0.777) (2.815) (0.389)
STVP -24.64*** 0.0543 0.607 -0.0540 -0.583* -0.734 -1.569 -0.00367 (9.042) (0.446) (0.517) (0.106) (0.299) (1.866) (10.96) (1.107)
First-stage F statistic 2.5 Observations 2,090 2,090 2,090 2,090 2,090 1,168 860 1,908 R-squared 0.441 0.095 0.128 0.046 0.026 0.213 0.222 0.181 Individual controls Yes Yes Yes Yes Yes Yes Yes Yes School fixed effects Yes Yes Yes Yes Yes Yes Yes Yes Age fixed effects Yes Yes Yes Yes Yes Yes Yes Yes Founded year fixed effects Yes Yes Yes Yes Yes Yes Yes Yes
Notes: Individual controls include ethnicity, foreign and gender dummies, and parental entrepreneurship status. Robust standard errors are reported in parentheses. *** p<0.01, ** p<0.05, * p<0.1.
27
Table 8. Robustness tests (1) (2) (3) (4) (5) (6) (7) (8) (9) (10)
VARIABLES Entrepreneurship
Years to entrepreneur
ship
Startup failure
Firm alive - no exit
Ln(firm revenue)
Entrepreneurship
Years to entrepreneur
ship
Startup failure
Firm alive - no exit
Ln(firm revenue)
A. Drop participants in both programs
CES -0.378** -10.36*** -0.331* 0.546** 7.762** (0.160) (2.311) (0.185) (0.222) (3.147)
STVP 0.549 -24.76** 0.240 0.564 -4.590 (0.395) (10.21) (0.486) (0.562) (13.06)
Observations 4,383 1,279 1,279 1,279 524 6,172 1,694 1,694 1,694 701 R-squared 0.132 0.765 0.112 0.162 0.248 0.076 0.390 0.097 0.136 0.238
B. Control for optimism
CES -0.321** -11.57*** -0.382** 0.578** 7.627** (0.162) (2.512) (0.193) (0.228) (3.250)
STVP 0.387 -31.07** 0.224 0.773 -3.367 (0.402) (13.88) (0.589) (0.697) (13.72)
Observations 4,355 1,281 1,281 1,281 523 6,127 1,689 1,689 1,689 700 R-squared 0.161 0.758 0.111 0.161 0.254 0.116 0.158 0.100 0.103 0.264
C. Use program*post as IV
CES -0.308* -12.25*** -0.191 0.374 7.321 (0.183) (2.682) (0.214) (0.237) (4.666)
STVP 0.536 -29.39*** 0.124 0.811 -3.277 (0.396) (11.29) (0.519) (0.625) (12.71)
Observations 4,403 1,290 1,290 1,290 526 6,187 1,701 1,701 1,701 704 R-squared 0.138 0.748 0.122 0.177 0.251 0.078 0.219 0.104 0.091 0.247
D. Use set of program*year dummies as IV
CES -0.330** -10.67*** -0.337* 0.516** 7.906*** (0.148) (2.411) (0.193) (0.219) (2.941)
STVP 0.184 -14.05*** -0.0963 0.301 -1.499 (0.340) (5.105) (0.390) (0.432) (8.153)
Observations 4,403 1,290 1,290 1,290 526 6,187 1,701 1,701 1,701 704 R-squared 0.136 0.762 0.116 0.167 0.247 0.103 0.677 0.105 0.163 0.250
E. Narrower sample: 1992 to 2002
CES -0.235 -18.21*** 0.0278 0.234 15.07 (0.309) (5.285) (0.341) (0.387) (11.20)
STVP 0.549 -17.07* -0.385 0.758 4.454 (0.677) (9.988) (0.722) (0.836) (14.28)
Observations 1,887 443 443 443 183 2,652 618 618 618 233 R-squared 0.128 0.515 0.251 0.280 0.276 0.064 0.268 0.137 0.144 0.347
F. School specific time trends 1992 to 2002
CES -0.161 9.938*** -0.429 0.644 9.267** (0.313) (3.349) (0.382) (0.430) (4.249)
STVP 1.089 5.274 0.618 0.0616 7.163 (0.934) (6.036) (0.743) (0.743) (16.63)
Observations 4,403 1,290 1,290 1,290 526 6,187 1,701 1,701 1,701 704 R-squared 0.147 0.790 0.110 0.155 0.238 -0.029 0.802 0.040 0.172 0.176
Notes: Individual controls include ethnicity, foreign and gender dummies, and parental entrepreneurship status. Robust standard errors are reported in parentheses. *** p<0.01, ** p<0.05, * p<0.1.
28
Table 9. Impact on startup industry (1) (2) (3) (4) (5) (6) (7)
VARIABLES Biomed Consulting Electronics Finance Internet Manufacturing Software Dcentent -0.0705 -0.668 -0.0374 0.326 0.618** -0.0379 -0.0965 (0.123) (0.456) (0.106) (0.302) (0.310) (0.0381) (0.310) Observations 434 434 434 434 434 434 434 R-squared 0.360 0.170 0.186 0.230 0.228 0.312 0.261 Dstvp 1.289 -1.478 -0.699 0.152 -0.256 -0.217 -0.0386 (0.855) (1.378) (0.766) (0.625) (0.687) (0.198) (1.057) Observations 590 590 590 590 590 590 590 R-squared -0.815 -0.337 -0.063 0.110 0.099 0.045 0.303 Dcentent -0.0611 -0.441 -0.0837 0.342 0.605* -0.0274 -0.378 (0.168) (0.412) (0.162) (0.310) (0.316) (0.0471) (0.361) Dstvp 1.134* -1.500 -0.655 -0.239 -0.0467 -0.0821 0.567 (0.613) (1.294) (0.618) (0.578) (0.556) (0.112) (0.929) Observations 737 737 737 737 737 737 737 R-squared -0.452 -0.232 -0.004 0.110 0.160 0.131 0.195 Individual controls Yes Yes Yes Yes Yes Yes Yes School fixed effects Yes Yes Yes Yes Yes Yes Yes Age fixed effects Yes Yes Yes Yes Yes Yes Yes Stanford graduation year FE Yes Yes Yes Yes Yes Yes Yes
Notes: Individual controls include ethnicity, foreign and gender dummies, and parental entrepreneurship status. Robust standard errors are reported in parentheses. *** p<0.01, ** p<0.05, * p<0.1.
29
Table 10. Alumni network utilization (1) (2) (3) (4) (5) (6) (7) (8)
Stanford Alumni
Association
Stanford Alumni
Regional Club
School specific Alumni Group
Use Stanford alumni
network for funding
Use Stanford
lumni network
for cofounders
Use Stanford alumni
network to find
customers
Use Stanford alumni
network to find
partnerships
Use Stanford alumni
network to find
advisors
CES 0.128 0.481** -0.175 -0.0904 0.193 0.295 0.662*** 0.221 (0.194) (0.235) (0.204) (0.186) (0.201) (0.197) (0.239) (0.238)
Observations 1,255 1,254 1,267 1,282 1,282 1,284 1,283 1,279 R-squared 0.093 0.065 0.409 0.184 0.157 0.143 0.121 0.141
STVP -0.301 0.589 -0.407 0.139 -0.0318 0.0655 -0.478 -0.226 (0.541) (0.555) (0.480) (0.286) (0.413) (0.336) (0.406) (0.482)
Observations 1,651 1,659 1,674 1,687 1,686 1,689 1,690 1,684 R-squared 0.035 0.057 0.042 0.040 0.080 0.055 -0.044 0.038
CES 0.154 0.211 -0.0842 -0.162 0.0706 0.185 0.659*** 0.337 (0.180) (0.214) (0.196) (0.181) (0.196) (0.193) (0.253) (0.238)
STVP -0.361 0.720 -0.443 0.00740 -0.0185 -0.147 -0.556 -0.217 (0.488) (0.507) (0.429) (0.275) (0.385) (0.324) (0.408) (0.443)
Observations 2,037 2,042 2,060 2,079 2,079 2,082 2,081 2,074 R-squared 0.027 0.051 0.273 0.118 0.101 0.084 -0.022 0.078 Individual controls Yes Yes Yes Yes Yes Yes Yes Yes School fixed effects Yes Yes Yes Yes Yes Yes Yes Yes Age fixed effects Yes Yes Yes Yes Yes Yes Yes Yes Stanford graduation year FE Yes Yes Yes Yes Yes Yes Yes Yes
Notes: Individual controls include ethnicity, foreign and gender dummies, and parental entrepreneurship status. Robust standard errors are reported in parentheses. *** p<0.01, ** p<0.05, * p<0.1.
30
Appendix Table 1. Logit regressions on responder status
Pr(respond) Pr(respond) Pr(respond) Pr(respond)
Gender (female=1) 1.051** 1.143
(0.018) (0.514)
Earth Sciences 1.074 0.535
(0.053) (0.550)
Education 1.183*** 0.662
(0.039) (0.905)
Engineering 0.883*** 0.280
(0.020) (0.236)
Law 0.741*** 0.565
(0.027) (0.185)
Medicine 1.698*** 0.170
(0.048) (0.162)
Humanities & Sciences 0.508***
(0.011)
Graduation Year 0.991***
(0.000)
Gender*Graduation year FE YES
Gender*school FE YES
Graduation Year FE YES
Constant 0.141*** 5.69e+06*** 0.292*** 0.273
(0.001) (5,022,770) (0.006) (0.223)
Observations 133,916 139,004 143,632 70,926 *** p<0.001, ** p<0.01, * p<0.05 The omitted school category for comparison is the Graduate School of Business. Response rates are lower in the Humanities and Sciences due to only being permitted to send one reminder to these graduates. The final column drops H&S alumni from the model and finds no statistically significant differences in response likelihood among graduates of the remaining schools.
31
Appendix Table 2. Effect on total and initial funding (1) (2) (3) (4) (5) (6)
VARIABLES Ln(total funding)
Ln(initial funding)
Ln(total funding)
Ln(initial funding)
Ln(total funding)
Ln(initial funding)
CES 0.0992 0.630 0.413 1.064 (0.389) (0.788) (0.373) (0.855)
STVP 0.0355 1.526 0.132 2.193 (0.767) (2.353) (0.732) (2.594)
Observations 1,271 572 1,676 789 2,066 967 R-squared 0.140 0.269 0.091 0.061 0.093 0.009 Individual controls Yes Yes Yes Yes Yes Yes School fixed effects Yes Yes Yes Yes Yes Yes Age fixed effects Yes Yes Yes Yes Yes Yes Founded year fixed effects Yes Yes Yes Yes Yes Yes
Notes: Individual controls include ethnicity, foreign and gender dummies, and parental entrepreneurship status. Robust standard errors are reported in parentheses. *** p<0.01, ** p<0.05, * p<0.1.