Embed Size (px)
Citation preview
Inventory and monitoring toolbox: freshwater ecology
DOCDM-765928
This introduction was prepared by Duncan Gray in 2013.
Contents
Introduction ...................................................................................................................................... 2
Sampling design and techniques ..................................................................................................... 8
Decision tree ...................................................................................................................................14
References .....................................................................................................................................17
Appendix A .....................................................................................................................................19
Introduction to periphyton monitoring in freshwater ecosystems
Version 1.0
DOCDM-765928 Introduction to periphyton monitoring in freshwater ecosystems v1.0 2
Inventory and monitoring toolbox: freshwater ecology
Introduction
What is periphyton?
The periphyton community is the slimy coating that adheres to rocks and other stable substrates
that comprise the stream bed. The community is made up of variable proportions of algae, fungi
and bacteria as well as organic matter entrained from stream flow. The appearance of the
periphyton layer can vary greatly and provides a lot of basic information about conditions within the
stream. Moreover, periphyton is a fundamental component of the stream ecosystem purifying
waters by absorption of metals and nutrients, and providing a significant component of the food
resource to the stream food web. Correspondingly, the periphyton community is highly responsive
to degradation of water quality, shifts in invertebrate consumer communities and the occurrence of
floods with sufficient energy to slough algal growths. High levels of periphyton cover can have
detrimental effects on stream biodiversity, trout and recreational use of waterways. Biggs & Kilroy
(2000) define these nuisance growths of periphyton and provide thresholds to be avoided in
resource consents and regional plans.
Periphyton community types
The species and morphologies of periphyton that are common in New Zealand streams are
reasonably well understood. An in-depth discussion is beyond the scope of this protocol, but an
accessible, yet comprehensive review of taxa and communities is provided by Biggs (2000a) and
Biggs & Kilroy (2004). The two most common morphologies of periphyton likely to be encountered
in New Zealand streams are diatoms and filamentous algae which may be readily divided according
to colour and thickness/length for mats and filaments, respectively. Taxonomic surveys are possible
in New Zealand, but require considerable resources, such as laboratory equipment for analysis and
trained personnel (see ‘Periphyton taxonomic sampling and identification’–docdm-784937). A
complete review of available methods suitable for New Zealand streams can be found in Biggs
(2000b).
Applications of periphyton monitoring
Periphyton sampling programmes may be used to address a number of different objectives in New
Zealand streams. Inventory or resource surveys may be performed to establish general patterns in
periphyton biomass or composition. This data can be applied in the ranking of conservation values
of sites or comparisons of broadscale effects of land use or flow regime change. Objectives
concerned with more local-scale, impact-specific effects such as the influence of restoration
projects or effects of concessions on the public estate, such as mining, can also be addressed. The
incursion of Didymosphenia geminata throughout the South Island and risk of further spread has led
to a substantial increase in Didymo detection in the periphyton monitoring being conducted by
DOC. More detailed monitoring of Didymo biomass to improve our understanding of its ecological
effects and management implications are a further application of periphyton monitoring. Periphyton
DOCDM-765928 Introduction to periphyton monitoring in freshwater ecosystems v1.0 3
Inventory and monitoring toolbox: freshwater ecology
communities can provide an effective time-integrated measure of many impacts on stream
ecosystems, indicative of not only conditions at the time of sampling, but also reflecting conditions
over the past weeks or months. To achieve this, clear objectives must be identified from the outset
and applied in the design of an efficient sampling programme.
Primary influences on the periphyton community
Streams and rivers are regulated by a hierarchy of factors that ultimately determine the
communities observed at any point in space and time (Hynes 1975; Allan & Castillo 2007). Broadly,
climate, geology and human activities dictate the morphology, hydrology and physico-chemistry of
stream reaches, which regulate the fundamental controllers of local stream habitats such as velocity
and nutrients (Biggs 2000b). Local periphyton communities can also be influenced by grazing
invertebrates, but these in turn are regulated by the hierarchical physical environment. Essentially,
at any location the periphyton community will reflect the battle between forces of growth: light and
nutrients; and those of loss: physical disturbance and invertebrate grazing (Biggs & Kilroy 2004).
Promoting growth
Light is a fundamental factor affecting periphyton growth, although light levels need to be unusually
low before they limit growth. Most stream periphyton communities will not be limited by light until
shading reaches 60% (Quinn et al. 1997). Nutrient levels, particularly nitrogen (N) and phosphorus
(P), tend to be primary limiting factors for periphyton growth. Levels of these nutrients are naturally
regulated by the geology of a catchment; for example, recent volcanic rocks contribute nutrients to
stream waters, but of more concern is the influence of land use intensification (Biggs & Kilroy 2004).
Given adequate light and nutrients, periphyton growth may be prolific and reach nuisance levels
very rapidly. However, usually either N or P availability limits growth and water managers need to
understand the nutrient flux or supply to streams and regulate changes in land use to prevent
excessive growth. Water chemistry testing is a routine method to assess nutrient limitations and
loadings, but it should be noted that nutrient concentrations may be highly variable over time and
interact with periphyton biomass such that low nutrient concentrations may be a direct result of high
periphyton growth rates. A useful characterisation of the nutrient status of a stream in relation to
periphyton should include data collected at least monthly over a year and analysed in conjunction
with discharge records (Biggs & Kilroy 2004).
Loss of biomass
Grazing by invertebrates in New Zealand streams has a potentially significant influence on the
composition and proliferation of periphyton communities, depending on the flow regime of the
stream in question (Fig. 1). Stable streams such as springs or lake outlets tend to have invertebrate
communities dominated by snails, such as Potamopyrgus antipodarum, which are replaced as
disturbance levels increase by caddis and finally mayflies (Sagar 1986; Scarsbrook & Townsend
1993). Snails appear to be more aggressive grazers than caddisflies, and in turn mayflies, such that
physical disturbance creates a gradient in invertebrate grazing pressure (Biggs, Stevenson et al.
1998). If all other conditions were constant it might be predicted that the interaction of grazing and
DOCDM-765928 Introduction to periphyton monitoring in freshwater ecosystems v1.0 4
Inventory and monitoring toolbox: freshwater ecology
disturbance would maintain periphyton at similar levels in all streams; however, as with all natural
systems there are important lag times and further factors to consider. For example, periphyton may
accumulate rapidly in some gravel bed streams where the invertebrate community has not yet
recovered from a catastrophic flood event (Sagar 1986). Similarly, if some form of pollution prevents
the colonisation of invertebrates, even in stable environments, periphyton proliferation may proceed
rapidly to nuisance levels where it might otherwise have been checked by invertebrates.
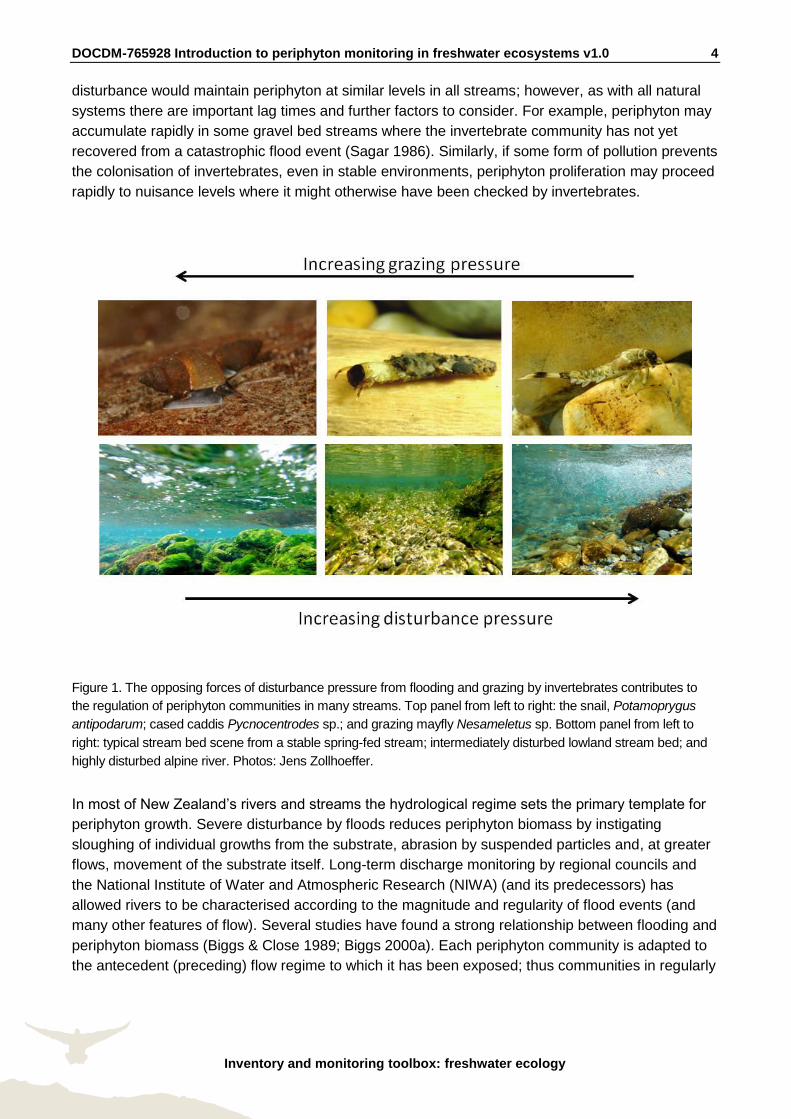
Figure 1. The opposing forces of disturbance pressure from flooding and grazing by invertebrates contributes to
the regulation of periphyton communities in many streams. Top panel from left to right: the snail, Potamoprygus
antipodarum; cased caddis Pycnocentrodes sp.; and grazing mayfly Nesameletus sp. Bottom panel from left to
right: typical stream bed scene from a stable spring-fed stream; intermediately disturbed lowland stream bed; and
highly disturbed alpine river. Photos: Jens Zollhoeffer.
In most of New Zealand’s rivers and streams the hydrological regime sets the primary template for
periphyton growth. Severe disturbance by floods reduces periphyton biomass by instigating
sloughing of individual growths from the substrate, abrasion by suspended particles and, at greater
flows, movement of the substrate itself. Long-term discharge monitoring by regional councils and
the National Institute of Water and Atmospheric Research (NIWA) (and its predecessors) has
allowed rivers to be characterised according to the magnitude and regularity of flood events (and
many other features of flow). Several studies have found a strong relationship between flooding and
periphyton biomass (Biggs & Close 1989; Biggs 2000a). Each periphyton community is adapted to
the antecedent (preceding) flow regime to which it has been exposed; thus communities in regularly

DOCDM-765928 Introduction to periphyton monitoring in freshwater ecosystems v1.0 5
Inventory and monitoring toolbox: freshwater ecology
flooding rivers tend to be a low-growing abrasion-resistant form as opposed to those longer, less
adherent forms which occur in stable streams subject to minimal flooding. Therefore, it is not only
the velocity of flow in a flood which is of particular importance, but the flood magnitude and velocity
relative to previous floods (Biggs & Kilroy 2004).
Various methods have been developed to describe relative flood magnitude, such as that required
to generate a specific threshold velocity or the stream-specific magnitude required to move a
percentage of bed substrates. However, the frequency of flooding events is also important and
these two factors—relative magnitude and frequency—are elegantly combined in the FRE suite of
metrics. FRE or frequency is always followed by a number representing the degree by which the
current flow exceeds the median flow, thus FRE3 refers to the annual frequency of flows which
exceed three times the median flow of any river. A low FRE3 number indicates a stable flow regime
with few floods, such as the lake/spring-fed Tarawera River, Bay of Plenty, which experiences an
annual average FRE3 of zero. A high number indicates a flashy hydrological regime, such as the
alpine-sourced Hokitika River, with a FRE3 of 18.7.
The FRE3 statistic has been shown to be related to both periphyton and invertebrates across a
number of New Zealand streams (Clausen & Biggs 1997). Three times the median flow may
therefore be considered an ecologically relevant indicator of flood disturbance, although the actual
magnitude of flood disturbance required to slough algae will vary amongst rivers, depending on
factors such as channel gradient, substrate size and preceding flow conditions. Thus, depending on
preceding conditions, flows less than three times median may also be ecologically significant.
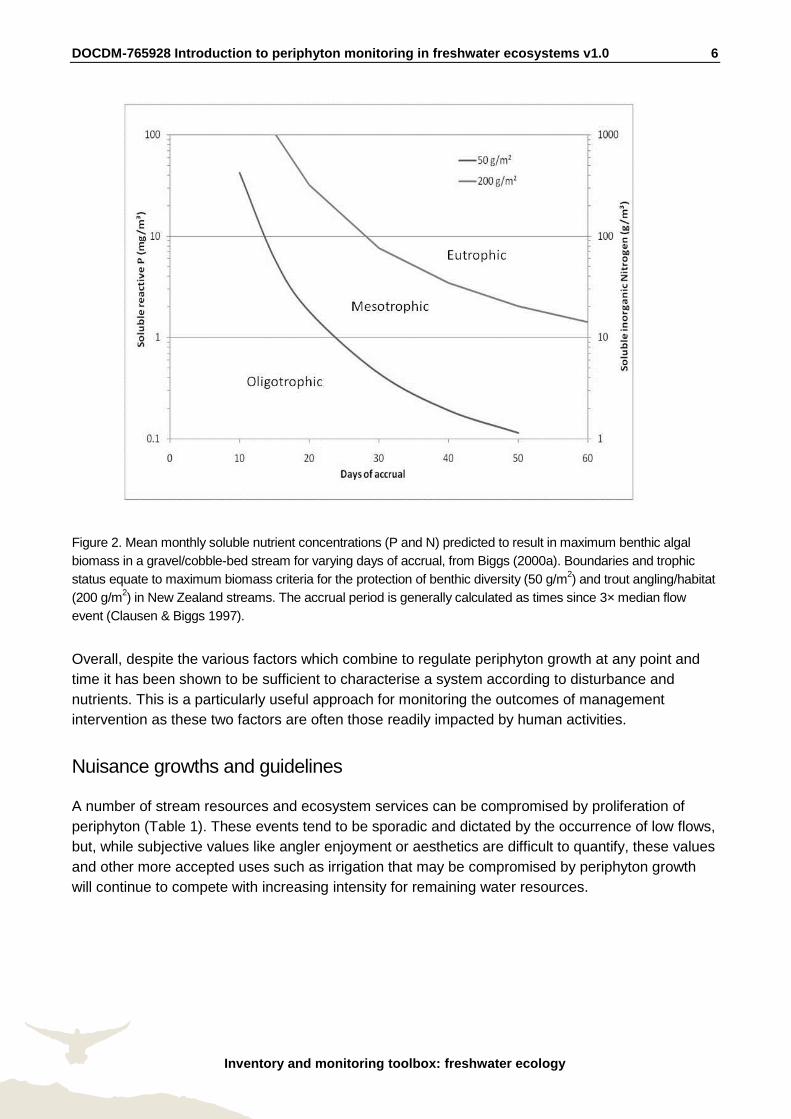
The time since the last FRE3 event is also of interest. This accrual period between floods may be
related to periphyton biomass on specific dates and also used to predict biomass for a river of
known hydrological regime and nutrient status (Biggs 2000b). Figure 2 illustrates the general
relationship between nutrients and accrual period in relation to maximum biomass criteria for the
protection of benthic diversity (50 mg/m2) and trout angling/habitat (200 mg/m2) in New Zealand
streams.
DOCDM-765928 Introduction to periphyton monitoring in freshwater ecosystems v1.0 6
Inventory and monitoring toolbox: freshwater ecology
Figure 2. Mean monthly soluble nutrient concentrations (P and N) predicted to result in maximum benthic algal
biomass in a gravel/cobble-bed stream for varying days of accrual, from Biggs (2000a). Boundaries and trophic
status equate to maximum biomass criteria for the protection of benthic diversity (50 g/m2) and trout angling/habitat
(200 g/m2) in New Zealand streams. The accrual period is generally calculated as times since 3× median flow
event (Clausen & Biggs 1997).
Overall, despite the various factors which combine to regulate periphyton growth at any point and
time it has been shown to be sufficient to characterise a system according to disturbance and
nutrients. This is a particularly useful approach for monitoring the outcomes of management
intervention as these two factors are often those readily impacted by human activities.
Nuisance growths and guidelines
A number of stream resources and ecosystem services can be compromised by proliferation of
periphyton (Table 1). These events tend to be sporadic and dictated by the occurrence of low flows,
but, while subjective values like angler enjoyment or aesthetics are difficult to quantify, these values
and other more accepted uses such as irrigation that may be compromised by periphyton growth
will continue to compete with increasing intensity for remaining water resources.
DOCDM-765928 Introduction to periphyton monitoring in freshwater ecosystems v1.0 7
Inventory and monitoring toolbox: freshwater ecology
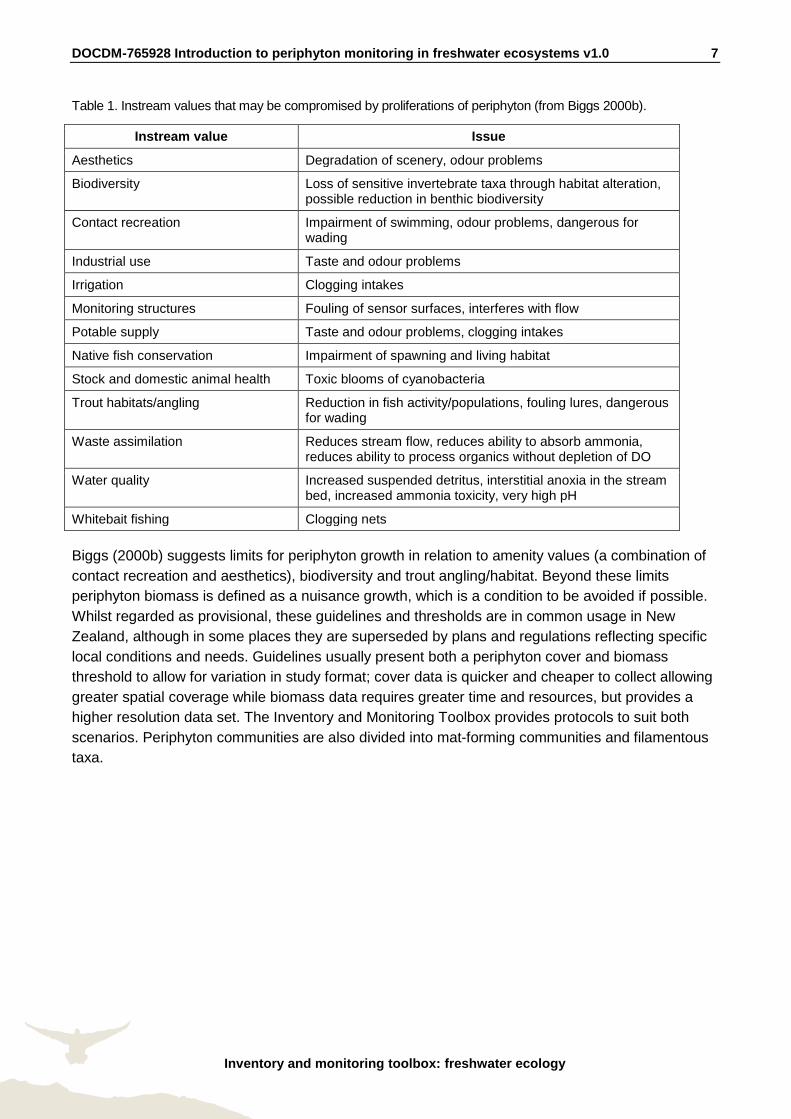
Table 1. Instream values that may be compromised by proliferations of periphyton (from Biggs 2000b).
Instream value Issue
Aesthetics Degradation of scenery, odour problems
Biodiversity Loss of sensitive invertebrate taxa through habitat alteration, possible reduction in benthic biodiversity
Contact recreation Impairment of swimming, odour problems, dangerous for wading
Industrial use Taste and odour problems
Irrigation Clogging intakes
Monitoring structures Fouling of sensor surfaces, interferes with flow
Potable supply Taste and odour problems, clogging intakes
Native fish conservation Impairment of spawning and living habitat
Stock and domestic animal health Toxic blooms of cyanobacteria
Trout habitats/angling Reduction in fish activity/populations, fouling lures, dangerous for wading
Waste assimilation Reduces stream flow, reduces ability to absorb ammonia, reduces ability to process organics without depletion of DO
Water quality Increased suspended detritus, interstitial anoxia in the stream bed, increased ammonia toxicity, very high pH
Whitebait fishing Clogging nets
Biggs (2000b) suggests limits for periphyton growth in relation to amenity values (a combination of
contact recreation and aesthetics), biodiversity and trout angling/habitat. Beyond these limits
periphyton biomass is defined as a nuisance growth, which is a condition to be avoided if possible.
Whilst regarded as provisional, these guidelines and thresholds are in common usage in New
Zealand, although in some places they are superseded by plans and regulations reflecting specific
local conditions and needs. Guidelines usually present both a periphyton cover and biomass
threshold to allow for variation in study format; cover data is quicker and cheaper to collect allowing
greater spatial coverage while biomass data requires greater time and resources, but provides a
higher resolution data set. The Inventory and Monitoring Toolbox provides protocols to suit both
scenarios. Periphyton communities are also divided into mat-forming communities and filamentous
taxa.
DOCDM-765928 Introduction to periphyton monitoring in freshwater ecosystems v1.0 8
Inventory and monitoring toolbox: freshwater ecology
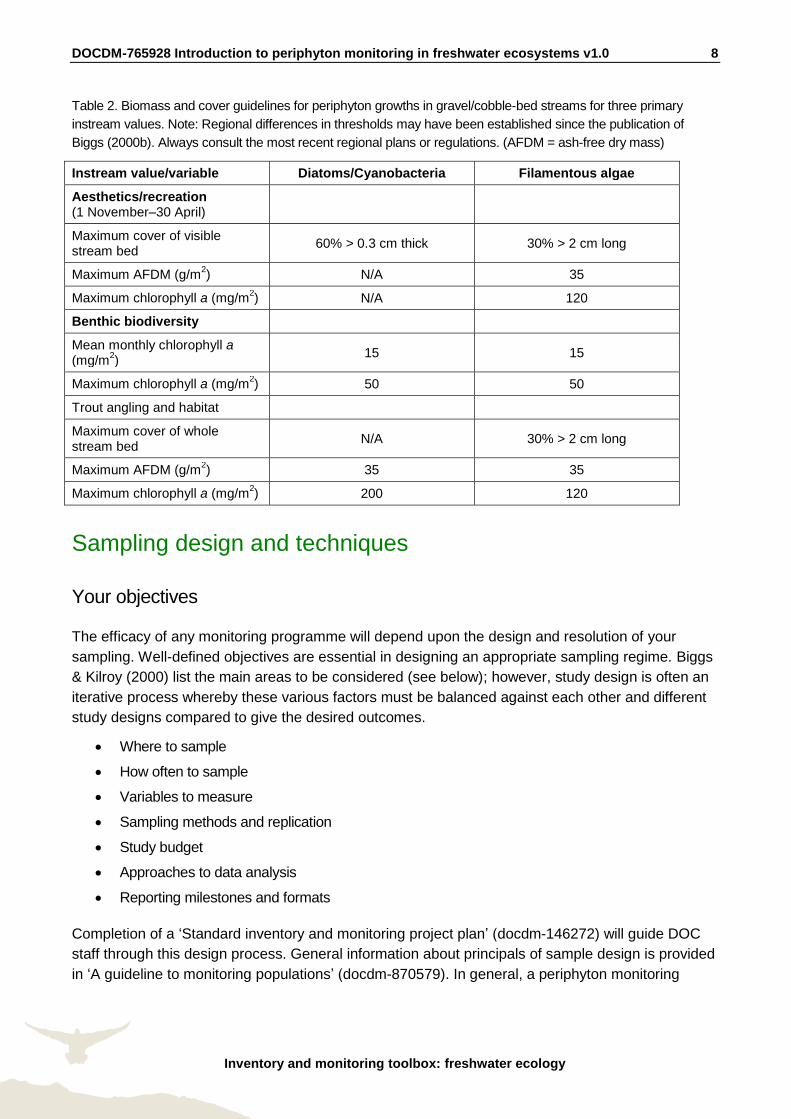
Table 2. Biomass and cover guidelines for periphyton growths in gravel/cobble-bed streams for three primary
instream values. Note: Regional differences in thresholds may have been established since the publication of
Biggs (2000b). Always consult the most recent regional plans or regulations. (AFDM = ash-free dry mass)
Instream value/variable Diatoms/Cyanobacteria Filamentous algae
Aesthetics/recreation
(1 November–30 April)
Maximum cover of visible stream bed
60% > 0.3 cm thick 30% > 2 cm long
Maximum AFDM (g/m2) N/A 35
Maximum chlorophyll a (mg/m2) N/A 120
Benthic biodiversity
Mean monthly chlorophyll a (mg/m
2)
15 15
Maximum chlorophyll a (mg/m2) 50 50
Trout angling and habitat
Maximum cover of whole stream bed
N/A 30% > 2 cm long
Maximum AFDM (g/m2) 35 35
Maximum chlorophyll a (mg/m2) 200 120
Sampling design and techniques
Your objectives
The efficacy of any monitoring programme will depend upon the design and resolution of your
sampling. Well-defined objectives are essential in designing an appropriate sampling regime. Biggs
& Kilroy (2000) list the main areas to be considered (see below); however, study design is often an
iterative process whereby these various factors must be balanced against each other and different
study designs compared to give the desired outcomes.
Where to sample
How often to sample
Variables to measure
Sampling methods and replication
Study budget
Approaches to data analysis
Reporting milestones and formats
Completion of a ‘Standard inventory and monitoring project plan’ (docdm-146272) will guide DOC
staff through this design process. General information about principals of sample design is provided
in ‘A guideline to monitoring populations’ (docdm-870579). In general, a periphyton monitoring
DOCDM-765928 Introduction to periphyton monitoring in freshwater ecosystems v1.0 9
Inventory and monitoring toolbox: freshwater ecology
study design will focus on either a spatially widespread or locally intensive issue. Spatially
widespread sampling covers a broad temporal/spatial scale and many different streams and rivers.
Accordingly, there may be a compromise in the resolution (closely related to cost) of data collected.
In contrast, a locally intensive study seeks to detect patterns in periphyton at smaller spatial or
shorter temporal scales. These studies often require high-resolution quantitative data which is more
labour- and resource-intensive to collect. Inventory or resource surveys tend to fall into the former
category and require rapid qualitative protocols, whereas the efficacy of a restoration project or
effect of concessions on the public estate, such as mining, require intensive quantitative protocols,
and could possibly be designed around detecting certain forms of periphyton communities that
thrive under acid mine drainage conditions. The first decision to make is the appropriate scale of
your investigation and the scales at which influential factors may be operating. This will aid greatly
in answering several of the questions above.
Where and when to sample?
Again the answer to this question is intimately tied to the monitoring objective. Sample site location
is strongly dictated by the opposing forces of data requirements and available budget. Basic
requirements are for an impacted/monitoring site and at the very least a single reference (or control)
site with which to compare. A reference (or control) site is considered to be unaffected by the
impact under consideration, be that a discharge or the legacy of 150 years of agriculture. A
common design is to compare sites that are upstream (reference) and downstream (impact) of a
discharge or other source of impact. In the upstream–downstream example, a second (or third)
upstream site may be added to estimate variation between the reference sites, whilst further
downstream sites may be added to measure the extent of the impact. In order to assess differences
in water quality it is essential that all sites are as physically similar as possible (substrate types,
shading, flow and stream dimensions) so that confounding effects on periphyton communities are
minimised or eliminated. A final reference site is often selected on an adjacent, or nearby un-
impacted stream, and used to assess the condition of the entire study stream relative to regional
stream conditions and communities. Alternatively, in a broadscale assessment of enrichment or
other impact status of streams you will want to sample as many streams as possible throughout
your region. The number and location of sites sampled will be dictated by resources available.
Once site locations and number have been established it is important to consider the meso-scale
habitat characteristics you want to include. Stream ecologists tend to characterise streams and
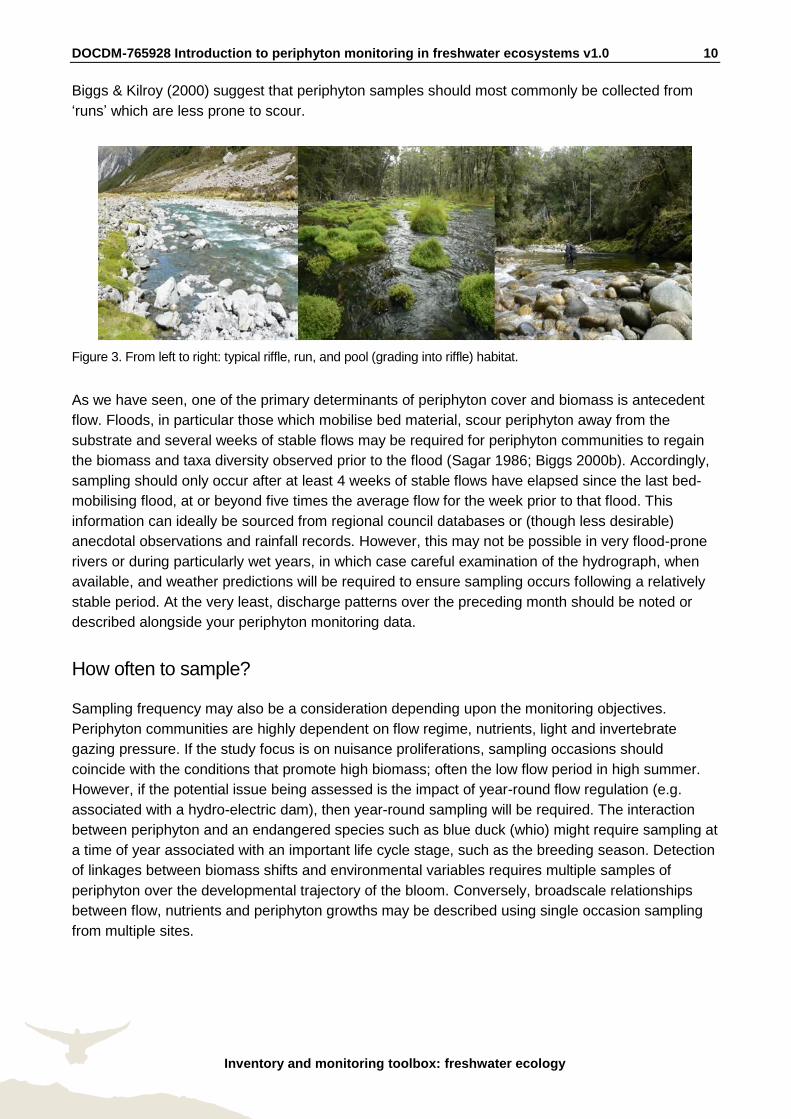
rivers by the relative amount of run, riffle or pool that occur at the sampling sites (Fig. 3). This is an
important consideration when comparing biotic communities between two or more sites. In hard-
bottomed streams, riffle habitats are often common, easily recognisable and biologically productive
habitats that can be sampled safely even in larger rivers. However, in soft-bottomed streams riffle
habitats may be rare or absent. A riffle is defined as an area of fast ‘whitewater’, usually associated
with a constriction in the channel and where stony or wood substrate may occur above the surface.
Conversely, a pool is an area of slow-flowing or standing water, not including the ‘whitewater’,
usually at the base of a riffle. This is the deepest habitat in a river. Intermediate between pools and
riffles are runs. These areas are characterised by laminar flow with a mostly unbroken surface. The
most important criterion is that habitat characteristics are standardised across your sampling sites.
DOCDM-765928 Introduction to periphyton monitoring in freshwater ecosystems v1.0 10
Inventory and monitoring toolbox: freshwater ecology
Biggs & Kilroy (2000) suggest that periphyton samples should most commonly be collected from
‘runs’ which are less prone to scour.
Figure 3. From left to right: typical riffle, run, and pool (grading into riffle) habitat.
As we have seen, one of the primary determinants of periphyton cover and biomass is antecedent
flow. Floods, in particular those which mobilise bed material, scour periphyton away from the
substrate and several weeks of stable flows may be required for periphyton communities to regain
the biomass and taxa diversity observed prior to the flood (Sagar 1986; Biggs 2000b). Accordingly,
sampling should only occur after at least 4 weeks of stable flows have elapsed since the last bed-
mobilising flood, at or beyond five times the average flow for the week prior to that flood. This
information can ideally be sourced from regional council databases or (though less desirable)
anecdotal observations and rainfall records. However, this may not be possible in very flood-prone
rivers or during particularly wet years, in which case careful examination of the hydrograph, when
available, and weather predictions will be required to ensure sampling occurs following a relatively
stable period. At the very least, discharge patterns over the preceding month should be noted or
described alongside your periphyton monitoring data.
How often to sample?
Sampling frequency may also be a consideration depending upon the monitoring objectives.
Periphyton communities are highly dependent on flow regime, nutrients, light and invertebrate
gazing pressure. If the study focus is on nuisance proliferations, sampling occasions should
coincide with the conditions that promote high biomass; often the low flow period in high summer.
However, if the potential issue being assessed is the impact of year-round flow regulation (e.g.
associated with a hydro-electric dam), then year-round sampling will be required. The interaction
between periphyton and an endangered species such as blue duck (whio) might require sampling at
a time of year associated with an important life cycle stage, such as the breeding season. Detection
of linkages between biomass shifts and environmental variables requires multiple samples of
periphyton over the developmental trajectory of the bloom. Conversely, broadscale relationships
between flow, nutrients and periphyton growths may be described using single occasion sampling
from multiple sites.
DOCDM-765928 Introduction to periphyton monitoring in freshwater ecosystems v1.0 11
Inventory and monitoring toolbox: freshwater ecology
Which variables to measure?
The method of measuring your response variable, the periphyton, is dictated by your study
objectives and available resources and is discussed in detail below. Alongside periphyton data it is
important to collect environmental and habitat information in order to prove that your sampling
locations are comparable and investigate the causes behind any patterns you may identify. Habitat
assessment alongside periphyton collection is an integral part of any monitoring programme. The
alteration of the physical structure of habitats is one of the major factors from human activities that
degrade aquatic resources; instream and surrounding topographical features are a major
determinant of aquatic communities. Both the quality and quantity of available habitat affect the
structure and composition of periphyton communities. Effects of such features on biological
assessment results can be minimised by sampling similar habitats at all sites being compared.
However, when all sites are not physically comparable, habitat characterisation is particularly
important for proper interpretation of survey results. Harding et al. (2009) provide a comprehensive
guide and protocols for habitat assessment in wadeable New Zealand stream and rivers.1 A
minimum requirement habitat assessment field sheet is provided with these protocols (see ‘Stream
habitat assessment field sheet’—docdm-761873).
The primary determinants of periphyton biomass growth are accrual period and nutrients (Fig. 2);
this information is of particular importance to any study. Additionally, an assessment of periphyton
taxonomic diversity would also benefit from measures of water chemistry other than nutrients, such
as silica or calcium concentrations. Design your sampling regime according to your objectives and
always consult an experienced freshwater ecologist during the design stage.
Sampling methods and replication
Choice of monitoring method will be dictated by your study objectives and available resources.
Refer to the ‘Decision tree’ for a guide to the most appropriate method for your objectives. The
protocols provided here are based on those of Biggs & Kilroy (2000) and describe methods for
rapid, qualitative assessment of communities and more intensive, quantitative sampling.
‘Freshwater ecology: periphyton rapid assessment monitoring in streams—method 1 (RAM-1)’
(docdm-769146) is appropriate to assess compliance with periphyton guidelines for aesthetic,
recreational and fishing values (Table 2) and involves a replicated visual assessment of the
percentage of long filamentous algae. ‘Freshwater ecology: periphyton rapid assessment
monitoring in streams—method 2 (RAM-2)’ (docdm-769150) includes more detail about the
periphyton community by visually estimating the proportional cover of 12 periphyton types on
replicate rocks and can be used to assess degrees of general nutrient enrichment and water
quality.
When greater sensitivity to detect change or differences in periphyton biomass is required, e.g. the
effects of specific discharge or change to a flow regime, a quantitative protocol should be used.
Two methods based on those recommended by Biggs & Kilroy (2000) are described in ‘Freshwater
1 http://www.cawthron.org.nz/coastal-freshwater-resources/downloads/stream-habitat-assessment-
protocols.pdf
DOCDM-765928 Introduction to periphyton monitoring in freshwater ecosystems v1.0 12
Inventory and monitoring toolbox: freshwater ecology
ecology: quantitative periphyton biomass sampling methods’ (docdm-766000). Both involve
collecting periphyton from replicate rocks, but differ in the manner of collection. Method 1a involves
sampling whole stones which provides data on the whole community, on the upper and lower
surface of the stone. Generally speaking, there will be little difference among sampled communities
in fine gravel substrates, but heterogeneity will increase with substrate size. Biggs & Kilroy suggest
this method is most appropriate for broad surveys of enrichment or periphyton biomass. Data are
expressed in terms of surface area of exposed sediments. Method 1b involves collecting periphyton
only from the upper surface of stones which reduces any effects of spatial variations in water
velocity, light availability or invertebrate grazing associated with the undersides of stone. This
method is commonly used to assess the effects of pollution, and data is expressed in terms of plane
surface area (actual flat area, as opposed to area of substrate surfaces) of the stream bed.
Taxonomic surveys are also possible in New Zealand, but require considerable resources, such as
laboratory equipment for analysis and trained personnel (see ‘Freshwater ecology: periphyton
taxonomic sampling and identification’—docdm-784937). A complete review of available methods
suitable for New Zealand streams can be found in Biggs (2000b).
Within-site sample replication is an important consideration, but may have to be adjusted in the
field. During RAM sampling it is standard practice to collect data at 10 points along each of 10
transects; however, the number of points within each transect may be reduced to 5 if periphyton
cover proves to be highly homogenous. During quantitative sampling it is standard practice to
collect 10 samples along a single transect due to the increased cost of sample processing (Biggs &
Kilroy 2000). At all times be aware of the level of apparent variability within and between your sites.
When variation is high, increase your replication, but note that it is best to replicate equally at every
site.
Study budgets
Financial and resource issues are one of the major constraints to any sampling programme. As well
as the fixed costs of planning, study design, interpretation and results write-up, the basic unit of cost
is the approximate price of each sample or site. This cost should include the staff time required to
collect each additional sample in the field, extra travel time needed to visit more sites, and the costs
of laboratory analysis and any disposable equipment required. Once the cost of samples and an
approximate budget is known, it is possible to calculate how many samples can be collected and
explore options for increasing either replication (collecting more samples or visiting more sites) or
resolution (collecting a finer level of detail within each sample or site).
Approaches to data analysis
Consult a biometrician or experienced ecologist about data analysis during the design and analysis
stages of your study. Necessary statistical skills should be identified during project planning and
appropriate advice or training sought on their use. Training in data handling and analysis is
available through the DOC Training Booking System. Sometimes it may be necessary to contract
people with the necessary skills to do more complex analyses. However, basic analyses can be
DOCDM-765928 Introduction to periphyton monitoring in freshwater ecosystems v1.0 13
Inventory and monitoring toolbox: freshwater ecology
readily performed using Excel and R. Useful references for statistical analysis include Quinn &
Keough (2002) and Zar (1999).
The first step is to carefully inspect your data. Calculate simple metrics that distil the community into
understandable components, e.g. biomass per unit area, morphotype or taxonomic richness or a
stream health indicator score (Biggs, Kilroy et al. 1998), and plot the results in graphical form. The
analytical method used will be dictated by the objectives of the study. Are you comparing between
groups of treatments or looking for trends in communities arranged along a spatio-temporal
gradient? Analysis of variance (ANOVA) is used to look for differences among ‘treatments’.
Treatments might be samples collected before or after an alteration to the flow regime, or up and
downstream of a discharge or some experimental manipulation. ANOVA makes a variety of
assumptions about the nature of the data which must be met for the results to be valid. Correlation
and linear regression analyses are used to test for statistical significance of incremental responses
along an environmental gradient; for instance, comparing the biomass of periphyton from 20
streams with varying degrees of nutrient enrichment. More information about analysis
considerations is provided in the section ‘Design and implementation framework’ in ‘A guideline to
monitoring populations’ (docdm-870579).
Reporting
The final stage of any study is the report; an un-reported study may as well not have occurred.
Scientific writing tends to have a very standard format although this may be altered for a specific
audience. Depending on the monitoring objective, it may be necessary to create both a formal
written report and a less formal presentation to communicate findings to a wider audience of
stakeholders and community members. A fundamental reporting requirement is to state the
monitoring objectives, describe how you addressed these objectives and present your findings in
the context of those objectives. Reports may also include re-evaluation of the monitoring
programme (objectives, design, field methods, etc.) and recommendations for improvements. More
information about reporting tools is provided in ‘A guideline to monitoring populations’ (docdm-
870579).
Didymosphenia geminata (didymo)
The non-native and highly invasive alga didymo was first detected in the Waiau River, Southland, New
Zealand in October 2004. Subsequently, it has been detected in numerous other rivers in the South
Island but has yet to be detected in North Island waterways (as at June 2013; see the Ministry for
Primary Industries (MPI) didymo webpage2 for more background information about didymo). In suitable
conditions didymo forms thick mats that may clothe significant portions of stream bed (Kilroy et al.
2005). Long-term effects of didymo on the stream ecosystems of New Zealand are still unknown;
however, the aesthetic and recreational impacts can be considerable. Didymo is capable of rapidly
overwhelming the existing periphyton community. Didymo cell division rates may be nutrient-limited in
some streams suggesting that cells can be incorporated with other periphyton types in assessment of
enrichment. Nevertheless, caution should be applied as didymo blooms (that are the result of stalk
2 http://www.biosecurity.govt.nz/pests/didymo
DOCDM-765928 Introduction to periphyton monitoring in freshwater ecosystems v1.0 14
Inventory and monitoring toolbox: freshwater ecology
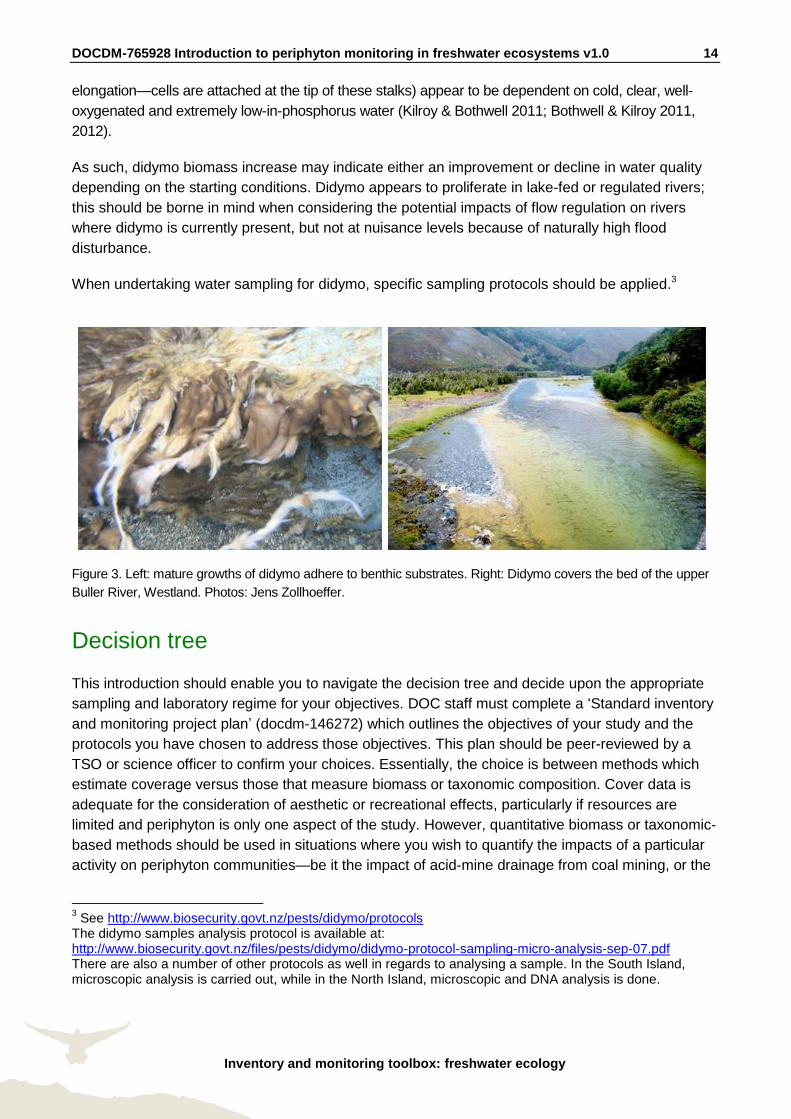
elongation—cells are attached at the tip of these stalks) appear to be dependent on cold, clear, well-
oxygenated and extremely low-in-phosphorus water (Kilroy & Bothwell 2011; Bothwell & Kilroy 2011,
2012).
As such, didymo biomass increase may indicate either an improvement or decline in water quality
depending on the starting conditions. Didymo appears to proliferate in lake-fed or regulated rivers;
this should be borne in mind when considering the potential impacts of flow regulation on rivers
where didymo is currently present, but not at nuisance levels because of naturally high flood
disturbance.
When undertaking water sampling for didymo, specific sampling protocols should be applied.3
Figure 3. Left: mature growths of didymo adhere to benthic substrates. Right: Didymo covers the bed of the upper
Buller River, Westland. Photos: Jens Zollhoeffer.
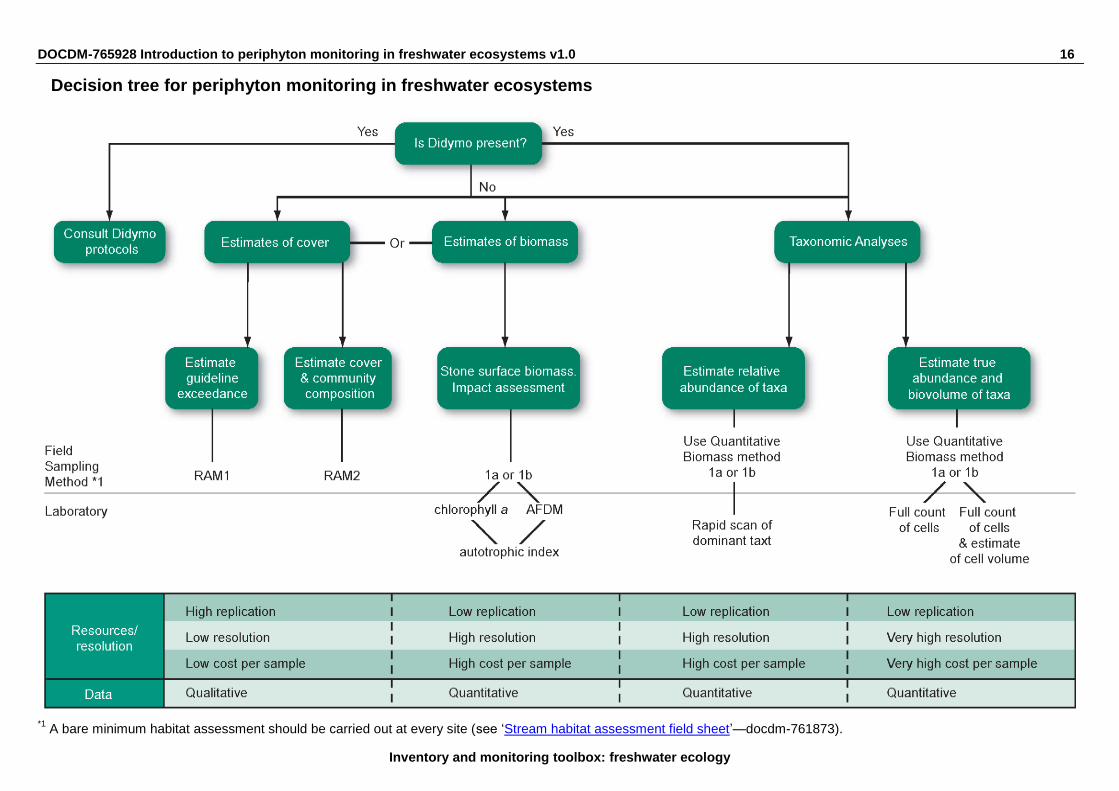
Decision tree
This introduction should enable you to navigate the decision tree and decide upon the appropriate
sampling and laboratory regime for your objectives. DOC staff must complete a ‘Standard inventory
and monitoring project plan’ (docdm-146272) which outlines the objectives of your study and the
protocols you have chosen to address those objectives. This plan should be peer-reviewed by a
TSO or science officer to confirm your choices. Essentially, the choice is between methods which
estimate coverage versus those that measure biomass or taxonomic composition. Cover data is
adequate for the consideration of aesthetic or recreational effects, particularly if resources are
limited and periphyton is only one aspect of the study. However, quantitative biomass or taxonomic-
based methods should be used in situations where you wish to quantify the impacts of a particular
activity on periphyton communities—be it the impact of acid-mine drainage from coal mining, or the
3 See http://www.biosecurity.govt.nz/pests/didymo/protocols
The didymo samples analysis protocol is available at: http://www.biosecurity.govt.nz/files/pests/didymo/didymo-protocol-sampling-micro-analysis-sep-07.pdf There are also a number of other protocols as well in regards to analysing a sample. In the South Island, microscopic analysis is carried out, while in the North Island, microscopic and DNA analysis is done.
DOCDM-765928 Introduction to periphyton monitoring in freshwater ecosystems v1.0 15
Inventory and monitoring toolbox: freshwater ecology
impacts of riparian planting and increased shade on stream communities. Even if quantitative
biomass sampling is undertaken, you should still make notes on periphyton cover and composition,
so that your laboratory results can be cross-checked and so you can determine whether the
biomass/community was composed mostly of long filaments versus mats or films.
The methods for periphyton monitoring in freshwater ecosystems are:
Freshwater ecology: periphyton rapid assessment monitoring in streams—method 1 (RAM-1)
(docdm-769146)
Freshwater ecology: periphyton rapid assessment monitoring in streams—method 2 (RAM-2)
(docdm-769150)
Freshwater ecology: quantitative periphyton biomass sampling methods (docdm-766000)
Freshwater ecology: periphyton taxonomic sampling and identification (docdm-784937)
If in doubt it is better to collect more information in the field and not process it, than to have an initial
data set that is inadequate to address your objectives.
DOCDM-765928 Introduction to periphyton monitoring in freshwater ecosystems v1.0 16
Inventory and monitoring toolbox: freshwater ecology
*1 A bare minimum habitat assessment should be carried out at every site (see ‘Stream habitat assessment field sheet’—docdm-761873).
Decision tree for periphyton monitoring in freshwater ecosystems
DOCDM-765928 Introduction to periphyton monitoring in freshwater ecosystems v1.0 17
Inventory and monitoring toolbox: freshwater ecology
References
Allan, J.D.; Castillo, M.M. 2007: Stream ecology: structure and function of running waters. 2nd edition.
Springer, Dordecht. 429 p.
Biggs, B.J.F. 2000a: Eutrophication of streams and rivers: dissolved nutrient-chlorophyll relationships for
benthic algae. Journal of the North American Benthological Society 19: 17–31.
Biggs, B.J.F. 2000b: New Zealand periphyton guideline: detecting, monitoring and managing
enrichment in streams. Prepared for the Ministry for the Environment. NIWA, Christchurch.
Biggs, B.J.F.; Close, M.E. 1989: Periphyton biomass dynamics in gravel bed rivers: the relative effects
of flows and nutrients. Freshwater Biology 22: 209–231.
Biggs, B.J.F.; Kilroy, C. 2000: Stream periphyton monitoring manual. Prepared for the New Zealand
Ministry for the Environment. NIWA, Christchurch.
Biggs, B.J.F.; Kilroy, C. 2004: Periphyton. Pp. 15.1–15.21 in Harding, J.S.; Mosley, P.; Pearson, C.;
Sorrell, B. (Eds): Freshwaters of New Zealand. New Zealand Hydrological Society and New
Zealand Limnological Society: Christchurch.
Biggs, B.J.F.; Kilroy, C.; Mulcock, C.M. 1998. New Zealand stream monitoring and assessment kit.
Stream monitoring manual. Version 1. NIWA Technical Report 40. 150 p.
Biggs, B.J.F.; Stevenson, R.; Lowe, R. 1998: A habitat matrix conceptual model for stream periphyton.
Archiv für Hydrobiologie 143: 25–56.
Bothwell, M.R.; Kilroy, C. 2011: Phosphorus limitation of the freshwater benthic diatom Didymosphenia
geminata determined from the frequency of dividing cells. Freshwater Biology 56: 565–578.
Bothwell, M.R.; Kilroy, C. 2012: Didymosphenia geminata growth rates and bloom formation in relation
to ambient dissolved phosphorus concentration. Freshwater Biology 57: 641–653.
Clausen, B.; Biggs, B.J.F. 1997: Relationships between benthic biota and hydrological indices in New
Zealand streams. Freshwater Biology 38: 327–342.
Harding, J.S.; Clapcott, J.; Quinn, J.; Hayes, J.; Joy, M.; Storey, R.; Greig, H.; Hay, J.; James, T.;
Beech, M.; Ozane, R.; Meredith, A.; Boothroyd, I. 2009: Stream habitat assessment protocols
for wadeable rivers and streams of New Zealand. University of Canterbury, Christchurch.
http://www.cawthron.org.nz/coastal-freshwater-resources/downloads/stream-habitat-
assessment-protocols.pdf
Hynes, H.B.N. 1975: The valley and its stream. Verhandlungen der Internationale Vereinigung für
Theoretische und Angewandt Limnologie 19: 1–15.
DOCDM-765928 Introduction to periphyton monitoring in freshwater ecosystems v1.0 18
Inventory and monitoring toolbox: freshwater ecology
Kilroy, C.; Biggs, B.; Blair, N.; Lambert, P.; Jarvie, B.; Dey, K.; Robinson, K.; Smale; D. 2005: Ecological
studies on Didymosphenia geminata. NIWA client report CHC2005-123 prepared for MAF. 79 p.
Kilroy, C.; Bothwell, M. 2011: Environmental control of stalk length in the bloom forming freshwater
benthic diatom Didymosphenia geminata (Bacillariophyceae). Journal of Phycology 47(5): 981–
989.
Quinn, G.P.; Keough, M.J. 2002: Experimental design and analysis for biologists. Cambridge University
Press. 537 p.
Quinn, J.M., Cooper, A.B.; Stroud, M.J.; Burrell, G.P. 1997: Shade effects on stream periphyton and
invertebrates: an experiment in streamside channels. New Zealand Journal of Marine and
Freshwater Research 31: 665–683.
Scarsbrook, M.R.; Townsend, C.R. 1993: Stream community structure in relation to spatial and
temporal variation: a habitat template study of 2 contrasting New Zealand streams. Freshwater
Biology 29: 395–410.
Sagar, P.M. 1986: The effect of floods on the invertebrate fauna of a large unstable braided river. New
Zealand Journal of Marine and Freshwater Research 20: 37–46.
Zar, J.H. 1999. Biostatistical analysis. 4th edition. Prentice Hall, New Jersey. 663 p.

DOCDM-765928 Introduction to periphyton monitoring in freshwater ecosystems v1.0 19
Appendix A
The following Department of Conservation documents are referred to in this method:
docdm-769146 Freshwater ecology: periphyton rapid assessment monitoring in streams—
method 1 (RAM-1)
docdm-769150 Freshwater ecology: periphyton rapid assessment monitoring in streams—
method 2 (RAM-2)
docdm-784937 Freshwater ecology: periphyton taxonomic sampling and identification
docdm-766000 Freshwater ecology: quantitative periphyton biomass sampling methods
docdm-870579 A guideline to monitoring populations
docdm-146272 Standard inventory and monitoring project plan
docdm-761873 Stream habitat assessment field sheet