Embed Size (px)
Citation preview
DOCUMENT RESUME
ED 301 324 PS 017 623
AUTHOR Entwisle, Doris R.; And OthersTITLE A Social Psychological Model of the Schooling Process
over First Grade. Report No. 28.INSTITUTION Center for Research on Elementary and Middle Schools,
Baltimore, MD.SPONS AGENCY Office of Educational Research and Improvement (ED),
Washington, DC.PUB DATE Jul 88GRANT OERI-G-86-90006NOTE 46p.
PUB TYPE Reports - Research/Technical (143)
EDRS PRICE MF01/PCO2 Plus Postage.DESCRIPTORS *Academic Achievement; *Adjustment (to Environment);
*Cognitive Development; *Elementary School Students;Expectation; Grade 1; Peer Influence; Personality;Primary Education; *Racial Differences; StressVariables
ABSTRACTThis paper examines the process of educational
achievement for a birth cohort of Baltimore children who werefollowed prospectively during their first grade year. The analysis,which employed a social-psychological model of the early schoolingprocess, identified some of the personal, interpersonal, andsituational factors that influence cognitive development during theperiod of transition from home child to school child. Gains onstandardized tests of verbal and mathematical competence were theachievement criteria used. Black children's lower initial report cardmarks and slower pace of cognitive growth indicated that theyexperienced more transition shock making the move into full-timeschooling than did white children. The processes that determined theachievement of the two groups were also different. Personality andtemperament variables turned out to be very important for earlyschooling, and evidence was also found for the efficacy of parents assignificant others. Self-expectations had effects only on verbal testperformance, and there was no indication of peer influence during thesettling-in period. Implications of these findings for models ofdevelopment and for understanding the social psychological basis ofachievement are discussed. (Author/RH)
* Reproductions supplied by EDRS are the best that can be rade* ftom the original document. *
,
4*tI
iCont r forRos cron OnElomentary &Viccile Schoo
U S DEPARTMENT OF EDUCATIONOffice of Educational Research and improvement
EDUCATIONAL RESOURCES INFORMATIONCENTER (ERIC)
Xhis document has been reproduced aseceivad from the person or organization
ongmattng it
n mnct ct,anges Ta.c been made to Mpfuvereproduction quality
PcorltS of new or opnlons slated in this documerit do not necessarily represent officialOERI bos.fion or policy
S
Report No. 28July, 1988
A SOCIAL PSYCHOLOGICAL MODEL OF THESCHOOLING PROCESS OVER FIRST GRADEDoris R. Entwise, Karl L. Alexander,Aaron M. Pallas, and Doris Cadigan
2
"PERMISSION TO REPRODUCE THISMATERIAL HAS BEEN GRANTED BY
:"SohnkAok\Skek4
TO THE EDUCATIONAL RESOURCESINFORMATION CENTER (ERIC)"
Center Staff
Edward L Mc Dill, Co-DircctorJamcs M. McPartland, Co-Dircctor
Karl L. AlcxandcrHenry J. BeckerBarbara A. BennettJomills H. Braddock 11Rcnec B. CastancdaBarbara S. ColtonRussell L. DawkinsDoris R EntwislcJoyce L. EpsteinAnna Maric FarnichDc.,isc C. GottfrcdsonGary D. Gottfrcdson
Center Liaison
Edward J. HarschJohn H. HollificldLois G. HyblNancy L. KarweitMclvin L. KohnNancy A. MaddenAlcjandro PortcsRobcrt E. SlavinCarleton W. SterlingRobert J. StevensTammi J. SweeneyShi Chang Wu
Rcnc Gonzalez, Office of Educational Research and Improvement
National Advisory Board
Patricia A. Bauch, Catholic Univcrsity of AmcricaJcrc Brophy, Michigan State UnivcrsityJcannc S. Chall, Harvard UnivcrsityJamcs S. Colcman, Univcrsity of ChicagoEdgar G. Epps, University of ChicagoBarbara Hcyns, Ncw York UnivcrsityDavid W. Hornbcck, Maryland Statc Dcpartmcnt of EducationMichacl W. Kirst, Chair, Stanford UnivcrsityRcbccca McAndrcw, Wcst Baltimorc Middlc SchoolSharon P. Robinson, National Education Association
3
1
A Social Psychological Model of the Schooling l'rocess
Over First Grade
Grant No. OERI -G -86 -90006
Doris R. Entwisle, Karl L. Alexander, Aaron M. Pallas
and Doris Cadigan
Report No. 28
July 1988
Published by the Center for Research on Elementary and Middle Schools, supported as a nationalresearch and development center by funds from the Office of Educational Research and Improve-ment, U.S. Department of Education. The opinions expressed in this publication do not necessarilyreflect the position or policy of the OERI, and no official endorsement should be inferred.
Center for Research on Elementary and Middle SchoolsThe Johns I-146ns University
3505 North Charles StreetBaltimore MD 21218
Printed and assembled by:VSP Industries
2440 West Belvedere AvenueBaltimore MD 21215
4

The Center
The mission of the Center for Research on Elementary and Middle Schools is toproduce useful knowledge about how elementary and middle schools can foster growth instudents' learning and development, to develop and evaluate practical methods forimproving the effectiveness of elementary and middle schools based on existing and newresearch findings, and to develop and evaluate specific strategies to help schools imple-ment effective research-based school and classroom practices.
The Center conducts its research in three program areas: (1) Elementary Schools; (2)Middle Schools, and (3) School Improvement.
The Elementary School Program
This program works from a strong existing research base to develop, evaluate, anddisseminate effective elementary school and classroom practices; synthesizes currentknowledge; and analyzes survey and descriptive data to expand the knowledge base ineffective elementary education.
The Middle School Program
This program's research links current knowledge about early adolescence as a stageof human development to school organization and classroom policies and practices foreffective middle schools. The major task is to establish a research base to identify spe-cific problem areas and promising practices in middle schools that will contribute toeffective policy decisions and the development of effective school and classroom prac-tices.
School Improvement Program
This program focuses on improving the organization-1 performance of schools inadopting and adapting innovations and developing schoo. rapacity for change.
This report, prepared by the Elementary School Program, examines the effects ofbackground and school factors on the achievement of a cohort of first-grade students asthey progress from the beginning to the end of first grade.
A Social Psyaholoyical Modal ofthe Schooling Process over First Grade
ABSTRACT
Children's experiences during first grade, as they pass through a key
life-cycle transition, are an especially critical but generally neglected
period in the sociology of Child development. This paper examines the
process of educational achievement for a birth cohort of Baltimore children
followed prospectively over their firs._ grade year. &playing a socidl-
psydhological model of the early schooling process, the analysis identifies
same of the personal, interpersonal and situational factors that influence
cognitive development during this period of transition from wbone diild" to
"sahool Child". Gains on standardized tests of verbal and mathematical
competence are the achievement criteria used. Black children experienced
more transition shock than white children in making the move into full-time
schooling, as indicated by their lower initial report mad marks and slower
pace of cognitive growth during the year. The processes determining the
achievement of the two groups also were .somewhat different. Personality/
temperament variables turned out to be very Important for early schooling,
and evidence was found as well for the efficacy of parents as "significant
others." Ellf-expectations had effects only on verbal test performance,
and there was no indication of peer influence during this important settling
in period. Implications of these findings for models of development and for
understanding the social psychological basis of the achievement process are
discussed.
INTROWCTICV
Age, a prepotent dimension of social organization in all segments of
society, is nowhere more prominent than in our school systems. In fact, the
recognition of "childhood" as a particular phase of human development
coincided with the emergence of universal sdhooling, and although the
boundarieg around most life periods are becoming hazy, middle childhood is
still clearly the span from age 6, when formal sdhooling begins, to early
adolemcence, when children move from elementary to middle or junior high
sdhool. Sanehai, though, despite middle childhood's distinctiveness as a
life period and despite the increasing reseal dh attention devoted to the
transition that marks its end (see the researdh summaries reported in
Collins, 1984), the transition at its beginning has been neglect d. This
paper begins to fill part of that gap.
Transitions are times when people's social roles are redefined by some
non-familial authority (Elder, 1968), times when new social expectations and
Obligations are assumed. Research to date on life transitions underlines the
wisdom of thinking About transitions in terms of social constructs. For
example, Simmons and her co-workers (Simmons and Blyth, 1987; Rosenberg and
Simmons, 1972) demonstrate that moving from elementary to junior high
increases stress of the adolescent transition partly because students move
from being "tap" to "bottom" dog in the school social system. In fact,
this change in relative social standing appears to be more critical in terms
of possible damage to the student's self-image than is the timing of
puberty. In similar vein, the physical changes of puberty affect the
adolescent transition mainly by way of the social constructions people put
on those changes. Girls find this transition difficult in part because the
3
physical changes that accompany pubescence involve increasing body fat, and
"fatness" in contemporary American society is undesirable.
The transition that occurs when Children begin formal schooling marks
another time when youngsters experience a sharp drop in social standing.
They go from the protective circle of the family where they are rated in
ipsative terms -- how they compare with themselves last month or last
year -- to the intensely competitive arena of the classroom where they are
rated almost daily relative to 25 or 30 other Children. At the same time
they face a number of challenging psychic tasks. They must construct an
image of self as student, discover the norms and mores of the school, learn
how to get along with new peers and authority figures, and map strategies
for mastering the necessary skills.
The immediate social context Obviously is critical for children as they
engage in these developmental tasks. For example, parents give explicit
advice an how to "get along" best in scnool, but perhaps even more important
parents convey their attitudes and expectations about the sdhool and about
sdhooling through many subtle expressions and actions. They can portray
school as a hostile or hospitable place merely by a glance or a chuckle.
And classmates react to students in ways that are unaMbiguoua and dimct.
A Meadian perspective in particular suggests that first-grade children
evaluate themselves and construct expectations for their school performance
on the basis of evaluations of significant others. We suspect that parent
influence is likely to outwei;t that of peers when Children are beginning
school because of the psychological closeness of parent and child at this
point in life. Additionally children may respond quite differently to
school according to their family's socioeconomic level because parents of
4
different socioeconomic levels socialize their preschool children
differently in preparing then to enter school (Hess et al., 1968). For
example, parents of higher socioeconomic status portray school as a place
responsive to individual needs and effort whereas parents of lower status
emphasize the need of the child to conform and respect authority.
The Child's more distal social context Should also be influential over
this transition because Children, even at this age, recognize the major
fault lines in society. They are well aware, for instance, of the existence
of ethnic and minority groups and have particularly clear conceptions of
same of the implications of gender. Primary school Children know about jabs
in terms of their sex-typicality (Swafford, 1975), for instance, and About
the " gender- appropriateness" of various school subjects (Entwisle et al.,
1987). There is little doubt than the social psychological climate of
school does differ for children of the two sexes (Entwisle and Baker, 1983).
It also differs for those from various socioeconomic and ethnic backgrounds,
even in first grade. Alexander, Entwisle, and Thompson (1987) found, for
exampin, that the social distance in terms of social class background
separating children from teachers has a direct bearing on teachers'
expectations for children's performance and also on haw teachers judge
children's personal maturity. Clearly, then, both proximal and distal
aspects of social structure would be expected to ippinge an the first-grade
transition.
As implied above, transitions are informative in terms of
understanding life change because they are points of maximum
continuity/discontinuity in development of social roles. But transitions
also are strategic periods for study because they provide a particularly
5
clear window on social-psychological development -- duringffigkzerdsga
variability among individuals tends to ice. 'Ibis latter reason for
studying transitions is not widely appreciated. Rather like what happens in
a bicycle race, it is hard to make distinctions among people when all are
clustered together pedalling along on the straightaway but a hill spreads
people out so it is easier to see who is leading and who is falling behind.
Life transitions are crucible periods when people are challenged and
differences an them tend to widen.
In this paper we will track a tigthLsgbmit of Baltimore youngsters as
they make the transition into full-time schooling.1 We will focus
especially on how the children's significant others and they themselves help
or hinder the settling-in process. We will also consider how the larger
social structure impinges on cognitive growth by investigating haw
children's minority status and socioeconomic background affect school
performance during this period.
THE MODEL
The vehicle for this inquiry will be a multivariate school process
model akin to those applied extensively at the secondary level in so-called
"status attainment" reseuth. As in that tradition, the model organizes
same of the structural, interpersonal, and intrapersonal forces that direct
individuals' achievement strivings.
The first, and still most elegant, integration of these themes is the
Wisconsin "school process" model (see Sewell, Haller and Fortes, 1969;
Sewell, Haller, and Chlendorf, 1970; Haller and Wbelfel, 1972), whidh gives
primacy to the individual as goal-oriented actor, and seeks to explicate the
interpersonal and situational processes that ex lain individual differences
6
10
in achievement orientations. The Wisconsin model, though, affords only a
snapshot of experiences during secondary school and very little is known
about the developmental precursors of the socio-psydhological processes
involved 7.t that level. In fact, with the exception of Entwisle and
Hayduk's studies (1978; 1981; 1982), research at the primary level has not
attempted a broadly inclusive accounting of the social- psychological
processes that underlie achievement Frocesses. Since the aim here is to
look specifically at children's cognitive growth over first grade in terms
of the social and interpersonal forces that vvern it, the Entwisle-HaydUk
(1982) model will be elaborated. In particular, information About the
Child's temperament/personality and special prOblcos (visim, hearing) will
be included. Personality variables are not customarily included in studies
of achievement at the secondary level because, al-hough signfricant
statistically, they have turned out AO be of quite small magnAtude (see
Gottfredson, 1982; Muase 1979). At the primary level, how-ver, childrrl's
temperament, ability to content ate and social matL:i_ty could turn to be
much more iTortant.
Figure 1 about here
The child's ascriptive charactristics -- race and sex -- appear first
in the model for obvious reasons. Because we wish to veasure gains in
achievement, initial CAT scores in the verbal and math as are in the
first block as well. Personality or temperamental cilakacteristics
associated with dwelopmental maturity of the child are included in the
first block because, as re.;.tionei, for Ch.] lren beginning school
7
iS
developmental maturity may be especially important. Teacher and peers may
rate more positively those children who get along well in a group and who
are usually happy, and give such children more learning opportunities. By
the same token, youngsters who are restless, disruptive, and unable to
concentrate would be expected to profit less from instruction.2
Family effects of two kinds appear in the model. Parents' educational
background is a well-known source of variance in rtatus attainment at the
secondary level, and the available evidence, although scarce, points to
strong effects of parents' educational background at the primary level as
well (see Heyns, 1978; Weikart et al., 1978). Parents are also implicated
in the model as significant others. By their daily interactions with the
child they help shape the child's early self-ooncept and achievement. In
this model three variables capture the influence of parents as significant
others: parents' notions of the child's ability level relative to other
children in the school, and parents' specific expectations for how well
their children will perform in the key areas of reading and mathematics.3
Particularly important for children of this age is an indicator taking
account of special problems (vision, hearing, and the like) that could
impair progress in first grade. Because we view this as a control variable,
't appears in a separate block below the initial block in Figure 1.
The importance of informal relations among pupils, particularly peer-
popularity, for school performance is captured in the second block of Figure
1. Inclusion of peers in the model rests mainly on theoretical grounds that
support the existence of relationships between peer-popularity and pupil
attitudes and achievement (COopersuLith, 1959; Horowitz, 1962). Recent
studies by Ladd and Price (1987) suggest that the social dimension of peer
8
:; 2
relations is especially sal during the early elementary years, while
other research on elementary-school children shows that low peer-popularity
leads to low utilization of academic abilities (Echelberger, 1i59; Sdhmudk,
1962, 1963).
The child's self-expectations appear in the model both as outcomes and
as antecedents. These are locates in the first and third blocks of the
model, corresponding, respectively, to fall and spring self-assessments.
Children develop expectations for their own performance based on how others
react to them, and take this information into account when they evaluate
their an performance. Entwisle end Hayduk (1982) and Brookover and
colleagues (1967, p.77) moth provide evidence for a link between self-
concept of ability and school achievement.
The child's performance is periodically assessed by teachers' marks,
and these too appear in the model -Is intervening variables. First quarter
marks are located in the second block, third quarter marks in the third
block. This allows us to consider how performance evaluations from early in
the year might differ from those later in the year. Since we are especially
interested in first grade as a transition period, the signals provided by
marks are of particular interest. For youngsters the social situation
should be most fluid at this point, and these marks constitute their first
formal evaluation from adult authority in the school context. We assume
that all actors use such feedback to regulate their behavior, and it is
through such mechanisms that marking distinctions impact upon subsequent
learning and self views.
Our model also considers attendance ("ilea and Harnischfeger, 1974).
9
It m j be especially important for school beginners because early reading
and mathematical instruction is hierarchically arranged.
Variables in the model are added, in successive blocks that reflect the
presumed sequencing of their impact. In most instances the timing of
measurement conforms to this sequence (see the description of the study
design below). One exception is tne measure of developmental maturity,
which was secured late in the year but appears in the initial block.
Another exception is the indicator for problem referral, which pertains to
referrals throughout the year. Many of these problems, thou h, like vision
prdblems, were "pre-existing," but only would be identified or recognized as
difficulties presented 'themselves during the school year.
The model traces the flow of influence through the anrual schooling
cycle. The first block of variables includes individual and background
factors (sex, race, various parent influences, the child's own expectations
and personal maturity) that are present either before schooling ber;ins or
vary early in the school year (in the case of the pupil's own performance
expectations).4 The second block of variables implicates school experiences
early in the school year: he first mark, popularity with peers, and
regularity of attendance. The third block incorporates school experiences
later in the year: the child's expectation for end of year performance and
third quarter (spring) mark in the relevant academic damain.5
Vertal and quantitative standardized test performance at the end of
grade one are considered separately as outcomes. Both scores at the
beginning of the year are inserted as part of the first block. (The
pattern of findings is the same whether one test score or both are inserted
in the initial block.) The influences of predetermined variables are
10
coostrained to be domain specific: for verbal outcomes, the relevant
explanatory variables pertain to reading (parent's expectations for reading
performance, child's expectations for reading performance, and reading
marks); for math outcomes, the relevant explanatory variables pertain to
math (parent's expectations for math performance, child's expectation for
math performance, and math marks). The model is estimated by full
information maximum likelihood procedures. Reliability estimates are
provided in Table 1.
MEITIODS
The Sample
The data come from the Beginning School Study (BSS) , initiated in the
fall of 1982 in 20 Baltimore City elementary sdhools. A stratified random
sampling was employed to assure a sample about equally-divided by race and
representative of all socioeconomic levels in the school system. In order
to begin Obtaining parental consent before the start of school in the fall,
kindergarten rosters from 1981-82 served as initial sampling lists. These
were supplemented by rosters of first grade classes in the fall. Both
rosters were used to draw random samples of children from each first grade
classroom in the 20 schools in September 1982. Less than 3% of the children
thus selected were excluded because of parent refusals. By this means 825
Baltimore City first graders were selected into the study. For purposes of
this analysis a birth cohort was identified by selecting only children who
were 6.9 years or less in December of 1982.
Beginning in the summer and continuing into the fall, 785 parent:.
(usually the mother) were interviewed. Pupils were interviewed individually
on two occasions, before the issuance of first quarter report cards in the
11
15
fall and again between the third quarter and year-end report cards.
Teachers were asked to respond to three questionnaires, staggered throughout
the year. Of fifty-five first grade teachers, 51 provided at least sme
data.
Analyses to be presented here are based on a "core sample" of 676
children, those who were not repeating first grade, who remained in the
study for the entire year, and whose parents and teachers provided data
through interviews and self-administered questionnaires, respectively.
Missing values were imputed for about 15% of the values for the personal
maturJLty and peer popularity variables, 2% of the values for the four
variables involving parents, and a maximum of 1% of the values for other
variables, using separate means for those who were promoted or not promoted
at the end of the year.6
=MN=Data were collected directly from parents, students and teachers on
separate occasions. Parents were questioned in their homes in late summer
or early fall. Children were interviewed individually during school hour% in
the fall but later than parents. All fall interviews were completed before
the end of the first marking period. Mealamvar t of parents' and children's
expectations thus weceded issuance of the children's first report cards.
In late Mardh, after children had a chance to get to know each other,
teachers rated students in terms of peer popularity. Teachers also answered
14 questions pertaining to each student's personal maturity in the spring.
Between the third and fourth (final) marking periods a second student
interview was conducted, which is the source of the data on children's
expectations for their end-of-year marks. Marks, absences, problem referral
12
records, and CAT scores were obtained from school records after the end of
the academic year.
Variables
Ram Race we., coded 0 for white, 1 for black. The few (7) orientals and
Indians in the sample were coded (0).
Sex. Sex was coded 0 for boys, 1 for girls.
parent's educational attainment. This information, obtained directly fran
parent interviews, indicates the number of school years completed.
Parent's ability estimate. Parents were asked: "How do you think your child
compares with other children in his/her school in terms of ability to do
school work?" scored from (5) Among the best to (1) Among the poorest.
Parent's expectations. Parents provided their "best guesses" for their
child's first mark in reading and mathematics: 4 for Ocoellent, 3 for Good,
2 for Satisfactory and 1 for Unsatisfactory. These distinctions correspond
to the narking system used on report cards.
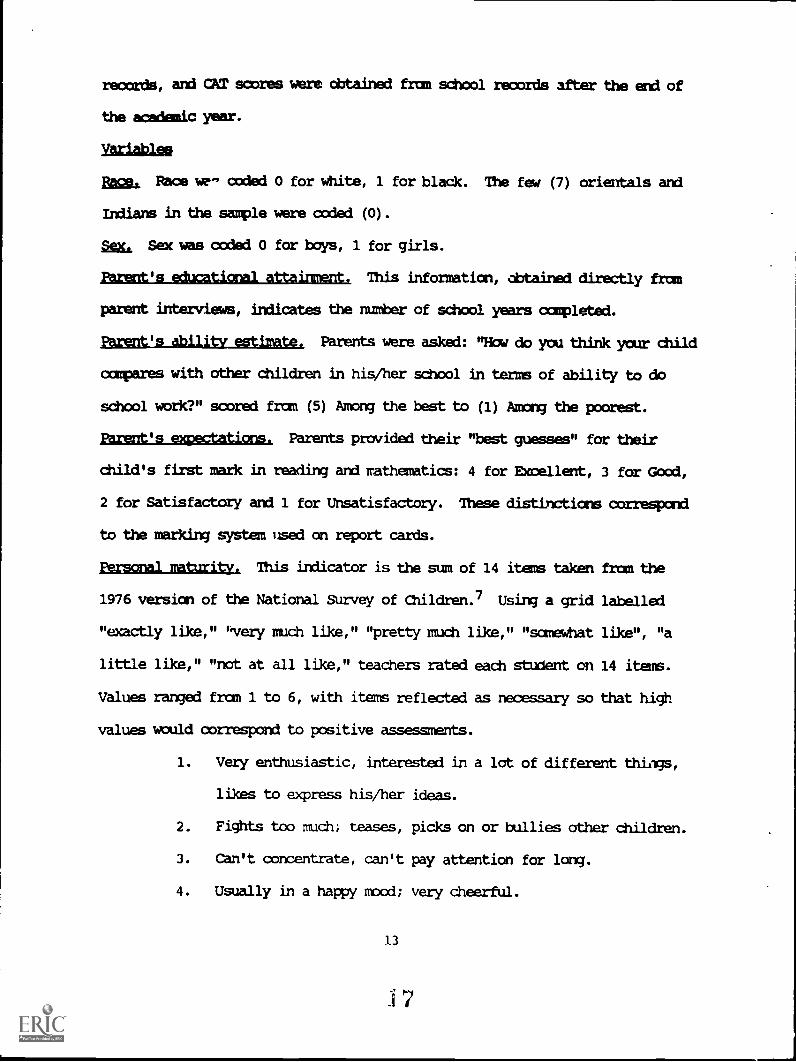
Personal maturity. This indicator is the sum of 14 items taken from the
1976 version of the National Survey of Children.7 Using a grid labelled
"exactly like," 'every much like," "pretty much like," "somewhat like", "a
little like," "not at all like," teachers rated each student on 14 items.
Values ranged from 1 to 6, with items reflected as necessary so that high
values would correspond to positive assessments.
1. Very enthusiastic, interested in a lot of different thims,
likes to express his/her ideas.
2. Fights too much; teases, picks on or bullies other children.
3. Can't concentrate, can't pay attention for long.
4. Usually in a happy mood; very cheerful.
13
7
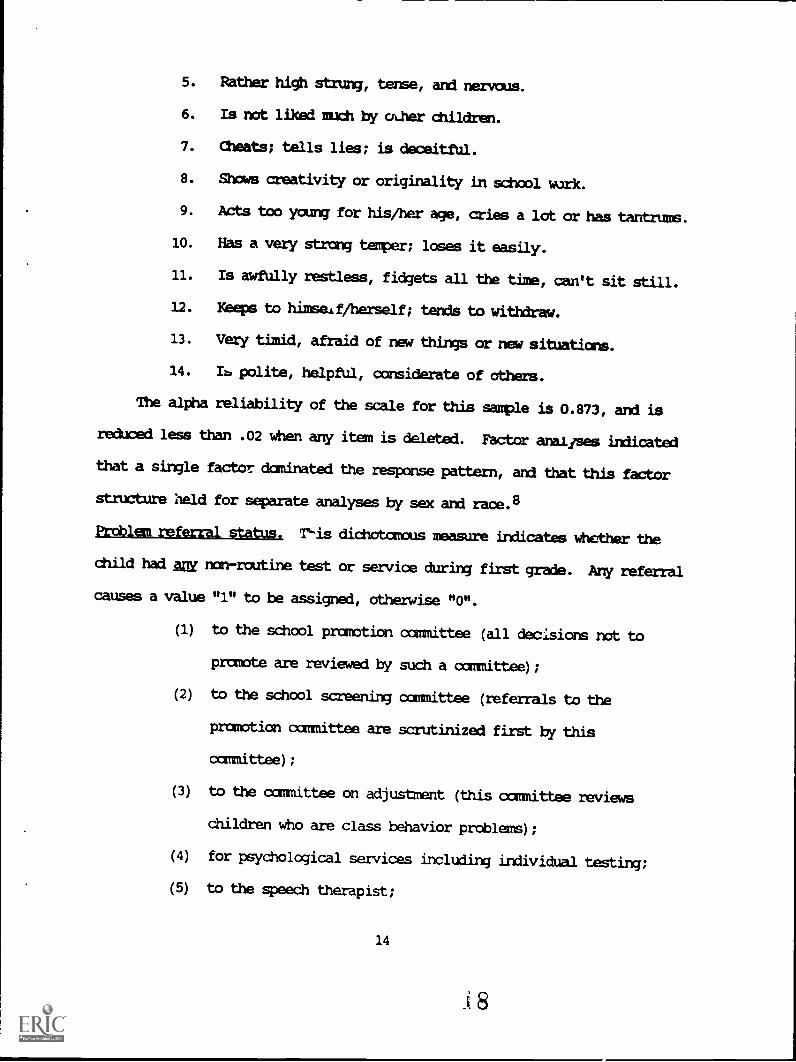
5. Rather high strung, tense, and nervous.
6. Is not liked much by other children.
7. Cheats; tells lies; is deceitful.
8. Shows creativity or originality in school work.
9. Acts too young for his/her age, cries a lot aches tantrums.
10. Has a very strong temper; loses it easily.
11. Is awfully restless, fidgets all the time, can't sit still.
12. Keeps to himseif/herself; tends to withdraw.
13. Very timid, afraid of new things or new situations.
14. Ib polite, helpfUl, considerate of others.
The alpha reliability of the scale for this sample is 0.873, and is
reduced less than .02 when any item is deleted. Factor analyses indicated
that a single factor dominated the response pattern, and that this factor
structure held for separate analyses by sex and race.8
B242]ggEreffxratiat D'is dichotomous measure indicates whether the
child had Any non-routine test or service during first grade. Any referral
causes a value "1" to be assigned, otherwise "0".
(1) to the school promotion committee (all decisions not to
promote are reviewed by such a camittee);
(2) to the school screening committee (referrals to the
promotion committee are scrutinized first by this
committee) ;
(3) to the committee on adjustment (this committee reviews
children who are class behavior problems);
(4) for psychological services including individual testing;
(5) to the speech therapist;
14

(6) for social worker visit to the child's home;
(7) to the reading resouroe specialist;
(8) to the vision or hearing specialist;
(9) to the physical therapist;
(10) to the attendance worker.
=glen's EXpectations. Before children received their first report card,
in individual interviews they guessed their forthcoming marks in reading and
mathematics by "playing a game". (See Entwisle and Hayduk (3982) for a
description of this procedure.) Children's expectations for mathematics and
reading were coded from 4 (high or "E"-excellent) to 1 (low or "U"--
unsatisfactory). Just before the year-end report card, children were
reinterviewed and asked to make guesses concerning the marks they expected
to receive an their last report card.
Marks. Marks in zeading and mathematics were obtained from school records.
These are: E (Excellent), G (Good), S (Satisfactory), or U (Unsatisfactory),
coded from "4" to "1" respectively.
Peer popularity. Ratings, obtained from teacLers in the spring, are coded
from "5" (most popular) to "1" (least popular).
Absences. Absences for the school year were taken from school records.
CAT scores. In October 1982 and May 1983, system -wide testing provided
California Achievement Test scores (Level 11 Form C). The verbal CAT score
used here is the average of 4 subtests (phonic analysis, vocabulary,
comprehension and language). The math CAT score used here is the average of
2 subtests (computation and concepts). If one or more subtests was
missing, the "average" is the average of the available subtests.
15
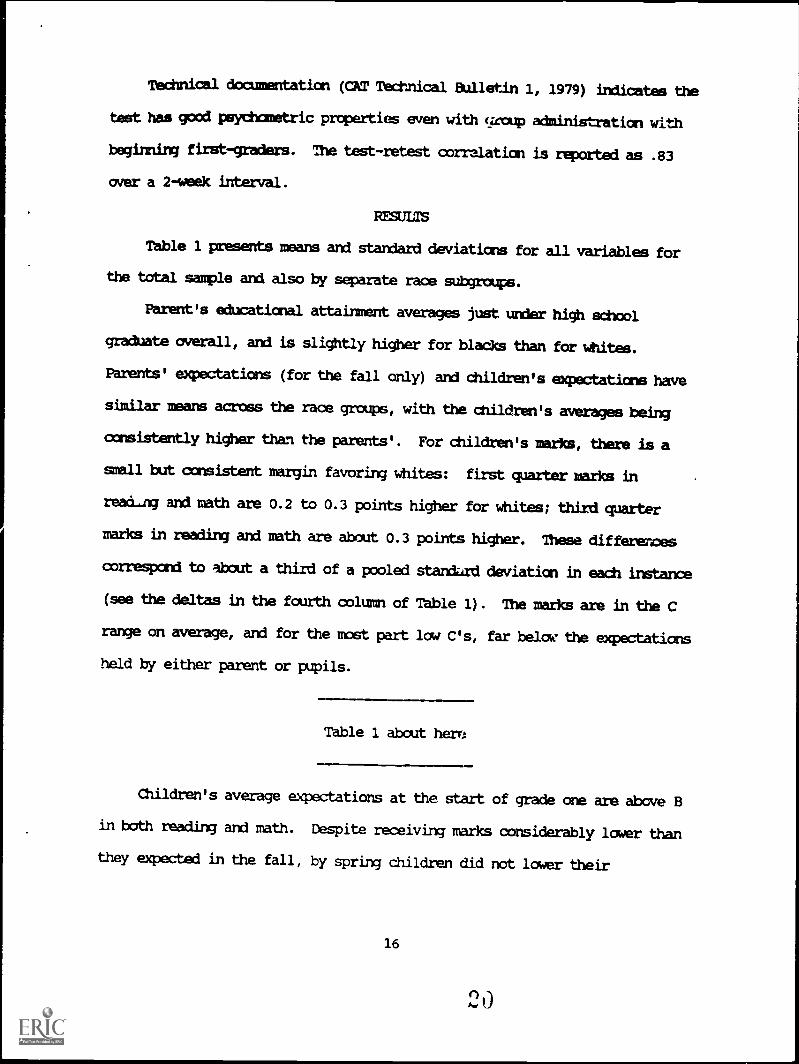
Technical documentation MG Technical Bulletin 1, 1979) indicates the
test has good psychometric properties even with Group adminis'aation with
beginning first-graders. The test-retest correlation is reported as .83
over a 2-week interval.
RESULTS
Table 1 presents means and standard deviations for all variables for
the total sample and also by separate race subgroups.
Parent's educational attainment averages just under high school
graduate overall, and is slightly higher for blacks than far whites.
Parents' expectations (for the fall only) and children's expectatians have
similar means across the race groups, with the children's averages being
consistently higher than the parents'. For children's marks, there is a
small but consistent margin favoring whites: first quarter marks in
reading and uath are 0.2 to 0.3 points higher for whites; third quarter
marks in reading and math are about 0.3 points higher. These differemes
correspond to about a third of a pooled standard deviation in each instance
(see the deltas in the fourth column of Table 1). The marks are in the C
range on average, and for the most part low C's, far below the expectations
held by either parent or pupils.
Table 1 about here
Children's average expectations at the start of grade one are above B
in both reading and math. Despite receiving marks considerably lower than
they expected in the fall, by spring children did not lower their
16
ti )
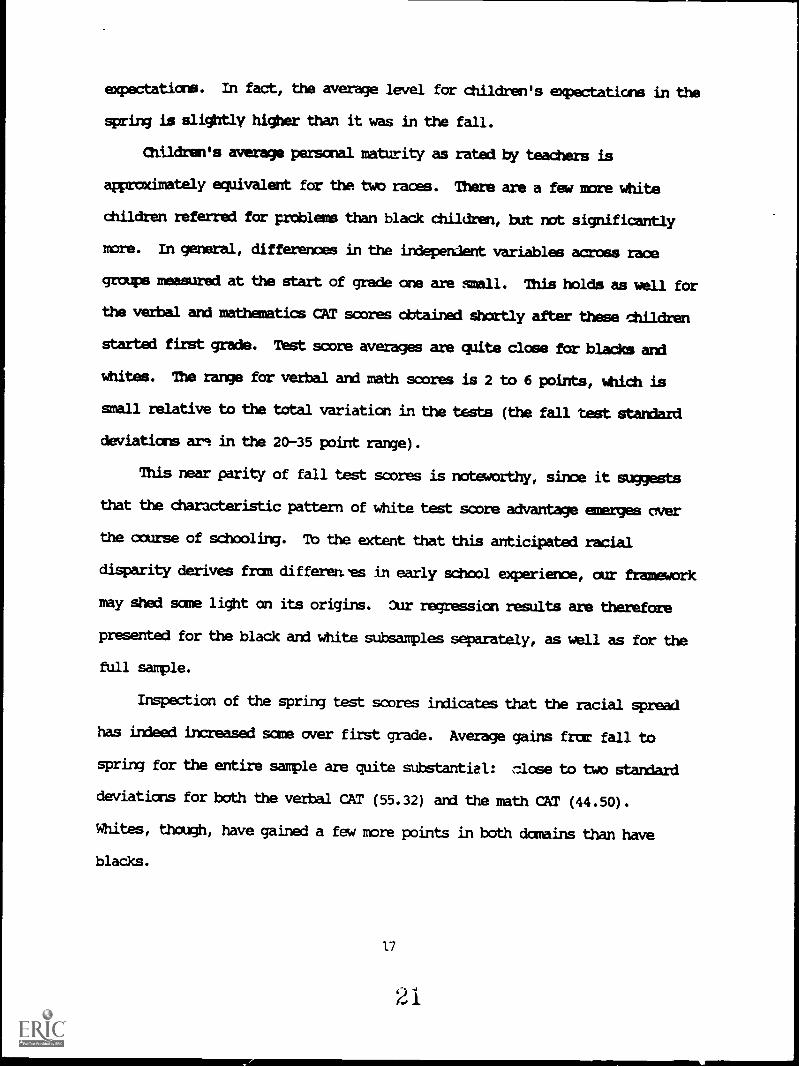
expectations. In fact, the average level for children's expectations in the
spring is slightly higher than it was in the fall.
Children's average personal maturity as rated by teachers is
approximately equivalent for the two races. There are a few more white
children referred for problems than black children, but not significantly
more. In general, differences in the indeperrdent variables across rape
groups measured at the start of grade one are small. This holds as well for
the verbal and mathematics CAT scores obtained shortly after these children
started first grade. Test score averages are quite close for blacks and
whites. The range for verbal and math scores is 2 to 6 points, which is
small relative to the total variation in the tests (the fall test standard
deviations am in the 20-35 point range).
This near parity of fall test scores is noteworthy, since it suggests
that the characteristic pattern of white test score advantage emerges over
the course of schooling. To the extent that this anticipated racial
disparity derives from differences in early school experience, our framework
may shed said light an its origins. Our regression results are therefore
presented for the black and white subsamples separately, as wall as for the
full sample.
Inspection of the spring test scores indicates that the racial spread
has indeed increased some over first grade. Average gains frac fall to
spring for the entire sample are quite substantial: close to two standard
deviations for both the verbal CAT (55.32) and the math CAT (44.50).
Whites, though, have gained a few more points in both domains than have
blacks.
17
21
Parameters estimated to explain these gains in CAT verbal and meth
scores for the sample as a whole appear in Table 2 and separately for the
two races in Tables 3 and 4. (Our consideration of race comparisons will be
highly selective because we are interested mainly in describing the general
achievement process.) Metric coefficients are given first for each
variable, with the corresponding standardized effects in parentheses below.
The model includes fall CAT scores in the initial block, so the focus
is an gains in each CAT domain over the year. In strictly empirical terms,
this framework proves quite powerful, accounting for almost 80% of the
variance in spring verbal CAT scores and over 75% of the variance in math.
Background and student characLristics alone, including student's personal
maturity and problem referrals, account for a large fraction of the variance
in each domain (74% and 73%, respectively).
Tables 2, 3, and 4 here
anagarre.qiilklUlf
In most respects results for verbal and quantitative performance are
quite similar, and so they will be discussed together.
Year-end test performance is substantially determined by factors
already "in place" at the time of school entry, with fall test scores having
large effects. Such continuity in performance levels at the onset of formal
school'Ig highlights both the importance of preschool development in
structuring cognitive capacities and the constraints under which schools
labor. Nevertheless, the results indicate that other factors can, and do,
influence the course of cognitive development.
18
4)2
The fact that fall testing levels are cmtrolled throughout has
important implications for t%e interpretation of the coefficients. By
adjusting for initial test differences, the design isolates sources of
change in cognitive performance over the per:od of observation. Hence, the
other significant coefficients in these equations maybe understood as
contributing specifically to cognitive growth during first grade.
Another way of thinking About these results involves comparisons across
(rather than within) persons. The fall test controls adjust statistically
for individual differences in testing levels at the time of school entry.
The effects of other variables thus can be viewed alternatively as
contributinj to cognitive differences at year's end among youngsters who
began the year with equivalent scores. Whether it is the sources of
cognitive growth over the first grade or the sources of individual
differences in cognitive competencies that is of most interest, this sort of
design provides a powerful interpretive framework (Coleman, 1982).
The coefficients for personal maturity are especially large. In the
verbal area this effect almost equals that for entry-level test scores. The
large personal maturity effects indicate that individual differences of
disposition or of temperament play an important role in early adhievement.
Youngsters who do the sorts of things that are expected of them make
markedly greater progress than youngsters for wham the requirements of the
student role do not came quite so "naturally." Importantly, the superior
performance of these youngsters is not just in the eyes of the teacher, who
might be expected to evaluate more favorably pupils who cause the fewest
problems. Rather, the criterion here is performance on a standardized
achievement battery, which is a relatively impartial barometer of cognitive
19
23
level. Moreover, the intermulingvarAablez added in the second and third
steps of the analysis, which include both first and third quarter marks,
reduce these teuperament effects only by about a third. Yt thus appears
that youngsters of a certain disposition profit much more fran instruction
in first grade than do others. And since scnool achievement patterns tend
to be highly stable over time there is little Gloat that these early
cognitive advances will pay substantial ..acurns later on.
Other significant effects fran the first block of predictors are much
smaller, but interesting nonetheless. There are significant negative total
race effects in both domains, with that in the math domain remaining
significant throughout. This effect tends to diminish over the year for the
verbal CAT suggesting that school experience serves to reduce (or account
for) differences across racial groups.
Sex differences appear only in math. Among whites, bces! test scores
tend to improve more than girls' over first grade (girls are scored "1" and
boys "0" on this measure). Among blacks, though, girls outpace b%s, but
not significantly. (The significance of these race/sex interactions is
evaluated in the last columns of the pooled analyses in Table 2, which adds
a race/sex product term to the main effects analysis.) The math
interaction, but not the reading, is significant.
The gap in cognitive scores by minority/majority status widens a bit
over the course of first grade, due in part to race differences in patterns
of growth among boys and girls. The slower pace of growth among blacks is
small when compared against the overall upward trend -- being on the order
of 8 to 10 points, relative to aggregate increases of about 55 points in the
20
24
verbal ckLsin and 4' points in the quaititative -- but even this small
shortfall Li disturbing.
Parents are implicated in these early atlilevement processes mainly as
significant others. With fall test sa,ls controlled, parents' education
has a small negative effect on spring performance.9 Parents' ability
judgments have no significant effects. However, parents' expectations for
their children's performance in specific subject areas (e.g., reading and
math) are important sources of influence an year-end test scores in
reading. This eviderre of parental influence is impressive because these
effects are estimated net of differences in fall test scores and also with
personal raturity, race and the other controls in place.1° We should note
too that parent expectations were procured before the issuance of first
report cards in the fall, and in many instances even before school began in
September. Hence, parents' expectations were framed, in the main,
independent of information on their child's school performance or adjustment
difficulties. In contrast to this evidence of parent influence, the pupil's
own expectations in the fall have only a small negative bearing an verbal
achievement, and no significant effect on math.
The second and third blocks add small but significant increments in
explanatory power, and these are proportionately larger among blacks than
among whites (compare P.-Squared statistics in the bottom rows of Tables 3a
and 3b). There are rather large effects for first and fourth quarter marks.
Of course, marks and test performance are grounded in similar competencies,
but marks have the additional property of constituting feedback from
teachers to both students and their parents. The fact that mark effects
generally are larger among blacks than whites (see Tables 3a and 3b) may
21
reflect precisely their inportance as sources of reinforcement, as we have
no reaoon to expect that teacher's marks will be more Eensitive to
differences of ability and effort among blacks than whites. On the other
hand, there are slight (and nonsignificant) differences in parent
expectation effects in reading that favor whites. It is possible that
minority youngsters more so than whites look to their teachers for feedback
and encouragement, while whites rely more on their parents as agents of
academic socialization. In empirical terms, these differences appear to
account for the differences in explanatory power notzd above.
Also suggestive are the cfects observed for the youth's spring
expectations, apparent in the verbal area. This effect is not large, but
it hints at an increase in personal efficacy as these youngsters mature and
become more experienced in the ways of school.
DISCUSSION
Three general conclusions stand out. Fist, the transition into full-
time schooling differs in important ways for black and white children:
although they begin with substantially equivalent levels of competence, they
do not register the same amounts of growth over the year. Second, the
personal maturity variable, which is affective in nature, has large effects
on Children's growth in both domains. Third, parents stand cut as important
sources of interpersonal influence during this period when children begin
formal schooling. Parent expectations for performance are an important
for in early verbal achievement while peer popularity is not.
The ease with which children make the transition into first grade, here
indexed by growth in achievement scores, depends on their ascriptive
22
cO
characyteristics. Growth over first grade in math is greater for white
boys. Most discussions of differential math achievement by sex focus on the
period of adolescence (e.g., Parsons, et al., 1982) and there is a tendency
to assume that children of the two sexes perforr at the same level in math
over elementary school. The data here, thoumh, indicate a small
deoalopmantal advantage of boys over girls as early as the first grade.
"Transition shock" for blacks as a group occurs in both domains. And
despite the smaller amounts of growth registered by black children, school
factors appear to play a greater role in their cognitive gains. The
variables in the seLond and third blocks of the model add little explanatory
power for whites' math gains -- the expo aimed variance for them increases
only by 1.5% when these two blocks are added to the model. But adding these
two blocks to the model increases the explained variance for blacks over
twice as much (3.7%). For verbal gains the difference is even greater: for
whites it is 4.1%, and for blacks about 1.5 times that - 6.6%. Hence,
events in the first year of school are apparently more important for the
achievement gains of black children than they are for those of white
Ihildren. Or conversely, home and background factors are relatively more
important for the achievement gains of white children. This accords with
the conclusion from other studies that the role of schools in fostering
cognitive growth is more important for blacks than it is for whites
(Coleman, et al., 1966; Heyns, 1978).
Despite close equivalence in personal and familial resources at the
start, blacks did not gain as much as whites over the transition period.
One clear stumbling block is marks -- black children receive lower marks
than whites all along, starting with the first mark, even though their , st
23
scores, personal maturity and other characteristics would predict otherwise
(see Entwisle and Alexander, in press;. All the reasons for this are yet to
be discovered but one is that teachers from higher status backgrounds judge
low status or minority children to be less mature and hold lower
expectations for them than do teachers from lower status backgrounds
(Alexander, Entwisle, and Thomson, 1987). This puts an extra burden on
black Children. Parent variables and youth's curkpertormanoe expectations
appear not to play such of a role in producing this racial gap, althoulh
parent expectation effects are somewhat higher for whites. This pattern of
emergent racial disparities should encourage further consideration of how
clamor= organization (e.g., Leiter and Brown, 1985; Rowan and Miracle,
1983) and classroom process (e.g., Barr and Dreeben, 1983; ALmarmier,
Entwisle, and Thompson, 1987) might fit into the picture. It is likely thit
a satisfactory accounting of achievement processes in the primary grades
eventually will have to combine elements from both the "socialization" and
the "allocation" perspectives, much as studies at the secondary level have
begun to do (see Kerckhoff, 1976, concerning such an integrated approach).
Affective
lbe personal maturity variable, which proved to have large effects for
these children's attainment in both the verbal and math domains, strongly
affects the ease with which children make this transition. It is not easy
to conceptualize but it includes attributes like restlessness, timidity, and
being prone to fight, which measure affective development on dimensions
appropriate for children just starting school. Children who have the
ability to postpone gratification, to be socially responsive in appropriate
24
8
ways, to maintain control over their emotions, to be in a positive frame of
mind, apparently profit more from early schooling.
In fact, the linkage between socioemotional status and school
performance may be one route by which children most directly affect the
course of their own development. A life course approach emphasizes that
individuals in many ways prompt their own development. For example,
children who do their homework likely contribute to their own cognitive
growth. But at a deeper level, children's asariptive characteristics, such
as minority status as discussed above, and other personal characteristics
can be important. Dispositions and temperament probably affect teachers and
other students in subtle ways that also can speed or slow development (see
Thomas and Chess, 1981, pp. 247-252). A child who has attained a "suitable"
level of socioemotional maturity is positioned to benefit from the
opportunities for growth offered in first grade. The strong effects of
personality constructs observed for these first graders support Lerner's
(1985) ideas regarding the importance of temperament as an explanatory
variable in development, and especially the importance of what he terms
"goodness of fit" between aspects of temperament and demands or pies ls of
the social context.
Most discussions of how noncognitive traits of this sort fit into the
social organization of schooling are short-sighted from a developmental
perspective, no doubt because of researchers' inattention to the achievement
process in the early school years. Our results may offer an important
corrective to such thinking.
At higher grade levels, "temperament" does not stand out as prominently
as it does for first graders. We believe this is precisely because the
25
29
influence of affective development on cognitive development expresses itself
from the very beginning, and is absorbed early into youngsters' achievement
trajectories. Since aspects of temperament may be more stable than other
kinds of psydhosocial development (McCall, 1986; Thomas and Chess, 1986), as
time passes the direct influence of affective traits on cognitive outcomes
will cycle down. Quite simply, the strength of this effect in the early
years is translated into achievement levels that then persist. Thus, by
high school, affective or temperament factors will have smaller direct
effects than we observe at the elementary level, which is what secondary
sdhool research indicates. This does not mean, though, that temperament
variables are unimportant; rather their maximum influence occurs earlier
and is carried along via stability in children's achievement trajectories,
school records and learning styles.
In complementary fashion, we expect that other affective -type
variables -- plans, goals, aspirations and expectations -- will gain
salience with time as youngsters acquire a more definite sense of personal
efficacy (or inefficacy) and become more cognizant of long-term goals.
Here, we see that effects of first grade pupils' own performance
expectations, while significant in the verbal area in the combined sample
and for blacks in the separate analysis, are weak. Their expectations are
taking form but not very stable in first grade (Alexander & Entwisle, in
press). In prior research children's expectations did not affect first
grade marks but did affect marks by third grade (Entwisle and Hayduk, 1982,
p.101). Eventually, then, the academic self -image will likely displace
temperament as an immediate factor in school achievement processes. The
effects of the latter are carried along in the continuity of achievement
26
30
patterns, while the former won't exercise nu.ah influence until later, when
"expectations" become absorbed into the sense of self and begin to give
direction to energies. Precisely when this crossover occurs may, in fact,
be a pivotal developmental turning point. Some youngsters, for example, may
pass this developmental milestone before others, and so they may realize a
decided advantage in subsequent academic competitions -- for preferred track
placements, in extracurricular involvements, and so on.
Thus, the social psychological factors involved In achievement
processes appear to differ considerably depending on which particular stage
of schooling or which particular aspect of personal development is at issue.
This insight, in turn, underscores the importance of both a long time frame
gnd a conceptual apparatus that takes an explicit developmental perspective
for understanding the complex interplay between cognitive and affective
development.
Other implications
While hesitant to press conclusions based on any one study too far, we
believe the present effort has same distinct strengths. The potential of a
life course perspective, when joined with a research design that tracks a
birth cohort over the period of a critical transition, for informing
understanding of the early schooling process is impressive. Most
importantly it reveals that the two racial groups, which were equivalent in
many key respects (schools attended, parents' educational level, initial
achievement status) at the start of first grade, were not equivalent at the
end. Our panel design and beginning and end of year testing data thus
afford a rare opportunity to observe the emergence of ascriptively linked
cognitive differences in a group of young children. And the first grade may
27
31

be a particularly critical period in children's academic development, as
social role transitions can be especially stressful (HUltsch and Clemons,
1979; Rutter, 1983).
An important corsideration in interpreting our findings is the key
nature of the home-to-school transition. If one group of children makes
this transition differently from another, or more productively than another,
the long-term =sequences may be substantial even if the differences at the
end of one year are only a few CAT score points. The black children can be
seen as snaking the how-to-school transition somewhat differently than the
white children, because school influences affected the achievement levels of
blacks more than the same influences affected the achievement of whites.
The home and background influences of whites remained strong enough,
especially for males, to lead to a substantial advantage for than at the end
of the year in math. And what starts out here as small differences can
potentially be compounded many times aver, as this early disparity no doubt
is one contributor of the black-white gap in school achievement documented
in numerous studies at higher grade levels.
28
1. For studying transitions this is an important distinction. Most
studies a schooling focus an simples defined by grade level where students
include repeaters as well as those who are going through a grade for the
first time.
2. Although data or. the relation between personality factors and young
children's school performance are scarce, there is some indication that
performance responds to personality rather than the reverse. In a
longitudinal study that identified children with behavior problems at age 3,
reading retardation in problem children was observed at age 8. But children
without behavior problems at age 3 who developed reading retardation at age
8 did not then develop behavior problems (Richman, Stevenson and Graham., 1982).
3. In earlier exploratory research on another large sample of Baltimore
children, a long list of parent variables was winnowed down to the four
variables employed here. See Entwisle and Hayduk, 1982.
4. As noted, the problem referral indicator is placed in a separate block
here to indicate that it is not thought of as an exogenous variable in the
same sense as other variables in the first block.
5. The child's mark in conduct is incltied at this point as a predictor of
gains in verbal or math achievement because for young children deportment
can Le an important determinant of learning (Entwisle and Hayduk, 1982).
29
6. Values of variables are very close whether or not imputations are used.
For exempla, the mean for personal maturity with iacutaticre is 68.00 and
the mean without imputations is 67.99. Zero-order correlations were
calculated for all pairs of variables, and these differ only in tlie third
decimal place.
7. There is no information in the open literature on the psychometric
properties of this scale but it was given to teethe. . in Wave One (1976-77)
of the National Survey of Children sponsored by the Foundation for Child
Development. Information reported here was provided by Zill (Nicholas Zill,
personal communication, October 9, 1987).
The scale is based on the research of Kellam et al. (1975), of Rutter,
Tizard, and their colleagues (1970, 1973, 1976), and Cycle II of the
National Health EXamination Survey (NCHS, 1971). Items were chosen that
seemed, on the basis of prior research, to discriminate between children who
needed psychological help or special educational resources and those who did
not, and/or to represent some of the more common behavior problems that had
been described by Kellam, Rutter, and oth,is. These patterns included an
aggressive- deceitful syndrome, a distractible-overreactive syndrome, and a
withdrawn-timid syndrome. For balance, 4 items that tapped positive
adjustment were also included.
8. In the National Survey of Children all items loaded on a major first
factor and thus could be considered as tapping a common underlyiag
dimension. Zill reports internal consistency reliability of .90 for the
full scale. Our findings with the BSS concerning the psychometric
properties of the scale are very similar to Zill's. We use it here
30
34
primarily as an overall indicator of personal maturity that could affect the
first grads transition. We believe it characterizes reasonabli well
individual differences in behavioral or response tendencies *portant in
children of this age group, but we are agnostic as to whether these are
most properly construed as facets of personality or of temperament (see
McCall, 1986, on the blurring of the boundaries between these constructs).
9. Parents' education correlates .34 with the fall verbal subtext and .33
with the quantitative. Hence, the small negative direct effect on spring
performance should not be misconstrued as indicating a true negative
socioeconomic influence on early cognitive development.
10. The coefficient for the problem referral variable also is significant
in both instances, indicating that those youngsters with physical
inpairments or behavioral problems that complicate adjustment to the
schooling routine suffer cognitively as a result.
Alexander, K.L. and D. R. Entwisle"Achievement in the first two years of school: Patterns andrTocesses." Monographs of the Society for Research in Child
qulopment, in press.
Alexand , K. Lr , D.R. Entwisle, and M.S. Thnmpeon1987 "School performance, status relations and the structure of
sentiment: Bringing the teacher beds in." American SociologicalReview 52:665-682.
Barr, R. and R. Dreeben1983 How Sdhools Mork. Chicago: 'flu Uhimersity of Chicago Press.
Brookuver, WEL, E.L. Erickson and L.M. Joiner1967 "Ability and sdhool achievement, III." U.S. Office of Education
Cooperative Researdh Project No. 2831. East Lansing: Office ofResearch and Publications, Michigan State Uhimersity.
California AChisvment Tests1979 Technical Bulletin 1, Forms C and D. Mbnterey, Clifornia:
CTBVMtGraw.Hill.
Coleman, J.S.1982 "fl use of 'ability' measures as controls for concurrent or
subsequent achievement." American Sociological Review 47:819-821.
Coleman, J.S., E.G. Campbell, C.J. Hobson, J. Maertland, A. Mood, F.D.Weinfeld and R.L York
1966 "Equality of educational opportunity." Washington, D.C.:Government Printing Office.
Collins, W.A. (Ed.)1984 Development DuAng Middle Childhood: The Years from Six to
Twelve. Washirgton, D.C.: National Academy Press.
Coppersmith, S.1959 "A method for determining types of self-esteem." Journal of
Abnormal and Social Psychology 59:87-94.
Ec:helberger, E.1959 "Relaticnships between personality traits and peer status."
Ph.D. dissertation University of Michigan.
Elder, G.H.
1968 Adolescent Socialization and Personality Development. Chicago:Rand-McNally.
Entwisle, D.R. and K.L. Alexander
"Factors affecting achievement test scores and marks received by
32
3O
black and white first graders." Elementary School Journal, inpress.
Entwislo, Dal" LL. Alexander, A.M. Pallas, and D. CadigRn1987 "Tbs emergent academic self-image of first-graders: Its
response to social structure." Child Development58:1190-1206.
Entwisle,1983
Entwisle,
1978
D.R. and D.P. Baker"Gender and young children's expectations for performance inarithmetic." Developmental Psychology 19:200-209.
D.R. and L.A. HaydukToo Great Expectations: The Academic Outlook of Young Children.Baltimore: Johns Hopkins University Press.
&twin's, D.R. and L.A. Hayduk1981 "Academic expectations and the school attainment of youngchildren." Sociology of Education 54:34-50.
&twin's, D.R. and L.A. Hayduk1982 Early Schooling. Baltimore: johns Hopkins Press.
Gottfredson, D.C.1982 "Personality and persistence in education: A longitudinalstudb." journal of Personality and Social Poychology 43:532-545.
Haller, A. and J. Wbelfel1972 "Significant others and their expectations: Concepts and
instruments to measure interpersonal influence an statusaspirations." Rural Sociology 37:591-621.
Hess, V.C. Shipman, J. Brophy and R.M. Bear1968 The Cognitive Environments of Urban Preschool Children.Chicago: The Graduate School of Education, University of
Chicago.
Heyns, B.1978
Horowitz,
1962
Summer Learning. New York: Academic Press.
"The relationship of anxiety, self-concept, and sociametricstatus among fourth, fifth, and sixth grade children." Journalof Abnormal and Social Psychology 65:212-214.
HUltsch, D.F. and JUdy K. Plemons1979 "Life events and life-span development." Pp. 1-36 in P. Baltes
and 0. Purim (eds.) , Life Span Development and Behavior, V. 1.New York: Academic Press.
33
3l
yal1ae, S., J.D. Branch, K.C. Agrawal, and M.E. Enuminier1975 Mantel Health and Going to School. Chicago: University
of Chicago Press.
Kerckhoff,1976 "!fl status attainment process: Socialization or allocation?"
Social Farces 52:368-381.
Ladd, G.W.1987
an2J.M. Price"Predicting children's social and school adjustment followingthe tranmiticn tram preschool to kindergarten." ChildDevelopment 58:1168-1189.
Leiter, J. and J.S. Brown1985 "Determinants of elementary school
Education 58:166-180.grading." Sociology of
Lerner, R.M.1985 "Individual and context in develop:le/Ital. psychology: Conceptual
and theoretical issues." Pp. 155-187 in J.R. Nieselrois and A.Von Eye (eds.), Individual Development and Social Change. NewYork: Academic.
McCall, R.B.1986 "Issues of stability and continuity in temperament research."
Pp. 13-25 in R. Plamin and J. Dunn (eds.), The Study ofTemperament: Changes, Contiraities and Challenges. Hillsdale,N.J.: Erlbaum.
Musser, P.1979. "The effects of noncognitive traits." In C. Jencks, et al., Who
Gets Ahead? The Determinants of Economic Success in America ;pp.122-158). New York: Basic Books.
National Center for Health Statistics1974 "Plan and operation of a health examination survey of U.S.
youths 12-17 years of age." Vital and Health Statistics, U. S.Dept. of Health, Education and Welfare, Washington, D. C-: U. S.Govt. Printing Office.
Parsons, J.E., T.F. Adler and C.M. Kaczala1982 "Socialization of achievement attitudes and beliefs: Parental
influences." Child Development 53:310-321.
Richman, N., J. Stevenson and P.J. Graham1982 Pre-school to School: A Behavior Study. New York: Academic
Prem.
rosenberg, M. and R.G. Simmons1972 Black and White Self-Esteem: The Urban School Child. The
Arnold M. and Caroline Rose Monograph Series. Washington, D.C.:American Sociological Association.
34
S 8
Rowan, B. and A.W. Miracle1983 !Systems of ability grouping and the stratification of
achievement in elementary schools." Sociology of Education56 :133 -144.
Rutter, M.,1970
Futter, N.1973
Rutter, N.,1976
Rutter, N.1983
Sctenack, R.
1962
Schnuck, R.1963
Sewall W.H.1969
Sewe.U. , W. H.
1970
J. Tizard, and K. Whitmore (Eds.)Education, Health, and Behavior. London: Longmmn.
"Why are London children so disturbed?" Proomedings of RoyalSociety of Medicine 66:1221-1225.
J. Tizard, W. Yule, P. Graham, and K. Whitmore"Isle of Wight studies, 1964-1974." PsychologicalMedicine 6:313-332.
"Stress, coping and development: Some imams and questions."P. 1-41 in N. Garmezy and M. Rutter (eds.) , Stress, Coping andDevelopment in Children. McGraw-Hill.
"Sociametric status and utilization of academic abilities."Merrill-Palmer Quarterly 8:165-172.
"Some relationships of peer liking patterns in the classroom topupil attitudes and achievement." School Review 71:337-359.
p A. Haller, and A. Porte."The educational and occupational attainneitpmccess."American Sociological Review 34:89-91.
, A. Haller, and G. W. Chlendorf"The educational and early occupational attainment process:Replication and revision." American Sociological Review 35:1014-1027.
Simmons, R. and D. Blyth1987 Moving into Adolescence: The impact of Pubertal Change and
School Context. New York: Aldine DeGruyter.
Swafford,1975 The perception of occupations among elementary school children.
Ph.. D. dissertation, Jahns Hopkins University, Baltimore,Maryland.
35
99
Thome, A.1981
and S. Chess"The role of temperament in the contributions of individuals totheirammilopment." pp. 231-256 in R.K. Lerner and N.A. EusdhMONnegel (eds.) , individuals as Producers of Their Development:Aliferlpen Perspective. Ni a York: Academic.
Thomas, A. and S. Chews1986 "The New York longitudinal study: Pram infancy to adult life."
P. 39-52 in R. Plamin and J. Dunn (eds.), The Study ofleepsroment: Changes, Continuities and Challenges. Hillsdale,N.J.: Wham
Weikart, J.T. Bond and J.T. McNeil1978 "The Ypsilanti Perry preschool prodect:
"Preschool years and
longitudinal results through first grade. Ypsilanti, Michigan:HighiSoopeiWkmmiticral Researdh Ibundation.
Wiley, D. and Harnisdhfsger1974 mEXplosion of a myth: Quantity of schooling and exposure to
instruction: Major educational vehicles." EducationelResearcher 3:7-12.
7111, N.1987 Personal cateunication, October 9.
36
40
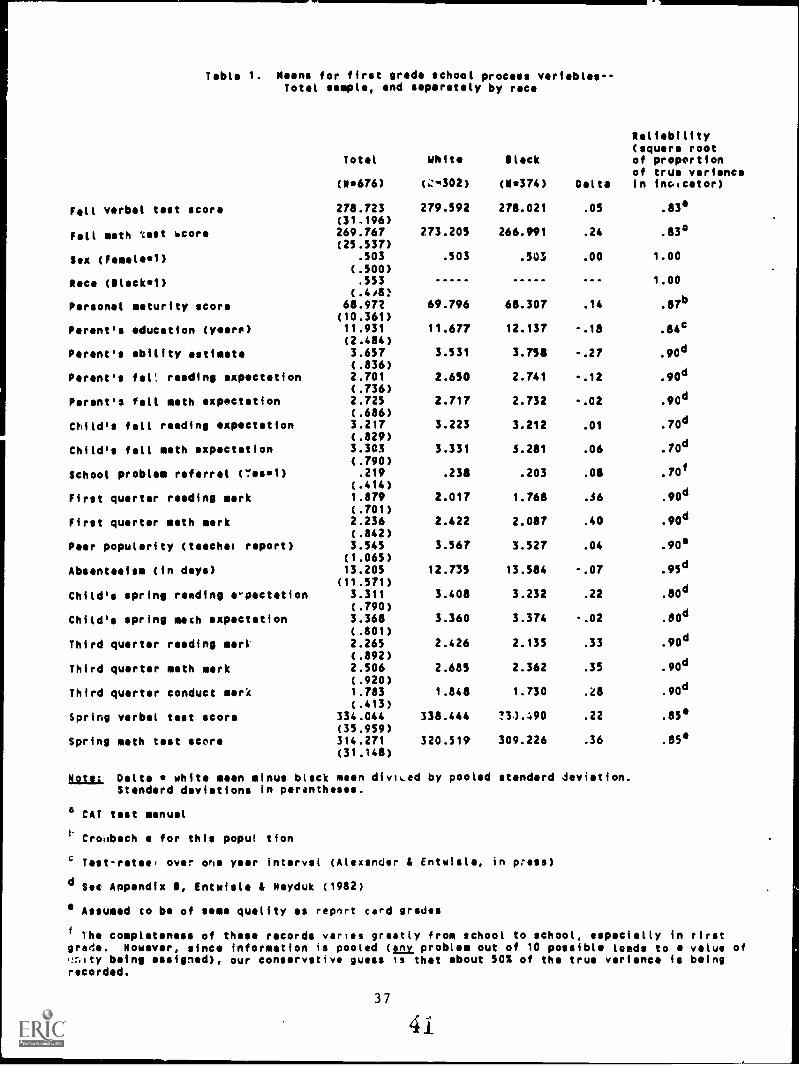
Table 1. Means for first grade school process variables- -Total sample, and separately by race
Total White Black
Reliability(square rootof proportionof true variance
(11676) (.:302) (1374) Delta in inuicator)
Fall verbal test score 278.723 279.592 278.021 .05 .834(31.196)
Fall math 'test score 269.767 273.205 266.991 .24 .83°(25.537)
Sex (Female') .503 .503 .503 .00 1.00(.500)
Race (Olack1) .553 ... 1.00
Personal maturity score 68.972 69.796 68.307 .14 .07b
(10.361)Parent's education (yearn) 11.931 11.677 12.137 -.18 .84c
(2.484)Parent's ability estimate 3.657 3.531 3.758 -.27 .90d
(.836)Parent's faV, reading expectation 2.701 2.650 2.741 -.12 .90d
(.736)Parent's fall math expectation 2.725 2.717 2.732 -.02 .90d
(.686)Child's fall reading expectation 3.217 3.223 3.212 .01
.70d
(.829)Child's fall math expectation 3.303 3.331 3.281 .06 .70d
(.790)School problem referral ( "es1) .219 .238 .203 .08 .70f
(.414)First quarter reading mark 1.879 2.017 1.768 .36 .90d
(.701)First quarter math mark 2.236 2.422 2.087 .40 .90d
(.842)Peer popularity (teaches report) 3.545 3.567 3.527 .04 .903a
(1.065)Absenteeism (in days) 13.205 12.735 13.584 -.07 .95d
(11.571)Child's spring reading e-pectation 3.311 3.408 3.232 .22 .80d
(.790)Child's spring mach expectation 3.368 3.360 3.374 -.02 .80d
(.801)Third quarter reading marl' 2.265 2.426 2.135 .33 .90d
(.892)Third quarter math mark 2.506 2.685 2.362 .35
.90d
(.920)Third quarter conduct mark 1.783 1.848 1.730 .28
.90d
(.413)Spring verbal test score 334.044 338.444 '3).490 .22 .854
(35.959)Spring math test score 314.271 320.519 309.226 .36 .85°
(31.148)
Note: Delta white mean minus black mean divined by pooled standard deviation.Standard deviations in parentheses.
a CAT test manual
Cronbach a for this poput tion
Test-retesf over one year interval (Alexander Si Entwisle, in p:ess)
d Sec Appendix 5, Entwisle i Nsyduk (1982)
Assumed to be of same quality as report card grades
f The completeness of these records varies greatly from school to school, especially in firstgrade. However, since information is pooled (Lit problem out of 10 possible leads to a value of.27.ity being assigned), our conservative guess is that about 50% of the true variance is beingrecorded.
37
41
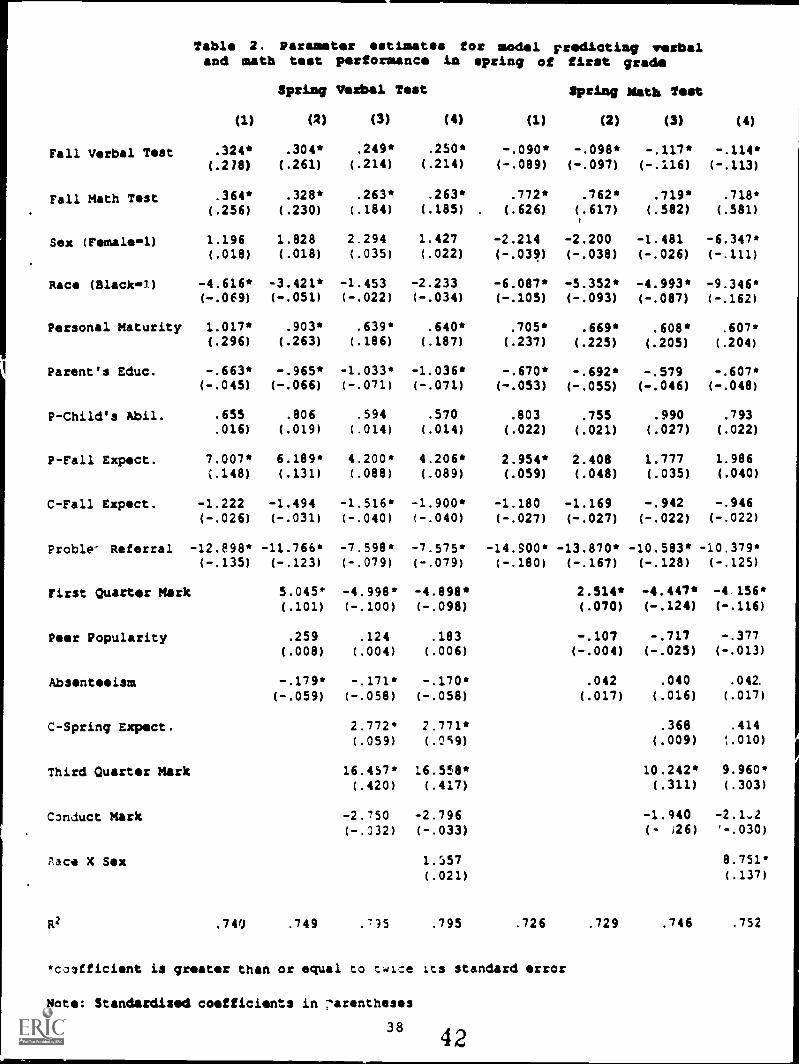
Table 2. Parameter estimates for model predloting verbaland math test performance in spring of first grade
Spring Verbal Test Spring Math Teat
(1) (2) (3) (4) (1) (2) (3) (4)
Fall Verbal Test .324* .304* .249* .250* -.090* -.098* -.117*(.278) (.261) (.214) (.214) (-.089) (-.097) (-.116) (-.113)
Fall Math Test .364* .328* .263* .263* .772* .762* .719* .718*
(.256) (.230) (.184) (.185) . (.626) (.617) (.582) (.581)
Sex (Femalel) 1.196 1.828 2.294 1.427 -2.214 -2.200 -1.481 -6.347*(.018) (.018) (.035) (.022) (-.039) (-.038) (-.026) (-.111)
Race (Black-1) -4.616* -3.421* -1.453 -2.233 -6.087* -5.352* -4.993* -9.346*(-.069) (-.051) (-.022) (-.034) (-.105) (-.093) (-.087) (-.162)
Personal Maturity 1.017* .903* .639* .640* .705* .669* .608* .607*(.296) (.263) (.186) (.187) (.237) (.225) (.205) (.204)
Parent's Educ. -.663* -.965* -1.033* -1.036* -.670* -.692* -.579 -.607'(-.045) (-.066) (-.071) (-.071) (-.053) (-.055) (-.046) (-.048)
P-Child's hbil. .655 .806 .594 .570 .803 .755 .990 .793.016) (.019) (.014) (.014) (.022) (.021) (.027) (.022)
P-Fall Expect. 7.007* 6.189* 4.200* 4.206* 2.954* 2.408 1.777 1.986(.148) (.131) (.088) (.089) (.059) (.048) (.035) (.040)
C-Fall Expect. -1.222 -1.494 -1.516* -1.900* -1.180 -1.169 -.942 -.946(-.026) (-.031) (-.040) (-.040) (-.027) (-.027) (-.022) (-.022)
Proble- Referral -12.898* -11.766* -7.598* -7.575* -14.S00* -13.870* -10.583* -10.379*(-.135) (-.123) (-.079) (-.079) (-.180) (-.167) (-.128) (-.125)
First Quarter Mark 5.045* -4.998* -4.898' 2.514* -4.447* -4156'(.101) (-.100) (-.098) (.070) (-.124) (-.116)
Peer Popularity .259 .124 .183 -.107 -.717 -.377(.008) (.004) (.006) (-.004) (-.025) (-.013)
Absenteeism -.179* -.171* -.170* .042 .040 .042.
(-.059) (-.058) (-.058) (.017) (.016) (.017)
C-Spring Expect. 2.772* 2.771* .368 .414
(.059) (.059) (.009) t.010)
Third Quarter Mark 16.457* 16.5.58* 10.242* 9.960*
(.420) (.417) (.311) (.303)
Conduct Mark -2.750 -2.796 -1.940 -2.1.2(-.032) (-.033) (- 26) '-.030)
R3C4 X Sex 1.557 8.751*
(.021) (.137)
R2 .740 .749 .7)5 .795 .726 .729 .746 .752
*coofficient is greater than or equal to twICe ICS standard error
Note: Standardised coefficients in 7arentheses
38 42
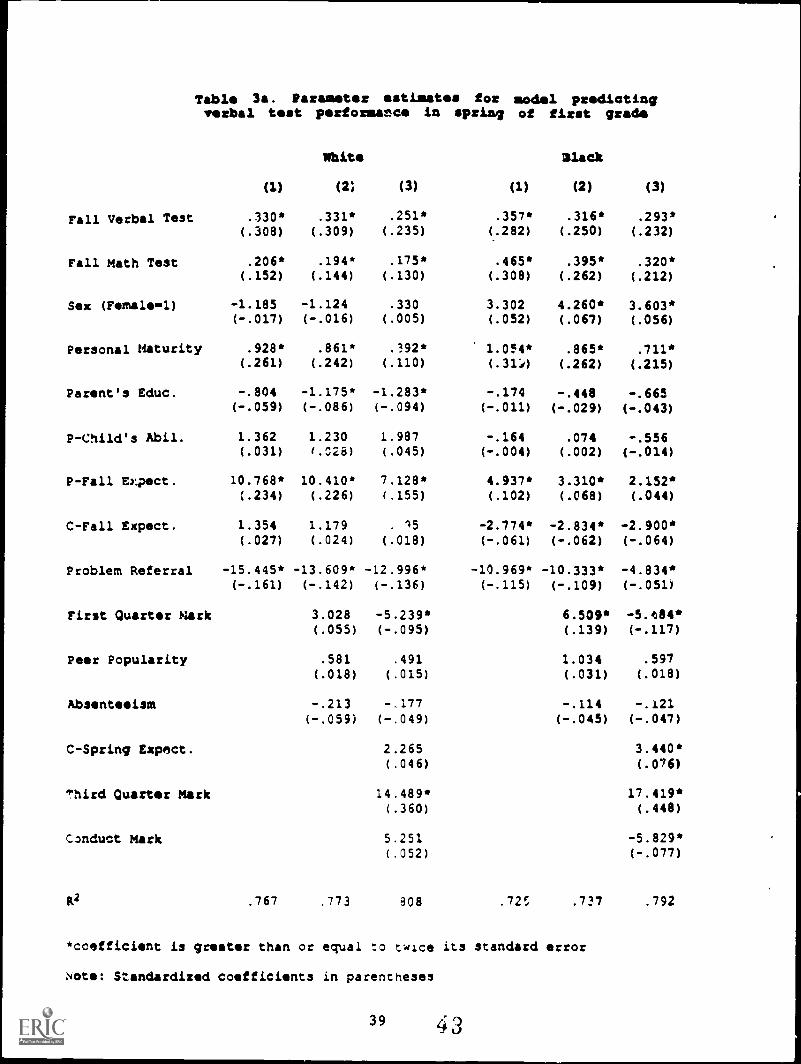
Table 3a. Parameter estimates for model predictingverbal test performance in spring of first grads
(1)
White
(2, (3) (1)
Plank
(2) (3)
Fall Verbal Test .330* .331* .251* .357* .316* .293*
(.308) (.309) (.235) (.282) (.250) (.232)
Fall Math Test .206* .194* .175* .465* .395* .320*(.152) (.144) (.130) (.308) (.262) (.212)
Sex (Female -i) -1.185 -1.124 .330 3.302 4.260* 3.603*(-.017) (-.016) (.005) (.052) (.067) (.056)
Personal Maturity .928* .861* .392* 1.054* .865* .711*(.261) (.242) (.110) (.314) (.262) (.215)
Parent's Educ. -.804 -1.175* -1.283* -.174 -.448 -.665(-.059) (-.086) (-.094) (-.011) (-.029) (-.043)
P-Child's Abil. 1.362 1.230 1.987 -.164 .074 -.556(.031) 1.028) (.045) (-.004) (.002) (-.014)
P-Fall Expect. 10.768* 10.410* 7.128* 4.937* 3.310* 2.152*(.234) (.226) (.155) (.102) (.068) (.044)
C-Fall Expect. 1.354 1.179 . 15 -2.774* -2.834* -2.900*(.027) (.024) (.018) (-.061) (-.062) (-.064)
Problem Referral -15.445* -13.609* -12.996* -10.969* -10.333* -4.834*(-.161) (-.142) (-.136) (-.115) (-.109) (-.051)
First Quarter Nark 3.028 -5.239* 6.509* -5.4584*
(.055) (-.095) (.139) (-.117)
Peer Popularity .581 .491 1.034 .597(.018) (.015) (.031) (.018)
Absenteeism -.213 -.177 -.114 -.121(-.059) (-.049) (-.045) (-.047)
C-Spring Expect. 2.265 3.440*(.046) (.076)
Third Quarter Mark 14.489* 17.419*(.360) (.448)
Conduct Mark 5.251 -5.829*(.052) (-.077)
R2 .767 .773 908 .72: .737 .792
*coefficient is greater than or equal to twice its standard error
Note: Standardized coefficients in parentheses
39
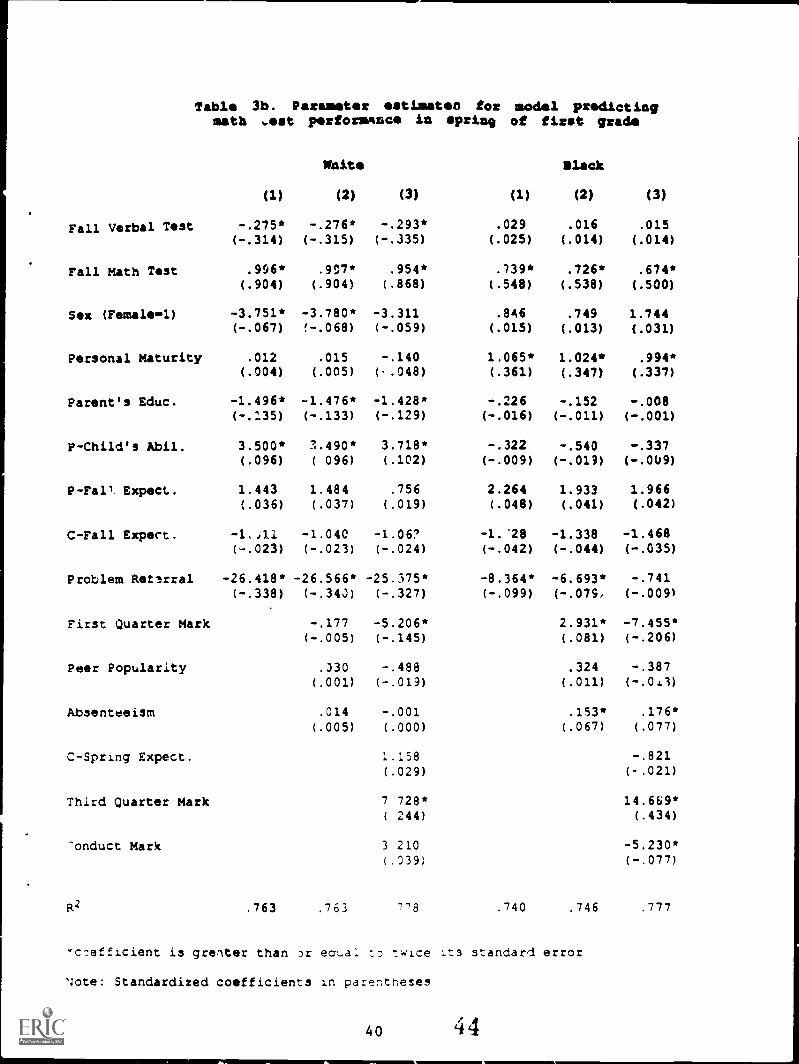
Table 3b. Parameter stiestec for model predictingmath .est performance in spring of first grade
(1)
White
(2) (3) (1)
Black
(2) (3)
Fall Verbal Test -.275* -.276* -.293* .029 .016 .015(-.314) (-.315) (-.335) (.025) (.014) (.014)
Fall Math Test .996* .9:7* .954* .139* .726* .674*(.904) (.904) (.868) (.548) (.538) (.500)
Sex (Femalm1) -3.751* -3.780* -3.311 .846 .749 1.744(-.067) ' -.068) (-.059) (.015) (.013) (.031)
Personal Maturity .012 .015 -.140 1.065* 1.024* .994*(.004) (.005) (-.048) (.361) (.347) (.337)
Parent's Educ. -1.496* -1.476* -1.428* -.226 -.152 -.008(-.:35) (-.133) (-.129) (-.016) (-.011) (-.001)
P-Child's Abil. 3.500* 1.490* 3.718* -.322 -.540 -.337(.096) ( 096) (.102) (-.009) (-.019) ( -.0U9)
P-Fall. Expect. 1.443 1.484 .756 2.264 1.933 1.966(.036) (.037) (.019) (.048) (.041) (.042)
C-Fall Expect. -1.411 -1.040 -1.06? -1.'28 -1.338 -1.468(-.023) (-.023) (-.024) (-.042) (-.044) ( -.035)
Problem Reilrral -26.418* -26.566* -25.575* -8.364* -6.693* -.741(-.338) (-.340) (-.327) (-.099) (-.079, (-.009)
First Quarter Mark -.177 -5.206* 2.931* -7.455*(-.005) (-.145) (.081) (-.206)
Peer Popularity .030 -.488 .324 -.387(.001) (-.019) (.011) ( -.043)
Absenteeism .014 -.001 .153* .176*
(.005) (.000) (.067) (.077)
C-Spring Expect. 1.158 -.821(.029) (-.021)
Third Quarter mark 7 728* 14.669*( 244) (.434)
-onduct Mark 3 210 -5.230*(.039) (-.077)
R2 .763 .763 778 .740 .746 .777
*c-:efficient is grelter than Dr ecua1 :D twice Its standard error
Note: Standardized coefficients in parentheses
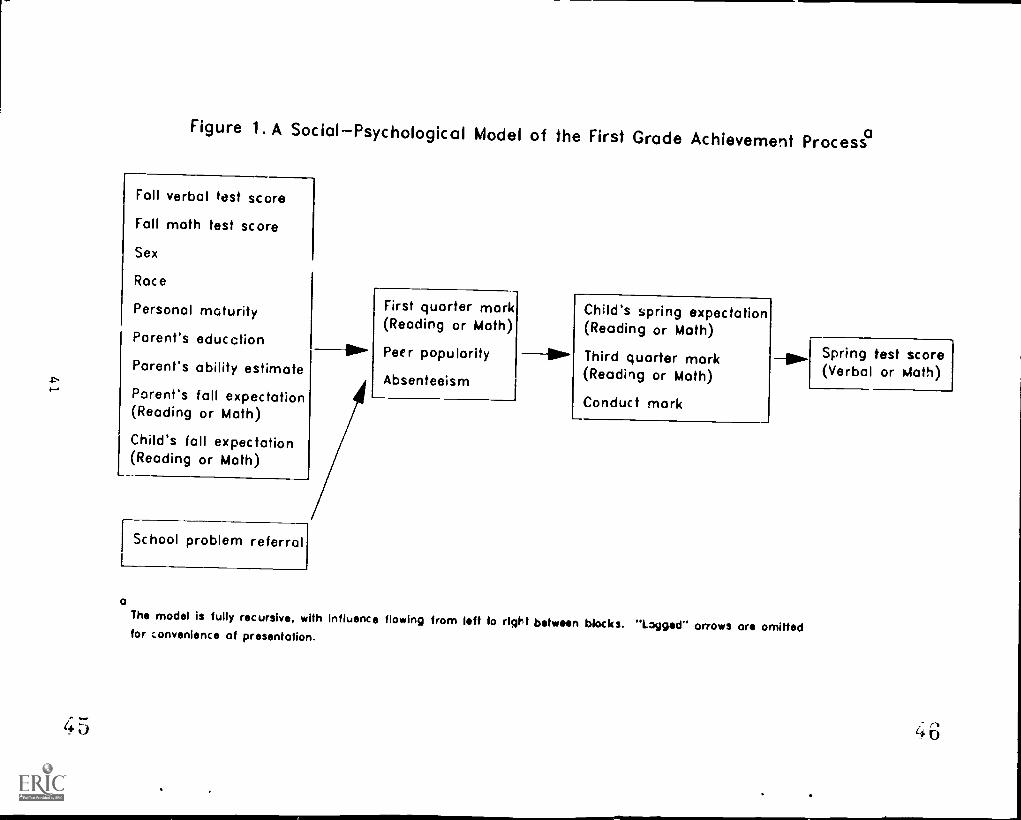
Figure 1. A SocialPsychological Model of the First Grade Achievement Process°
Fall verbal test score
Fall math test score
Sex
Race
Personal maturity
Parent's educction
Parent's ability estimate
Parent's fall expectation(Reading or Moth)
Child's fall expectation(Reading or Math)
1School problem referral
11111
First quarter mark(Reading or Math)
Peer popularity
Absenteeism
--OP'
Child's spring expectation(Reading or Math)
Third quarter mark(Reading or Moth)
Conduct mark
Hmo.[Spring test score(Verbal or Moth)
aThe model is fully recursive, with influence flowing from left to right between blocks. "Logged" arrows are omittedfor convenience of presentation.
45 46


![623 Ιατρικών Εργαστηρίων Θεσσαλονίκηςsep4u.gr/osp/623.pdf Ιατρικών Εργαστηρίων Θεσσαλονίκης [623] ΠΡΟΓΡΑΜΜΑ ΣΠΟΥΔΩΝ](https://img.pdfslide.net/doc/110x75/5e19aedabb69e26dd03fa5e6/623-f-ffsep4ugrosp623pdf.jpg)