Embed Size (px)
Citation preview
Does Diagnostic Math Testing Improve Student Learning?
October 2011
Julian R. Betts, Youjin Hahn, Andrew C. Zau
Supported with funding from the Donald Bren Foundation
http://www.ppic.org/main/home.asp Does Diagnostic Math Testing Improve Student Learning? 2
Summary
California, like all other states, has adopted a sweeping school accountability system that features annual testing of students. The main state test, the California Standards Test (CST), serves multiple goals, the foremost of which is to measure student proficiency and to determine whether schools receive interventions and sanctions set out in the federal No Child Left Behind law.
There is another type of test, freely available to middle and high school math teachers throughout California, which holds two key advantages over the CST math tests. The Mathematics Diagnostic Testing Project (MDTP) offers course-specific assessments that provide teachers with timely feedback on their students’ strengths and weaknesses in mathematics, often returning feedback to teachers on individual students and the entire class within a week of testing. In this way, teachers can quickly act on what they learn about their students’ mathematics skills. A second advantage of the MDTP tests is that they provide more detailed feedback about each student’s areas of strength and weakness than do the CST mathematics tests. The MDTP attempts to “diagnose”, not just “report.”
This study examines the effect of MDTP testing on students’ mathematics achievement, using detailed student-level data from the San Diego Unified School District (SDUSD), the second largest district in California. The MDTP has in fact been used in two ways in the district. First, many math teachers have voluntarily used the tests for their classes. Second, beginning in 1999–2000, the district began mandating end-of-year testing of all students in certain grades. The goal of this mandatory testing was to help teachers place students in mathematics classes of appropriate difficulty in the following academic year. Schools also used MDTP test results to help identify students who should attend summer school.
We examine how both the voluntary use of MDTP tests by individual teachers and mandatory testing by the district affect the math achievement of students. Due to an administrative policy to phase in mandatory MDTP testing over years and grades, we are able to take advantage of a “natural experiment.”
We find that mandatory MDTP testing boosts scores on the CST math test enough to move students up several percentile points. For instance, the median student (who ranked at the 50th percentile) in one year rises to somewhere between the 54.6th and the 57th percentile, on average, a year after the district-mandated testing. Compared to other types of interventions, these are strong and noteworthy gains.
The gains arise in part from students being more accurately tracked into appropriate math classes. About 5 to 11 percent of the MDTP effect on achievement derives from this source. The mandated use of the MDTP also increased the probability that low-achieving students attended summer school. However, only about 1 percent of the overall benefits of the MDTP come from this source. We can only speculate as to the other reasons why mandated use of the tests in certain grades boosted learning. One possibility is that when entire grades are tested, it encourages the entire math department at each school to work on diagnosing and overcoming students’ learning difficulties.
We also found that if a student is given an MDTP test two years in a row, the benefits that accrue the year following the first test strengthen in the second year. For instance, in our lead model, a student originally at the 50th percentile rises to the 57th percentile a year after the first test and reaches the 58th percentile after having been diagnostically tested in each of the two prior years. Importantly, if a student is given an MDTP test in one year but not the next, the benefits of MDTP testing decay over time. Two years after having been
http://www.ppic.org/main/home.asp Does Diagnostic Math Testing Improve Student Learning? 3
tested, if the student was not tested a second time, a positive effect remains, but the size of the effect has fallen by about 40 to 60 percent.
How does mandatory MDTP testing affect gains at various achievement levels? We grouped students based on low, medium, and high math CST scores from previous years. We found some evidence that students in the middle and top end benefitted more from mandated MDTP testing than those in the lower end, though all groups were found to show gains in math achievement in the subsequent year.
In contrast to district-mandated testing, the voluntary use of MDTP tests by teachers had no detectable relation with students’ gains in math achievement during the year. This contrary finding suggests that having a school systematically use the MDTP test rather than having individual teachers use the test piecemeal could be critical. Further, voluntary testing by individual teachers was not used to recommend summer school placements or to channel students into appropriate classes for the following year, both of which account for some of the gains from mandated testing. However, we note that we did not have a natural experiment in which voluntary testing was phased in over time, it is possible that the apparent lack of effectiveness of voluntary MDTP testing simply reflects teachers deciding to test only those classes that they perceive to be less well prepared. This would tend to yield the result that voluntary MDTP tests had no or even negative association with students’ subsequent progress.
Several policy implications emanate from these findings. More districts could use the MDTP or a similar test not only to help diagnose an individual student’s weaknesses in math, but also to direct assistance to all students lagging behind. San Diego’s policy of steering struggling students to summer school is only one of many possible such interventions. Second, the idea of using diagnostic tests to steer students toward an appropriate math class for the following year appears to have produced tangible benefits. Districts might want to consider using the MDTP for this purpose. Third, at least in San Diego, the effects of diagnostic testing wear off if the testing is administered in only one year. Repeated diagnostic monitoring across grades could reap tangible benefits over the course of a students’ career.
In addition to improving policy at the district level, there are also implications for the state CST test. While the CST already provides some information on students’ strengths and weakness within a subject, it could do more to inform teachers where students need further assistance. The CST test results arrive late in the summer, too late to help students during the year they took the test. In many cases, they also arrive too late to play an important role in either summer remediation or in finding appropriate classes and supports for students in the following school year.
Computerizing the CST might provide quicker turnaround that would boost teachers’ ability to rectify students’ specific weaknesses in a given field before the students have moved well into their next school year. At present, with California’s budget challenges, computerizing the state test may seem like a distant possibility. But in June 2011, California joined the SMARTER Balanced Assessment Consortium, which is developing national tests for the Common Core standards in math and English. This consortium is planning computerized testing and is also interested in providing teachers with formative testing during the school year (i.e., testing designed to diagnose how well students have mastered the material just taught). Thus the insights we gained in our study of the MDTP may have broad significance.
It remains to be seen if a new statewide testing system can serve both the goals of accountability and diagnostic feedback. These two goals are inherently different, but clearly there is an important place for both types of tests in the current education landscape.
Contents
Summary 2
Figures 5
Tables 5
Introduction 6
Background 8 Four Key Distinctions between the MDTP Tests and the State Test 10 Study Questions and Research Design 11
Data 12 Student Longitudinal Database 12 Further Information on Math Diagnostic Testing in San Diego 12
Results 15 Principal Findings 15 Potential Explanations for Positive Effect of Mandated MDTP Testing 17 Voluntary Versus Mandated MDTP Testing 19
Conclusion 21
References 23
About the Authors 24
Acknowledgments 24
A technical appendix to this paper is available on the PPIC website: http://www.ppic.org/content/pubs/other/1011JBR_appendix.pdf
http://www.ppic.org/main/home.asp Does Diagnostic Math Testing Improve Student Learning? 5
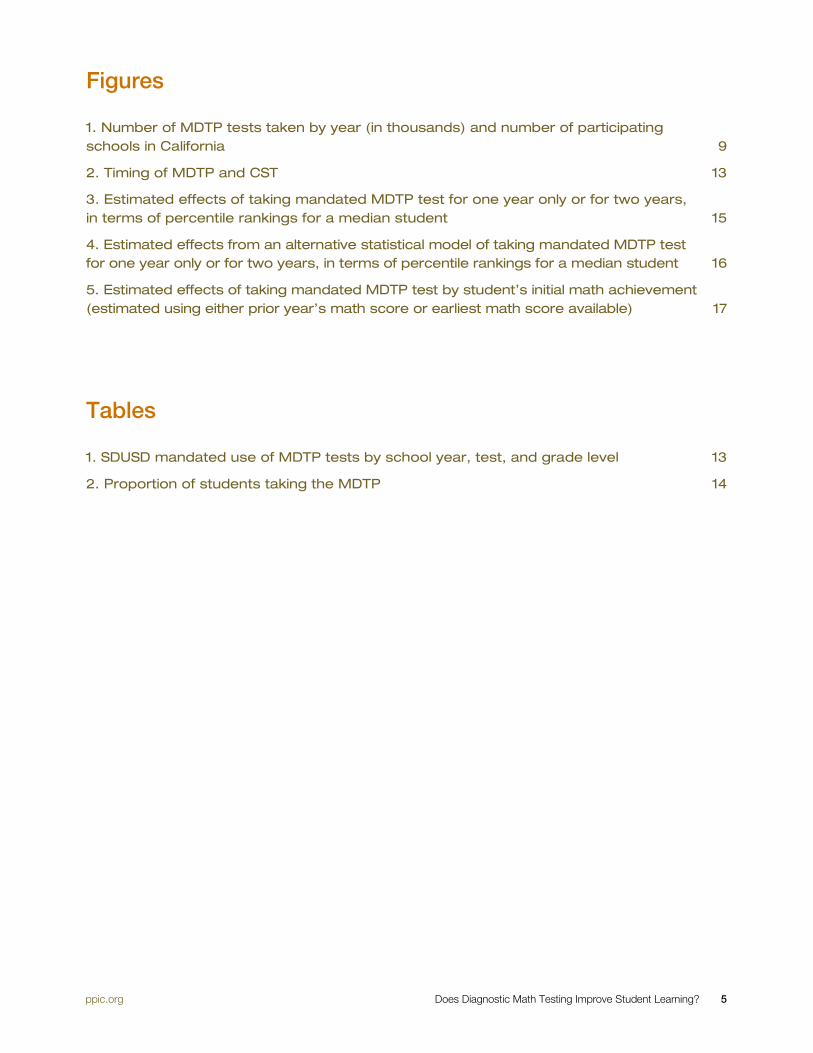
Figures
1. Number of MDTP tests taken by year (in thousands) and number of participating schools in California 9
2. Timing of MDTP and CST 13
3. Estimated effects of taking mandated MDTP test for one year only or for two years, in terms of percentile rankings for a median student 15
4. Estimated effects from an alternative statistical model of taking mandated MDTP test for one year only or for two years, in terms of percentile rankings for a median student 16
5. Estimated effects of taking mandated MDTP test by student’s initial math achievement (estimated using either prior year’s math score or earliest math score available) 17
Tables
1. SDUSD mandated use of MDTP tests by school year, test, and grade level 13
2. Proportion of students taking the MDTP 14
http://www.ppic.org/main/home.asp Does Diagnostic Math Testing Improve Student Learning? 6
Introduction
California, like other states, has implemented an educational accountability system designed to measure the performance of students in public schools and to provide a series of interventions for schools that fail to improve sufficiently. At present, several mandated tests feed into the calculation of the summary Academic Performance Index (API), the single number the state publishes annually as a rough proxy of each school’s academic performance. These tests include the California Standards Test (CST), offered in a variety of subjects between grades 2 and 11, and the California High School Exit Exam, which high school students must pass in order to receive a diploma.
This accountability program has done much to inform the public about average achievement levels in California and the large variations in achievement across schools and demographic groups. However, anecdotal information suggests that teachers in California find that the testing system does not provide timely feedback to teachers about their students’ performance, or about the specific subareas of knowledge within a subject in which individual students need to improve. Indeed, the CST is not intended to diagnose student weaknesses and strengths so much as to provide an overall measure of student proficiency. Notably, results from CST tests given in March or April do not become available until late summer.1
Although the public is now widely aware of API scores and the principal state tests, there is another testing program, with a quite different purpose, that has been offered to math teachers and their students since 1982. The Mathematics Diagnostic Testing Project (MDTP), a joint program of the California State University and the University of California, offers math teachers throughout California free diagnostic math testing, with efficient and detailed feedback. Teachers typically receive printed results within a week of test administration, along with overall and student-by-student information on student performance on individual topics within the subject of the test. For example, the MDTP’s Algebra Readiness test, designed to be given to students before their first algebra course, provides information to teachers and their students on students’ understanding of integers, fractions, decimals, percentages, and other clearly defined topics.
One key distinguishing feature of the MDTP is that, unlike the state tests that represent California’s official accountability system, the MDTP tests are graded locally in one of ten regional site offices. The proximity of the grading centers speeds up turnaround time dramatically, and it also allows regional coordinators to work with local schools to interpret and use test results. The accessibility of the local MDTP offices is largely responsible for the ability of the MDTP to provide timely and detailed feedback to teachers, which they can immediately put into use by tailoring their instruction to the specific needs of individual students. In addition (since the time period analyzed in this report), MDTP now provides an online version of the tests that makes feedback to teachers about the performance of their students virtually instantaneous.2
Obviously, tests designed for accountability (such as the CST) and tests designed to diagnose student weaknesses (such as the MDTP) serve inherently different purposes. As one sign of that, we note that the MDTP pre-dates the state accountability system and the CST and, in addition, typically tests understanding of topics that should have been taught in the preceding two or three grades. Thus it is correlated with, but does not attempt to match, state content standards or tests in any particular grade.
1 Linn (2000, p. 9) points out that examining subscores in different strands of a test can be much more informative than looking at overall scores on a state test and that to understand student progress, “multiple measures”should be used to measure student achievement. 2 More details on the MDTP tests and the history of the program are available at http://mdtp.ucsd.edu.

http://www.ppic.org/main/home.asp Does Diagnostic Math Testing Improve Student Learning? 7
This study examines the effect of MDTP testing on students’ mathematics achievement, using detailed student-level data from the San Diego Unified School District (SDUSD). The MDTP has been used in two ways in the district. First, many math teachers have voluntarily used the tests to assess individual student achivement in their classes. Second, beginning in 1999–2000, the district began mandating end-of-year testing of all students in certain grades. This mandate may have been precipitated in part by a decision the district made at about the same time to begin diagnostic testing in reading, combined with reading interventions.
We study the relation between mandated MDTP testing as well as voluntary MDTP testing and subsequent student gains in the statewide math test.
http://www.ppic.org/main/home.asp Does Diagnostic Math Testing Improve Student Learning? 8
Background
The MDTP consists of a set of “readiness” tests designed to give students and teachers detailed feedback on the student’s readiness to move on to a given course in the next academic year. Any middle or high school math teacher in California can order the tests for free and will receive detailed feedback for the class and each student within a week or two of test administration. The MDTP tests are widely but not universally used in California.
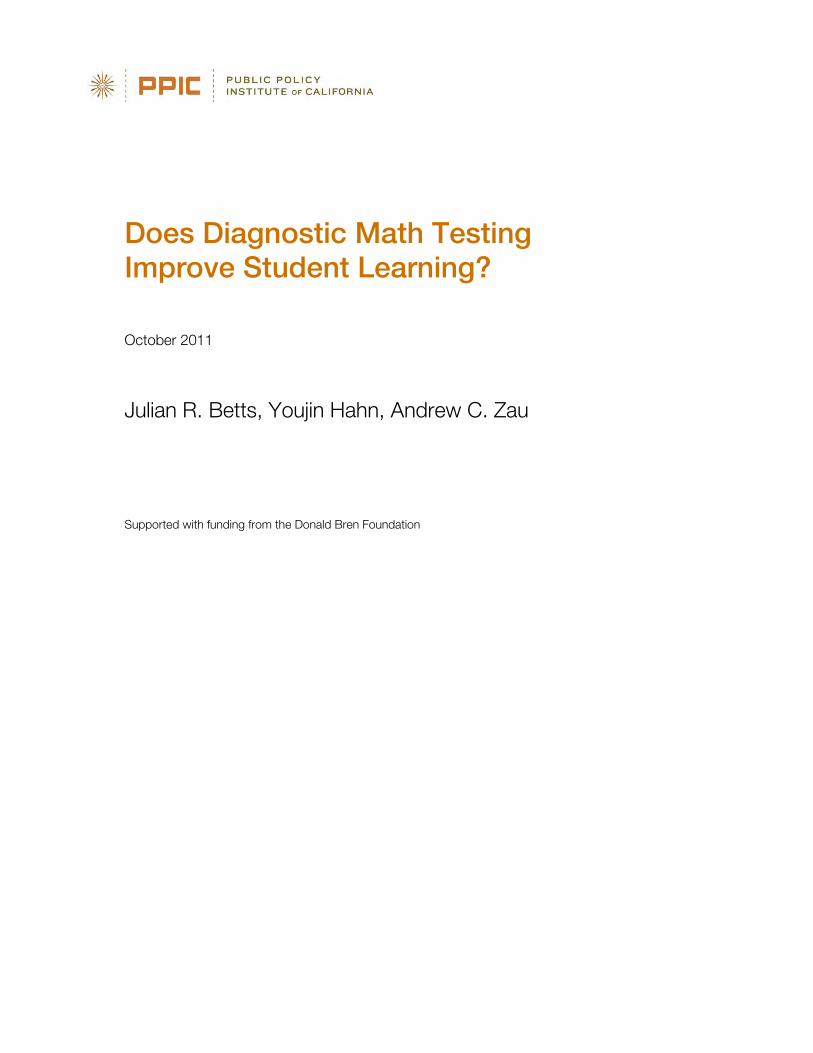
Figure 1 shows that during the time period we study, statewide in California the number of schools using the MDTP and the total number of tests graded rose steadily. By 2006–2007, the MDTP processed about 689,000 tests for just over 1700 schools. We cannot be sure how many students were tested more than once, but to give a rough feel for the extent of adoption of the MDTP, we can compare the number of tests to total California public school enrollment in grades 6 through 12, the principal grades in which the tests are administered. In 2006–2007, this ratio was 0.2 implying that up to 20 percent of middle and high school students in the state had taken an MDTP test that year. Similarly, the ratio of the number of schools participating in MDTP to the number of non-elementary public schools in California in 2006–2007 is 0.44, implying that 44 percent of public schools in the relevant grade spans participate. Both of these numbers are probably slight overestimates because some private schools in California also administer MDTP.3 MDTP tests are also used as placement tests by California community colleges, the California State University, and the University of California.
During the time period we study, the most commonly used MDTP tests in San Diego were the Prealgebra Readiness Test, the Algebra Readiness Test, and the Geometry Readiness Test. These same tests are also the most commonly used MDTP tests statewide. For instance, in 2006–2007, they constituted about 21 percent, 46 percent, and 16 percent of MDTP tests given in California, respectively.
The MDTP does more than provide free diagnostic testing. Representatives from the ten regional offices that score tests are available to visit schools and provide training to math teachers on how to use the tests and interpret results. Staff from regional offices visit the schools they serve from once to several times per semester. In addition, the MDTP sites hold regional conferences, teacher leadership institutes, and smaller focus group meetings to help teachers make the best use of MDTP tests and other materials. MDTP administrators do not view this assistance as formal professional development so much as helping teachers understand their students’ strengths and weaknesses and steps they can take to address the problems.4
3 Data on California public school enrollment in grades 6 through 12 were downloaded from http://dq.cde.ca.gov/dataquest/, and data on the number of public schools in California not identified as elementary schools were downloaded from http://www.ed-dataon .k12.ca.us/welcome.asp, both in November 2010. 4 We thank state MDTP director Bruce Arnold for providing much of the descriptive material in this and the following paragraph.

http://www.ppic.org/main/home.asp Does Diagnostic Math Testing Improve Student Learning? 9
FIGURE 1 Number of MDTP tests taken by year and number of participating schools in California
SOURCE: Bruce Arnold, State Director, Mathematics Diagnostic Testing Project.
A second supplementary aspect of the MDTP is a set of “written response materials” consisting of sample math problems, commentary, solutions, and a scoring rubric that is available to math teachers. MDTP State Director Bruce Arnold described these materials to us as follows: “They are examples of ways for teachers to use students' written work to further develop formative assessments of their students and to enrich their curricula by providing additional instructional opportunities that encourage effective communications among students and their teacher.” That said, the MDTP tests themselves are not formative assessments—i.e., they are not a series of tests that teachers can use to gauge how much students have mastered materials just taught during a course.
Although it is intended primarily as a diagnostic tool, the MDTP test, as mandated by SDUSD, is not entirely a low-stakes diagnostic test. The test was given in May and June and was one of many factors that teachers took into account when placing students into math classes for the subsequent year. It was also used by teachers, along with grades, in deciding which students should be encouraged to attend summer school.
Each readiness test probes students’ understanding of the specific math skills they will need to proceed successfully to the next course. For example, the Algebra Readiness test assesses a student’s preparation in topics that are required knowledge for a student to fare well in a subsequent algebra course, while the Geometry Readiness Test evaluates a student’s understanding of first-year algebra topics that students will need to have mastered in order to do well in a subsequent geometry course. Each test lasts 45 minutes and contains, depending on the subject matter, 40 to 50 multiple choice questions.
The teacher receives for each student, as well as for her class, indicators of the percentage of questions answered correctly in specific areas. For example, in the Algebra Readiness test, the areas include:
Data Analysis, Probability, and Statistics
Decimals, Their Operations and Applications; Percent
Simple Equations and Operations with Literal Symbols
Exponents and Square Roots; Scientific Notation
Fractions and Their Applications
Measurement of Geometric Objects
0
500
1,000
1,500
2,000
2001–02 2002–03 2003–04 2004–05 2005–06 2006–07
Number of participating schools
0
100,000
200,000
300,000
400,000
500,000
600,000
700,000
800,000
2001–02 2002–03 2003–04 2004–05 2005–06 2006–07
Number of tests
http://www.ppic.org/main/home.asp Does Diagnostic Math Testing Improve Student Learning? 10
Graphical Representation
Integers, Their Operations and Applications
Areas in which students answer fewer than 70 percent of questions correctly will be flagged for teacher follow-up. The teacher receives this information individually for each student and also receives statistics on the percentage of students scoring 70 percent or higher in each topic area, thus providing guidance on areas that might require greater emphasis or clarity in the classroom in general.
Four Key Distinctions between the MDTP Tests and the State Test
As discussed above, the intent of the MDTP tests is quite different from statewide testing systems mandated under the federal No Child Left Behind law. The latter are designed to measure overall school progress, and results can trigger various interventions at the school, district, and state levels. The MDTP tests are designed to help students and teachers work together in specific math areas that the student has yet to master.
The MDTP varies from the state CST in four fundamental ways related to the nature and timing of the information that teachers receive. First, information from the CST does not arrive from the spring tests until August, and thus most teachers do not have a chance to review the results until the next school year begins. Second, during the period we study, teachers were provided with printed copies of CST results for students in their classes during the prior year, making it very difficult and time consuming to coordinate with other teachers to obtain test results for their current students when the new school year began. Third, while the math CST tests do provide teachers with information on student performance in individual areas, the MDTP provides more categories, and in some cases, more-specific categories, which are likely to provide teachers with additional information on how to help an individual student.5 Fourth, unlike the CST, the MDTP test results provided to teachers show the distribution of answers by their students on each individual question on a test. Because the multiple choice answers are carefully designed with distracters, it is often straightforward for a math teacher to infer from the most frequent wrong answer chosen what specifically it is that the student is misunderstanding. For example, if a question requires a student to add together two fractions, one of the wrong choices might be designed to test whether the student mistakenly believes that the lowest common denominator is found by adding together the denominators from the two individual fractions rather than identifying the smallest integer that is a multiple of the denominators.
In sum, the MDTP gives teachers, students, and schools much more timely feedback, in electronic form, with more detailed information on the strands of subject matter being tested, and far better information on specific areas in which students need help. For these reasons, the effect of MDTP testing on subsequent student learning may be greater than the effect of CST testing.
Although the MDTP test is distinctly different from the typical state-mandated test, it is useful to see what studies on the effects of student testing have revealed thus far. Quite a few studies of broader accountability systems, such as No Child Left Behind, now exist. See for example Dee and Jacob (2009), who compare trends in achievement at the state level and conclude that accountability may have a positive effect on
5 For instance, the grade seven math CST includes six strands, compared to eight items on the MDTP Algebra Readiness test, and CST strands are occasionally quite broad (e.g., the CST strand “Multistep Problems, Graphing, and Functions,” which translates roughly into two separate MDTP areas: “Simple Equations and Operations with Literal Symbols” and “Graphical Representation”). For information on the CST strands see California Department of Education (2010), Appendix A .
http://www.ppic.org/main/home.asp Does Diagnostic Math Testing Improve Student Learning? 11
achievement. Figlio and Loeb (2011) review 21 papers that consider the impact of accountability systems on student achievement and conclude that accountability systems appear to boost achievement, but more clearly for mathematics achievement than reading achievement. However, economists and other social scientists have not studied low-stakes diagnostic testing in any detail.
In San Diego, the MDTP diagnostic tests were considered low-stakes testing by teachers and principals because they were not used to evaluate schools. However, when they were mandated by the district in certain grades, the tests were indeed of some consequence to students because they influenced course placement. Thus the literature reviewed above is only partially relevant to the MDTP.
This report seeks to make one of the first contributions to this literature on the impact of diagnostic testing. Nunnery, Ross, and Goldfeder (2003) study the introduction of math and reading initiatives known as School Renaissance in the McKinney Independent School District in Texas. The interventions focused heavily on the use of Standards Master (software designed by the Renaissance Learning Corporation) for testing and quick feedback in math and reading. Professional development for teachers and assistance for the district in aligning the local curriculum to state standards accompanied the interventions. The analysis generally found positive growth in math and reading in the schools receiving the program relative to a matched set of comparison schools. However, it is not possible to identify the independent contributions of the testing system, professional development, and curriculum alignment. Yeh (2006) conducts a qualitative study of the same district and concludes that teachers appreciate the quarterly administration of the Standards Master tests, especially if they receive training in how to use students’ results. In contrast, Muralidharan and Sundararaman (2010) find that students in India do not benefit from the provision of detailed test-score results to their teachers.
Study Questions and Research Design
The two primary questions in our research were whether the mandated use of MDTP tests and the voluntary use of MDTP by individual teachers were associated with changes in individual students’ growth in math achievement.
To answer these questions, we use data from 2001–2002 through 2006–2007. During this period, we model individual students’ trends in math achievement, as measured on the CST test, and we look for a break from each student’s trend in years after the student took a district-mandated MDTP test or took an MDTP test voluntarily adopted by his or her teacher.
When analyzing the mandated MDTP testing in certain grades, we want to guard against the possibility that all students might have a break in trend achievement in a given grade. We therefore use what is sometimes referred to as a natural experiment: The San Diego district phased in MDTP tests in grades 6 and 7 part way through our study period and had already implemented tests in grades 8 and 9 at the start of our study period but later phased them out. Thus we can observe student progress in any of these grades, comparing years with and without mandated MDTP testing. This allows us to search for breaks from trend achievement for individual students in years and grades when they took a mandated MDTP test.
We do not have the same sort of natural experiment in place for the voluntary use of MDTP testing by individual teachers. Thus it is possible that the teacher voluntarily used the MDTP test for reasons that we do not observe but which are correlated with the student’s subsequent achievement growth.
http://www.ppic.org/main/home.asp Does Diagnostic Math Testing Improve Student Learning? 12
Data
Student Longitudinal Database
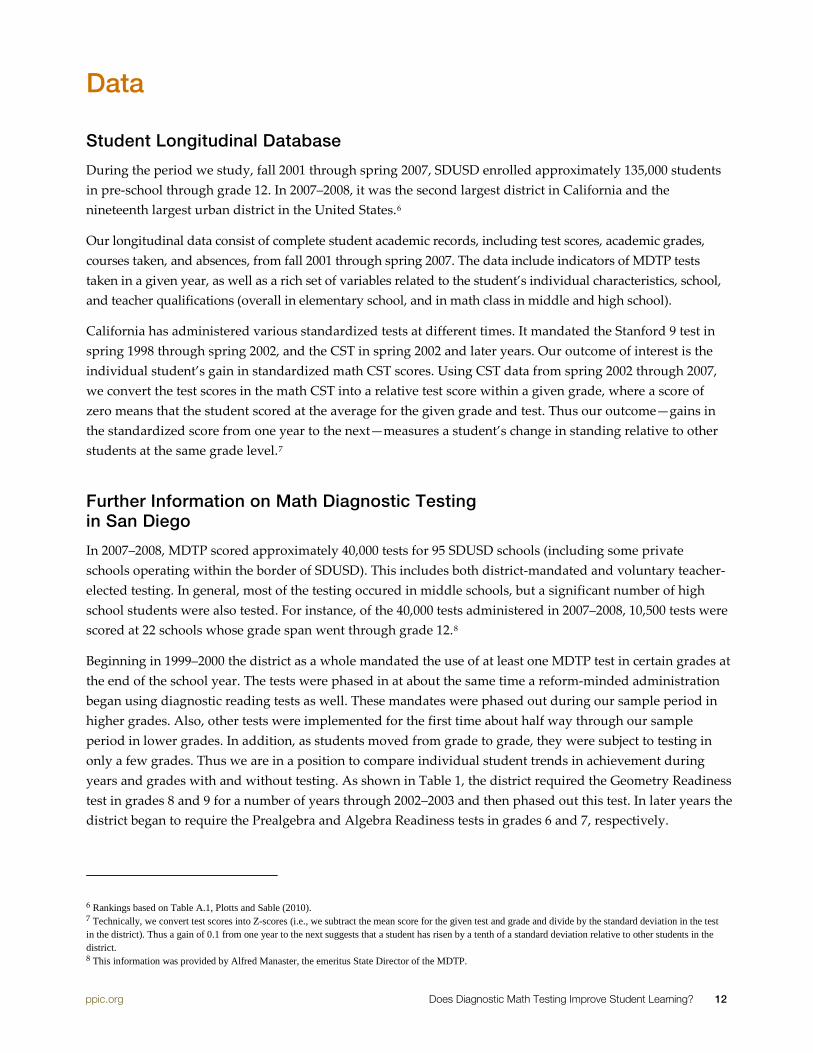
During the period we study, fall 2001 through spring 2007, SDUSD enrolled approximately 135,000 students in pre-school through grade 12. In 2007–2008, it was the second largest district in California and the nineteenth largest urban district in the United States.6
Our longitudinal data consist of complete student academic records, including test scores, academic grades, courses taken, and absences, from fall 2001 through spring 2007. The data include indicators of MDTP tests taken in a given year, as well as a rich set of variables related to the student’s individual characteristics, school, and teacher qualifications (overall in elementary school, and in math class in middle and high school).
California has administered various standardized tests at different times. It mandated the Stanford 9 test in spring 1998 through spring 2002, and the CST in spring 2002 and later years. Our outcome of interest is the individual student’s gain in standardized math CST scores. Using CST data from spring 2002 through 2007, we convert the test scores in the math CST into a relative test score within a given grade, where a score of zero means that the student scored at the average for the given grade and test. Thus our outcome—gains in the standardized score from one year to the next—measures a student’s change in standing relative to other students at the same grade level.7
Further Information on Math Diagnostic Testing in San Diego
In 2007–2008, MDTP scored approximately 40,000 tests for 95 SDUSD schools (including some private schools operating within the border of SDUSD). This includes both district-mandated and voluntary teacher-elected testing. In general, most of the testing occured in middle schools, but a significant number of high school students were also tested. For instance, of the 40,000 tests administered in 2007–2008, 10,500 tests were scored at 22 schools whose grade span went through grade 12.8
Beginning in 1999–2000 the district as a whole mandated the use of at least one MDTP test in certain grades at the end of the school year. The tests were phased in at about the same time a reform-minded administration began using diagnostic reading tests as well. These mandates were phased out during our sample period in higher grades. Also, other tests were implemented for the first time about half way through our sample period in lower grades. In addition, as students moved from grade to grade, they were subject to testing in only a few grades. Thus we are in a position to compare individual student trends in achievement during years and grades with and without testing. As shown in Table 1, the district required the Geometry Readiness test in grades 8 and 9 for a number of years through 2002–2003 and then phased out this test. In later years the district began to require the Prealgebra and Algebra Readiness tests in grades 6 and 7, respectively.
6 Rankings based on Table A.1, Plotts and Sable (2010). 7 Technically, we convert test scores into Z-scores (i.e., we subtract the mean score for the given test and grade and divide by the standard deviation in the test in the district). Thus a gain of 0.1 from one year to the next suggests that a student has risen by a tenth of a standard deviation relative to other students in the district. 8 This information was provided by Alfred Manaster, the emeritus State Director of the MDTP.
http://www.ppic.org/main/home.asp Does Diagnostic Math Testing Improve Student Learning? 13
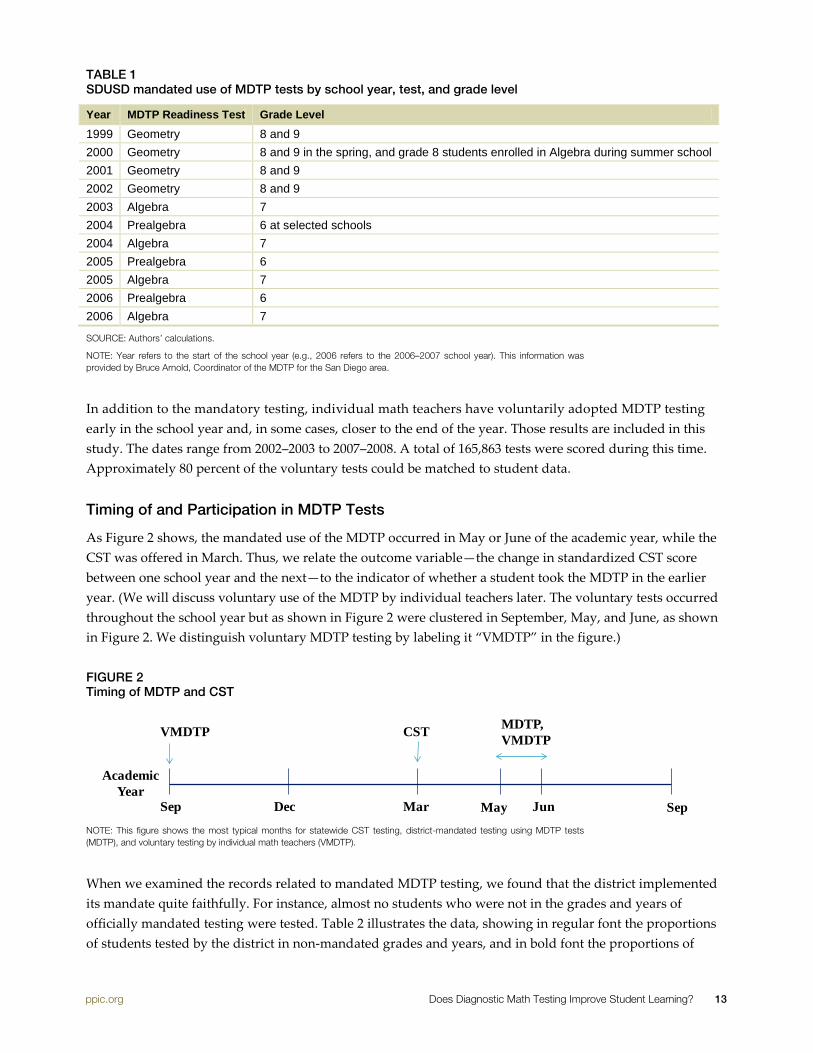
TABLE 1 SDUSD mandated use of MDTP tests by school year, test, and grade level
Year MDTP Readiness Test Grade Level 1999 Geometry 8 and 9 2000 Geometry 8 and 9 in the spring, and grade 8 students enrolled in Algebra during summer school 2001 Geometry 8 and 9 2002 Geometry 8 and 9 2003 Algebra 7 2004 Prealgebra 6 at selected schools 2004 Algebra 7 2005 Prealgebra 6 2005 Algebra 7 2006 Prealgebra 6 2006 Algebra 7
SOURCE: Authors’ calculations.
NOTE: Year refers to the start of the school year (e.g., 2006 refers to the 2006–2007 school year). This information was provided by Bruce Arnold, Coordinator of the MDTP for the San Diego area.
In addition to the mandatory testing, individual math teachers have voluntarily adopted MDTP testing early in the school year and, in some cases, closer to the end of the year. Those results are included in this study. The dates range from 2002–2003 to 2007–2008. A total of 165,863 tests were scored during this time. Approximately 80 percent of the voluntary tests could be matched to student data.
Timing of and Participation in MDTP Tests
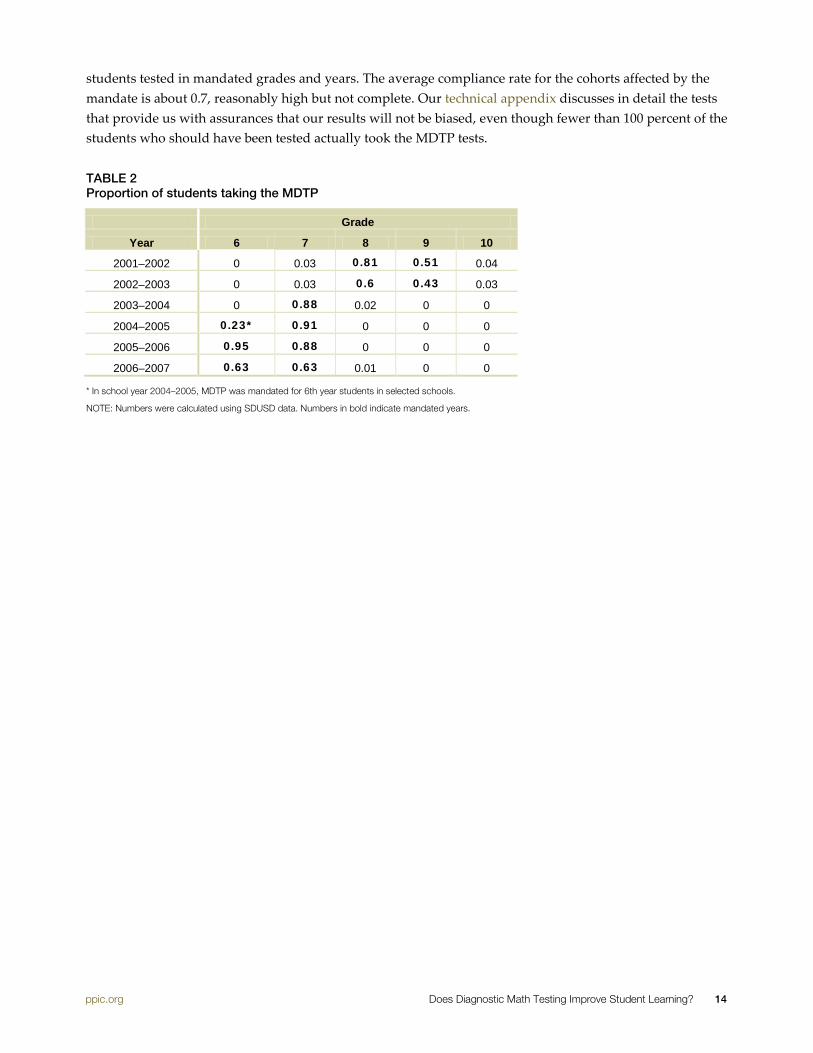
As Figure 2 shows, the mandated use of the MDTP occurred in May or June of the academic year, while the CST was offered in March. Thus, we relate the outcome variable—the change in standardized CST score between one school year and the next—to the indicator of whether a student took the MDTP in the earlier year. (We will discuss voluntary use of the MDTP by individual teachers later. The voluntary tests occurred throughout the school year but as shown in Figure 2 were clustered in September, May, and June, as shown in Figure 2. We distinguish voluntary MDTP testing by labeling it “VMDTP” in the figure.)
FIGURE 2 Timing of MDTP and CST
NOTE: This figure shows the most typical months for statewide CST testing, district-mandated testing using MDTP tests (MDTP), and voluntary testing by individual math teachers (VMDTP).
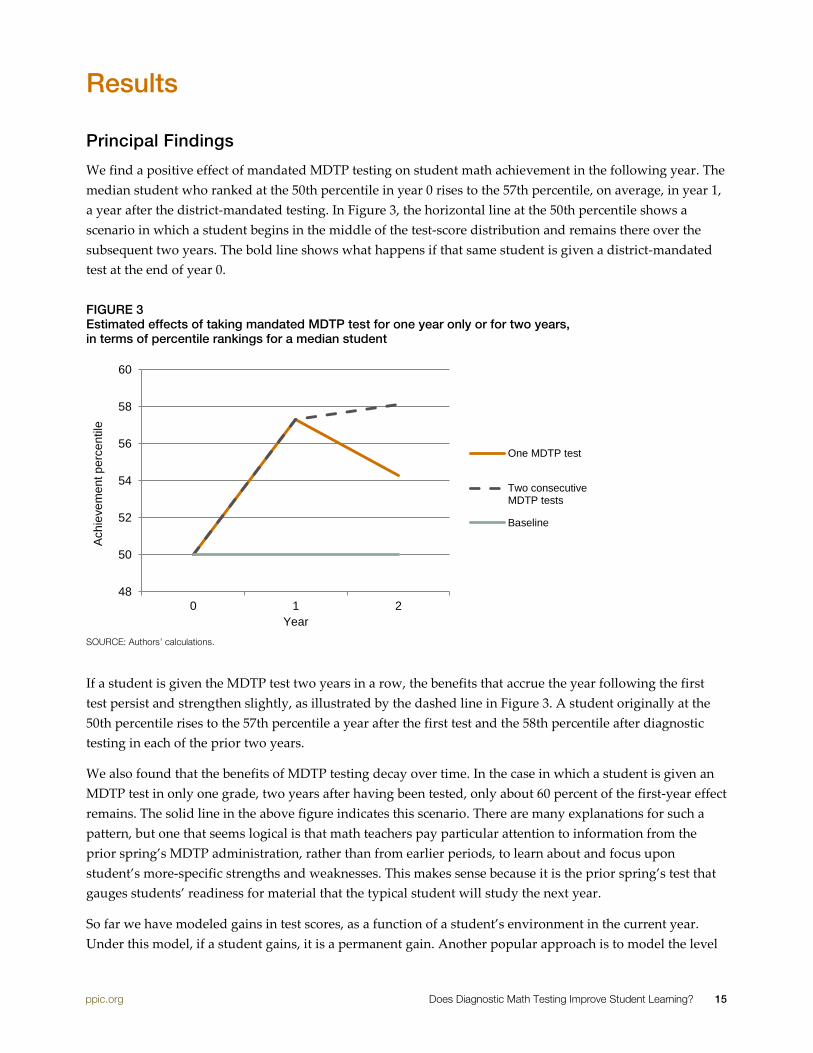
When we examined the records related to mandated MDTP testing, we found that the district implemented its mandate quite faithfully. For instance, almost no students who were not in the grades and years of officially mandated testing were tested. Table 2 illustrates the data, showing in regular font the proportions of students tested by the district in non-mandated grades and years, and in bold font the proportions of
Sep SepDec Mar Jun
CST MDTP, VMDTPVMDTP
May
AcademicYear
http://www.ppic.org/main/home.asp Does Diagnostic Math Testing Improve Student Learning? 14
students tested in mandated grades and years. The average compliance rate for the cohorts affected by the mandate is about 0.7, reasonably high but not complete. Our technical appendix discusses in detail the tests that provide us with assurances that our results will not be biased, even though fewer than 100 percent of the students who should have been tested actually took the MDTP tests.
TABLE 2 Proportion of students taking the MDTP
Grade
Year 6 7 8 9 10
2001–2002 0 0.03 0.81 0.51 0.04
2002–2003 0 0.03 0.6 0.43 0.03
2003–2004 0 0.88 0.02 0 0
2004–2005 0.23* 0.91 0 0 0
2005–2006 0.95 0.88 0 0 0
2006–2007 0.63 0.63 0.01 0 0
* In school year 2004–2005, MDTP was mandated for 6th year students in selected schools.
NOTE: Numbers were calculated using SDUSD data. Numbers in bold indicate mandated years.
http://www.ppic.org/main/home.asp Does Diagnostic Math Testing Improve Student Learning? 15
Results
Principal Findings
We find a positive effect of mandated MDTP testing on student math achievement in the following year. The median student who ranked at the 50th percentile in year 0 rises to the 57th percentile, on average, in year 1, a year after the district-mandated testing. In Figure 3, the horizontal line at the 50th percentile shows a scenario in which a student begins in the middle of the test-score distribution and remains there over the subsequent two years. The bold line shows what happens if that same student is given a district-mandated test at the end of year 0.
FIGURE 3 Estimated effects of taking mandated MDTP test for one year only or for two years, in terms of percentile rankings for a median student
SOURCE: Authors’ calculations.
If a student is given the MDTP test two years in a row, the benefits that accrue the year following the first test persist and strengthen slightly, as illustrated by the dashed line in Figure 3. A student originally at the 50th percentile rises to the 57th percentile a year after the first test and the 58th percentile after diagnostic testing in each of the prior two years.
We also found that the benefits of MDTP testing decay over time. In the case in which a student is given an MDTP test in only one grade, two years after having been tested, only about 60 percent of the first-year effect remains. The solid line in the above figure indicates this scenario. There are many explanations for such a pattern, but one that seems logical is that math teachers pay particular attention to information from the prior spring’s MDTP administration, rather than from earlier periods, to learn about and focus upon student’s more-specific strengths and weaknesses. This makes sense because it is the prior spring’s test that gauges students’ readiness for material that the typical student will study the next year.
So far we have modeled gains in test scores, as a function of a student’s environment in the current year. Under this model, if a student gains, it is a permanent gain. Another popular approach is to model the level
48
50
52
54
56
58
60
0 1 2
Ach
ieve
men
t per
cent
ile
Year
One MDTP test
Two consecutiveMDTP tests
Baseline
http://www.ppic.org/main/home.asp Does Diagnostic Math Testing Improve Student Learning? 16
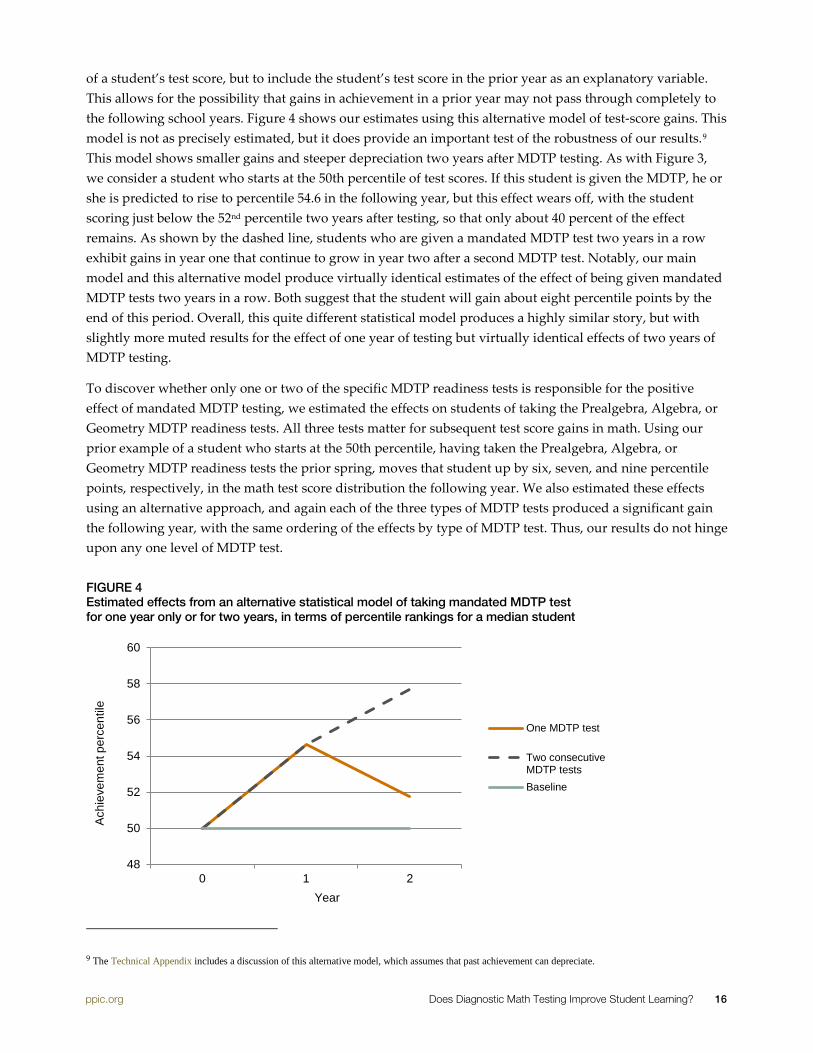
of a student’s test score, but to include the student’s test score in the prior year as an explanatory variable. This allows for the possibility that gains in achievement in a prior year may not pass through completely to the following school years. Figure 4 shows our estimates using this alternative model of test-score gains. This model is not as precisely estimated, but it does provide an important test of the robustness of our results.9 This model shows smaller gains and steeper depreciation two years after MDTP testing. As with Figure 3, we consider a student who starts at the 50th percentile of test scores. If this student is given the MDTP, he or she is predicted to rise to percentile 54.6 in the following year, but this effect wears off, with the student scoring just below the 52nd percentile two years after testing, so that only about 40 percent of the effect remains. As shown by the dashed line, students who are given a mandated MDTP test two years in a row exhibit gains in year one that continue to grow in year two after a second MDTP test. Notably, our main model and this alternative model produce virtually identical estimates of the effect of being given mandated MDTP tests two years in a row. Both suggest that the student will gain about eight percentile points by the end of this period. Overall, this quite different statistical model produces a highly similar story, but with slightly more muted results for the effect of one year of testing but virtually identical effects of two years of MDTP testing.
To discover whether only one or two of the specific MDTP readiness tests is responsible for the positive effect of mandated MDTP testing, we estimated the effects on students of taking the Prealgebra, Algebra, or Geometry MDTP readiness tests. All three tests matter for subsequent test score gains in math. Using our prior example of a student who starts at the 50th percentile, having taken the Prealgebra, Algebra, or Geometry MDTP readiness tests the prior spring, moves that student up by six, seven, and nine percentile points, respectively, in the math test score distribution the following year. We also estimated these effects using an alternative approach, and again each of the three types of MDTP tests produced a significant gain the following year, with the same ordering of the effects by type of MDTP test. Thus, our results do not hinge upon any one level of MDTP test.
FIGURE 4 Estimated effects from an alternative statistical model of taking mandated MDTP test for one year only or for two years, in terms of percentile rankings for a median student
9 The Technical Appendix includes a discussion of this alternative model, which assumes that past achievement can depreciate.
48
50
52
54
56
58
60
0 1 2
Ach
ieve
men
t per
cent
ile
Year
One MDTP test
Two consecutiveMDTP testsBaseline
http://www.ppic.org/main/home.asp Does Diagnostic Math Testing Improve Student Learning? 17
SOURCE: Authors’ calculations.
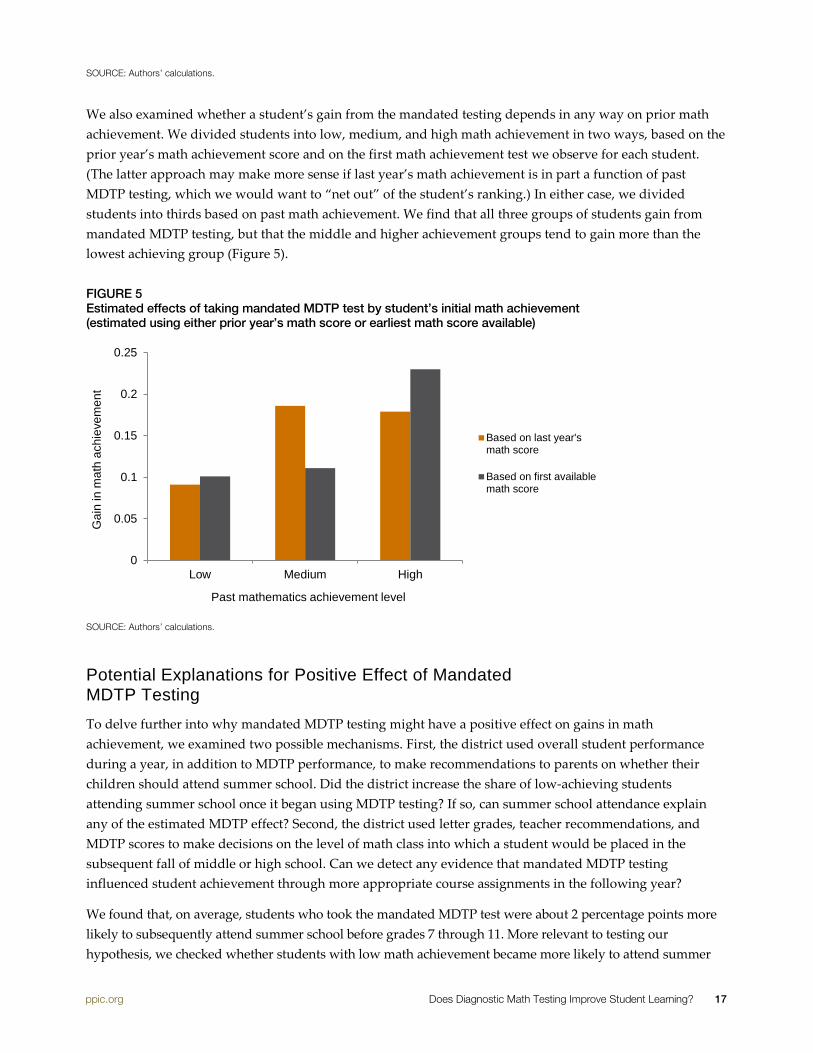
We also examined whether a student’s gain from the mandated testing depends in any way on prior math achievement. We divided students into low, medium, and high math achievement in two ways, based on the prior year’s math achievement score and on the first math achievement test we observe for each student. (The latter approach may make more sense if last year’s math achievement is in part a function of past MDTP testing, which we would want to “net out” of the student’s ranking.) In either case, we divided students into thirds based on past math achievement. We find that all three groups of students gain from mandated MDTP testing, but that the middle and higher achievement groups tend to gain more than the lowest achieving group (Figure 5).
FIGURE 5 Estimated effects of taking mandated MDTP test by student’s initial math achievement (estimated using either prior year’s math score or earliest math score available)
SOURCE: Authors’ calculations.
Potential Explanations for Positive Effect of Mandated MDTP Testing
To delve further into why mandated MDTP testing might have a positive effect on gains in math achievement, we examined two possible mechanisms. First, the district used overall student performance during a year, in addition to MDTP performance, to make recommendations to parents on whether their children should attend summer school. Did the district increase the share of low-achieving students attending summer school once it began using MDTP testing? If so, can summer school attendance explain any of the estimated MDTP effect? Second, the district used letter grades, teacher recommendations, and MDTP scores to make decisions on the level of math class into which a student would be placed in the subsequent fall of middle or high school. Can we detect any evidence that mandated MDTP testing influenced student achievement through more appropriate course assignments in the following year?
We found that, on average, students who took the mandated MDTP test were about 2 percentage points more likely to subsequently attend summer school before grades 7 through 11. More relevant to testing our hypothesis, we checked whether students with low math achievement became more likely to attend summer
0
0.05
0.1
0.15
0.2
0.25
Low Medium High
Gai
n in
mat
h ac
hiev
emen
t
Past mathematics achievement level
Based on last year'smath score
Based on first availablemath score
http://www.ppic.org/main/home.asp Does Diagnostic Math Testing Improve Student Learning? 18
school when they were tested near the end of the year with an MDTP diagnostic test. We found evidence in favor of this hypothesis. Indeed, while it is true across our entire sample that students who do poorly on the math CST test are more likely to attend summer school, this tendency becomes twice as strong in years and grades when students are tested using the MDTP tests. For example, comparing two students, one at the 50th percentile on the state CST math test and another who scores at the 16th percentile (which corresponds to a one standard deviation difference), in years without mandated MDTP testing, the lower-performing student was more likely to attend summer school by 1.1 percentage points. (To provide some perspective, we note that in our sample, 8.1 percent of students attended summer school, on average.) However, if both students were in a grade and year with mandated testing, the lower-performing student was more likely to attend summer school by 2.1 percentage points. Thus the use of MDTP testing doubled the increase in probability that a low-achieving student enrolled in summer school, relative to the probability that a median student would enroll.
Next, we examine the question of whether the student’s score on the MDTP test affects placement into math classes the following academic year. More accurate “tracking” or “ability grouping” would manifest itself by reduced heterogeneity within each classroom. (Ability grouping refers to grouping students by initial ability in a subject area; tracking additionally suggests placing students into classes that cover different content, which is common in American middle and high schools. See Betts (2010) for a review of the literature on the relation between tracking and student achievement.) If it is true that mandated MDTP testing leads to more accurate placement, then we should expect to see that the variation in initial math test scores among students in a given math classroom falls if the students were given the MDTP in the prior spring. We indeed found that the variation in prior year’s math test scores within a classroom falls by about 6 percent if the students had been given an end-of-year MDTP test the prior spring.
So, we have found evidence that the use of mandated MDTP testing both increased the chances that students with low achievement in math attended summer school, and that it lowered variation in prior achievement within math classrooms in the following year. The next question is whether these consequences of MDTP testing can explain any of the positive effect of MDTP testing on students’ subsequent gains in math achievement. To address this question, we re-estimated our model of math gains, and found that indeed, students who attended summer school gained more than they did in other grades, and that students in classes with less variation among students learned more than they did in years when they were in classes with more heterogeneity across students. Summer school and more accurate ability grouping appear to promote student learning.
We found that only about 1 percent of the positive effect of MDTP could be attributed to summer school, while more appropriate classroom placement the following year can explain about 11 percent.10 Thus, most of the effect of MDTP occurs for reasons other than summer school and appropriate classroom placement. One obvious possibility is that the MDTP provides teachers with the knowledge they need to identify and address specific student weaknesses in math. On a related note, it could be that the coordinated use of the MDTP across all students within a grade engenders active discussion among math teachers about strategies to address the most common problem areas among students.
10 We estimated the model using the alternative approach we mentioned earlier and found in that case that summer school and better course placement could explain 1 percent and 5 percent, respectively, of the overall positive impact of MDTP on math achievement gains.
http://www.ppic.org/main/home.asp Does Diagnostic Math Testing Improve Student Learning? 19
Voluntary Versus Mandated MDTP Testing
We also obtained data on the voluntary use of MDTP tests by individual math teachers. To distinguish between teachers’ voluntary use of MDTP tests and district-mandated MDTP testing, we refer to the former, voluntary, testing, as VMDTP and reserve the moniker MDTP for district-mandated testing. We obtained information on which students were tested from 2003 forward.
There are several issues with the VMDTP testing that make it relatively more difficult to infer its effects on subsequent student achievement. First, the testing is voluntary, and there is no obvious way to take into account why some teachers adopted the MDTP and others did not, or why some teachers test some of their classes but not others. Second, we were able to match the VMDTP data to specific students in only 80 percent of cases. Third, we found, as indicated in Figure 2, that many teachers gave the MDTP test to their students in early fall, ostensibly to learn about the specific areas of mathematical understanding in which their students needed the most help. But many teachers used the MDTP in the spring, after the statewide tests that we use as our outcome measure were administered. Testing so late could only have a causal effect on the student’s CST scores during spring of the next grade level. For this reason, we distinguish between two types of VMDTP testing: testing that occurred between September and March of the current school year (and therefore before the statewide testing occurs in late March) and VMDTP testing between April and August of the prior school year.
Overall, we found a very small negative association between VMDTP testing and student outcomes. For instance, a median student (that is, one at the 50th percentile) is estimated to lose slightly more than one percentile point if a teacher has voluntarily decided to test the student’s class between April of the prior year and March of the current year. Testing between September and March of the current year is more responsible for this negative association than is testing during the prior spring.
We are careful here to say “association” rather than “effect” because, unlike in the case of mandated testing (which was phased in over time in a way beyond the control of teachers), voluntary testing is just that, voluntary. So, for instance, an obvious way to explain the negative association is that teachers who are especially concerned about a given class might decide to test that class using the MDTP. This would produce a negative link between VMDTP and student gains in test scores if the voluntary testing had no true effect on math achievement gains. We do control for students’ average gains in performance from year to year, but we also tried estimating our models after taking account of the average of last year’s CST math scores for students in a given class. This approach allows us to test whether the negative voluntary MDTP “effect” is just picking up a pattern in which teachers elect to test their class if they sense that they are poorly prepared. When we took the average CST score from last year for a class into account, the estimated effect of voluntary MDTP testing changed from negative and statistically meaningful to a result that could not be distinguished from a zero effect.11
Another explanation for why mandatory testing has a positive association with subsequent gains in achievement whereas voluntary testing does not is that when the district mandates testing all students in certain grades, it induces coordination among teachers within the math department of a given school. District-mandated MDTP tests might induce a systematic examination of the MDTP test results for topics that might require review before lagging students get back onto track in the next school year. Voluntary
11 Conversely, the average effect of mandated MDTP was not sensitive to whether we included peer scores.
http://www.ppic.org/main/home.asp Does Diagnostic Math Testing Improve Student Learning? 20
testing by individual teachers might not engender a similar level of engagement across teachers in the math department. We tested whether voluntary testing had more positive effects if the proportion of students being given the MDTP test in a given grade and school was higher, but we did not find any variation.
A third possibility is that the main benefits of mandated spring use of MDTP testing arise not due to subsequent remediation of student deficiencies exposed by the MDTP test, but rather the gains to students from being placed in the appropriate math class in the subsequent year. As noted earlier we found evidence that, depending on the model we estimated, about 5 to 11 percent of the estimated impact of MDTP on math achievement can be attributed to classrooms that are more homogeneous in students’ initial achievement. To the extent that the district used spring MDTP results in the assignment of students to math courses, the improvements in ability grouping that resulted may have benefited students regardless of whether they were placed in a higher or lower track. For an example of such a finding, see Duflo, Dupas and Kremer (2011), who present experimental evidence that students in Kenya gain from ability grouping regardless of the group into which they are placed. See also Betts (2011) for a review of the literature on tracking in schools, which shows that although many observers in the United States criticize tracking and ability grouping, evidence that it hurts students is not very convincing from a statistical standpoint.
Another hint that the main benefit from mandated MDTP testing may arise due to better placement of students in the following year comes from the experimental work of Muralidharan and Sundararaman (2010), who find that the provision of detailed student test results to teachers in Andhra Pradesh in India does not appear to induce gains in student achievement. While many details of their study differ, and the educational settings of Andhra Pradesh and California have very little in common, perhaps the most important difference is that teachers in Andhra Pradesh did not use the tests to place students. In their study, the detailed tests were given at the beginning of the school year, whereas in our study the tests were given at the end of the school year and were explicitly used by the district to place students.
http://www.ppic.org/main/home.asp Does Diagnostic Math Testing Improve Student Learning? 21
Conclusion
We find that district-mandated diagnostic math testing produces positive gains in the next year, but voluntary use of MDTP tests by individual teachers does not convey the same apparent benefits. The gains from district-mandated testing for students are quite large, enough to move a student originally at the 50th percentile to somewhere between the 54.6th and the 57th percentile in the subsequent year. However, we also found a temporal trend where between 40 and 60 percent of the effect of mandated testing dissipates in tests two grades after the MDTP test. One inference from this pattern is that isolated MDTP testing may not be as helpful as repeated testing. This notion gains support from our finding that this depreciation is eliminated if students take MDTP tests two years in a row.
We can explain roughly 6 to 12 percent of the effect of mandated MDTP testing: 5 to 11 percent emanates from the creation of classes the following year that are more homogeneous in terms of initial student ability, and 1 percent results from placement of struggling students in summer school.
In sum, we find that diagnostic testing, if it leads to specific interventions and more accurate grouping, has positive effects. However, these effects are temporary unless the diagnostic testing is repeated the next year.
What are the broader implications of our study for improving math achievement in California (or elsewhere)? Simply providing teachers with diagnostic testing with quick turnaround does not appear to guarantee that their students will learn more: We found that voluntary use of the MDTP tests by teachers does not boost their students’ learning. However, we must remain cautious in making this claim, because with voluntary MDTP testing we cannot fully account for why some classes are tested and others are not. The recipe that has demonstrably worked in San Diego is to make a systemwide decision to test students diagnostically near the end of a grade, and to use the results to identify students in need of remediation (for instance, through summer school) and to place students into appropriate math classes in the next grade.
We cannot say for sure what other aspects of the mandatory use of MDTP might contribute to such a difference. One clear possibility is that when all teachers in a school know that the MDTP test results are available for students in a given grade, they regularly consult these results and tailor lessons in the following grade to students’ individual needs. MDTP offices around the state also provide assistance to schools in interpreting test results and using sample materials provided by the MDTP in the classroom to address specific issues. It could be that the provision of this assistance matters, and that it is more likely to occur when a school is mandated to use the MDTP tests for an entire cohort of students. One conjecture that we cannot test, but which is still plausible, is that the MDTP tests might become even more effective if teachers were provided with further professional development in how to change their teaching methods in response to test results.
The MDTP is available without charge to middle school and high school math teachers. It is used widely but far from universally, with about one test administered annually for every five California middle and high school students. Districts that have not used the MDTP might want to consider adopting one or more of the readiness tests.
Our findings also carry some implications for the state accountability system. If an important mechanism through which MDTP boosts achievement is by providing information to help teachers and counselors better assign students to appropriate math classes in the following academic year, then the current California Standards Test cannot fulfill this role unless it becomes more timely. Schools typically receive student results
http://www.ppic.org/main/home.asp Does Diagnostic Math Testing Improve Student Learning? 22
from the prior spring’s CST test in late summer, too late to be used either to place students into remedial summer classes or to assign students to specific courses. Any adjustments the state can implement to accelerate the delivery of test results would make the CST far more useful as a tool for improving educational achievement, rather than simply assessing achievement. Computerizing the CST tests could provide one option for quicker turnaround that would boost teachers’ ability to rectify students’ specific weaknesses in a given field before the students have moved well into their next year of school. One impediment to this approach, of course, is the considerable upfront investment that would be required to replace paper tests.
But significantly, in June 2011 California officially became one of 18 governing states in the 30-state SMARTER Balanced Assessment Consortium (one of two multi-state consortia developing national tests for the Common Core standards in math and English). This consortium is planning computer adaptive testing, which alters the questions asked of students based on how well they have addressed previous questions in a test. The consortium is also interested in providing teachers with the capability of conducting formative testing during the school year (i.e., testing designed to diagnose how well students have mastered the material just taught). This approach bears some similarity to the MDTP, which diagnoses mastery of specific topics. (See Fensterwald, 2011.)
The CST or the successor testing system being designed by the SMARTER Balanced Assessment Consortium could also provide teachers with more nuanced indications of the mathematical concepts a student has not yet mastered. It could do this by providing results for a greater number of “strands” on a given test and by defining each strand more clearly. But it would be unrealistic to hope that a statewide test used for accountability purposes could ever convey as detailed a picture of students’ strengths and weaknesses as can a diagnostic test such as the MDTP, which even provides teachers with the distribution of answers to specific questions, helping teachers to pinpoint how many students missed a given concept and why. In contrast, the California Standards Test is a secure test. That is, in part to reduce cheating, teachers do not receive the actual questions and student responses after the test, but instead receive only a summary of student achievement over broad areas. This may be the most important lesson of all: Tests designed for accountability and tests designed to diagnose student weaknesses are inherently different. Clearly, there is an important place for both types of tests in the current education landscape. The MDTP is an important tool school districts can leverage in addition to a state accountability test in order to improve student achievement in mathematics.
http://www.ppic.org/main/home.asp Does Diagnostic Math Testing Improve Student Learning? 23
References
Betts, Julian R. 2011. "The Economics of Tracking in Education." In Handbook of the Economics of Education, vol. 3, ed. Eric A. Hanushek, Stephen Machin, and Ludger Woessmann (Amsterdam: North Holland), 341–81.
California Department of Education. 2010. California Standardized Testing and Reporting Post-Test Guide Technical Information for STAR District and Test Site Coordinators and Research Specialists. Available at www.startest.org/pdfs/STAR.post-test_guide.2010.pdf (downloaded November 2010).
Dee, Thomas, and Brian Jacob. 2009. "The Impact of No Child Left Behind on Student Achievement." National Bureau of Economic Research Working Paper 15531.
Duflo, Esther, Pascaline Dupas, and Michael Kremer. 2011. "Peer Effects, Teacher Incentives, and the Impact of Tracking: Evidence from a Randomized Evaluation in Kenya." American Economic Review 101 (5): 1707–38.
Fensterwald, John. 2011. “California Switches Test Consortiums.” Thoughts on Public Education, June 10. Available at http://toped.svefoundation.org/2011/06/10/california-jumps-to-other-test-consortium.
Figlio, David, and Susanna Loeb. 2011. “School Accountability.” In Handbook of the Economics of Education, vol. 3, ed. Eric A. Hanushek, Stephen Machin, and Ludger Woessmann (Amsterdam: North Holland), 383–421.
Linn, Robert L. 2000. “Assessments and Accountability.” Educational Researcher 29 (2): 4–15.
Muralidharan, Karthik, and Venkatesh Sundararaman. 2010. “The Impact of Diagnostic Feedback to Teachers on Student Learning: Experimental Evidence from India.” Economic Journal 120 (546): F187–F203.
Nunnery, John, Steven M. Ross, and Elizabeth Goldfeder. 2003. "The Effect of School Renaissance on TAAS Scores in the McKinney ISD." Center for Research in Educational Policy, University of Memphis.
Plotts, C., and J. Sable. 2010. Characteristics of the 100 Largest Public Elementary and Secondary School Districts in the United States: 2007–08. Statistical Analysis Report, NCES 2010-349. U.S. Department of Education, National Center for Education Statistics. Washington DC: U.S. Government Printing Office.
Yeh, Stuart S. 2006. “Can Rapid Assessment Moderate the Effects of High-Stakes Testing?” Education and Urban Society 39 (1): 91–112.
http://www.ppic.org/main/home.asp Does Diagnostic Math Testing Improve Student Learning? 24
About the Authors
Julian R. Betts is an adjunct policy fellow and a Bren fellow at the Public Policy Institute of California. He is professor and former chair of economics at the University of California, San Diego, where he is Executive Director of the San Diego Education Research Alliance (sandera.ucsd.edu). He is also a research associate at the National Bureau of Economic Research. He has written extensively on the link between student outcomes and measures of school spending, and he has studied the role that educational standards, accountability, teacher qualifications, and school choice play in student achievement. He has served on three National Academy of Sciences panels, the Consensus Panel of the National Charter School Research Project, and various advisory groups for the U.S. Department of Education. He is also principal investigator for the federally mandated National Evaluation of Magnet Schools. He holds a Ph.D. in economics from Queen’s University, Kingston, Ontario, Canada.
Youjin Hahn is an assistant professor at Monash University, Australia. She holds a doctorate in economics from the University of California, San Diego.
Andrew C. Zau is a senior statistician in the Department of Economics at the University of California, San Diego. Previously, he was a research associate at PPIC. Before joining PPIC, he was a SAS programmer and research assistant at the Naval Health Research Center in San Diego, where he investigated the health consequences of military service in Operations Desert Shield and Desert Storm. He holds a B.S. in bioengineering from the University of California, San Diego, and an M.P.H. in epidemiology from San Diego State University.
Acknowledgments
This research was funded at arms’ length by the California Academic Partnership Program at the California State University and the University of California, and by the Public Policy Institute of California through a Bren Fellowship awarded to Julian Betts. We are grateful to participants in seminars at the annual meetings of the American Economic Association; the University of California, San Diego, and the CAPP Advisory Committee meeting; and to Karen Bachofer, Ron Rode and Peter Bell for helpful suggestions. For their help in answering our many questions about the MDTP, we are especially grateful to Alfred Manaster, the emeritus state director of the MDTP; Bruce Arnold, the current state director of the MDTP; Donna Ames of the MDTP San Diego office; and David Jolly and Andrea Ball, emeritus and current directors of CAPP, respectively. We also thank Hans Johnson, Richard Murnane, and Russell Rumberger for providing detailed comments on an earlier draft and Gary Bjork for editing assistance.

PUBLIC POLICY INSTITUTE OF CALIFORNIA
Board of Directors
John E. Bryson, Chair Retired Chairman and CEO Edison International
Mark Baldassare President and CEO Public Policy Institute of California
Ruben Barrales President and CEO San Diego Regional Chamber of Commerce
María Blanco Vice President, Civic Engagement California Community Foundation
Brigitte Bren Chief Executive Officer International Strategic Planning, Inc.
Gary K. Hart Former State Senator and Secretary of Education State of California
Robert M. Hertzberg Partner Mayer Brown LLP
Walter B. Hewlett Director Center for Computer Assisted Research in the Humanities
Donna Lucas Chief Executive Officer Lucas Public Affairs
David Mas Masumoto Author and farmer
Steven A. Merksamer Senior Partner Nielsen, Merksamer, Parrinello, Gross & Leoni, LLP
Kim Polese Chairman ClearStreet, Inc.
Thomas C. Sutton Retired Chairman and CEO Pacific Life Insurance Company
The Public Policy Institute of California is dedicated to informing and improving public policy in California through independent, objective, nonpartisan research on major economic, social, and political issues. The institute’s goal is to raise public awareness and to give elected representatives and other decisionmakers a more informed basis for developing policies and programs.
The institute’s research focuses on the underlying forces shaping California’s future, cutting across a wide range of public policy concerns, including economic development, education, environment and resources, governance, population, public finance, and social and health policy.
PPIC is a private operating foundation. It does not take or support positions on any ballot measures or on any local, state, or federal legislation, nor does it endorse, support, or oppose any political parties or candidates for public office. PPIC was established in 1994 with an endowment from William R. Hewlett.
Mark Baldassare is President and Chief Executive Officer of PPIC. John E. Bryson is Chair of the Board of Directors.
Short sections of text, not to exceed three paragraphs, may be quoted without written permission provided that full attribution is given to the source and the above copyright notice is included. Research publications reflect the views of the authors and do not necessarily reflect the views of the staff, officers, or Board of Directors of the Public Policy Institute of California.
Copyright © 2011 Public Policy Institute of California All rights reserved. San Francisco, CA
PUBLIC POLICY INSTITUTE OF CALIFORNIA 500 Washington Street, Suite 600 San Francisco, California 94111 phone: 415.291.4400 fax: 415.291.4401 www.ppic.org
PPIC SACRAMENTO CENTER Senator Office Building 1121 L Street, Suite 801 Sacramento, California 95814 phone: 916.440.1120 fax: 916.440.1121