Embed Size (px)
Citation preview
S TAT E M E N T O N M O N E TA R Y P O L I C Y | F E B R UA R Y 2018 4 3
4. Domestic Financial Markets
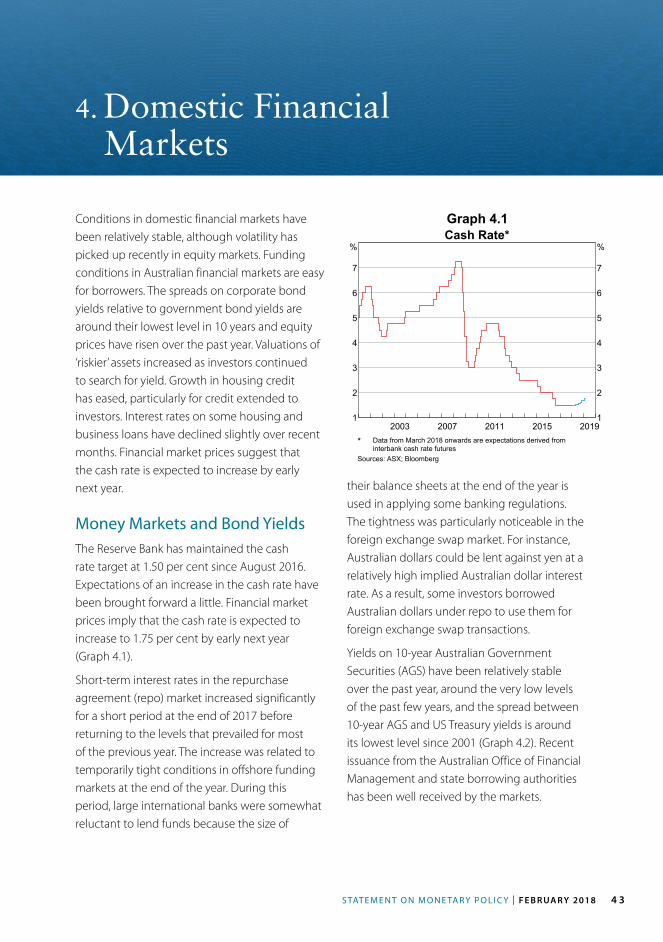
Conditions in domestic financial markets have been relatively stable, although volatility has picked up recently in equity markets. Funding conditions in Australian financial markets are easy for borrowers. The spreads on corporate bond yields relative to government bond yields are around their lowest level in 10 years and equity prices have risen over the past year. Valuations of ‘riskier’ assets increased as investors continued to search for yield. Growth in housing credit has eased, particularly for credit extended to investors. Interest rates on some housing and business loans have declined slightly over recent months. Financial market prices suggest that the cash rate is expected to increase by early next year.
Money Markets and Bond YieldsThe Reserve Bank has maintained the cash rate target at 1.50 per cent since August 2016. Expectations of an increase in the cash rate have been brought forward a little. Financial market prices imply that the cash rate is expected to increase to 1.75 per cent by early next year (Graph 4.1).
Short-term interest rates in the repurchase agreement (repo) market increased significantly for a short period at the end of 2017 before returning to the levels that prevailed for most of the previous year. The increase was related to temporarily tight conditions in offshore funding markets at the end of the year. During this period, large international banks were somewhat reluctant to lend funds because the size of
their balance sheets at the end of the year is used in applying some banking regulations. The tightness was particularly noticeable in the foreign exchange swap market. For instance, Australian dollars could be lent against yen at a relatively high implied Australian dollar interest rate. As a result, some investors borrowed Australian dollars under repo to use them for foreign exchange swap transactions.
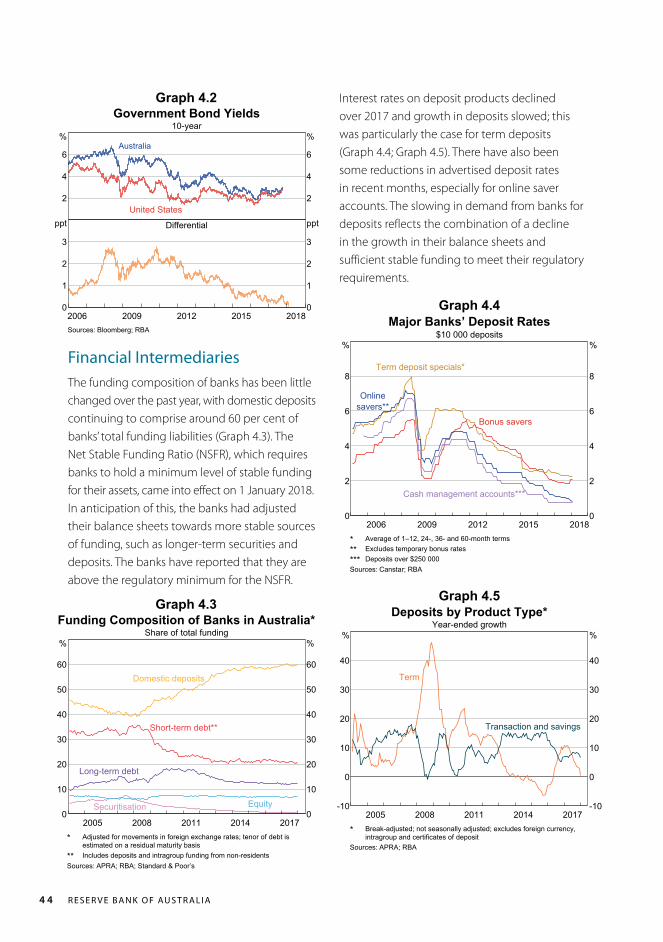
Yields on 10-year Australian Government Securities (AGS) have been relatively stable over the past year, around the very low levels of the past few years, and the spread between 10-year AGS and US Treasury yields is around its lowest level since 2001 (Graph 4.2). Recent issuance from the Australian Office of Financial Management and state borrowing authorities has been well received by the markets.
Graph 4.1
2015201120072003 20191
2
3
4
5
6
7
%
1
2
3
4
5
6
7
%Cash Rate*
* Data from March 2018 onwards are expectations derived frominterbank cash rate futures
Sources: ASX; Bloomberg
R E S E R V E B A N K O F AU S T R A L I A4 4
Financial IntermediariesThe funding composition of banks has been little changed over the past year, with domestic deposits continuing to comprise around 60 per cent of banks’ total funding liabilities (Graph 4.3). The Net Stable Funding Ratio (NSFR), which requires banks to hold a minimum level of stable funding for their assets, came into effect on 1 January 2018. In anticipation of this, the banks had adjusted their balance sheets towards more stable sources of funding, such as longer-term securities and deposits. The banks have reported that they are above the regulatory minimum for the NSFR.
Interest rates on deposit products declined over 2017 and growth in deposits slowed; this was particularly the case for term deposits (Graph 4.4; Graph 4.5). There have also been some reductions in advertised deposit rates in recent months, especially for online saver accounts. The slowing in demand from banks for deposits reflects the combination of a decline in the growth in their balance sheets and sufficient stable funding to meet their regulatory requirements.
Graph 4.2
Graph 4.3
Graph 4.4
Graph 4.5
Government Bond Yields10-year
2
4
6
%
2
4
6
%Australia
United States
Differential
2015201220092006 20180
1
2
3
ppt
0
1
2
3
ppt
Sources: Bloomberg; RBA
2014201120082005 20170
10
20
30
40
50
60
%
0
10
20
30
40
50
60
%
Funding Composition of Banks in Australia*Share of total funding
Securitisation
Long-term debt
Domestic deposits
Short-term debt**
Equity
* Adjusted for movements in foreign exchange rates; tenor of debt isestimated on a residual maturity basis** Includes deposits and intragroup funding from non-residents
Sources: APRA; RBA; Standard & Poor’s
2015201220092006 20180
2
4
6
8
%
0
2
4
6
8
%
Major Banks’ Deposit Rates$10 000 deposits
Term deposit specials*
Bonus savers
Cash management accounts***
Onlinesavers**
* Average of 1–12, 24-, 36- and 60-month terms** Excludes temporary bonus rates*** Deposits over $250 000Sources: Canstar; RBA
2014201120082005 2017-10
0
10
20
30
40
%
-10
0
10
20
30
40
%
Deposits by Product Type*Year-ended growth
Term
Transaction and savings
* Break-adjusted; not seasonally adjusted; excludes foreign currency,intragroup and certificates of deposit
Sources: APRA; RBA
S TAT E M E N T O N M O N E TA R Y P O L I C Y | F E B R UA R Y 2018 4 5
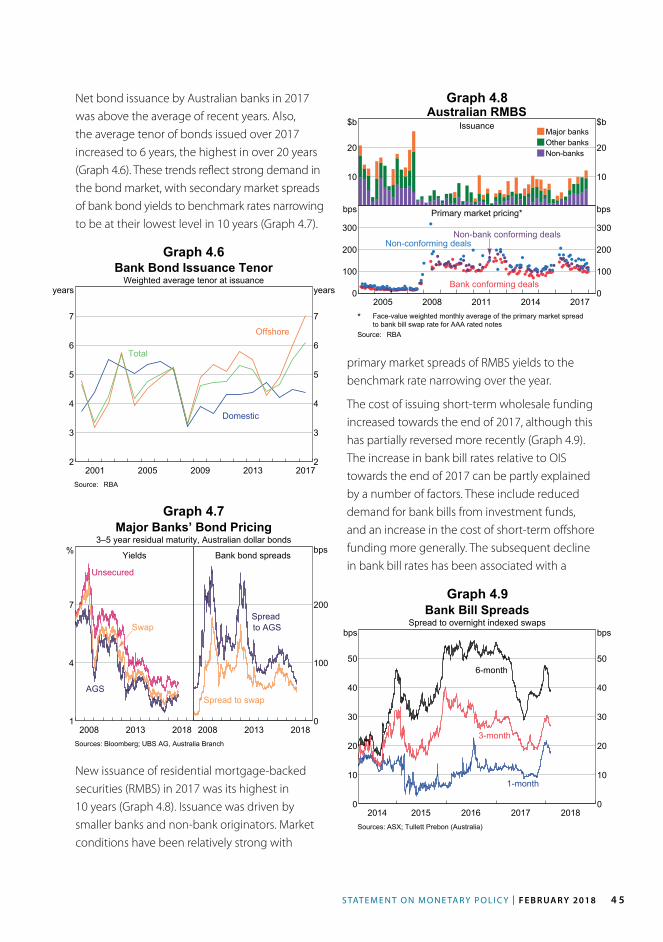
Net bond issuance by Australian banks in 2017 was above the average of recent years. Also, the average tenor of bonds issued over 2017 increased to 6 years, the highest in over 20 years (Graph 4.6). These trends reflect strong demand in the bond market, with secondary market spreads of bank bond yields to benchmark rates narrowing to be at their lowest level in 10 years (Graph 4.7).
primary market spreads of RMBS yields to the benchmark rate narrowing over the year.
The cost of issuing short-term wholesale funding increased towards the end of 2017, although this has partially reversed more recently (Graph 4.9). The increase in bank bill rates relative to OIS towards the end of 2017 can be partly explained by a number of factors. These include reduced demand for bank bills from investment funds, and an increase in the cost of short-term offshore funding more generally. The subsequent decline in bank bill rates has been associated with a
Graph 4.6
Graph 4.8
Graph 4.9
Graph 4.7
2013200920052001 20172
3
4
5
6
7
years
2
3
4
5
6
7
years
Bank Bond Issuance TenorWeighted average tenor at issuance
Domestic
Total
Offshore
Source: RBA
Australian RMBSIssuance
Major banksOther banksNon-banks
10
20
$b
10
20
$b
Primary market pricing*
2014201120082005 20170
100
200
300
bps
0
100
200
300
bps
Bank conforming deals
Non-conforming dealsNon-bank conforming deals
* Face-value weighted monthly average of the primary market spreadto bank bill swap rate for AAA rated notes
Source: RBA
2014 201720162015 20180
10
20
30
40
50
bps
0
10
20
30
40
50
bps
Bank Bill SpreadsSpread to overnight indexed swaps
1-month
3-month
6-month
Sources: ASX; Tullett Prebon (Australia)
Major Banks’ Bond Pricing3–5 year residual maturity, Australian dollar bonds
Yields
20132008 20181
4
7
%
AGS
Swap
Unsecured
Bank bond spreads
20132008 20180
100
200
bps
Spreadto AGS
Spread to swap
Sources: Bloomberg; UBS AG, Australia Branch
New issuance of residential mortgage-backed securities (RMBS) in 2017 was its highest in 10 years (Graph 4.8). Issuance was driven by smaller banks and non-bank originators. Market conditions have been relatively strong with
R E S E R V E B A N K O F AU S T R A L I A4 6
broader improvement in conditions in short-term funding markets.
The implied spread between lending rates and debt funding costs for the banks is estimated to have been stable in recent months.
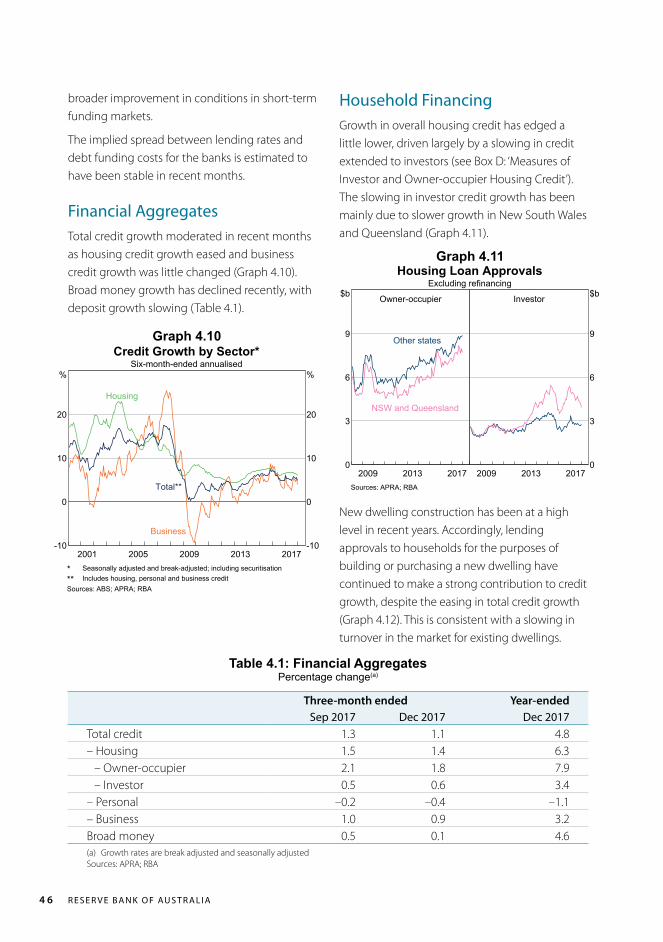
Financial AggregatesTotal credit growth moderated in recent months as housing credit growth eased and business credit growth was little changed (Graph 4.10). Broad money growth has declined recently, with deposit growth slowing (Table 4.1).
Household FinancingGrowth in overall housing credit has edged a little lower, driven largely by a slowing in credit extended to investors (see Box D: ‘Measures of Investor and Owner-occupier Housing Credit’). The slowing in investor credit growth has been mainly due to slower growth in New South Wales and Queensland (Graph 4.11).
Graph 4.10
Graph 4.11
2013200920052001 2017-10
0
10
20
%
-10
0
10
20
%
Credit Growth by Sector*Six-month-ended annualised
Business
Housing
Total**
* Seasonally adjusted and break-adjusted; including securitisation** Includes housing, personal and business creditSources: ABS; APRA; RBA
Housing Loan ApprovalsExcluding refinancing
Owner-occupier
20132009 20170
3
6
9
$b
NSW and Queensland
Other states
Investor
20132009 20170
3
6
9
$b
Sources: APRA; RBA
Table 4.1: Financial AggregatesPercentage change(a)
Three-month ended Year-endedSep 2017 Dec 2017 Dec 2017
Total credit 1.3 1.1 4.8– Housing 1.5 1.4 6.3
– Owner-occupier 2.1 1.8 7.9– Investor 0.5 0.6 3.4
– Personal –0.2 –0.4 –1.1– Business 1.0 0.9 3.2Broad money 0.5 0.1 4.6(a) Growth rates are break adjusted and seasonally adjustedSources: APRA; RBA
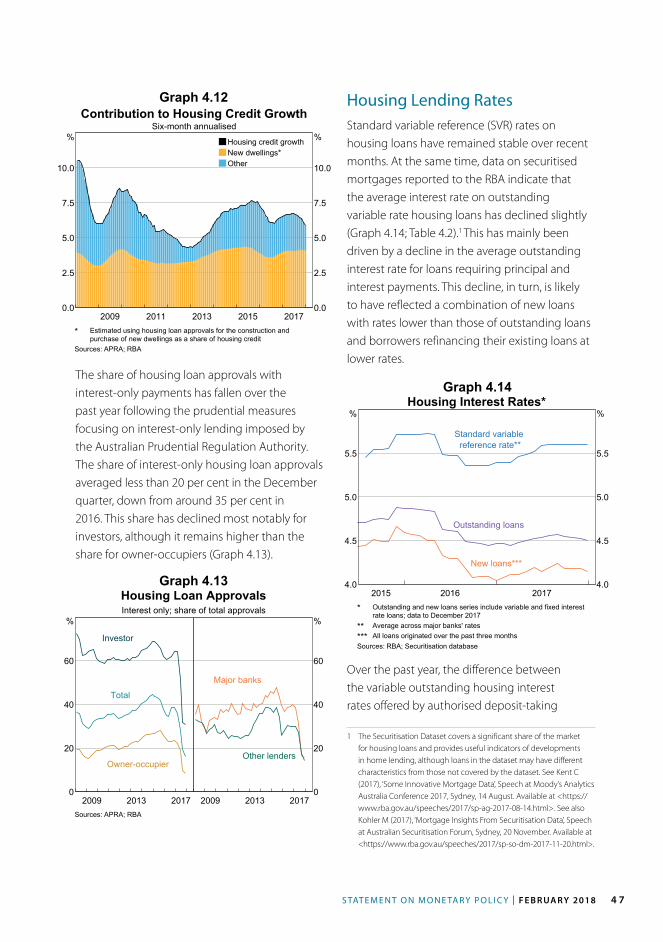
New dwelling construction has been at a high level in recent years. Accordingly, lending approvals to households for the purposes of building or purchasing a new dwelling have continued to make a strong contribution to credit growth, despite the easing in total credit growth (Graph 4.12). This is consistent with a slowing in turnover in the market for existing dwellings.
S TAT E M E N T O N M O N E TA R Y P O L I C Y | F E B R UA R Y 2018 4 7
Housing Lending RatesStandard variable reference (SVR) rates on housing loans have remained stable over recent months. At the same time, data on securitised mortgages reported to the RBA indicate that the average interest rate on outstanding variable rate housing loans has declined slightly (Graph 4.14; Table 4.2).1 This has mainly been driven by a decline in the average outstanding interest rate for loans requiring principal and interest payments. This decline, in turn, is likely to have reflected a combination of new loans with rates lower than those of outstanding loans and borrowers refinancing their existing loans at lower rates.
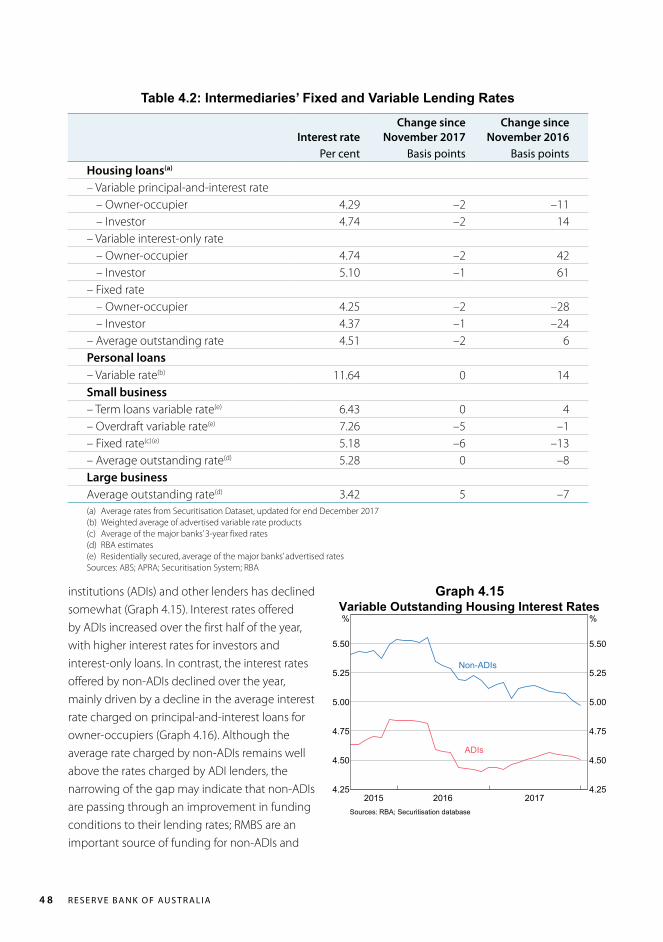
Over the past year, the difference between the variable outstanding housing interest rates offered by authorised deposit-taking
1 The Securitisation Dataset covers a significant share of the market for housing loans and provides useful indicators of developments in home lending, although loans in the dataset may have different characteristics from those not covered by the dataset. See Kent C (2017), ‘Some Innovative Mortgage Data’, Speech at Moody’s Analytics Australia Conference 2017, Sydney, 14 August. Available at <https://www.rba.gov.au/speeches/2017/sp-ag-2017-08-14.html>. See also Kohler M (2017), ‘Mortgage Insights From Securitisation Data’, Speech at Australian Securitisation Forum, Sydney, 20 November. Available at <https://www.rba.gov.au/speeches/2017/sp-so-dm-2017-11-20.html>.
Graph 4.12
Graph 4.13
Housing credit growthNew dwellings*Other
2015201320112009 20170.0
2.5
5.0
7.5
10.0
%
0.0
2.5
5.0
7.5
10.0
%
Contribution to Housing Credit GrowthSix-month annualised
* Estimated using housing loan approvals for the construction andpurchase of new dwellings as a share of housing credit
Sources: APRA; RBA
Housing Loan ApprovalsInterest only; share of total approvals
20132009 20170
20
40
60
%
Total
Owner-occupier
Investor
20132009 20170
20
40
60
%
Other lenders
Major banks
Sources: APRA; RBA
The share of housing loan approvals with interest-only payments has fallen over the past year following the prudential measures focusing on interest-only lending imposed by the Australian Prudential Regulation Authority. The share of interest-only housing loan approvals averaged less than 20 per cent in the December quarter, down from around 35 per cent in 2016. This share has declined most notably for investors, although it remains higher than the share for owner-occupiers (Graph 4.13).
Graph 4.14
2015 2016 20174.0
4.5
5.0
5.5
%
4.0
4.5
5.0
5.5
%Housing Interest Rates*
Outstanding loans
New loans***
Standard variablereference rate**
* Outstanding and new loans series include variable and fixed interestrate loans; data to December 2017** Average across major banks' rates*** All loans originated over the past three months
Sources: RBA; Securitisation database
R E S E R V E B A N K O F AU S T R A L I A4 8
Table 4.2: Intermediaries’ Fixed and Variable Lending Rates
Interest rateChange since
November 2017Change since
November 2016 Per cent Basis points Basis points
Housing loans(a)
– Variable principal-and-interest rate– Owner-occupier 4.29 –2 –11– Investor 4.74 –2 14
– Variable interest-only rate– Owner-occupier 4.74 –2 42– Investor 5.10 –1 61
– Fixed rate– Owner-occupier 4.25 –2 –28– Investor 4.37 –1 –24
– Average outstanding rate 4.51 –2 6Personal loans– Variable rate(b) 11.64 0 14Small business– Term loans variable rate(e) 6.43 0 4– Overdraft variable rate(e) 7.26 –5 –1– Fixed rate(c) (e) 5.18 –6 –13– Average outstanding rate(d) 5.28 0 –8Large businessAverage outstanding rate(d) 3.42 5 –7(a) Average rates from Securitisation Dataset, updated for end December 2017 (b) Weighted average of advertised variable rate products (c) Average of the major banks’ 3-year fixed rates (d) RBA estimates (e) Residentially secured, average of the major banks’ advertised ratesSources: ABS; APRA; Securitisation System; RBA
Graph 4.15
2015 2016 20174.25
4.50
4.75
5.00
5.25
5.50
%
4.25
4.50
4.75
5.00
5.25
5.50
%Variable Outstanding Housing Interest Rates
Non-ADIs
ADIs
Sources: RBA; Securitisation database
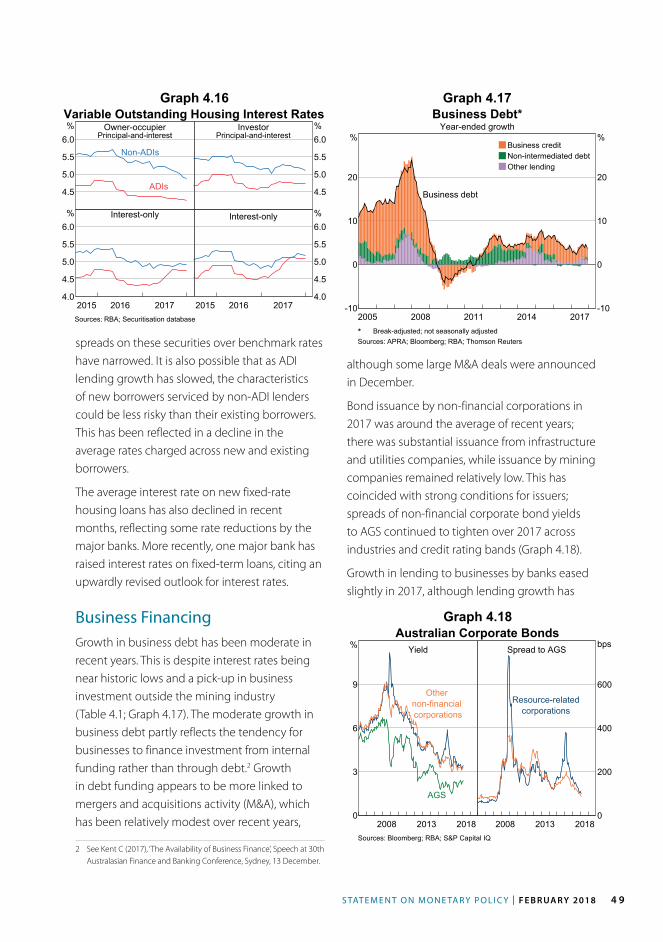
institutions (ADIs) and other lenders has declined somewhat (Graph 4.15). Interest rates offered by ADIs increased over the first half of the year, with higher interest rates for investors and interest-only loans. In contrast, the interest rates offered by non-ADIs declined over the year, mainly driven by a decline in the average interest rate charged on principal-and-interest loans for owner-occupiers (Graph 4.16). Although the average rate charged by non-ADIs remains well above the rates charged by ADI lenders, the narrowing of the gap may indicate that non-ADIs are passing through an improvement in funding conditions to their lending rates; RMBS are an important source of funding for non-ADIs and
S TAT E M E N T O N M O N E TA R Y P O L I C Y | F E B R UA R Y 2018 4 9
Graph 4.16 Graph 4.17Variable Outstanding Housing Interest Rates
Owner-occupierPrincipal-and-interest
4.5
5.0
5.5
6.0%
ADIs
Non-ADIs
InvestorPrincipal-and-interest
4.5
5.0
5.5
6.0%
Interest-only
2015 2016 20174.0
4.5
5.0
5.5
6.0% Interest-only
2015 2016 20174.0
4.5
5.0
5.5
6.0%
Sources: RBA; Securitisation database
Business creditNon-intermediated debtOther lending
2014201120082005 2017-10
0
10
20
%
-10
0
10
20
%
Business Debt*Year-ended growth
Business debt
* Break-adjusted; not seasonally adjustedSources: APRA; Bloomberg; RBA; Thomson Reutersspreads on these securities over benchmark rates
have narrowed. It is also possible that as ADI lending growth has slowed, the characteristics of new borrowers serviced by non-ADI lenders could be less risky than their existing borrowers. This has been reflected in a decline in the average rates charged across new and existing borrowers.
The average interest rate on new fixed-rate housing loans has also declined in recent months, reflecting some rate reductions by the major banks. More recently, one major bank has raised interest rates on fixed-term loans, citing an upwardly revised outlook for interest rates.
Business FinancingGrowth in business debt has been moderate in recent years. This is despite interest rates being near historic lows and a pick-up in business investment outside the mining industry (Table 4.1; Graph 4.17). The moderate growth in business debt partly reflects the tendency for businesses to finance investment from internal funding rather than through debt.2 Growth in debt funding appears to be more linked to mergers and acquisitions activity (M&A), which has been relatively modest over recent years,
2 See Kent C (2017), ‘The Availability of Business Finance’, Speech at 30th Australasian Finance and Banking Conference, Sydney, 13 December.
although some large M&A deals were announced in December.
Bond issuance by non-financial corporations in 2017 was around the average of recent years; there was substantial issuance from infrastructure and utilities companies, while issuance by mining companies remained relatively low. This has coincided with strong conditions for issuers; spreads of non-financial corporate bond yields to AGS continued to tighten over 2017 across industries and credit rating bands (Graph 4.18).
Growth in lending to businesses by banks eased slightly in 2017, although lending growth has
Graph 4.18Australian Corporate BondsYield
20132008 20180
3
6
9
%
AGS
Othernon-financialcorporations
Spread to AGS
20132008 20180
200
400
600
bps
Resource-relatedcorporations
Sources: Bloomberg; RBA; S&P Capital IQ
R E S E R V E B A N K O F AU S T R A L I A5 0
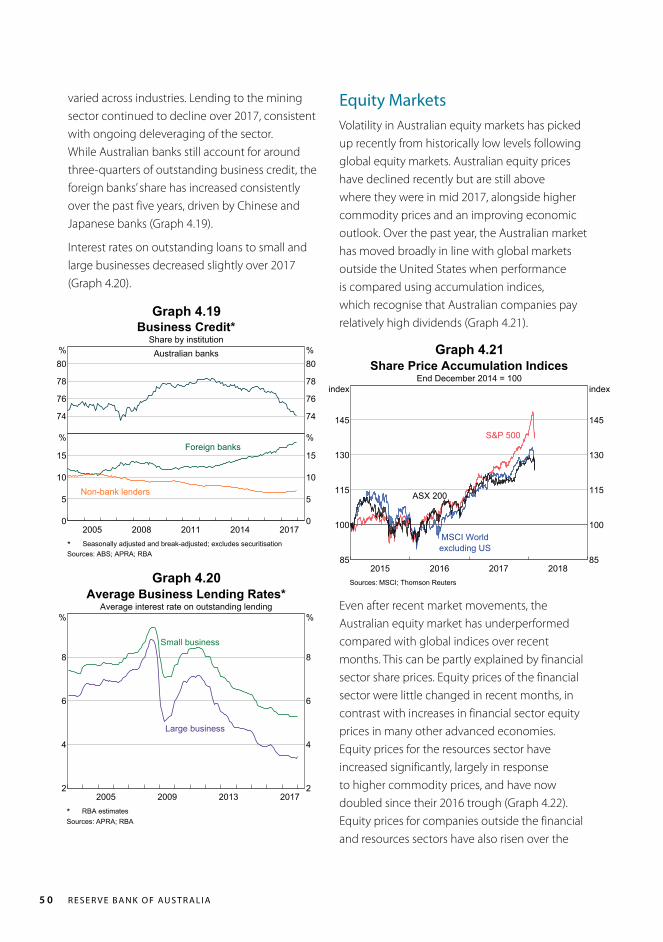
varied across industries. Lending to the mining sector continued to decline over 2017, consistent with ongoing deleveraging of the sector. While Australian banks still account for around three-quarters of outstanding business credit, the foreign banks’ share has increased consistently over the past five years, driven by Chinese and Japanese banks (Graph 4.19).
Interest rates on outstanding loans to small and large businesses decreased slightly over 2017 (Graph 4.20).
Equity MarketsVolatility in Australian equity markets has picked up recently from historically low levels following global equity markets. Australian equity prices have declined recently but are still above where they were in mid 2017, alongside higher commodity prices and an improving economic outlook. Over the past year, the Australian market has moved broadly in line with global markets outside the United States when performance is compared using accumulation indices, which recognise that Australian companies pay relatively high dividends (Graph 4.21).
Graph 4.19
Graph 4.20
Graph 4.21Business Credit*Share by institutionAustralian banks
74
76
78
80%
74
76
78
80%
2014201120082005 20170
5
10
15
%
0
5
10
15
%Foreign banks
Non-bank lenders
* Seasonally adjusted and break-adjusted; excludes securitisationSources: ABS; APRA; RBA
201320092005 20172
4
6
8
%
2
4
6
8
%
Average Business Lending Rates*Average interest rate on outstanding lending
Small business
Large business
* RBA estimatesSources: APRA; RBA
201720162015 201885
100
115
130
145
index
85
100
115
130
145
index
Share Price Accumulation IndicesEnd December 2014 = 100
S&P 500
ASX 200
MSCI Worldexcluding US
Sources: MSCI; Thomson Reuters
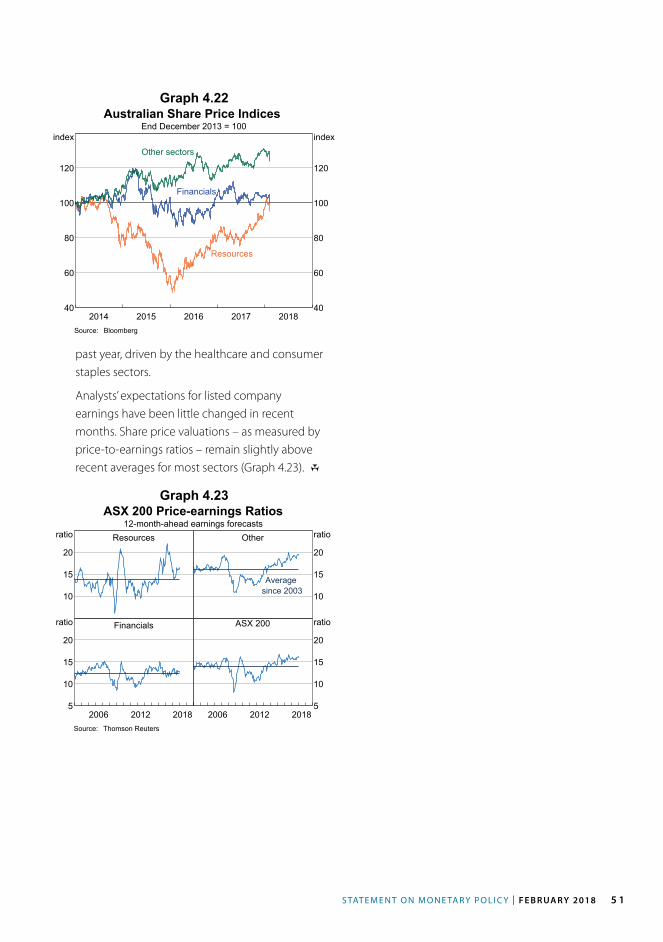
Even after recent market movements, the Australian equity market has underperformed compared with global indices over recent months. This can be partly explained by financial sector share prices. Equity prices of the financial sector were little changed in recent months, in contrast with increases in financial sector equity prices in many other advanced economies. Equity prices for the resources sector have increased significantly, largely in response to higher commodity prices, and have now doubled since their 2016 trough (Graph 4.22). Equity prices for companies outside the financial and resources sectors have also risen over the
S TAT E M E N T O N M O N E TA R Y P O L I C Y | F E B R UA R Y 2018 5 1
Graph 4.22
Graph 4.23
2017201620152014 201840
60
80
100
120
index
40
60
80
100
120
index
Australian Share Price IndicesEnd December 2013 = 100
Resources
Financials
Other sectors
Source: Bloomberg
ASX 200 Price-earnings Ratios12-month-ahead earnings forecasts
Resources
10
15
20
ratio Other
10
15
20
ratio
Averagesince 2003
Financials
20122006 20185
10
15
20
ratio ASX 200
20122006 20185
10
15
20
ratio
Source: Thomson Reuters
past year, driven by the healthcare and consumer staples sectors.
Analysts’ expectations for listed company earnings have been little changed in recent months. Share price valuations – as measured by price-to-earnings ratios – remain slightly above recent averages for most sectors (Graph 4.23). R