Embed Size (px)
Citation preview
Domestic Tourism Survey 2015
THE SOUTH AFRICA I KNOW, THE HOME I UNDERSTAND
www.statssa.gov.za [email protected] T +27 12 310 8911 F +27 12 310 8500 Private Bag X44, Pretoria, 0001, South Africa ISIbalo House, Koch Street, Salvokop, Pretoria, 0002
STATISTICAL RELEASE P0352.1
Domestic Tourism Survey 2015
January to December 2015
Embargoed until: 16 March 2017
13:30 FORTHCOMING ISSUE: EXPECTED RELEASE DATE DTS 2016 September 2017
STATISTICS SOUTH AFRICA P0352.1
Domestic Tourism Survey, 2015
i
User Information Services Tel: 012 310 8600/4892 /8390 Published by Statistics South Africa, Private Bag X44, Pretoria 0001 © Statistics South Africa, 2017 Users may apply or process this data, provided Statistics South Africa (Stats SA) is acknowledged as the original source of the data; that it is specified that the application and/or analysis is the result of the user's independent processing of the data; and that neither the basic data nor any reprocessed version or application thereof may be sold or offered for sale in any form whatsoever without prior permission from Stats SA. A complete set of Stats SA publications is available at Stats SA Library and the following libraries: National Library of South Africa, Pretoria Division National Library of South Africa, Cape Town Division Library of Parliament, Cape Town Bloemfontein Public Library Natal Society Library, Pietermaritzburg Johannesburg Public Library Eastern Cape Library Services, King William's Town Central Regional Library, Polokwane Central Reference Library, Mbombela Central Reference Collection, Kimberley Central Reference Library, Mmabatho This publication is available both in hard copy and on the Stats SA website www.statssa.gov.za The data and metadata set from the Domestic Tourism Survey, 2015 will be available on CD-ROM. A charge may be made according to the pricing policy, which can be seen on the website. Stats SA also provides a subscription service. Technical enquiries: Brenda Mosima Email: [email protected]
STATISTICS SOUTH AFRICA P0352.1
Domestic Tourism Survey, 2015
ii
Contents
1. Introduction and methodology ............................................................................................................... 1
1.1 Background .............................................................................................................................................. 1
1.2 Objectives of the survey .......................................................................................................................... 4
1.3 Target population and sample ................................................................................................................. 4
2. Summary of key findings of the Domestic Tourism Survey 2015 ...................................................... 4
3. Definitions ................................................................................................................................................ 6
4. Number and types of trips ...................................................................................................................... 8
4.1 Total number of day and overnight trips inside South Africa ................................................................... 8
4.2 Analysis of tourism patterns by province of destination ........................................................................ 20
4.3 Analysis by main purpose of the trip ...................................................................................................... 30
4.4 Analysis by main mode of transport for the trip ..................................................................................... 39
4.5 Analysis of travelling patterns of different population groups ................................................................ 41
4.6 General activities related to trips ........................................................................................................... 53
4.7 Analysis of trip-taking patterns of different LSM groups ........................................................................ 59
5. Technical notes ...................................................................................................................................... 65
5.1 Response details ................................................................................................................................... 65
5.2 Survey requirements.............................................................................................................................. 65
5.3 Sample design ....................................................................................................................................... 65
5.4 Weighting ............................................................................................................................................... 66
5.5 Estimation .............................................................................................................................................. 68
5.6 Limitations to the study .......................................................................................................................... 69
5.7 Non-response adjustment ..................................................................................................................... 69
5.8 Benchmarking ........................................................................................................................................ 69
5.9 Editing and imputation ........................................................................................................................... 69
STATISTICS SOUTH AFRICA P0352.1
Domestic Tourism Survey, 2015
iii
List of tables in the key findings
Table 1: Primary differences between the SAT and Stats SA domestic tourism surveys ........................ 3
Table 2a: Total number of day and overnight trips taken during the period January–December, 2013, 2014 and 2015 ................................................................................. 8
Table 2b: Total number of day trips taken during the period January–December, 2013, 2014 and 2015 ..................................................................................................................................... 8
Table 2c: Total number of overnight trips taken during the period January–December, 2013, 2014 and 2015 ............................................................................................................................ 9
Table 3a: Total expenditure on domestic day and overnight trips (R'000), January–December, 2013, 2014 and 2015 ................................................................................. 9
Table 3b: Total expenditure on domestic day trips (R'000) by month, January–December, 2013, 2014 and 2015 ................................................................................................................ 10
Table 3c: Total expenditure on domestic overnight trips (R'000) by month, January–December, 2013, 2014 and 2015 ............................................................................... 11
Table 4a: Number of most recent person day and overnight trips, January–December, 2013, 2014 and 2015 .......................................................................................................................... 15
Table 4b: Most recent person day trips, January–December, 2013, 2014 and 2015 ............................... 15
Table 4c: Most recent person overnight trips, January–December, 2013, 2014 and 2015 ...................... 16
Table 5: Length of stay for the most recent person overnight trip, 2013, 2014 and 2015 ...................... 16
Table 6: Most recent trips taken by the respondent and other household members, 2013, 2014 and 2015 .......................................................................................................................... 17
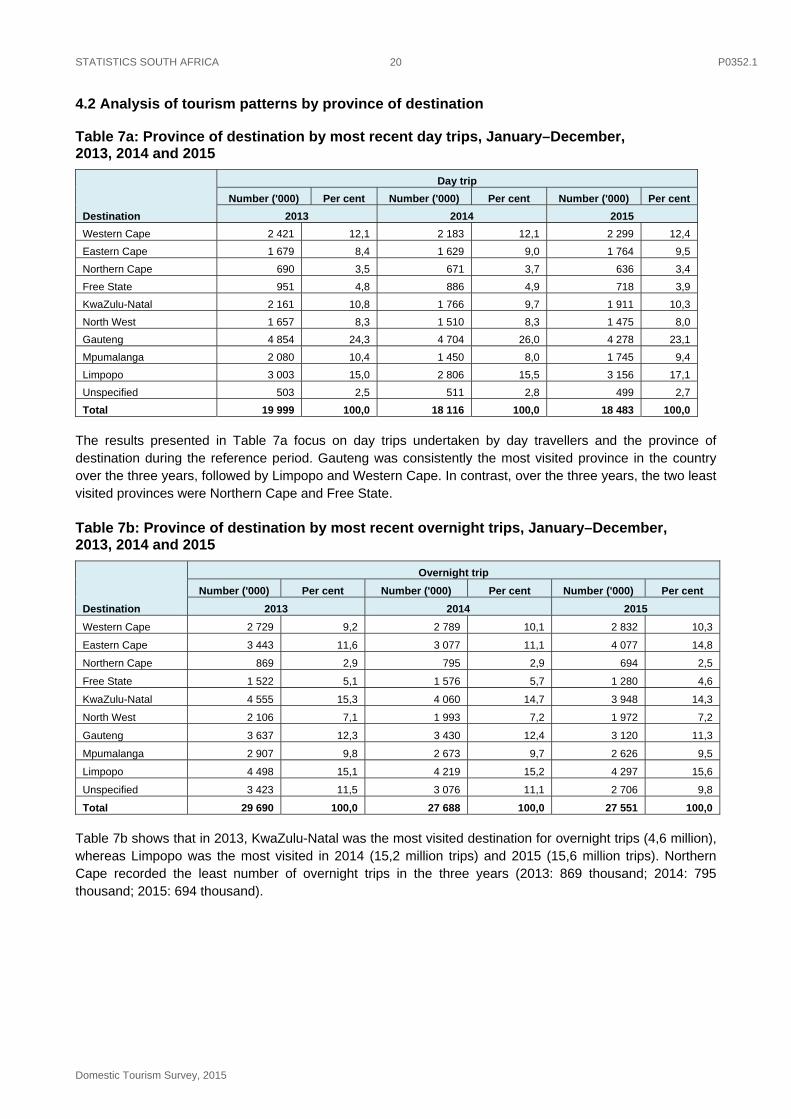
Table 7a: Province of destination by most recent day trips, January–December, 2013, 2014 and 2015 ................................................................................................................................... 20
Table 7b: Province of destination by most recent overnight trips, January–December, 2013, 2014 and 2015 .......................................................................................................................... 20
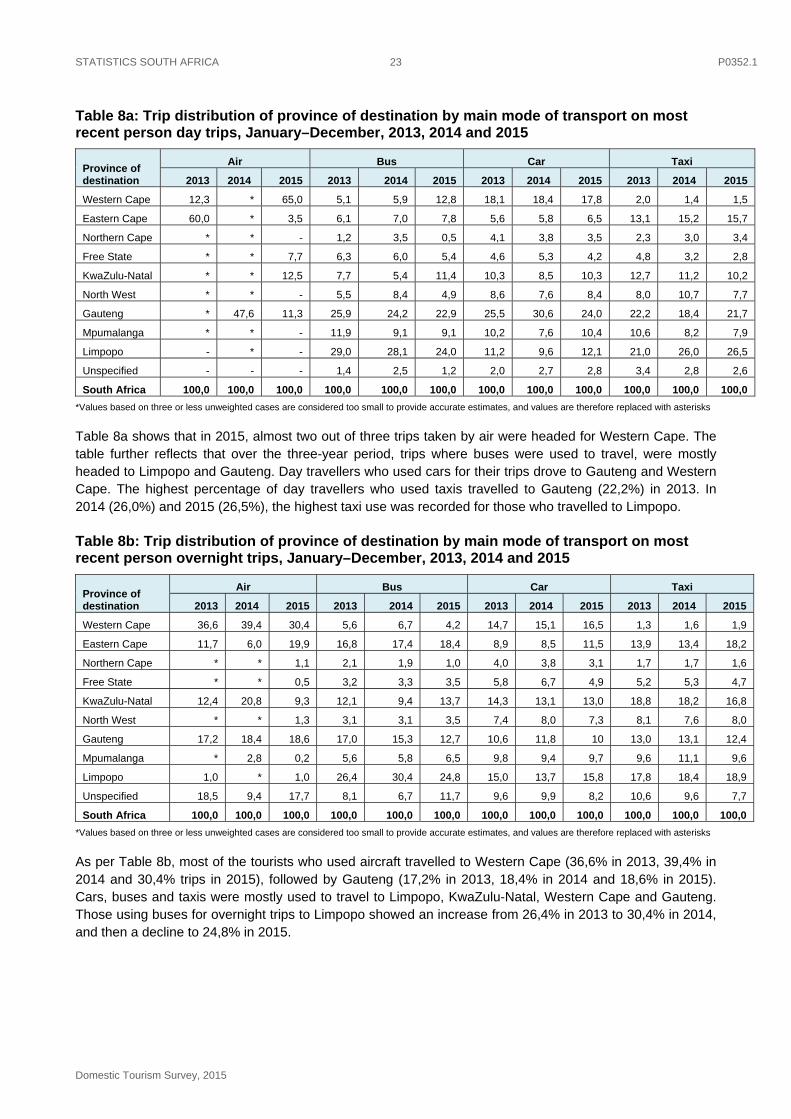
Table 8a: Trip distribution of province of destination by main mode of transport on most recent person day trips, January–December, 2013, 2014 and 2015 ........................................ 23
Table 8b: Trip distribution of province of destination by main mode of transport on most recent person overnight trips, January–December, 2013, 2014 and 2015 ............................... 23
Table 9: Province of destination by main purpose of most recent day trips, 2015 ................................. 24
Table 10: Province of destination by main purpose of most recent overnight trips, 2015 ........................ 25
Table 11: Province of destination for most recent overnight trips by principal type of accommodation utilised, January–December, 2015 ................................................................. 26
Table 12: Province of destination by length of stay on most recent overnight trips, 2015 ........................ 28
Table 13a: Main purpose of most recent day trips by type of trip, January–December, 2013, 2014 and 2015 .......................................................................................................................... 30
Table 13b: Main purpose of most recent overnight trips by type of trip, January–December, 2013, 2014 and 2015 ................................................................................................................ 31
Table 14a: Main purpose of most recent day trips by main mode of transport used, January–December, 2013, 2014 and 2015 ............................................................................... 33
Table 14b: Main purpose of most recent overnight trips by main mode of transport used, January–December, 2013, 2014 and 2015 ............................................................................... 34
Table 15: Main purpose of most recent overnight trips by length of stay, January–December, 2015 .......................................................................................................................................... 35
Table 16a: Main purpose of most recent day trips by expenditure (R'000), January–December, 2013, 2014 and 2015 ................................................................................................................ 36
Table 16b: Main purpose of most recent overnight trips by expenditure (R'000), January–December, 2013, 2014 and 2015 ............................................................................... 38
STATISTICS SOUTH AFRICA P0352.1
Domestic Tourism Survey, 2015
iv
Table 17: Main mode of transport by most recent type of trip, 2013, 2014 and 2015 .............................. 39
Table 18: Main mode of transport used to undertake overnight trip by principal type of accommodation, January–December, 2013, 2014 and 2015 ................................................... 40
Table 19: Population group by most recent type of trip, 2015 .................................................................. 41
Table 20a: Population group by main purpose of the most recent day trip, 2015 ...................................... 43
Table 20b: Population group by main purpose of the most recent overnight trip, 2015 ............................. 43
Table 21: Population group by province of destination of the most recent type of trip, 2015 ................... 44
Table 22: Population group by number of trips per individual, January–December, 2015 ....................... 46
Table 23: Population group by expenditure (R'000) on most recent trips, January–December, 2015 .......................................................................................................................................... 47
Table 24: Population group by average expenditure on most recent day and overnight trips, January–December, 2015 ......................................................................................................... 48
Table 25a: Demographic analysis by most recent person day trips, January–December, 2013, 2014 and 2015 .......................................................................................................................... 49
Table 25b: Demographic analysis by most recent person overnight trips, January–December, 2013, 2014 and 2015 ................................................................................................................ 50
Table 26a: Activities, other than the main activity during the most recent day trip, January–December, 2013–2015 ............................................................................................... 53
Table 26b: Activities, other than the main activity during the most recent overnight trip, January–December, 2013–2015 ............................................................................................... 55
Table 27: Booking patterns by main purpose of most recent overnight trips, January–December, 2015 ......................................................................................................... 56
Table 28a: Reasons given for not taking day trips, 2013–2015 .................................................................. 57
Table 28b: Reasons given for not taking overnight trips, January–December, 2013–2015 ....................... 58
Table 29: LSM group by type of trip, January–December, 2015 .............................................................. 59
Table 30: LSM groups by length of stay during most recent overnight trips, January–December, 2015 ......................................................................................................... 61
Table 31: LSM groups by expenditure (R'000) on most recent day and overnight trips, January–December, 2015 ......................................................................................................... 62
Table 32: Number of most recent trips per broad LSM group by main mode of transport, January–December, 2015 ......................................................................................................... 64
STATISTICS SOUTH AFRICA P0352.1
Domestic Tourism Survey, 2015
v
Appendix tables
1. Population .......................................................................................................................................... 71
1.1 Province by population group and gender ('000) ................................................................................ 71
1.2 Age group ('000) by population group and gender .............................................................................. 72
2. Education ........................................................................................................................................... 73
2.1 Population aged 18 years and older ('000) by highest level of education and province ..................... 73
2.2 Population aged 18 years and older ('000) by highest level of education, population group and gender .......................................................................................................................................... 74
3. Day or overnight ................................................................................................................................ 75
3.1 Number of most recent trips taken in South Africa during the twelve-month reference period by type of trip and province of origin, January–December, 2015............................................. 75
3.2 Number of most recent trips in South Africa during the twelve-month reference period by number of day trips and province of origin, January–December, 2015 .............................................. 76
3.3 Number of most recent trips in South Africa during the twelve-month reference period by number of overnight trips and province of origin, January–December, 2015 ..................................... 77
3.4 Number of most recent trips in South Africa during the twelve-month reference period by province of origin and gender, January–December, 2015 .................................................................. 78
3.5 Number of most recent day trips ('000) in South Africa during the twelve-month reference period by month of the trip, province of origin and gender, January–December, 2015 ...................... 79
3.6 Number of most recent overnight trips ('000) in South Africa during the twelve-month reference period by month of the trip, province of origin and gender, January–December, 2015 ................................................................................................................... 81
3.7 Number of most recent day trips ('000) in South Africa during the twelve-month reference period by month of the trip, province of destination and gender, January–December, 2015 ............. 83
3.8 Number of most recent overnight trips ('000) in South Africa during the twelve-month reference period by month of the trip, province of destination and gender, January–December, 2015 ................................................................................................................... 85
3.9 Number of most recent day trips ('000) in South Africa during the twelve-month reference period by month of the trip and purpose of trip, January–December, 2015 ........................................ 87
3.10 Number of most recent overnight trips ('000) in South Africa during the twelve-month reference period by month of the trip and purpose of trip, January–December, 2015 ....................... 88
4. Origin and main destination of trips ............................................................................................... 89
4.1 Number of most recent day trips ('000) in South Africa during the twelve-month reference period by province of origin and of destination, January–December, 2015 ........................................ 89
4.2 Number of most recent overnight trips ('000) in South Africa during the twelve-month reference period by province of origin and of destination, January–December, 2015 ........................ 90
5. Main purpose of trip and destination .............................................................................................. 91
5.1 Number of most recent day trips ('000) in South Africa during the twelve-month reference period by main purpose of trip and province of destination, January–December, 2015 ..................... 91
5.2 Number of most recent overnight trips ('000) in South Africa during the twelve-month reference period by main purpose of trip and province of destination, January–December, 2015 ................................................................................................................... 92
6. Mode of transport .............................................................................................................................. 93
6.1 Number of most recent day trips ('000) in South Africa during the twelve-month reference period by mode of transport and province of destination, January–December, 2015 ........................ 93
6.2 Number of most recent overnight trips ('000) in South Africa during the twelve-month reference period by mode of transport and province of destination, January–December, 2015 ................................................................................................................... 94
STATISTICS SOUTH AFRICA P0352.1
Domestic Tourism Survey, 2015
vi
6.3 Main mode of transport ('000) used during the most recent overnight trip by principal type of accommodation, January–December, 2015 ................................................................................... 95
6.4 Main mode of transport ('000) by month of most recent trip, January–December, 2015 .................... 96
7. Main purpose ..................................................................................................................................... 97
7.1 Main purpose ('000) of most recent day trip by month of trip, January–December, 2015 .................. 97
7.2 Main purpose ('000) of most recent overnight trip by month of trip, January–December, 2015 ................................................................................................................... 98
8. Population group ............................................................................................................................... 99
8.1 Population group ('000) by principal type of accommodation on the most recent overnight trips, January–December, 2015 .......................................................................................................... 99
8.2 Population group (per cent) by length of stay on the most recent overnight trip, January–December, 2015 ................................................................................................................. 100
8.3 Population group ('000) by month of the most recent trip, January–December, 2015 ..................... 101
9. Demographic analysis .................................................................................................................... 102
9.1 Demographic analysis by main purpose of the most recent day trips (per cent), January–December, 2015 ................................................................................................................. 102
9.2 Demographic analysis by main purpose of the most recent overnight trips (per cent), January–December, 2015 ................................................................................................................. 104
9.3 Demographic analysis by length of stay on the most recent trips ('000), January–December, 2015 ................................................................................................................. 106
9.4 Demographic analysis by principal type of accommodation for most recent overnight trips ('000), January–December, 2015 ...................................................................................................... 108
9.5 Demographic analysis by month of trip for most recent day trips ('000), January–December, 2015 ................................................................................................................. 110
9.6 Demographic analysis by month of trip for most recent overnight trips ('000), January–December, 2015 ................................................................................................................. 112
10. Living Standards Measure groups ................................................................................................ 114
10.1 LSM groups ('000) by principal type of accommodation used during the most recent overnight trip, January–December, 2015 .......................................................................................... 114
11. Expenditure ...................................................................................................................................... 115
11.1 Province of destination by average expenditure (R) on most recent day and overnight trips, January–December, 2015 ........................................................................................................ 115
11.2 Province of destination by expenditure ('000) on most recent day and overnight trips, January–December, 2015 ................................................................................................................. 116
11.2 Province of destination by expenditure ('000) on most recent day and overnight trips, January–December, 2015 (concluded) ............................................................................................. 117
STATISTICS SOUTH AFRICA P0352.1
Domestic Tourism Survey, 2015
vii
List of figures in the key findings
Figure 1a: Percentage of total day trips by province of destination, January–December, 2015 ................ 13
Figure 1b: Percentage of total overnight trips by province of destination, January–December, 2015 ......................................................................................................................................... 14
Figure 2a: Percentage distribution of province of origin, by province of destination for total day trips, January–December, 2015 ............................................................................................... 18
Figure 2b: Percentage distribution of province of origin, by province of destination for total overnight trips, January–December, 2015 ............................................................................... 19
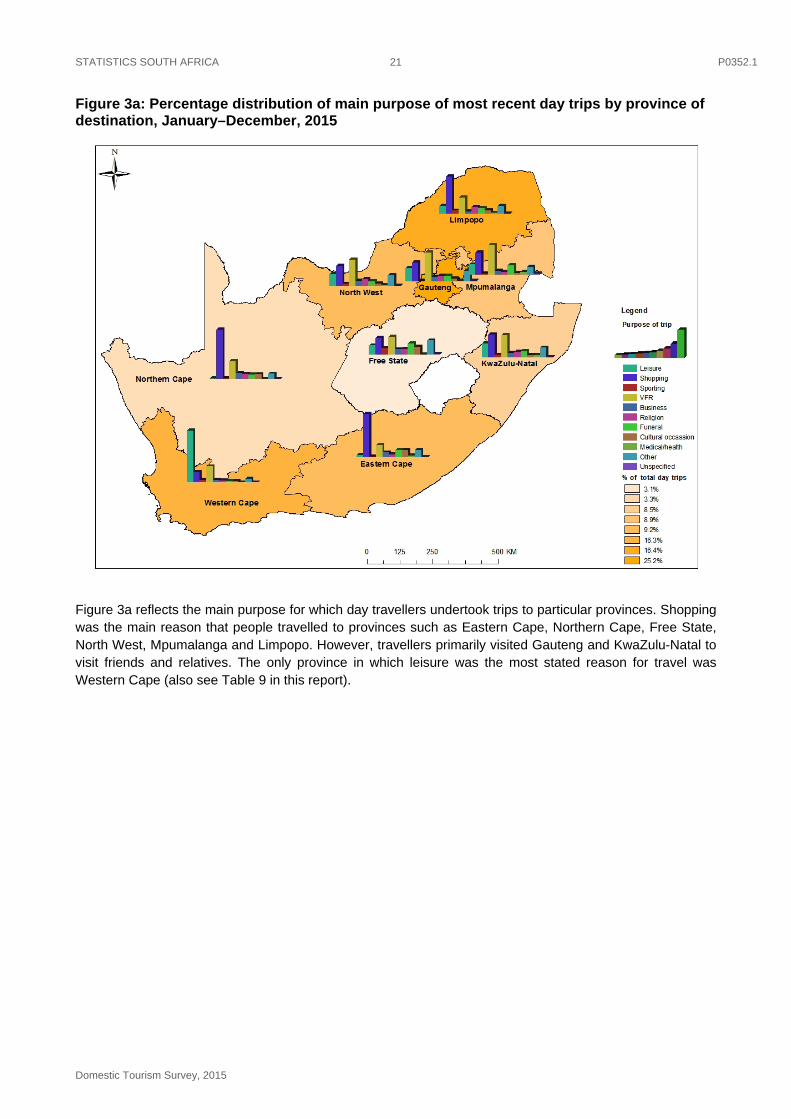
Figure 3a: Percentage distribution of main purpose of most recent day trips by province of destination, January–December, 2015 .................................................................................... 21
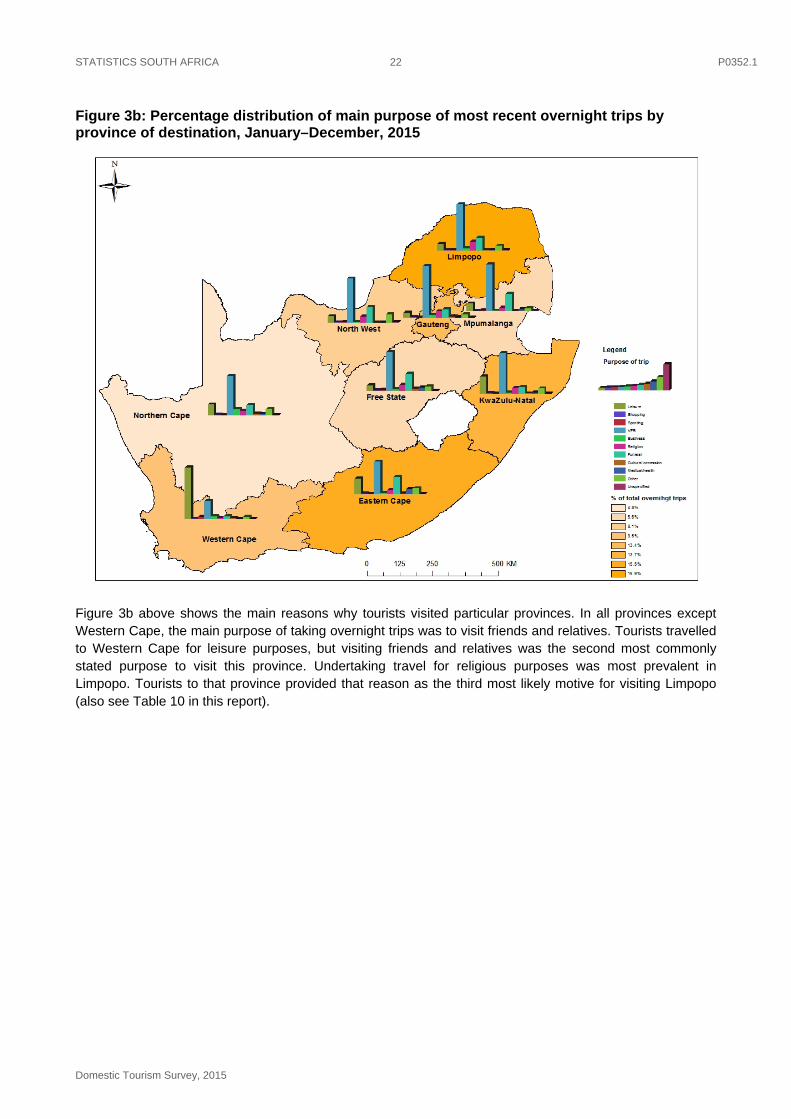
Figure 3b: Percentage distribution of main purpose of most recent overnight trips by province of destination, January–December, 2015 .................................................................................... 22
Figure 4a: Percentage of average spend per expenditure category for most recent day trips by province of destination, January–December, 2015 ................................................................. 27
Figure 4b: Percentage of average spend per expenditure category for most recent overnight trips by province of destination, January–December, 2015 ............................................................ 28
Figure 5: Main purpose of most recent overnight trips by months of trips, January–December, 2015 (per cent) ......................................................................................................................... 32
Figure 6: Main mode of transport by type of accommodation on most recent overnight trips, January–December, 2015 (per cent) ....................................................................................... 41
Figure 7: Percentage of spend on most recent overnight trips by population groups at province of destination, January–December, 2015 ................................................................................ 45
Figure 8: Selected demographic groups by purpose of most recent day and overnight trips, January–December, 2015 (per cent) ....................................................................................... 51
Figure 9: Percentage of spend on most recent day and overnight trips per selected demographic group, January–December, 2015 (per cent) ............................................................................ 52
Figure 10: Broad LSM groups by main purpose of most recent day and overnight trips (per cent), January–December, 2015........................................................................................................ 60
Figure 11: Broad LSM groups by expenditure (per cent) on most recent day and overnight trips, January–December, 2015........................................................................................................ 63
STATISTICS SOUTH AFRICA P0352.1
Domestic Tourism Survey, 2015
1
1. Introduction and methodology
1.1 Background
Tourism is regarded in the National Development Plan (2030) as one of the most important potential drivers of economic growth and job creation in South Africa. Some of the indicators covered by the Domestic Tourism Survey include the total number of trips taken within the borders of the country, expenditure incurred and types of transport used to different destinations within the country. These indicators address the National Tourism Sector Strategy (NTSS) objective, which aims at growing the contribution by domestic tourism to the country’s economy. Again, these indicators will provide a picture on how far the sector is doing in addressing the National Development Plan’s target of increasing the total number of tourists, the average amount of money spent by each tourist and achieving appropriate levels of tourism infrastructure (particularly transport and accommodation) in view of attracting different types of tourists within and/or outside the country.
For a considerable time, Statistics South Africa (Stats SA) has provided data on international tourism, based on secondary data obtained from the Department of Home Affairs (DHA). The information from these data sources continues to be used by a wide variety of stakeholders to measure and understand international tourism in South Africa. Nevertheless, detailed information about national domestic tourism is limited despite its potential role in improving economic and social development. Prior to 2008, Stats SA provided limited data on domestic tourism through the General Household Survey (GHS). A fully-fledged Domestic Tourism Survey (DTS) was introduced in 2008, primarily to meet the needs of National Accounts for the compilation of the Tourism Satellite Account (TSA). South African Tourism (SAT) has been conducting a similar survey, albeit with a greater emphasis on tourism marketing information, since 2001. This particular survey became a monthly survey in 2005.
Given that users became confused with the differences in statistics produced by these two entities, it was decided to rationalise and consolidate them. The Domestic Tourism Task Team (DTTT) was established in 2010, and consisted of representatives of the National Department of Tourism (NDT), Statistics South Africa (Stats SA) and South African Tourism (SAT). The committee is co-chaired by NDT and Stats SA, and its task is to oversee the process of integrating the two existing domestic tourism surveys conducted respectively by Stats SA and SAT. The main deliverable of the task team is to rationalise the collection of tourism statistics by these entities and agree on a single Domestic Tourism Survey (DTS), which takes into account data needs of all the parties and their stakeholders.
The key findings of this survey cover the domestic activities for the period from January to December. In some instances, comparisons have been made from the results of the DTS 2013 to 2015 because all these surveys have the same reference period, which is January to December. In these three surveys, a similar weighting procedure was applied whereby the full sample weights were created separately for each of the monthly files. More details about weighting can be found in Section 5.
In addition to addressing the differences in questionnaire content between the two surveys, Statistics South Africa also had to shorten its recall period, introduce continuous data collection and produce a biannual report in addition to the annual report. Data collection was changed from cross-sectional to continuous in 2013, and this enabled the organisation to not only shorten the recall period, but also to analyse the data of the first six months of data collection for the purposes of producing headline statistics for a biannual report.
Since the continuous data collection methodology was accompanied by significant structural changes in the questionnaire, new editing and imputation systems had to be developed. In addition to these changes, the DTS 2013, 2014 and 2015 reports are also based on the analysis of the most recent trip as in previous DTS reports. However, instead of presenting only the data of the most recent trip in the report, the data were modelled based on the assumption that the information of the most recent trip is representative of all trips taken during a particular quarter. This assumption was made plausible by the fact that the seasonality bias
STATISTICS SOUTH AFRICA P0352.1
Domestic Tourism Survey, 2015
2
present in previous surveys was reduced through continuous collection and a moving three-month recall period.
The primary differences between the two surveys and current status of the work of the DTTT are summarised in Table 1.
STATISTICS SOUTH AFRICA P0352.1
Domestic Tourism Survey, 2015
3
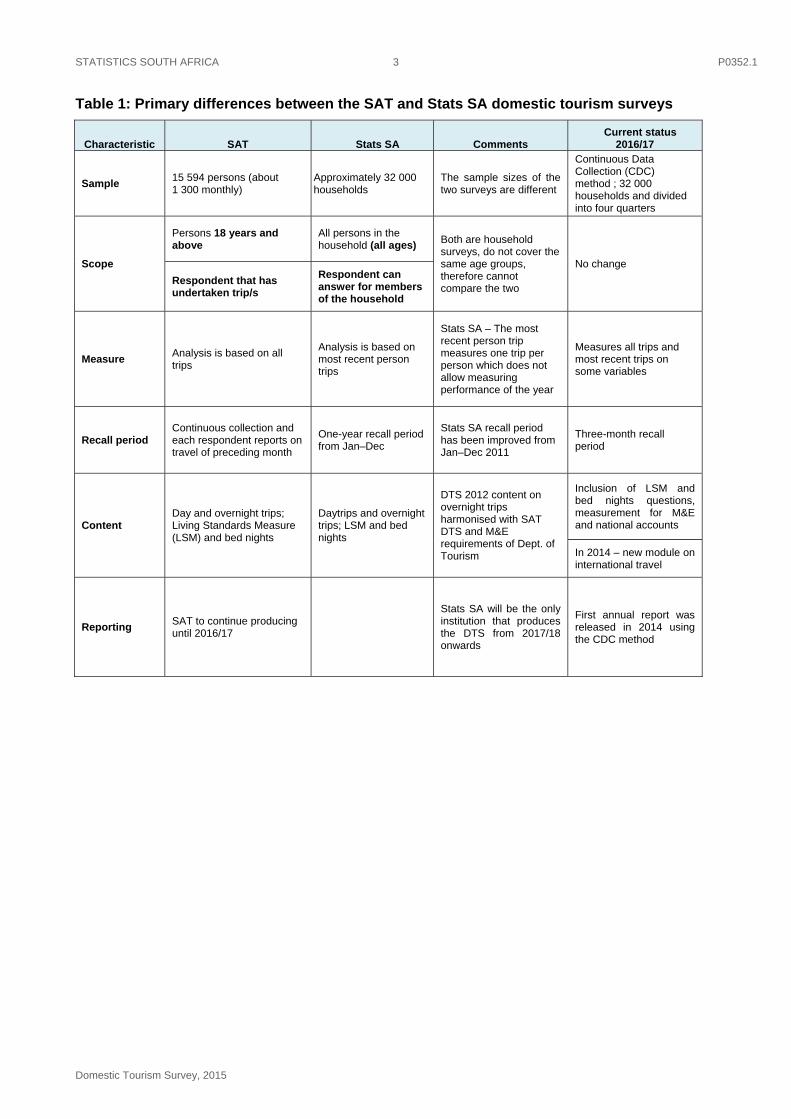
Table 1: Primary differences between the SAT and Stats SA domestic tourism surveys
Characteristic SAT Stats SA Comments Current status
2016/17
Sample 15 594 persons (about 1 300 monthly)
Approximately 32 000 households
The sample sizes of the two surveys are different
Continuous Data Collection (CDC) method ; 32 000 households and divided into four quarters
Scope
Persons 18 years and above
All persons in the household (all ages) Both are household
surveys, do not cover the same age groups, therefore cannot compare the two
No change
Respondent that has undertaken trip/s
Respondent can answer for members of the household
Measure Analysis is based on all trips
Analysis is based on most recent person trips
Stats SA – The most recent person trip measures one trip per person which does not allow measuring performance of the year
Measures all trips and most recent trips on some variables
Recall period Continuous collection and each respondent reports on travel of preceding month
One-year recall period from Jan–Dec
Stats SA recall period has been improved from Jan–Dec 2011
Three-month recall period
Content Day and overnight trips; Living Standards Measure (LSM) and bed nights
Daytrips and overnight trips; LSM and bed nights
DTS 2012 content on overnight trips harmonised with SAT DTS and M&E requirements of Dept. of Tourism
Inclusion of LSM and bed nights questions, measurement for M&E and national accounts
In 2014 – new module on international travel
Reporting SAT to continue producing until 2016/17
Stats SA will be the only institution that produces the DTS from 2017/18 onwards
First annual report was released in 2014 using the CDC method
STATISTICS SOUTH AFRICA P0352.1
Domestic Tourism Survey, 2015
4
1.2 Objectives of the survey
The DTS is a large-scale household survey aimed at collecting accurate statistics on the travel behaviour and expenditure of South African residents travelling within the borders of the country. Such information is crucial in determining the contribution of tourism to the South African economy as well as helping with planning, marketing, policy formulation, and regulation of tourism-related activities.
The key objective of the DTS is to understand the domestic travel behaviour of an average South African resident. Hence, this would include collecting information on:
Domestic day and overnight trips undertaken; Trips by respondents and trips by other household members without the respondent accompanying them; Profile of the most recent day/overnight domestic trips both by the respondent and other household
members (destination, trip length, purpose of visit, accommodation, transport, activities, trip expenditure, etc.); and
Socio-demographics.
1.3 Target population and sample
A randomised probability-proportional-to-size (RPPS) systematic sample of PSUs was drawn in each stratum, with the measure of size being the number of households in the PSU. The number of PSUs in the current Master Sample (3 324) reflect an 8,0% increase in the size of the Master Sample compared to the previous (2008) Master Sample (which had 3 080 PSUs). In each selected PSU, a systematic sample of this particular report deals with the data that were collected from January 2015 to March 2016. Given that a three-month recall period is used, the data of DTS 2016 January to March had to be included to fully construct the October, November and December 2015 datasets. The DTS 2015 was based on the new Master Sample that was developed after Census 2011. The organisation of fieldwork of the DTS 2015 is also different from the DTS 2014, in that the DUs to be visited each month were pre-determined by methodology in order to ensure an even spread of DUs per stratum for each month.
2. Summary of key findings of the Domestic Tourism Survey 2015
This particular publication focuses on domestic tourism and includes information on day and overnight trips. The DTS 2015 findings reflect a general pattern of decline in domestic tourism over the past two years as associated with economic stagnation and re-prioritisation of consumer spending that has taken place in the country during that time.
The number of day trips decreased from 54,4 million in 2013 to 48 million in 2014 and decreased further to 44,3 million in 2015. Overnight trips also declined from 50,8 million in 2013 to 47,3 million in 2014 and 45,4 million in 2015. An actual total expenditure on domestic overnight trips increased from R68,5 billion in 2013 to R71 billion in 2014. A different pattern was seen in 2015 with a decrease in expenditure to R61,9 billion. Expenditure on day trips also increased from an estimated R35 billion in 2013 to R38,6 billion in 2014 and decreased to R24,9 billion in 2015. This increase in expenditure between 2013 and 2014 on overnight trips has largely been driven by increased spending in the higher living standard measure subgroup (LSM 8–10), as individuals and households from the lower living standard measure groupings were significantly less likely to travel in 2014 than in 2013.
Much of the findings of this report are based on the most recent trips undertaken by South African residents. In 2013, 2014 and 2015, Gauteng, Limpopo and Western Cape were the most popular destinations for day travellers, whereas tourists (those who undertook overnight trips) mostly preferred visiting Limpopo and KwaZulu-Natal. Most of the money spent during the most recent day trips was spent in Gauteng, whereas most overnight expenditure occurred in Eastern Cape and KwaZulu-Natal.
STATISTICS SOUTH AFRICA P0352.1
Domestic Tourism Survey, 2015
5
A visit to friends and relatives was the most popular reason for undertaking overnight trips, as approximately 13 million trips were taken for this reason in 2015. For most of these visits, travellers did not make use of paid accommodation, which had a negative impact in boosting economy and job creation in the tourism sector. Most recent day trips were undertaken for shopping purposes.
Most tourists spent up to one week at their destinations on an overnight trip, with an average of six nights. These people were most likely to have stayed with friends and relatives on their trips, having arrived at their destinations in cars and taxis, since almost six out of ten trips were undertaken with taxis as the main mode of transport.
Pali Lehohla
Statistician‐General
STATISTICS SOUTH AFRICA P0352.1
Domestic Tourism Survey, 2015
6
3. Definitions
Tourist accommodation
Any facility that regularly (or occasionally) provides 'paid' or 'unpaid' overnight accommodation for tourists.
Day trip
A trip outside of the respondent's usual environment, where they leave and return within the same day (i.e. do not stay overnight).
Domestic trip
A trip within the boundaries of South Africa but outside of the respondent's usual environment.
Note: The following categories are excluded from the definition of domestic visitor:
Persons travelling to another place within the country with the intention of setting up their usual residence in that place.
Persons who travel to another place within the country and are remunerated from within the place visited. Persons who travel regularly or frequently between neighbouring localities as defined by the 'usual
environment' rule.
Dwelling unit
Structure or part of a structure or group of structures occupied or meant to be occupied by one or more than one household.
Expenditure
The total consumption expenditure made by a visitor or on behalf of a visitor during his/her trip and stay at a destination.
Household
A group of persons who live together and provide themselves jointly with food and/or other essentials for living, or a single person who lives alone.
Household head
The main decision-maker, or the person who owns or rents the dwelling, or the person who is the main breadwinner.
Acting household head
Any member of the household acting on behalf of the head of the household.
Main purpose of trip
This is the purpose in the absence of which the trip would not have been made.
Most recent person trip
This is the last trip that the household member undertook in the reference period.
STATISTICS SOUTH AFRICA P0352.1
Domestic Tourism Survey, 2015
7
Multiple households
Two or more households living in the same dwelling unit.
Overnight trip
A trip outside of the respondent's usual environment where one night or more is spent away from the usual environment.
Place of usual residence
The geographical place where the person resides four nights a week on average.
Reference period
The period of time (day, week, month, or year) for which information is relevant.
Tourism
The activities of persons travelling to and staying in places outside their usual environment for not more than one consecutive year for leisure, business and other purposes not related to the exercise of an activity remunerated from within the place visited.
Tourist
A visitor who stays at least one night in the place visited.
Traveller
Any person on a trip between two or more localities in his/her country of residence. Broadly, travellers can include visitors (same-day and overnight) and other travellers such as workers paid in the country visited, migrants, refugees, diplomats and others within the usual environment.
Usual environment
To be outside the 'usual environment' the person should travel more than 40 kilometres from his/her place of residence (one way) AND the place should NOT be visited more than once a week. This includes place of work and place of study. Leisure and recreational trips are included irrespective of frequency.
Visitor
Someone who doesn't stay permanently with and is not a member of the household.
STATISTICS SOUTH AFRICA P0352.1
Domestic Tourism Survey, 2015
MAIN FINDINGS
STATISTICS SOUTH AFRICA P0352.1
Domestic Tourism Survey, 2015
8
4. Number and types of trips
4.1 Total number of day and overnight trips inside South Africa
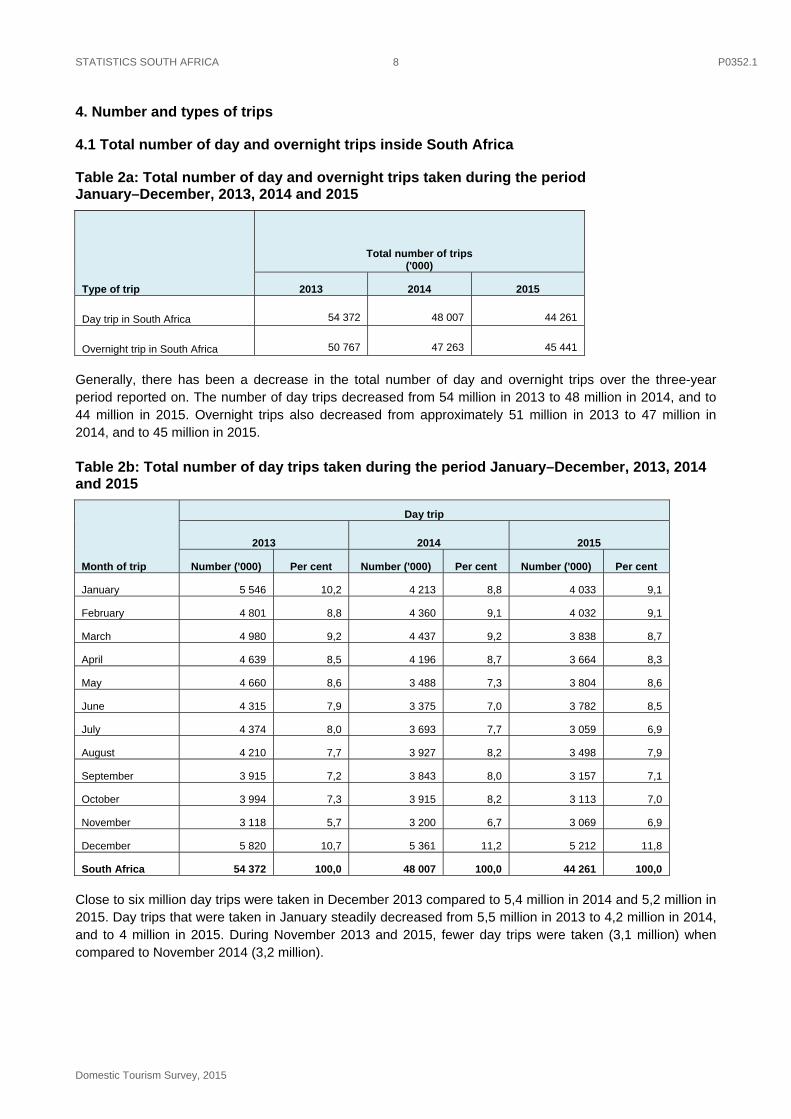
Table 2a: Total number of day and overnight trips taken during the period January–December, 2013, 2014 and 2015
Type of trip
Total number of trips ('000)
2013 2014 2015
Day trip in South Africa 54 372 48 007 44 261
Overnight trip in South Africa 50 767 47 263 45 441
Generally, there has been a decrease in the total number of day and overnight trips over the three-year period reported on. The number of day trips decreased from 54 million in 2013 to 48 million in 2014, and to 44 million in 2015. Overnight trips also decreased from approximately 51 million in 2013 to 47 million in 2014, and to 45 million in 2015.
Table 2b: Total number of day trips taken during the period January–December, 2013, 2014 and 2015
Month of trip
Day trip
2013 2014 2015
Number ('000) Per cent Number ('000) Per cent Number ('000) Per cent
January 5 546 10,2 4 213 8,8 4 033 9,1
February 4 801 8,8 4 360 9,1 4 032 9,1
March 4 980 9,2 4 437 9,2 3 838 8,7
April 4 639 8,5 4 196 8,7 3 664 8,3
May 4 660 8,6 3 488 7,3 3 804 8,6
June 4 315 7,9 3 375 7,0 3 782 8,5
July 4 374 8,0 3 693 7,7 3 059 6,9
August 4 210 7,7 3 927 8,2 3 498 7,9
September 3 915 7,2 3 843 8,0 3 157 7,1
October 3 994 7,3 3 915 8,2 3 113 7,0
November 3 118 5,7 3 200 6,7 3 069 6,9
December 5 820 10,7 5 361 11,2 5 212 11,8
South Africa 54 372 100,0 48 007 100,0 44 261 100,0
Close to six million day trips were taken in December 2013 compared to 5,4 million in 2014 and 5,2 million in 2015. Day trips that were taken in January steadily decreased from 5,5 million in 2013 to 4,2 million in 2014, and to 4 million in 2015. During November 2013 and 2015, fewer day trips were taken (3,1 million) when compared to November 2014 (3,2 million).

STATISTICS SOUTH AFRICA P0352.1
Domestic Tourism Survey, 2015
9
Table 2c: Total number of overnight trips taken during the period January–December, 2013, 2014 and 2015
Month of trip
Overnight trip
2013 2014 2015
Number ('000) Per cent Number ('000) Per cent Number ('000) Per cent
January 5 012 9,9 5 183 11,0 4 541 10,0
February 2 718 5,4 3 298 7,0 3 001 6,6
March 4 585 9,0 3 734 7,9 3 115 6,9
April 4 275 8,4 4 729 10,0 4 169 9,2
May 3 591 7,1 2 928 6,2 3 120 6,9
June 4 148 8,2 3 442 7,3 4 090 9,0
July 3 945 7,8 3 918 8,3 3 475 7,6
August 3 373 6,6 2 949 6,2 3 349 7,4
September 4 284 8,4 3 506 7,4 3 626 8,0
October 3 488 6,9 3 411 7,2 3 063 6,7
November 3 045 6,0 2 995 6,3 2 764 6,1
December 8 304 16,4 7 169 15,2 7 127 15,7
South Africa 50 767 100,0 47 263 100,0 45 441 100,0
Overnight trips that were taken in December decreased from 8,3 million in 2013 to 7,2 million in 2014 and further to 7,1 million in 2015. November has recorded a relatively lower number of overnight trips across the three years with a steady decline over time. For most of the months, overnight trips increased between 2013 and 2014, and declined in 2015.
Table 3a: Total expenditure on domestic day and overnight trips (R'000), January–December, 2013, 2014 and 2015
Total expenditure Accommodation
Food and beverages
Domestic transport
Recreation and culture Shopping Other1 Total
2013
Day trips * 4 546 976 8 771 039 851 063 19 376 511 1 867 966 35 413 555
Overnight trips 9 128 072 10 783 127 22 715 012 1 168 910 21 747 858 2 923 296 68 466 275
Total 9 128 072 15 330 103 31 486 051 2 019 973 41 124 369 4 791 262 103 879 830
2014
Day trips * 4 631 998 7 652 151 252 295 24 154 917 1 927 410 38 618 771
Overnight trips 7 453 201 12 997 181 24 329 765 1 370 917 22 238 197 2 722 735 71 111 995
Total 7 453 201 17 629 179 31 981 916 1 623 212 46 393 114 4 650 145 109 730 766
2015
Day trips * 5 608 012 8 446 087 526 668 8 068 469 2 209 549 24 858 785
Overnight trips 7 578 921 10 029 145 19 651 146 843 809 20 886 716 2 889 805 61 879 542
Total 7 578 921 15 637 157 28 097 233 1 370 477 28 955 185 5 099 354 86 738 327 1 The expenditure shown in this table represents an extrapolation of expenditure reported for the most recent trip. The extrapolation is based on the assumption that expenditure on the most recent trip is representative of trip expenditure during the preceding three months
Table 3a shows that there was a decline in the total spent on domestic tourism in 2015 after an increase between 2013 and 2014. In total, R104 billion was spent on domestic trips in 2013, followed by R110 billion spent in 2014 and R87 billion in 2015. The amount of money that was spent on day trips increased from R35 billion in 2013 to R39 billion in 2014; however, in 2015, day travellers spent just R25 billion. Total spending
STATISTICS SOUTH AFRICA P0352.1
Domestic Tourism Survey, 2015
10
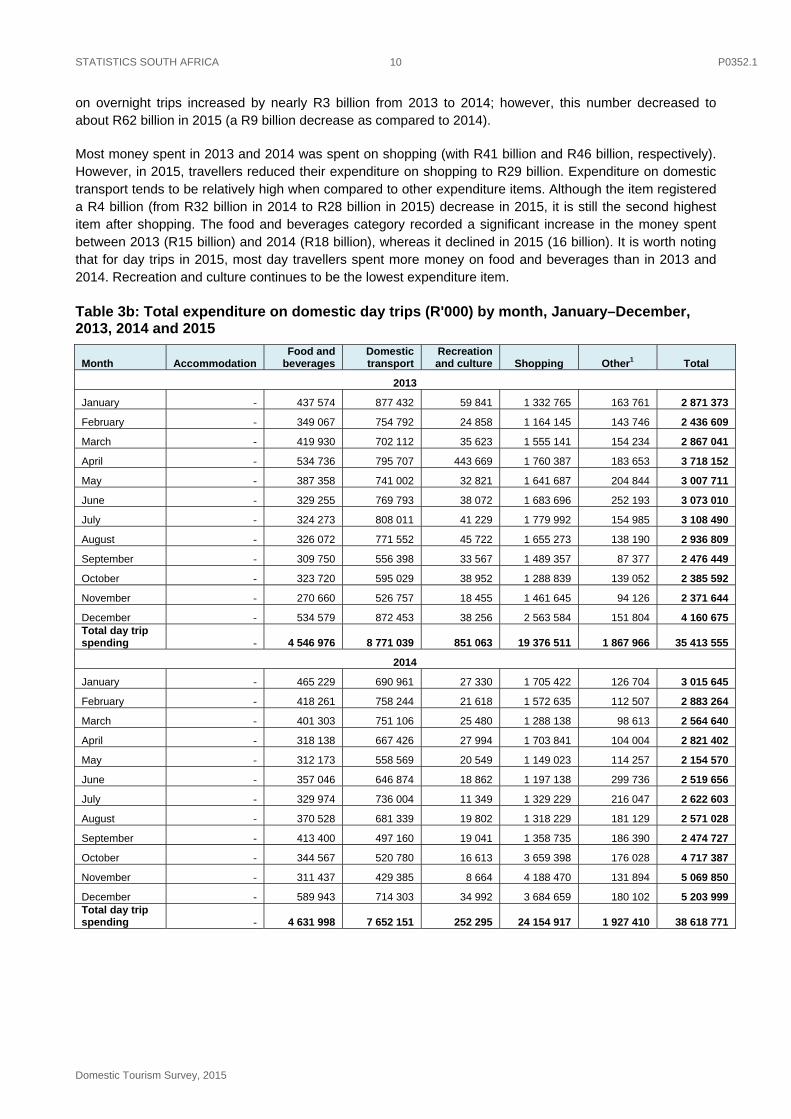
on overnight trips increased by nearly R3 billion from 2013 to 2014; however, this number decreased to about R62 billion in 2015 (a R9 billion decrease as compared to 2014).
Most money spent in 2013 and 2014 was spent on shopping (with R41 billion and R46 billion, respectively). However, in 2015, travellers reduced their expenditure on shopping to R29 billion. Expenditure on domestic transport tends to be relatively high when compared to other expenditure items. Although the item registered a R4 billion (from R32 billion in 2014 to R28 billion in 2015) decrease in 2015, it is still the second highest item after shopping. The food and beverages category recorded a significant increase in the money spent between 2013 (R15 billion) and 2014 (R18 billion), whereas it declined in 2015 (16 billion). It is worth noting that for day trips in 2015, most day travellers spent more money on food and beverages than in 2013 and 2014. Recreation and culture continues to be the lowest expenditure item.
Table 3b: Total expenditure on domestic day trips (R'000) by month, January–December, 2013, 2014 and 2015
Month Accommodation Food and
beverages Domestic transport
Recreation and culture Shopping Other1 Total
2013
January - 437 574 877 432 59 841 1 332 765 163 761 2 871 373
February - 349 067 754 792 24 858 1 164 145 143 746 2 436 609
March - 419 930 702 112 35 623 1 555 141 154 234 2 867 041
April - 534 736 795 707 443 669 1 760 387 183 653 3 718 152
May - 387 358 741 002 32 821 1 641 687 204 844 3 007 711
June - 329 255 769 793 38 072 1 683 696 252 193 3 073 010
July - 324 273 808 011 41 229 1 779 992 154 985 3 108 490
August - 326 072 771 552 45 722 1 655 273 138 190 2 936 809
September - 309 750 556 398 33 567 1 489 357 87 377 2 476 449
October - 323 720 595 029 38 952 1 288 839 139 052 2 385 592
November - 270 660 526 757 18 455 1 461 645 94 126 2 371 644
December - 534 579 872 453 38 256 2 563 584 151 804 4 160 675 Total day trip spending - 4 546 976 8 771 039 851 063 19 376 511 1 867 966 35 413 555
2014
January - 465 229 690 961 27 330 1 705 422 126 704 3 015 645
February - 418 261 758 244 21 618 1 572 635 112 507 2 883 264
March - 401 303 751 106 25 480 1 288 138 98 613 2 564 640
April - 318 138 667 426 27 994 1 703 841 104 004 2 821 402
May - 312 173 558 569 20 549 1 149 023 114 257 2 154 570
June - 357 046 646 874 18 862 1 197 138 299 736 2 519 656
July - 329 974 736 004 11 349 1 329 229 216 047 2 622 603
August - 370 528 681 339 19 802 1 318 229 181 129 2 571 028
September - 413 400 497 160 19 041 1 358 735 186 390 2 474 727
October - 344 567 520 780 16 613 3 659 398 176 028 4 717 387
November - 311 437 429 385 8 664 4 188 470 131 894 5 069 850
December - 589 943 714 303 34 992 3 684 659 180 102 5 203 999 Total day trip spending - 4 631 998 7 652 151 252 295 24 154 917 1 927 410 38 618 771
STATISTICS SOUTH AFRICA P0352.1
Domestic Tourism Survey, 2015
11
Table 3b: Total expenditure on domestic day trips (R'000) by month, January–December, 2013, 2014 and 2015 (concluded)
Month Accommodation Food and
beverages Domestic transport
Recreation and culture Shopping Other1 Total
2015
January - 823 935 911 105 64 665 750 673 418 576 2 968 955
February - 595 733 677 999 79 990 677 624 272 752 2 304 097
March - 493 452 617 549 26 225 401 897 146 566 1 685 689
April - 398 069 669 356 39 437 513 860 107 051 1 727 773
May - 543 648 709 829 22 038 557 238 121 629 1 954 382
June - 599 669 870 326 37 497 516 694 183 637 2 207 822
July - 354 532 589 003 30 840 337 739 186 620 1 498 734
August - 242 674 619 420 48 034 285 822 113 925 1 309 876
September - 223 712 529 287 28 268 294 041 47 606 1 122 915
October - 253 942 555 234 33 176 534 798 48 547 1 425 697
November - 276 375 637 445 36 414 787 105 177 614 1 914 953
December - 802 272 1 059 532 80 084 2 410 976 385 027 4 737 892 Total day trip spending - 5 608 012 8 446 087 526 668 8 068 469 2 209 549 24 858 785
1 The expenditure shown in this table represents an extrapolation of expenditure reported for the most recent trip. The extrapolation is based on the assumption that expenditure on the most recent trip is representative of trips expenditure during the preceding three months
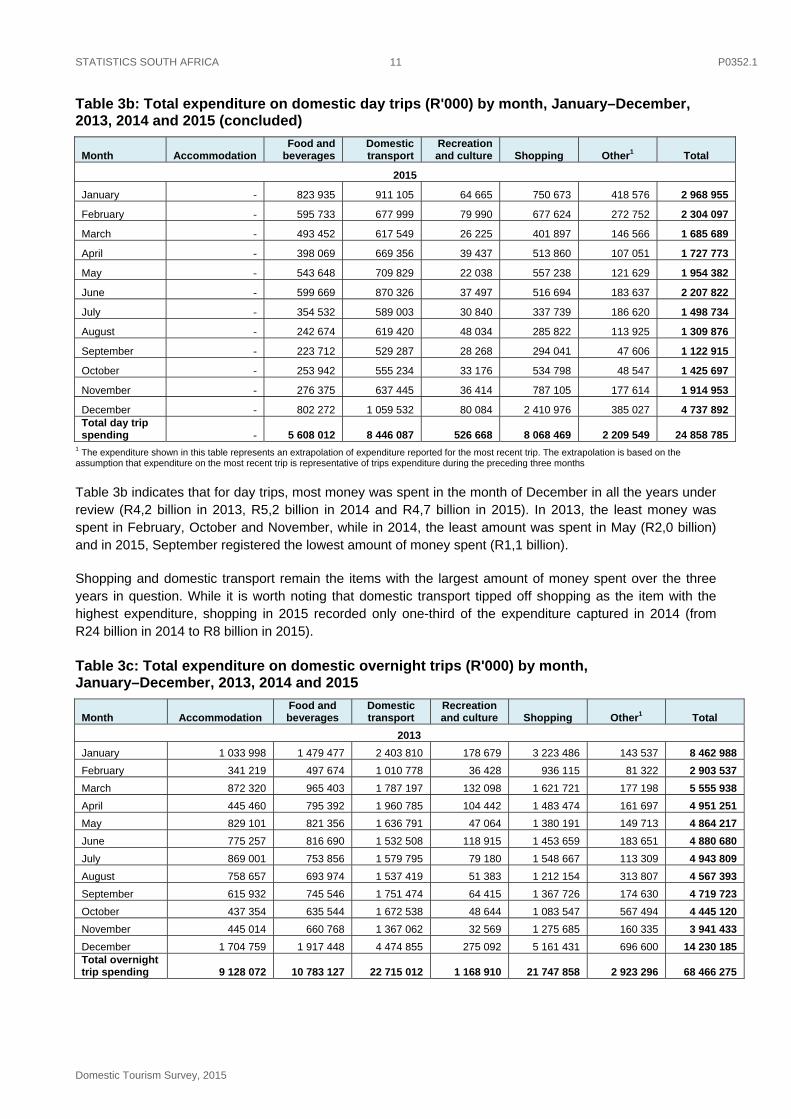
Table 3b indicates that for day trips, most money was spent in the month of December in all the years under review (R4,2 billion in 2013, R5,2 billion in 2014 and R4,7 billion in 2015). In 2013, the least money was spent in February, October and November, while in 2014, the least amount was spent in May (R2,0 billion) and in 2015, September registered the lowest amount of money spent (R1,1 billion).
Shopping and domestic transport remain the items with the largest amount of money spent over the three years in question. While it is worth noting that domestic transport tipped off shopping as the item with the highest expenditure, shopping in 2015 recorded only one-third of the expenditure captured in 2014 (from R24 billion in 2014 to R8 billion in 2015).
Table 3c: Total expenditure on domestic overnight trips (R'000) by month, January–December, 2013, 2014 and 2015
Month Accommodation Food and beverages
Domestic transport
Recreation and culture Shopping Other1 Total
2013
January 1 033 998 1 479 477 2 403 810 178 679 3 223 486 143 537 8 462 988
February 341 219 497 674 1 010 778 36 428 936 115 81 322 2 903 537
March 872 320 965 403 1 787 197 132 098 1 621 721 177 198 5 555 938
April 445 460 795 392 1 960 785 104 442 1 483 474 161 697 4 951 251
May 829 101 821 356 1 636 791 47 064 1 380 191 149 713 4 864 217
June 775 257 816 690 1 532 508 118 915 1 453 659 183 651 4 880 680
July 869 001 753 856 1 579 795 79 180 1 548 667 113 309 4 943 809
August 758 657 693 974 1 537 419 51 383 1 212 154 313 807 4 567 393
September 615 932 745 546 1 751 474 64 415 1 367 726 174 630 4 719 723
October 437 354 635 544 1 672 538 48 644 1 083 547 567 494 4 445 120
November 445 014 660 768 1 367 062 32 569 1 275 685 160 335 3 941 433
December 1 704 759 1 917 448 4 474 855 275 092 5 161 431 696 600 14 230 185 Total overnight trip spending 9 128 072 10 783 127 22 715 012 1 168 910 21 747 858 2 923 296 68 466 275
STATISTICS SOUTH AFRICA P0352.1
Domestic Tourism Survey, 2015
12
Table 3c: Total expenditure on domestic overnight trips (R'000) by month, January–December, 2013, 2014 and 2015 (concluded)
Month Accommodation Food and beverages
Domestic transport
Recreation and culture Shopping Other1 Total
2014
January 807 112 1 218 228 2 653 544 159 537 2 978 229 450 674 8 267 324
February 617 052 887 866 1 622 574 74 066 1 481 271 550 109 5 232 938
March 675 493 981 937 1 687 318 77 015 1 610 556 159 236 5 191 555
April 845 905 1 102 065 1 981 454 159 245 1 967 600 180 926 6 237 194
May 437 589 627 388 1 546 139 133 750 1 413 500 98 076 4 256 443
June 397 016 664 961 1 411 216 140 613 1 474 460 205 082 4 293 348
July 518 348 1 676 465 1 754 059 42 695 1 400 032 170 214 5 561 812
August 393 375 601 400 1 134 293 45 382 1 134 198 147 542 3 456 190
September 547 385 1 641 564 1 718 949 66 105 1 293 761 81 405 5 349 169
October 528 802 879 655 2 624 310 73 936 1 289 832 185 007 5 581 542
November 455 709 518 914 2 705 874 57 172 1 212 482 143 690 5 093 841
December 1 229 414 2 196 738 3 490 036 341 400 4 982 277 350 774 12 590 640 Total overnight trip spending 7 453 201 12 997 181 24 329 765 1 370 917 22 238 197 2 722 735 71 111 995
2015
January 895 213 1 451 821 1 987 430 123 764 2 512 643 260 949 7 231 819
February 293 843 523 929 1 092 803 45 044 1 188 195 85 820 3 229 635
March 415 649 641 809 1 398 549 75 284 1 175 768 341 754 4 048 813
April 567 284 862 714 1 694 197 50 773 1 523 915 366 297 5 065 180
May 332 957 624 109 1 349 935 44 522 1 126 859 214 224 3 692 606
June 497 396 865 725 1 777 696 45 205 1 352 135 292 882 4 831 039
July 450 654 661 388 1 400 965 44 596 1 207 771 268 756 4 034 129
August 473 630 536 809 1 313 810 80 360 1 130 096 175 603 3 710 308
September 538 435 680 805 1 515 774 44 531 1 527 569 161 764 4 468 877
October 580 356 640 698 1 271 211 83 832 1 446 736 174 253 4 197 087
November 814 542 645 475 1 158 624 73 011 1 533 910 119 075 4 344 637
December 1 718 962 1 893 862 3 690 151 132 888 5 161 120 428 428 13 025 412 Total overnight trip spending 7 578 921 10 029 145 19 651 146 843 809 20 886 716 2 889 805 61 879 542
1 'Other' includes categories of expenditure that were not included in the categories * The expenditure shown in this table represents an extrapolation of expenditure reported for the most recent trip. The extrapolation is based on the assumption that expenditure on the most recent trip is representative of trips expenditure during the preceding three months
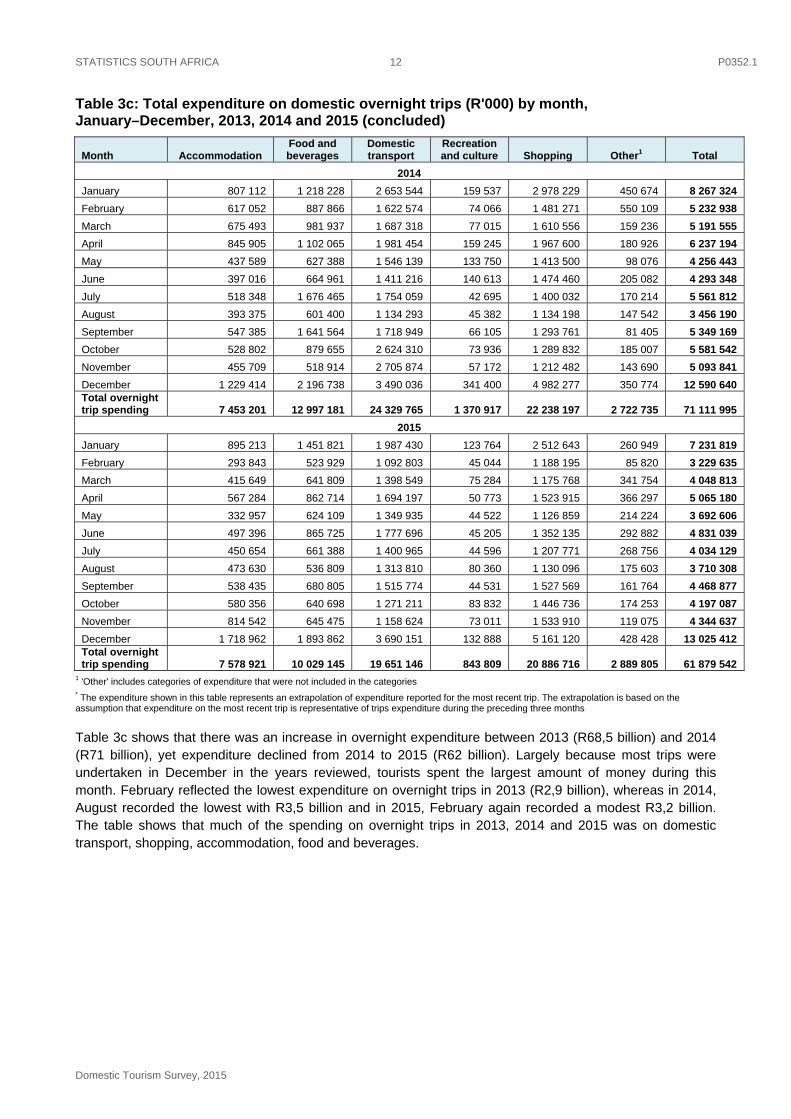
Table 3c shows that there was an increase in overnight expenditure between 2013 (R68,5 billion) and 2014 (R71 billion), yet expenditure declined from 2014 to 2015 (R62 billion). Largely because most trips were undertaken in December in the years reviewed, tourists spent the largest amount of money during this month. February reflected the lowest expenditure on overnight trips in 2013 (R2,9 billion), whereas in 2014, August recorded the lowest with R3,5 billion and in 2015, February again recorded a modest R3,2 billion. The table shows that much of the spending on overnight trips in 2013, 2014 and 2015 was on domestic transport, shopping, accommodation, food and beverages.
STATISTICS SOUTH AFRICA P0352.1
Domestic Tourism Survey, 2015
13
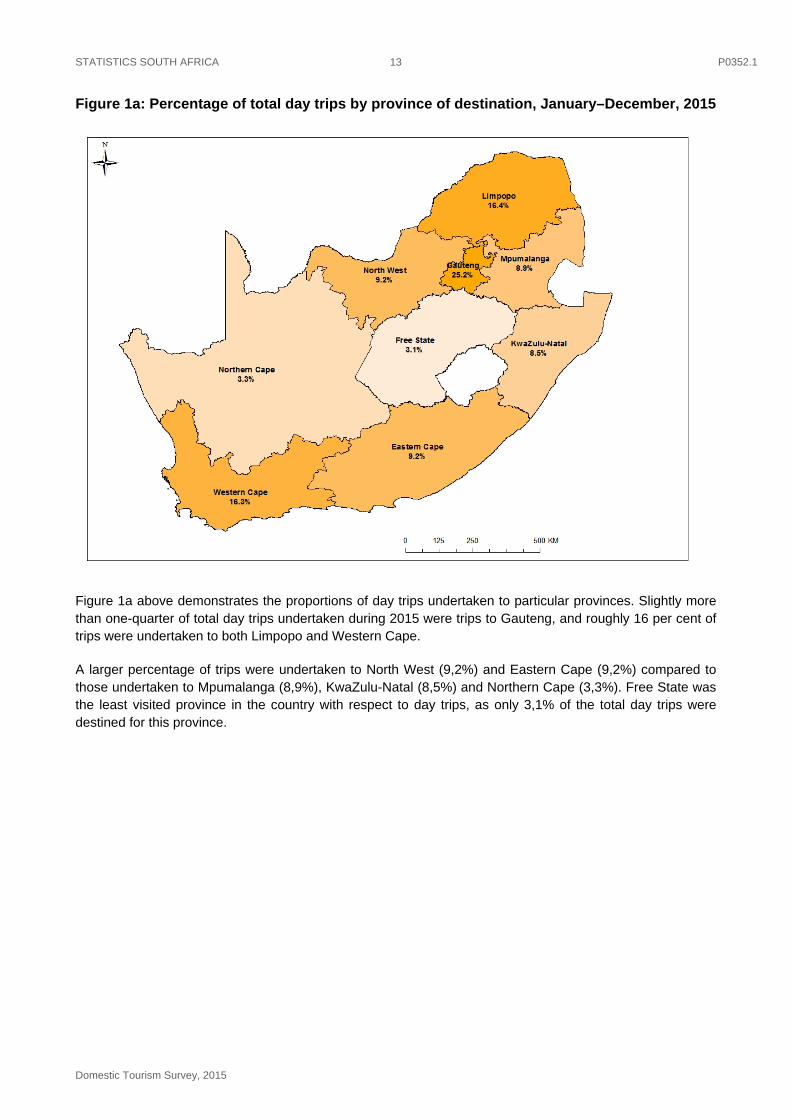
Figure 1a: Percentage of total day trips by province of destination, January–December, 2015
Figure 1a above demonstrates the proportions of day trips undertaken to particular provinces. Slightly more than one-quarter of total day trips undertaken during 2015 were trips to Gauteng, and roughly 16 per cent of trips were undertaken to both Limpopo and Western Cape.
A larger percentage of trips were undertaken to North West (9,2%) and Eastern Cape (9,2%) compared to those undertaken to Mpumalanga (8,9%), KwaZulu-Natal (8,5%) and Northern Cape (3,3%). Free State was the least visited province in the country with respect to day trips, as only 3,1% of the total day trips were destined for this province.
STATISTICS SOUTH AFRICA P0352.1
Domestic Tourism Survey, 2015
14
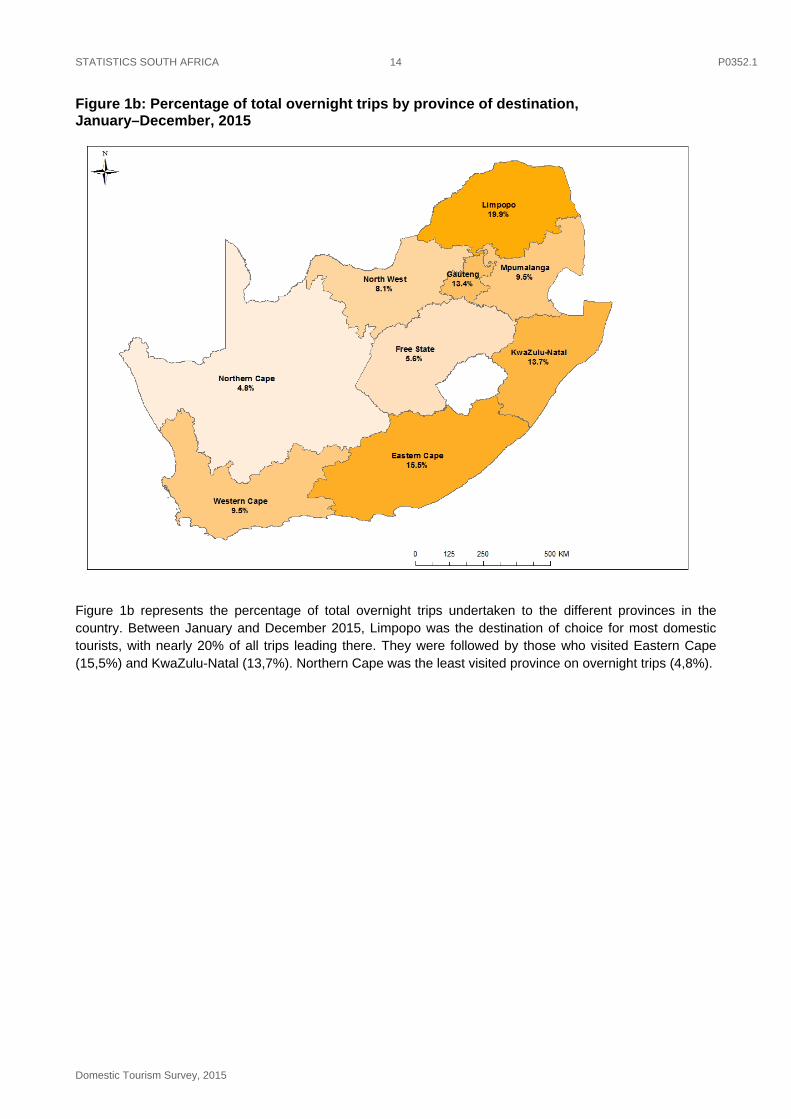
Figure 1b: Percentage of total overnight trips by province of destination, January–December, 2015
Figure 1b represents the percentage of total overnight trips undertaken to the different provinces in the country. Between January and December 2015, Limpopo was the destination of choice for most domestic tourists, with nearly 20% of all trips leading there. They were followed by those who visited Eastern Cape (15,5%) and KwaZulu-Natal (13,7%). Northern Cape was the least visited province on overnight trips (4,8%).
STATISTICS SOUTH AFRICA P0352.1
Domestic Tourism Survey, 2015
15
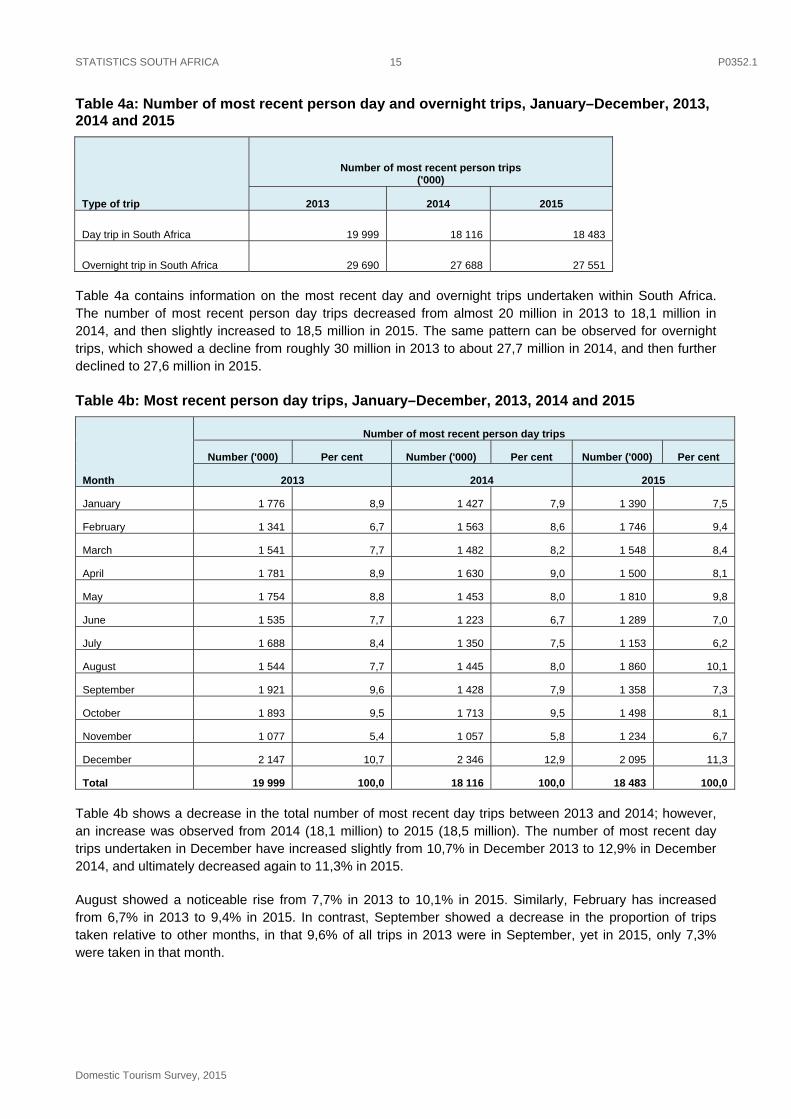
Table 4a: Number of most recent person day and overnight trips, January–December, 2013, 2014 and 2015
Type of trip
Number of most recent person trips ('000)
2013 2014 2015
Day trip in South Africa 19 999 18 116 18 483
Overnight trip in South Africa 29 690 27 688 27 551
Table 4a contains information on the most recent day and overnight trips undertaken within South Africa. The number of most recent person day trips decreased from almost 20 million in 2013 to 18,1 million in 2014, and then slightly increased to 18,5 million in 2015. The same pattern can be observed for overnight trips, which showed a decline from roughly 30 million in 2013 to about 27,7 million in 2014, and then further declined to 27,6 million in 2015.
Table 4b: Most recent person day trips, January–December, 2013, 2014 and 2015
Month
Number of most recent person day trips
Number ('000) Per cent Number ('000) Per cent Number ('000) Per cent
2013 2014 2015
January 1 776 8,9 1 427 7,9 1 390 7,5
February 1 341 6,7 1 563 8,6 1 746 9,4
March 1 541 7,7 1 482 8,2 1 548 8,4
April 1 781 8,9 1 630 9,0 1 500 8,1
May 1 754 8,8 1 453 8,0 1 810 9,8
June 1 535 7,7 1 223 6,7 1 289 7,0
July 1 688 8,4 1 350 7,5 1 153 6,2
August 1 544 7,7 1 445 8,0 1 860 10,1
September 1 921 9,6 1 428 7,9 1 358 7,3
October 1 893 9,5 1 713 9,5 1 498 8,1
November 1 077 5,4 1 057 5,8 1 234 6,7
December 2 147 10,7 2 346 12,9 2 095 11,3
Total 19 999 100,0 18 116 100,0 18 483 100,0
Table 4b shows a decrease in the total number of most recent day trips between 2013 and 2014; however, an increase was observed from 2014 (18,1 million) to 2015 (18,5 million). The number of most recent day trips undertaken in December have increased slightly from 10,7% in December 2013 to 12,9% in December 2014, and ultimately decreased again to 11,3% in 2015.
August showed a noticeable rise from 7,7% in 2013 to 10,1% in 2015. Similarly, February has increased from 6,7% in 2013 to 9,4% in 2015. In contrast, September showed a decrease in the proportion of trips taken relative to other months, in that 9,6% of all trips in 2013 were in September, yet in 2015, only 7,3% were taken in that month.
STATISTICS SOUTH AFRICA P0352.1
Domestic Tourism Survey, 2015
16
Table 4c: Most recent person overnight trips, January–December, 2013, 2014 and 2015
Month
Most recent person overnight trips
Number ('000) Per cent Number ('000) Per cent Number ('000) Per cent
2013 2014 2015
January 3 633 12,2 3 411 12,3 3 070 11,1
February 1 385 4,7 1 680 6,1 1 980 7,2
March 2 470 8,3 2 180 7,9 1 766 6,4
April 2 925 9,9 3 380 12,2 2 690 9,8
May 1 967 6,6 1 424 5,1 1 933 7,0
June 2 360 7,9 1 742 6,3 2 286 8,3
July 2 557 8,6 2 434 8,8 2 173 7,9
August 1 941 6,5 1 639 5,9 2 366 8,6
September 3 111 10,5 2 304 8,3 2 258 8,2
October 2 107 7,1 1 994 7,2 1 923 7,0
November 1 249 4,2 1 539 5,6 1 427 5,2
December 3 986 13,4 3 960 14,3 3 678 13,4
Total 29 690 100,0 27 688 100,0 27 551 100,0
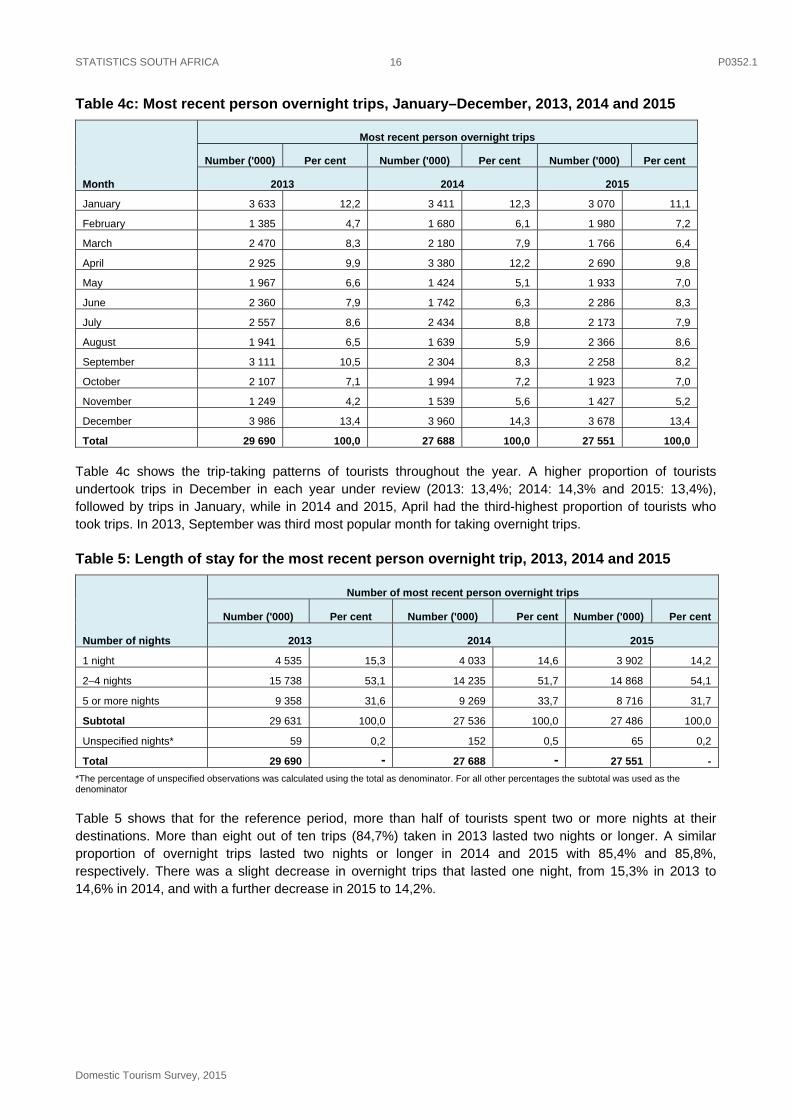
Table 4c shows the trip-taking patterns of tourists throughout the year. A higher proportion of tourists undertook trips in December in each year under review (2013: 13,4%; 2014: 14,3% and 2015: 13,4%), followed by trips in January, while in 2014 and 2015, April had the third-highest proportion of tourists who took trips. In 2013, September was third most popular month for taking overnight trips.
Table 5: Length of stay for the most recent person overnight trip, 2013, 2014 and 2015
Number of nights
Number of most recent person overnight trips
Number ('000) Per cent Number ('000) Per cent Number ('000) Per cent
2013 2014 2015
1 night 4 535 15,3 4 033 14,6 3 902 14,2
2–4 nights 15 738 53,1 14 235 51,7 14 868 54,1
5 or more nights 9 358 31,6 9 269 33,7 8 716 31,7
Subtotal 29 631 100,0 27 536 100,0 27 486 100,0
Unspecified nights* 59 0,2 152 0,5 65 0,2
Total 29 690 - 27 688 - 27 551 -
*The percentage of unspecified observations was calculated using the total as denominator. For all other percentages the subtotal was used as the denominator
Table 5 shows that for the reference period, more than half of tourists spent two or more nights at their destinations. More than eight out of ten trips (84,7%) taken in 2013 lasted two nights or longer. A similar proportion of overnight trips lasted two nights or longer in 2014 and 2015 with 85,4% and 85,8%, respectively. There was a slight decrease in overnight trips that lasted one night, from 15,3% in 2013 to 14,6% in 2014, and with a further decrease in 2015 to 14,2%.
STATISTICS SOUTH AFRICA P0352.1
Domestic Tourism Survey, 2015
17
Table 6: Most recent trips taken by the respondent and other household members, 2013, 2014 and 2015
Trips undertaken by household members
Day trips Overnight trips
Number ('000) Per cent Number ('000) Per cent
2013
Trips by the respondent 8 079 40,4 11 301 38,1
Trips by other members of household 11 920 59,6 18 388 61,9
Total number of trips 19 999 100,0 29 690 100,0
2014
Trips by the respondent 8 423 46,5 12 185 44,0 Trips by other members of household 9 694 53,5 15 503 56,0
Total number of trips 18 116 100,0 27 688 100,0
2015
Trips by the respondent 8 658 46,8 12 750 46,3 Trips by other members of household 9 825 53,2 14 801 53,7
Total number of trips 18 483 100,0 27 551 100,0
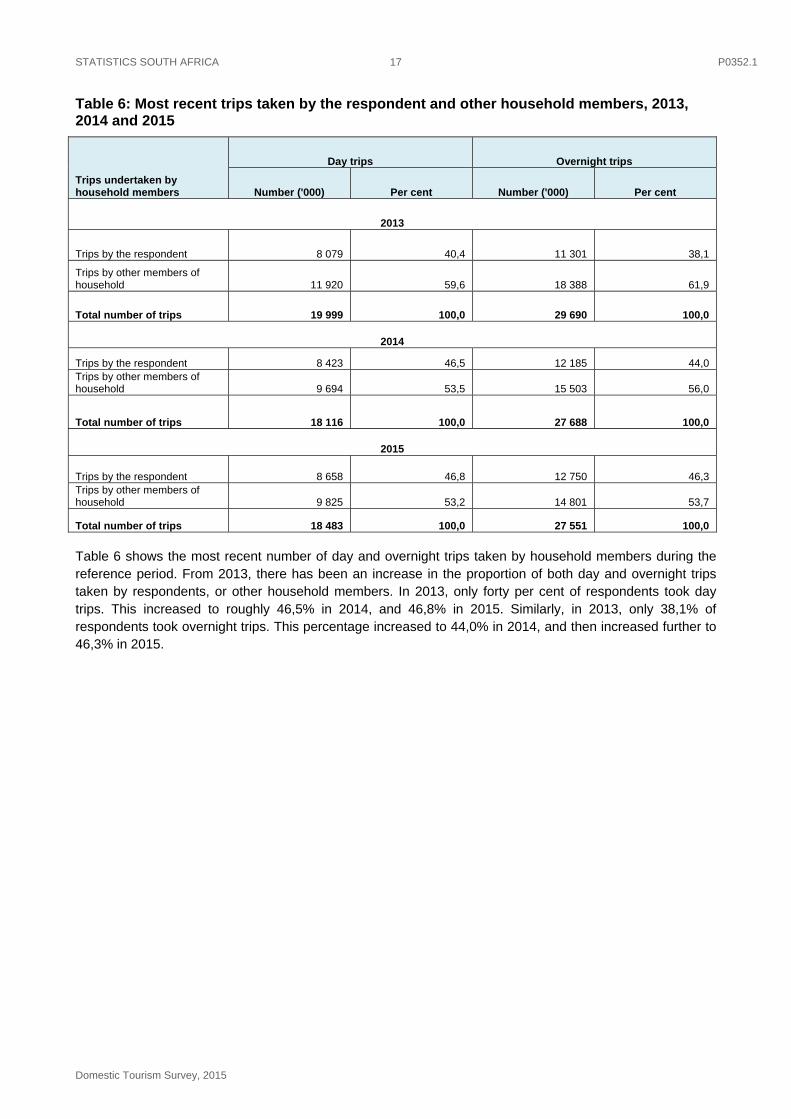
Table 6 shows the most recent number of day and overnight trips taken by household members during the reference period. From 2013, there has been an increase in the proportion of both day and overnight trips taken by respondents, or other household members. In 2013, only forty per cent of respondents took day trips. This increased to roughly 46,5% in 2014, and 46,8% in 2015. Similarly, in 2013, only 38,1% of respondents took overnight trips. This percentage increased to 44,0% in 2014, and then increased further to 46,3% in 2015.
STATISTICS SOUTH AFRICA P0352.1
Domestic Tourism Survey, 2015
18
Figure 2a: Percentage distribution of province of origin, by province of destination for total day trips, January–December, 2015
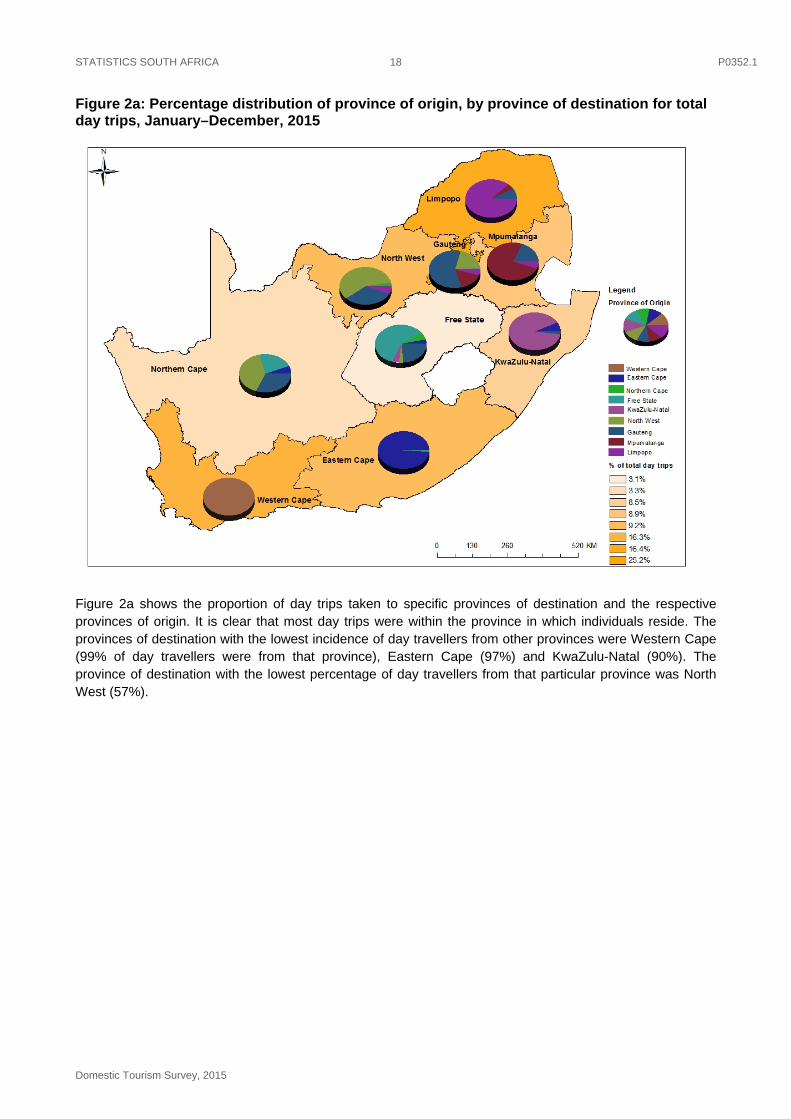
Figure 2a shows the proportion of day trips taken to specific provinces of destination and the respective provinces of origin. It is clear that most day trips were within the province in which individuals reside. The provinces of destination with the lowest incidence of day travellers from other provinces were Western Cape (99% of day travellers were from that province), Eastern Cape (97%) and KwaZulu-Natal (90%). The province of destination with the lowest percentage of day travellers from that particular province was North West (57%).
STATISTICS SOUTH AFRICA P0352.1
Domestic Tourism Survey, 2015
19
Figure 2b: Percentage distribution of province of origin, by province of destination for total overnight trips, January–December, 2015
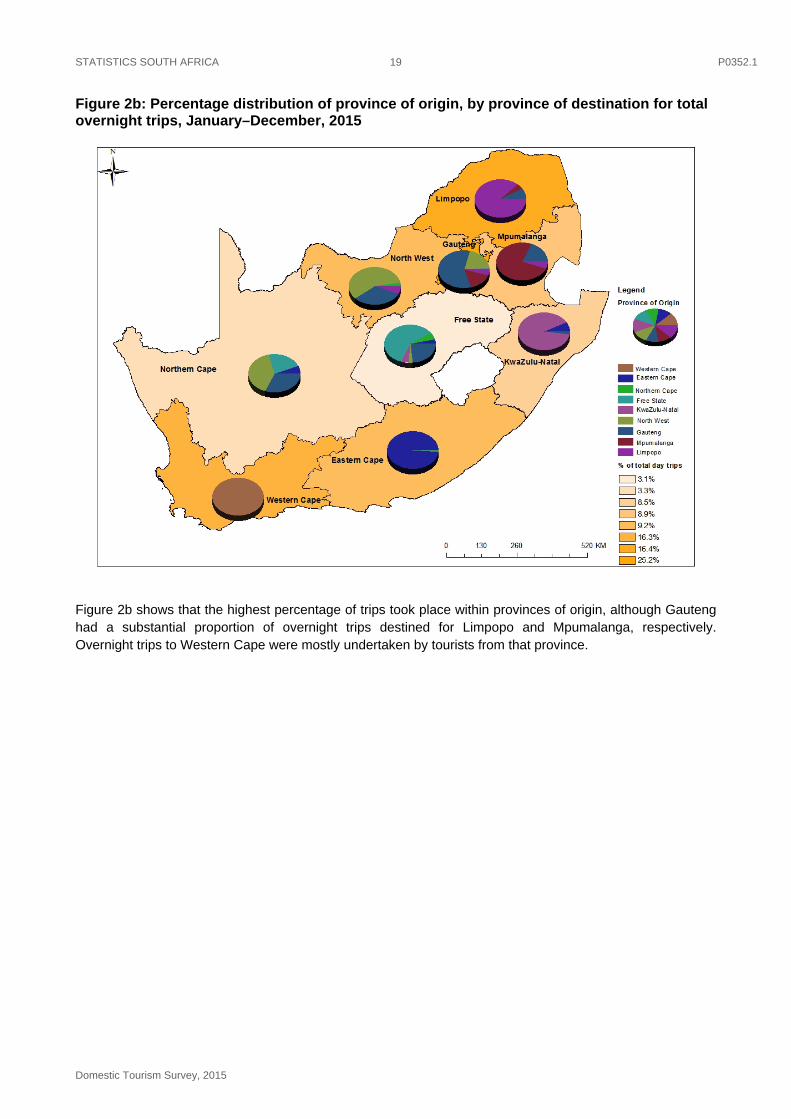
Figure 2b shows that the highest percentage of trips took place within provinces of origin, although Gauteng had a substantial proportion of overnight trips destined for Limpopo and Mpumalanga, respectively. Overnight trips to Western Cape were mostly undertaken by tourists from that province.
STATISTICS SOUTH AFRICA P0352.1
Domestic Tourism Survey, 2015
20
4.2 Analysis of tourism patterns by province of destination
Table 7a: Province of destination by most recent day trips, January–December, 2013, 2014 and 2015
Destination
Day trip
Number ('000) Per cent Number ('000) Per cent Number ('000) Per cent
2013 2014 2015
Western Cape 2 421 12,1 2 183 12,1 2 299 12,4
Eastern Cape 1 679 8,4 1 629 9,0 1 764 9,5
Northern Cape 690 3,5 671 3,7 636 3,4
Free State 951 4,8 886 4,9 718 3,9
KwaZulu-Natal 2 161 10,8 1 766 9,7 1 911 10,3
North West 1 657 8,3 1 510 8,3 1 475 8,0
Gauteng 4 854 24,3 4 704 26,0 4 278 23,1
Mpumalanga 2 080 10,4 1 450 8,0 1 745 9,4
Limpopo 3 003 15,0 2 806 15,5 3 156 17,1
Unspecified 503 2,5 511 2,8 499 2,7
Total 19 999 100,0 18 116 100,0 18 483 100,0
The results presented in Table 7a focus on day trips undertaken by day travellers and the province of destination during the reference period. Gauteng was consistently the most visited province in the country over the three years, followed by Limpopo and Western Cape. In contrast, over the three years, the two least visited provinces were Northern Cape and Free State.
Table 7b: Province of destination by most recent overnight trips, January–December, 2013, 2014 and 2015
Destination
Overnight trip
Number ('000) Per cent Number ('000) Per cent Number ('000) Per cent
2013 2014 2015
Western Cape 2 729 9,2 2 789 10,1 2 832 10,3
Eastern Cape 3 443 11,6 3 077 11,1 4 077 14,8
Northern Cape 869 2,9 795 2,9 694 2,5
Free State 1 522 5,1 1 576 5,7 1 280 4,6
KwaZulu-Natal 4 555 15,3 4 060 14,7 3 948 14,3
North West 2 106 7,1 1 993 7,2 1 972 7,2
Gauteng 3 637 12,3 3 430 12,4 3 120 11,3
Mpumalanga 2 907 9,8 2 673 9,7 2 626 9,5
Limpopo 4 498 15,1 4 219 15,2 4 297 15,6
Unspecified 3 423 11,5 3 076 11,1 2 706 9,8
Total 29 690 100,0 27 688 100,0 27 551 100,0
Table 7b shows that in 2013, KwaZulu-Natal was the most visited destination for overnight trips (4,6 million), whereas Limpopo was the most visited in 2014 (15,2 million trips) and 2015 (15,6 million trips). Northern Cape recorded the least number of overnight trips in the three years (2013: 869 thousand; 2014: 795 thousand; 2015: 694 thousand).
STATISTICS SOUTH AFRICA P0352.1
Domestic Tourism Survey, 2015
21
Figure 3a: Percentage distribution of main purpose of most recent day trips by province of destination, January–December, 2015
Figure 3a reflects the main purpose for which day travellers undertook trips to particular provinces. Shopping was the main reason that people travelled to provinces such as Eastern Cape, Northern Cape, Free State, North West, Mpumalanga and Limpopo. However, travellers primarily visited Gauteng and KwaZulu-Natal to visit friends and relatives. The only province in which leisure was the most stated reason for travel was Western Cape (also see Table 9 in this report).
STATISTICS SOUTH AFRICA P0352.1
Domestic Tourism Survey, 2015
22
Figure 3b: Percentage distribution of main purpose of most recent overnight trips by province of destination, January–December, 2015
Figure 3b above shows the main reasons why tourists visited particular provinces. In all provinces except Western Cape, the main purpose of taking overnight trips was to visit friends and relatives. Tourists travelled to Western Cape for leisure purposes, but visiting friends and relatives was the second most commonly stated purpose to visit this province. Undertaking travel for religious purposes was most prevalent in Limpopo. Tourists to that province provided that reason as the third most likely motive for visiting Limpopo (also see Table 10 in this report).
STATISTICS SOUTH AFRICA P0352.1
Domestic Tourism Survey, 2015
23
Table 8a: Trip distribution of province of destination by main mode of transport on most recent person day trips, January–December, 2013, 2014 and 2015
Province of destination
Air Bus Car Taxi
2013 2014 2015 2013 2014 2015 2013 2014 2015 2013 2014 2015
Western Cape 12,3 * 65,0 5,1 5,9 12,8 18,1 18,4 17,8 2,0 1,4 1,5
Eastern Cape 60,0 * 3,5 6,1 7,0 7,8 5,6 5,8 6,5 13,1 15,2 15,7
Northern Cape * * - 1,2 3,5 0,5 4,1 3,8 3,5 2,3 3,0 3,4
Free State * * 7,7 6,3 6,0 5,4 4,6 5,3 4,2 4,8 3,2 2,8
KwaZulu-Natal * * 12,5 7,7 5,4 11,4 10,3 8,5 10,3 12,7 11,2 10,2
North West * * - 5,5 8,4 4,9 8,6 7,6 8,4 8,0 10,7 7,7
Gauteng * 47,6 11,3 25,9 24,2 22,9 25,5 30,6 24,0 22,2 18,4 21,7
Mpumalanga * * - 11,9 9,1 9,1 10,2 7,6 10,4 10,6 8,2 7,9
Limpopo - * - 29,0 28,1 24,0 11,2 9,6 12,1 21,0 26,0 26,5
Unspecified - - - 1,4 2,5 1,2 2,0 2,7 2,8 3,4 2,8 2,6
South Africa 100,0 100,0 100,0 100,0 100,0 100,0 100,0 100,0 100,0 100,0 100,0 100,0
*Values based on three or less unweighted cases are considered too small to provide accurate estimates, and values are therefore replaced with asterisks
Table 8a shows that in 2015, almost two out of three trips taken by air were headed for Western Cape. The table further reflects that over the three-year period, trips where buses were used to travel, were mostly headed to Limpopo and Gauteng. Day travellers who used cars for their trips drove to Gauteng and Western Cape. The highest percentage of day travellers who used taxis travelled to Gauteng (22,2%) in 2013. In 2014 (26,0%) and 2015 (26,5%), the highest taxi use was recorded for those who travelled to Limpopo.
Table 8b: Trip distribution of province of destination by main mode of transport on most recent person overnight trips, January–December, 2013, 2014 and 2015
Province of destination
Air Bus Car Taxi
2013 2014 2015 2013 2014 2015 2013 2014 2015 2013 2014 2015
Western Cape 36,6 39,4 30,4 5,6 6,7 4,2 14,7 15,1 16,5 1,3 1,6 1,9
Eastern Cape 11,7 6,0 19,9 16,8 17,4 18,4 8,9 8,5 11,5 13,9 13,4 18,2
Northern Cape * * 1,1 2,1 1,9 1,0 4,0 3,8 3,1 1,7 1,7 1,6
Free State * * 0,5 3,2 3,3 3,5 5,8 6,7 4,9 5,2 5,3 4,7
KwaZulu-Natal 12,4 20,8 9,3 12,1 9,4 13,7 14,3 13,1 13,0 18,8 18,2 16,8
North West * * 1,3 3,1 3,1 3,5 7,4 8,0 7,3 8,1 7,6 8,0
Gauteng 17,2 18,4 18,6 17,0 15,3 12,7 10,6 11,8 10 13,0 13,1 12,4
Mpumalanga * 2,8 0,2 5,6 5,8 6,5 9,8 9,4 9,7 9,6 11,1 9,6
Limpopo 1,0 * 1,0 26,4 30,4 24,8 15,0 13,7 15,8 17,8 18,4 18,9
Unspecified 18,5 9,4 17,7 8,1 6,7 11,7 9,6 9,9 8,2 10,6 9,6 7,7
South Africa 100,0 100,0 100,0 100,0 100,0 100,0 100,0 100,0 100,0 100,0 100,0 100,0
*Values based on three or less unweighted cases are considered too small to provide accurate estimates, and values are therefore replaced with asterisks
As per Table 8b, most of the tourists who used aircraft travelled to Western Cape (36,6% in 2013, 39,4% in 2014 and 30,4% trips in 2015), followed by Gauteng (17,2% in 2013, 18,4% in 2014 and 18,6% in 2015). Cars, buses and taxis were mostly used to travel to Limpopo, KwaZulu-Natal, Western Cape and Gauteng. Those using buses for overnight trips to Limpopo showed an increase from 26,4% in 2013 to 30,4% in 2014, and then a decline to 24,8% in 2015.
STATISTICS SOUTH AFRICA P0352.1
Domestic Tourism Survey, 2015
24
Table 9: Province of destination by main purpose of most recent day trips, 2015
Province of destination
Main purpose ('000)
Leisure Shopping Sporting VFR Business Religion Funeral Medical/
health Study/
educational Other Unspecified Total Western Cape 1 298 256 62 405 62 55 35 39 9 80 - 2 299 Eastern Cape 51 839 15 242 95 58 142 140 10 164 7 1 764 Northern Cape 4 340 1 122 39 33 30 32 - 35 - 636
Free State 70 127 49 137 40 42 84 58 12 97 2 718 KwaZulu-Natal 288 471 54 463 95 113 129 48 40 209 - 1 911
North West 193 329 36 424 86 111 74 37 28 155 2 1 475
Gauteng 629 875 16 1 348 201 258 262 138 107 417 27 4 278
Mpumalanga 192 421 19 563 69 54 179 34 26 171 17 1 745
Limpopo 273 1 280 108 555 81 238 192 114 87 219 10 3 156
Unspecified 90 124 - 143 22 34 41 17 - 14 16 499 South Africa 3 088 5 062 360 4 403 790 994 1 168 658 320 1 561 79 18 483
*Values based on three or less unweighted cases are considered too small to provide accurate estimates, and values are therefore replaced with asterisks 'Other' includes 'Wellness', 'Child care', 'Cultural occasion', 'Other social events', etc.
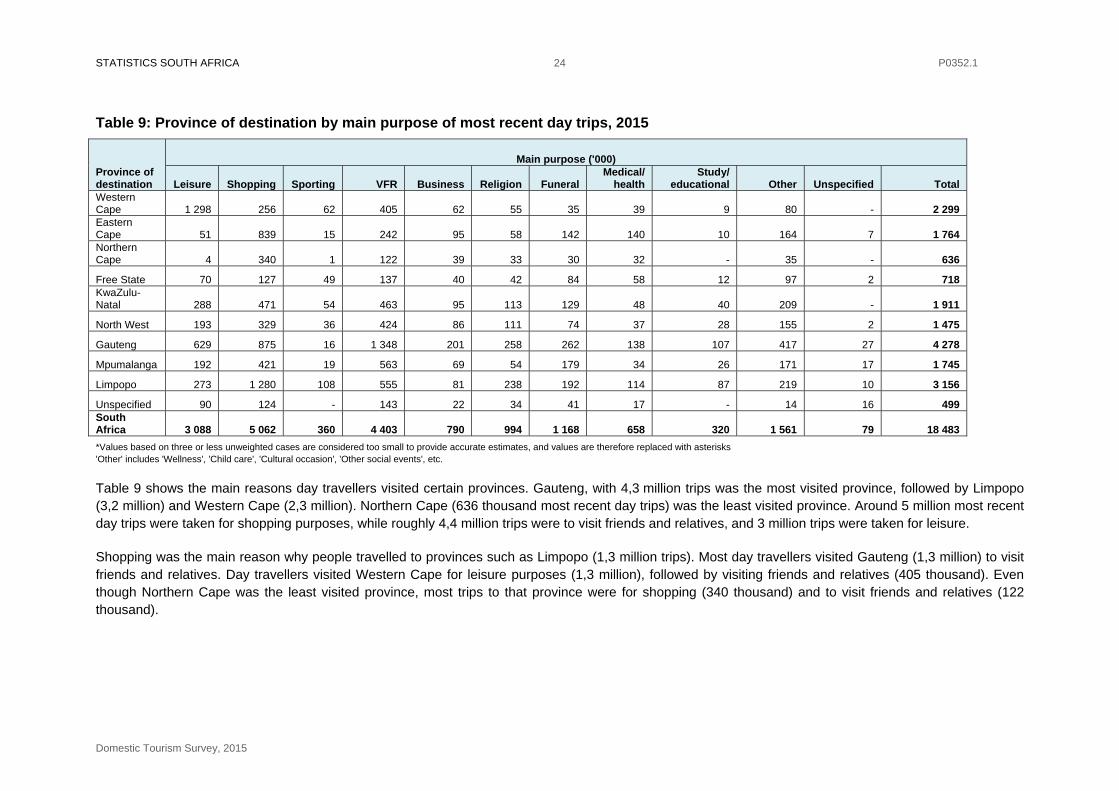
Table 9 shows the main reasons day travellers visited certain provinces. Gauteng, with 4,3 million trips was the most visited province, followed by Limpopo (3,2 million) and Western Cape (2,3 million). Northern Cape (636 thousand most recent day trips) was the least visited province. Around 5 million most recent day trips were taken for shopping purposes, while roughly 4,4 million trips were to visit friends and relatives, and 3 million trips were taken for leisure.
Shopping was the main reason why people travelled to provinces such as Limpopo (1,3 million trips). Most day travellers visited Gauteng (1,3 million) to visit friends and relatives. Day travellers visited Western Cape for leisure purposes (1,3 million), followed by visiting friends and relatives (405 thousand). Even though Northern Cape was the least visited province, most trips to that province were for shopping (340 thousand) and to visit friends and relatives (122 thousand).
STATISTICS SOUTH AFRICA P0352.1
Domestic Tourism Survey, 2015
25
Table 10: Province of destination by main purpose of most recent overnight trips, 2015
Province of destination
Main purpose ('000)
Leisure Shopping Sporting VFR Business Religion Funeral Cultural
occasion Medical/
Health Other Unspecified Total
Western Cape 1 779 12 73 626 91 37 96 8 34 77 - 2 832
Eastern Cape 761 15 9 1 611 63 185 859 252 23 289 10 4 077
Northern Cape 92 5 - 333 54 37 87 13 16 55 1 694
Free State 88 9 21 608 28 94 273 56 34 69 2 1 280
KwaZulu-Natal 836 45 23 1 965 70 287 330 74 28 269 20 3 948
North West 153 7 9 1 060 9 145 376 - 3 202 9 1 972
Gauteng 201 33 18 1 964 116 251 324 13 53 139 6 3 120
Mpumalanga 231 7 23 1 417 13 113 528 56 6 87 15 2 495
Limpopo 380 17 21 2 627 107 494 710 21 24 257 14 4 672
Unspecified 569 11 18 1 216 57 81 323 13 14 72 88 2 461
South Africa 5 089 160 215 13 426 607 1 723 3 906 508 235 1 517 164 27 551
*Values based on three or less unweighted cases are considered too small to provide accurate estimates, and values are therefore replaced with asterisks 'Other' includes 'Study/educational', Wellness', 'Child care', 'Other social events', etc.
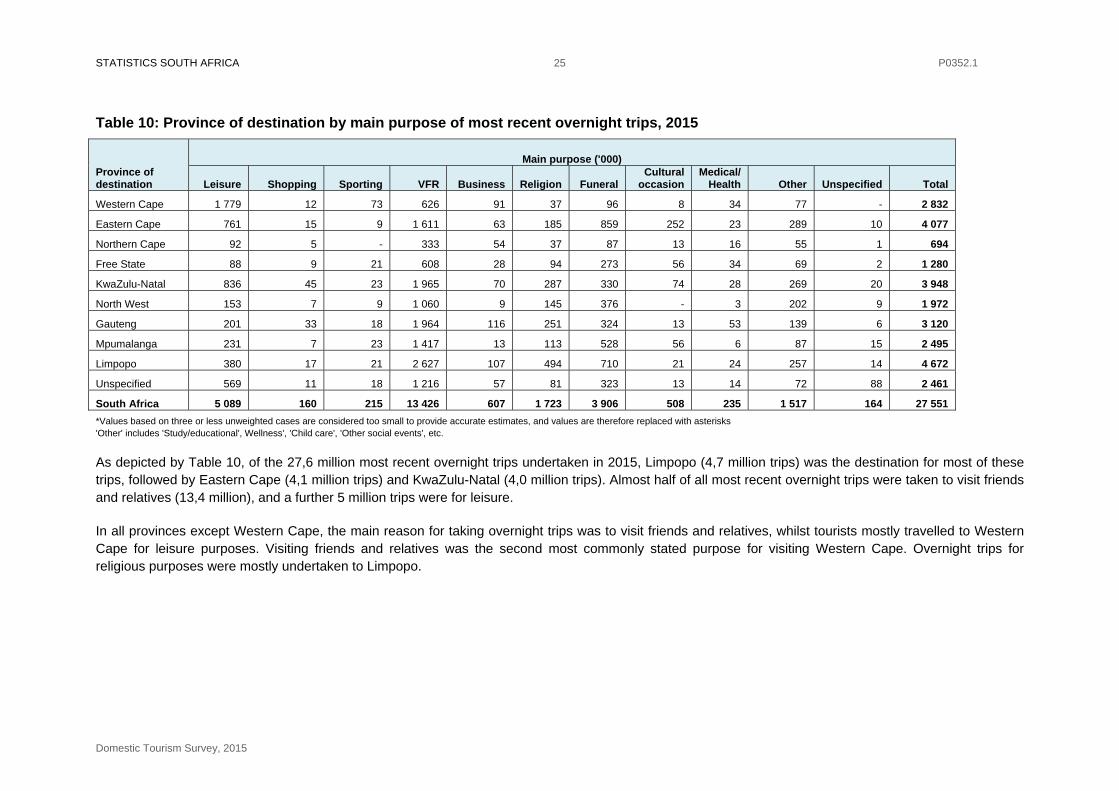
As depicted by Table 10, of the 27,6 million most recent overnight trips undertaken in 2015, Limpopo (4,7 million trips) was the destination for most of these trips, followed by Eastern Cape (4,1 million trips) and KwaZulu-Natal (4,0 million trips). Almost half of all most recent overnight trips were taken to visit friends and relatives (13,4 million), and a further 5 million trips were for leisure.
In all provinces except Western Cape, the main reason for taking overnight trips was to visit friends and relatives, whilst tourists mostly travelled to Western Cape for leisure purposes. Visiting friends and relatives was the second most commonly stated purpose for visiting Western Cape. Overnight trips for religious purposes were mostly undertaken to Limpopo.
STATISTICS SOUTH AFRICA P0352.1
Domestic Tourism Survey, 2015
26
Table 11: Province of destination for most recent overnight trips by principal type of accommodation utilised, January–December, 2015
Province of destination
Accommodation ('000)
Hotel
Guest house/
guest farm Bed and breakfast Lodge
Hostel/ backpackers
Self-catering establishment
Stayed with
friends and
relatives
Holiday home/
second home Campsite
Caravan park Other1 Unspecified Total
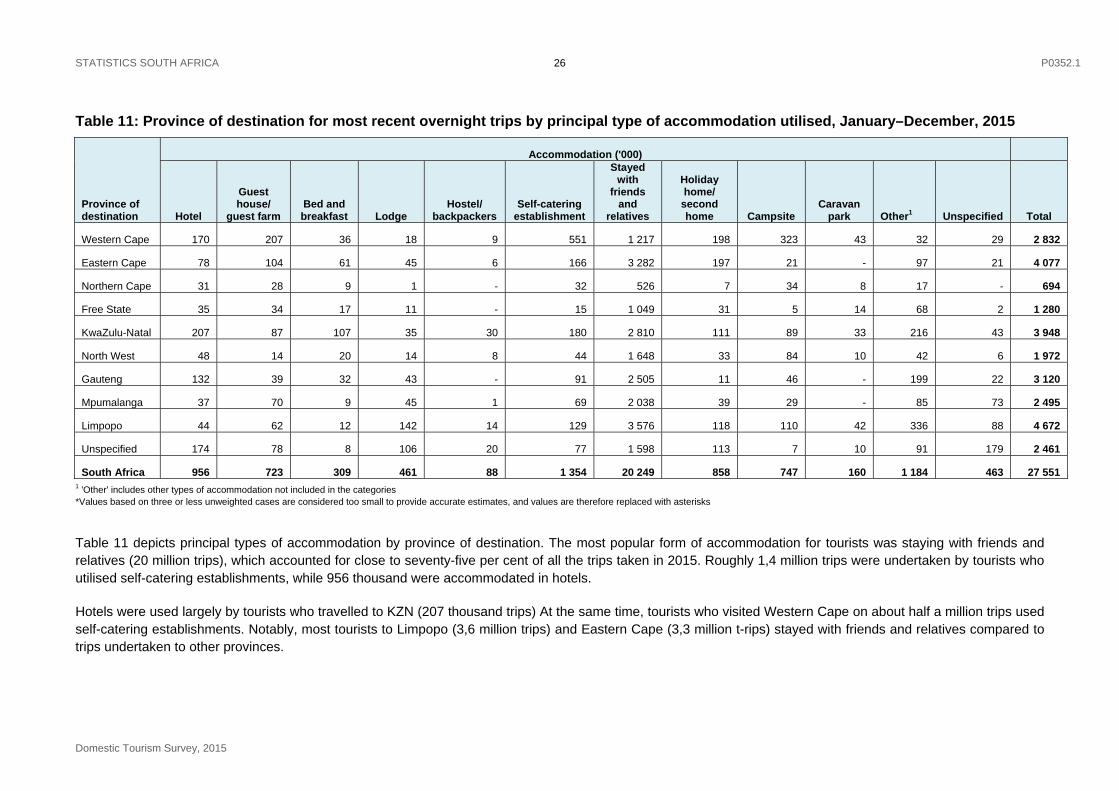
Western Cape 170 207 36 18 9 551 1 217 198 323 43 32 29 2 832
Eastern Cape 78 104 61 45 6 166 3 282 197 21 - 97 21 4 077
Northern Cape 31 28 9 1 - 32 526 7 34 8 17 - 694
Free State 35 34 17 11 - 15 1 049 31 5 14 68 2 1 280
KwaZulu-Natal 207 87 107 35 30 180 2 810 111 89 33 216 43 3 948
North West 48 14 20 14 8 44 1 648 33 84 10 42 6 1 972
Gauteng 132 39 32 43 - 91 2 505 11 46 - 199 22 3 120
Mpumalanga 37 70 9 45 1 69 2 038 39 29 - 85 73 2 495
Limpopo 44 62 12 142 14 129 3 576 118 110 42 336 88 4 672
Unspecified 174 78 8 106 20 77 1 598 113 7 10 91 179 2 461
South Africa 956 723 309 461 88 1 354 20 249 858 747 160 1 184 463 27 551 1 'Other' includes other types of accommodation not included in the categories *Values based on three or less unweighted cases are considered too small to provide accurate estimates, and values are therefore replaced with asterisks
Table 11 depicts principal types of accommodation by province of destination. The most popular form of accommodation for tourists was staying with friends and relatives (20 million trips), which accounted for close to seventy-five per cent of all the trips taken in 2015. Roughly 1,4 million trips were undertaken by tourists who utilised self-catering establishments, while 956 thousand were accommodated in hotels.
Hotels were used largely by tourists who travelled to KZN (207 thousand trips) At the same time, tourists who visited Western Cape on about half a million trips used self-catering establishments. Notably, most tourists to Limpopo (3,6 million trips) and Eastern Cape (3,3 million t-rips) stayed with friends and relatives compared to trips undertaken to other provinces.
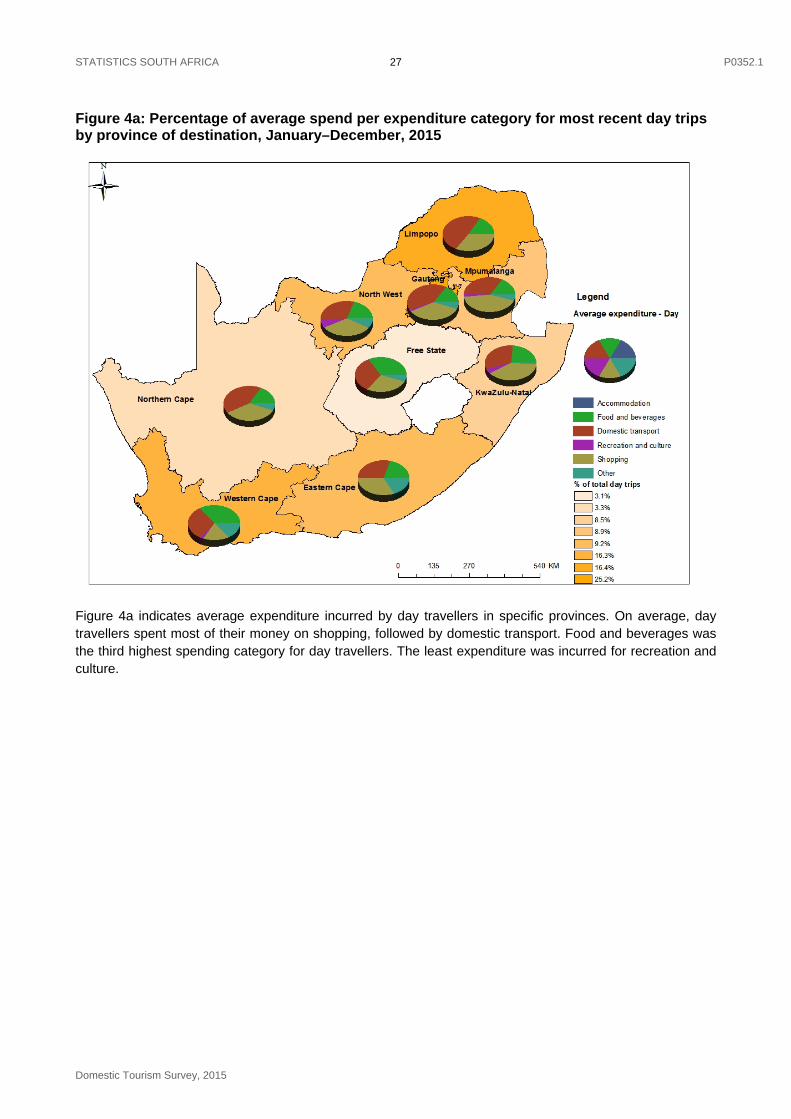
STATISTICS SOUTH AFRICA P0352.1
Domestic Tourism Survey, 2015
27
Figure 4a: Percentage of average spend per expenditure category for most recent day trips by province of destination, January–December, 2015
Figure 4a indicates average expenditure incurred by day travellers in specific provinces. On average, day travellers spent most of their money on shopping, followed by domestic transport. Food and beverages was the third highest spending category for day travellers. The least expenditure was incurred for recreation and culture.
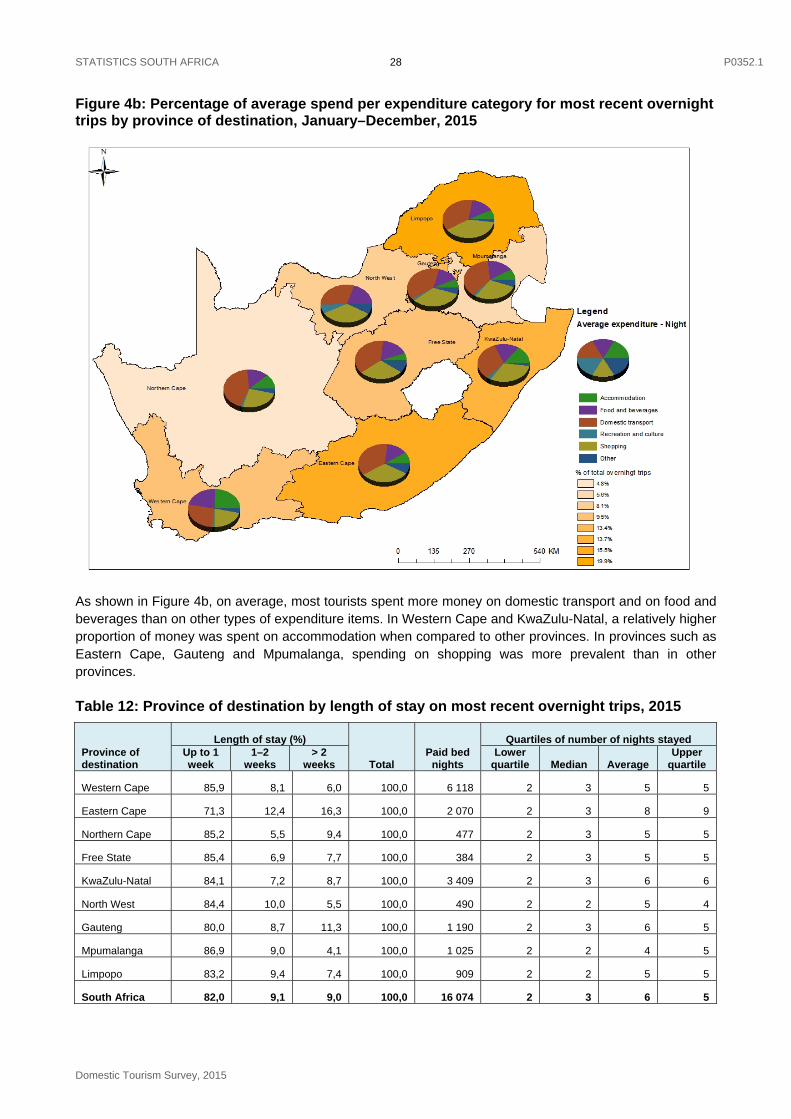
STATISTICS SOUTH AFRICA P0352.1
Domestic Tourism Survey, 2015
28
Figure 4b: Percentage of average spend per expenditure category for most recent overnight trips by province of destination, January–December, 2015
As shown in Figure 4b, on average, most tourists spent more money on domestic transport and on food and beverages than on other types of expenditure items. In Western Cape and KwaZulu-Natal, a relatively higher proportion of money was spent on accommodation when compared to other provinces. In provinces such as Eastern Cape, Gauteng and Mpumalanga, spending on shopping was more prevalent than in other provinces.
Table 12: Province of destination by length of stay on most recent overnight trips, 2015
Province of destination
Length of stay (%)
Total Paid bed
nights
Quartiles of number of nights stayed Up to 1 week
1–2 weeks
> 2 weeks
Lower quartile Median Average
Upper quartile
Western Cape 85,9 8,1 6,0 100,0 6 118 2 3 5 5
Eastern Cape 71,3 12,4 16,3 100,0 2 070 2 3 8 9
Northern Cape 85,2 5,5 9,4 100,0 477 2 3 5 5
Free State 85,4 6,9 7,7 100,0 384 2 3 5 5
KwaZulu-Natal 84,1 7,2 8,7 100,0 3 409 2 3 6 6
North West 84,4 10,0 5,5 100,0 490 2 2 5 4
Gauteng 80,0 8,7 11,3 100,0 1 190 2 3 6 5
Mpumalanga 86,9 9,0 4,1 100,0 1 025 2 2 4 5
Limpopo 83,2 9,4 7,4 100,0 909 2 2 5 5
South Africa 82,0 9,1 9,0 100,0 16 074 2 3 6 5
STATISTICS SOUTH AFRICA P0352.1
Domestic Tourism Survey, 2015
29
Length of stay
The majority of tourists who undertook overnight trips in 2015 stayed up to one week at their destination (82,0%), followed by those who stayed between one to two weeks (9,1%). Almost 87% of tourists who went to Mpumalanga stayed for up to one week, yet a relatively higher proportion of Eastern Cape tourists stayed longer than two weeks (16,3%) when compared to other provinces.
Paid bed nights
About 16,1 million paid bed nights were spent on overnight trips during the reference period. Of this total, 6,1 million were spent in the Western Cape, about 3,4 million nights were spent in KwaZulu-Natal and 2 million in Eastern Cape. Northern Cape and Free State had the lowest number of paid bed nights (477 thousand and 384 thousand, respectively) spent by tourists in 2015.
Quartiles of number of nights stayed
On average, South African residents stayed for approximately six nights at their destination while on overnight trips. The bottom 25% of tourists stayed for roughly two nights; the median number of nights stayed at destinations were three nights, and the top quarter of domestic tourists stayed for five nights. The Eastern Cape had the highest number of average nights spent in a province (eight nights).
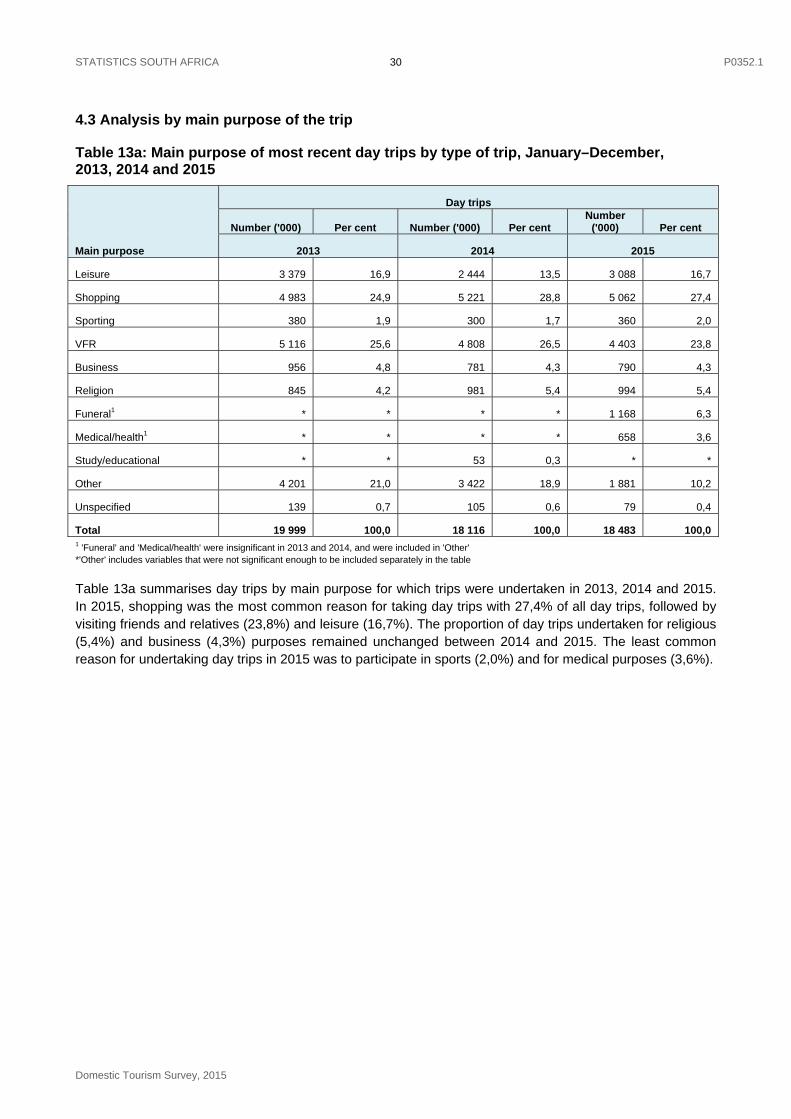
STATISTICS SOUTH AFRICA P0352.1
Domestic Tourism Survey, 2015
30
4.3 Analysis by main purpose of the trip
Table 13a: Main purpose of most recent day trips by type of trip, January–December, 2013, 2014 and 2015
Main purpose
Day trips
Number ('000) Per cent Number ('000) Per cent Number
('000) Per cent
2013 2014 2015
Leisure 3 379 16,9 2 444 13,5 3 088 16,7
Shopping 4 983 24,9 5 221 28,8 5 062 27,4
Sporting 380 1,9 300 1,7 360 2,0
VFR 5 116 25,6 4 808 26,5 4 403 23,8
Business 956 4,8 781 4,3 790 4,3
Religion 845 4,2 981 5,4 994 5,4
Funeral1 * * * * 1 168 6,3
Medical/health1 * * * * 658 3,6
Study/educational * * 53 0,3 * *
Other 4 201 21,0 3 422 18,9 1 881 10,2
Unspecified 139 0,7 105 0,6 79 0,4
Total 19 999 100,0 18 116 100,0 18 483 100,0 1 'Funeral' and 'Medical/health' were insignificant in 2013 and 2014, and were included in 'Other' *'Other' includes variables that were not significant enough to be included separately in the table
Table 13a summarises day trips by main purpose for which trips were undertaken in 2013, 2014 and 2015. In 2015, shopping was the most common reason for taking day trips with 27,4% of all day trips, followed by visiting friends and relatives (23,8%) and leisure (16,7%). The proportion of day trips undertaken for religious (5,4%) and business (4,3%) purposes remained unchanged between 2014 and 2015. The least common reason for undertaking day trips in 2015 was to participate in sports (2,0%) and for medical purposes (3,6%).
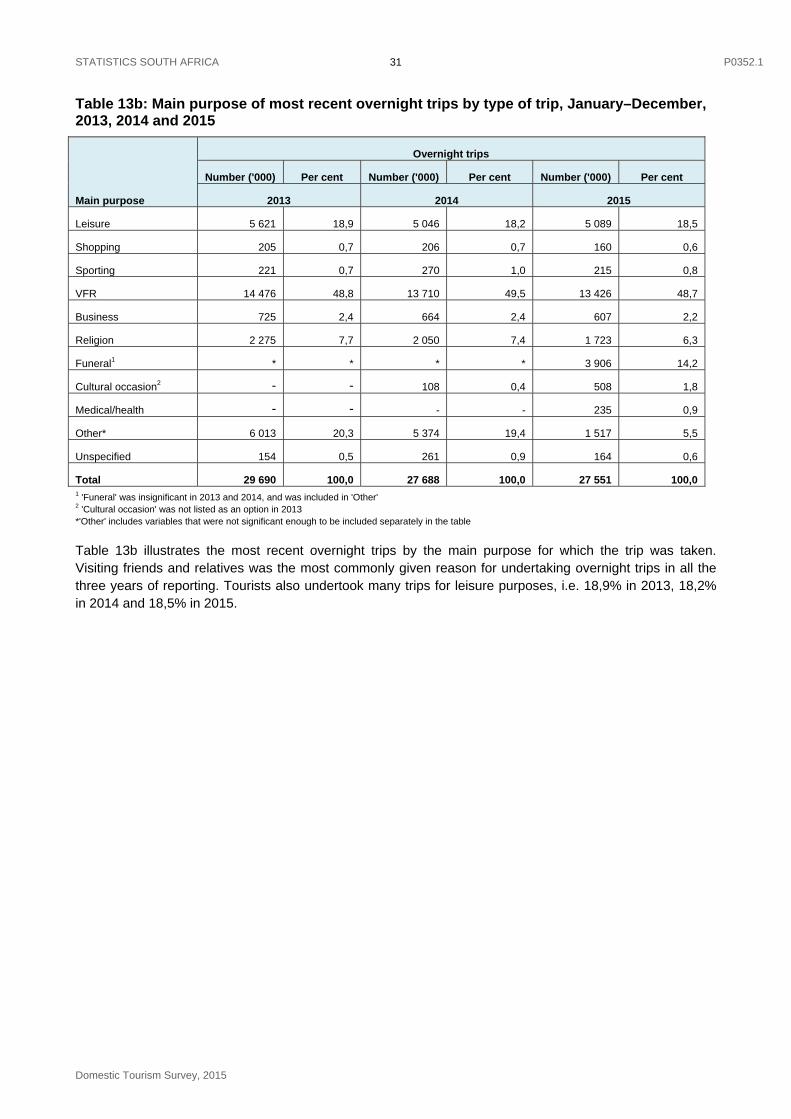
STATISTICS SOUTH AFRICA P0352.1
Domestic Tourism Survey, 2015
31
Table 13b: Main purpose of most recent overnight trips by type of trip, January–December, 2013, 2014 and 2015
Main purpose
Overnight trips
Number ('000) Per cent Number ('000) Per cent Number ('000) Per cent
2013 2014 2015
Leisure 5 621 18,9 5 046 18,2 5 089 18,5
Shopping 205 0,7 206 0,7 160 0,6
Sporting 221 0,7 270 1,0 215 0,8
VFR 14 476 48,8 13 710 49,5 13 426 48,7
Business 725 2,4 664 2,4 607 2,2
Religion 2 275 7,7 2 050 7,4 1 723 6,3
Funeral1 * * * * 3 906 14,2
Cultural occasion2 - - 108 0,4 508 1,8
Medical/health - - - - 235 0,9
Other* 6 013 20,3 5 374 19,4 1 517 5,5
Unspecified 154 0,5 261 0,9 164 0,6
Total 29 690 100,0 27 688 100,0 27 551 100,0 1 'Funeral' was insignificant in 2013 and 2014, and was included in 'Other' 2 'Cultural occasion' was not listed as an option in 2013 *'Other' includes variables that were not significant enough to be included separately in the table
Table 13b illustrates the most recent overnight trips by the main purpose for which the trip was taken. Visiting friends and relatives was the most commonly given reason for undertaking overnight trips in all the three years of reporting. Tourists also undertook many trips for leisure purposes, i.e. 18,9% in 2013, 18,2% in 2014 and 18,5% in 2015.
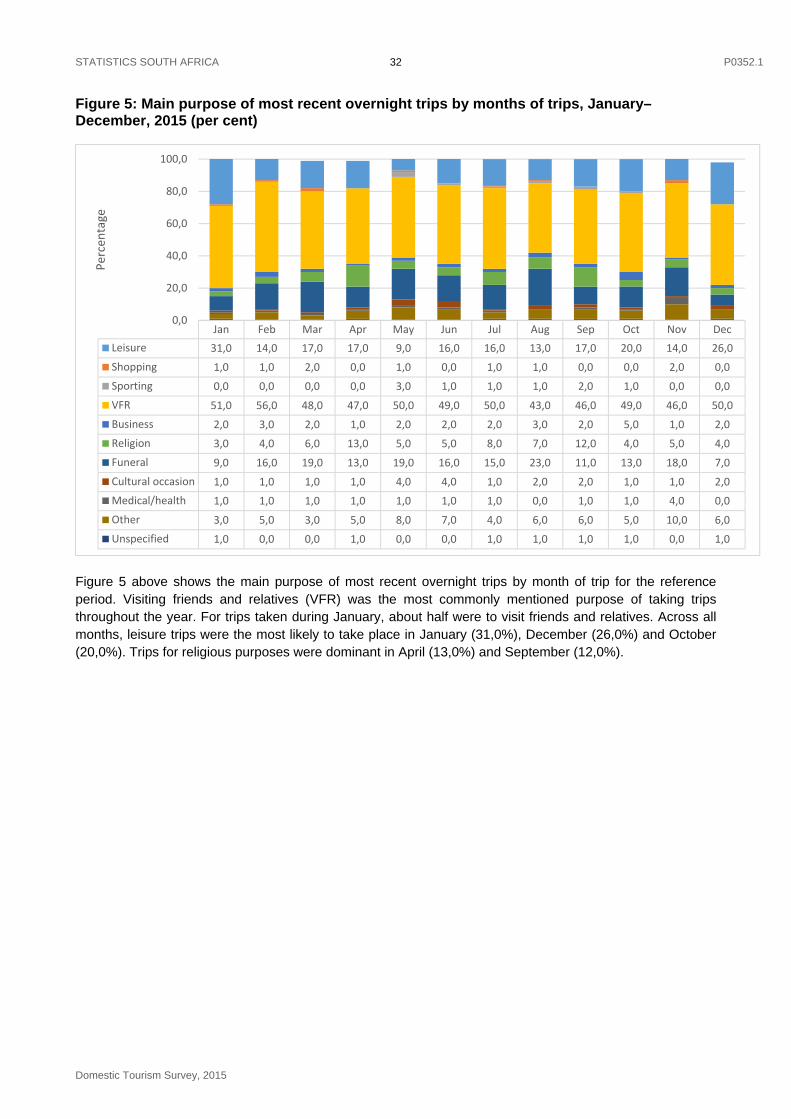
STATISTICS SOUTH AFRICA P0352.1
Domestic Tourism Survey, 2015
32
Figure 5: Main purpose of most recent overnight trips by months of trips, January–December, 2015 (per cent)
Figure 5 above shows the main purpose of most recent overnight trips by month of trip for the reference period. Visiting friends and relatives (VFR) was the most commonly mentioned purpose of taking trips throughout the year. For trips taken during January, about half were to visit friends and relatives. Across all months, leisure trips were the most likely to take place in January (31,0%), December (26,0%) and October (20,0%). Trips for religious purposes were dominant in April (13,0%) and September (12,0%).
Jan Feb Mar Apr May Jun Jul Aug Sep Oct Nov Dec
Leisure 31,0 14,0 17,0 17,0 9,0 16,0 16,0 13,0 17,0 20,0 14,0 26,0
Shopping 1,0 1,0 2,0 0,0 1,0 0,0 1,0 1,0 0,0 0,0 2,0 0,0
Sporting 0,0 0,0 0,0 0,0 3,0 1,0 1,0 1,0 2,0 1,0 0,0 0,0
VFR 51,0 56,0 48,0 47,0 50,0 49,0 50,0 43,0 46,0 49,0 46,0 50,0
Business 2,0 3,0 2,0 1,0 2,0 2,0 2,0 3,0 2,0 5,0 1,0 2,0
Religion 3,0 4,0 6,0 13,0 5,0 5,0 8,0 7,0 12,0 4,0 5,0 4,0
Funeral 9,0 16,0 19,0 13,0 19,0 16,0 15,0 23,0 11,0 13,0 18,0 7,0
Cultural occasion 1,0 1,0 1,0 1,0 4,0 4,0 1,0 2,0 2,0 1,0 1,0 2,0
Medical/health 1,0 1,0 1,0 1,0 1,0 1,0 1,0 0,0 1,0 1,0 4,0 0,0
Other 3,0 5,0 3,0 5,0 8,0 7,0 4,0 6,0 6,0 5,0 10,0 6,0
Unspecified 1,0 0,0 0,0 1,0 0,0 0,0 1,0 1,0 1,0 1,0 0,0 1,0
0,0
20,0
40,0
60,0
80,0
100,0
Percentage
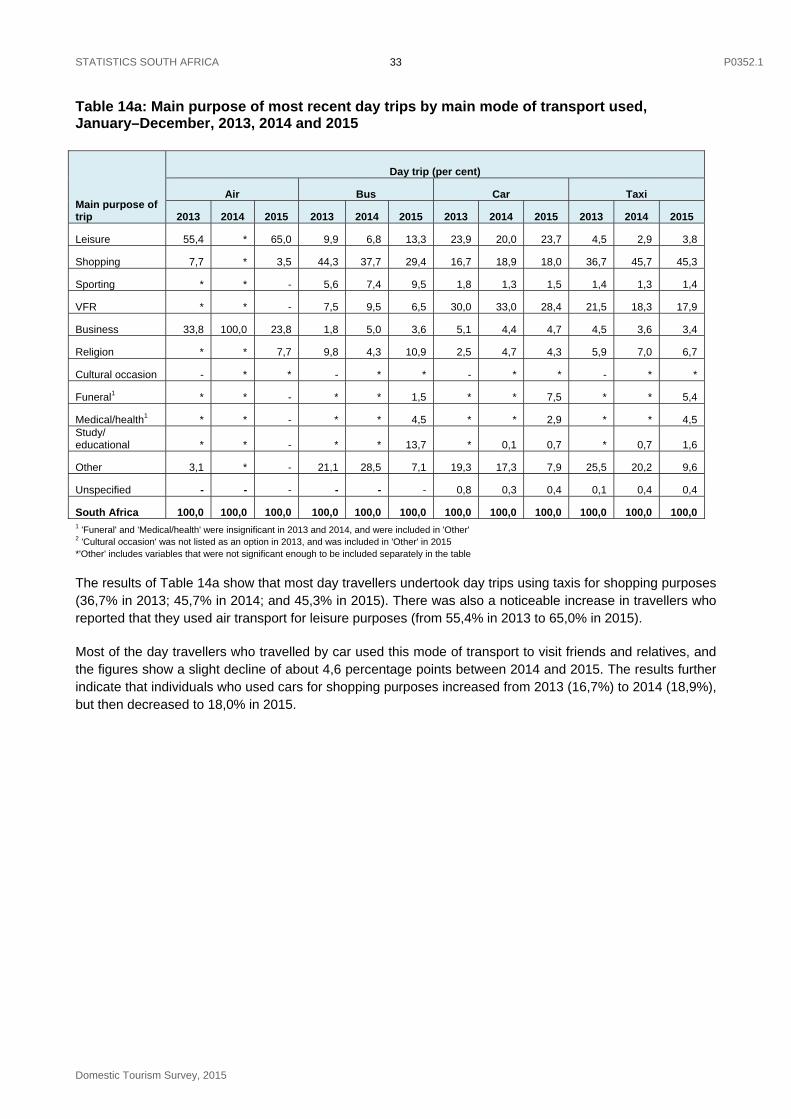
STATISTICS SOUTH AFRICA P0352.1
Domestic Tourism Survey, 2015
33
Table 14a: Main purpose of most recent day trips by main mode of transport used, January–December, 2013, 2014 and 2015
1 'Funeral' and 'Medical/health' were insignificant in 2013 and 2014, and were included in 'Other' 2 'Cultural occasion' was not listed as an option in 2013, and was included in 'Other' in 2015 *'Other' includes variables that were not significant enough to be included separately in the table
The results of Table 14a show that most day travellers undertook day trips using taxis for shopping purposes (36,7% in 2013; 45,7% in 2014; and 45,3% in 2015). There was also a noticeable increase in travellers who reported that they used air transport for leisure purposes (from 55,4% in 2013 to 65,0% in 2015).
Most of the day travellers who travelled by car used this mode of transport to visit friends and relatives, and the figures show a slight decline of about 4,6 percentage points between 2014 and 2015. The results further indicate that individuals who used cars for shopping purposes increased from 2013 (16,7%) to 2014 (18,9%), but then decreased to 18,0% in 2015.
Main purpose of trip
Day trip (per cent)
Air Bus Car Taxi
2013 2014 2015 2013 2014 2015 2013 2014 2015 2013 2014 2015
Leisure 55,4 * 65,0 9,9 6,8 13,3 23,9 20,0 23,7 4,5 2,9 3,8
Shopping 7,7 * 3,5 44,3 37,7 29,4 16,7 18,9 18,0 36,7 45,7 45,3
Sporting * * - 5,6 7,4 9,5 1,8 1,3 1,5 1,4 1,3 1,4
VFR * * - 7,5 9,5 6,5 30,0 33,0 28,4 21,5 18,3 17,9
Business 33,8 100,0 23,8 1,8 5,0 3,6 5,1 4,4 4,7 4,5 3,6 3,4
Religion * * 7,7 9,8 4,3 10,9 2,5 4,7 4,3 5,9 7,0 6,7
Cultural occasion - * * - * * - * * - * *
Funeral1 * * - * * 1,5 * * 7,5 * * 5,4
Medical/health1 * * - * * 4,5 * * 2,9 * * 4,5 Study/ educational * * - * * 13,7 * 0,1 0,7 * 0,7 1,6
Other 3,1 * - 21,1 28,5 7,1 19,3 17,3 7,9 25,5 20,2 9,6
Unspecified - - - - - - 0,8 0,3 0,4 0,1 0,4 0,4
South Africa 100,0 100,0 100,0 100,0 100,0 100,0 100,0 100,0 100,0 100,0 100,0 100,0

STATISTICS SOUTH AFRICA P0352.1
Domestic Tourism Survey, 2015
34
Table 14b: Main purpose of most recent overnight trips by main mode of transport used, January–December, 2013, 2014 and 2015
Main purpose of trip
Overnight trip (per cent)
Air Bus Car Taxi
2013 2014 2015 2013 2014 2015 2013 2014 2015 2013 2014 2015
Leisure 42,9 34,6 44,3 8,6 10,0 12,0 30,9 29,3 28,5 4,1 3,5 4,8
Shopping * 1,9 - 0,6 1,5 1,1 0,7 0,6 0,4 0,6 0,5 0,7
Sporting * * 2,8 2,2 1,1 1,1 0,8 1,3 1,0 0,2 0,5 0,3
VFR 24,6 25,9 22,3 46,4 45,2 46,6 41,8 44,2 42,8 60,4 60,8 60,4
Business 19,6 27,3 20,8 2,2 1,2 1,7 2,3 2,1 2,1 1,2 1,1 1,0
Religion * 1,4 0,5 22,2 21,9 15,8 3,5 3,9 4,0 10,0 9,4 7,2
Funeral * * 7,9 * * 11,3 * * 12,9 * * 16,8
Cultural occasion** - * - - * 2,5 - 0,5 1,6 - 0,3 2,2
Medical/health * * 0,4 * * 0,9 * * 0,8 * * 0,8
Other 10,7 7,8 1,0 16,8 18,7 6,4 19,6 17,3 5,6 20,3 23,3 5,5
Unspecified 2,2 - - 1,0 0,4 0,7 0,4 0,8 0,3 0,5 0,6 0,3
Total 100,0 100,0 100,0 100,0 100,0 100,0 100,0 100,0 100,0 100,0 100,0 100,0 1 'Funeral' and 'Medical/health' were insignificant in 2013 and 2014, and were included in 'Other' 2 'Cultural occasion' was not listed as an option in 2013, and was included in 'Other' in 2015 *'Other' includes variables that were not significant enough to be included separately in the table
Table 14b reports that air travel was used mostly by tourists on leisure trips, and secondly by those who visited friends and relatives, in the years under review. However, cars were preferred by tourists who took trips to visit friends and relatives since they were used in roughly four out of ten trips, followed by those who travelled for leisure.
Buses were the most popular mode of transport to tourists who visited friends and relatives, accounting for more than four out of ten trips taken from 2013 to 2015. This type of transport was also used to a large extent by those who travelled for religious purposes during those years. Taxis were overwhelmingly used by tourists who visited friends and relatives because about sixty per cent used taxis across all the years used them for this purpose.
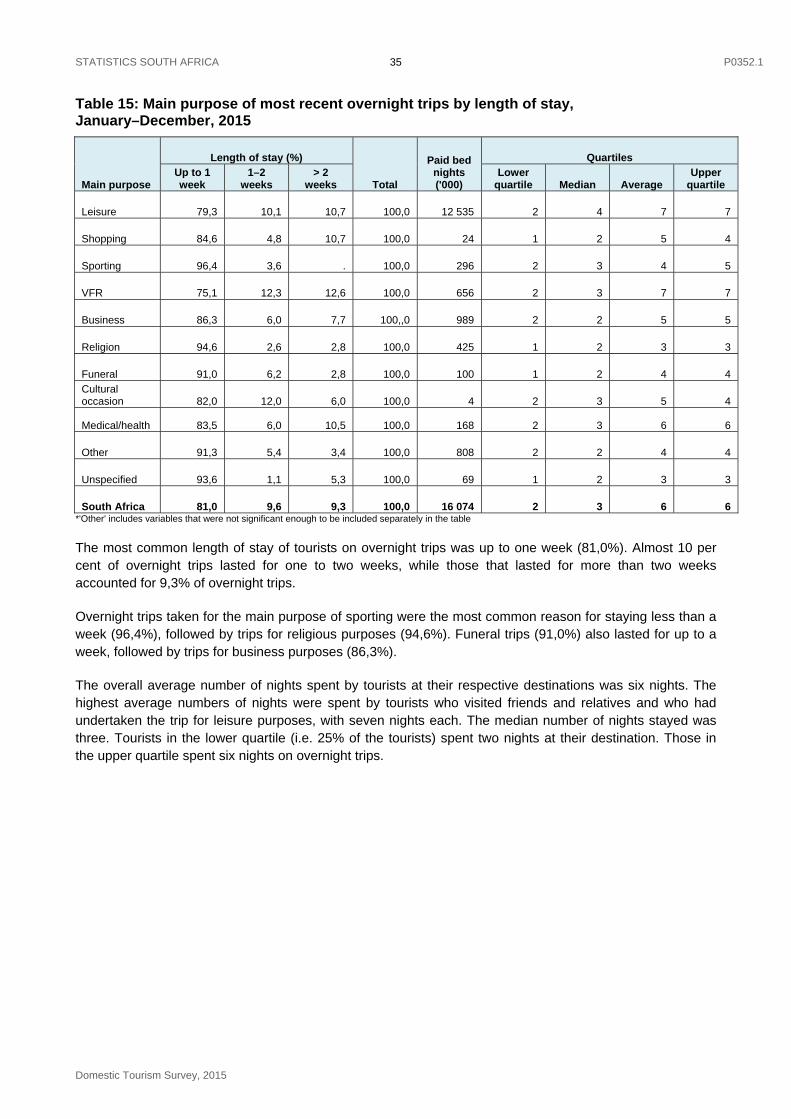
STATISTICS SOUTH AFRICA P0352.1
Domestic Tourism Survey, 2015
35
Table 15: Main purpose of most recent overnight trips by length of stay, January–December, 2015
Main purpose
Length of stay (%)
Total
Paid bed nights ('000)
Quartiles
Up to 1 week
1–2 weeks
> 2 weeks
Lower quartile Median Average
Upper quartile
Leisure 79,3 10,1 10,7 100,0 12 535 2 4 7 7
Shopping 84,6 4,8 10,7 100,0 24 1 2 5 4
Sporting 96,4 3,6 . 100,0 296 2 3 4 5
VFR 75,1 12,3 12,6 100,0 656 2 3 7 7
Business 86,3 6,0 7,7 100,,0 989 2 2 5 5
Religion 94,6 2,6 2,8 100,0 425 1 2 3 3
Funeral 91,0 6,2 2,8 100,0 100 1 2 4 4
Cultural occasion 82,0 12,0 6,0 100,0 4 2 3 5 4
Medical/health 83,5 6,0 10,5 100,0 168 2 3 6 6
Other 91,3 5,4 3,4 100,0 808 2 2 4 4
Unspecified 93,6 1,1 5,3 100,0 69 1 2 3 3
South Africa 81,0 9,6 9,3 100,0 16 074 2 3 6 6 *'Other' includes variables that were not significant enough to be included separately in the table
The most common length of stay of tourists on overnight trips was up to one week (81,0%). Almost 10 per cent of overnight trips lasted for one to two weeks, while those that lasted for more than two weeks accounted for 9,3% of overnight trips.
Overnight trips taken for the main purpose of sporting were the most common reason for staying less than a week (96,4%), followed by trips for religious purposes (94,6%). Funeral trips (91,0%) also lasted for up to a week, followed by trips for business purposes (86,3%).
The overall average number of nights spent by tourists at their respective destinations was six nights. The highest average numbers of nights were spent by tourists who visited friends and relatives and who had undertaken the trip for leisure purposes, with seven nights each. The median number of nights stayed was three. Tourists in the lower quartile (i.e. 25% of the tourists) spent two nights at their destination. Those in the upper quartile spent six nights on overnight trips.
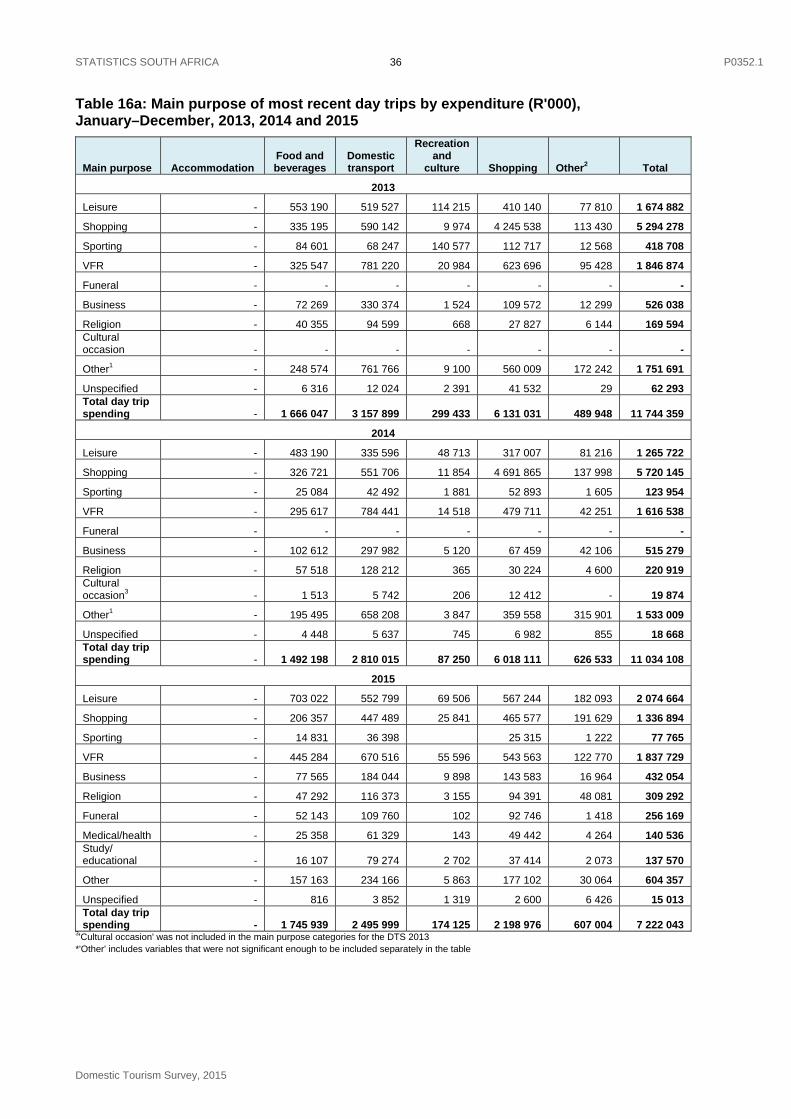
STATISTICS SOUTH AFRICA P0352.1
Domestic Tourism Survey, 2015
36
Table 16a: Main purpose of most recent day trips by expenditure (R'000), January–December, 2013, 2014 and 2015
Main purpose Accommodation Food and beverages
Domestic transport
Recreation and
culture Shopping Other2 Total
2013
Leisure - 553 190 519 527 114 215 410 140 77 810 1 674 882
Shopping - 335 195 590 142 9 974 4 245 538 113 430 5 294 278
Sporting - 84 601 68 247 140 577 112 717 12 568 418 708
VFR - 325 547 781 220 20 984 623 696 95 428 1 846 874
Funeral - - - - - - -
Business - 72 269 330 374 1 524 109 572 12 299 526 038
Religion - 40 355 94 599 668 27 827 6 144 169 594 Cultural occasion - - - - - - -
Other1 - 248 574 761 766 9 100 560 009 172 242 1 751 691
Unspecified - 6 316 12 024 2 391 41 532 29 62 293 Total day trip spending - 1 666 047 3 157 899 299 433 6 131 031 489 948 11 744 359
2014
Leisure - 483 190 335 596 48 713 317 007 81 216 1 265 722
Shopping - 326 721 551 706 11 854 4 691 865 137 998 5 720 145
Sporting - 25 084 42 492 1 881 52 893 1 605 123 954
VFR - 295 617 784 441 14 518 479 711 42 251 1 616 538
Funeral - - - - - - -
Business - 102 612 297 982 5 120 67 459 42 106 515 279
Religion - 57 518 128 212 365 30 224 4 600 220 919 Cultural occasion3 - 1 513 5 742 206 12 412 - 19 874
Other1 - 195 495 658 208 3 847 359 558 315 901 1 533 009
Unspecified - 4 448 5 637 745 6 982 855 18 668 Total day trip spending - 1 492 198 2 810 015 87 250 6 018 111 626 533 11 034 108
2015
Leisure - 703 022 552 799 69 506 567 244 182 093 2 074 664
Shopping - 206 357 447 489 25 841 465 577 191 629 1 336 894
Sporting - 14 831 36 398 25 315 1 222 77 765
VFR - 445 284 670 516 55 596 543 563 122 770 1 837 729
Business - 77 565 184 044 9 898 143 583 16 964 432 054
Religion - 47 292 116 373 3 155 94 391 48 081 309 292
Funeral - 52 143 109 760 102 92 746 1 418 256 169
Medical/health - 25 358 61 329 143 49 442 4 264 140 536 Study/ educational - 16 107 79 274 2 702 37 414 2 073 137 570
Other - 157 163 234 166 5 863 177 102 30 064 604 357
Unspecified - 816 3 852 1 319 2 600 6 426 15 013 Total day trip spending - 1 745 939 2 495 999 174 125 2 198 976 607 004 7 222 043
3'Cultural occasion' was not included in the main purpose categories for the DTS 2013 *'Other' includes variables that were not significant enough to be included separately in the table

STATISTICS SOUTH AFRICA P0352.1
Domestic Tourism Survey, 2015
37
In 2013, total expenditure on day trips was R11,7 billion, which decreased to R11 billion in 2014 and to R7,2 billion in 2015, as shown in Table 16a.
In 2013, day travellers spent most of their money on shopping (R6,1 billion) and domestic transport (R3,2 billion), and the same pattern followed in 2014 with shopping at R6,0 billion and domestic transport at R2,8 billion. In 2015, more money was spent on domestic transport (R2,5 billion) and shopping (R2,2 billion). For all the three years, the least amount of money was spent on recreation and culture (R299 000 in 2013; R87 000 in 2014; and R174 000 in 2015).
Of the R11,7 billion total expenditure by day travellers in 2013, shopping (R5,3 billion), visiting friends and relatives (R1,8 billion) and leisure (R1,7 billion) were the main reasons. When looking at the expenditure figures for 2014, shopping was the main purpose for trip-taking at R5,7 billion, with expenditure spent while visiting friends and relatives the second highest at R1,6 billion. It can also be seen in 2015 that most money was spent on leisure trips (R2,1 billion) and visiting friends and relatives (R1,8 billion). Day travellers were least likely to spend money on religious activities in 2013 and on sporting events in 2014 and 2015.
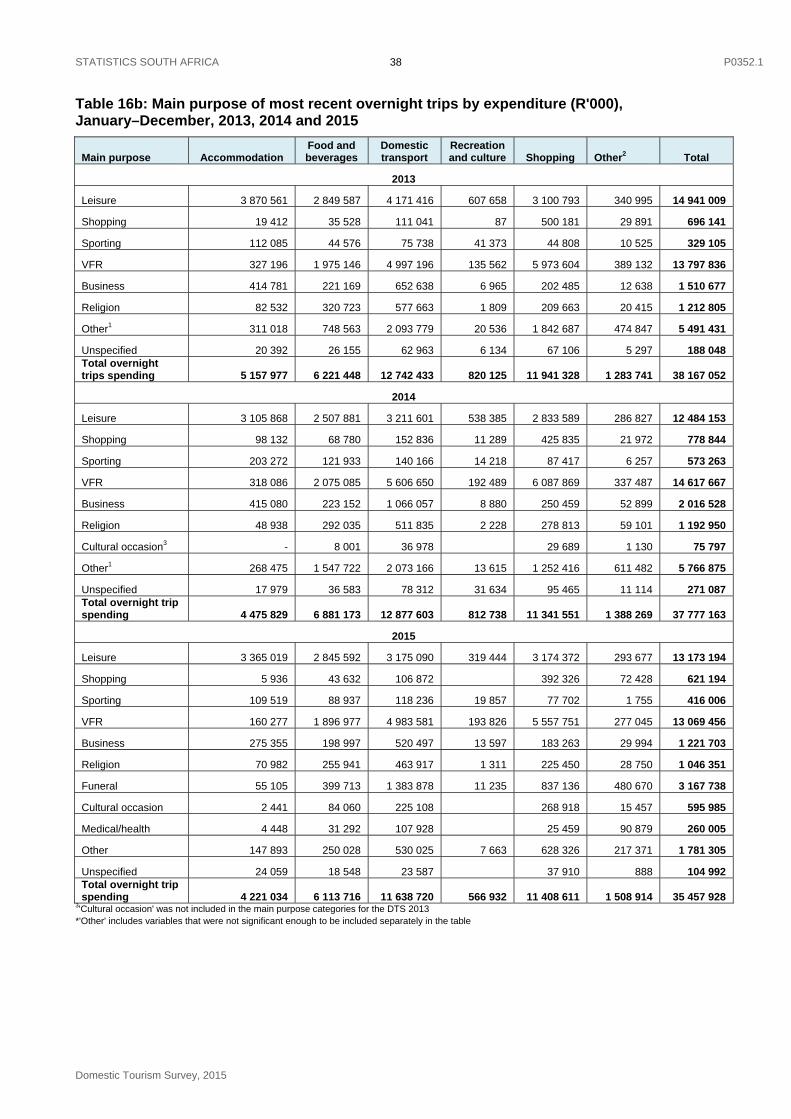
STATISTICS SOUTH AFRICA P0352.1
Domestic Tourism Survey, 2015
38
Table 16b: Main purpose of most recent overnight trips by expenditure (R'000), January–December, 2013, 2014 and 2015
Main purpose Accommodation Food and beverages
Domestic transport
Recreation and culture Shopping Other2 Total
2013
Leisure 3 870 561 2 849 587 4 171 416 607 658 3 100 793 340 995 14 941 009
Shopping 19 412 35 528 111 041 87 500 181 29 891 696 141
Sporting 112 085 44 576 75 738 41 373 44 808 10 525 329 105
VFR 327 196 1 975 146 4 997 196 135 562 5 973 604 389 132 13 797 836
Business 414 781 221 169 652 638 6 965 202 485 12 638 1 510 677
Religion 82 532 320 723 577 663 1 809 209 663 20 415 1 212 805
Other1 311 018 748 563 2 093 779 20 536 1 842 687 474 847 5 491 431
Unspecified 20 392 26 155 62 963 6 134 67 106 5 297 188 048 Total overnight trips spending 5 157 977 6 221 448 12 742 433 820 125 11 941 328 1 283 741 38 167 052
2014
Leisure 3 105 868 2 507 881 3 211 601 538 385 2 833 589 286 827 12 484 153
Shopping 98 132 68 780 152 836 11 289 425 835 21 972 778 844
Sporting 203 272 121 933 140 166 14 218 87 417 6 257 573 263
VFR 318 086 2 075 085 5 606 650 192 489 6 087 869 337 487 14 617 667
Business 415 080 223 152 1 066 057 8 880 250 459 52 899 2 016 528
Religion 48 938 292 035 511 835 2 228 278 813 59 101 1 192 950
Cultural occasion3 - 8 001 36 978 29 689 1 130 75 797
Other1 268 475 1 547 722 2 073 166 13 615 1 252 416 611 482 5 766 875
Unspecified 17 979 36 583 78 312 31 634 95 465 11 114 271 087 Total overnight trip spending 4 475 829 6 881 173 12 877 603 812 738 11 341 551 1 388 269 37 777 163
2015
Leisure 3 365 019 2 845 592 3 175 090 319 444 3 174 372 293 677 13 173 194
Shopping 5 936 43 632 106 872 392 326 72 428 621 194
Sporting 109 519 88 937 118 236 19 857 77 702 1 755 416 006
VFR 160 277 1 896 977 4 983 581 193 826 5 557 751 277 045 13 069 456
Business 275 355 198 997 520 497 13 597 183 263 29 994 1 221 703
Religion 70 982 255 941 463 917 1 311 225 450 28 750 1 046 351
Funeral 55 105 399 713 1 383 878 11 235 837 136 480 670 3 167 738
Cultural occasion 2 441 84 060 225 108 268 918 15 457 595 985
Medical/health 4 448 31 292 107 928 25 459 90 879 260 005
Other 147 893 250 028 530 025 7 663 628 326 217 371 1 781 305
Unspecified 24 059 18 548 23 587 37 910 888 104 992 Total overnight trip spending 4 221 034 6 113 716 11 638 720 566 932 11 408 611 1 508 914 35 457 928
3'Cultural occasion' was not included in the main purpose categories for the DTS 2013 *'Other' includes variables that were not significant enough to be included separately in the table
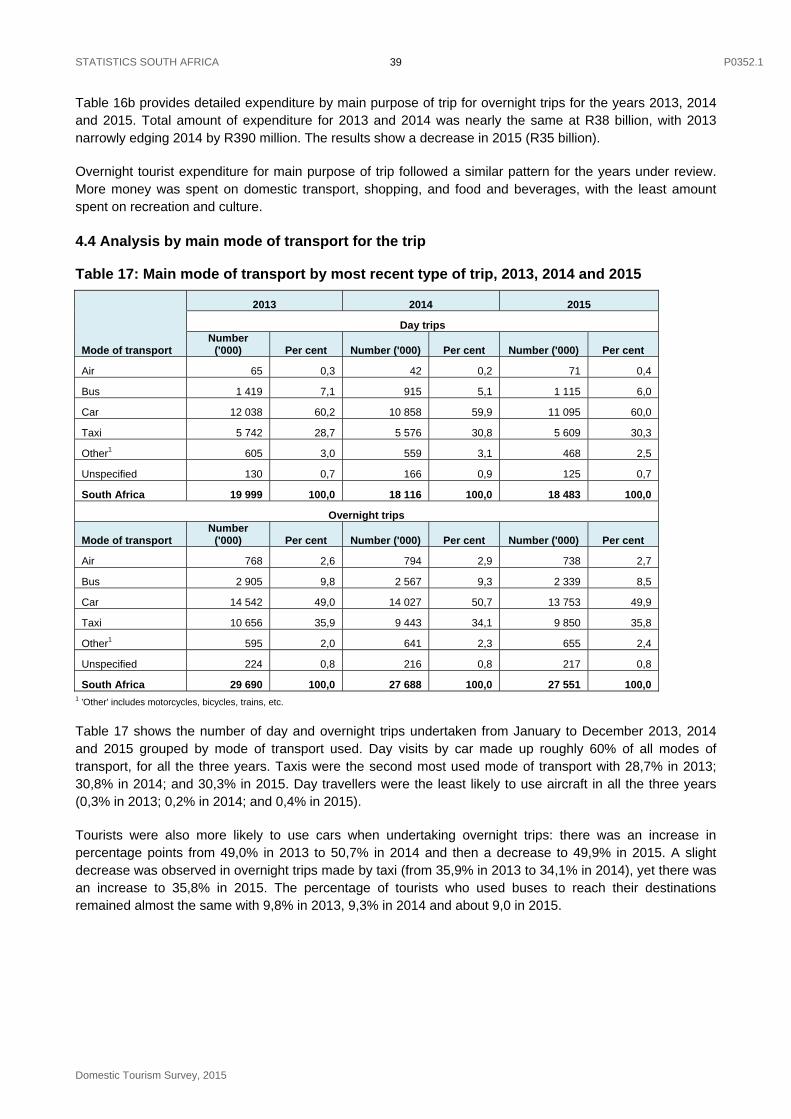
STATISTICS SOUTH AFRICA P0352.1
Domestic Tourism Survey, 2015
39
Table 16b provides detailed expenditure by main purpose of trip for overnight trips for the years 2013, 2014 and 2015. Total amount of expenditure for 2013 and 2014 was nearly the same at R38 billion, with 2013 narrowly edging 2014 by R390 million. The results show a decrease in 2015 (R35 billion).
Overnight tourist expenditure for main purpose of trip followed a similar pattern for the years under review. More money was spent on domestic transport, shopping, and food and beverages, with the least amount spent on recreation and culture.
4.4 Analysis by main mode of transport for the trip
Table 17: Main mode of transport by most recent type of trip, 2013, 2014 and 2015
Mode of transport
2013 2014 2015
Day trips Number
('000) Per cent Number ('000) Per cent Number ('000) Per cent
Air 65 0,3 42 0,2 71 0,4
Bus 1 419 7,1 915 5,1 1 115 6,0
Car 12 038 60,2 10 858 59,9 11 095 60,0
Taxi 5 742 28,7 5 576 30,8 5 609 30,3
Other1 605 3,0 559 3,1 468 2,5
Unspecified 130 0,7 166 0,9 125 0,7
South Africa 19 999 100,0 18 116 100,0 18 483 100,0
Overnight trips
Mode of transport Number
('000) Per cent Number ('000) Per cent Number ('000) Per cent
Air 768 2,6 794 2,9 738 2,7
Bus 2 905 9,8 2 567 9,3 2 339 8,5
Car 14 542 49,0 14 027 50,7 13 753 49,9
Taxi 10 656 35,9 9 443 34,1 9 850 35,8
Other1 595 2,0 641 2,3 655 2,4
Unspecified 224 0,8 216 0,8 217 0,8
South Africa 29 690 100,0 27 688 100,0 27 551 100,0 1 'Other' includes motorcycles, bicycles, trains, etc.
Table 17 shows the number of day and overnight trips undertaken from January to December 2013, 2014 and 2015 grouped by mode of transport used. Day visits by car made up roughly 60% of all modes of transport, for all the three years. Taxis were the second most used mode of transport with 28,7% in 2013; 30,8% in 2014; and 30,3% in 2015. Day travellers were the least likely to use aircraft in all the three years (0,3% in 2013; 0,2% in 2014; and 0,4% in 2015).
Tourists were also more likely to use cars when undertaking overnight trips: there was an increase in percentage points from 49,0% in 2013 to 50,7% in 2014 and then a decrease to 49,9% in 2015. A slight decrease was observed in overnight trips made by taxi (from 35,9% in 2013 to 34,1% in 2014), yet there was an increase to 35,8% in 2015. The percentage of tourists who used buses to reach their destinations remained almost the same with 9,8% in 2013, 9,3% in 2014 and about 9,0 in 2015.
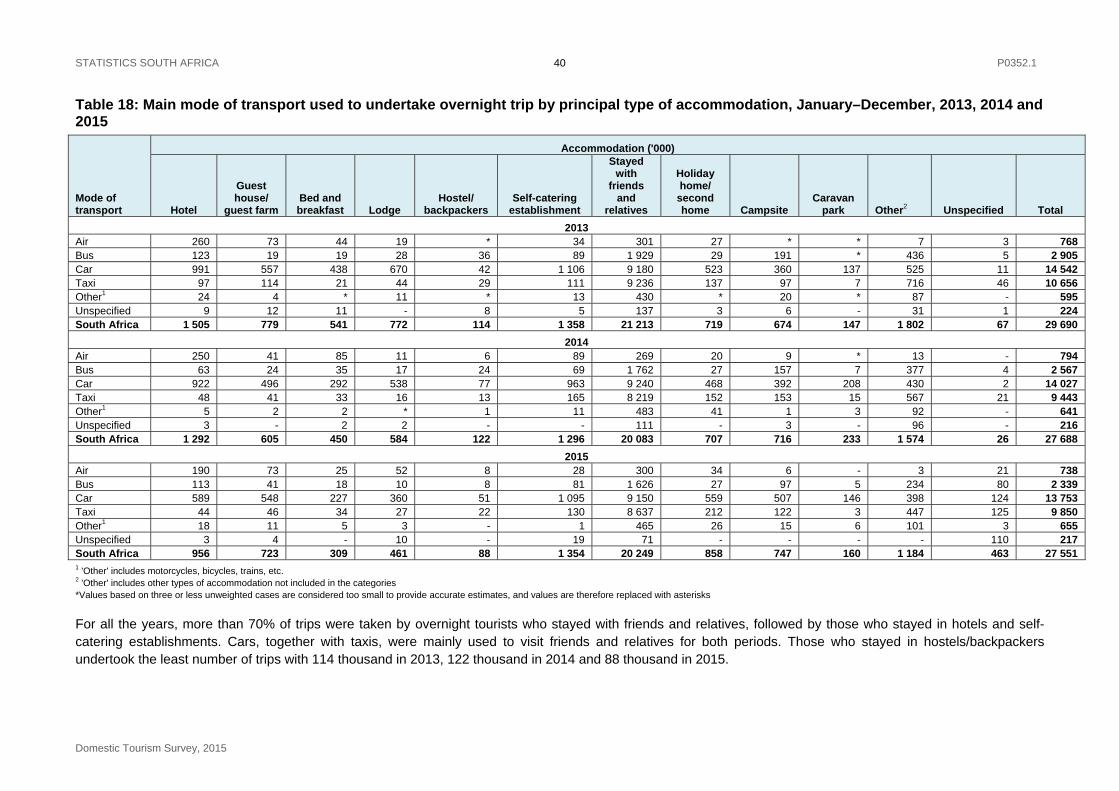
STATISTICS SOUTH AFRICA P0352.1
Domestic Tourism Survey, 2015
40
Table 18: Main mode of transport used to undertake overnight trip by principal type of accommodation, January–December, 2013, 2014 and 2015
Mode of transport
Accommodation ('000)
Hotel
Guest house/
guest farm Bed and breakfast Lodge
Hostel/ backpackers
Self-catering establishment
Stayed with
friends and
relatives
Holiday home/
second home Campsite
Caravan park Other2 Unspecified Total
2013 Air 260 73 44 19 * 34 301 27 * * 7 3 768 Bus 123 19 19 28 36 89 1 929 29 191 * 436 5 2 905 Car 991 557 438 670 42 1 106 9 180 523 360 137 525 11 14 542 Taxi 97 114 21 44 29 111 9 236 137 97 7 716 46 10 656 Other1 24 4 * 11 * 13 430 * 20 * 87 - 595 Unspecified 9 12 11 - 8 5 137 3 6 - 31 1 224 South Africa 1 505 779 541 772 114 1 358 21 213 719 674 147 1 802 67 29 690
2014 Air 250 41 85 11 6 89 269 20 9 * 13 - 794 Bus 63 24 35 17 24 69 1 762 27 157 7 377 4 2 567 Car 922 496 292 538 77 963 9 240 468 392 208 430 2 14 027 Taxi 48 41 33 16 13 165 8 219 152 153 15 567 21 9 443 Other1 5 2 2 * 1 11 483 41 1 3 92 - 641 Unspecified 3 - 2 2 - - 111 - 3 - 96 - 216 South Africa 1 292 605 450 584 122 1 296 20 083 707 716 233 1 574 26 27 688
2015 Air 190 73 25 52 8 28 300 34 6 - 3 21 738 Bus 113 41 18 10 8 81 1 626 27 97 5 234 80 2 339 Car 589 548 227 360 51 1 095 9 150 559 507 146 398 124 13 753 Taxi 44 46 34 27 22 130 8 637 212 122 3 447 125 9 850 Other1 18 11 5 3 - 1 465 26 15 6 101 3 655 Unspecified 3 4 - 10 - 19 71 - - - - 110 217 South Africa 956 723 309 461 88 1 354 20 249 858 747 160 1 184 463 27 551 1 'Other' includes motorcycles, bicycles, trains, etc. 2 'Other' includes other types of accommodation not included in the categories *Values based on three or less unweighted cases are considered too small to provide accurate estimates, and values are therefore replaced with asterisks
For all the years, more than 70% of trips were taken by overnight tourists who stayed with friends and relatives, followed by those who stayed in hotels and self-catering establishments. Cars, together with taxis, were mainly used to visit friends and relatives for both periods. Those who stayed in hostels/backpackers undertook the least number of trips with 114 thousand in 2013, 122 thousand in 2014 and 88 thousand in 2015.
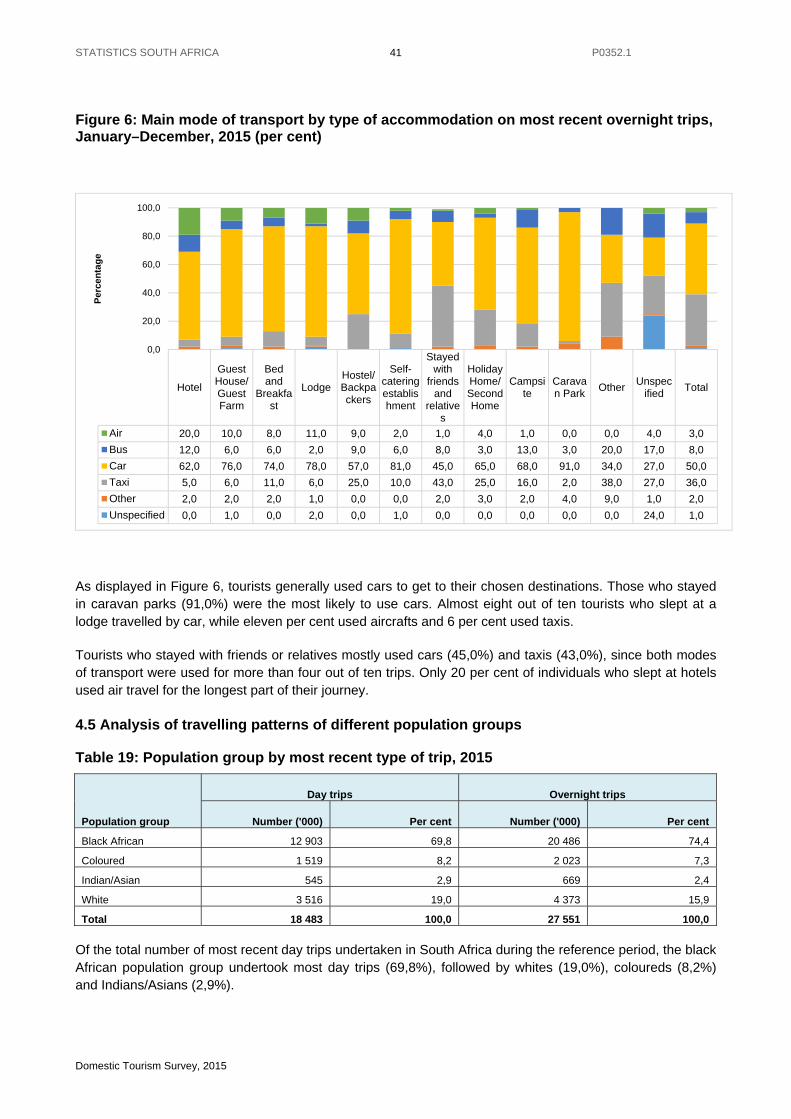
STATISTICS SOUTH AFRICA P0352.1
Domestic Tourism Survey, 2015
41
Figure 6: Main mode of transport by type of accommodation on most recent overnight trips, January–December, 2015 (per cent)
As displayed in Figure 6, tourists generally used cars to get to their chosen destinations. Those who stayed in caravan parks (91,0%) were the most likely to use cars. Almost eight out of ten tourists who slept at a lodge travelled by car, while eleven per cent used aircrafts and 6 per cent used taxis.
Tourists who stayed with friends or relatives mostly used cars (45,0%) and taxis (43,0%), since both modes of transport were used for more than four out of ten trips. Only 20 per cent of individuals who slept at hotels used air travel for the longest part of their journey.
4.5 Analysis of travelling patterns of different population groups
Table 19: Population group by most recent type of trip, 2015
Population group
Day trips Overnight trips
Number ('000) Per cent Number ('000) Per cent
Black African 12 903 69,8 20 486 74,4
Coloured 1 519 8,2 2 023 7,3
Indian/Asian 545 2,9 669 2,4
White 3 516 19,0 4 373 15,9
Total 18 483 100,0 27 551 100,0
Of the total number of most recent day trips undertaken in South Africa during the reference period, the black African population group undertook most day trips (69,8%), followed by whites (19,0%), coloureds (8,2%) and Indians/Asians (2,9%).
Hotel
GuestHouse/GuestFarm
Bedand
Breakfast
LodgeHostel/Backpackers
Self-cateringestablishment
Stayedwith
friendsand
relatives
HolidayHome/SecondHome
Campsite
Caravan Park
OtherUnspec
ifiedTotal
Air 20,0 10,0 8,0 11,0 9,0 2,0 1,0 4,0 1,0 0,0 0,0 4,0 3,0
Bus 12,0 6,0 6,0 2,0 9,0 6,0 8,0 3,0 13,0 3,0 20,0 17,0 8,0
Car 62,0 76,0 74,0 78,0 57,0 81,0 45,0 65,0 68,0 91,0 34,0 27,0 50,0
Taxi 5,0 6,0 11,0 6,0 25,0 10,0 43,0 25,0 16,0 2,0 38,0 27,0 36,0
Other 2,0 2,0 2,0 1,0 0,0 0,0 2,0 3,0 2,0 4,0 9,0 1,0 2,0
Unspecified 0,0 1,0 0,0 2,0 0,0 1,0 0,0 0,0 0,0 0,0 0,0 24,0 1,0
0,0
20,0
40,0
60,0
80,0
100,0
Per
cen
tag
e
STATISTICS SOUTH AFRICA P0352.1
Domestic Tourism Survey, 2015
42
With respect to most recent overnight trips undertaken, black Africans undertook 74,4% of all overnight trips, while nearly 16% were taken by whites. The coloured and Indian/Asian population groups recorded the lowest proportions (7,3% and 2,4%, respectively).
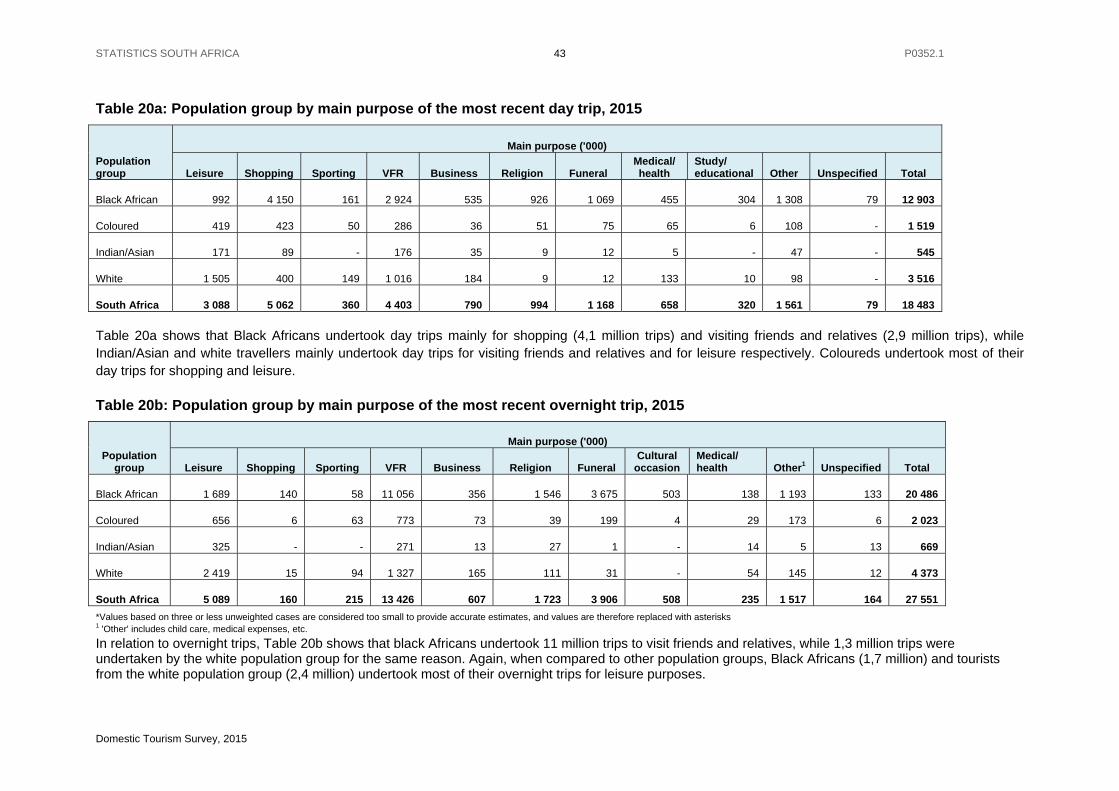
STATISTICS SOUTH AFRICA P0352.1
Domestic Tourism Survey, 2015
43
Table 20a: Population group by main purpose of the most recent day trip, 2015
Population group
Main purpose ('000)
Leisure Shopping Sporting VFR Business Religion Funeral Medical/ health
Study/ educational Other Unspecified Total
Black African 992 4 150 161 2 924 535 926 1 069 455 304 1 308 79 12 903
Coloured 419 423 50 286 36 51 75 65 6 108 - 1 519
Indian/Asian 171 89 - 176 35 9 12 5 - 47 - 545
White 1 505 400 149 1 016 184 9 12 133 10 98 - 3 516
South Africa 3 088 5 062 360 4 403 790 994 1 168 658 320 1 561 79 18 483
Table 20a shows that Black Africans undertook day trips mainly for shopping (4,1 million trips) and visiting friends and relatives (2,9 million trips), while Indian/Asian and white travellers mainly undertook day trips for visiting friends and relatives and for leisure respectively. Coloureds undertook most of their day trips for shopping and leisure.
Table 20b: Population group by main purpose of the most recent overnight trip, 2015
Population group
Main purpose ('000)
Leisure Shopping Sporting VFR Business Religion Funeral Cultural
occasion Medical/ health Other1 Unspecified Total
Black African 1 689 140 58 11 056 356 1 546 3 675 503 138 1 193 133 20 486
Coloured 656 6 63 773 73 39 199 4 29 173 6 2 023
Indian/Asian 325 - - 271 13 27 1 - 14 5 13 669
White 2 419 15 94 1 327 165 111 31 - 54 145 12 4 373
South Africa 5 089 160 215 13 426 607 1 723 3 906 508 235 1 517 164 27 551
*Values based on three or less unweighted cases are considered too small to provide accurate estimates, and values are therefore replaced with asterisks 1 'Other' includes child care, medical expenses, etc.
In relation to overnight trips, Table 20b shows that black Africans undertook 11 million trips to visit friends and relatives, while 1,3 million trips were undertaken by the white population group for the same reason. Again, when compared to other population groups, Black Africans (1,7 million) and tourists from the white population group (2,4 million) undertook most of their overnight trips for leisure purposes.
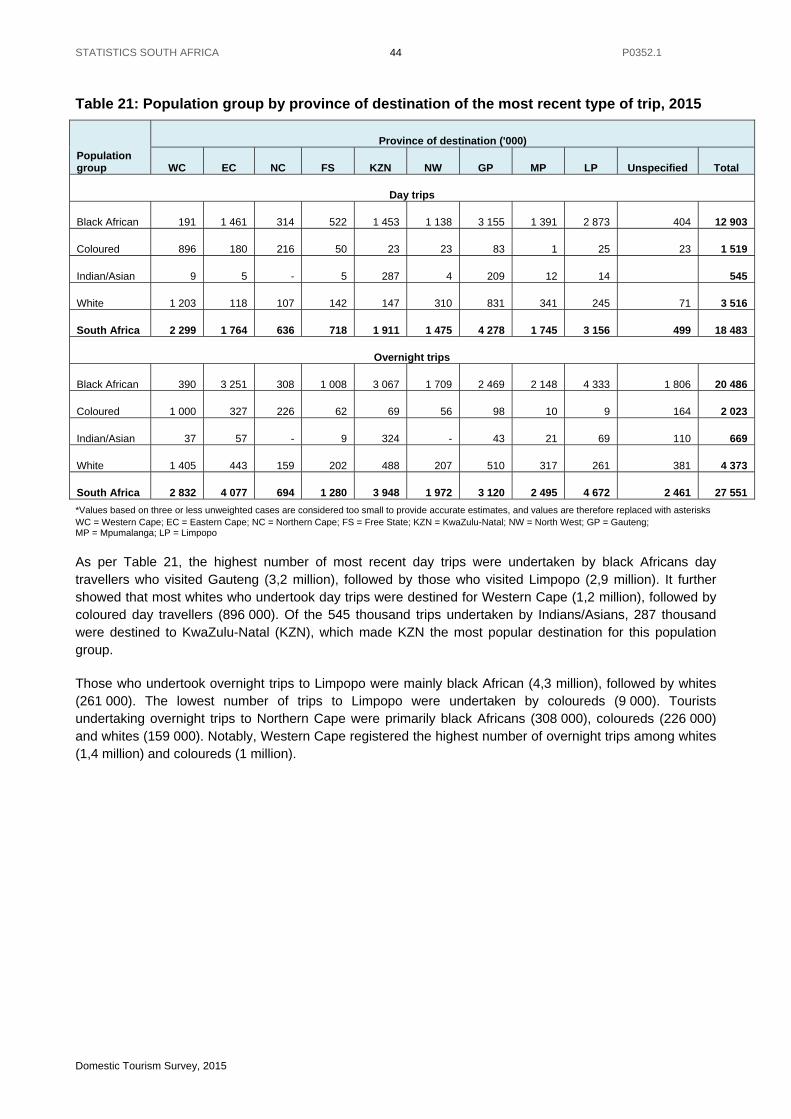
STATISTICS SOUTH AFRICA P0352.1
Domestic Tourism Survey, 2015
44
Table 21: Population group by province of destination of the most recent type of trip, 2015
Population group
Province of destination ('000)
WC EC NC FS KZN NW GP MP LP Unspecified Total
Day trips
Black African 191 1 461 314 522 1 453 1 138 3 155 1 391 2 873 404 12 903
Coloured 896 180 216 50 23 23 83 1 25 23 1 519
Indian/Asian 9 5 - 5 287 4 209 12 14 545
White 1 203 118 107 142 147 310 831 341 245 71 3 516
South Africa 2 299 1 764 636 718 1 911 1 475 4 278 1 745 3 156 499 18 483
Overnight trips
Black African 390 3 251 308 1 008 3 067 1 709 2 469 2 148 4 333 1 806 20 486
Coloured 1 000 327 226 62 69 56 98 10 9 164 2 023
Indian/Asian 37 57 - 9 324 - 43 21 69 110 669
White 1 405 443 159 202 488 207 510 317 261 381 4 373
South Africa 2 832 4 077 694 1 280 3 948 1 972 3 120 2 495 4 672 2 461 27 551
*Values based on three or less unweighted cases are considered too small to provide accurate estimates, and values are therefore replaced with asterisks WC = Western Cape; EC = Eastern Cape; NC = Northern Cape; FS = Free State; KZN = KwaZulu-Natal; NW = North West; GP = Gauteng; MP = Mpumalanga; LP = Limpopo
As per Table 21, the highest number of most recent day trips were undertaken by black Africans day travellers who visited Gauteng (3,2 million), followed by those who visited Limpopo (2,9 million). It further showed that most whites who undertook day trips were destined for Western Cape (1,2 million), followed by coloured day travellers (896 000). Of the 545 thousand trips undertaken by Indians/Asians, 287 thousand were destined to KwaZulu-Natal (KZN), which made KZN the most popular destination for this population group.
Those who undertook overnight trips to Limpopo were mainly black African (4,3 million), followed by whites (261 000). The lowest number of trips to Limpopo were undertaken by coloureds (9 000). Tourists undertaking overnight trips to Northern Cape were primarily black Africans (308 000), coloureds (226 000) and whites (159 000). Notably, Western Cape registered the highest number of overnight trips among whites (1,4 million) and coloureds (1 million).
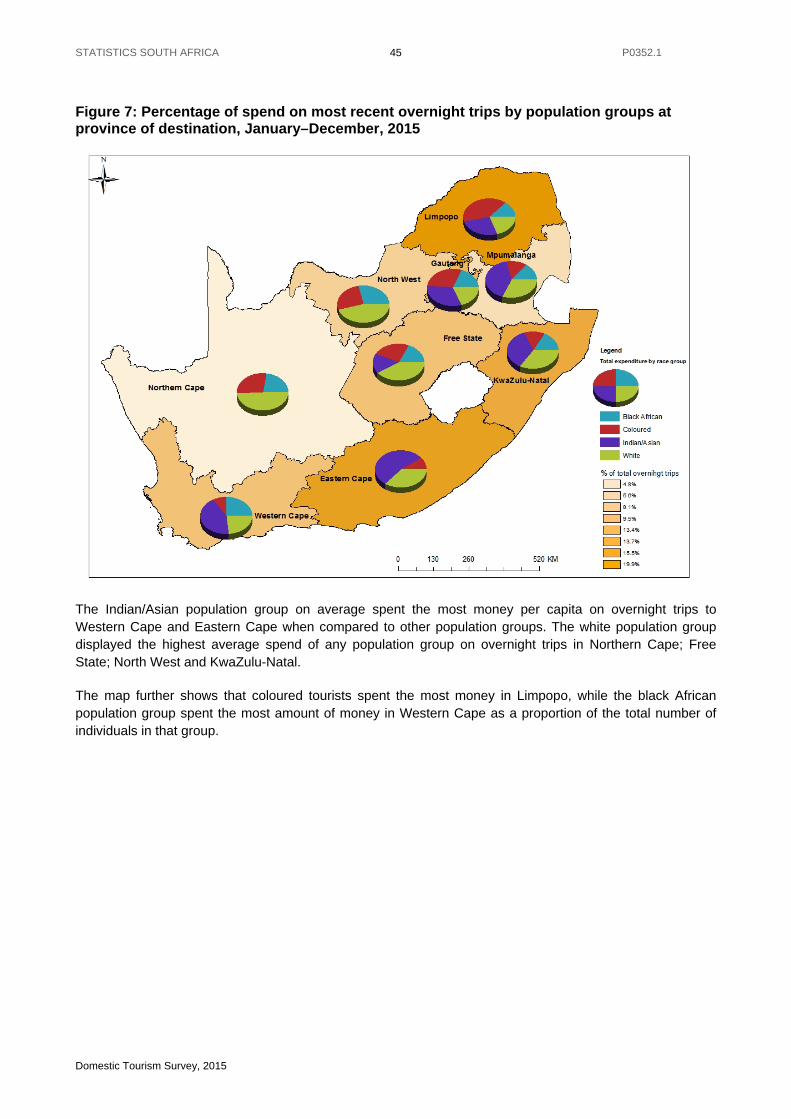
STATISTICS SOUTH AFRICA P0352.1
Domestic Tourism Survey, 2015
45
Figure 7: Percentage of spend on most recent overnight trips by population groups at province of destination, January–December, 2015
The Indian/Asian population group on average spent the most money per capita on overnight trips to Western Cape and Eastern Cape when compared to other population groups. The white population group displayed the highest average spend of any population group on overnight trips in Northern Cape; Free State; North West and KwaZulu-Natal.
The map further shows that coloured tourists spent the most money in Limpopo, while the black African population group spent the most amount of money in Western Cape as a proportion of the total number of individuals in that group.
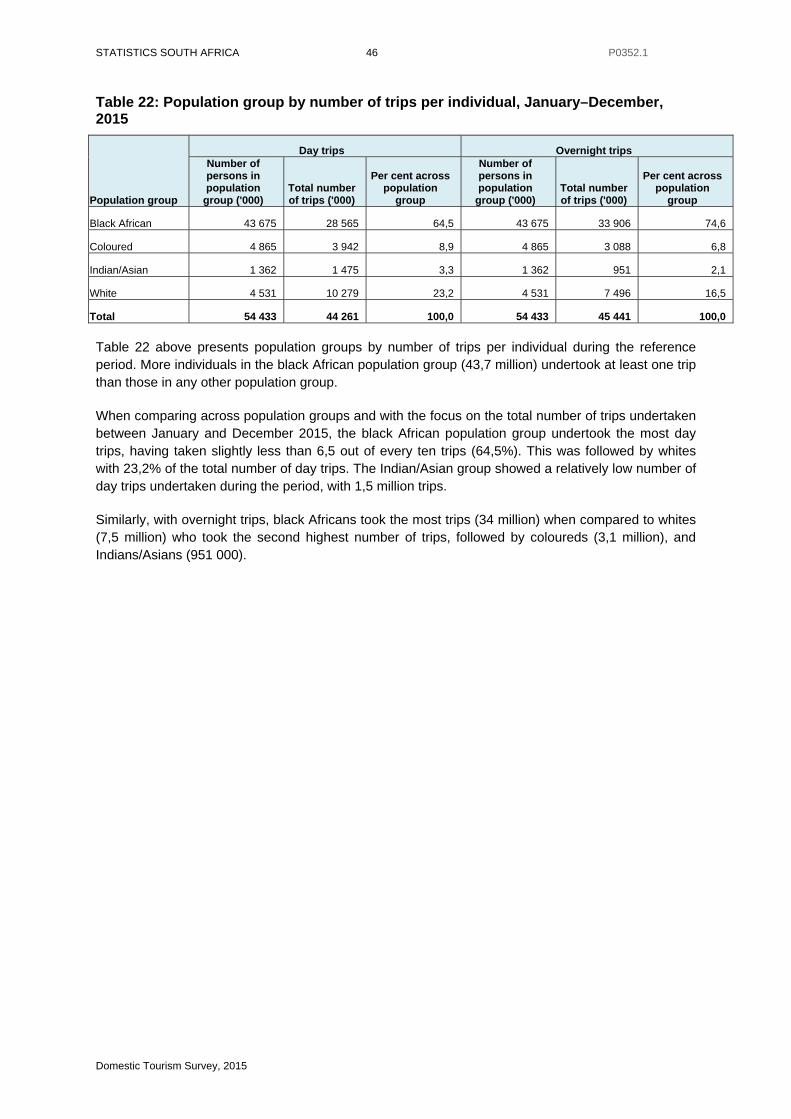
STATISTICS SOUTH AFRICA 46 P0352.1
Domestic Tourism Survey, 2015
Table 22: Population group by number of trips per individual, January–December, 2015
Population group
Day trips Overnight trips Number of persons in population
group ('000) Total number of trips ('000)
Per cent across population
group
Number of persons in population
group ('000) Total number of trips ('000)
Per cent across population
group
Black African 43 675 28 565 64,5 43 675 33 906 74,6
Coloured 4 865 3 942 8,9 4 865 3 088 6,8
Indian/Asian 1 362 1 475 3,3 1 362 951 2,1
White 4 531 10 279 23,2 4 531 7 496 16,5
Total 54 433 44 261 100,0 54 433 45 441 100,0
Table 22 above presents population groups by number of trips per individual during the reference period. More individuals in the black African population group (43,7 million) undertook at least one trip than those in any other population group.
When comparing across population groups and with the focus on the total number of trips undertaken between January and December 2015, the black African population group undertook the most day trips, having taken slightly less than 6,5 out of every ten trips (64,5%). This was followed by whites with 23,2% of the total number of day trips. The Indian/Asian group showed a relatively low number of day trips undertaken during the period, with 1,5 million trips.
Similarly, with overnight trips, black Africans took the most trips (34 million) when compared to whites (7,5 million) who took the second highest number of trips, followed by coloureds (3,1 million), and Indians/Asians (951 000).

STATISTICS SOUTH AFRICA P0352.1
Domestic Tourism Survey, 2015
47
Table 23: Population group by expenditure (R'000) on most recent trips, January–December, 2015
Population group Accommodation
Food and beverages
Domestic transport
Recreation and culture Shopping Other1 Total
Day Trips
Black African - 740 315 1 594 405 85 202 1 635 579 395 417 4 450 917
Coloured - 103 475 135 256 7 976 133 205 20 099 400 011
Indian/Asian - 50 337 57 527 11 981 43 323 293 163 461
White - 851 812 708 811 68 967 386 869 191 196 2 207 655
South Africa - 1 745 939 2 495 999 174 125 2 198 976 607 004 7 222 043
Overnight trips
Black African 1 194 940 3 190 502 7 733 910 246 354 8 998 737 1 149 568 22 514 010
Coloured 355 405 511 783 685 815 32 356 473 069 75 929 2 134 356
Indian/Asian 456 166 290 546 440 345 67 980 424 326 2 973 1 682 335
White 2 214 523 2 120 886 2 778 651 220 243 1 512 479 280 445 9 127 227
South Africa 4 221 034 6 113 716 11 638 720 566 932 11 408 611 1 508 914 35 457 928 1 'Other' includes categories of expenditure that were not included in the categories *Values based on three or less unweighted cases are considered too small to provide accurate estimates, and values are therefore replaced with asterisks
The estimated total spending on most recent day trips between January and December 2015 was R7,2 billion and R35 billion for most recent overnight trips. During day trips, over R1,6 billion was spent by black Africans on shopping and R1,6 billion on domestic transport. This group further spent R740 million on food and beverages. In absolute terms, Indian/Asian tourists spent the least amount (R163 million) on day trips, compared to other population groups.
The black African population group, on their most recent overnight trips, spent most of their money on shopping (R9 billion), and then on domestic transport (R7,7 billion). The white population group spent the highest amount on domestic transport (R2,8 billion), while the second highest amount was spent on accommodation (R2,2 billion) and the third highest expense item for this group was food and beverages (R2,1 billion). The coloured population group spent most money on domestic transport (R685 million), followed by expenditure on food and beverages (R512 million) and shopping (R473 million).
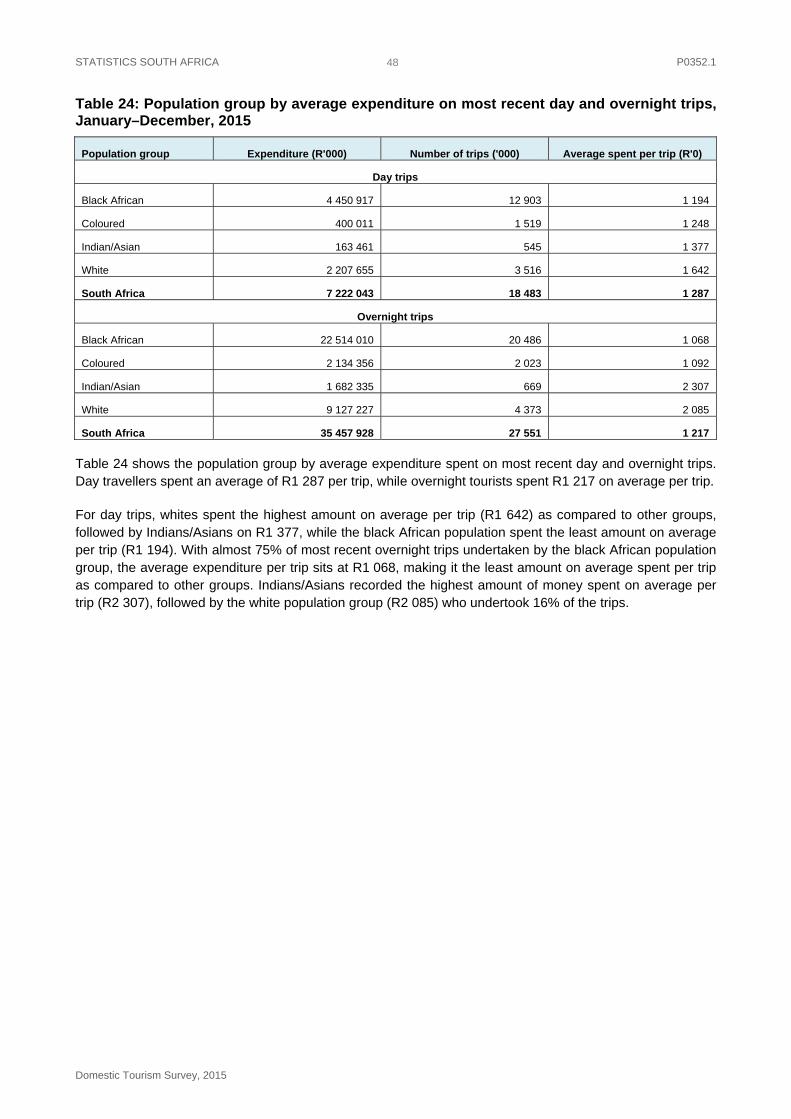
STATISTICS SOUTH AFRICA P0352.1
Domestic Tourism Survey, 2015
48
Table 24: Population group by average expenditure on most recent day and overnight trips, January–December, 2015
Population group Expenditure (R'000) Number of trips ('000) Average spent per trip (R'0)
Day trips
Black African 4 450 917 12 903 1 194
Coloured 400 011 1 519 1 248
Indian/Asian 163 461 545 1 377
White 2 207 655 3 516 1 642
South Africa 7 222 043 18 483 1 287
Overnight trips
Black African 22 514 010 20 486 1 068
Coloured 2 134 356 2 023 1 092
Indian/Asian 1 682 335 669 2 307
White 9 127 227 4 373 2 085
South Africa 35 457 928 27 551 1 217
Table 24 shows the population group by average expenditure spent on most recent day and overnight trips. Day travellers spent an average of R1 287 per trip, while overnight tourists spent R1 217 on average per trip.
For day trips, whites spent the highest amount on average per trip (R1 642) as compared to other groups, followed by Indians/Asians on R1 377, while the black African population spent the least amount on average per trip (R1 194). With almost 75% of most recent overnight trips undertaken by the black African population group, the average expenditure per trip sits at R1 068, making it the least amount on average spent per trip as compared to other groups. Indians/Asians recorded the highest amount of money spent on average per trip (R2 307), followed by the white population group (R2 085) who undertook 16% of the trips.
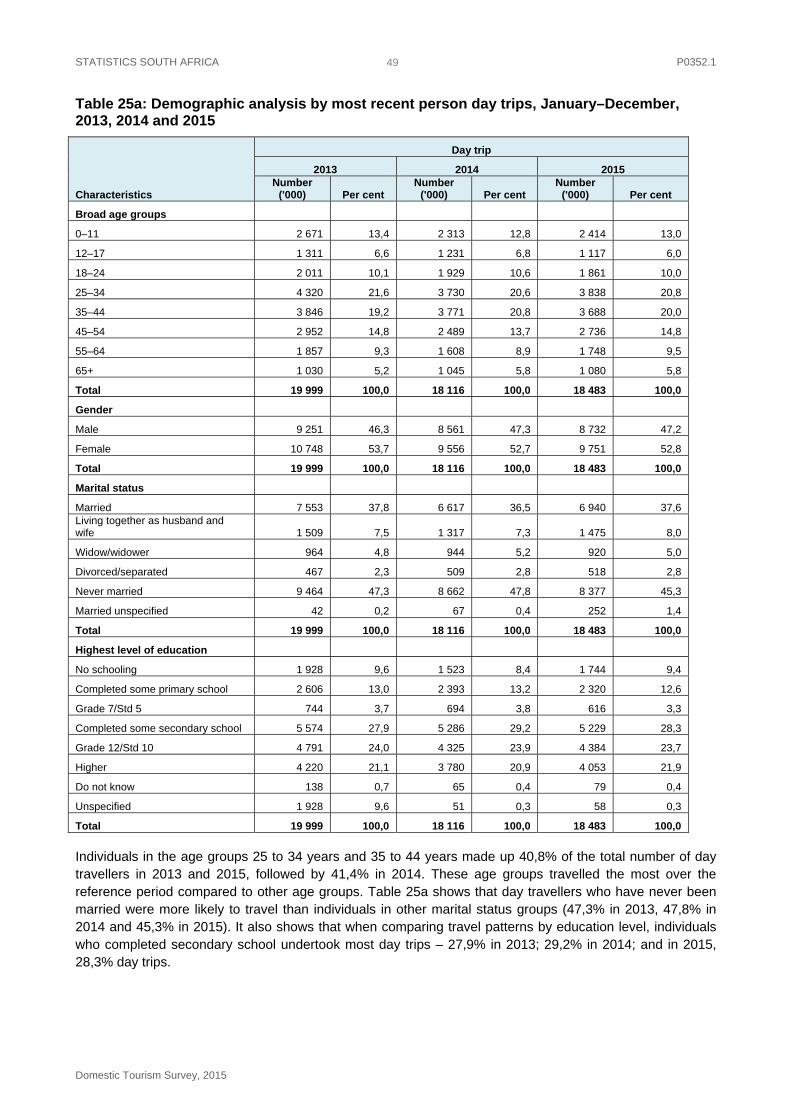
STATISTICS SOUTH AFRICA P0352.1
Domestic Tourism Survey, 2015
49
Table 25a: Demographic analysis by most recent person day trips, January–December, 2013, 2014 and 2015
Characteristics
Day trip
2013 2014 2015 Number
('000) Per cent Number
('000) Per cent Number
('000) Per cent
Broad age groups
0–11 2 671 13,4 2 313 12,8 2 414 13,0
12–17 1 311 6,6 1 231 6,8 1 117 6,0
18–24 2 011 10,1 1 929 10,6 1 861 10,0
25–34 4 320 21,6 3 730 20,6 3 838 20,8
35–44 3 846 19,2 3 771 20,8 3 688 20,0
45–54 2 952 14,8 2 489 13,7 2 736 14,8
55–64 1 857 9,3 1 608 8,9 1 748 9,5
65+ 1 030 5,2 1 045 5,8 1 080 5,8
Total 19 999 100,0 18 116 100,0 18 483 100,0
Gender
Male 9 251 46,3 8 561 47,3 8 732 47,2
Female 10 748 53,7 9 556 52,7 9 751 52,8
Total 19 999 100,0 18 116 100,0 18 483 100,0
Marital status
Married 7 553 37,8 6 617 36,5 6 940 37,6 Living together as husband and wife 1 509 7,5 1 317 7,3 1 475 8,0
Widow/widower 964 4,8 944 5,2 920 5,0
Divorced/separated 467 2,3 509 2,8 518 2,8
Never married 9 464 47,3 8 662 47,8 8 377 45,3
Married unspecified 42 0,2 67 0,4 252 1,4
Total 19 999 100,0 18 116 100,0 18 483 100,0
Highest level of education
No schooling 1 928 9,6 1 523 8,4 1 744 9,4
Completed some primary school 2 606 13,0 2 393 13,2 2 320 12,6
Grade 7/Std 5 744 3,7 694 3,8 616 3,3
Completed some secondary school 5 574 27,9 5 286 29,2 5 229 28,3
Grade 12/Std 10 4 791 24,0 4 325 23,9 4 384 23,7
Higher 4 220 21,1 3 780 20,9 4 053 21,9
Do not know 138 0,7 65 0,4 79 0,4
Unspecified 1 928 9,6 51 0,3 58 0,3
Total 19 999 100,0 18 116 100,0 18 483 100,0
Individuals in the age groups 25 to 34 years and 35 to 44 years made up 40,8% of the total number of day travellers in 2013 and 2015, followed by 41,4% in 2014. These age groups travelled the most over the reference period compared to other age groups. Table 25a shows that day travellers who have never been married were more likely to travel than individuals in other marital status groups (47,3% in 2013, 47,8% in 2014 and 45,3% in 2015). It also shows that when comparing travel patterns by education level, individuals who completed secondary school undertook most day trips – 27,9% in 2013; 29,2% in 2014; and in 2015, 28,3% day trips.
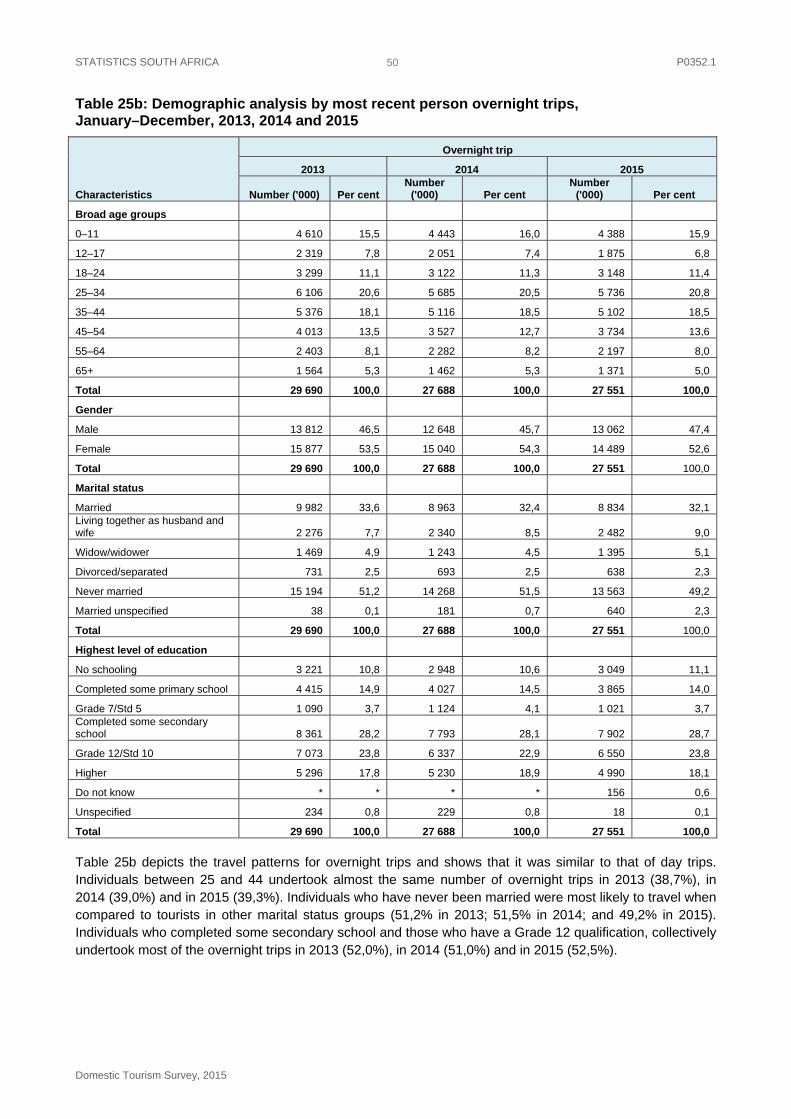
STATISTICS SOUTH AFRICA P0352.1
Domestic Tourism Survey, 2015
50
Table 25b: Demographic analysis by most recent person overnight trips, January–December, 2013, 2014 and 2015
Characteristics
Overnight trip
2013 2014 2015
Number ('000) Per cent Number
('000) Per cent Number
('000) Per cent
Broad age groups
0–11 4 610 15,5 4 443 16,0 4 388 15,9
12–17 2 319 7,8 2 051 7,4 1 875 6,8
18–24 3 299 11,1 3 122 11,3 3 148 11,4
25–34 6 106 20,6 5 685 20,5 5 736 20,8
35–44 5 376 18,1 5 116 18,5 5 102 18,5
45–54 4 013 13,5 3 527 12,7 3 734 13,6
55–64 2 403 8,1 2 282 8,2 2 197 8,0
65+ 1 564 5,3 1 462 5,3 1 371 5,0
Total 29 690 100,0 27 688 100,0 27 551 100,0
Gender
Male 13 812 46,5 12 648 45,7 13 062 47,4
Female 15 877 53,5 15 040 54,3 14 489 52,6
Total 29 690 100,0 27 688 100,0 27 551 100,0
Marital status
Married 9 982 33,6 8 963 32,4 8 834 32,1 Living together as husband and wife 2 276 7,7 2 340 8,5 2 482 9,0
Widow/widower 1 469 4,9 1 243 4,5 1 395 5,1
Divorced/separated 731 2,5 693 2,5 638 2,3
Never married 15 194 51,2 14 268 51,5 13 563 49,2
Married unspecified 38 0,1 181 0,7 640 2,3
Total 29 690 100,0 27 688 100,0 27 551 100,0
Highest level of education
No schooling 3 221 10,8 2 948 10,6 3 049 11,1
Completed some primary school 4 415 14,9 4 027 14,5 3 865 14,0
Grade 7/Std 5 1 090 3,7 1 124 4,1 1 021 3,7 Completed some secondary school 8 361 28,2 7 793 28,1 7 902 28,7
Grade 12/Std 10 7 073 23,8 6 337 22,9 6 550 23,8
Higher 5 296 17,8 5 230 18,9 4 990 18,1
Do not know * * * * 156 0,6
Unspecified 234 0,8 229 0,8 18 0,1
Total 29 690 100,0 27 688 100,0 27 551 100,0
Table 25b depicts the travel patterns for overnight trips and shows that it was similar to that of day trips. Individuals between 25 and 44 undertook almost the same number of overnight trips in 2013 (38,7%), in 2014 (39,0%) and in 2015 (39,3%). Individuals who have never been married were most likely to travel when compared to tourists in other marital status groups (51,2% in 2013; 51,5% in 2014; and 49,2% in 2015). Individuals who completed some secondary school and those who have a Grade 12 qualification, collectively undertook most of the overnight trips in 2013 (52,0%), in 2014 (51,0%) and in 2015 (52,5%).
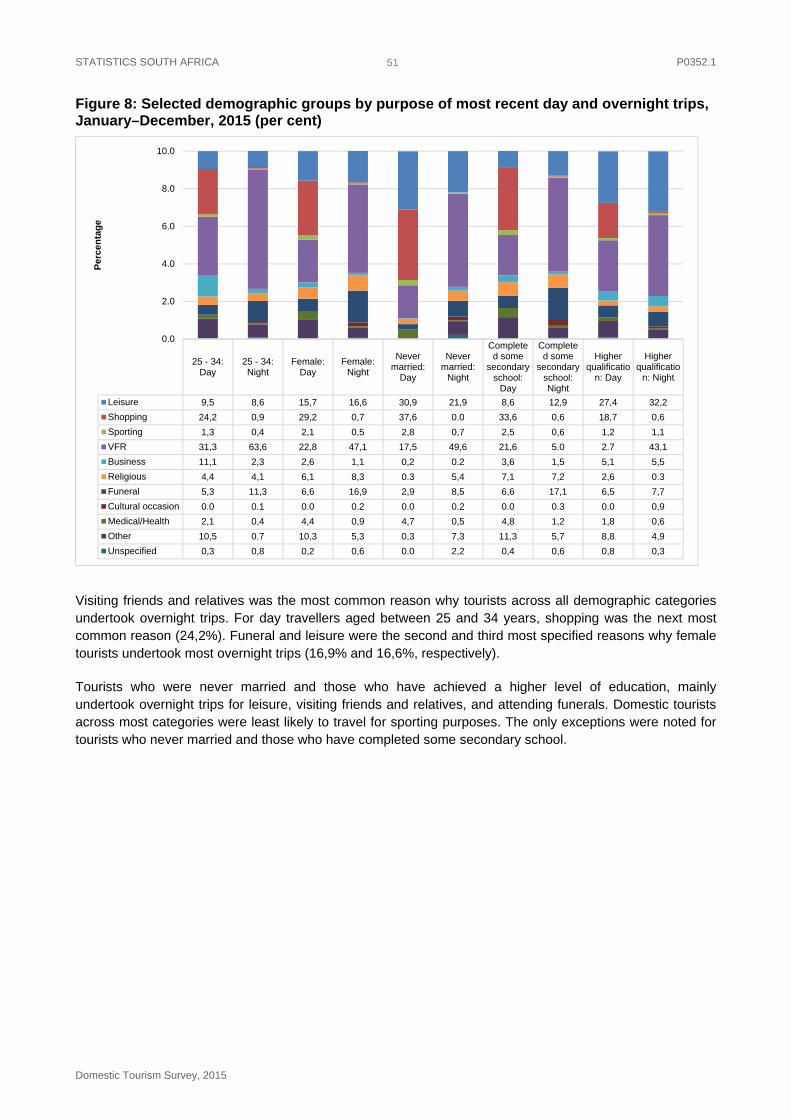
STATISTICS SOUTH AFRICA P0352.1
Domestic Tourism Survey, 2015
51
Figure 8: Selected demographic groups by purpose of most recent day and overnight trips, January–December, 2015 (per cent)
Visiting friends and relatives was the most common reason why tourists across all demographic categories undertook overnight trips. For day travellers aged between 25 and 34 years, shopping was the next most common reason (24,2%). Funeral and leisure were the second and third most specified reasons why female tourists undertook most overnight trips (16,9% and 16,6%, respectively).
Tourists who were never married and those who have achieved a higher level of education, mainly undertook overnight trips for leisure, visiting friends and relatives, and attending funerals. Domestic tourists across most categories were least likely to travel for sporting purposes. The only exceptions were noted for tourists who never married and those who have completed some secondary school.
25 - 34:Day
25 - 34:Night
Female:Day
Female:Night
Nevermarried:
Day
Nevermarried:
Night
Completed some
secondaryschool:
Day
Completed some
secondaryschool:Night
Higherqualificatio
n: Day
Higherqualificatio
n: Night
Leisure 9,5 8,6 15,7 16,6 30,9 21,9 8,6 12,9 27,4 32,2
Shopping 24,2 0,9 29,2 0,7 37,6 0.0 33,6 0,6 18,7 0,6
Sporting 1,3 0,4 2,1 0,5 2,8 0,7 2,5 0,6 1,2 1,1
VFR 31,3 63,6 22,8 47,1 17,5 49,6 21,6 5.0 2.7 43,1
Business 11,1 2,3 2,6 1,1 0,2 0.2 3,6 1,5 5,1 5,5
Religious 4,4 4,1 6,1 8,3 0.3 5,4 7,1 7,2 2,6 0.3
Funeral 5,3 11,3 6,6 16,9 2,9 8,5 6,6 17,1 6,5 7,7
Cultural occasion 0.0 0.1 0.0 0.2 0.0 0.2 0.0 0.3 0.0 0,9
Medical/Health 2,1 0,4 4,4 0,9 4,7 0,5 4,8 1,2 1,8 0,6
Other 10,5 0.7 10,3 5,3 0,3 7,3 11,3 5,7 8,8 4,9
Unspecified 0,3 0,8 0,2 0,6 0.0 2,2 0,4 0,6 0,8 0,3
0.0
2.0
4.0
6.0
8.0
10.0
Per
cen
tag
e
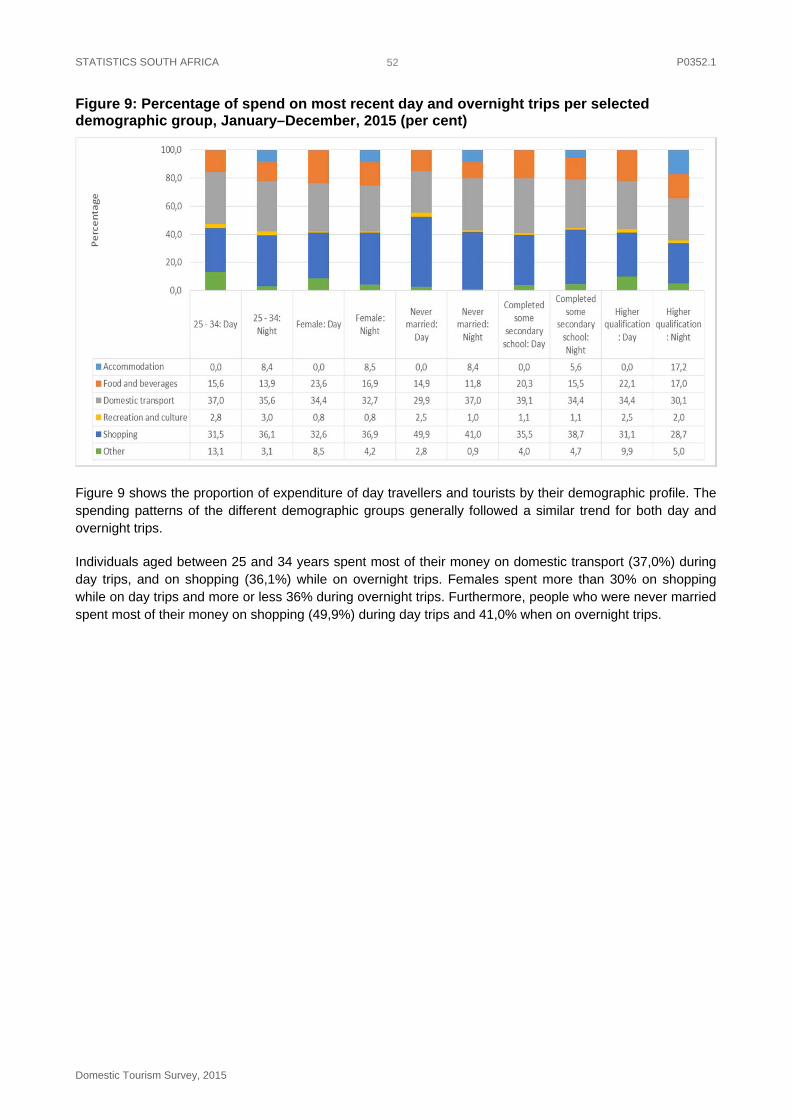
STATISTICS SOUTH AFRICA P0352.1
Domestic Tourism Survey, 2015
52
Figure 9: Percentage of spend on most recent day and overnight trips per selected demographic group, January–December, 2015 (per cent)
Figure 9 shows the proportion of expenditure of day travellers and tourists by their demographic profile. The spending patterns of the different demographic groups generally followed a similar trend for both day and overnight trips.
Individuals aged between 25 and 34 years spent most of their money on domestic transport (37,0%) during day trips, and on shopping (36,1%) while on overnight trips. Females spent more than 30% on shopping while on day trips and more or less 36% during overnight trips. Furthermore, people who were never married spent most of their money on shopping (49,9%) during day trips and 41,0% when on overnight trips.
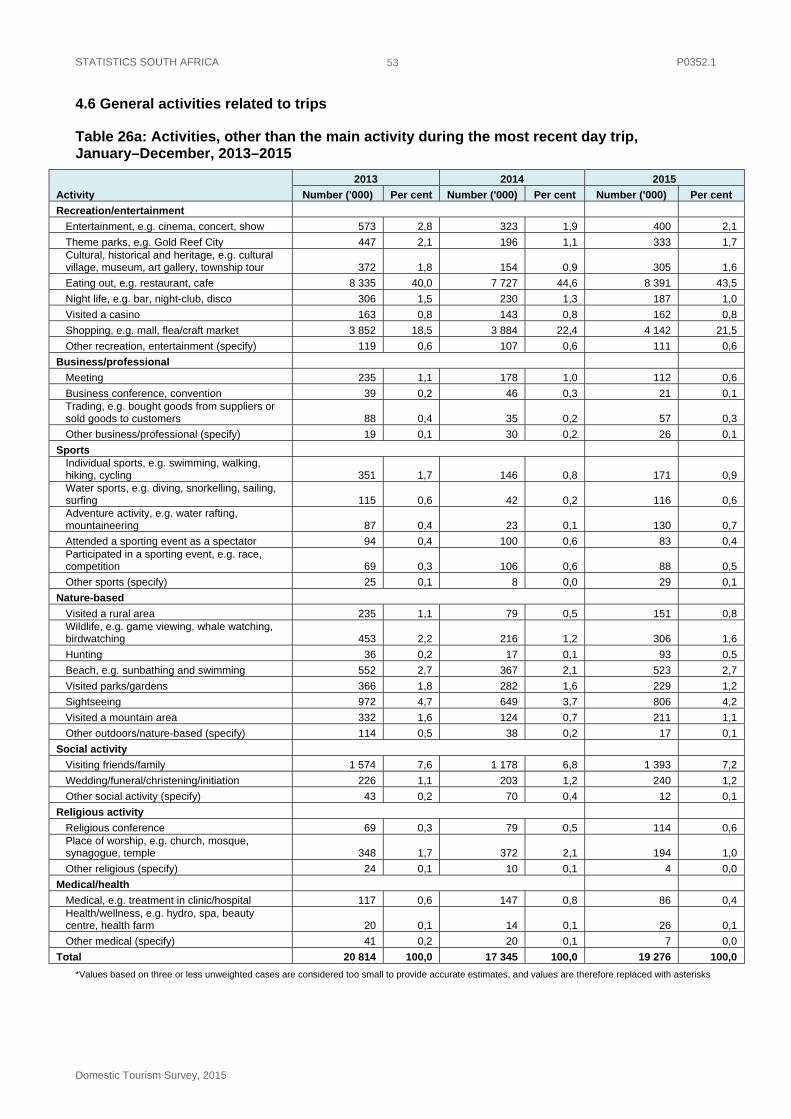
STATISTICS SOUTH AFRICA P0352.1
Domestic Tourism Survey, 2015
53
4.6 General activities related to trips
Table 26a: Activities, other than the main activity during the most recent day trip, January–December, 2013–2015
Activity
2013 2014 2015
Number ('000) Per cent Number ('000) Per cent Number ('000) Per cent
Recreation/entertainment
Entertainment, e.g. cinema, concert, show 573 2,8 323 1,9 400 2,1
Theme parks, e.g. Gold Reef City 447 2,1 196 1,1 333 1,7 Cultural, historical and heritage, e.g. cultural village, museum, art gallery, township tour 372 1,8 154 0,9 305 1,6
Eating out, e.g. restaurant, cafe 8 335 40,0 7 727 44,6 8 391 43,5
Night life, e.g. bar, night-club, disco 306 1,5 230 1,3 187 1,0
Visited a casino 163 0,8 143 0,8 162 0,8
Shopping, e.g. mall, flea/craft market 3 852 18,5 3 884 22,4 4 142 21,5
Other recreation, entertainment (specify) 119 0,6 107 0,6 111 0,6
Business/professional
Meeting 235 1,1 178 1,0 112 0,6
Business conference, convention 39 0,2 46 0,3 21 0,1 Trading, e.g. bought goods from suppliers or sold goods to customers 88 0,4 35 0,2 57 0,3
Other business/professional (specify) 19 0,1 30 0,2 26 0,1
Sports Individual sports, e.g. swimming, walking, hiking, cycling 351 1,7 146 0,8 171 0,9 Water sports, e.g. diving, snorkelling, sailing, surfing 115 0,6 42 0,2 116 0,6 Adventure activity, e.g. water rafting, mountaineering 87 0,4 23 0,1 130 0,7
Attended a sporting event as a spectator 94 0,4 100 0,6 83 0,4 Participated in a sporting event, e.g. race, competition 69 0,3 106 0,6 88 0,5
Other sports (specify) 25 0,1 8 0,0 29 0,1
Nature-based
Visited a rural area 235 1,1 79 0,5 151 0,8 Wildlife, e.g. game viewing, whale watching, birdwatching 453 2,2 216 1,2 306 1,6
Hunting 36 0,2 17 0,1 93 0,5
Beach, e.g. sunbathing and swimming 552 2,7 367 2,1 523 2,7
Visited parks/gardens 366 1,8 282 1,6 229 1,2
Sightseeing 972 4,7 649 3,7 806 4,2
Visited a mountain area 332 1,6 124 0,7 211 1,1
Other outdoors/nature-based (specify) 114 0,5 38 0,2 17 0,1
Social activity
Visiting friends/family 1 574 7,6 1 178 6,8 1 393 7,2
Wedding/funeral/christening/initiation 226 1,1 203 1,2 240 1,2
Other social activity (specify) 43 0,2 70 0,4 12 0,1
Religious activity
Religious conference 69 0,3 79 0,5 114 0,6 Place of worship, e.g. church, mosque, synagogue, temple 348 1,7 372 2,1 194 1,0
Other religious (specify) 24 0,1 10 0,1 4 0,0
Medical/health
Medical, e.g. treatment in clinic/hospital 117 0,6 147 0,8 86 0,4 Health/wellness, e.g. hydro, spa, beauty centre, health farm 20 0,1 14 0,1 26 0,1
Other medical (specify) 41 0,2 20 0,1 7 0,0
Total 20 814 100,0 17 345 100,0 19 276 100,0
*Values based on three or less unweighted cases are considered too small to provide accurate estimates, and values are therefore replaced with asterisks
STATISTICS SOUTH AFRICA P0352.1
Domestic Tourism Survey, 2015
54
From Table 26a, it is clear that the broader activity category, namely 'recreation and entertainment', which includes eating out, restaurants and cafes, formed the bulk of activities undertaken by day trip travellers – 68,1% in 2013; 73,6% in 2014; and 72,8% in 2015, followed by nature-based activities from 14,8% in 2013; 10,1% in 2014; and 12,2% in 2015.
Almost 9,0% of activities undertaken as secondary activities in 2013 and 2015 were social activities. The results show that in 2014, social activities were 8,4%. This includes visiting friends/family, and weddings, amongst others. About two per cent (2%) of some of the engagements were religious activities from 2013 to 2015. The opposite trend was observed for sports activities with a decrease from 3,5% in 2013 to 2,3% in 2014, and an increase to 3,2% in 2015.

STATISTICS SOUTH AFRICA P0352.1
Domestic Tourism Survey, 2015
55
Table 26b: Activities, other than the main activity during the most recent overnight trip, January–December, 2013–2015
Table 26b indicates similar patterns for the type of additional activities undertaken during overnight trips when compared to day trips. As was the case with day trips, the three most popular activities undertaken on overnight trips were shopping at malls/flea markets (about 20%) in 2013, 2014 and 2015; eating out at restaurants/bars was 22,7% in 2013, and increased by 0,7% to 23,4% in 2014 and then to 24,0% in 2015. In 2013, 9,7% of overnight trips included visiting friends/family, and this figure increased to 10,4% in 2014 and then to 11,1% in 2015.
Activity
2013 2014 2015 Number
('000) Per cent Number
('000) Per cent Number
('000) Per cent Recreation/entertainment
Entertainment, e.g. cinema, concert, show 1 256 2,5 1 263 2,6 1 226 2,6 Theme parks, e.g. aquarium 1 411 2,8 1 263 2,6 1 011 2,2 Cultural, historical and heritage, e.g. cultural village, museum 1 237 2,4 1 090 2,2 877 1,9 Eating out, e.g. restaurant, cafe 11 446 22,7 11 440 23,4 11 163 24,0 Night life, e.g. bar, night club, disco 1 577 3,1 1 315 2,7 1 282 2,8 Visited casino 598 1,2 567 1,2 660 1,4 Shopping, e.g. mall, flea/craft market 9 844 19,5 10 027 20,5 9 520 20,4 Other recreation, entertainment 147 0,3 251 0,5 127 0,3
Business/professional Meeting 191 0,4 214 0,4 172 0,4 Business conference, convention 140 0,3 110 0,2 115 0,2 Trading, e.g. bought goods from suppliers or sold goods to customers 96 0,2 54 0,1 98 0,2 Other business 48 0,1 33 0,1 30 0,1
Sports Individual sports, e.g. swimming, walking, hiking, cycling 1 157 2,3 1 122 2,3 712 1,5 Water sports, e.g. diving, snorkelling, sailing, surfing 378 0,7 448 0,9 253 0,5 Adventure activity, e.g. water rafting, mountaineering 228 0,5 263 0,5 274 0,6 Attended a sporting event as a spectator 517 1,0 254 0,5 201 0,4 Participated in a sporting event, e.g. race, competition 248 0,5 130 0,3 81 0,2 Other sports 78 0,2 39 0,1 38 0,1
Nature-based Visited a rural area 953 1,9 683 1,4 894 1,9 Wildlife, e.g. game viewing, whale watching, birdwatching 1 272 2,5 1 243 2,5 887 1,9 Hunting 195 0,4 60 0,1 58 0,1 Beach, e.g. sunbathing and swimming 2 319 4,6 2 479 5,1 2 547 5,5 Visited parks/gardens 1 244 2,5 1 271 2,6 1 077 2,3 Sightseeing 2 466 4,9 2 137 4,4 2 329 5,0 Visited a mountain area 1 160 2,3 896 1,8 735 1,6 Other outdoors/nature-based 312 0,6 124 0,3 245 0,5
Social activity Visiting friends/family 4 902 9,7 5 083 10,4 5 149 11,1 Wedding/funeral/christening/initiation 1 112 2,2 1 283 2,6 1 538 3,3 Other social activities 208 0,4 174 0,4 104 0,2
Religious activity Religious conference 508 1,0 531 1,1 387 0,8 Place of worship, e.g. church, mosque, synagogue, temple 2 504 5,0 2 612 5,3 2 433 5,2 Other religious 84 0,2 64 0,1 45 0,1
Medical/health Medical, e.g. treatment in clinic/hospital 410 0,8 236 0,5 170 0,4 Health/wellness, e.g. hydro, spa, beauty centre, health farm 213 0,4 85 0,2 112 0,2 Other medical 38 0,1 41 0,1 28 0,1
Total 50 497 100,0 48 887 100,0 46 578 100,0

STATISTICS SOUTH AFRICA P0352.1
Domestic Tourism Survey, 2015
56
Table 27: Booking patterns by main purpose of most recent overnight trips, January–December, 2015
Booking patterns
Main purpose of trip (Per cent)
Leisure Shopping Sporting VFR Business Religion Funeral Cultural
occasion Medical/ health Other Unspecified Total
How trip booked
Tour operator 0,4 * * * 1,2 2,2 * * * 1,5 * 0,4
Travel agent 4,9 22,1 5,9 7,0 44,1 2,7 * * 6,0 13,8 * 7,7
Independently 94,5 54,0 94,1 71,8 54,7 95,0 83,5 74,8 94,0 83,5 17,3 86,0
No booking necessary 0,2 23,9 * 21,1 * * 16,5 25,2 * 1,2 82,7 5,8
Total 100,0 100,0 100,0 100,0 100,0 100,0 100,0 100,0 100,0 100,0 100,0 100,0
Method used to book Personal visit to travel shop 4,2 * * 36,8 16,6 22,8 20,8 38,0 13,4 14,2 1,8 11,0
Entirely by phone 36,2 54,0 46,8 12,0 22,1 45,0 20,4 36,8 67,0 52,9 * 32,4
On the internet 50,8 * 47,3 15,1 51,8 7,5 23,1 * * 25,5 12,5 40,8
Through fax/post * * * 0,7 * * * * * * * 0,1
Don't know 0,7 * 5,9 0,9 3,9 2,2 * * * 1,4 * 1,0
Unspecified 8,1 46,0 * 34,6 5,6 22,4 35,7 25,2 19,6 5,9 85,7 14,8
Total 100,0 100,0 100,0 100,0 100,0 100,0 100,0 100,0 100,0 100,0 100,0 100,0
Booking lead period
Less than 2 weeks 21,7 12,1 42,9 40,1 68,7 32,0 64,3 74,8 74,3 18,8 1,8 29,3 Two weeks to one month 39,9 * 22,9 21,6 21,9 23,1 * * 6,0 49,3 * 33,1
Two to three months 15,9 41,9 * 0,7 1,7 22,5 * * * 21,0 12,5 12,4
Four months and more 14,3 * 28,4 0,7 2,4 * * * * 0,8 * 9,8
Unspecified 8,2 46,0 5,9 36,8 5,4 22,4 35,7 25,2 19,6 10,2 85,7 15,4
Total 100,0 100,0 100,0 100,0 100,0 100,0 100,0 100,0 100,0 100,0 100,0 100,0
*Values based on three or less unweighted cases are considered too small to provide accurate estimates, and values are therefore replaced with asterisks
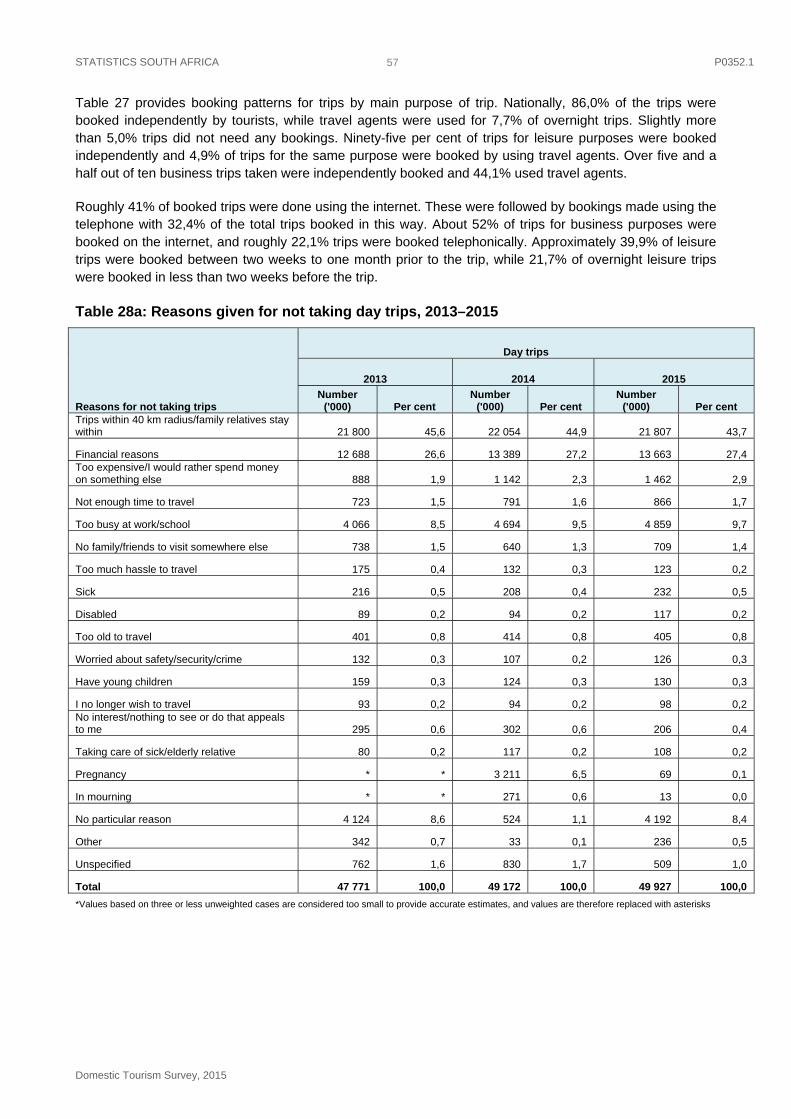
STATISTICS SOUTH AFRICA P0352.1
Domestic Tourism Survey, 2015
57
Table 27 provides booking patterns for trips by main purpose of trip. Nationally, 86,0% of the trips were booked independently by tourists, while travel agents were used for 7,7% of overnight trips. Slightly more than 5,0% trips did not need any bookings. Ninety-five per cent of trips for leisure purposes were booked independently and 4,9% of trips for the same purpose were booked by using travel agents. Over five and a half out of ten business trips taken were independently booked and 44,1% used travel agents.
Roughly 41% of booked trips were done using the internet. These were followed by bookings made using the telephone with 32,4% of the total trips booked in this way. About 52% of trips for business purposes were booked on the internet, and roughly 22,1% trips were booked telephonically. Approximately 39,9% of leisure trips were booked between two weeks to one month prior to the trip, while 21,7% of overnight leisure trips were booked in less than two weeks before the trip.
Table 28a: Reasons given for not taking day trips, 2013–2015
Reasons for not taking trips
Day trips
2013 2014 2015
Number ('000) Per cent
Number ('000) Per cent
Number ('000) Per cent
Trips within 40 km radius/family relatives stay within 21 800 45,6 22 054 44,9 21 807 43,7
Financial reasons 12 688 26,6 13 389 27,2 13 663 27,4Too expensive/I would rather spend money on something else 888 1,9 1 142 2,3 1 462 2,9
Not enough time to travel 723 1,5 791 1,6 866 1,7
Too busy at work/school 4 066 8,5 4 694 9,5 4 859 9,7
No family/friends to visit somewhere else 738 1,5 640 1,3 709 1,4
Too much hassle to travel 175 0,4 132 0,3 123 0,2
Sick 216 0,5 208 0,4 232 0,5
Disabled 89 0,2 94 0,2 117 0,2
Too old to travel 401 0,8 414 0,8 405 0,8
Worried about safety/security/crime 132 0,3 107 0,2 126 0,3
Have young children 159 0,3 124 0,3 130 0,3
I no longer wish to travel 93 0,2 94 0,2 98 0,2No interest/nothing to see or do that appeals to me 295 0,6 302 0,6 206 0,4
Taking care of sick/elderly relative 80 0,2 117 0,2 108 0,2
Pregnancy * * 3 211 6,5 69 0,1
In mourning * * 271 0,6 13 0,0
No particular reason 4 124 8,6 524 1,1 4 192 8,4
Other 342 0,7 33 0,1 236 0,5
Unspecified 762 1,6 830 1,7 509 1,0
Total 47 771 100,0 49 172 100,0 49 927 100,0
*Values based on three or less unweighted cases are considered too small to provide accurate estimates, and values are therefore replaced with asterisks
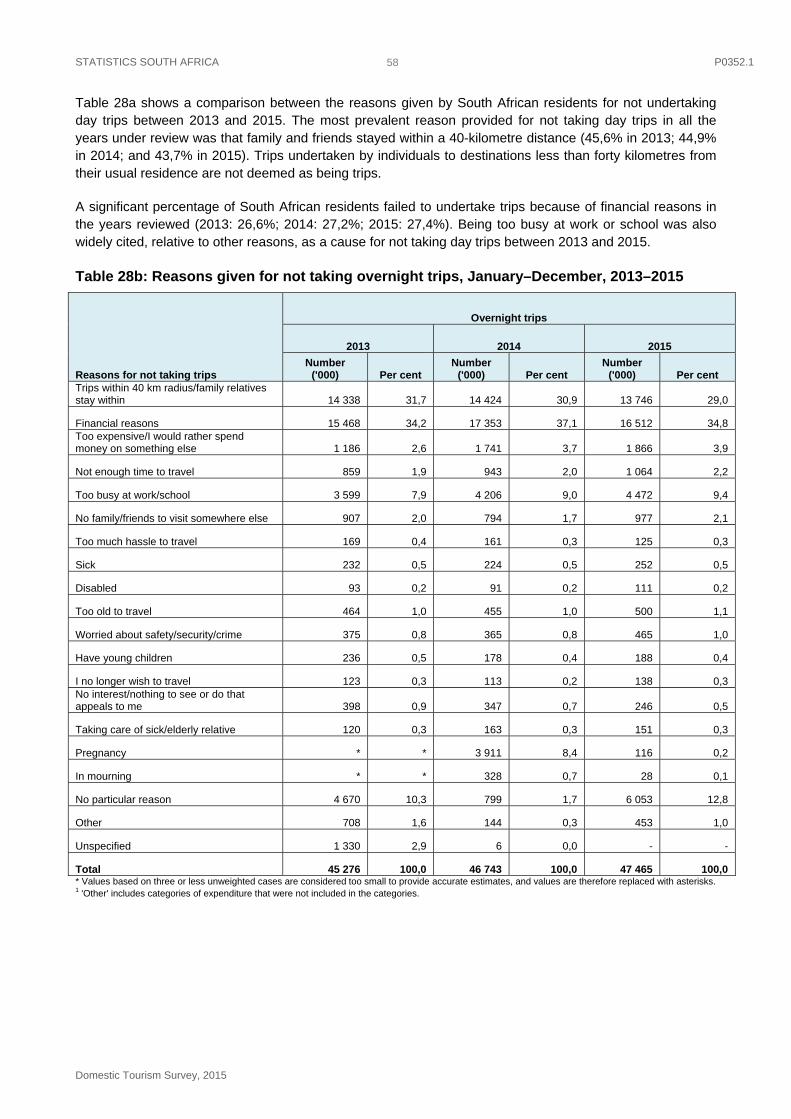
STATISTICS SOUTH AFRICA P0352.1
Domestic Tourism Survey, 2015
58
Table 28a shows a comparison between the reasons given by South African residents for not undertaking day trips between 2013 and 2015. The most prevalent reason provided for not taking day trips in all the years under review was that family and friends stayed within a 40-kilometre distance (45,6% in 2013; 44,9% in 2014; and 43,7% in 2015). Trips undertaken by individuals to destinations less than forty kilometres from their usual residence are not deemed as being trips.
A significant percentage of South African residents failed to undertake trips because of financial reasons in the years reviewed (2013: 26,6%; 2014: 27,2%; 2015: 27,4%). Being too busy at work or school was also widely cited, relative to other reasons, as a cause for not taking day trips between 2013 and 2015.
Table 28b: Reasons given for not taking overnight trips, January–December, 2013–2015
Reasons for not taking trips
Overnight trips
2013 2014 2015
Number ('000) Per cent
Number ('000) Per cent
Number ('000) Per cent
Trips within 40 km radius/family relatives stay within 14 338 31,7 14 424 30,9 13 746 29,0
Financial reasons 15 468 34,2 17 353 37,1 16 512 34,8 Too expensive/I would rather spend money on something else 1 186 2,6 1 741 3,7 1 866 3,9
Not enough time to travel 859 1,9 943 2,0 1 064 2,2
Too busy at work/school 3 599 7,9 4 206 9,0 4 472 9,4
No family/friends to visit somewhere else 907 2,0 794 1,7 977 2,1
Too much hassle to travel 169 0,4 161 0,3 125 0,3
Sick 232 0,5 224 0,5 252 0,5
Disabled 93 0,2 91 0,2 111 0,2
Too old to travel 464 1,0 455 1,0 500 1,1
Worried about safety/security/crime 375 0,8 365 0,8 465 1,0
Have young children 236 0,5 178 0,4 188 0,4
I no longer wish to travel 123 0,3 113 0,2 138 0,3 No interest/nothing to see or do that appeals to me 398 0,9 347 0,7 246 0,5
Taking care of sick/elderly relative 120 0,3 163 0,3 151 0,3
Pregnancy * * 3 911 8,4 116 0,2
In mourning * * 328 0,7 28 0,1
No particular reason 4 670 10,3 799 1,7 6 053 12,8
Other 708 1,6 144 0,3 453 1,0
Unspecified 1 330 2,9 6 0,0 - -
Total 45 276 100,0 46 743 100,0 47 465 100,0 * Values based on three or less unweighted cases are considered too small to provide accurate estimates, and values are therefore replaced with asterisks. 1 'Other' includes categories of expenditure that were not included in the categories.
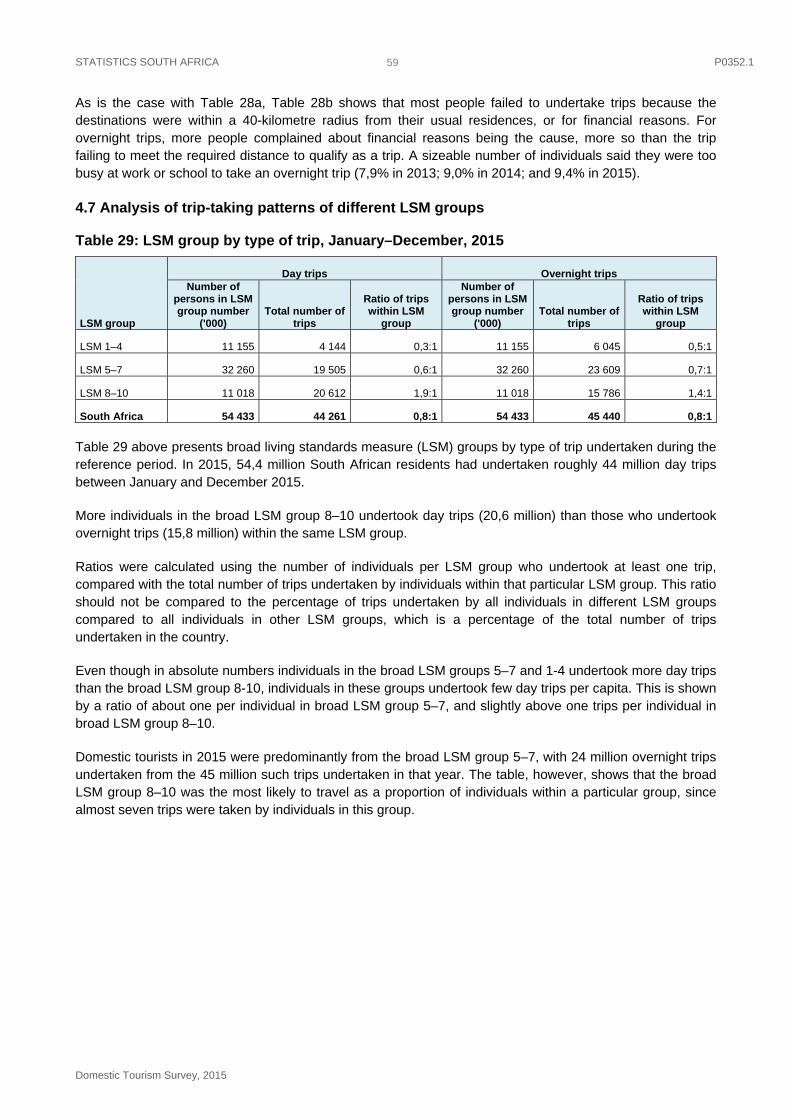
STATISTICS SOUTH AFRICA P0352.1
Domestic Tourism Survey, 2015
59
As is the case with Table 28a, Table 28b shows that most people failed to undertake trips because the destinations were within a 40-kilometre radius from their usual residences, or for financial reasons. For overnight trips, more people complained about financial reasons being the cause, more so than the trip failing to meet the required distance to qualify as a trip. A sizeable number of individuals said they were too busy at work or school to take an overnight trip (7,9% in 2013; 9,0% in 2014; and 9,4% in 2015).
4.7 Analysis of trip-taking patterns of different LSM groups
Table 29: LSM group by type of trip, January–December, 2015
LSM group
Day trips Overnight trips Number of
persons in LSM group number
('000) Total number of
trips
Ratio of trips within LSM
group
Number of persons in LSM group number
('000) Total number of
trips
Ratio of trips within LSM
group
LSM 1–4 11 155 4 144 0,3:1 11 155 6 045 0,5:1
LSM 5–7 32 260 19 505 0,6:1 32 260 23 609 0,7:1
LSM 8–10 11 018 20 612 1,9:1 11 018 15 786 1,4:1
South Africa 54 433 44 261 0,8:1 54 433 45 440 0,8:1
Table 29 above presents broad living standards measure (LSM) groups by type of trip undertaken during the reference period. In 2015, 54,4 million South African residents had undertaken roughly 44 million day trips between January and December 2015.
More individuals in the broad LSM group 8–10 undertook day trips (20,6 million) than those who undertook overnight trips (15,8 million) within the same LSM group.
Ratios were calculated using the number of individuals per LSM group who undertook at least one trip, compared with the total number of trips undertaken by individuals within that particular LSM group. This ratio should not be compared to the percentage of trips undertaken by all individuals in different LSM groups compared to all individuals in other LSM groups, which is a percentage of the total number of trips undertaken in the country.
Even though in absolute numbers individuals in the broad LSM groups 5–7 and 1-4 undertook more day trips than the broad LSM group 8-10, individuals in these groups undertook few day trips per capita. This is shown by a ratio of about one per individual in broad LSM group 5–7, and slightly above one trips per individual in broad LSM group 8–10.
Domestic tourists in 2015 were predominantly from the broad LSM group 5–7, with 24 million overnight trips undertaken from the 45 million such trips undertaken in that year. The table, however, shows that the broad LSM group 8–10 was the most likely to travel as a proportion of individuals within a particular group, since almost seven trips were taken by individuals in this group.

STATISTICS SOUTH AFRICA P0352.1
Domestic Tourism Survey, 2015
60
Figure 10: Broad LSM groups by main purpose of most recent day and overnight trips (per cent), January–December, 2015
Figure 10 reveals the different purposes that individuals in different LSM groups gave for taking trips. For broad LSM groups 1–4 and 5–7, the trend seems to be to take day trips for shopping (49,5% and 32,0%, respectively) and visiting friends and relatives for overnight trips (64,7% and 52,9%, respectively).
For individuals in broad LSM group 8–10, however, the most cited reason for undertaking both day and overnight trips was leisure (day trips: 31,1%; overnight trips: 40,4%), followed by visiting friends and relatives.
LSM 1 ‐ 4: DayLSM 1 ‐ 4:Night
LSM 5 ‐ 7: DayLSM 5 ‐ 7:Night
LSM 8 ‐ 10:Day
LSM 8 ‐ 10:Night
Leisure 3,6 3,3 7,5 8,1 31,1 40,4
Shopping 49,5 0,5 32,0 0,7 15,8 0,4
Sporting 1,4 0,1 1,5 0,5 2,6 1,6
VFR 15,1 64,7 22,2 52,9 28,2 36,1
Business 4,8 1,8 3,9 1,6 4,6 3,3
Religion 5,3 7,8 7,4 7,9 3,1 3,2
Funeral 4,6 13,2 7,6 17,6 5,3 9,3
Cultural occassion 0,0 2,1 0,0 2,7 0,0 0,5
Medical/health 5,2 1,7 4,4 0,8 2,2 0,7
Other 9,8 3,8 13,0 6,9 7,0 4,1
Unspecified 0,6 1,1 0,6 0,5 0,2 0,5
0,0
20,0
40,0
60,0
80,0
100,0
Percentage
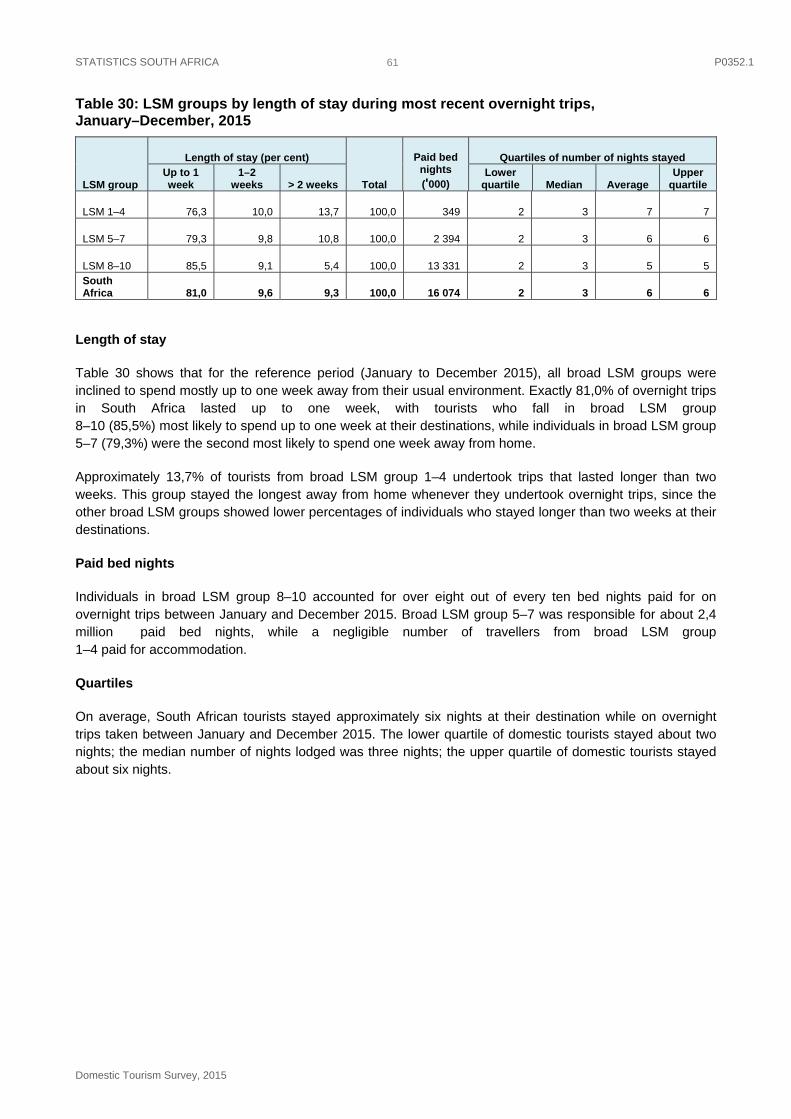
STATISTICS SOUTH AFRICA P0352.1
Domestic Tourism Survey, 2015
61
Table 30: LSM groups by length of stay during most recent overnight trips, January–December, 2015
LSM group
Length of stay (per cent)
Total
Paid bed nights ('000)
Quartiles of number of nights stayed
Up to 1 week
1–2 weeks > 2 weeks
Lower quartile Median Average
Upper quartile
LSM 1–4 76,3 10,0 13,7 100,0 349 2 3 7 7
LSM 5–7 79,3 9,8 10,8 100,0 2 394 2 3 6 6
LSM 8–10 85,5 9,1 5,4 100,0 13 331 2 3 5 5
South Africa 81,0 9,6 9,3 100,0 16 074 2 3 6 6
Length of stay
Table 30 shows that for the reference period (January to December 2015), all broad LSM groups were inclined to spend mostly up to one week away from their usual environment. Exactly 81,0% of overnight trips in South Africa lasted up to one week, with tourists who fall in broad LSM group 8–10 (85,5%) most likely to spend up to one week at their destinations, while individuals in broad LSM group 5–7 (79,3%) were the second most likely to spend one week away from home.
Approximately 13,7% of tourists from broad LSM group 1–4 undertook trips that lasted longer than two weeks. This group stayed the longest away from home whenever they undertook overnight trips, since the other broad LSM groups showed lower percentages of individuals who stayed longer than two weeks at their destinations.
Paid bed nights
Individuals in broad LSM group 8–10 accounted for over eight out of every ten bed nights paid for on overnight trips between January and December 2015. Broad LSM group 5–7 was responsible for about 2,4 million paid bed nights, while a negligible number of travellers from broad LSM group 1–4 paid for accommodation.
Quartiles
On average, South African tourists stayed approximately six nights at their destination while on overnight trips taken between January and December 2015. The lower quartile of domestic tourists stayed about two nights; the median number of nights lodged was three nights; the upper quartile of domestic tourists stayed about six nights.

STATISTICS SOUTH AFRICA P0352.1
Domestic Tourism Survey, 2015
62
Table 31: LSM groups by expenditure (R'000) on most recent day and overnight trips, January–December, 2015
LSM group Accommodation Food and
beverages Domestic transport
Recreation and culture Shopping Other1 Total
Day trips
LSM 1–4 - 55 491 105 758 1 109 77 305 9 548 249 210
LSM 5–7 - 353 575 748 564 21 262 749 597 256 753 2 129 751
LSM 8–10 - 1 336 873 1 641 677 151 755 1 372 074 340 704 4 843 082
South Africa - 1 745 939 2 495 999 174 125 2 198 976 607 004 7 222 043
Overnight trips
LSM 1–4 36 539 365 274 949 084 7 312 1 112 105 53 918 2 524 231
LSM 5–7 554 537 2 070 211 4 930 214 117 785 5 645 164 706 370 14 024 281
LSM 8–10 3 629 958 3 678 232 5 759 421 441 836 4 651 342 748 627 18 909 416
South Africa 4 221 034 6 113 716 11 638 720 566 932 11 408 611 1 508 914 35 457 928 1 'Other' includes categories of expenditure that were not included in the categories
The estimated total spending on most recent day trips between January and December 2015 was R7,2 billion, and R35 billion for overnight trips over the same period. Much of the expenditure on day trips was for domestic transport (R2,5 billion), followed by expenditure on shopping and food and beverages with R2,2 billion and R1,7 billion, respectively.
On overnight trips, domestic transport (R11,6 billion) remained the category with the highest expenditure, followed by shopping (R11,4 billion) and food and beverages (R6,1 billion).
The table further shows that broad LSM group 8–10 spent the most while on day trips, having spent more or less R4,8 billion. Most of the expenditure was spent on domestic transport (R1,6 billion) and shopping (R1,4 billion). Broad LSM group 1–4 spent the least money while on day trips, but they tended to spend their money on domestic transport (R105 million) and shopping (R77 million).
Broad LSM group 8–10 accounted for slightly above five rand of every ten rand spent on overnight trips between January and December 2015. They spent most of their money on domestic transport (R5,8 billion); shopping (R4,7 billion); food and beverages (R3,7 billion) and on accommodation (R3,6 billion). The next highest spending group was broad LSM group 5–7 (R14 billion), and individuals in this group spent money mostly on shopping (R5,6 billion) and domestic transport (R4,9 billion).
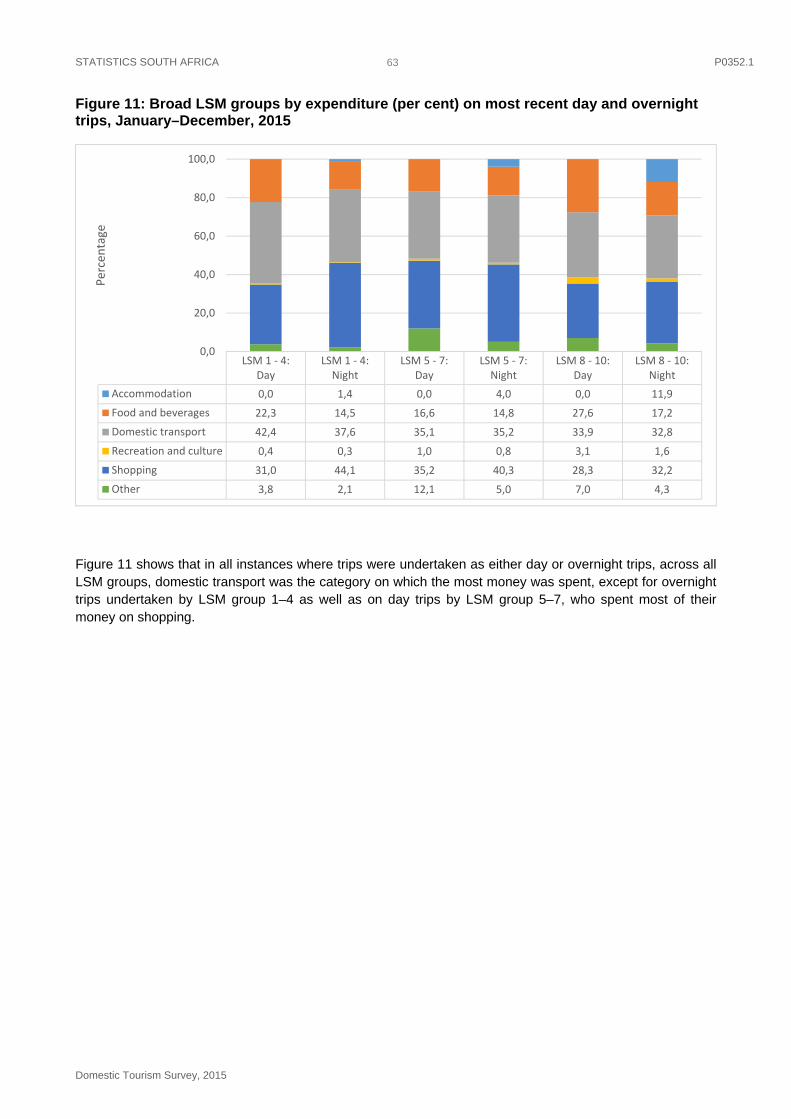
STATISTICS SOUTH AFRICA P0352.1
Domestic Tourism Survey, 2015
63
Figure 11: Broad LSM groups by expenditure (per cent) on most recent day and overnight trips, January–December, 2015
Figure 11 shows that in all instances where trips were undertaken as either day or overnight trips, across all LSM groups, domestic transport was the category on which the most money was spent, except for overnight trips undertaken by LSM group 1–4 as well as on day trips by LSM group 5–7, who spent most of their money on shopping.
LSM 1 ‐ 4:Day
LSM 1 ‐ 4:Night
LSM 5 ‐ 7:Day
LSM 5 ‐ 7:Night
LSM 8 ‐ 10:Day
LSM 8 ‐ 10:Night
Accommodation 0,0 1,4 0,0 4,0 0,0 11,9
Food and beverages 22,3 14,5 16,6 14,8 27,6 17,2
Domestic transport 42,4 37,6 35,1 35,2 33,9 32,8
Recreation and culture 0,4 0,3 1,0 0,8 3,1 1,6
Shopping 31,0 44,1 35,2 40,3 28,3 32,2
Other 3,8 2,1 12,1 5,0 7,0 4,3
0,0
20,0
40,0
60,0
80,0
100,0
Percentage

STATISTICS SOUTH AFRICA P0352.1
Domestic Tourism Survey, 2015
64
Table 32: Number of most recent trips per broad LSM group by main mode of transport, January–December, 2015
Broad LSM group
Main mode of transport ('000)
Air Bus Car Taxi Other1 Unspecified Total
Day trips
LSM group 1–4 * 256 351 1 402 140 19 2 168
LSM group 5–7 * 682 3 748 3 953 256 84 8 721
LSM group 8–10 71 177 6 996 254 72 22 7 593
South Africa 71 1 115 11 095 5 609 468 125 18 483
Overnight trips
LSM group 1–4 11 367 539 2 607 112 46 3 681
LSM group 5–7 111 1 639 5 353 6 806 460 96 14 466
LSM group 8–10 617 332 7 861 437 83 75 9 404
South Africa 738 2 339 13 753 9 850 655 217 27 551 1 'Other' includes motorcycles, bicycles, trains, etc.
Most recent day trips undertaken during the reference period January to December 2015 were taken by a car (11 million), and most tourists on overnight trips also used cars (14 million) to reach their destinations.
Since broad LSM group 5–7 undertook most of the day trips during the reference period, this group had the second highest proportion of cars used on day trips, when compared to other LSM groups. This group relied mostly on taxis while on day and overnight trips, unlike their more affluent counterparts.
For overnight trips, the table shows that over eighty per cent of air travel was undertaken by tourists in broad LSM group 8–10, and a further fifteen per cent by individuals in group 5–7, while broad LSM group 1–4 made up less than two per cent of South Africans who used that mode of transport on overnight trips.
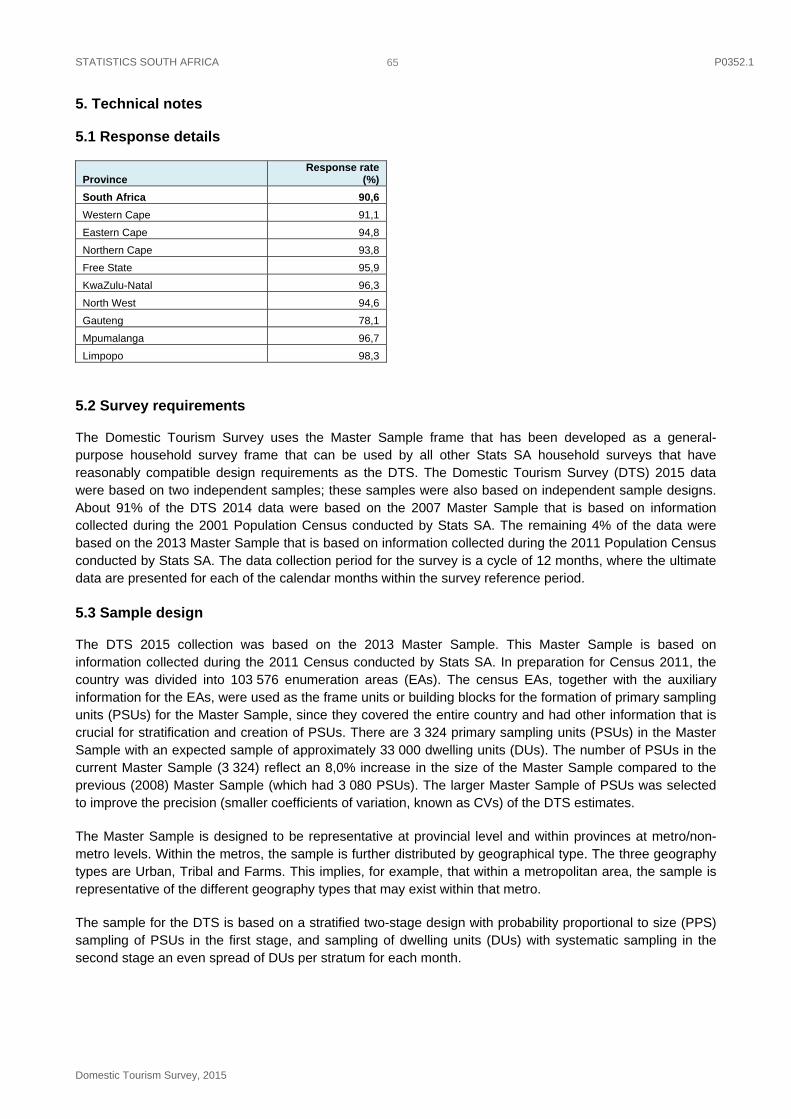
STATISTICS SOUTH AFRICA P0352.1
Domestic Tourism Survey, 2015
65
5. Technical notes
5.1 Response details
Province Response rate
(%)
South Africa 90,6
Western Cape 91,1
Eastern Cape 94,8
Northern Cape 93,8
Free State 95,9
KwaZulu-Natal 96,3
North West 94,6
Gauteng 78,1
Mpumalanga 96,7
Limpopo 98,3
5.2 Survey requirements
The Domestic Tourism Survey uses the Master Sample frame that has been developed as a general-purpose household survey frame that can be used by all other Stats SA household surveys that have reasonably compatible design requirements as the DTS. The Domestic Tourism Survey (DTS) 2015 data were based on two independent samples; these samples were also based on independent sample designs. About 91% of the DTS 2014 data were based on the 2007 Master Sample that is based on information collected during the 2001 Population Census conducted by Stats SA. The remaining 4% of the data were based on the 2013 Master Sample that is based on information collected during the 2011 Population Census conducted by Stats SA. The data collection period for the survey is a cycle of 12 months, where the ultimate data are presented for each of the calendar months within the survey reference period.
5.3 Sample design
The DTS 2015 collection was based on the 2013 Master Sample. This Master Sample is based on information collected during the 2011 Census conducted by Stats SA. In preparation for Census 2011, the country was divided into 103 576 enumeration areas (EAs). The census EAs, together with the auxiliary information for the EAs, were used as the frame units or building blocks for the formation of primary sampling units (PSUs) for the Master Sample, since they covered the entire country and had other information that is crucial for stratification and creation of PSUs. There are 3 324 primary sampling units (PSUs) in the Master Sample with an expected sample of approximately 33 000 dwelling units (DUs). The number of PSUs in the current Master Sample (3 324) reflect an 8,0% increase in the size of the Master Sample compared to the previous (2008) Master Sample (which had 3 080 PSUs). The larger Master Sample of PSUs was selected to improve the precision (smaller coefficients of variation, known as CVs) of the DTS estimates.
The Master Sample is designed to be representative at provincial level and within provinces at metro/non-metro levels. Within the metros, the sample is further distributed by geographical type. The three geography types are Urban, Tribal and Farms. This implies, for example, that within a metropolitan area, the sample is representative of the different geography types that may exist within that metro.
The sample for the DTS is based on a stratified two-stage design with probability proportional to size (PPS) sampling of PSUs in the first stage, and sampling of dwelling units (DUs) with systematic sampling in the second stage an even spread of DUs per stratum for each month.
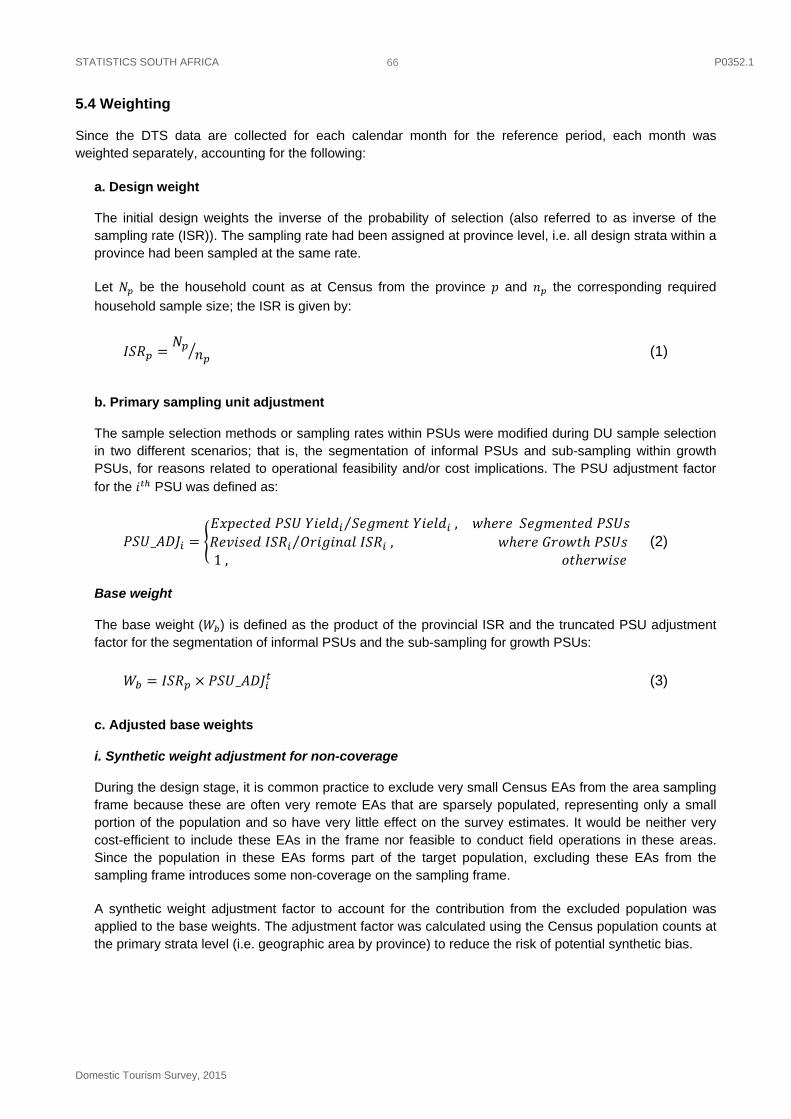
STATISTICS SOUTH AFRICA P0352.1
Domestic Tourism Survey, 2015
66
5.4 Weighting
Since the DTS data are collected for each calendar month for the reference period, each month was weighted separately, accounting for the following:
a. Design weight
The initial design weights the inverse of the probability of selection (also referred to as inverse of the sampling rate (ISR)). The sampling rate had been assigned at province level, i.e. all design strata within a province had been sampled at the same rate.
Let be the household count as at Census from the province and the corresponding required
household sample size; the ISR is given by:
(1)
b. Primary sampling unit adjustment
The sample selection methods or sampling rates within PSUs were modified during DU sample selection in two different scenarios; that is, the segmentation of informal PSUs and sub-sampling within growth PSUs, for reasons related to operational feasibility and/or cost implications. The PSU adjustment factor for the PSU was defined as:
_ ,⁄
,⁄ 1,
(2)
Base weight
The base weight ( ) is defined as the product of the provincial ISR and the truncated PSU adjustment factor for the segmentation of informal PSUs and the sub-sampling for growth PSUs:
_ (3)
c. Adjusted base weights
i. Synthetic weight adjustment for non-coverage
During the design stage, it is common practice to exclude very small Census EAs from the area sampling frame because these are often very remote EAs that are sparsely populated, representing only a small portion of the population and so have very little effect on the survey estimates. It would be neither very cost-efficient to include these EAs in the frame nor feasible to conduct field operations in these areas. Since the population in these EAs forms part of the target population, excluding these EAs from the sampling frame introduces some non-coverage on the sampling frame.
A synthetic weight adjustment factor to account for the contribution from the excluded population was applied to the base weights. The adjustment factor was calculated using the Census population counts at the primary strata level (i.e. geographic area by province) to reduce the risk of potential synthetic bias.
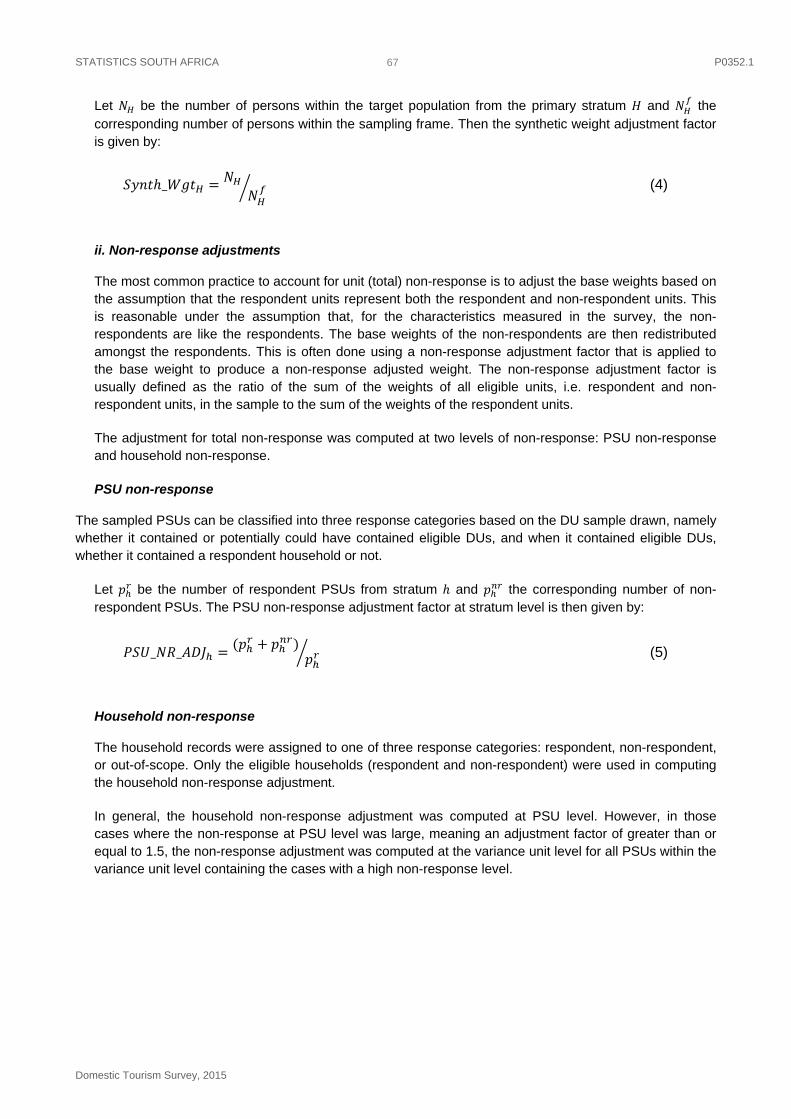
STATISTICS SOUTH AFRICA P0352.1
Domestic Tourism Survey, 2015
67
Let be the number of persons within the target population from the primary stratum and the corresponding number of persons within the sampling frame. Then the synthetic weight adjustment factor is given by:
_ (4)
ii. Non-response adjustments
The most common practice to account for unit (total) non-response is to adjust the base weights based on the assumption that the respondent units represent both the respondent and non-respondent units. This is reasonable under the assumption that, for the characteristics measured in the survey, the non-respondents are like the respondents. The base weights of the non-respondents are then redistributed amongst the respondents. This is often done using a non-response adjustment factor that is applied to the base weight to produce a non-response adjusted weight. The non-response adjustment factor is usually defined as the ratio of the sum of the weights of all eligible units, i.e. respondent and non-respondent units, in the sample to the sum of the weights of the respondent units.
The adjustment for total non-response was computed at two levels of non-response: PSU non-response and household non-response.
PSU non-response
The sampled PSUs can be classified into three response categories based on the DU sample drawn, namely whether it contained or potentially could have contained eligible DUs, and when it contained eligible DUs, whether it contained a respondent household or not.
Let be the number of respondent PSUs from stratum and the corresponding number of non-respondent PSUs. The PSU non-response adjustment factor at stratum level is then given by:
_ _ (5)
Household non-response
The household records were assigned to one of three response categories: respondent, non-respondent, or out-of-scope. Only the eligible households (respondent and non-respondent) were used in computing the household non-response adjustment.
In general, the household non-response adjustment was computed at PSU level. However, in those cases where the non-response at PSU level was large, meaning an adjustment factor of greater than or equal to 1.5, the non-response adjustment was computed at the variance unit level for all PSUs within the variance unit level containing the cases with a high non-response level.
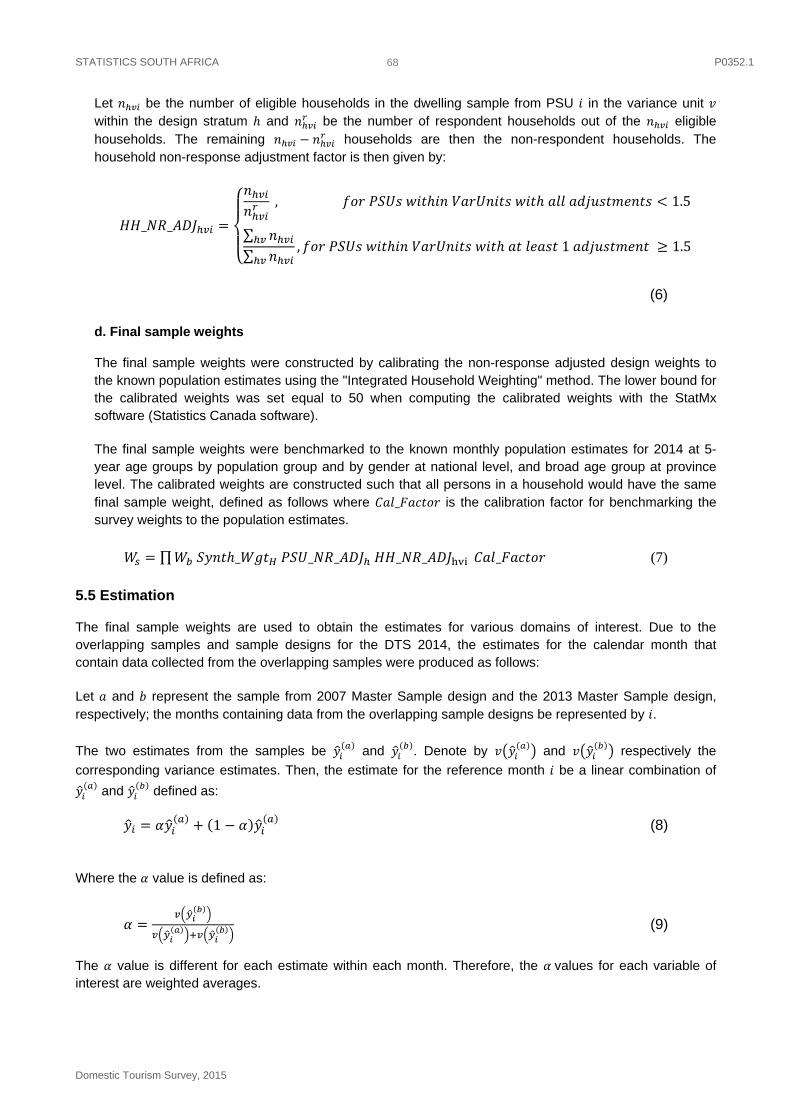
STATISTICS SOUTH AFRICA P0352.1
Domestic Tourism Survey, 2015
68
Let be the number of eligible households in the dwelling sample from PSU in the variance unit within the design stratum and be the number of respondent households out of the eligible households. The remaining households are then the non-respondent households. The household non-response adjustment factor is then given by:
_ _
, 1.5
∑∑
, 1 1.5
(6)
d. Final sample weights
The final sample weights were constructed by calibrating the non-response adjusted design weights to the known population estimates using the "Integrated Household Weighting" method. The lower bound for the calibrated weights was set equal to 50 when computing the calibrated weights with the StatMx software (Statistics Canada software).
The final sample weights were benchmarked to the known monthly population estimates for 2014 at 5-year age groups by population group and by gender at national level, and broad age group at province level. The calibrated weights are constructed such that all persons in a household would have the same final sample weight, defined as follows where _ is the calibration factor for benchmarking the survey weights to the population estimates.
∏ _ _ _ _ _ _ (7)
5.5 Estimation
The final sample weights are used to obtain the estimates for various domains of interest. Due to the overlapping samples and sample designs for the DTS 2014, the estimates for the calendar month that contain data collected from the overlapping samples were produced as follows:
Let and represent the sample from 2007 Master Sample design and the 2013 Master Sample design, respectively; the months containing data from the overlapping sample designs be represented by .
The two estimates from the samples be and . Denote by and respectively the
corresponding variance estimates. Then, the estimate for the reference month be a linear combination of
and defined as:
1 (8)
Where the value is defined as:
(9)
The value is different for each estimate within each month. Therefore, the values for each variable of interest are weighted averages.
STATISTICS SOUTH AFRICA P0352.1
Domestic Tourism Survey, 2015
69
5.6 Limitations to the study
The DTS 2013 was the first round of tourism surveys to be conducted using the Continuous Data Collection method, followed by DTS 2014 and 2015. The recall period was three months as compared to the previous waves.
5.7 Non-response adjustment
In general, editing (i.e. invalid or inconsistent responses) and imputation (i.e. blanks within the questionnaire) were used for item non-response. The eligible households in the sampled dwellings can be divided into two response categories: households and non-households; and weight adjustment is applied to account for the non-respondent household (e.g. refusal, non-contact).
5.8 Benchmarking
The population estimates produced by the Demographic Analysis division were used during the weighting of the DTS as calibration totals. The calibration process was done at national and provincial levels. This process involved the following demographic variables: age, race and gender (i.e. national x race x gender and province x broad age group).
5.9 Editing and imputation
All questionnaires were scanned, and the data were sent to the post-capture process for editing and imputation. At each stage of checking, data were edited to ensure consistency. Data editing is concerned with the identification and, if possible, the correction of erroneous or highly suspect survey data. Data were checked for valid range, internal logic and consistency.
The focus of the editing process was on clearing skip violations and ensuring that each variable only contains valid values. Very few limits to valid values were set and data were largely released as it was received from the field.
When testing for skip violations and doing automated editing, the following general rules are applied in cases where one question follows the filter question and the skip is violated:
If the filter question had a missing value, the filter is allocated the value that corresponds with the subsequent question that had a valid value.
If the values of the filter question and subsequent question are inconsistent, the value of the filter question is set to missing and imputed using either the hot-deck or nearest neighbour imputation techniques. The imputed value is then once again tested against the skip rule. If the skip rule remains violated, the question subsequent to the filter question is dealt with by either setting it to missing and imputing or, if that fails, printing a message of edit failure for further investigation, decision-making and manual editing.
In cases where skip violations take place for questions where multiple questions follow the filter question, the rules used are as follows:
If the filter question has a missing value, the filter question is allocated the value that corresponds with the value expected, given the completion of the remainder of the question set.
If the filter question and the values of subsequent questions values were inconsistent, a counter is set to see what proportion of the subsequent questions have been completed. If more than 50% of the subsequent questions have been completed, the value of the filter question is modified to correspond with the fact that the rest of the questions in the set were completed. If less than 50% of the subsequent questions in the set were completed, the value of the filter question is set to missing and imputed, using either the hot-deck or nearest neighbour imputation techniques. The imputed value is then once again
STATISTICS SOUTH AFRICA P0352.1
Domestic Tourism Survey, 2015
70
tested against the skip rule. If the skip rule remains violated, the questions in the set that follows the filter question are set to missing.
When dealing with internal inconsistencies, as much as possible was done using logical imputation, i.e. information from other questions was compared with the inconsistent information. If other evidence is found to back up either of the two inconsistent viewpoints, the inconsistency is resolved accordingly. If the internal consistency remains, the question subsequent to the filter question is dealt with by either setting it to missing and imputing its value or printing a message of edit failure for further investigation, decision-making and manual editing.
Two imputation techniques were used for imputing missing values: hot deck and nearest neighbour. In both cases, an already published code was used for imputation. The variable composition of hot decks is based on a combination of the variables used for the Census (where appropriate), an analysis of odds ratios and logistic regression models. Generally, as in the QLFS system, the DTS adds geographic variables such as province, geography type, metro/non-metro, population group, etc. to further refine the decks. This was not done for Census 2001 and it is assumed that the reason for this is the differences in deck size and position for sample surveys as opposed to a multi-million record database.
The 'No' imputations assume that if the 'Yes'/'No' question had to be completed and there is a missing value next to any of the options, the response should have been 'No'. Missing values are therefore converted to the code for 'No', namely '2'. This is only done if there is some evidence that the questions have been completed. Otherwise, all remain missing. For questions for which each option represents a question, no 'No' imputations were made.
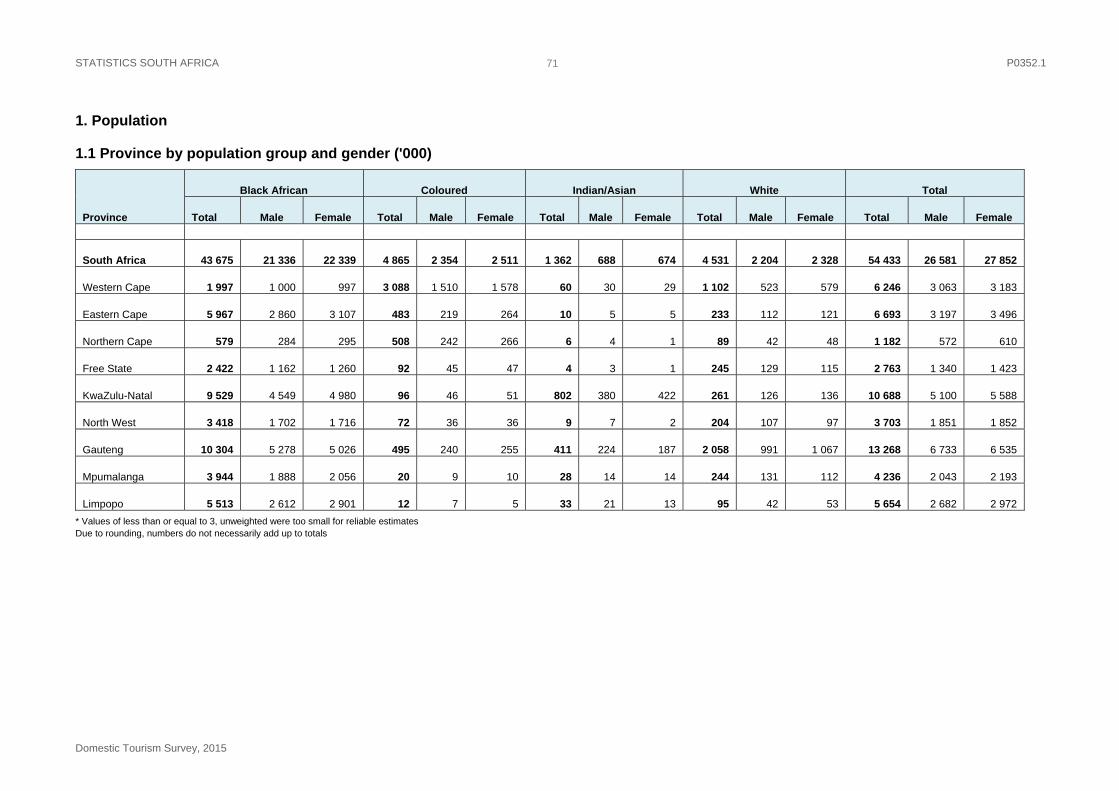
STATISTICS SOUTH AFRICA P0352.1
Domestic Tourism Survey, 2015
71
1. Population
1.1 Province by population group and gender ('000)
Province
Black African Coloured Indian/Asian White Total
Total Male Female Total Male Female Total Male Female Total Male Female Total Male Female
South Africa 43 675 21 336 22 339 4 865 2 354 2 511 1 362 688 674 4 531 2 204 2 328 54 433 26 581 27 852
Western Cape 1 997 1 000 997 3 088 1 510 1 578 60 30 29 1 102 523 579 6 246 3 063 3 183
Eastern Cape 5 967 2 860 3 107 483 219 264 10 5 5 233 112 121 6 693 3 197 3 496
Northern Cape 579 284 295 508 242 266 6 4 1 89 42 48 1 182 572 610
Free State 2 422 1 162 1 260 92 45 47 4 3 1 245 129 115 2 763 1 340 1 423
KwaZulu-Natal 9 529 4 549 4 980 96 46 51 802 380 422 261 126 136 10 688 5 100 5 588
North West 3 418 1 702 1 716 72 36 36 9 7 2 204 107 97 3 703 1 851 1 852
Gauteng 10 304 5 278 5 026 495 240 255 411 224 187 2 058 991 1 067 13 268 6 733 6 535
Mpumalanga 3 944 1 888 2 056 20 9 10 28 14 14 244 131 112 4 236 2 043 2 193
Limpopo 5 513 2 612 2 901 12 7 5 33 21 13 95 42 53 5 654 2 682 2 972
* Values of less than or equal to 3, unweighted were too small for reliable estimates Due to rounding, numbers do not necessarily add up to totals
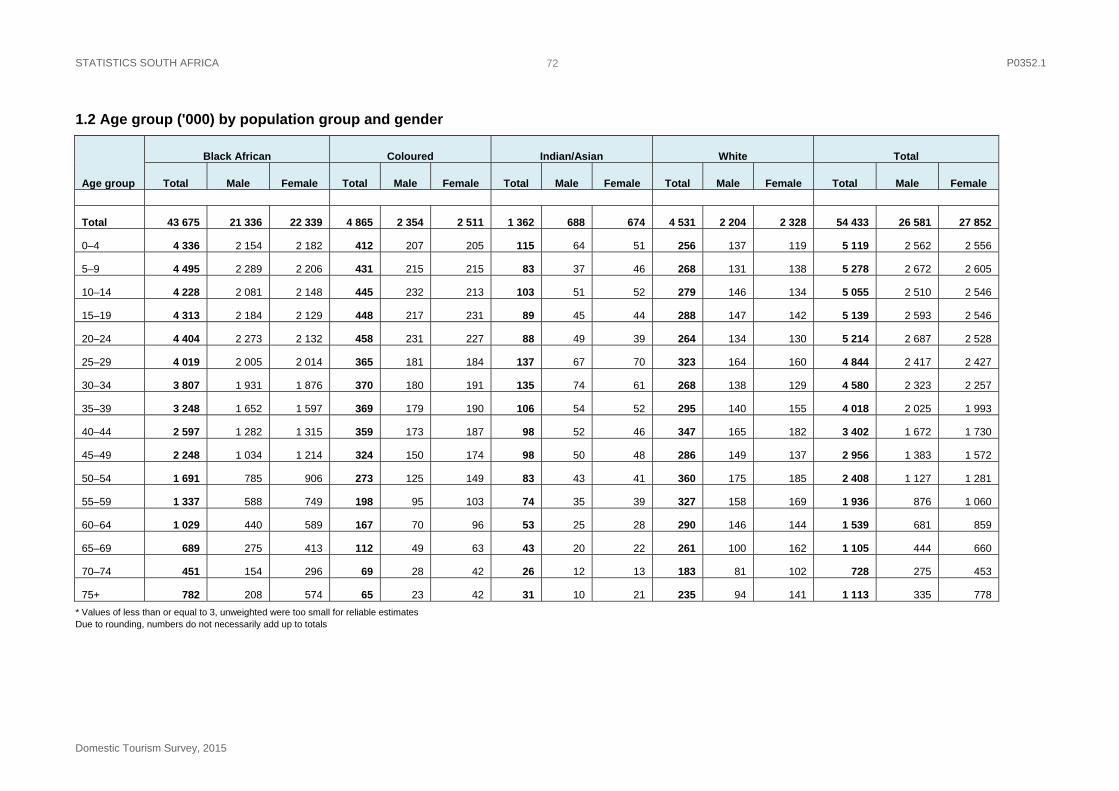
STATISTICS SOUTH AFRICA P0352.1
Domestic Tourism Survey, 2015
72
1.2 Age group ('000) by population group and gender
Age group
Black African Coloured Indian/Asian White Total
Total Male Female Total Male Female Total Male Female Total Male Female Total Male Female
Total 43 675 21 336 22 339 4 865 2 354 2 511 1 362 688 674 4 531 2 204 2 328 54 433 26 581 27 852
0–4 4 336 2 154 2 182 412 207 205 115 64 51 256 137 119 5 119 2 562 2 556
5–9 4 495 2 289 2 206 431 215 215 83 37 46 268 131 138 5 278 2 672 2 605
10–14 4 228 2 081 2 148 445 232 213 103 51 52 279 146 134 5 055 2 510 2 546
15–19 4 313 2 184 2 129 448 217 231 89 45 44 288 147 142 5 139 2 593 2 546
20–24 4 404 2 273 2 132 458 231 227 88 49 39 264 134 130 5 214 2 687 2 528
25–29 4 019 2 005 2 014 365 181 184 137 67 70 323 164 160 4 844 2 417 2 427
30–34 3 807 1 931 1 876 370 180 191 135 74 61 268 138 129 4 580 2 323 2 257
35–39 3 248 1 652 1 597 369 179 190 106 54 52 295 140 155 4 018 2 025 1 993
40–44 2 597 1 282 1 315 359 173 187 98 52 46 347 165 182 3 402 1 672 1 730
45–49 2 248 1 034 1 214 324 150 174 98 50 48 286 149 137 2 956 1 383 1 572
50–54 1 691 785 906 273 125 149 83 43 41 360 175 185 2 408 1 127 1 281
55–59 1 337 588 749 198 95 103 74 35 39 327 158 169 1 936 876 1 060
60–64 1 029 440 589 167 70 96 53 25 28 290 146 144 1 539 681 859
65–69 689 275 413 112 49 63 43 20 22 261 100 162 1 105 444 660
70–74 451 154 296 69 28 42 26 12 13 183 81 102 728 275 453
75+ 782 208 574 65 23 42 31 10 21 235 94 141 1 113 335 778
* Values of less than or equal to 3, unweighted were too small for reliable estimates Due to rounding, numbers do not necessarily add up to totals
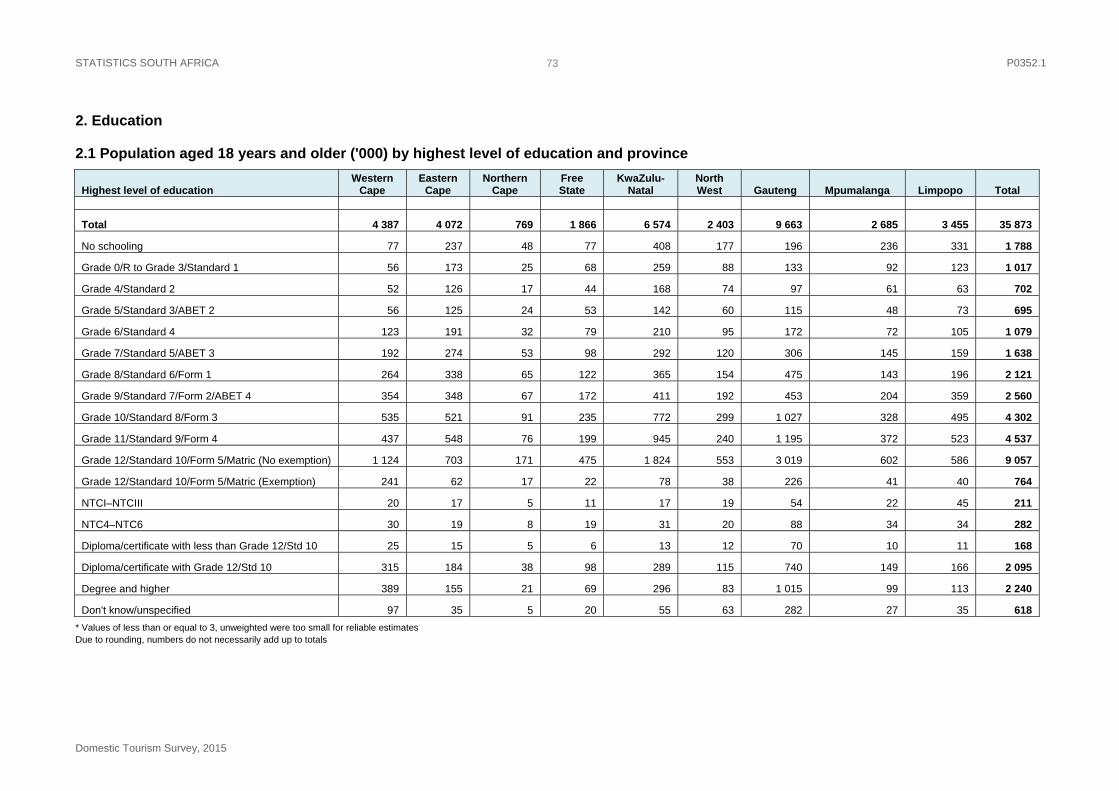
STATISTICS SOUTH AFRICA P0352.1
Domestic Tourism Survey, 2015
73
2. Education
2.1 Population aged 18 years and older ('000) by highest level of education and province
Highest level of education Western
Cape Eastern
Cape Northern
Cape Free State
KwaZulu-Natal
North West Gauteng Mpumalanga Limpopo Total
Total 4 387 4 072 769 1 866 6 574 2 403 9 663 2 685 3 455 35 873
No schooling 77 237 48 77 408 177 196 236 331 1 788
Grade 0/R to Grade 3/Standard 1 56 173 25 68 259 88 133 92 123 1 017
Grade 4/Standard 2 52 126 17 44 168 74 97 61 63 702
Grade 5/Standard 3/ABET 2 56 125 24 53 142 60 115 48 73 695
Grade 6/Standard 4 123 191 32 79 210 95 172 72 105 1 079
Grade 7/Standard 5/ABET 3 192 274 53 98 292 120 306 145 159 1 638
Grade 8/Standard 6/Form 1 264 338 65 122 365 154 475 143 196 2 121
Grade 9/Standard 7/Form 2/ABET 4 354 348 67 172 411 192 453 204 359 2 560
Grade 10/Standard 8/Form 3 535 521 91 235 772 299 1 027 328 495 4 302
Grade 11/Standard 9/Form 4 437 548 76 199 945 240 1 195 372 523 4 537
Grade 12/Standard 10/Form 5/Matric (No exemption) 1 124 703 171 475 1 824 553 3 019 602 586 9 057
Grade 12/Standard 10/Form 5/Matric (Exemption) 241 62 17 22 78 38 226 41 40 764
NTCI–NTCIII 20 17 5 11 17 19 54 22 45 211
NTC4–NTC6 30 19 8 19 31 20 88 34 34 282
Diploma/certificate with less than Grade 12/Std 10 25 15 5 6 13 12 70 10 11 168
Diploma/certificate with Grade 12/Std 10 315 184 38 98 289 115 740 149 166 2 095
Degree and higher 389 155 21 69 296 83 1 015 99 113 2 240
Don't know/unspecified 97 35 5 20 55 63 282 27 35 618
* Values of less than or equal to 3, unweighted were too small for reliable estimates Due to rounding, numbers do not necessarily add up to totals
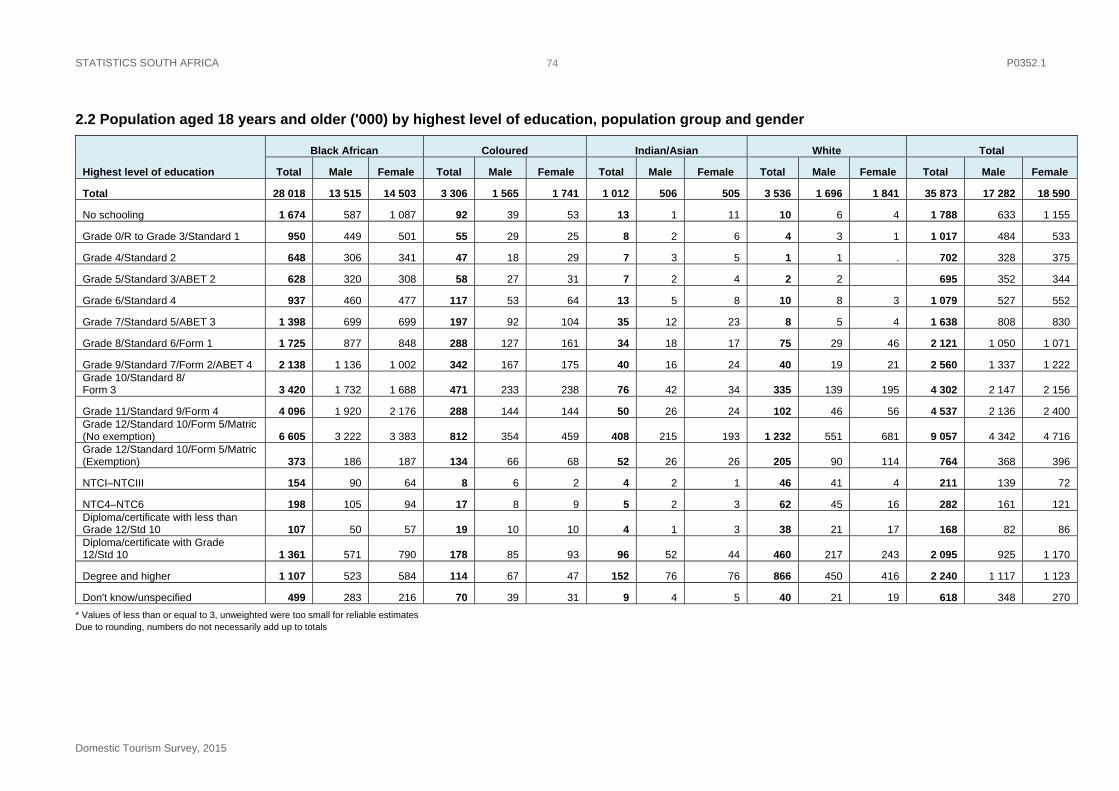
STATISTICS SOUTH AFRICA P0352.1
Domestic Tourism Survey, 2015
74
2.2 Population aged 18 years and older ('000) by highest level of education, population group and gender
Highest level of education
Black African Coloured Indian/Asian White Total
Total Male Female Total Male Female Total Male Female Total Male Female Total Male Female
Total 28 018 13 515 14 503 3 306 1 565 1 741 1 012 506 505 3 536 1 696 1 841 35 873 17 282 18 590
No schooling 1 674 587 1 087 92 39 53 13 1 11 10 6 4 1 788 633 1 155
Grade 0/R to Grade 3/Standard 1 950 449 501 55 29 25 8 2 6 4 3 1 1 017 484 533
Grade 4/Standard 2 648 306 341 47 18 29 7 3 5 1 1 . 702 328 375
Grade 5/Standard 3/ABET 2 628 320 308 58 27 31 7 2 4 2 2 695 352 344
Grade 6/Standard 4 937 460 477 117 53 64 13 5 8 10 8 3 1 079 527 552
Grade 7/Standard 5/ABET 3 1 398 699 699 197 92 104 35 12 23 8 5 4 1 638 808 830
Grade 8/Standard 6/Form 1 1 725 877 848 288 127 161 34 18 17 75 29 46 2 121 1 050 1 071
Grade 9/Standard 7/Form 2/ABET 4 2 138 1 136 1 002 342 167 175 40 16 24 40 19 21 2 560 1 337 1 222 Grade 10/Standard 8/ Form 3 3 420 1 732 1 688 471 233 238 76 42 34 335 139 195 4 302 2 147 2 156
Grade 11/Standard 9/Form 4 4 096 1 920 2 176 288 144 144 50 26 24 102 46 56 4 537 2 136 2 400 Grade 12/Standard 10/Form 5/Matric (No exemption) 6 605 3 222 3 383 812 354 459 408 215 193 1 232 551 681 9 057 4 342 4 716 Grade 12/Standard 10/Form 5/Matric (Exemption) 373 186 187 134 66 68 52 26 26 205 90 114 764 368 396
NTCI–NTCIII 154 90 64 8 6 2 4 2 1 46 41 4 211 139 72
NTC4–NTC6 198 105 94 17 8 9 5 2 3 62 45 16 282 161 121 Diploma/certificate with less than Grade 12/Std 10 107 50 57 19 10 10 4 1 3 38 21 17 168 82 86 Diploma/certificate with Grade 12/Std 10 1 361 571 790 178 85 93 96 52 44 460 217 243 2 095 925 1 170
Degree and higher 1 107 523 584 114 67 47 152 76 76 866 450 416 2 240 1 117 1 123
Don't know/unspecified 499 283 216 70 39 31 9 4 5 40 21 19 618 348 270
* Values of less than or equal to 3, unweighted were too small for reliable estimates Due to rounding, numbers do not necessarily add up to totals
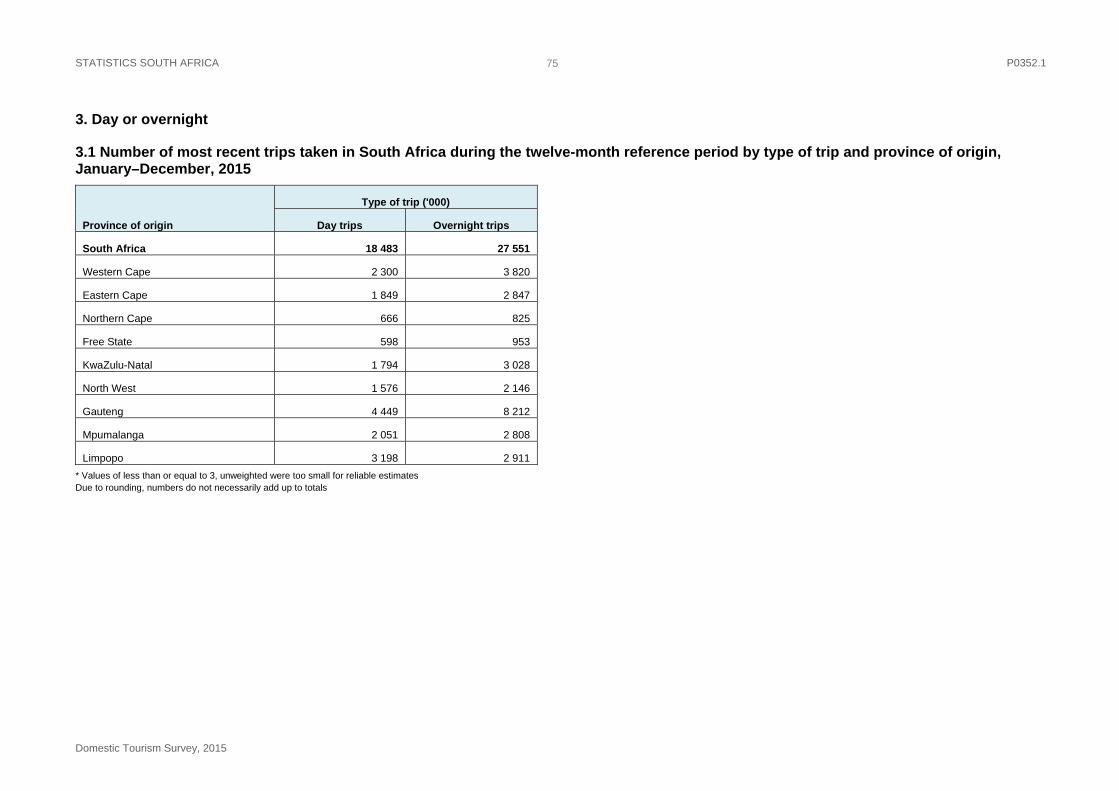
STATISTICS SOUTH AFRICA P0352.1
Domestic Tourism Survey, 2015
75
3. Day or overnight
3.1 Number of most recent trips taken in South Africa during the twelve-month reference period by type of trip and province of origin, January–December, 2015
Province of origin
Type of trip ('000)
Day trips Overnight trips
South Africa 18 483 27 551
Western Cape 2 300 3 820
Eastern Cape 1 849 2 847
Northern Cape 666 825
Free State 598 953
KwaZulu-Natal 1 794 3 028
North West 1 576 2 146
Gauteng 4 449 8 212
Mpumalanga 2 051 2 808
Limpopo 3 198 2 911
* Values of less than or equal to 3, unweighted were too small for reliable estimates Due to rounding, numbers do not necessarily add up to totals

STATISTICS SOUTH AFRICA P0352.1
Domestic Tourism Survey, 2015
76
3.2 Number of most recent trips in South Africa during the twelve-month reference period by number of day trips and province of origin, January–December, 2015
Province of origin
Number of day trips ('000)
1 trip 2–4 trips 5 trips or more Total
South Africa 15 932 2 263 288 18 483
Western Cape 1 713 461 125 2 300
Eastern Cape 1 639 195 15 1 849
Northern Cape 605 52 9 666
Free State 553 41 3 598
KwaZulu-Natal 1 644 147 3 1 794
North West 1 300 238 37 1 576
Gauteng 3 844 549 56 4 449
Mpumalanga 1 802 231 19 2 051
Limpopo 2 831 347 20 3 198
* Values of less than or equal to 3, unweighted were too small for reliable estimates Due to rounding, numbers do not necessarily add up to totals
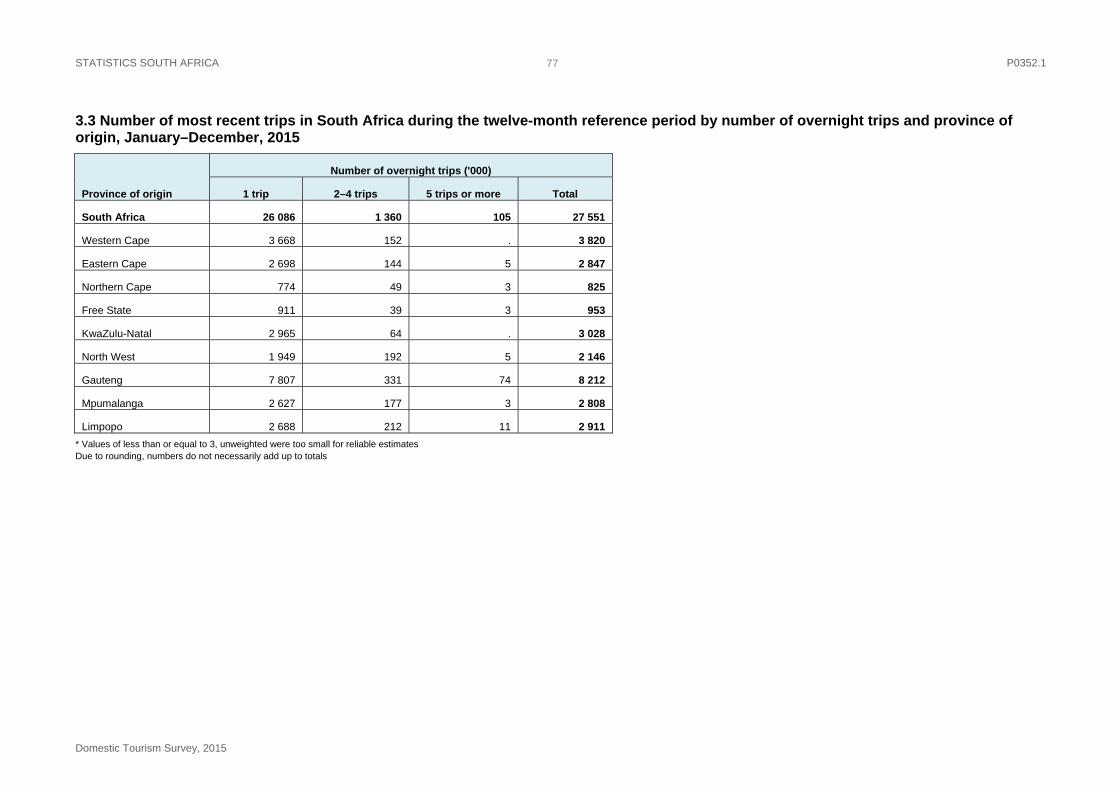
STATISTICS SOUTH AFRICA P0352.1
Domestic Tourism Survey, 2015
77
3.3 Number of most recent trips in South Africa during the twelve-month reference period by number of overnight trips and province of origin, January–December, 2015
Province of origin
Number of overnight trips ('000)
1 trip 2–4 trips 5 trips or more Total
South Africa 26 086 1 360 105 27 551
Western Cape 3 668 152 . 3 820
Eastern Cape 2 698 144 5 2 847
Northern Cape 774 49 3 825
Free State 911 39 3 953
KwaZulu-Natal 2 965 64 . 3 028
North West 1 949 192 5 2 146
Gauteng 7 807 331 74 8 212
Mpumalanga 2 627 177 3 2 808
Limpopo 2 688 212 11 2 911
* Values of less than or equal to 3, unweighted were too small for reliable estimates Due to rounding, numbers do not necessarily add up to totals
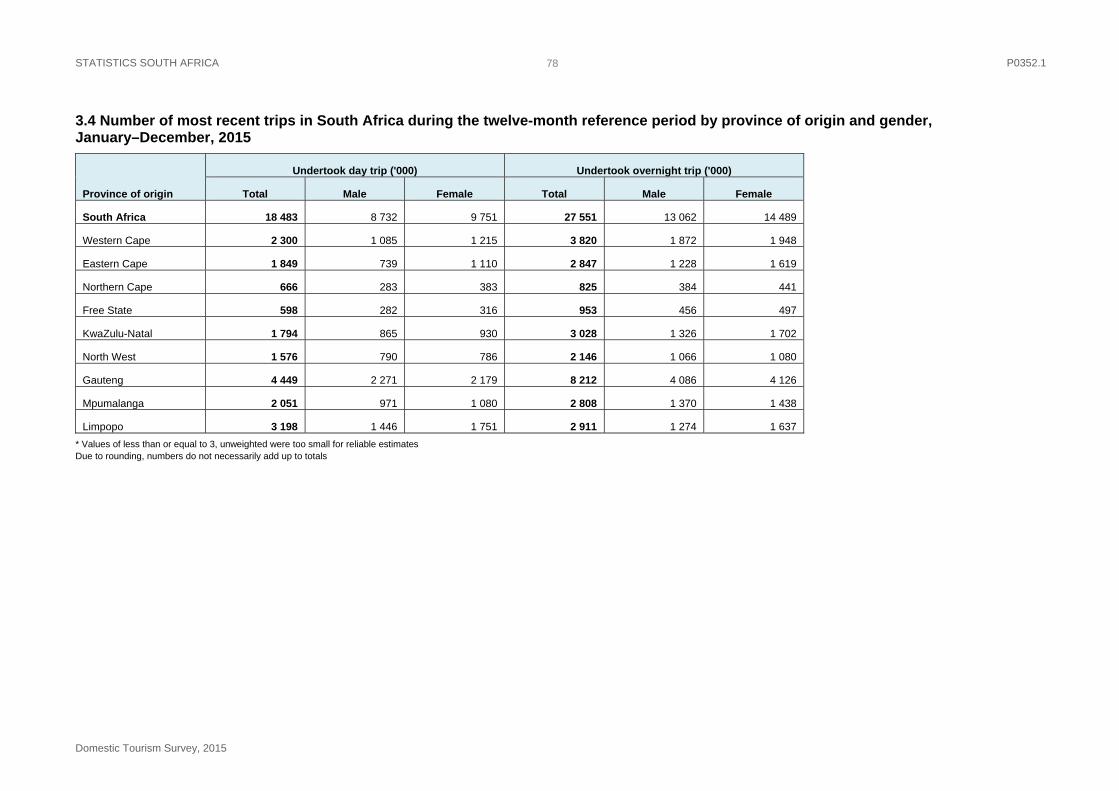
STATISTICS SOUTH AFRICA P0352.1
Domestic Tourism Survey, 2015
78
3.4 Number of most recent trips in South Africa during the twelve-month reference period by province of origin and gender, January–December, 2015
Province of origin
Undertook day trip ('000) Undertook overnight trip ('000)
Total Male Female Total Male Female
South Africa 18 483 8 732 9 751 27 551 13 062 14 489
Western Cape 2 300 1 085 1 215 3 820 1 872 1 948
Eastern Cape 1 849 739 1 110 2 847 1 228 1 619
Northern Cape 666 283 383 825 384 441
Free State 598 282 316 953 456 497
KwaZulu-Natal 1 794 865 930 3 028 1 326 1 702
North West 1 576 790 786 2 146 1 066 1 080
Gauteng 4 449 2 271 2 179 8 212 4 086 4 126
Mpumalanga 2 051 971 1 080 2 808 1 370 1 438
Limpopo 3 198 1 446 1 751 2 911 1 274 1 637
* Values of less than or equal to 3, unweighted were too small for reliable estimates Due to rounding, numbers do not necessarily add up to totals
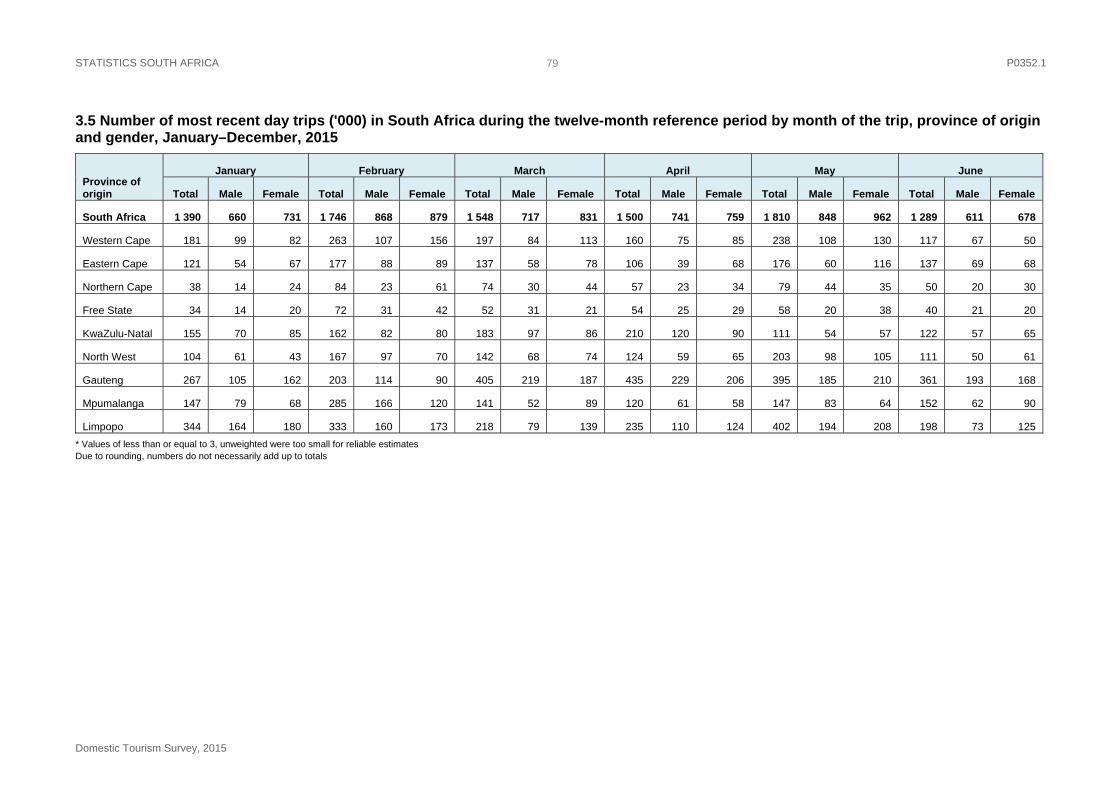
STATISTICS SOUTH AFRICA P0352.1
Domestic Tourism Survey, 2015
79
3.5 Number of most recent day trips ('000) in South Africa during the twelve-month reference period by month of the trip, province of origin and gender, January–December, 2015
Province of origin
January February March April May June
Total Male Female Total Male Female Total Male Female Total Male Female Total Male Female Total Male Female
South Africa 1 390 660 731 1 746 868 879 1 548 717 831 1 500 741 759 1 810 848 962 1 289 611 678
Western Cape 181 99 82 263 107 156 197 84 113 160 75 85 238 108 130 117 67 50
Eastern Cape 121 54 67 177 88 89 137 58 78 106 39 68 176 60 116 137 69 68
Northern Cape 38 14 24 84 23 61 74 30 44 57 23 34 79 44 35 50 20 30
Free State 34 14 20 72 31 42 52 31 21 54 25 29 58 20 38 40 21 20
KwaZulu-Natal 155 70 85 162 82 80 183 97 86 210 120 90 111 54 57 122 57 65
North West 104 61 43 167 97 70 142 68 74 124 59 65 203 98 105 111 50 61
Gauteng 267 105 162 203 114 90 405 219 187 435 229 206 395 185 210 361 193 168
Mpumalanga 147 79 68 285 166 120 141 52 89 120 61 58 147 83 64 152 62 90
Limpopo 344 164 180 333 160 173 218 79 139 235 110 124 402 194 208 198 73 125
* Values of less than or equal to 3, unweighted were too small for reliable estimates Due to rounding, numbers do not necessarily add up to totals
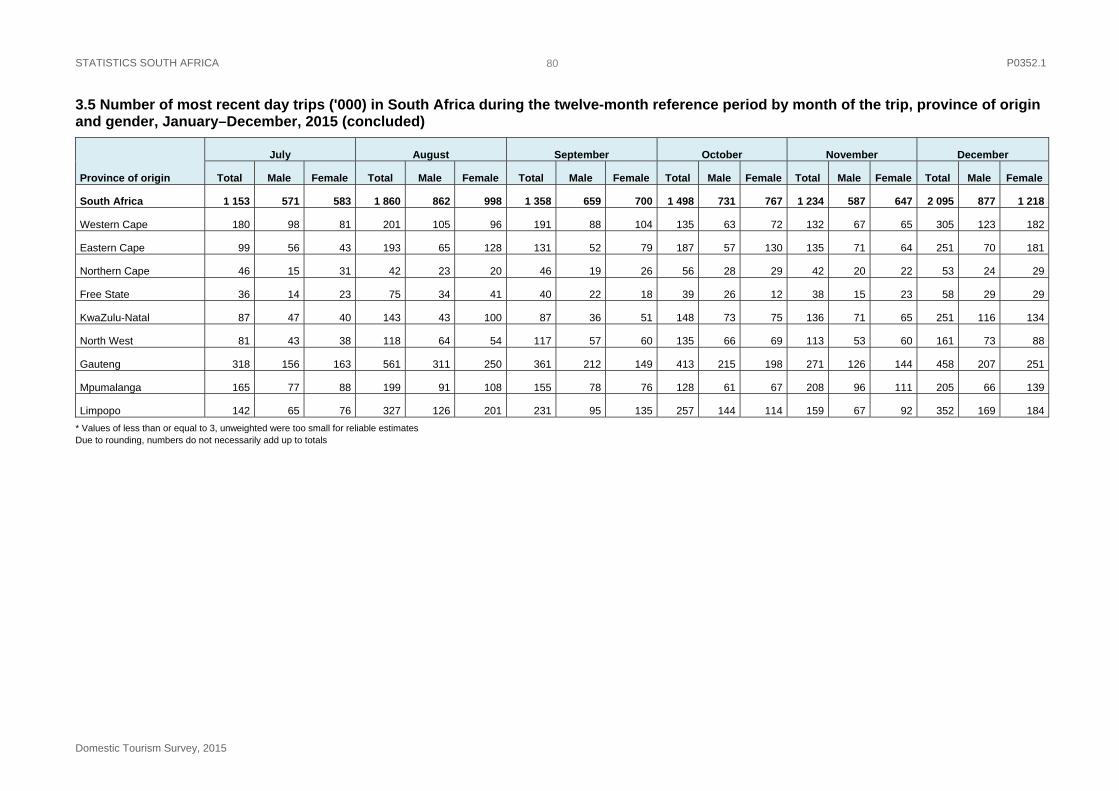
STATISTICS SOUTH AFRICA P0352.1
Domestic Tourism Survey, 2015
80
3.5 Number of most recent day trips ('000) in South Africa during the twelve-month reference period by month of the trip, province of origin and gender, January–December, 2015 (concluded)
Province of origin
July August September October November December
Total Male Female Total Male Female Total Male Female Total Male Female Total Male Female Total Male Female
South Africa 1 153 571 583 1 860 862 998 1 358 659 700 1 498 731 767 1 234 587 647 2 095 877 1 218
Western Cape 180 98 81 201 105 96 191 88 104 135 63 72 132 67 65 305 123 182
Eastern Cape 99 56 43 193 65 128 131 52 79 187 57 130 135 71 64 251 70 181
Northern Cape 46 15 31 42 23 20 46 19 26 56 28 29 42 20 22 53 24 29
Free State 36 14 23 75 34 41 40 22 18 39 26 12 38 15 23 58 29 29
KwaZulu-Natal 87 47 40 143 43 100 87 36 51 148 73 75 136 71 65 251 116 134
North West 81 43 38 118 64 54 117 57 60 135 66 69 113 53 60 161 73 88
Gauteng 318 156 163 561 311 250 361 212 149 413 215 198 271 126 144 458 207 251
Mpumalanga 165 77 88 199 91 108 155 78 76 128 61 67 208 96 111 205 66 139
Limpopo 142 65 76 327 126 201 231 95 135 257 144 114 159 67 92 352 169 184
* Values of less than or equal to 3, unweighted were too small for reliable estimates Due to rounding, numbers do not necessarily add up to totals
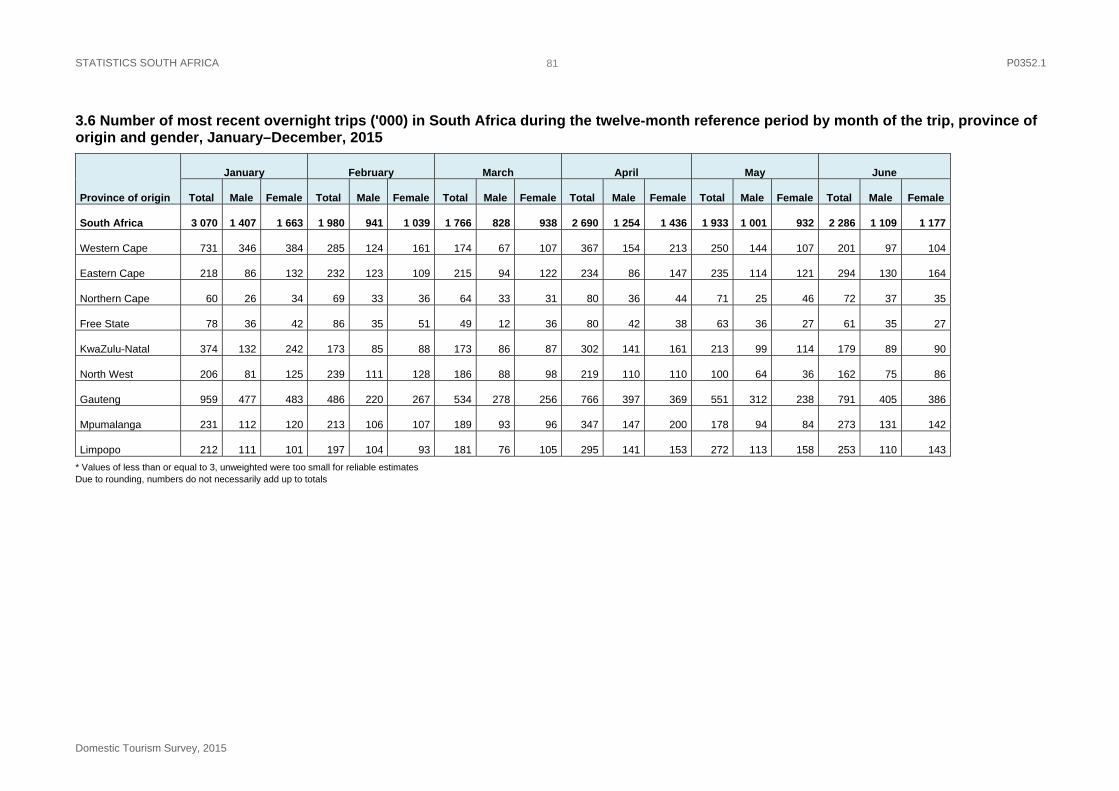
STATISTICS SOUTH AFRICA P0352.1
Domestic Tourism Survey, 2015
81
3.6 Number of most recent overnight trips ('000) in South Africa during the twelve-month reference period by month of the trip, province of origin and gender, January–December, 2015
Province of origin
January February March April May June
Total Male Female Total Male Female Total Male Female Total Male Female Total Male Female Total Male Female
South Africa 3 070 1 407 1 663 1 980 941 1 039 1 766 828 938 2 690 1 254 1 436 1 933 1 001 932 2 286 1 109 1 177
Western Cape 731 346 384 285 124 161 174 67 107 367 154 213 250 144 107 201 97 104
Eastern Cape 218 86 132 232 123 109 215 94 122 234 86 147 235 114 121 294 130 164
Northern Cape 60 26 34 69 33 36 64 33 31 80 36 44 71 25 46 72 37 35
Free State 78 36 42 86 35 51 49 12 36 80 42 38 63 36 27 61 35 27
KwaZulu-Natal 374 132 242 173 85 88 173 86 87 302 141 161 213 99 114 179 89 90
North West 206 81 125 239 111 128 186 88 98 219 110 110 100 64 36 162 75 86
Gauteng 959 477 483 486 220 267 534 278 256 766 397 369 551 312 238 791 405 386
Mpumalanga 231 112 120 213 106 107 189 93 96 347 147 200 178 94 84 273 131 142
Limpopo 212 111 101 197 104 93 181 76 105 295 141 153 272 113 158 253 110 143
* Values of less than or equal to 3, unweighted were too small for reliable estimates Due to rounding, numbers do not necessarily add up to totals
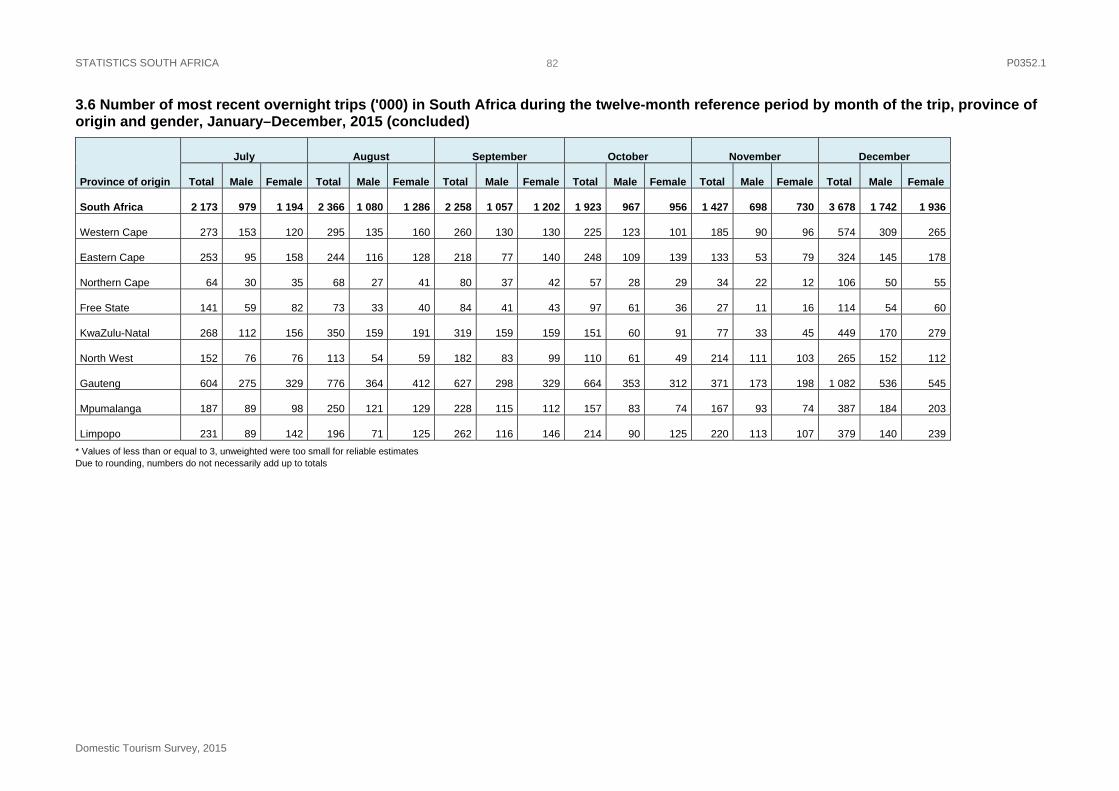
STATISTICS SOUTH AFRICA P0352.1
Domestic Tourism Survey, 2015
82
3.6 Number of most recent overnight trips ('000) in South Africa during the twelve-month reference period by month of the trip, province of origin and gender, January–December, 2015 (concluded)
Province of origin
July August September October November December
Total Male Female Total Male Female Total Male Female Total Male Female Total Male Female Total Male Female
South Africa 2 173 979 1 194 2 366 1 080 1 286 2 258 1 057 1 202 1 923 967 956 1 427 698 730 3 678 1 742 1 936
Western Cape 273 153 120 295 135 160 260 130 130 225 123 101 185 90 96 574 309 265
Eastern Cape 253 95 158 244 116 128 218 77 140 248 109 139 133 53 79 324 145 178
Northern Cape 64 30 35 68 27 41 80 37 42 57 28 29 34 22 12 106 50 55
Free State 141 59 82 73 33 40 84 41 43 97 61 36 27 11 16 114 54 60
KwaZulu-Natal 268 112 156 350 159 191 319 159 159 151 60 91 77 33 45 449 170 279
North West 152 76 76 113 54 59 182 83 99 110 61 49 214 111 103 265 152 112
Gauteng 604 275 329 776 364 412 627 298 329 664 353 312 371 173 198 1 082 536 545
Mpumalanga 187 89 98 250 121 129 228 115 112 157 83 74 167 93 74 387 184 203
Limpopo 231 89 142 196 71 125 262 116 146 214 90 125 220 113 107 379 140 239
* Values of less than or equal to 3, unweighted were too small for reliable estimates Due to rounding, numbers do not necessarily add up to totals
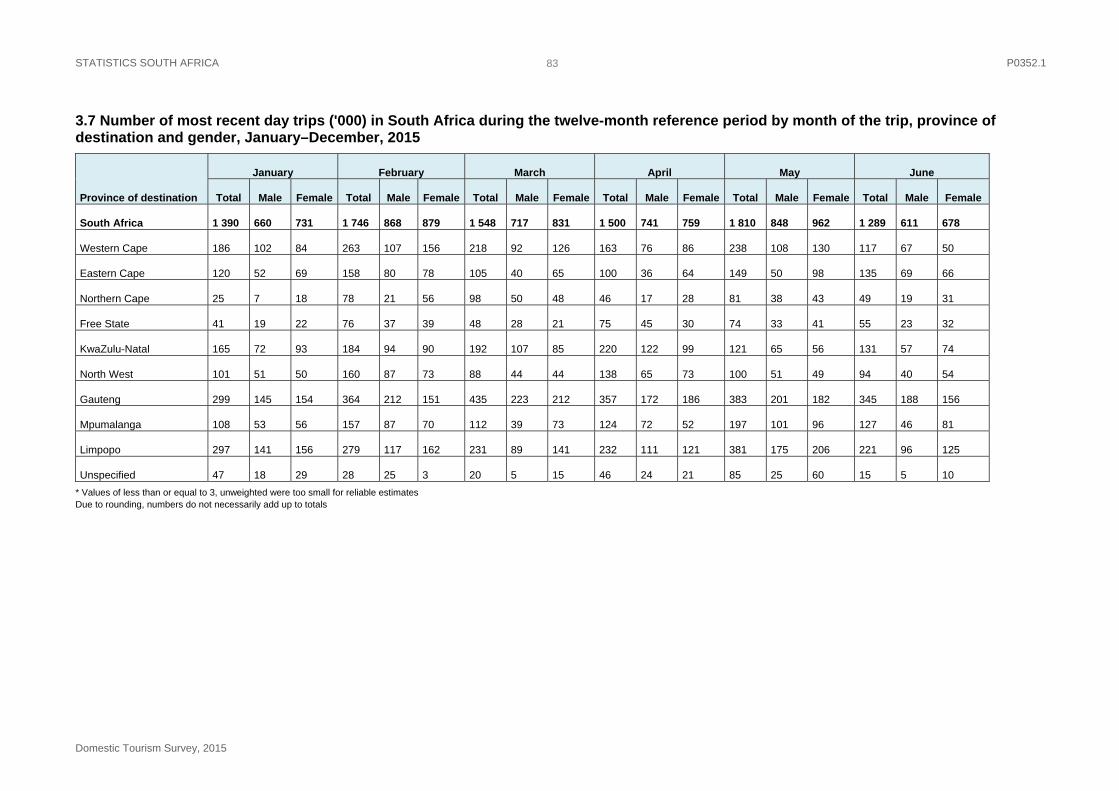
STATISTICS SOUTH AFRICA P0352.1
Domestic Tourism Survey, 2015
83
3.7 Number of most recent day trips ('000) in South Africa during the twelve-month reference period by month of the trip, province of destination and gender, January–December, 2015
Province of destination
January February March April May June
Total Male Female Total Male Female Total Male Female Total Male Female Total Male Female Total Male Female
South Africa 1 390 660 731 1 746 868 879 1 548 717 831 1 500 741 759 1 810 848 962 1 289 611 678
Western Cape 186 102 84 263 107 156 218 92 126 163 76 86 238 108 130 117 67 50
Eastern Cape 120 52 69 158 80 78 105 40 65 100 36 64 149 50 98 135 69 66
Northern Cape 25 7 18 78 21 56 98 50 48 46 17 28 81 38 43 49 19 31
Free State 41 19 22 76 37 39 48 28 21 75 45 30 74 33 41 55 23 32
KwaZulu-Natal 165 72 93 184 94 90 192 107 85 220 122 99 121 65 56 131 57 74
North West 101 51 50 160 87 73 88 44 44 138 65 73 100 51 49 94 40 54
Gauteng 299 145 154 364 212 151 435 223 212 357 172 186 383 201 182 345 188 156
Mpumalanga 108 53 56 157 87 70 112 39 73 124 72 52 197 101 96 127 46 81
Limpopo 297 141 156 279 117 162 231 89 141 232 111 121 381 175 206 221 96 125
Unspecified 47 18 29 28 25 3 20 5 15 46 24 21 85 25 60 15 5 10
* Values of less than or equal to 3, unweighted were too small for reliable estimates Due to rounding, numbers do not necessarily add up to totals
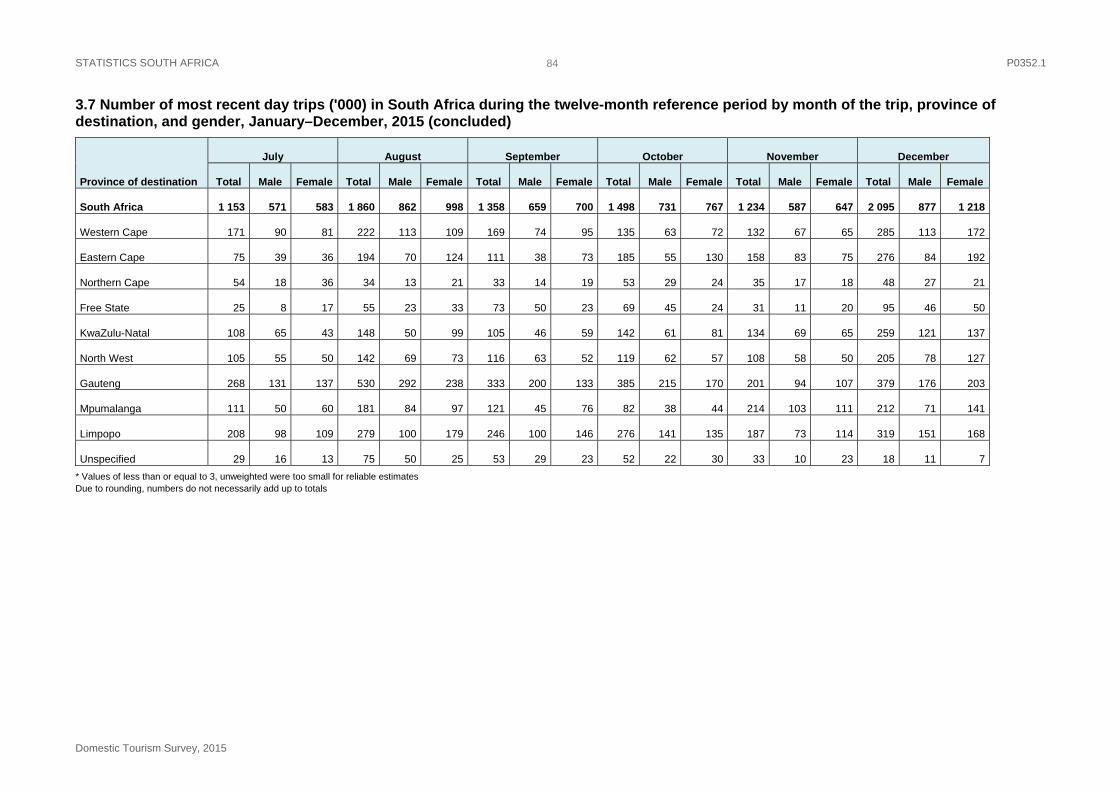
STATISTICS SOUTH AFRICA P0352.1
Domestic Tourism Survey, 2015
84
3.7 Number of most recent day trips ('000) in South Africa during the twelve-month reference period by month of the trip, province of destination, and gender, January–December, 2015 (concluded)
Province of destination
July August September October November December
Total Male Female Total Male Female Total Male Female Total Male Female Total Male Female Total Male Female
South Africa 1 153 571 583 1 860 862 998 1 358 659 700 1 498 731 767 1 234 587 647 2 095 877 1 218
Western Cape 171 90 81 222 113 109 169 74 95 135 63 72 132 67 65 285 113 172
Eastern Cape 75 39 36 194 70 124 111 38 73 185 55 130 158 83 75 276 84 192
Northern Cape 54 18 36 34 13 21 33 14 19 53 29 24 35 17 18 48 27 21
Free State 25 8 17 55 23 33 73 50 23 69 45 24 31 11 20 95 46 50
KwaZulu-Natal 108 65 43 148 50 99 105 46 59 142 61 81 134 69 65 259 121 137
North West 105 55 50 142 69 73 116 63 52 119 62 57 108 58 50 205 78 127
Gauteng 268 131 137 530 292 238 333 200 133 385 215 170 201 94 107 379 176 203
Mpumalanga 111 50 60 181 84 97 121 45 76 82 38 44 214 103 111 212 71 141
Limpopo 208 98 109 279 100 179 246 100 146 276 141 135 187 73 114 319 151 168
Unspecified 29 16 13 75 50 25 53 29 23 52 22 30 33 10 23 18 11 7
* Values of less than or equal to 3, unweighted were too small for reliable estimates Due to rounding, numbers do not necessarily add up to totals

STATISTICS SOUTH AFRICA P0352.1
Domestic Tourism Survey, 2015
85
3.8 Number of most recent overnight trips ('000) in South Africa during the twelve-month reference period by month of the trip, province of destination and gender, January–December, 2015
Province of destination
January February March April May June
Total Male Female Total Male Female Total Male Female Total Male Female Total Male Female Total Male Female
South Africa 3 070 1 407 1 663 1 980 941 1 039 1 766 828 938 2 690 1 254 1 436 1 933 1 001 932 2 286 1 109 1 177
Western Cape 422 191 231 217 98 120 156 73 83 261 116 145 212 115 97 108 53 55
Eastern Cape 559 251 308 262 137 124 225 99 125 371 152 219 277 144 133 392 181 212
Northern Cape 67 34 33 27 10 17 76 36 40 54 28 25 59 27 32 93 45 48
Free State 105 43 62 121 61 60 77 31 46 135 73 62 60 40 19 98 46 52
KwaZulu-Natal 508 210 298 232 119 113 240 128 112 472 222 250 262 140 122 348 193 155
North West 196 75 121 121 55 66 125 58 67 228 102 126 130 76 53 96 40 56
Gauteng 218 123 95 282 115 166 245 127 118 254 105 149 259 142 117 219 100 119
Mpumalanga 240 115 125 126 52 74 229 114 115 271 115 156 159 68 91 239 128 112
Limpopo 339 161 178 368 201 168 258 108 150 458 256 202 319 154 165 411 186 226
Unspecified 416 205 211 224 92 131 135 53 81 187 86 101 196 94 102 280 136 144
* Values of less than or equal to 3, unweighted were too small for reliable estimates Due to rounding, numbers do not necessarily add up to totals
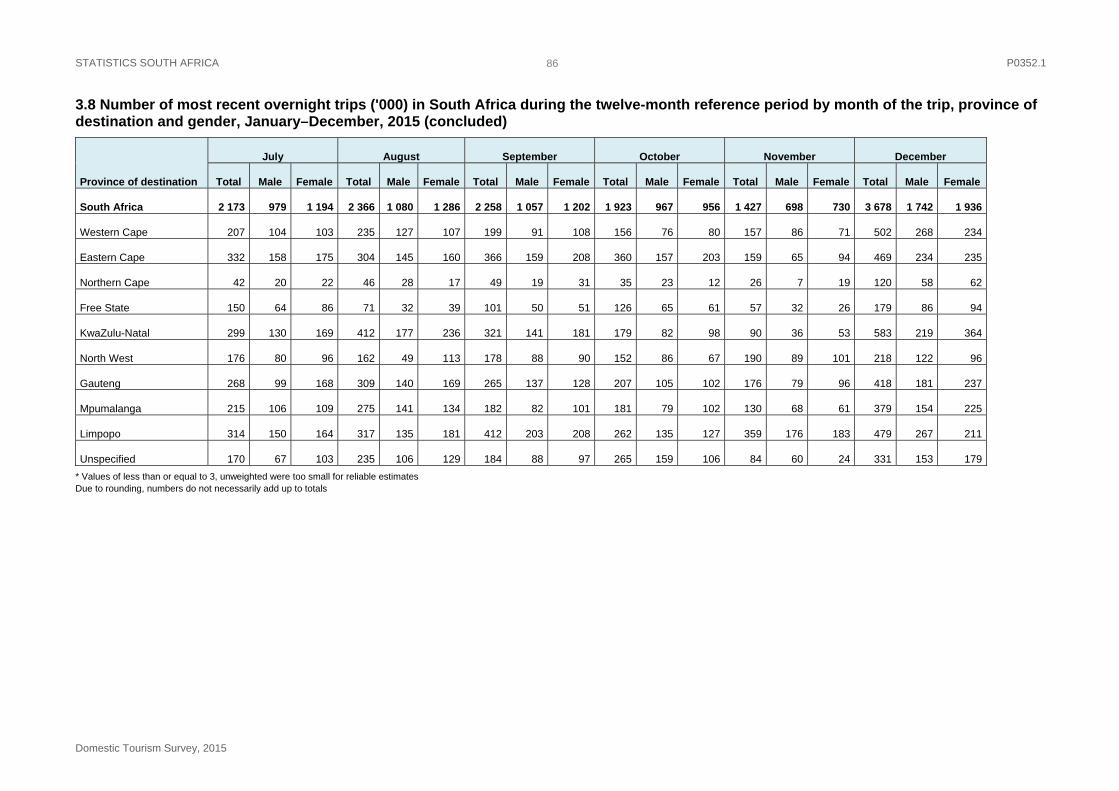
STATISTICS SOUTH AFRICA P0352.1
Domestic Tourism Survey, 2015
86
3.8 Number of most recent overnight trips ('000) in South Africa during the twelve-month reference period by month of the trip, province of destination and gender, January–December, 2015 (concluded)
Province of destination
July August September October November December
Total Male Female Total Male Female Total Male Female Total Male Female Total Male Female Total Male Female
South Africa 2 173 979 1 194 2 366 1 080 1 286 2 258 1 057 1 202 1 923 967 956 1 427 698 730 3 678 1 742 1 936
Western Cape 207 104 103 235 127 107 199 91 108 156 76 80 157 86 71 502 268 234
Eastern Cape 332 158 175 304 145 160 366 159 208 360 157 203 159 65 94 469 234 235
Northern Cape 42 20 22 46 28 17 49 19 31 35 23 12 26 7 19 120 58 62
Free State 150 64 86 71 32 39 101 50 51 126 65 61 57 32 26 179 86 94
KwaZulu-Natal 299 130 169 412 177 236 321 141 181 179 82 98 90 36 53 583 219 364
North West 176 80 96 162 49 113 178 88 90 152 86 67 190 89 101 218 122 96
Gauteng 268 99 168 309 140 169 265 137 128 207 105 102 176 79 96 418 181 237
Mpumalanga 215 106 109 275 141 134 182 82 101 181 79 102 130 68 61 379 154 225
Limpopo 314 150 164 317 135 181 412 203 208 262 135 127 359 176 183 479 267 211
Unspecified 170 67 103 235 106 129 184 88 97 265 159 106 84 60 24 331 153 179
* Values of less than or equal to 3, unweighted were too small for reliable estimates Due to rounding, numbers do not necessarily add up to totals
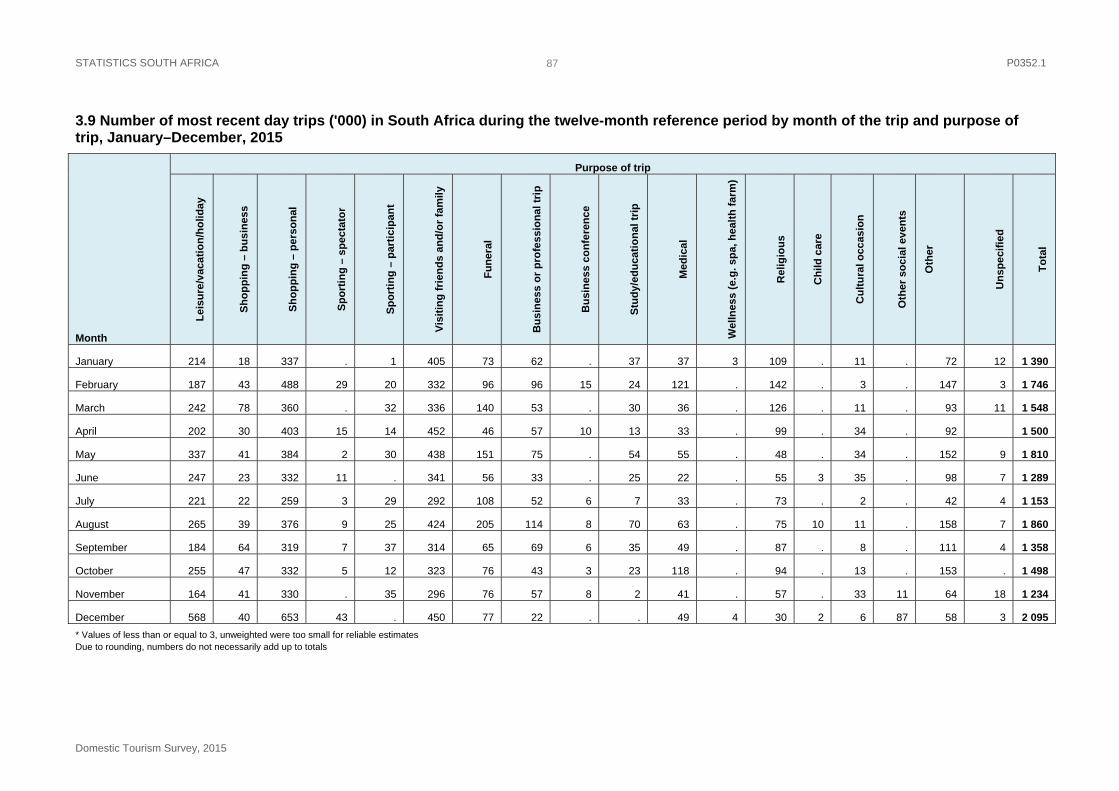
STATISTICS SOUTH AFRICA P0352.1
Domestic Tourism Survey, 2015
87
3.9 Number of most recent day trips ('000) in South Africa during the twelve-month reference period by month of the trip and purpose of trip, January–December, 2015
Month
Purpose of trip
Lei
sure
/vac
atio
n/h
oli
day
Sh
op
pin
g –
bu
sin
ess
Sh
op
pin
g –
per
son
al
Sp
ort
ing
– s
pec
tato
r
Sp
ort
ing
– p
arti
cip
ant
Vis
itin
g f
rien
ds
and
/or
fam
ily
Fu
ner
al
Bu
sin
ess
or
pro
fess
ion
al t
rip
Bu
sin
ess
con
fere
nce
Stu
dy/
edu
cati
on
al t
rip
Med
ical
Wel
lnes
s (e
.g. s
pa,
hea
lth
far
m)
Rel
igio
us
Ch
ild c
are
Cu
ltu
ral o
ccas
ion
Oth
er s
oci
al e
ven
ts
Oth
er
Un
spe
cifi
ed
To
tal
January 214 18 337 . 1 405 73 62 . 37 37 3 109 . 11 . 72 12 1 390
February 187 43 488 29 20 332 96 96 15 24 121 . 142 . 3 . 147 3 1 746
March 242 78 360 . 32 336 140 53 . 30 36 . 126 . 11 . 93 11 1 548
April 202 30 403 15 14 452 46 57 10 13 33 . 99 . 34 . 92 1 500
May 337 41 384 2 30 438 151 75 . 54 55 . 48 . 34 . 152 9 1 810
June 247 23 332 11 . 341 56 33 . 25 22 . 55 3 35 . 98 7 1 289
July 221 22 259 3 29 292 108 52 6 7 33 . 73 . 2 . 42 4 1 153
August 265 39 376 9 25 424 205 114 8 70 63 . 75 10 11 . 158 7 1 860
September 184 64 319 7 37 314 65 69 6 35 49 . 87 . 8 . 111 4 1 358
October 255 47 332 5 12 323 76 43 3 23 118 . 94 . 13 . 153 . 1 498
November 164 41 330 . 35 296 76 57 8 2 41 . 57 . 33 11 64 18 1 234
December 568 40 653 43 . 450 77 22 . . 49 4 30 2 6 87 58 3 2 095
* Values of less than or equal to 3, unweighted were too small for reliable estimates Due to rounding, numbers do not necessarily add up to totals
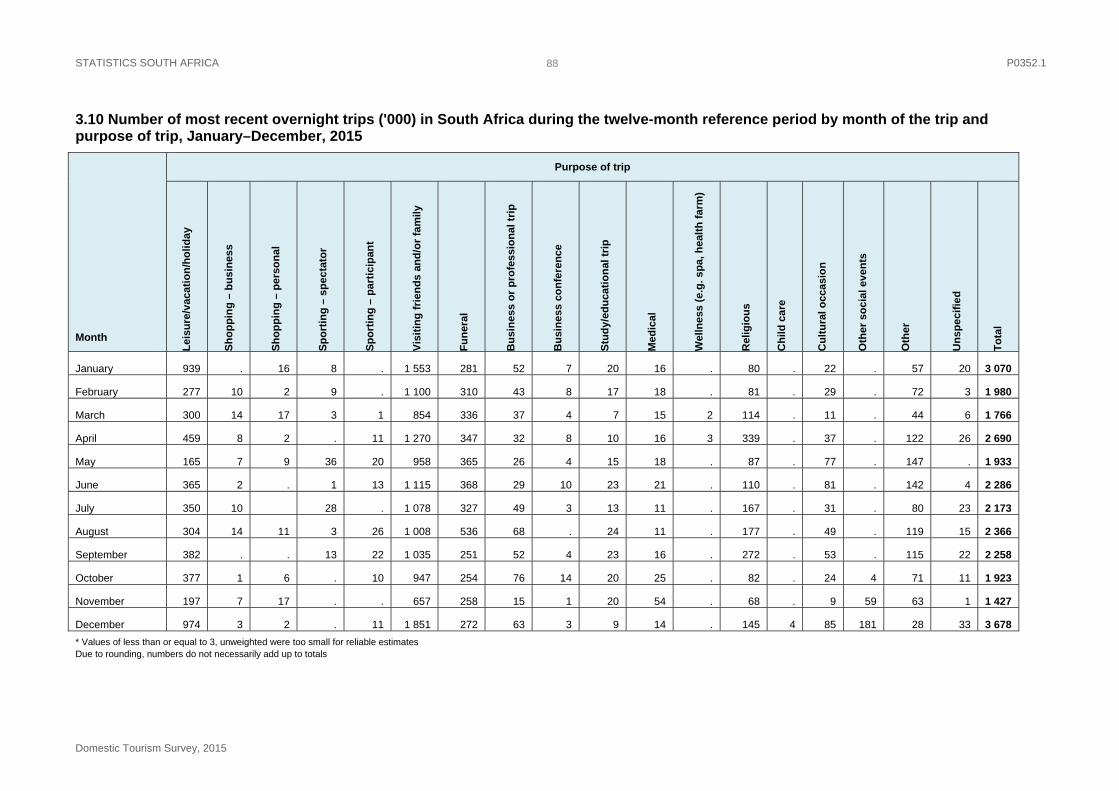
STATISTICS SOUTH AFRICA P0352.1
Domestic Tourism Survey, 2015
88
3.10 Number of most recent overnight trips ('000) in South Africa during the twelve-month reference period by month of the trip and purpose of trip, January–December, 2015
Month
Purpose of trip
Lei
sure
/vac
atio
n/h
oli
day
Sh
op
pin
g –
bu
sin
ess
Sh
op
pin
g –
per
son
al
Sp
ort
ing
– s
pec
tato
r
Sp
ort
ing
– p
arti
cip
ant
Vis
itin
g f
rien
ds
and
/or
fam
ily
Fu
ner
al
Bu
sin
ess
or
pro
fess
ion
al t
rip
Bu
sin
ess
con
fere
nce
Stu
dy/
edu
cati
on
al t
rip
Med
ical
Wel
lnes
s (e
.g. s
pa,
hea
lth
far
m)
Rel
igio
us
Ch
ild c
are
Cu
ltu
ral o
ccas
ion
Oth
er s
oci
al e
ven
ts
Oth
er
Un
spe
cifi
ed
To
tal
January 939 . 16 8 . 1 553 281 52 7 20 16 . 80 . 22 . 57 20 3 070
February 277 10 2 9 . 1 100 310 43 8 17 18 . 81 . 29 . 72 3 1 980
March 300 14 17 3 1 854 336 37 4 7 15 2 114 . 11 . 44 6 1 766
April 459 8 2 . 11 1 270 347 32 8 10 16 3 339 . 37 . 122 26 2 690
May 165 7 9 36 20 958 365 26 4 15 18 . 87 . 77 . 147 . 1 933
June 365 2 . 1 13 1 115 368 29 10 23 21 . 110 . 81 . 142 4 2 286
July 350 10 28 . 1 078 327 49 3 13 11 . 167 . 31 . 80 23 2 173
August 304 14 11 3 26 1 008 536 68 . 24 11 . 177 . 49 . 119 15 2 366
September 382 . . 13 22 1 035 251 52 4 23 16 . 272 . 53 . 115 22 2 258
October 377 1 6 . 10 947 254 76 14 20 25 . 82 . 24 4 71 11 1 923
November 197 7 17 . . 657 258 15 1 20 54 . 68 . 9 59 63 1 1 427
December 974 3 2 . 11 1 851 272 63 3 9 14 . 145 4 85 181 28 33 3 678
* Values of less than or equal to 3, unweighted were too small for reliable estimates Due to rounding, numbers do not necessarily add up to totals
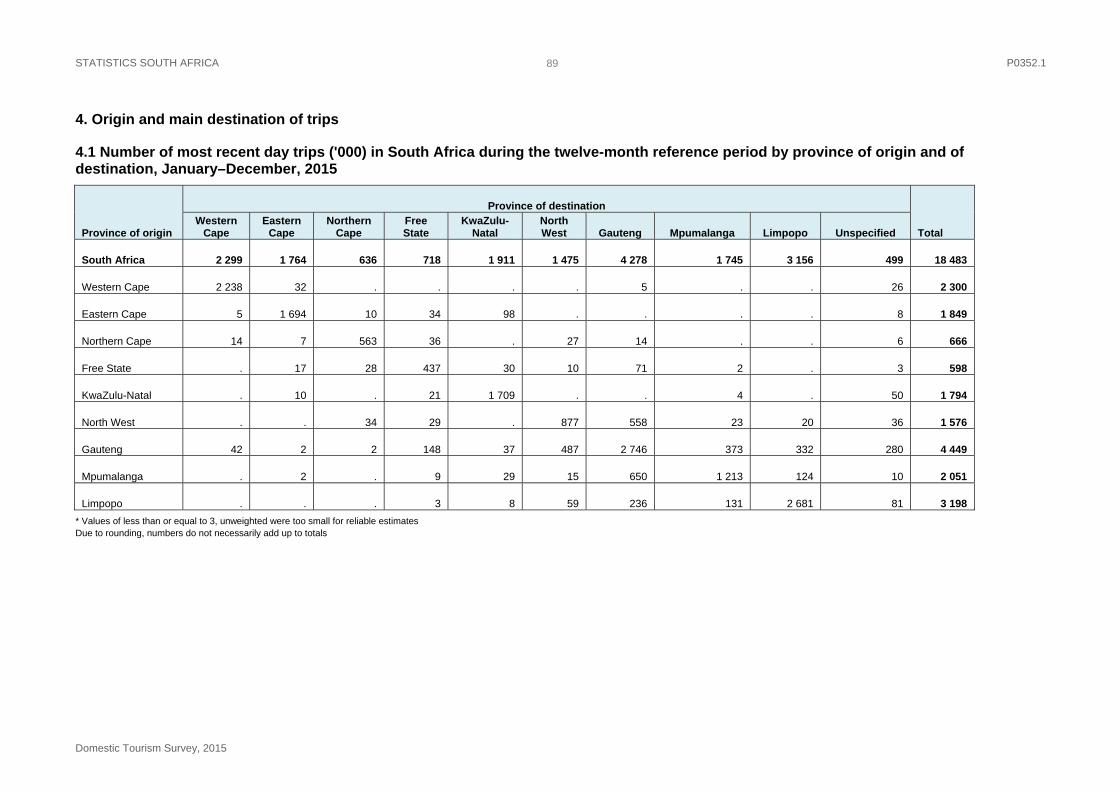
STATISTICS SOUTH AFRICA P0352.1
Domestic Tourism Survey, 2015
89
4. Origin and main destination of trips
4.1 Number of most recent day trips ('000) in South Africa during the twelve-month reference period by province of origin and of destination, January–December, 2015
Province of origin
Province of destination
Total Western
Cape Eastern
Cape Northern
Cape Free State
KwaZulu-Natal
North West Gauteng Mpumalanga Limpopo Unspecified
South Africa 2 299 1 764 636 718 1 911 1 475 4 278 1 745 3 156 499 18 483
Western Cape 2 238 32 . . . . 5 . . 26 2 300
Eastern Cape 5 1 694 10 34 98 . . . . 8 1 849
Northern Cape 14 7 563 36 . 27 14 . . 6 666
Free State . 17 28 437 30 10 71 2 . 3 598
KwaZulu-Natal . 10 . 21 1 709 . . 4 . 50 1 794
North West . . 34 29 . 877 558 23 20 36 1 576
Gauteng 42 2 2 148 37 487 2 746 373 332 280 4 449
Mpumalanga . 2 . 9 29 15 650 1 213 124 10 2 051
Limpopo . . . 3 8 59 236 131 2 681 81 3 198
* Values of less than or equal to 3, unweighted were too small for reliable estimates Due to rounding, numbers do not necessarily add up to totals
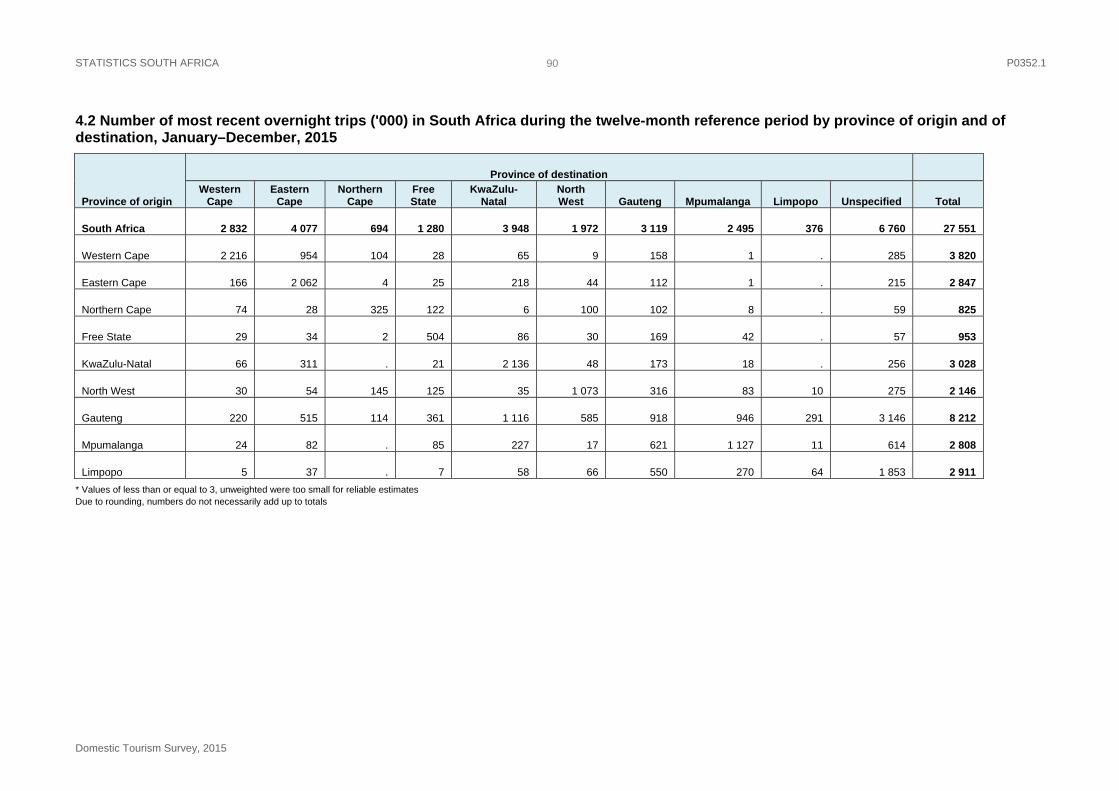
STATISTICS SOUTH AFRICA P0352.1
Domestic Tourism Survey, 2015
90
4.2 Number of most recent overnight trips ('000) in South Africa during the twelve-month reference period by province of origin and of destination, January–December, 2015
Province of origin
Province of destination
Western Cape
Eastern Cape
Northern Cape
Free State
KwaZulu-Natal
North West Gauteng Mpumalanga Limpopo Unspecified Total
South Africa 2 832 4 077 694 1 280 3 948 1 972 3 119 2 495 376 6 760 27 551
Western Cape 2 216 954 104 28 65 9 158 1 . 285 3 820
Eastern Cape 166 2 062 4 25 218 44 112 1 . 215 2 847
Northern Cape 74 28 325 122 6 100 102 8 . 59 825
Free State 29 34 2 504 86 30 169 42 . 57 953
KwaZulu-Natal 66 311 . 21 2 136 48 173 18 . 256 3 028
North West 30 54 145 125 35 1 073 316 83 10 275 2 146
Gauteng 220 515 114 361 1 116 585 918 946 291 3 146 8 212
Mpumalanga 24 82 . 85 227 17 621 1 127 11 614 2 808
Limpopo 5 37 . 7 58 66 550 270 64 1 853 2 911
* Values of less than or equal to 3, unweighted were too small for reliable estimates Due to rounding, numbers do not necessarily add up to totals
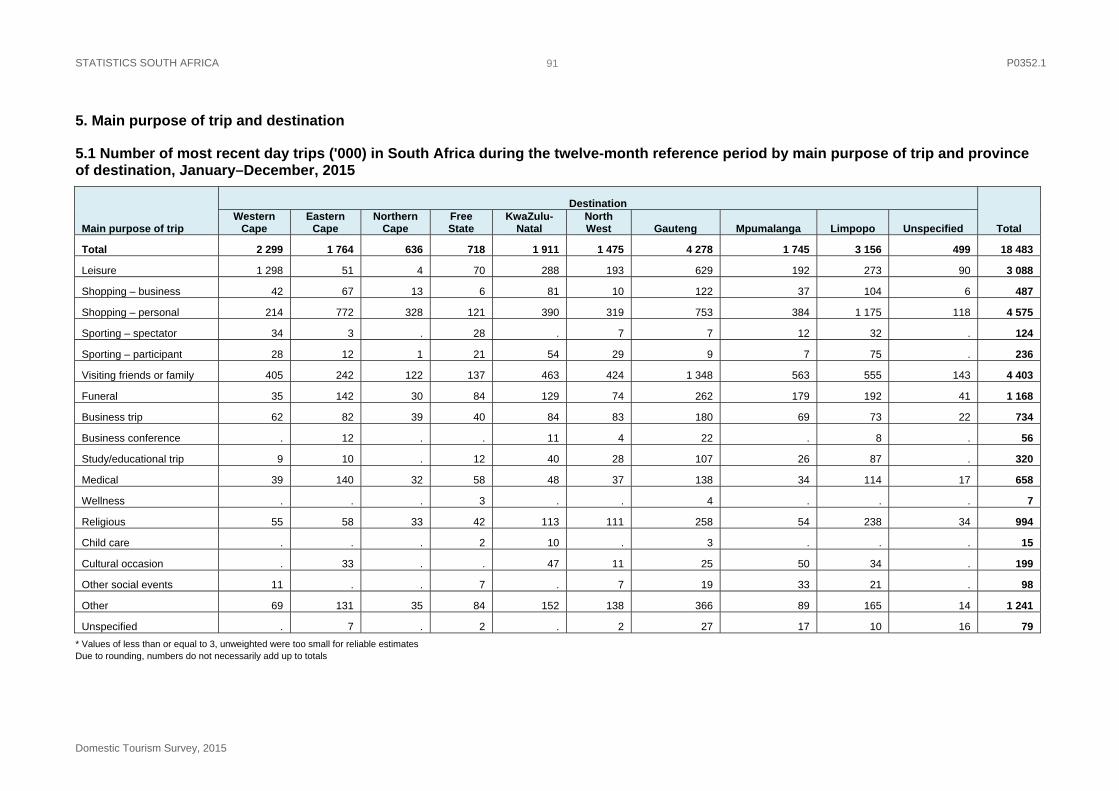
STATISTICS SOUTH AFRICA P0352.1
Domestic Tourism Survey, 2015
91
5. Main purpose of trip and destination
5.1 Number of most recent day trips ('000) in South Africa during the twelve-month reference period by main purpose of trip and province of destination, January–December, 2015
Main purpose of trip
Destination
Total Western
Cape Eastern
Cape Northern
Cape Free State
KwaZulu-Natal
North West Gauteng Mpumalanga Limpopo Unspecified
Total 2 299 1 764 636 718 1 911 1 475 4 278 1 745 3 156 499 18 483
Leisure 1 298 51 4 70 288 193 629 192 273 90 3 088
Shopping – business 42 67 13 6 81 10 122 37 104 6 487
Shopping – personal 214 772 328 121 390 319 753 384 1 175 118 4 575
Sporting – spectator 34 3 . 28 . 7 7 12 32 . 124
Sporting – participant 28 12 1 21 54 29 9 7 75 . 236
Visiting friends or family 405 242 122 137 463 424 1 348 563 555 143 4 403
Funeral 35 142 30 84 129 74 262 179 192 41 1 168
Business trip 62 82 39 40 84 83 180 69 73 22 734
Business conference . 12 . . 11 4 22 . 8 . 56
Study/educational trip 9 10 . 12 40 28 107 26 87 . 320
Medical 39 140 32 58 48 37 138 34 114 17 658
Wellness . . . 3 . . 4 . . . 7
Religious 55 58 33 42 113 111 258 54 238 34 994
Child care . . . 2 10 . 3 . . . 15
Cultural occasion . 33 . . 47 11 25 50 34 . 199
Other social events 11 . . 7 . 7 19 33 21 . 98
Other 69 131 35 84 152 138 366 89 165 14 1 241
Unspecified . 7 . 2 . 2 27 17 10 16 79
* Values of less than or equal to 3, unweighted were too small for reliable estimates Due to rounding, numbers do not necessarily add up to totals
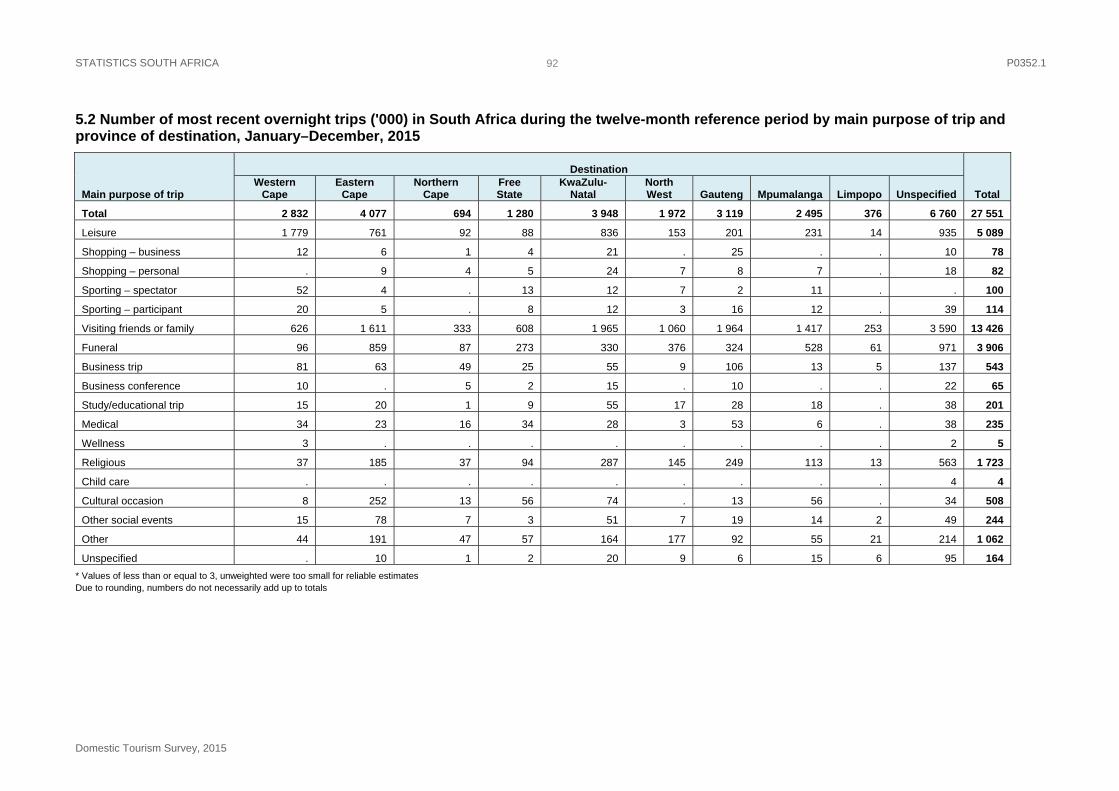
STATISTICS SOUTH AFRICA P0352.1
Domestic Tourism Survey, 2015
92
5.2 Number of most recent overnight trips ('000) in South Africa during the twelve-month reference period by main purpose of trip and province of destination, January–December, 2015
Main purpose of trip
Destination
Total Western
Cape Eastern
Cape Northern
Cape Free State
KwaZulu-Natal
North West Gauteng Mpumalanga Limpopo Unspecified
Total 2 832 4 077 694 1 280 3 948 1 972 3 119 2 495 376 6 760 27 551
Leisure 1 779 761 92 88 836 153 201 231 14 935 5 089
Shopping – business 12 6 1 4 21 . 25 . . 10 78
Shopping – personal . 9 4 5 24 7 8 7 . 18 82
Sporting – spectator 52 4 . 13 12 7 2 11 . . 100
Sporting – participant 20 5 . 8 12 3 16 12 . 39 114
Visiting friends or family 626 1 611 333 608 1 965 1 060 1 964 1 417 253 3 590 13 426
Funeral 96 859 87 273 330 376 324 528 61 971 3 906
Business trip 81 63 49 25 55 9 106 13 5 137 543
Business conference 10 . 5 2 15 . 10 . . 22 65
Study/educational trip 15 20 1 9 55 17 28 18 . 38 201
Medical 34 23 16 34 28 3 53 6 . 38 235
Wellness 3 . . . . . . . . 2 5
Religious 37 185 37 94 287 145 249 113 13 563 1 723
Child care . . . . . . . . . 4 4
Cultural occasion 8 252 13 56 74 . 13 56 . 34 508
Other social events 15 78 7 3 51 7 19 14 2 49 244
Other 44 191 47 57 164 177 92 55 21 214 1 062
Unspecified . 10 1 2 20 9 6 15 6 95 164
* Values of less than or equal to 3, unweighted were too small for reliable estimates Due to rounding, numbers do not necessarily add up to totals
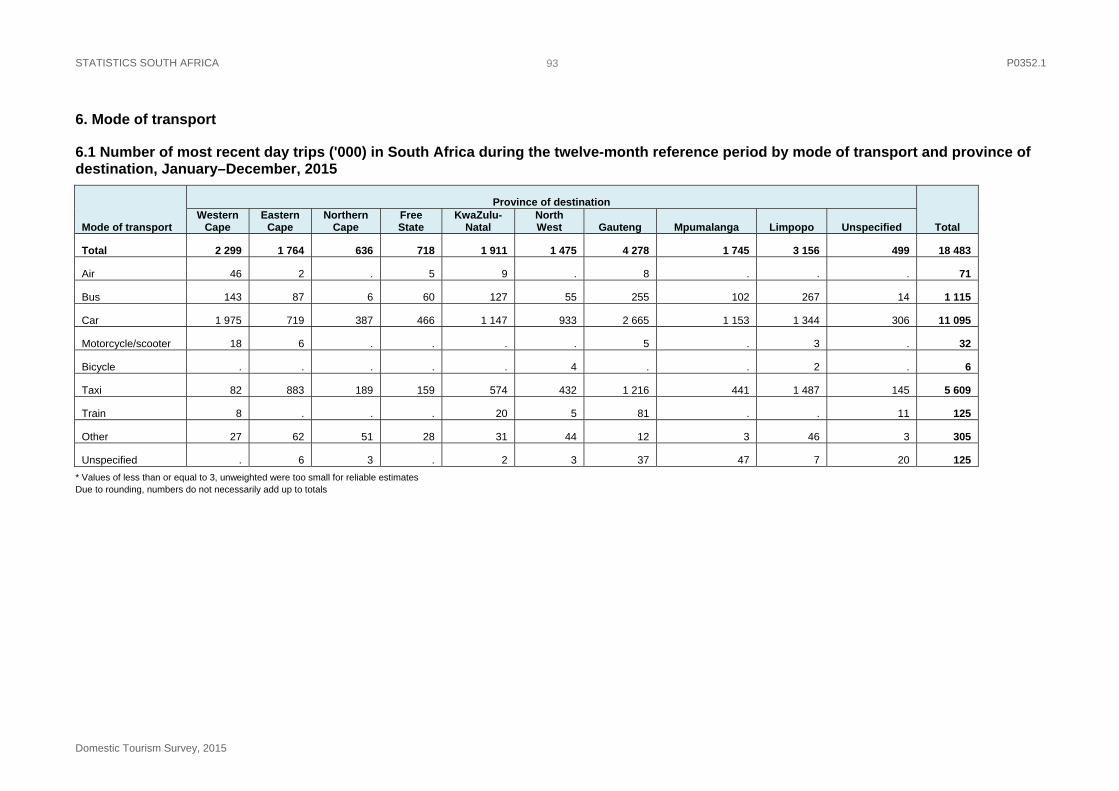
STATISTICS SOUTH AFRICA P0352.1
Domestic Tourism Survey, 2015
93
6. Mode of transport
6.1 Number of most recent day trips ('000) in South Africa during the twelve-month reference period by mode of transport and province of destination, January–December, 2015
Mode of transport
Province of destination
Total Western
Cape Eastern
Cape Northern
Cape Free State
KwaZulu-Natal
North West Gauteng Mpumalanga Limpopo Unspecified
Total 2 299 1 764 636 718 1 911 1 475 4 278 1 745 3 156 499 18 483
Air 46 2 . 5 9 . 8 . . . 71
Bus 143 87 6 60 127 55 255 102 267 14 1 115
Car 1 975 719 387 466 1 147 933 2 665 1 153 1 344 306 11 095
Motorcycle/scooter 18 6 . . . . 5 . 3 . 32
Bicycle . . . . . 4 . . 2 . 6
Taxi 82 883 189 159 574 432 1 216 441 1 487 145 5 609
Train 8 . . . 20 5 81 . . 11 125
Other 27 62 51 28 31 44 12 3 46 3 305
Unspecified . 6 3 . 2 3 37 47 7 20 125
* Values of less than or equal to 3, unweighted were too small for reliable estimates Due to rounding, numbers do not necessarily add up to totals
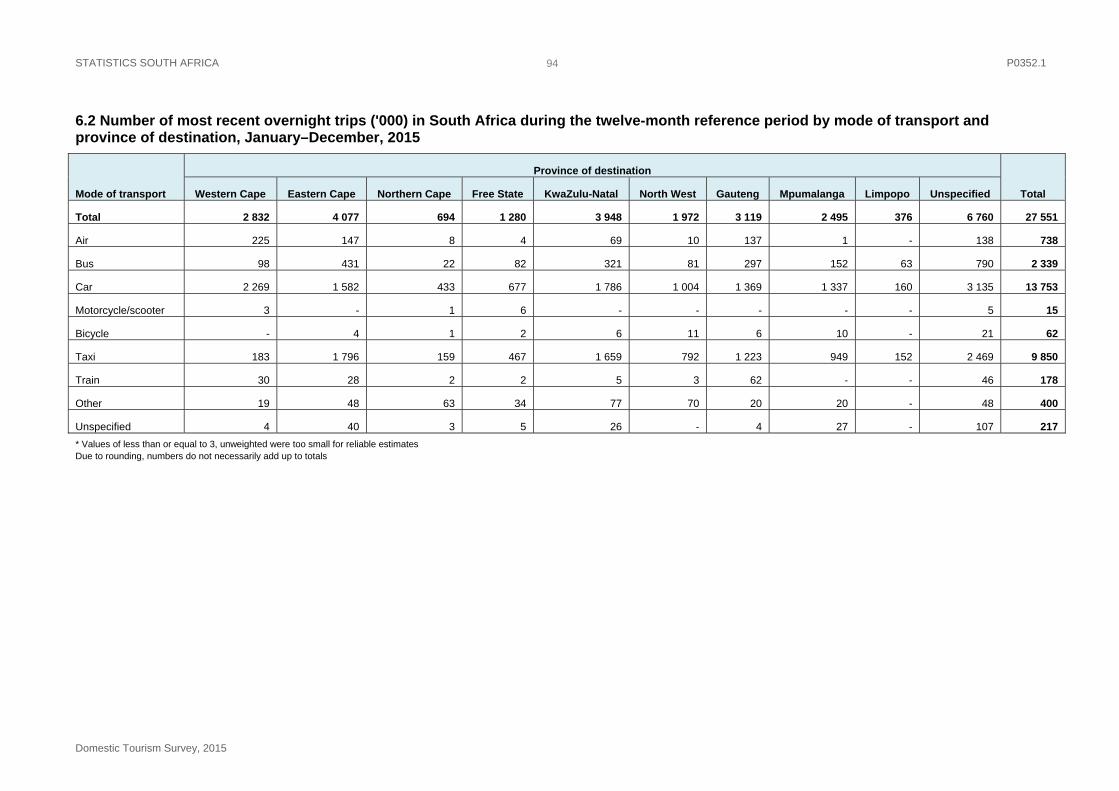
STATISTICS SOUTH AFRICA P0352.1
Domestic Tourism Survey, 2015
94
6.2 Number of most recent overnight trips ('000) in South Africa during the twelve-month reference period by mode of transport and province of destination, January–December, 2015
Mode of transport
Province of destination
Total Western Cape Eastern Cape Northern Cape Free State KwaZulu-Natal North West Gauteng Mpumalanga Limpopo Unspecified
Total 2 832 4 077 694 1 280 3 948 1 972 3 119 2 495 376 6 760 27 551
Air 225 147 8 4 69 10 137 1 - 138 738
Bus 98 431 22 82 321 81 297 152 63 790 2 339
Car 2 269 1 582 433 677 1 786 1 004 1 369 1 337 160 3 135 13 753
Motorcycle/scooter 3 - 1 6 - - - - - 5 15
Bicycle - 4 1 2 6 11 6 10 - 21 62
Taxi 183 1 796 159 467 1 659 792 1 223 949 152 2 469 9 850
Train 30 28 2 2 5 3 62 - - 46 178
Other 19 48 63 34 77 70 20 20 - 48 400
Unspecified 4 40 3 5 26 - 4 27 - 107 217
* Values of less than or equal to 3, unweighted were too small for reliable estimates Due to rounding, numbers do not necessarily add up to totals
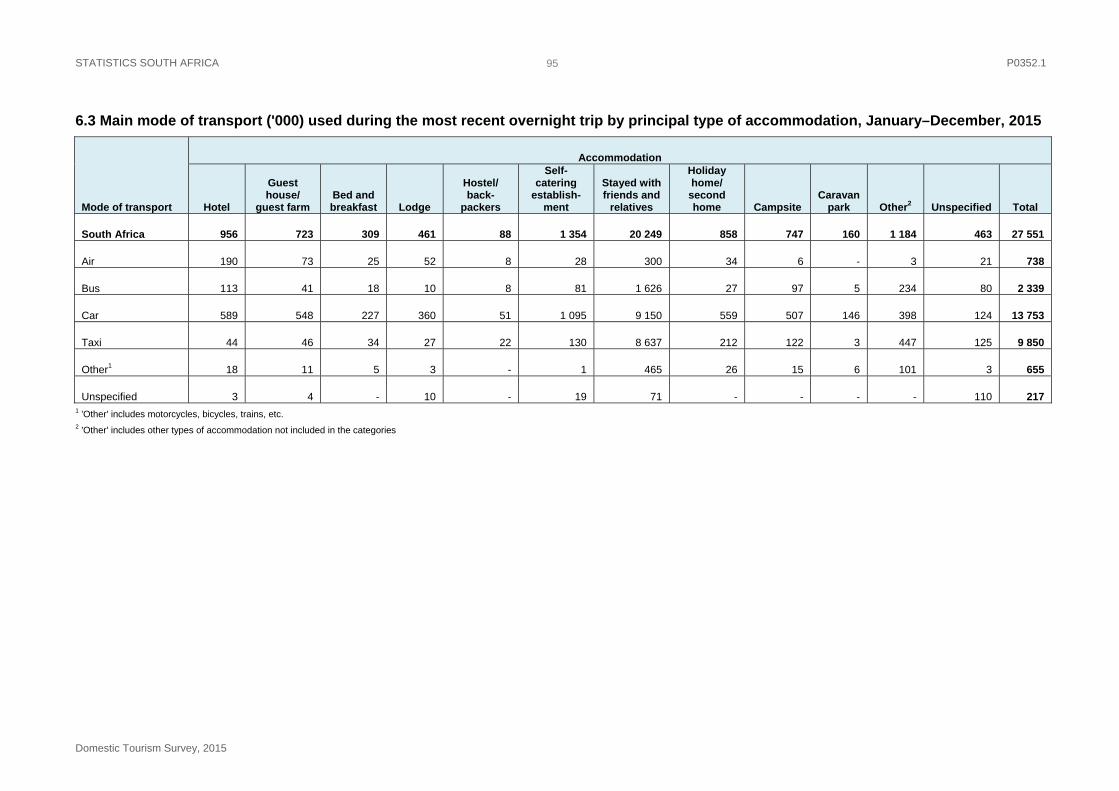
STATISTICS SOUTH AFRICA P0352.1
Domestic Tourism Survey, 2015
95
6.3 Main mode of transport ('000) used during the most recent overnight trip by principal type of accommodation, January–December, 2015
Mode of transport
Accommodation
Hotel
Guest house/
guest farm Bed and breakfast Lodge
Hostel/ back-
packers
Self-catering
establish-ment
Stayed with friends and
relatives
Holiday home/
second home Campsite
Caravan park Other2 Unspecified Total
South Africa 956 723 309 461 88 1 354 20 249 858 747 160 1 184 463 27 551
Air 190 73 25 52 8 28 300 34 6 - 3 21 738
Bus 113 41 18 10 8 81 1 626 27 97 5 234 80 2 339
Car 589 548 227 360 51 1 095 9 150 559 507 146 398 124 13 753
Taxi 44 46 34 27 22 130 8 637 212 122 3 447 125 9 850
Other1 18 11 5 3 - 1 465 26 15 6 101 3 655
Unspecified 3 4 - 10 - 19 71 - - - - 110 217 1 'Other' includes motorcycles, bicycles, trains, etc. 2 'Other' includes other types of accommodation not included in the categories

STATISTICS SOUTH AFRICA P0352.1
Domestic Tourism Survey, 2015
96
6.4 Main mode of transport ('000) by month of most recent trip, January–December, 2015
Mode of transport January February March April May June July August September October November December Total
Day trips
Air * * 16 * * 7 5 34 5 * 3 * 71
Bus 53 165 121 56 99 53 52 128 106 114 60 107 1 115
Car 847 1 065 832 950 1 150 734 738 1 124 735 876 821 1 223 11 095
Taxi 447 458 523 462 520 456 296 517 438 454 327 709 5 609
Other1 40 34 53 27 20 31 59 47 61 50 15 30 468
Unspecified 3 24 2 4 21 9 4 9 13 3 7 25 125
Total 1 390 1 746 1 548 1 500 1 810 1 289 1 153 1 860 1 358 1 498 1 234 2 095 18 483
Overnight trips
Air 21 34 30 66 47 80 78 76 69 107 26 105 738
Bus 288 167 78 316 150 150 129 212 284 138 93 335 2 339
Car 1 614 1 025 1 022 1 228 924 1 271 991 1 108 993 1 029 766 1 782 13 753
Taxi 1 071 714 580 1 005 741 730 894 909 856 559 486 1 302 9 850
Other1 53 28 40 35 51 48 69 49 28 80 51 124 655
Unspecified 23 13 15 39 21 7 13 13 29 9 6 29 217
Total 3 070 1 980 1 766 2 690 1 933 2 286 2 173 2 366 2 258 1 923 1 427 3 678 27 551 1 'Other' includes motorcycles, bicycles, trains, etc. *Values based on three or less unweighted cases are considered too small to provide accurate estimates, and values are therefore replaced with asterisks
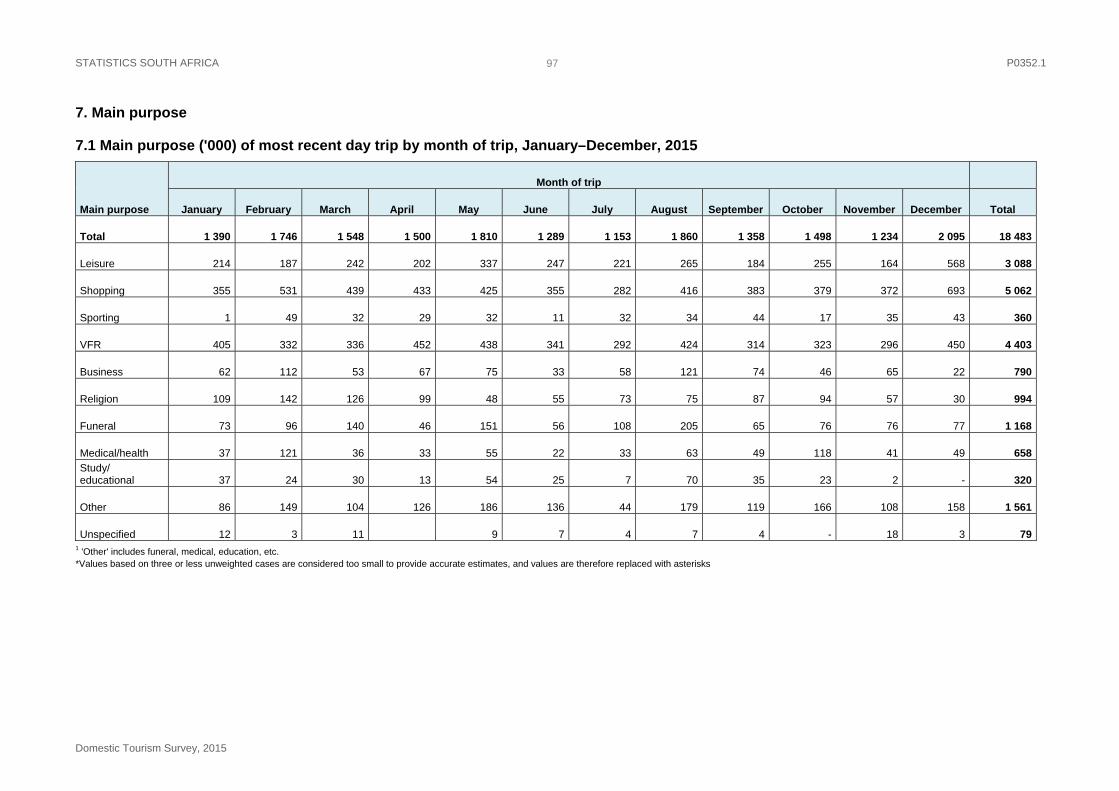
STATISTICS SOUTH AFRICA P0352.1
Domestic Tourism Survey, 2015
97
7. Main purpose
7.1 Main purpose ('000) of most recent day trip by month of trip, January–December, 2015
Main purpose
Month of trip
January February March April May June July August September October November December Total
Total 1 390 1 746 1 548 1 500 1 810 1 289 1 153 1 860 1 358 1 498 1 234 2 095 18 483
Leisure 214 187 242 202 337 247 221 265 184 255 164 568 3 088
Shopping 355 531 439 433 425 355 282 416 383 379 372 693 5 062
Sporting 1 49 32 29 32 11 32 34 44 17 35 43 360
VFR 405 332 336 452 438 341 292 424 314 323 296 450 4 403
Business 62 112 53 67 75 33 58 121 74 46 65 22 790
Religion 109 142 126 99 48 55 73 75 87 94 57 30 994
Funeral 73 96 140 46 151 56 108 205 65 76 76 77 1 168
Medical/health 37 121 36 33 55 22 33 63 49 118 41 49 658
Study/ educational 37 24 30 13 54 25 7 70 35 23 2 - 320
Other 86 149 104 126 186 136 44 179 119 166 108 158 1 561
Unspecified 12 3 11 9 7 4 7 4 - 18 3 79 1 'Other' includes funeral, medical, education, etc. *Values based on three or less unweighted cases are considered too small to provide accurate estimates, and values are therefore replaced with asterisks
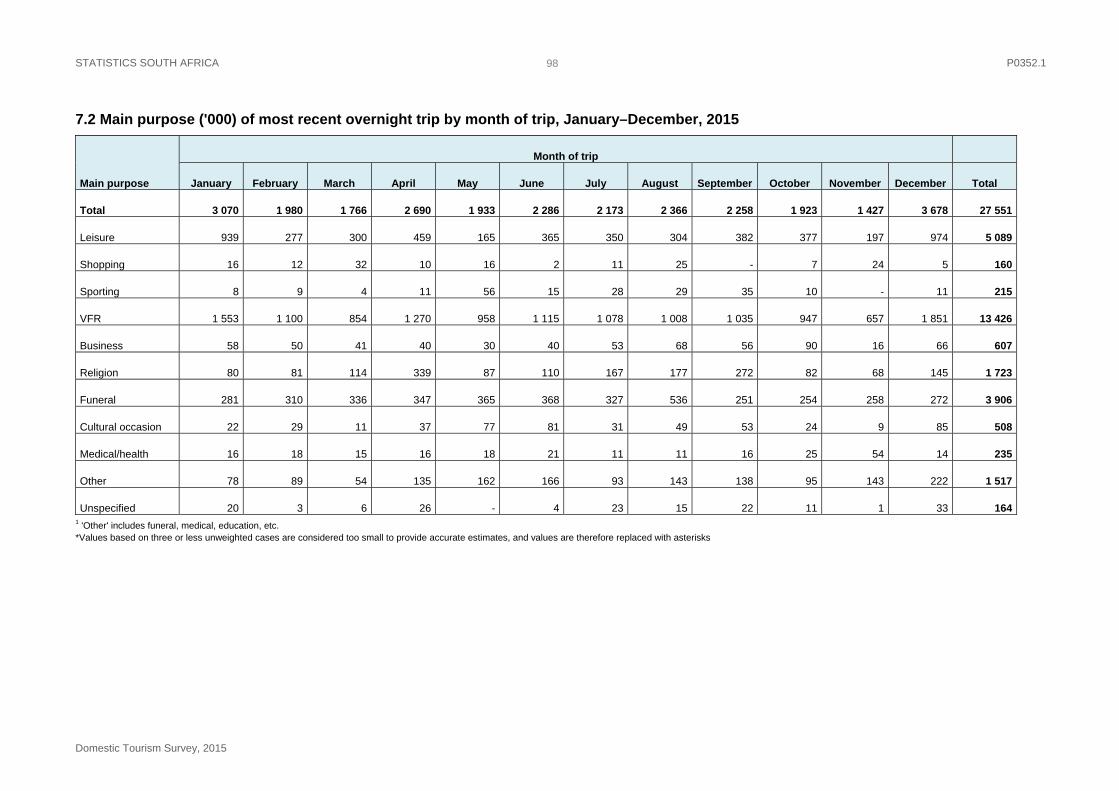
STATISTICS SOUTH AFRICA P0352.1
Domestic Tourism Survey, 2015
98
7.2 Main purpose ('000) of most recent overnight trip by month of trip, January–December, 2015
Main purpose
Month of trip
January February March April May June July August September October November December Total
Total 3 070 1 980 1 766 2 690 1 933 2 286 2 173 2 366 2 258 1 923 1 427 3 678 27 551
Leisure 939 277 300 459 165 365 350 304 382 377 197 974 5 089
Shopping 16 12 32 10 16 2 11 25 - 7 24 5 160
Sporting 8 9 4 11 56 15 28 29 35 10 - 11 215
VFR 1 553 1 100 854 1 270 958 1 115 1 078 1 008 1 035 947 657 1 851 13 426
Business 58 50 41 40 30 40 53 68 56 90 16 66 607
Religion 80 81 114 339 87 110 167 177 272 82 68 145 1 723
Funeral 281 310 336 347 365 368 327 536 251 254 258 272 3 906
Cultural occasion 22 29 11 37 77 81 31 49 53 24 9 85 508
Medical/health 16 18 15 16 18 21 11 11 16 25 54 14 235
Other 78 89 54 135 162 166 93 143 138 95 143 222 1 517
Unspecified 20 3 6 26 - 4 23 15 22 11 1 33 164 1 'Other' includes funeral, medical, education, etc. *Values based on three or less unweighted cases are considered too small to provide accurate estimates, and values are therefore replaced with asterisks

STATISTICS SOUTH AFRICA P0352.1
Domestic Tourism Survey, 2015
99
8. Population group
8.1 Population group ('000) by principal type of accommodation on the most recent overnight trips, January–December, 2015
Population group
Accommodation
Hotel
Guest house/
guest farm Bed and breakfast Lodge
Hostel/ back-
packers Self-catering
establishment
Stayed with
friends and
relatives
Holiday home/
second home Campsite
Caravan park Other Unspecified Total
Black African 488 252 150 222 45 308 16 794 527 264 12 1 024 399 20 486
Coloured 67 35 29 13 1 402 1 358 24 53 11 16 15 2 023
Indian/Asian 88 15 44 53 41 88 289 3 - 10 32 7 669
White 312 421 86 174 1 556 1 808 304 430 126 111 42 4 373
South Africa 956 723 309 461 88 1 354 20 249 858 747 160 1 184 463 27 551
*Values based on three or less unweighted cases are considered too small to provide accurate estimates, and values are therefore replaced with asterisks
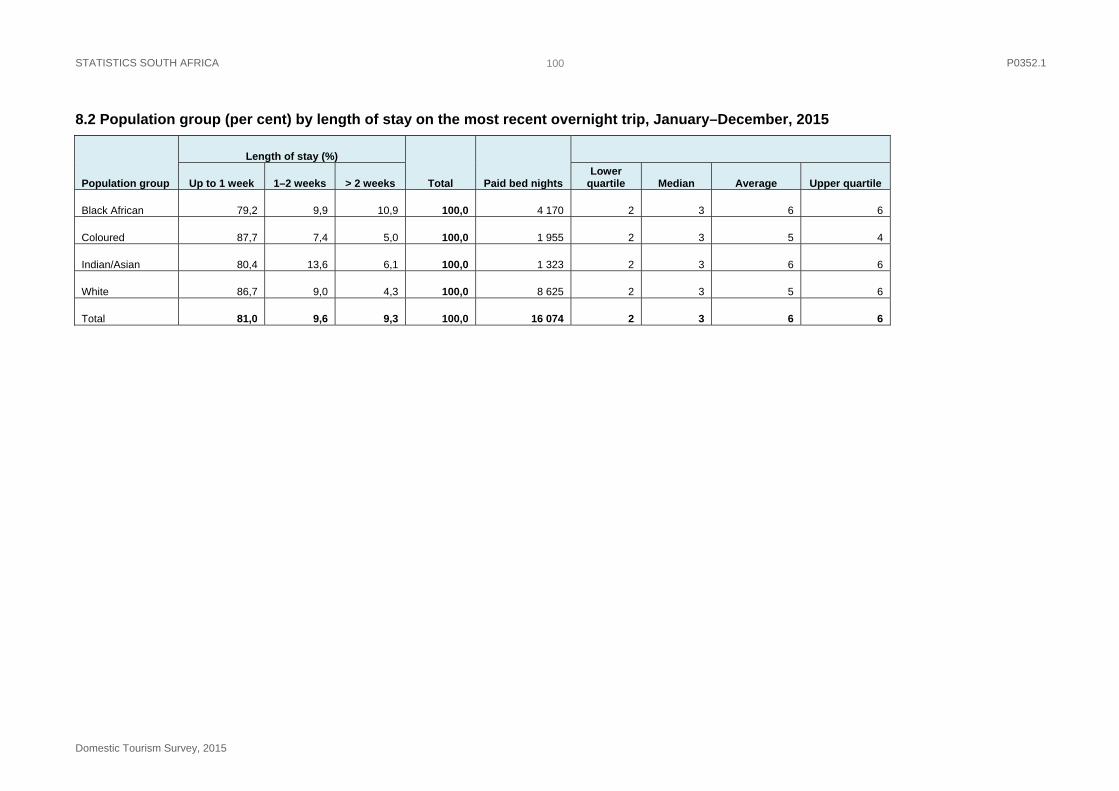
STATISTICS SOUTH AFRICA P0352.1
Domestic Tourism Survey, 2015
100
8.2 Population group (per cent) by length of stay on the most recent overnight trip, January–December, 2015
Population group
Length of stay (%)
Total Paid bed nights
Up to 1 week 1–2 weeks > 2 weeks Lower
quartile Median Average Upper quartile
Black African 79,2 9,9 10,9 100,0 4 170 2 3 6 6
Coloured 87,7 7,4 5,0 100,0 1 955 2 3 5 4
Indian/Asian 80,4 13,6 6,1 100,0 1 323 2 3 6 6
White 86,7 9,0 4,3 100,0 8 625 2 3 5 6
Total 81,0 9,6 9,3 100,0 16 074 2 3 6 6

STATISTICS SOUTH AFRICA P0352.1
Domestic Tourism Survey, 2015
101
8.3 Population group ('000) by month of the most recent trip, January–December, 2015
Population group January February March April May June July August September October November December Total
Day trips
Black African 228 308 383 342 329 293 291 370 238 261 171 302 3 516
Coloured 92 185 65 93 144 96 105 142 156 105 79 257 1 519
Indian/Asian 1 017 1 237 1 026 1 016 1 297 869 709 1 225 944 1 077 972 1 513 12 903
White 53 16 74 50 39 31 48 123 21 55 12 22 545
South Africa 1 390 1 746 1 548 1 500 1 810 1 289 1 153 1 860 1 358 1 498 1 234 2 095 18 483
Overnight trips
Black African 333 141 107 182 159 173 141 164 187 96 49 292 2 023
Coloured 1 990 1 445 1 313 2 094 1 543 1 643 1 612 1 808 1 769 1 349 1 130 2 791 20 486
Indian/Asian 544 378 292 351 224 443 363 286 245 473 205 569 4 373
White 203 17 53 63 7 28 58 107 58 6 43 26 669
South Africa 3 070 1 980 1 766 2 690 1 933 2 286 2 173 2 366 2 258 1 923 1 427 3 678 27 551
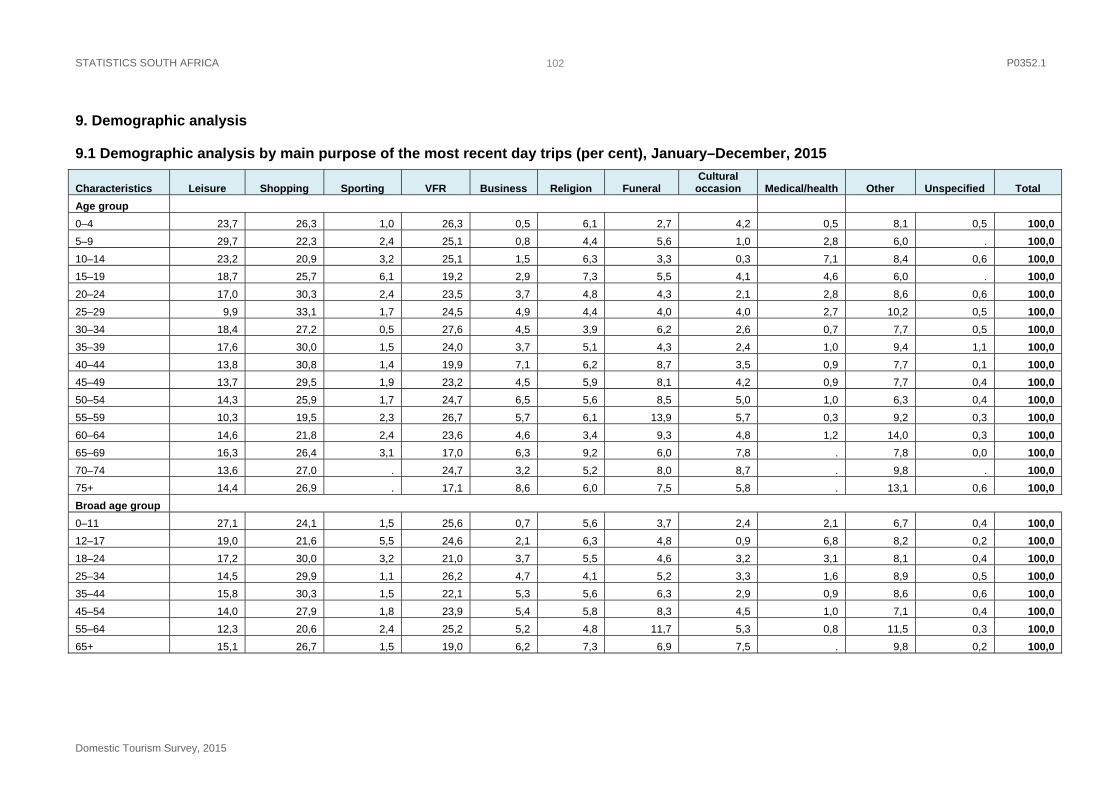
STATISTICS SOUTH AFRICA P0352.1
Domestic Tourism Survey, 2015
102
9. Demographic analysis
9.1 Demographic analysis by main purpose of the most recent day trips (per cent), January–December, 2015
Characteristics Leisure Shopping Sporting VFR Business Religion Funeral Cultural
occasion Medical/health Other Unspecified Total
Age group
0–4 23,7 26,3 1,0 26,3 0,5 6,1 2,7 4,2 0,5 8,1 0,5 100,0
5–9 29,7 22,3 2,4 25,1 0,8 4,4 5,6 1,0 2,8 6,0 . 100,0
10–14 23,2 20,9 3,2 25,1 1,5 6,3 3,3 0,3 7,1 8,4 0,6 100,0
15–19 18,7 25,7 6,1 19,2 2,9 7,3 5,5 4,1 4,6 6,0 . 100,0
20–24 17,0 30,3 2,4 23,5 3,7 4,8 4,3 2,1 2,8 8,6 0,6 100,0
25–29 9,9 33,1 1,7 24,5 4,9 4,4 4,0 4,0 2,7 10,2 0,5 100,0
30–34 18,4 27,2 0,5 27,6 4,5 3,9 6,2 2,6 0,7 7,7 0,5 100,0
35–39 17,6 30,0 1,5 24,0 3,7 5,1 4,3 2,4 1,0 9,4 1,1 100,0
40–44 13,8 30,8 1,4 19,9 7,1 6,2 8,7 3,5 0,9 7,7 0,1 100,0
45–49 13,7 29,5 1,9 23,2 4,5 5,9 8,1 4,2 0,9 7,7 0,4 100,0
50–54 14,3 25,9 1,7 24,7 6,5 5,6 8,5 5,0 1,0 6,3 0,4 100,0
55–59 10,3 19,5 2,3 26,7 5,7 6,1 13,9 5,7 0,3 9,2 0,3 100,0
60–64 14,6 21,8 2,4 23,6 4,6 3,4 9,3 4,8 1,2 14,0 0,3 100,0
65–69 16,3 26,4 3,1 17,0 6,3 9,2 6,0 7,8 . 7,8 0,0 100,0
70–74 13,6 27,0 . 24,7 3,2 5,2 8,0 8,7 . 9,8 . 100,0
75+ 14,4 26,9 . 17,1 8,6 6,0 7,5 5,8 . 13,1 0,6 100,0
Broad age group
0–11 27,1 24,1 1,5 25,6 0,7 5,6 3,7 2,4 2,1 6,7 0,4 100,0
12–17 19,0 21,6 5,5 24,6 2,1 6,3 4,8 0,9 6,8 8,2 0,2 100,0
18–24 17,2 30,0 3,2 21,0 3,7 5,5 4,6 3,2 3,1 8,1 0,4 100,0
25–34 14,5 29,9 1,1 26,2 4,7 4,1 5,2 3,3 1,6 8,9 0,5 100,0
35–44 15,8 30,3 1,5 22,1 5,3 5,6 6,3 2,9 0,9 8,6 0,6 100,0
45–54 14,0 27,9 1,8 23,9 5,4 5,8 8,3 4,5 1,0 7,1 0,4 100,0
55–64 12,3 20,6 2,4 25,2 5,2 4,8 11,7 5,3 0,8 11,5 0,3 100,0
65+ 15,1 26,7 1,5 19,0 6,2 7,3 6,9 7,5 . 9,8 0,2 100,0
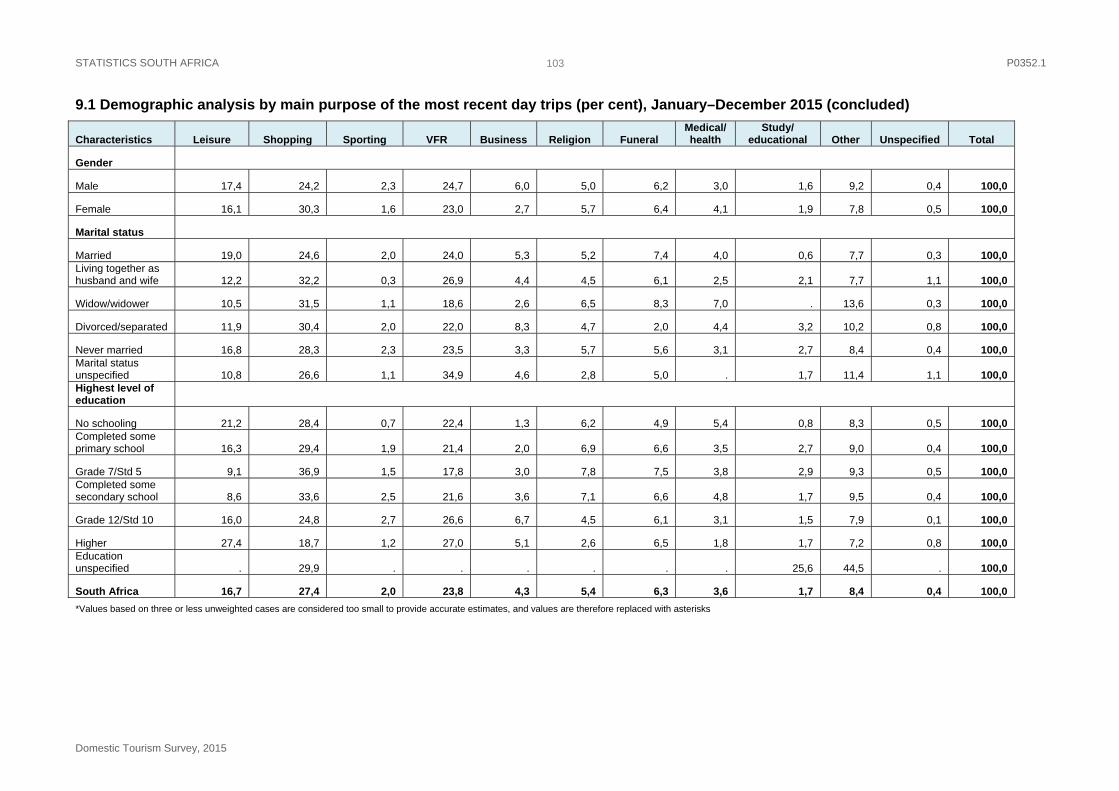
STATISTICS SOUTH AFRICA P0352.1
Domestic Tourism Survey, 2015
103
9.1 Demographic analysis by main purpose of the most recent day trips (per cent), January–December 2015 (concluded)
Characteristics Leisure Shopping Sporting VFR Business Religion Funeral Medical/ health
Study/ educational Other Unspecified Total
Gender
Male 17,4 24,2 2,3 24,7 6,0 5,0 6,2 3,0 1,6 9,2 0,4 100,0
Female 16,1 30,3 1,6 23,0 2,7 5,7 6,4 4,1 1,9 7,8 0,5 100,0
Marital status
Married 19,0 24,6 2,0 24,0 5,3 5,2 7,4 4,0 0,6 7,7 0,3 100,0 Living together as husband and wife 12,2 32,2 0,3 26,9 4,4 4,5 6,1 2,5 2,1 7,7 1,1 100,0
Widow/widower 10,5 31,5 1,1 18,6 2,6 6,5 8,3 7,0 . 13,6 0,3 100,0
Divorced/separated 11,9 30,4 2,0 22,0 8,3 4,7 2,0 4,4 3,2 10,2 0,8 100,0
Never married 16,8 28,3 2,3 23,5 3,3 5,7 5,6 3,1 2,7 8,4 0,4 100,0 Marital status unspecified 10,8 26,6 1,1 34,9 4,6 2,8 5,0 . 1,7 11,4 1,1 100,0 Highest level of education
No schooling 21,2 28,4 0,7 22,4 1,3 6,2 4,9 5,4 0,8 8,3 0,5 100,0 Completed some primary school 16,3 29,4 1,9 21,4 2,0 6,9 6,6 3,5 2,7 9,0 0,4 100,0
Grade 7/Std 5 9,1 36,9 1,5 17,8 3,0 7,8 7,5 3,8 2,9 9,3 0,5 100,0 Completed some secondary school 8,6 33,6 2,5 21,6 3,6 7,1 6,6 4,8 1,7 9,5 0,4 100,0
Grade 12/Std 10 16,0 24,8 2,7 26,6 6,7 4,5 6,1 3,1 1,5 7,9 0,1 100,0
Higher 27,4 18,7 1,2 27,0 5,1 2,6 6,5 1,8 1,7 7,2 0,8 100,0 Education unspecified . 29,9 . . . . . . 25,6 44,5 . 100,0
South Africa 16,7 27,4 2,0 23,8 4,3 5,4 6,3 3,6 1,7 8,4 0,4 100,0
*Values based on three or less unweighted cases are considered too small to provide accurate estimates, and values are therefore replaced with asterisks

STATISTICS SOUTH AFRICA P0352.1
Domestic Tourism Survey, 2015
104
9.2 Demographic analysis by main purpose of the most recent overnight trips (per cent), January–December, 2015
Characteristics Leisure Shopping Sporting VFR Business Religion Funeral Cultural
occasion Medical/ health Other Unspecified Total
Age group
0–4 16,8 0,5 0,1 59,1 0,3 5,1 11,2 1,7 0,2 4,2 0,8 100,0
5–9 24,6 0,6 0,8 50,2 1,0 5,3 9,8 2,1 0,2 4,4 1,0 100,0
10–14 24,9 0,4 1,4 44,7 0,7 7,0 9,9 1,7 0,3 7,7 1,2 100,0
15–19 21,2 0,4 1,9 46,1 0,6 9,1 9,9 1,2 0,8 7,9 0,8 100,0
20–24 11,6 0,2 0,6 59,2 1,5 5,5 11,3 2,0 0,7 6,8 0,5 100,0
25–29 12,5 0,5 0,3 59,3 2,1 4,4 12,5 1,8 0,6 5,3 0,7 100,0
30–34 14,9 0,8 0,1 58,7 3,3 5,0 10,4 1,6 0,2 4,6 0,3 100,0
35–39 19,5 0,7 1,4 49,5 4,2 4,4 13,3 1,4 0,2 5,0 0,4 100,0
40–44 20,1 0,8 0,9 43,4 3,6 6,9 16,9 1,6 0,6 4,5 0,6 100,0
45–49 20,5 0,5 1,4 40,4 2,3 7,0 18,4 1,9 1,4 5,6 0,5 100,0
50–54 19,5 0,7 0,4 40,3 2,0 6,8 21,6 2,5 1,4 4,7 0,0 100,0
55–59 23,5 0,7 0,7 34,5 1,4 8,4 19,1 3,9 1,2 6,2 0,3 100,0
60–64 15,6 0,9 . 33,8 5,2 9,6 25,6 1,9 2,2 4,5 0,7 100,0
65–69 25,7 1,0 0,9 36,5 4,0 9,2 12,6 1,1 2,8 5,9 0,4 100,0
70–74 20,9 . 2,2 21,3 . 8,4 25,3 3,0 8,6 9,7 0,6 100,0
75+ 20,7 . . 36,7 . 7,4 23,9 0,7 2,5 7,4 0,6 100,0 Broad age group
0–11 21,2 0,5 0,6 54,2 0,6 5,6 10,1 1,7 0,2 4,2 1,0 100,0
12–17 23,2 0,7 2,3 42,3 0,9 7,7 10,6 1,8 0,4 9,0 0,9 100,0
18–24 13,5 0,2 0,5 57,0 1,2 6,5 11,0 1,8 0,8 7,1 0,6 100,0
25–34 13,7 0,7 0,2 59,0 2,7 4,7 11,4 1,7 0,4 4,9 0,5 100,0
35–44 19,8 0,8 1,2 46,6 3,9 5,6 15,0 1,5 0,4 4,7 0,5 100,0
45–54 20,1 0,6 0,9 40,4 2,2 6,9 19,9 2,2 1,4 5,2 0,3 100,0
55–64 20,0 0,8 0,4 34,2 3,1 9,0 22,0 3,0 1,6 5,4 0,5 100,0
65+ 22,9 0,4 1,0 32,2 1,7 8,4 19,5 1,6 4,4 7,4 0,5 100,0
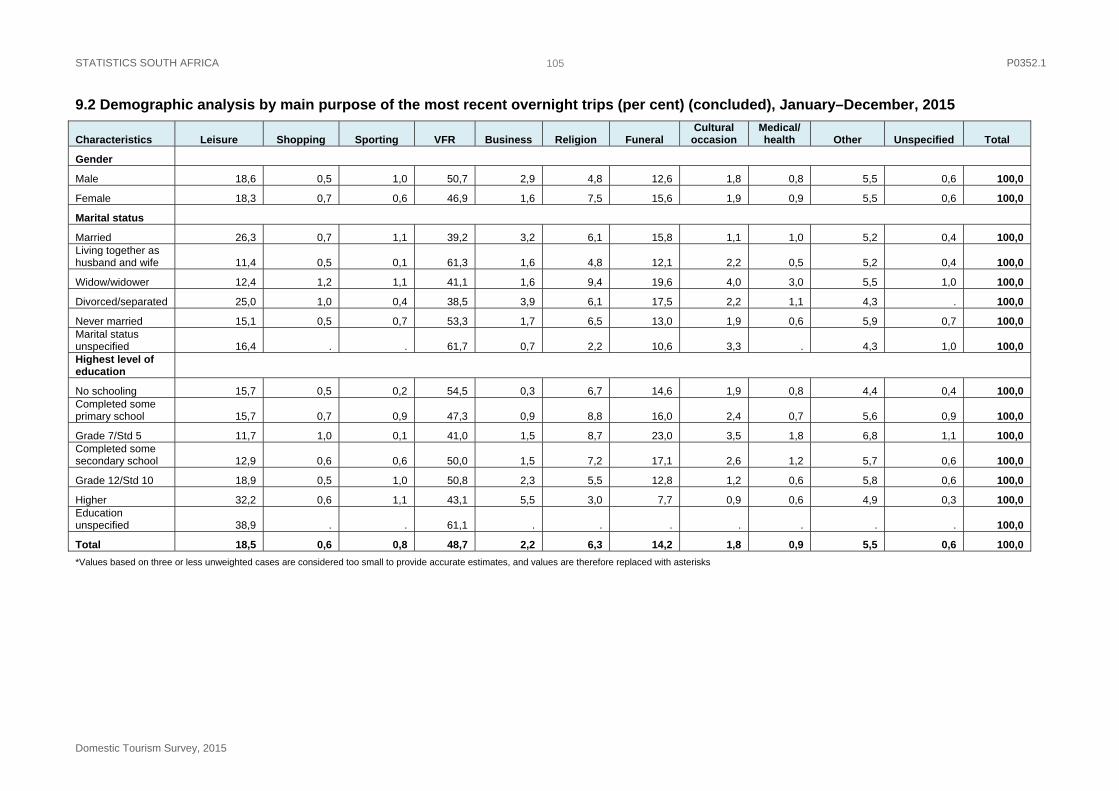
STATISTICS SOUTH AFRICA P0352.1
Domestic Tourism Survey, 2015
105
9.2 Demographic analysis by main purpose of the most recent overnight trips (per cent) (concluded), January–December, 2015
Characteristics Leisure Shopping Sporting VFR Business Religion Funeral Cultural
occasion Medical/ health Other Unspecified Total
Gender
Male 18,6 0,5 1,0 50,7 2,9 4,8 12,6 1,8 0,8 5,5 0,6 100,0
Female 18,3 0,7 0,6 46,9 1,6 7,5 15,6 1,9 0,9 5,5 0,6 100,0
Marital status
Married 26,3 0,7 1,1 39,2 3,2 6,1 15,8 1,1 1,0 5,2 0,4 100,0 Living together as husband and wife 11,4 0,5 0,1 61,3 1,6 4,8 12,1 2,2 0,5 5,2 0,4 100,0
Widow/widower 12,4 1,2 1,1 41,1 1,6 9,4 19,6 4,0 3,0 5,5 1,0 100,0
Divorced/separated 25,0 1,0 0,4 38,5 3,9 6,1 17,5 2,2 1,1 4,3 . 100,0
Never married 15,1 0,5 0,7 53,3 1,7 6,5 13,0 1,9 0,6 5,9 0,7 100,0 Marital status unspecified 16,4 . . 61,7 0,7 2,2 10,6 3,3 . 4,3 1,0 100,0 Highest level of education
No schooling 15,7 0,5 0,2 54,5 0,3 6,7 14,6 1,9 0,8 4,4 0,4 100,0 Completed some primary school 15,7 0,7 0,9 47,3 0,9 8,8 16,0 2,4 0,7 5,6 0,9 100,0
Grade 7/Std 5 11,7 1,0 0,1 41,0 1,5 8,7 23,0 3,5 1,8 6,8 1,1 100,0 Completed some secondary school 12,9 0,6 0,6 50,0 1,5 7,2 17,1 2,6 1,2 5,7 0,6 100,0
Grade 12/Std 10 18,9 0,5 1,0 50,8 2,3 5,5 12,8 1,2 0,6 5,8 0,6 100,0
Higher 32,2 0,6 1,1 43,1 5,5 3,0 7,7 0,9 0,6 4,9 0,3 100,0 Education unspecified 38,9 . . 61,1 . . . . . . . 100,0
Total 18,5 0,6 0,8 48,7 2,2 6,3 14,2 1,8 0,9 5,5 0,6 100,0
*Values based on three or less unweighted cases are considered too small to provide accurate estimates, and values are therefore replaced with asterisks
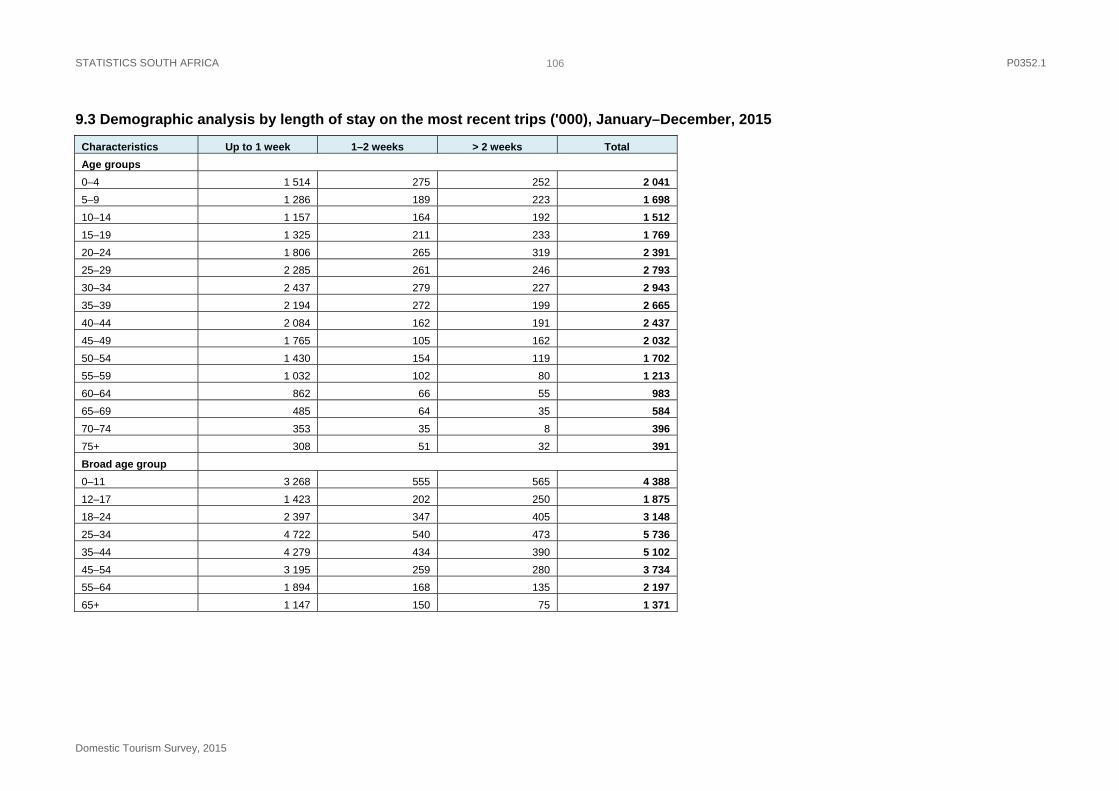
STATISTICS SOUTH AFRICA P0352.1
Domestic Tourism Survey, 2015
106
9.3 Demographic analysis by length of stay on the most recent trips ('000), January–December, 2015
Characteristics Up to 1 week 1–2 weeks > 2 weeks Total
Age groups
0–4 1 514 275 252 2 041
5–9 1 286 189 223 1 698
10–14 1 157 164 192 1 512
15–19 1 325 211 233 1 769
20–24 1 806 265 319 2 391
25–29 2 285 261 246 2 793
30–34 2 437 279 227 2 943
35–39 2 194 272 199 2 665
40–44 2 084 162 191 2 437
45–49 1 765 105 162 2 032
50–54 1 430 154 119 1 702
55–59 1 032 102 80 1 213
60–64 862 66 55 983
65–69 485 64 35 584
70–74 353 35 8 396
75+ 308 51 32 391
Broad age group
0–11 3 268 555 565 4 388
12–17 1 423 202 250 1 875
18–24 2 397 347 405 3 148
25–34 4 722 540 473 5 736
35–44 4 279 434 390 5 102
45–54 3 195 259 280 3 734
55–64 1 894 168 135 2 197
65+ 1 147 150 75 1 371
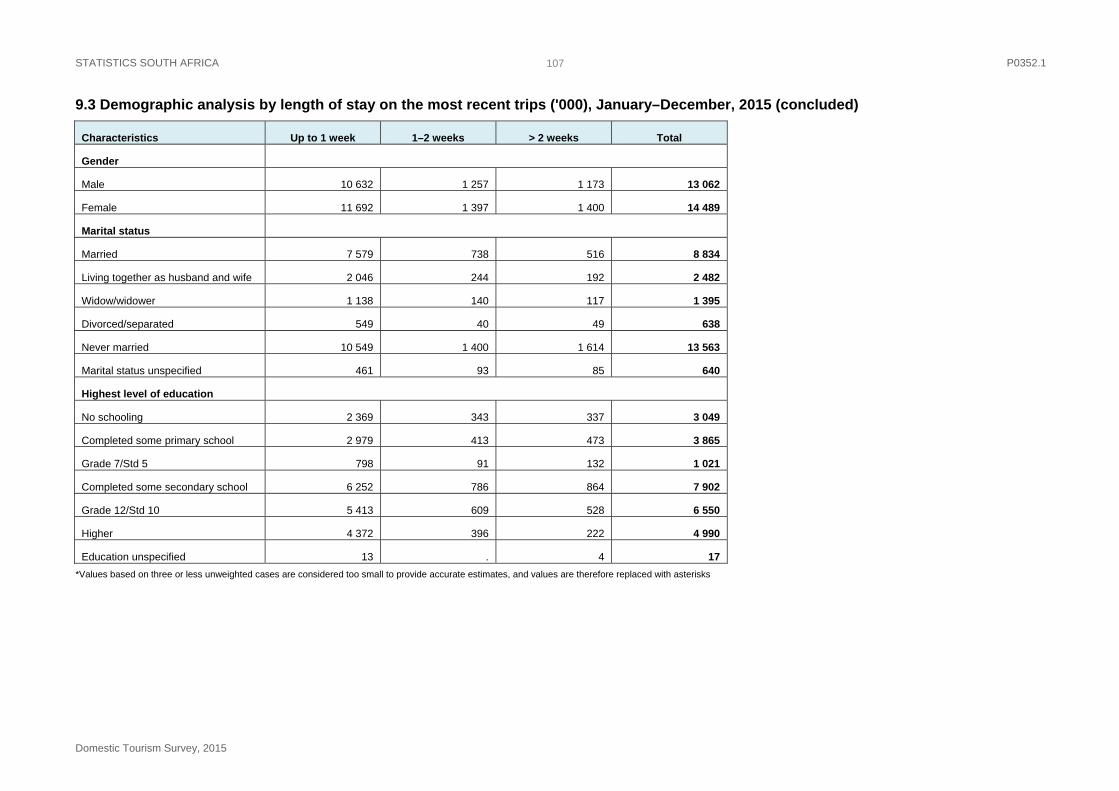
STATISTICS SOUTH AFRICA P0352.1
Domestic Tourism Survey, 2015
107
9.3 Demographic analysis by length of stay on the most recent trips ('000), January–December, 2015 (concluded)
Characteristics Up to 1 week 1–2 weeks > 2 weeks Total
Gender
Male 10 632 1 257 1 173 13 062
Female 11 692 1 397 1 400 14 489
Marital status
Married 7 579 738 516 8 834
Living together as husband and wife 2 046 244 192 2 482
Widow/widower 1 138 140 117 1 395
Divorced/separated 549 40 49 638
Never married 10 549 1 400 1 614 13 563
Marital status unspecified 461 93 85 640
Highest level of education
No schooling 2 369 343 337 3 049
Completed some primary school 2 979 413 473 3 865
Grade 7/Std 5 798 91 132 1 021
Completed some secondary school 6 252 786 864 7 902
Grade 12/Std 10 5 413 609 528 6 550
Higher 4 372 396 222 4 990
Education unspecified 13 . 4 17
*Values based on three or less unweighted cases are considered too small to provide accurate estimates, and values are therefore replaced with asterisks
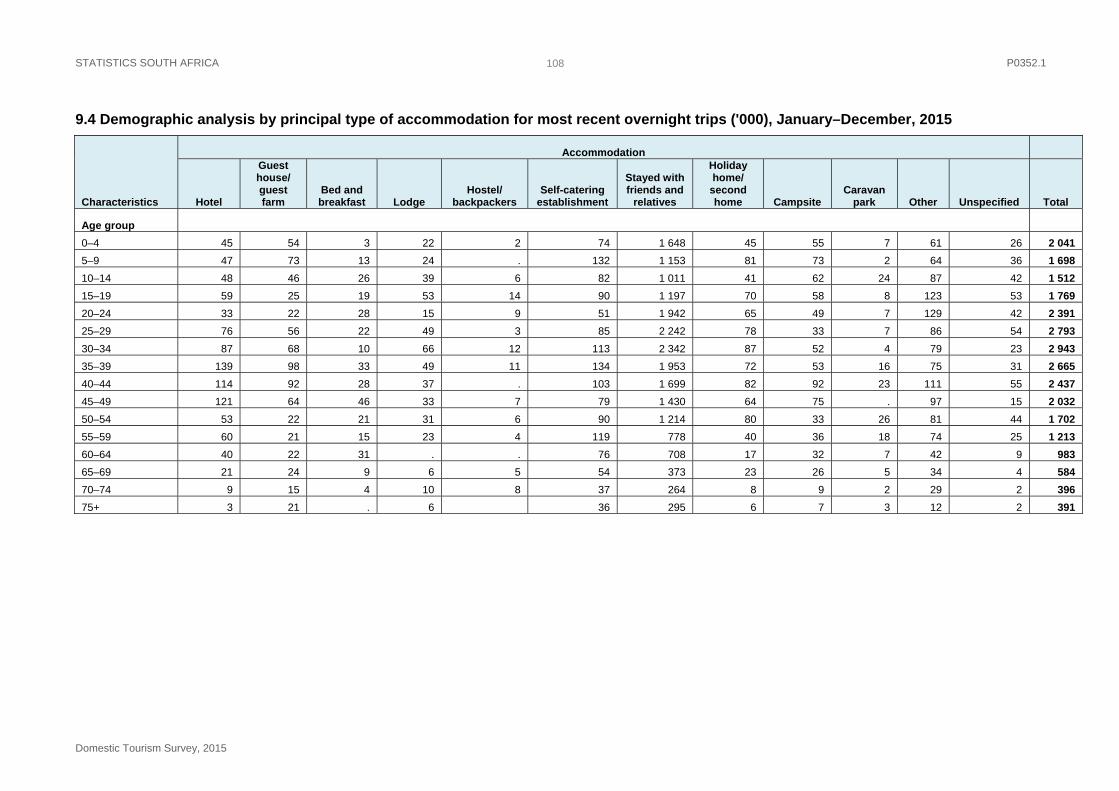
STATISTICS SOUTH AFRICA P0352.1
Domestic Tourism Survey, 2015
108
9.4 Demographic analysis by principal type of accommodation for most recent overnight trips ('000), January–December, 2015
Characteristics
Accommodation
Hotel
Guest house/ guest farm
Bed and breakfast Lodge
Hostel/ backpackers
Self-catering establishment
Stayed with friends and
relatives
Holiday home/
second home Campsite
Caravan park Other Unspecified Total
Age group
0–4 45 54 3 22 2 74 1 648 45 55 7 61 26 2 041
5–9 47 73 13 24 . 132 1 153 81 73 2 64 36 1 698
10–14 48 46 26 39 6 82 1 011 41 62 24 87 42 1 512
15–19 59 25 19 53 14 90 1 197 70 58 8 123 53 1 769
20–24 33 22 28 15 9 51 1 942 65 49 7 129 42 2 391
25–29 76 56 22 49 3 85 2 242 78 33 7 86 54 2 793
30–34 87 68 10 66 12 113 2 342 87 52 4 79 23 2 943
35–39 139 98 33 49 11 134 1 953 72 53 16 75 31 2 665
40–44 114 92 28 37 . 103 1 699 82 92 23 111 55 2 437
45–49 121 64 46 33 7 79 1 430 64 75 . 97 15 2 032
50–54 53 22 21 31 6 90 1 214 80 33 26 81 44 1 702
55–59 60 21 15 23 4 119 778 40 36 18 74 25 1 213
60–64 40 22 31 . . 76 708 17 32 7 42 9 983
65–69 21 24 9 6 5 54 373 23 26 5 34 4 584
70–74 9 15 4 10 8 37 264 8 9 2 29 2 396
75+ 3 21 . 6 36 295 6 7 3 12 2 391
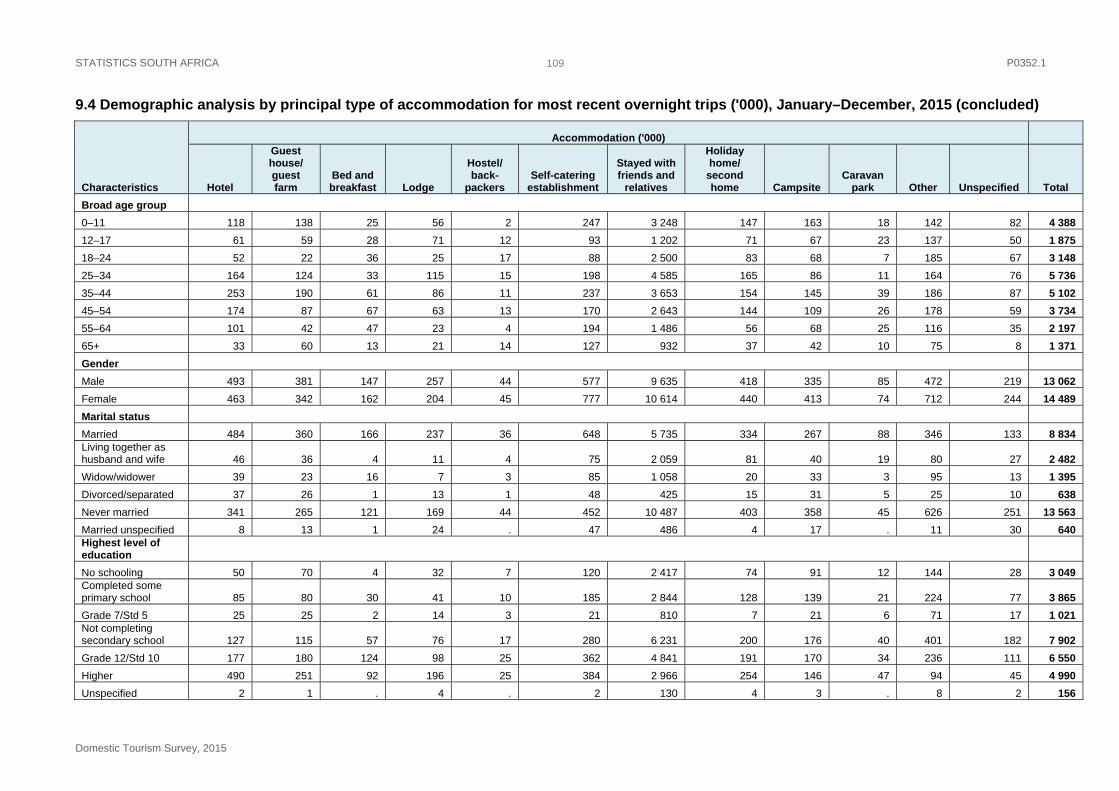
STATISTICS SOUTH AFRICA P0352.1
Domestic Tourism Survey, 2015
109
9.4 Demographic analysis by principal type of accommodation for most recent overnight trips ('000), January–December, 2015 (concluded)
Characteristics
Accommodation ('000)
Hotel
Guest house/ guest farm
Bed and breakfast Lodge
Hostel/ back-
packers Self-catering
establishment
Stayed with friends and
relatives
Holiday home/
second home Campsite
Caravan park Other Unspecified Total
Broad age group
0–11 118 138 25 56 2 247 3 248 147 163 18 142 82 4 388
12–17 61 59 28 71 12 93 1 202 71 67 23 137 50 1 875
18–24 52 22 36 25 17 88 2 500 83 68 7 185 67 3 148
25–34 164 124 33 115 15 198 4 585 165 86 11 164 76 5 736
35–44 253 190 61 86 11 237 3 653 154 145 39 186 87 5 102
45–54 174 87 67 63 13 170 2 643 144 109 26 178 59 3 734
55–64 101 42 47 23 4 194 1 486 56 68 25 116 35 2 197
65+ 33 60 13 21 14 127 932 37 42 10 75 8 1 371
Gender
Male 493 381 147 257 44 577 9 635 418 335 85 472 219 13 062
Female 463 342 162 204 45 777 10 614 440 413 74 712 244 14 489
Marital status
Married 484 360 166 237 36 648 5 735 334 267 88 346 133 8 834 Living together as husband and wife 46 36 4 11 4 75 2 059 81 40 19 80 27 2 482
Widow/widower 39 23 16 7 3 85 1 058 20 33 3 95 13 1 395
Divorced/separated 37 26 1 13 1 48 425 15 31 5 25 10 638
Never married 341 265 121 169 44 452 10 487 403 358 45 626 251 13 563
Married unspecified 8 13 1 24 . 47 486 4 17 . 11 30 640 Highest level of education
No schooling 50 70 4 32 7 120 2 417 74 91 12 144 28 3 049 Completed some primary school 85 80 30 41 10 185 2 844 128 139 21 224 77 3 865
Grade 7/Std 5 25 25 2 14 3 21 810 7 21 6 71 17 1 021 Not completing secondary school 127 115 57 76 17 280 6 231 200 176 40 401 182 7 902
Grade 12/Std 10 177 180 124 98 25 362 4 841 191 170 34 236 111 6 550
Higher 490 251 92 196 25 384 2 966 254 146 47 94 45 4 990
Unspecified 2 1 . 4 . 2 130 4 3 . 8 2 156
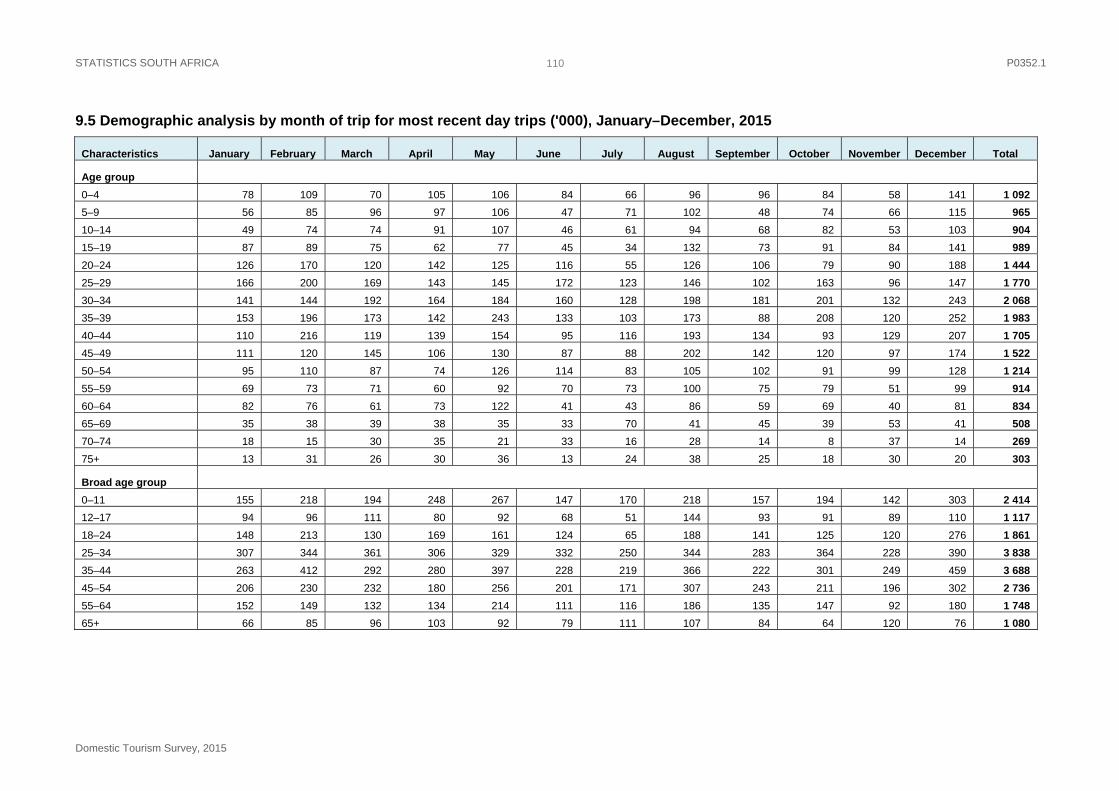
STATISTICS SOUTH AFRICA P0352.1
Domestic Tourism Survey, 2015
110
9.5 Demographic analysis by month of trip for most recent day trips ('000), January–December, 2015
Characteristics January February March April May June July August September October November December Total
Age group
0–4 78 109 70 105 106 84 66 96 96 84 58 141 1 092
5–9 56 85 96 97 106 47 71 102 48 74 66 115 965
10–14 49 74 74 91 107 46 61 94 68 82 53 103 904
15–19 87 89 75 62 77 45 34 132 73 91 84 141 989
20–24 126 170 120 142 125 116 55 126 106 79 90 188 1 444
25–29 166 200 169 143 145 172 123 146 102 163 96 147 1 770
30–34 141 144 192 164 184 160 128 198 181 201 132 243 2 068
35–39 153 196 173 142 243 133 103 173 88 208 120 252 1 983
40–44 110 216 119 139 154 95 116 193 134 93 129 207 1 705
45–49 111 120 145 106 130 87 88 202 142 120 97 174 1 522
50–54 95 110 87 74 126 114 83 105 102 91 99 128 1 214
55–59 69 73 71 60 92 70 73 100 75 79 51 99 914
60–64 82 76 61 73 122 41 43 86 59 69 40 81 834
65–69 35 38 39 38 35 33 70 41 45 39 53 41 508
70–74 18 15 30 35 21 33 16 28 14 8 37 14 269
75+ 13 31 26 30 36 13 24 38 25 18 30 20 303
Broad age group
0–11 155 218 194 248 267 147 170 218 157 194 142 303 2 414
12–17 94 96 111 80 92 68 51 144 93 91 89 110 1 117
18–24 148 213 130 169 161 124 65 188 141 125 120 276 1 861
25–34 307 344 361 306 329 332 250 344 283 364 228 390 3 838
35–44 263 412 292 280 397 228 219 366 222 301 249 459 3 688
45–54 206 230 232 180 256 201 171 307 243 211 196 302 2 736
55–64 152 149 132 134 214 111 116 186 135 147 92 180 1 748
65+ 66 85 96 103 92 79 111 107 84 64 120 76 1 080
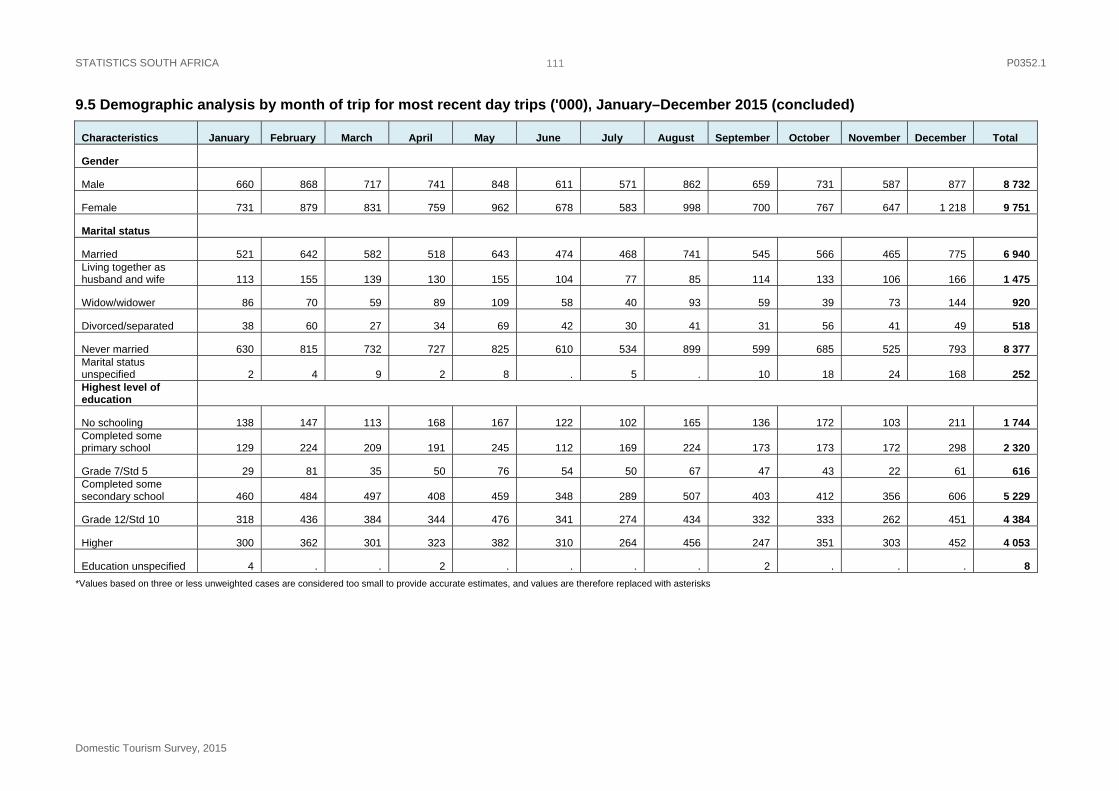
STATISTICS SOUTH AFRICA P0352.1
Domestic Tourism Survey, 2015
111
9.5 Demographic analysis by month of trip for most recent day trips ('000), January–December 2015 (concluded)
Characteristics January February March April May June July August September October November December Total
Gender
Male 660 868 717 741 848 611 571 862 659 731 587 877 8 732
Female 731 879 831 759 962 678 583 998 700 767 647 1 218 9 751
Marital status
Married 521 642 582 518 643 474 468 741 545 566 465 775 6 940 Living together as husband and wife 113 155 139 130 155 104 77 85 114 133 106 166 1 475
Widow/widower 86 70 59 89 109 58 40 93 59 39 73 144 920
Divorced/separated 38 60 27 34 69 42 30 41 31 56 41 49 518
Never married 630 815 732 727 825 610 534 899 599 685 525 793 8 377 Marital status unspecified 2 4 9 2 8 . 5 . 10 18 24 168 252 Highest level of education
No schooling 138 147 113 168 167 122 102 165 136 172 103 211 1 744 Completed some primary school 129 224 209 191 245 112 169 224 173 173 172 298 2 320
Grade 7/Std 5 29 81 35 50 76 54 50 67 47 43 22 61 616 Completed some secondary school 460 484 497 408 459 348 289 507 403 412 356 606 5 229
Grade 12/Std 10 318 436 384 344 476 341 274 434 332 333 262 451 4 384
Higher 300 362 301 323 382 310 264 456 247 351 303 452 4 053
Education unspecified 4 . . 2 . . . . 2 . . . 8
*Values based on three or less unweighted cases are considered too small to provide accurate estimates, and values are therefore replaced with asterisks
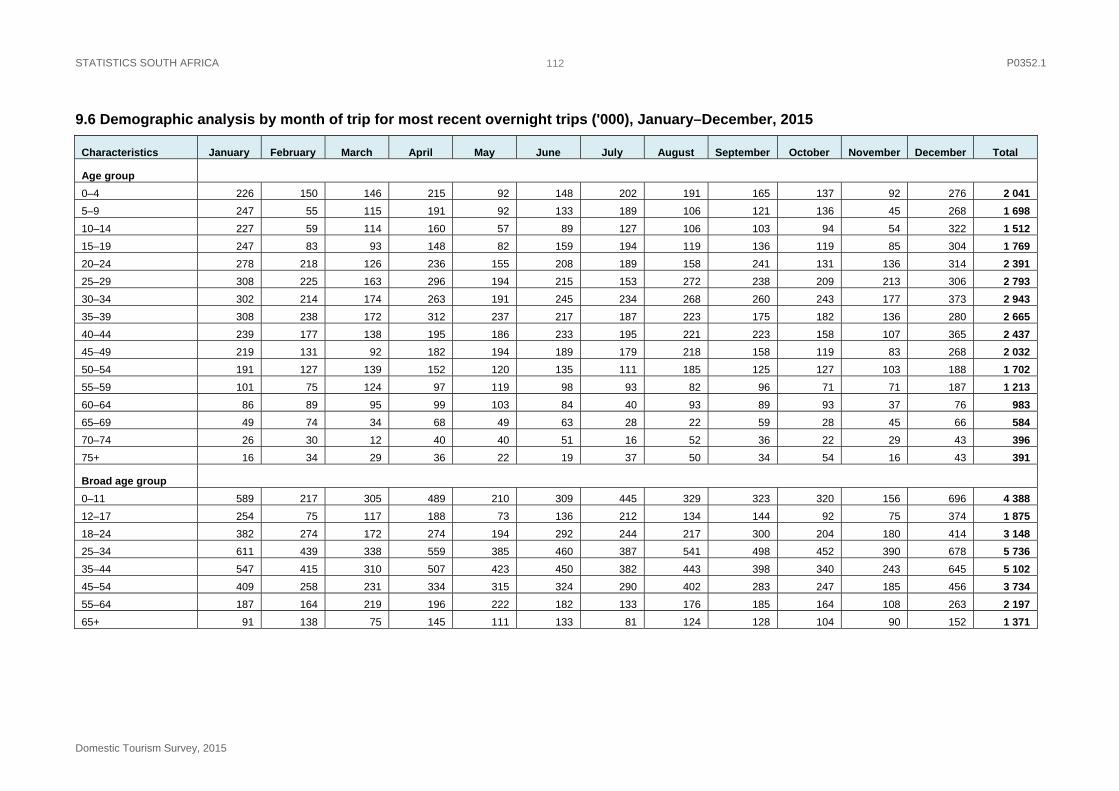
STATISTICS SOUTH AFRICA P0352.1
Domestic Tourism Survey, 2015
112
9.6 Demographic analysis by month of trip for most recent overnight trips ('000), January–December, 2015
Characteristics January February March April May June July August September October November December Total
Age group
0–4 226 150 146 215 92 148 202 191 165 137 92 276 2 041
5–9 247 55 115 191 92 133 189 106 121 136 45 268 1 698
10–14 227 59 114 160 57 89 127 106 103 94 54 322 1 512
15–19 247 83 93 148 82 159 194 119 136 119 85 304 1 769
20–24 278 218 126 236 155 208 189 158 241 131 136 314 2 391
25–29 308 225 163 296 194 215 153 272 238 209 213 306 2 793
30–34 302 214 174 263 191 245 234 268 260 243 177 373 2 943
35–39 308 238 172 312 237 217 187 223 175 182 136 280 2 665
40–44 239 177 138 195 186 233 195 221 223 158 107 365 2 437
45–49 219 131 92 182 194 189 179 218 158 119 83 268 2 032
50–54 191 127 139 152 120 135 111 185 125 127 103 188 1 702
55–59 101 75 124 97 119 98 93 82 96 71 71 187 1 213
60–64 86 89 95 99 103 84 40 93 89 93 37 76 983
65–69 49 74 34 68 49 63 28 22 59 28 45 66 584
70–74 26 30 12 40 40 51 16 52 36 22 29 43 396
75+ 16 34 29 36 22 19 37 50 34 54 16 43 391
Broad age group
0–11 589 217 305 489 210 309 445 329 323 320 156 696 4 388
12–17 254 75 117 188 73 136 212 134 144 92 75 374 1 875
18–24 382 274 172 274 194 292 244 217 300 204 180 414 3 148
25–34 611 439 338 559 385 460 387 541 498 452 390 678 5 736
35–44 547 415 310 507 423 450 382 443 398 340 243 645 5 102
45–54 409 258 231 334 315 324 290 402 283 247 185 456 3 734
55–64 187 164 219 196 222 182 133 176 185 164 108 263 2 197
65+ 91 138 75 145 111 133 81 124 128 104 90 152 1 371
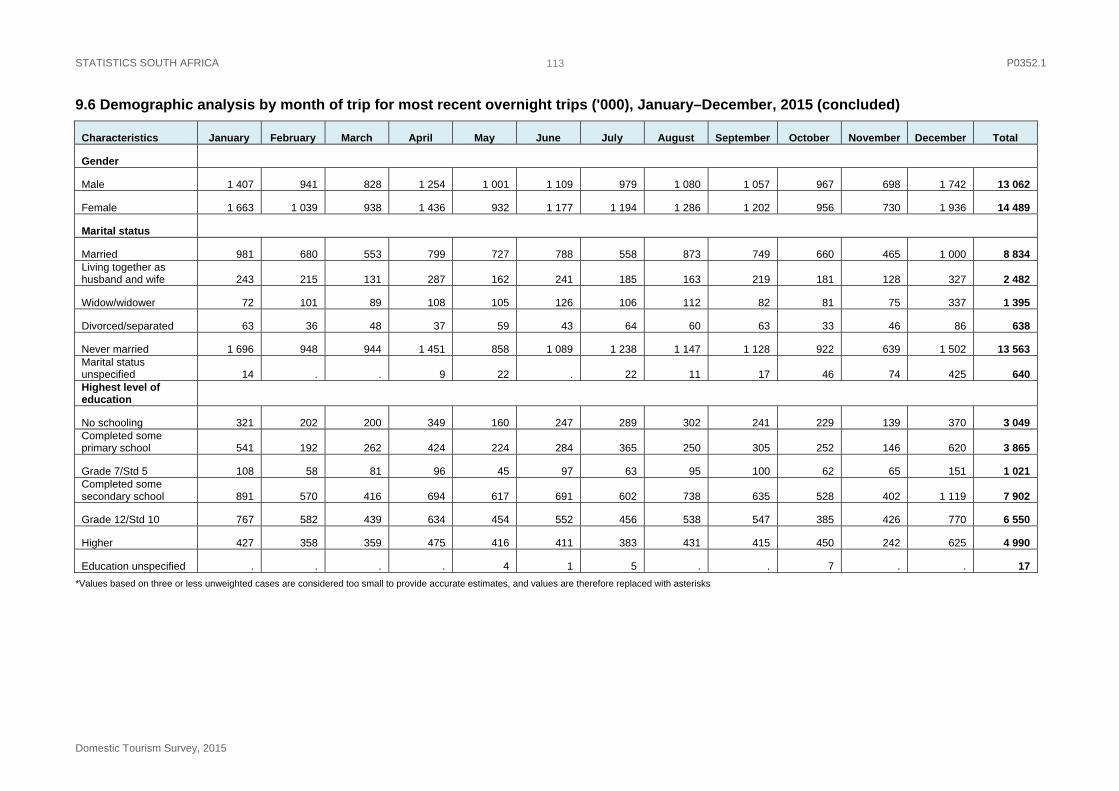
STATISTICS SOUTH AFRICA P0352.1
Domestic Tourism Survey, 2015
113
9.6 Demographic analysis by month of trip for most recent overnight trips ('000), January–December, 2015 (concluded)
Characteristics January February March April May June July August September October November December Total
Gender
Male 1 407 941 828 1 254 1 001 1 109 979 1 080 1 057 967 698 1 742 13 062
Female 1 663 1 039 938 1 436 932 1 177 1 194 1 286 1 202 956 730 1 936 14 489
Marital status
Married 981 680 553 799 727 788 558 873 749 660 465 1 000 8 834 Living together as husband and wife 243 215 131 287 162 241 185 163 219 181 128 327 2 482
Widow/widower 72 101 89 108 105 126 106 112 82 81 75 337 1 395
Divorced/separated 63 36 48 37 59 43 64 60 63 33 46 86 638
Never married 1 696 948 944 1 451 858 1 089 1 238 1 147 1 128 922 639 1 502 13 563 Marital status unspecified 14 . . 9 22 . 22 11 17 46 74 425 640 Highest level of education
No schooling 321 202 200 349 160 247 289 302 241 229 139 370 3 049 Completed some primary school 541 192 262 424 224 284 365 250 305 252 146 620 3 865
Grade 7/Std 5 108 58 81 96 45 97 63 95 100 62 65 151 1 021 Completed some secondary school 891 570 416 694 617 691 602 738 635 528 402 1 119 7 902
Grade 12/Std 10 767 582 439 634 454 552 456 538 547 385 426 770 6 550
Higher 427 358 359 475 416 411 383 431 415 450 242 625 4 990
Education unspecified . . . . 4 1 5 . . 7 . . 17
*Values based on three or less unweighted cases are considered too small to provide accurate estimates, and values are therefore replaced with asterisks
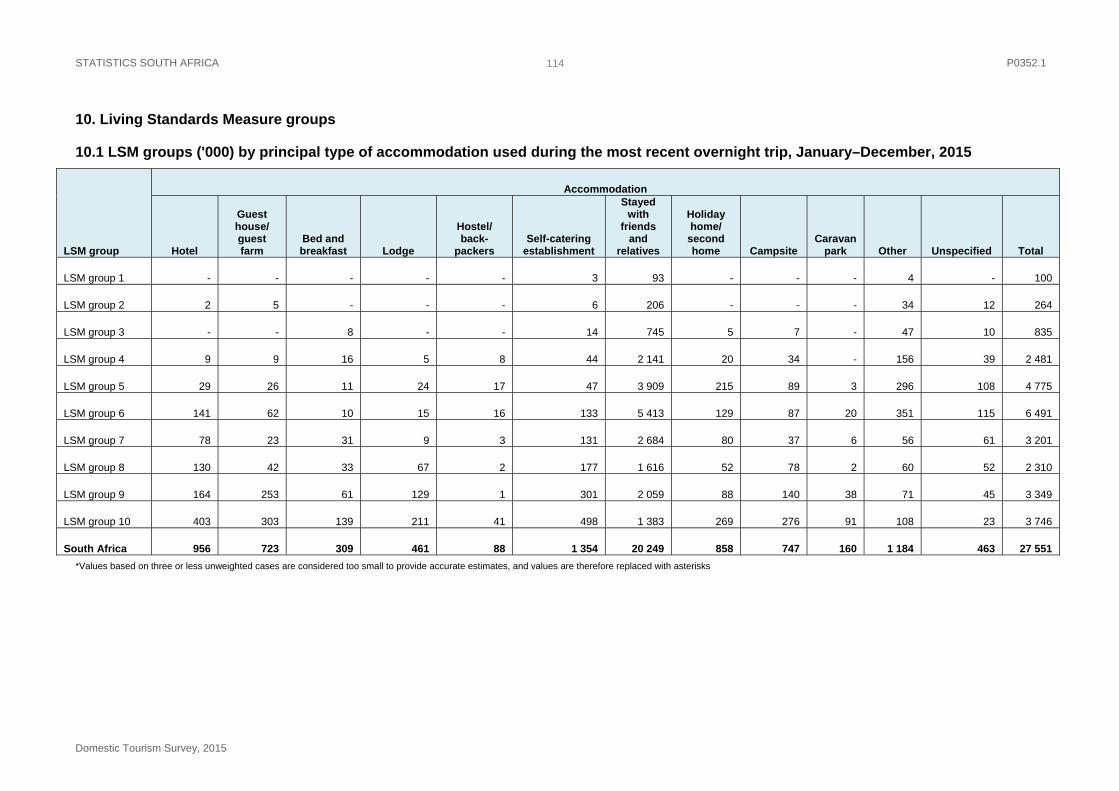
STATISTICS SOUTH AFRICA P0352.1
Domestic Tourism Survey, 2015
114
10. Living Standards Measure groups
10.1 LSM groups ('000) by principal type of accommodation used during the most recent overnight trip, January–December, 2015
LSM group
Accommodation
Hotel
Guest house/ guest farm
Bed and breakfast Lodge
Hostel/ back-
packers Self-catering
establishment
Stayed with
friends and
relatives
Holiday home/
second home Campsite
Caravan park Other Unspecified Total
LSM group 1 - - - - - 3 93 - - - 4 - 100
LSM group 2 2 5 - - - 6 206 - - - 34 12 264
LSM group 3 - - 8 - - 14 745 5 7 - 47 10 835
LSM group 4 9 9 16 5 8 44 2 141 20 34 - 156 39 2 481
LSM group 5 29 26 11 24 17 47 3 909 215 89 3 296 108 4 775
LSM group 6 141 62 10 15 16 133 5 413 129 87 20 351 115 6 491
LSM group 7 78 23 31 9 3 131 2 684 80 37 6 56 61 3 201
LSM group 8 130 42 33 67 2 177 1 616 52 78 2 60 52 2 310
LSM group 9 164 253 61 129 1 301 2 059 88 140 38 71 45 3 349
LSM group 10 403 303 139 211 41 498 1 383 269 276 91 108 23 3 746
South Africa 956 723 309 461 88 1 354 20 249 858 747 160 1 184 463 27 551
*Values based on three or less unweighted cases are considered too small to provide accurate estimates, and values are therefore replaced with asterisks
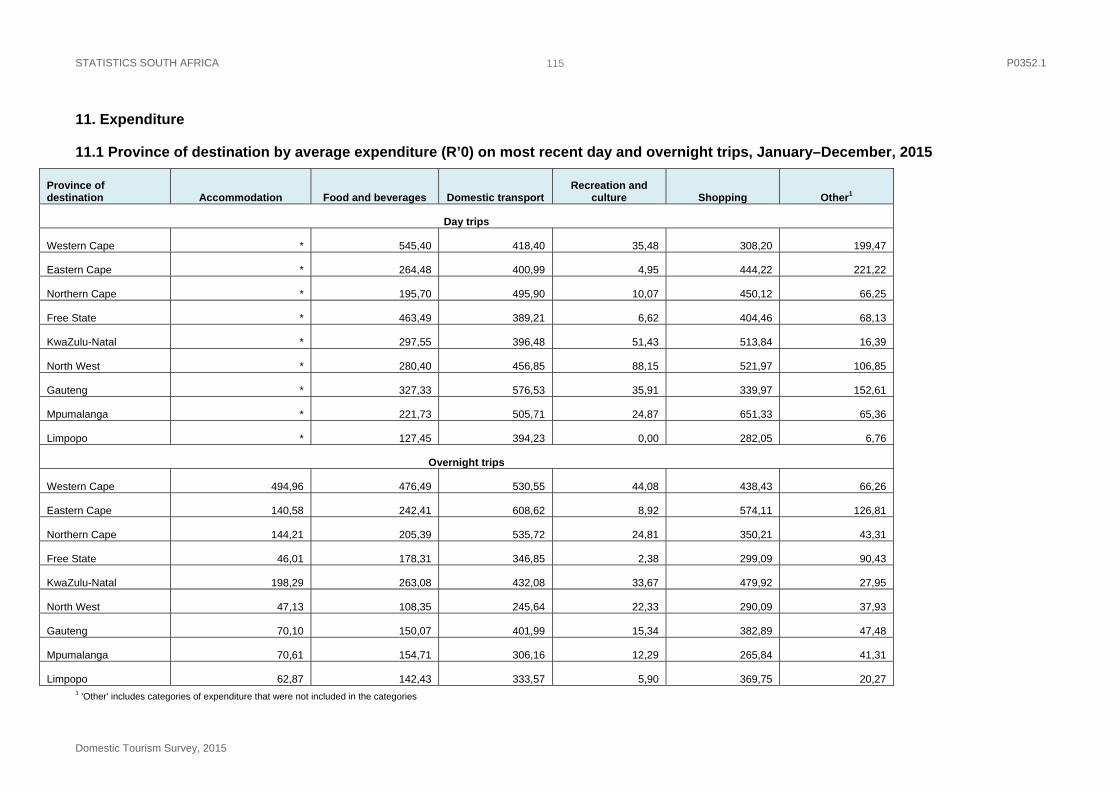
STATISTICS SOUTH AFRICA P0352.1
Domestic Tourism Survey, 2015
115
11. Expenditure
11.1 Province of destination by average expenditure (R’0) on most recent day and overnight trips, January–December, 2015
Province of destination Accommodation Food and beverages Domestic transport
Recreation and culture Shopping Other1
Day trips
Western Cape * 545,40 418,40 35,48 308,20 199,47
Eastern Cape * 264,48 400,99 4,95 444,22 221,22
Northern Cape * 195,70 495,90 10,07 450,12 66,25
Free State * 463,49 389,21 6,62 404,46 68,13
KwaZulu-Natal * 297,55 396,48 51,43 513,84 16,39
North West * 280,40 456,85 88,15 521,97 106,85
Gauteng * 327,33 576,53 35,91 339,97 152,61
Mpumalanga * 221,73 505,71 24,87 651,33 65,36
Limpopo * 127,45 394,23 0,00 282,05 6,76
Overnight trips
Western Cape 494,96 476,49 530,55 44,08 438,43 66,26
Eastern Cape 140,58 242,41 608,62 8,92 574,11 126,81
Northern Cape 144,21 205,39 535,72 24,81 350,21 43,31
Free State 46,01 178,31 346,85 2,38 299,09 90,43
KwaZulu-Natal 198,29 263,08 432,08 33,67 479,92 27,95
North West 47,13 108,35 245,64 22,33 290,09 37,93
Gauteng 70,10 150,07 401,99 15,34 382,89 47,48
Mpumalanga 70,61 154,71 306,16 12,29 265,84 41,31
Limpopo 62,87 142,43 333,57 5,90 369,75 20,27 1 'Other' includes categories of expenditure that were not included in the categories
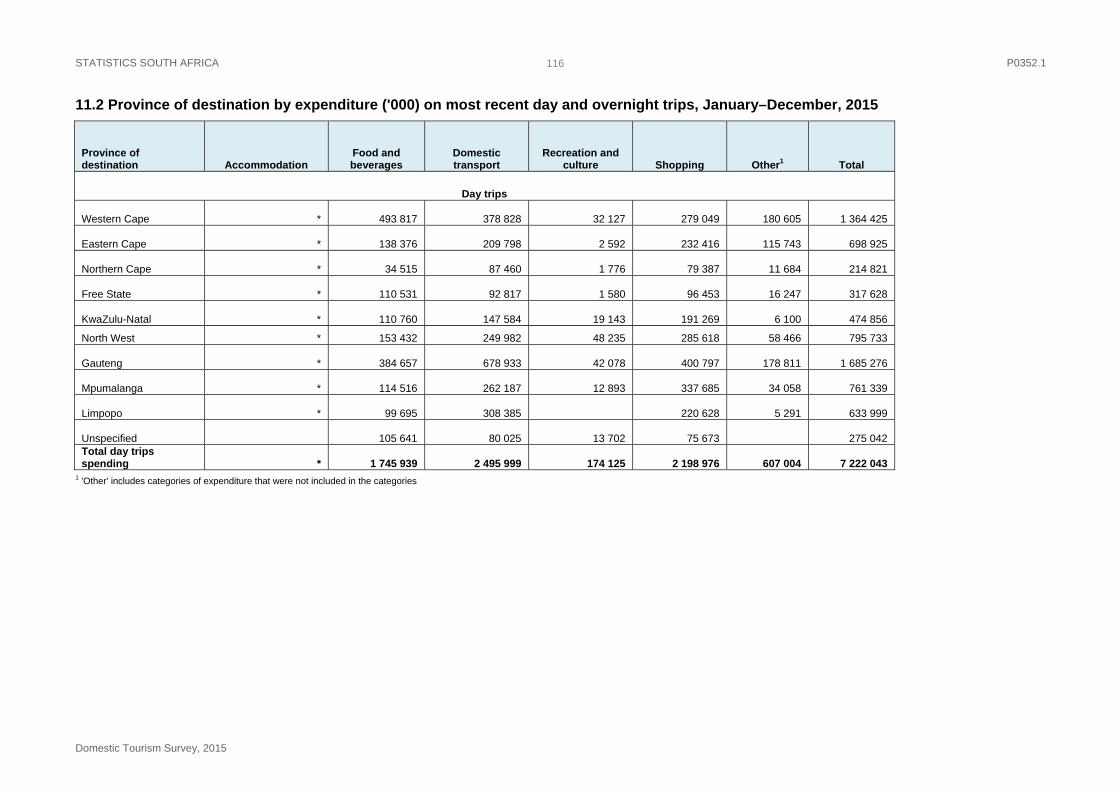
STATISTICS SOUTH AFRICA P0352.1
Domestic Tourism Survey, 2015
116
11.2 Province of destination by expenditure ('000) on most recent day and overnight trips, January–December, 2015
Province of destination Accommodation
Food and beverages
Domestic transport
Recreation and culture Shopping Other1 Total
Day trips
Western Cape * 493 817 378 828 32 127 279 049 180 605 1 364 425
Eastern Cape * 138 376 209 798 2 592 232 416 115 743 698 925
Northern Cape * 34 515 87 460 1 776 79 387 11 684 214 821
Free State * 110 531 92 817 1 580 96 453 16 247 317 628
KwaZulu-Natal * 110 760 147 584 19 143 191 269 6 100 474 856
North West * 153 432 249 982 48 235 285 618 58 466 795 733
Gauteng * 384 657 678 933 42 078 400 797 178 811 1 685 276
Mpumalanga * 114 516 262 187 12 893 337 685 34 058 761 339
Limpopo * 99 695 308 385 220 628 5 291 633 999
Unspecified 105 641 80 025 13 702 75 673 275 042 Total day trips spending * 1 745 939 2 495 999 174 125 2 198 976 607 004 7 222 043
1 'Other' includes categories of expenditure that were not included in the categories
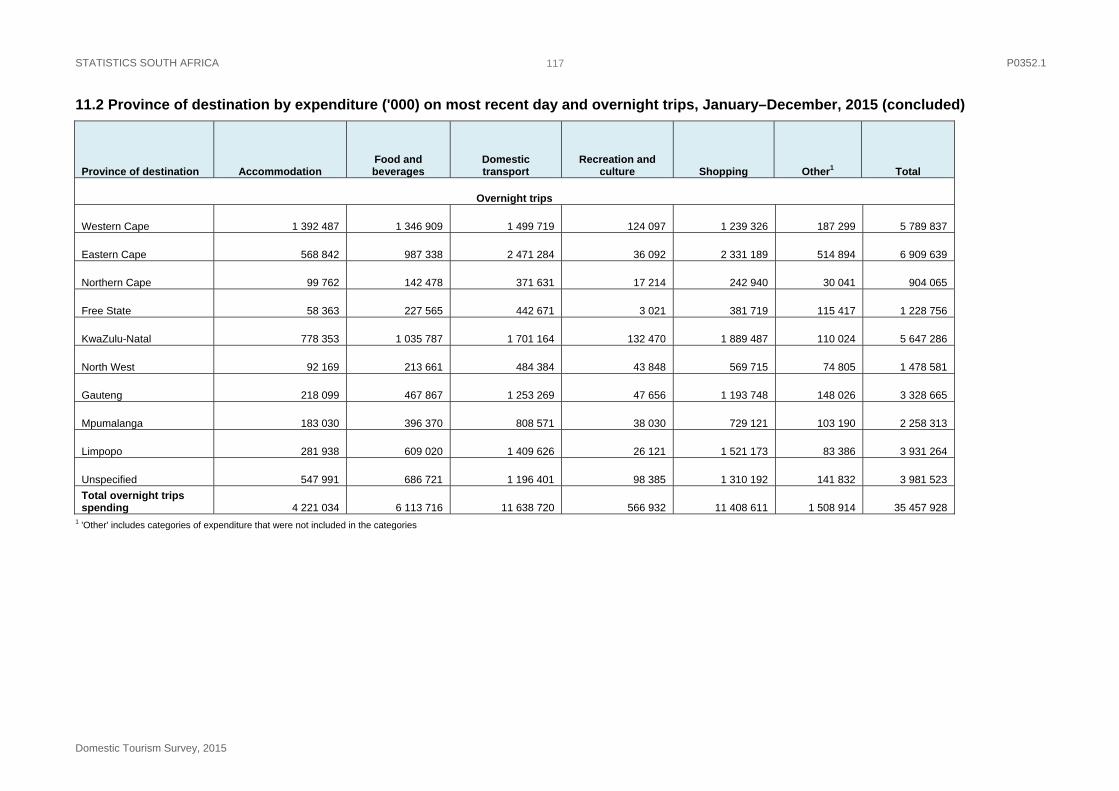
STATISTICS SOUTH AFRICA P0352.1
Domestic Tourism Survey, 2015
117
11.2 Province of destination by expenditure ('000) on most recent day and overnight trips, January–December, 2015 (concluded)
Province of destination Accommodation Food and beverages
Domestic transport
Recreation and culture Shopping Other1 Total
Overnight trips
Western Cape 1 392 487 1 346 909 1 499 719 124 097 1 239 326 187 299 5 789 837
Eastern Cape 568 842 987 338 2 471 284 36 092 2 331 189 514 894 6 909 639
Northern Cape 99 762 142 478 371 631 17 214 242 940 30 041 904 065
Free State 58 363 227 565 442 671 3 021 381 719 115 417 1 228 756
KwaZulu-Natal 778 353 1 035 787 1 701 164 132 470 1 889 487 110 024 5 647 286
North West 92 169 213 661 484 384 43 848 569 715 74 805 1 478 581
Gauteng 218 099 467 867 1 253 269 47 656 1 193 748 148 026 3 328 665
Mpumalanga 183 030 396 370 808 571 38 030 729 121 103 190 2 258 313
Limpopo 281 938 609 020 1 409 626 26 121 1 521 173 83 386 3 931 264
Unspecified 547 991 686 721 1 196 401 98 385 1 310 192 141 832 3 981 523
Total overnight trips spending 4 221 034 6 113 716 11 638 720 566 932 11 408 611 1 508 914 35 457 928
1 'Other' includes categories of expenditure that were not included in the categories