Embed Size (px)
Citation preview
Doppler Weather Radar (DWR) for Low Level Wind Shear (LLWS) detectionLow Level Wind Shear (LLWS) detection -Necessity of aircraft reports and feedback
R SureshR. SureshIMD, Chennai
Topics to be discussed• Low Level Wind Shear (LLWS) – causes, detection & Forecast• DWR based shear computation • DWR based horizontal wind estimation at various levels• DWR based Layer turbulence estimation• Clear Air Turbulence (CAT) & its forecasting techniques ( ) g q• Eddy Dissipation Rate (EDR) and estimation using DWR data• Chennai observations / validation campaign• Necessity of feedback from Air Crews• Necessity of feedback from Air Crews.
Wind shearTh j f th i t b l i i d h• The major cause of the air turbulence is wind shear.
• Wind shear refers to a change in wind speed or direction, or both, over a short distance ( ).
• In India topography monsoon weather conditions and highzV∂∂
In India, topography, monsoon weather conditions and high incidences of low level inversions are the major cause for LLWS.
Wind shear Vis à vis TurbulenceWind shear Vis-à-vis TurbulenceFrom Pilot’s point of view,• Rapid fluctuations of the headwind or tailwind encountered by the• Rapid fluctuations of the headwind or tailwind encountered by the
aircraft for a few seconds are considered as turbulence• A sustained change of the headwind or tailwind of 15 kt or more for
more than a few seconds is regarded as significant wind shear. • Wind shear and turbulence events can be on very small scale,
sporadic and transient in nature and may affect successive aircraft differently.
Wind shear or turbulence as experienced by an aircraft may atWind shear or turbulence as experienced by an aircraft may at times differ from the conditions reported by the preceding aircraft and from the alerts provided.
Low Level Wind shear
• An abrupt change in direction and/or velocity of wind.• May be associated with thunderstorms, temperature inversions orMay be associated with thunderstorms, temperature inversions or
surface obstructions and fronts in extra-tropics. • The most hazardous form of wind shear is that encountered in
thunderstorms. Wi d h f it d hi h 417 X 10 3 1 (25 1 i th• Wind shear of magnitude as high as 417 X 10-3 s-1 (25 m s-1 in the first 60 m a.g.l) have been documented ( ICAO, 1983).
• An aircraft can recover from the loss of altitude due to strong shears encountered at higher altitudes, = g
• When wind shear occurs at lower atmosphere in view of non-availability of space and time for the pilot to act, considerable loss of altitude leading to aircraft incidents / accidents may occur.
Aircraft observation & reporting of LLWSp g
• Wind shear encountered by a Pilot, which, in the opinion of the pilot-in-command, may affect the safety or markedly affect the p , y y yefficiency of other aircraft operations, the pilot-in-command shall advise the appropriate air traffic services unit as soon as practicable (ICAO, 2004, Annex 3).
• Note.— Icing, turbulence and, to a large extent, wind shear, areNote. Icing, turbulence and, to a large extent, wind shear, are elements which, for the time being, cannot be satisfactorily observed from the ground and for which in most cases aircraftobservations represent the only available evidence.LLWS t d b i ft i d l t• LLWS reported by an aircraft is used as supplementary information in METAR / SPECI for the next two hours to alert the air crews operating from the airport concerned.
• Wind shear warning will be cancelled when aircraft reports g pindicate that wind shear no longer exists or alternatively after an elapsed time of two hours.
Causes of Wind shear & Turbulence
• Winds blowing across terrain (terrain-induced, mountain wave)Ab t i ti• Abrupt pressure variation
• Sea breeze• Thunderstorm related gust front and microburst • Jet streams (low level / upper level)• Cold / warm fronts.
LLWS alert procedure
• Turbulence and to a large extent the wind shear are the elements which, for the time being, cannot be satisfactorily observed from , g, ythe ground and for which in most cases aircraft observations represent the only available evidence (ICAO, Annex 3, 2007).
• Wind profilers, TDWRs, Doppler LIDARs, sonic anemometers etc are installed in some of the major airports in the world either onare installed in some of the major airports in the world either on research or in operational mode.
• Aircraft report on wind shear serves as the source for all airports in India.LLWS i it b bl d i ti diti d• LLWS is quite probable during active monsoon conditions and during winter season over airports located in western Ghats of southern peninsular India such as VOTV, VOCI, VOCL, VOML, and VOCB wherein no low level wind shear alert system is
il bl f d th i ft t ti l f thavailable as of now and the aircraft reports are essential for these airports.
Low level wind shear and turbulence
• The life time of the shear is very minimum (say a maximum of few minutes) but its catastrophic effect is very high. ) p y g
• As the exploration of vertical atmosphere is limited to two observations every day through radio sonde / radio wind (RS/RW) technique, prediction of wind shear to a reasonable degree of accuracy is somewhat limited.accuracy is somewhat limited.
• Hence the in-flight report on wind shear serves as the basic input for the meteorologists to issue TREND forecast for the next few hours.Al d t b t d i i t t h• Also serves as a database to devise a warning strategy when sufficient input is received.
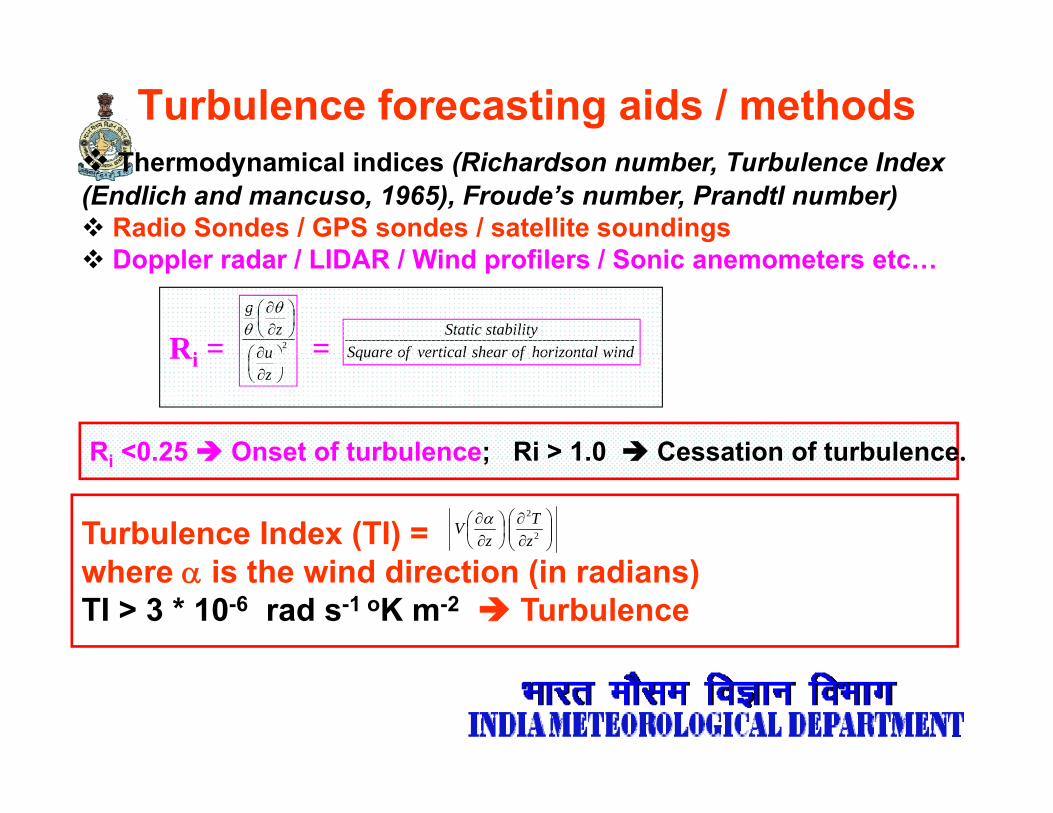
Turbulence forecasting aids / methodsThermodynamical indices (Richardson number, Turbulence Index
(Endlich and mancuso, 1965), Froude’s number, Prandtl number)Radio Sondes / GPS sondes / satellite soundingsD l d / LIDAR / Wi d fil / S i t tDoppler radar / LIDAR / Wind profilers / Sonic anemometers etc…
windhorizontalofshearverticalofSquarestabilityStatic
2
⎟⎞
⎜⎛ ∂
⎟⎠⎞
⎜⎝⎛∂∂
uz
g θθ
Ri = = windhorizontalofshearverticalofSquare⎟⎠⎞
⎜⎝⎛∂∂zuRi
Ri <0.25 Onset of turbulence; Ri > 1.0 Cessation of turbulence.Ri <0.25 Onset of turbulence; Ri > 1.0 Cessation of turbulence.
Turbulence Index (TI) = h i th i d di ti (i di )
⎟⎟⎠
⎞⎜⎜⎝
⎛∂∂
⎟⎠⎞
⎜⎝⎛∂∂
2
2
zT
zV α
where α is the wind direction (in radians)TI > 3 * 10-6 rad s-1 oK m-2 Turbulence
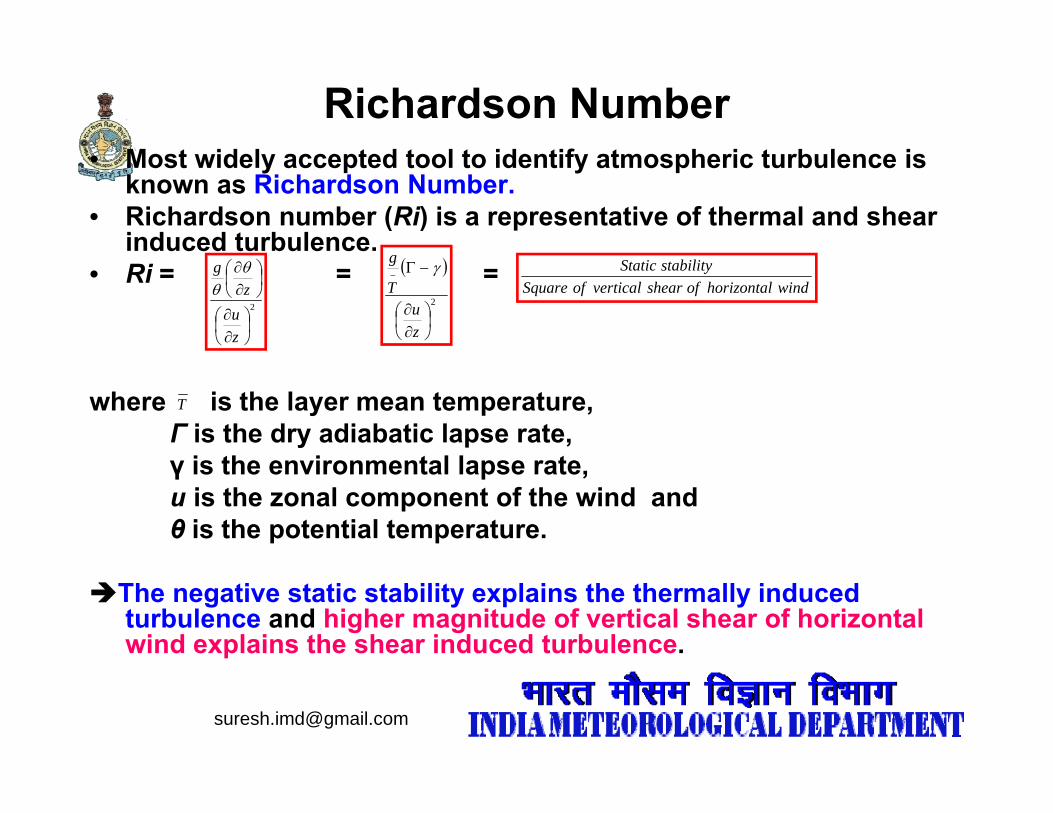
Richardson NumberM t id l t d t l t id tif t h i t b l i• Most widely accepted tool to identify atmospheric turbulence is known as Richardson Number.
• Richardson number (Ri) is a representative of thermal and shear induced turbulence.
• Ri = = = 2
⎟⎠⎞
⎜⎝⎛∂∂
⎟⎠⎞
⎜⎝⎛∂∂
zu
zg θθ
( )
2
⎟⎠⎞
⎜⎝⎛∂∂
−Γ−
zu
T
g γwindhorizontalofshearverticalofSquare
stabilityStatic
where is the layer mean temperature, Γ is the dry adiabatic lapse rate,
i th i t l l t
T
γ is the environmental lapse rate, u is the zonal component of the wind and θ is the potential temperature.
The negative static stability explains the thermally induced turbulence and higher magnitude of vertical shear of horizontal wind explains the shear induced turbulence.
Turbulence thresholds
• Change of wind speed of 6 kt and more in a layer of 1000 ft (300 m) is associated with moderate turbulence)
• 12 kts and more in 1000 ft is associated with severe turbulence in aviation parlance (Endlich, 1964; Ellrod and Knapp, 1992).
(i ) i d h th h ld f 0 00967 1 i i t d ith• (i.e.) wind shear threshold of 0.00967s-1 is associated with moderate turbulence
• 0.019 s-1 is associated with severe turbulence.
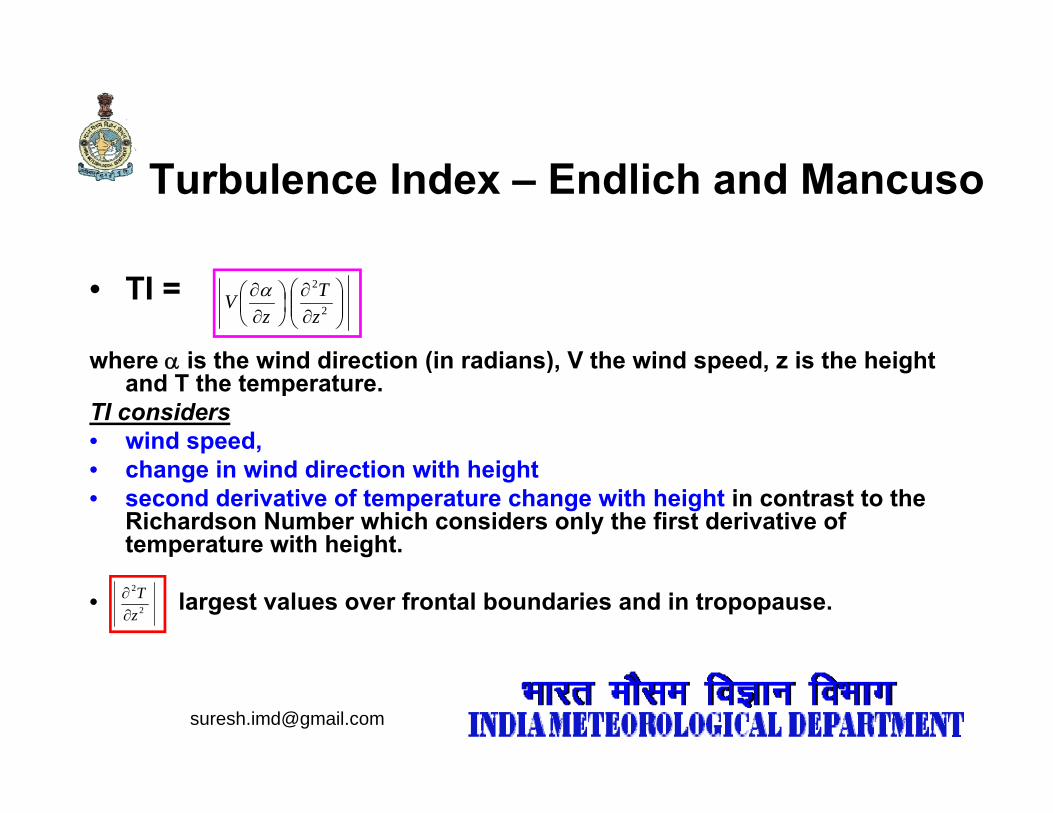
Turbulence Index – Endlich and Mancuso
• TI =
h i th i d di ti (i di ) V th i d d i th h i ht
⎟⎟⎠
⎞⎜⎜⎝
⎛∂∂
⎟⎠⎞
⎜⎝⎛∂∂
2
2
zT
zV α
where α is the wind direction (in radians), V the wind speed, z is the height and T the temperature.
TI considers• wind speed, • change in wind direction with height • second derivative of temperature change with height in contrast to the
Richardson Number which considers only the first derivative of temperature with height.
• largest values over frontal boundaries and in tropopause.2
2
zT
∂∂
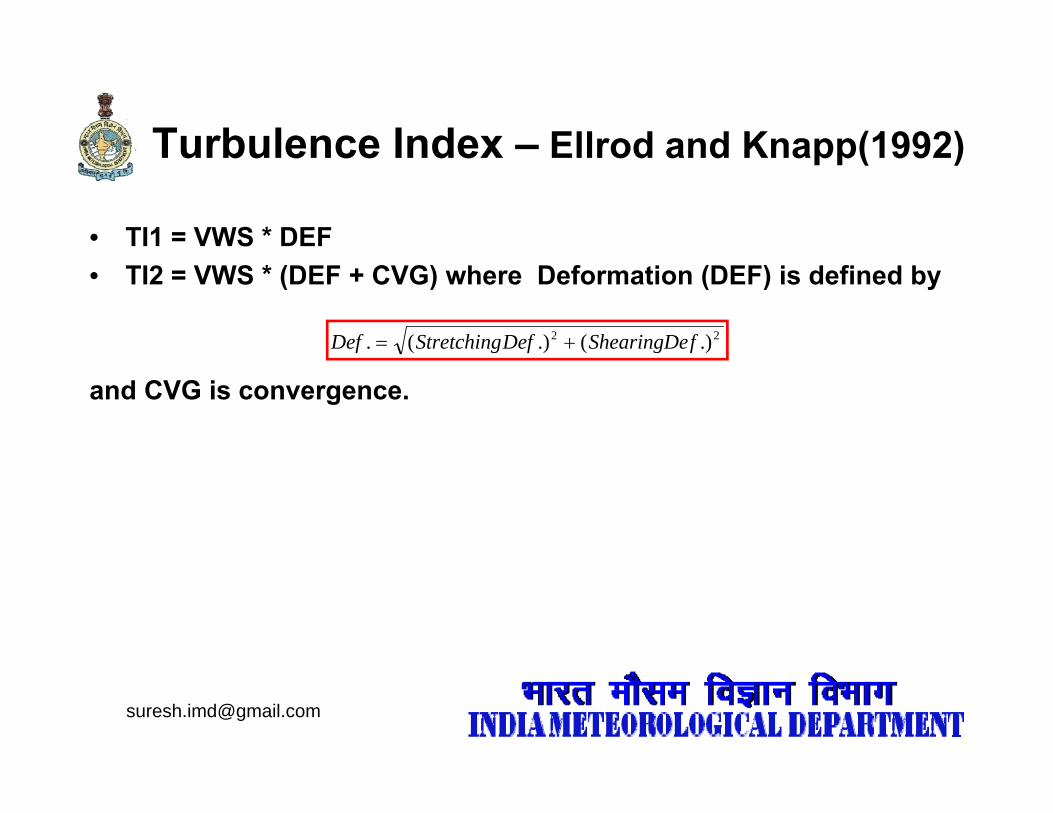
Turbulence Index – Ellrod and Knapp(1992)Turbulence Index Ellrod and Knapp(1992)
• TI1 = VWS * DEF• TI2 = VWS * (DEF + CVG) where Deformation (DEF) is defined by
22 .)(.)(. fShearingDeDefStretchingDef +=
and CVG is convergence.
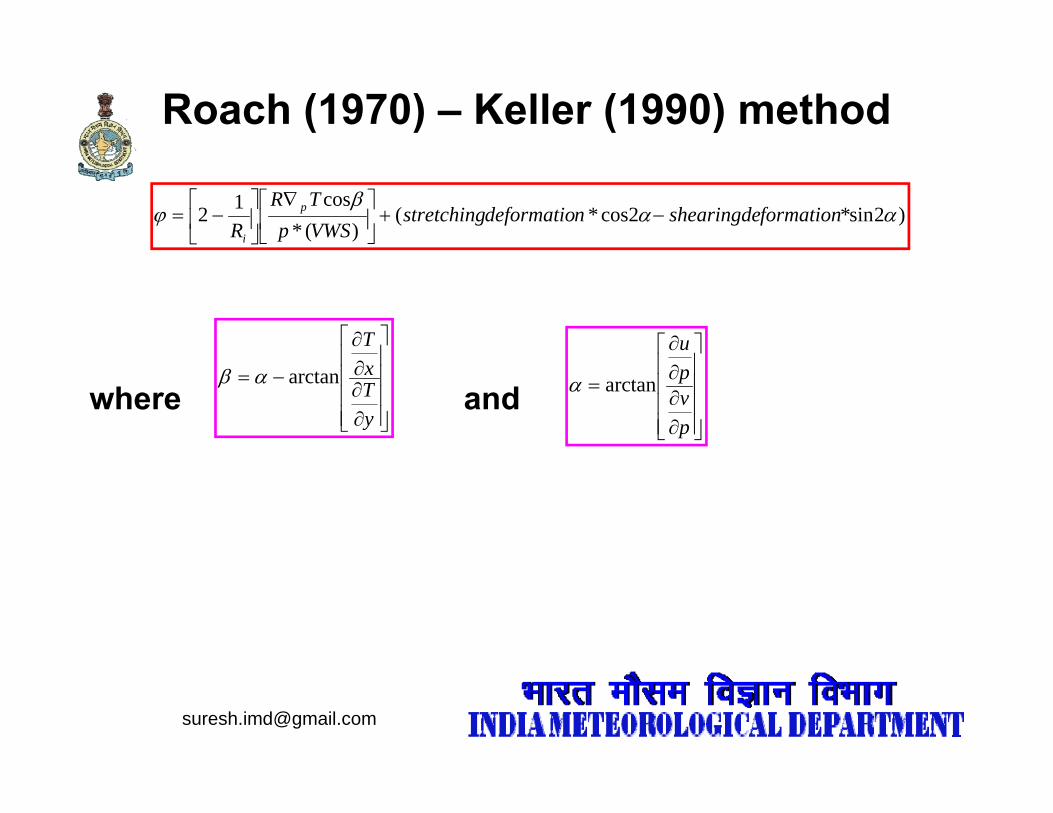
Roach (1970) – Keller (1990) method
)2sin*2cos*()(*
cos12 ααβ
ϕ formationshearingdendeformatiostretchingVWSpTR
Rp
i
−+⎥⎦
⎤⎢⎣
⎡ ∇⎥⎦
⎤⎢⎣
⎡−=
⎥⎤
⎢⎡ ∂T
⎥⎤
⎢⎡ ∂u
where and ⎥⎥⎥⎥
⎦⎢⎢⎢⎢
⎣ ∂∂∂−=
yTxarctanαβ
⎥⎥⎥⎥
⎦⎢⎢⎢⎢
⎣ ∂∂∂=
pvparctanα
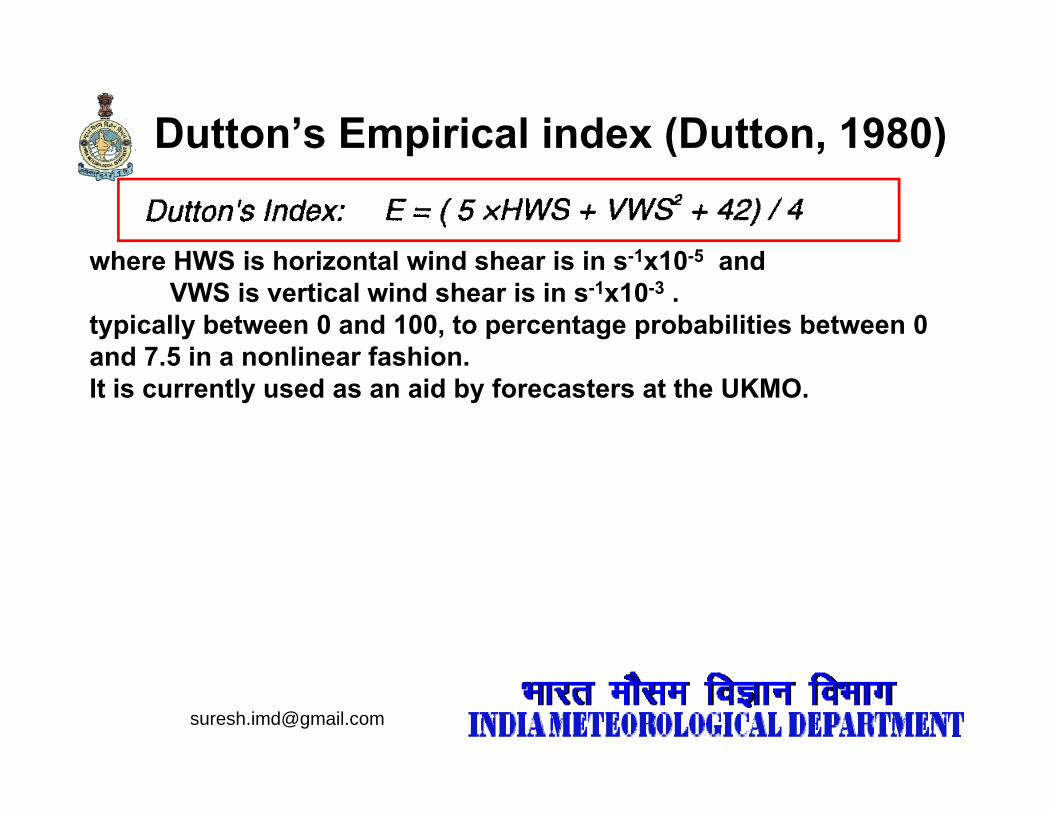
Dutton’s Empirical index (Dutton, 1980)p ( , )
h HWS i h i t l i d h i i 1 10 5 dwhere HWS is horizontal wind shear is in s-1x10⁻⁵ and VWS is vertical wind shear is in s-1x10⁻³ .
typically between 0 and 100, to percentage probabilities between 0 and 7 5 in a nonlinear fashionand 7.5 in a nonlinear fashion. It is currently used as an aid by forecasters at the UKMO.
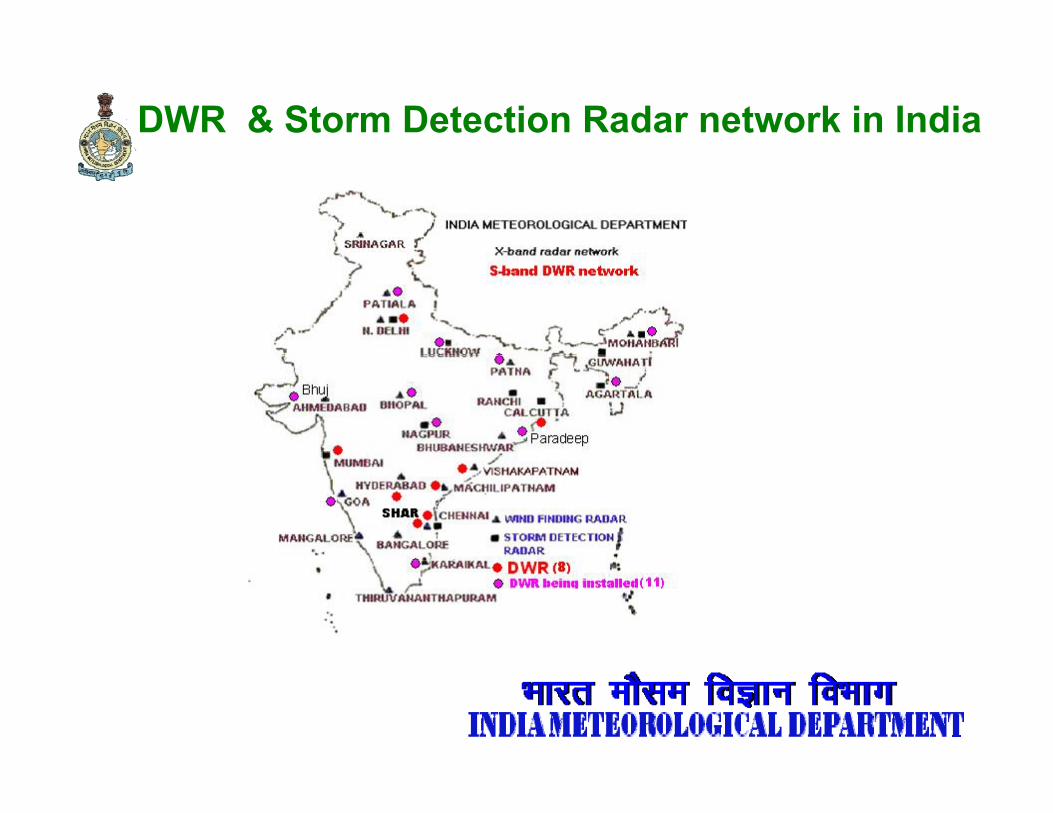
DWR & Storm Detection Radar network in India
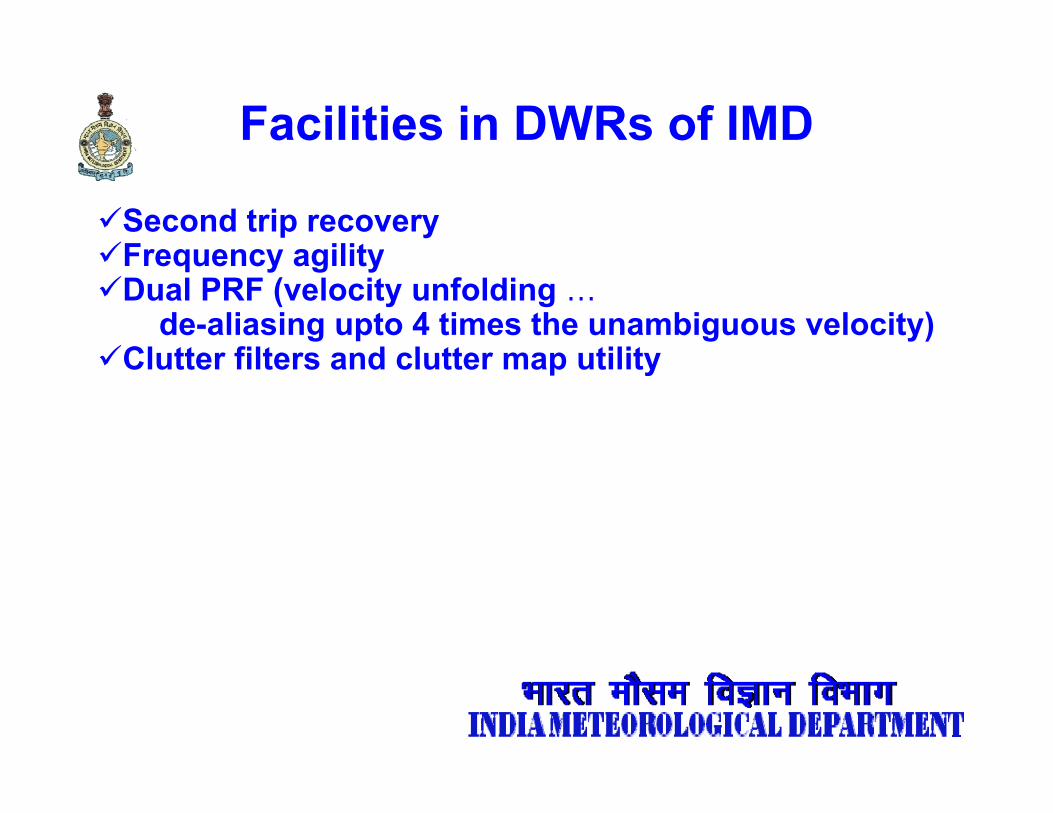
Facilities in DWRs of IMD
Second trip recoveryFrequency agilityFrequency agilityDual PRF (velocity unfolding …
de-aliasing upto 4 times the unambiguous velocity)Clutter filters and clutter map utilityClutter filters and clutter map utility
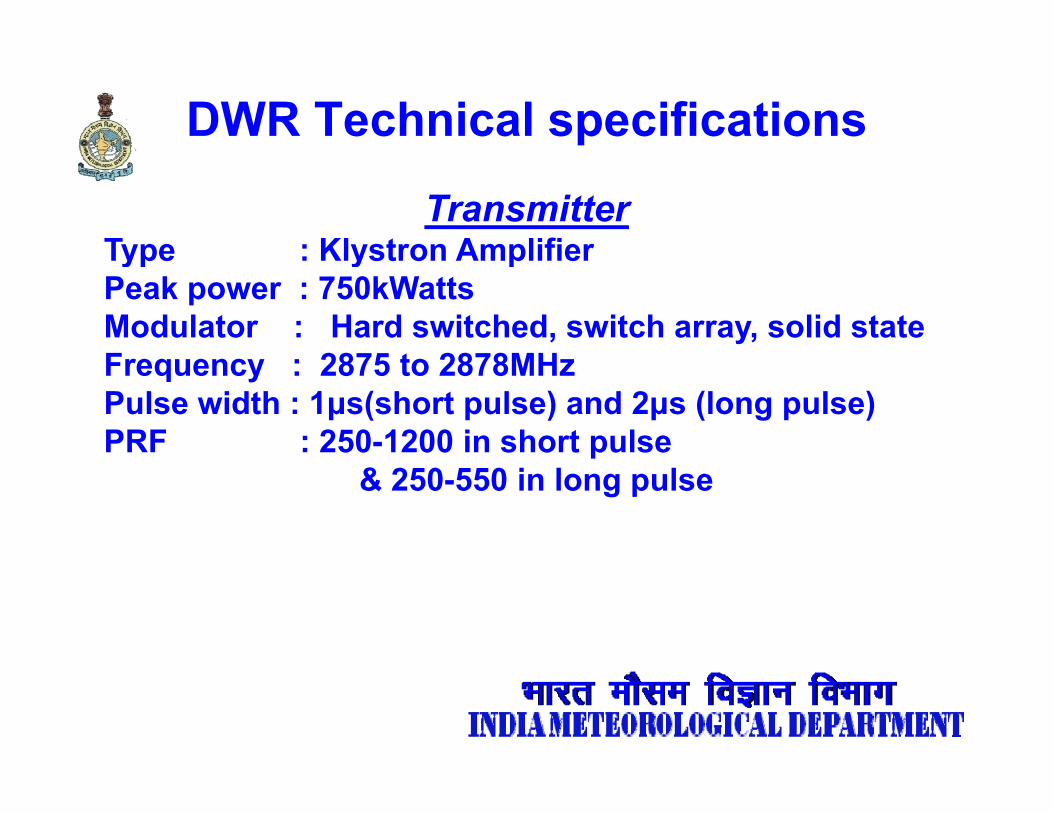
DWR Technical specifications
TransmitterType : Klystron AmplifierType : Klystron AmplifierPeak power : 750kWattsModulator : Hard switched, switch array, solid stateF 2875 t 2878MHFrequency : 2875 to 2878MHzPulse width : 1μs(short pulse) and 2μs (long pulse)PRF : 250-1200 in short pulse p
& 250-550 in long pulse
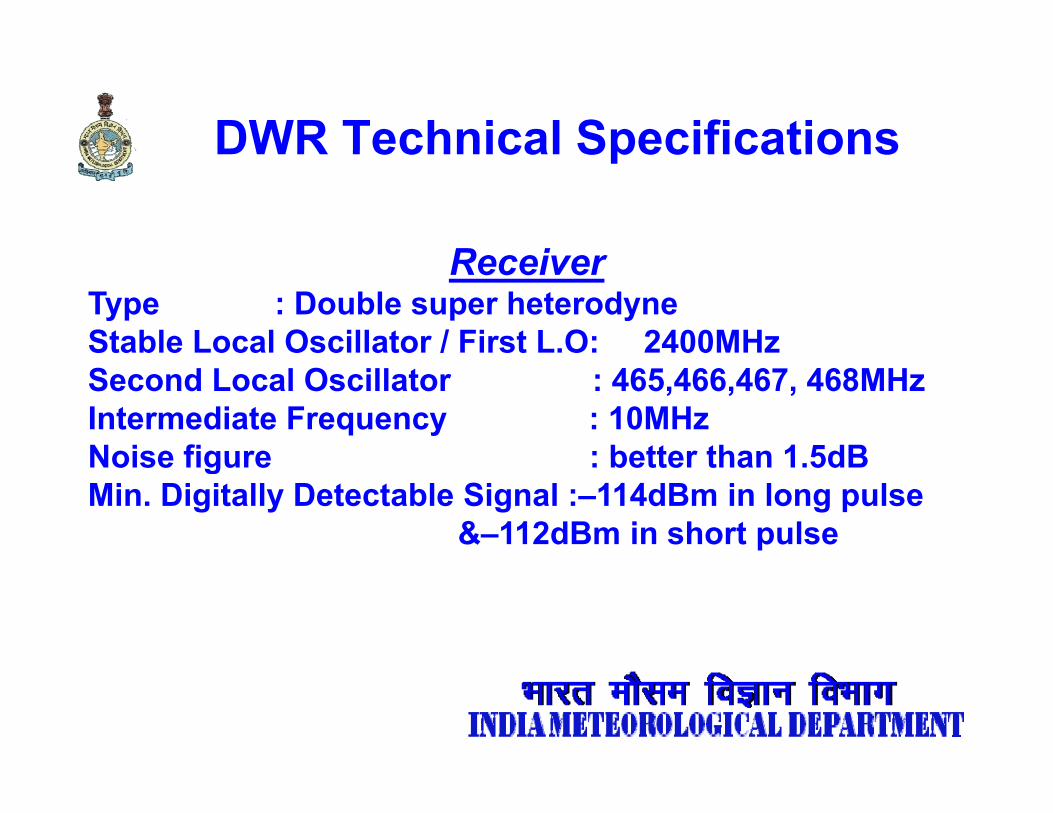
DWR Technical SpecificationsDWR Technical Specifications
R iReceiverType : Double super heterodyneStable Local Oscillator / First L.O: 2400MHzSecond Local Oscillator : 465,466,467, 468MHzIntermediate Frequency : 10MHzNoise figure : better than 1 5dBNoise figure : better than 1.5dBMin. Digitally Detectable Signal :–114dBm in long pulse
&–112dBm in short pulse
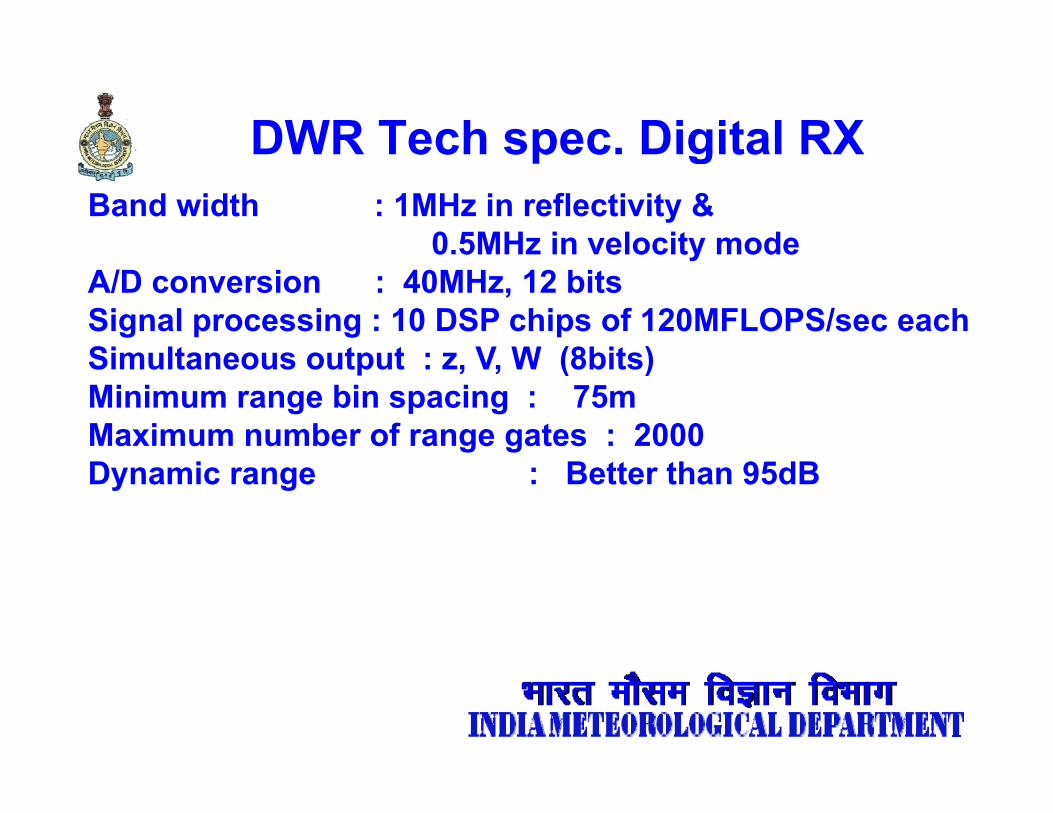
DWR Tech spec. Digital RXDWR Tech spec. Digital RXBand width : 1MHz in reflectivity &
0.5MHz in velocity mode0.5MHz in velocity modeA/D conversion : 40MHz, 12 bitsSignal processing : 10 DSP chips of 120MFLOPS/sec eachSimultaneous output : z V W (8bits)Simultaneous output : z, V, W (8bits)Minimum range bin spacing : 75m Maximum number of range gates : 2000Dynamic range : Better than 95dB
DWR based Shear productsDWR based Shear products
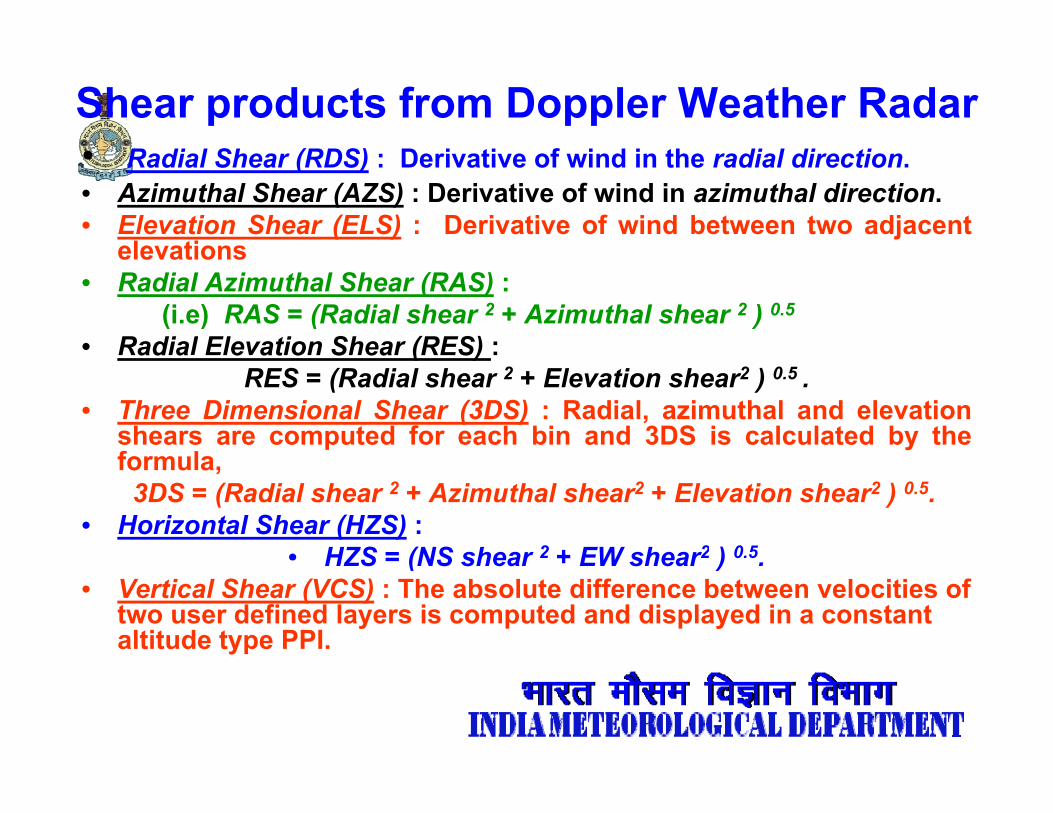
Shear products from Doppler Weather RadarR di l Sh (RDS) D i ti f i d i th di l di ti• Radial Shear (RDS) : Derivative of wind in the radial direction.
• Azimuthal Shear (AZS) : Derivative of wind in azimuthal direction.• Elevation Shear (ELS) : Derivative of wind between two adjacent
elevationselevations• Radial Azimuthal Shear (RAS) :
(i.e) RAS = (Radial shear 2 + Azimuthal shear 2 ) 0.5
• Radial Elevation Shear (RES) :ad a e at o S ea ( S)RES = (Radial shear 2 + Elevation shear2 ) 0.5 .
• Three Dimensional Shear (3DS) : Radial, azimuthal and elevationshears are computed for each bin and 3DS is calculated by theformulaformula,
3DS = (Radial shear 2 + Azimuthal shear2 + Elevation shear2 ) 0.5.• Horizontal Shear (HZS) :
• HZS = (NS shear 2 + EW shear2 ) 0.5HZS = (NS shear + EW shear ) .• Vertical Shear (VCS) : The absolute difference between velocities of
two user defined layers is computed and displayed in a constant altitude type PPI.
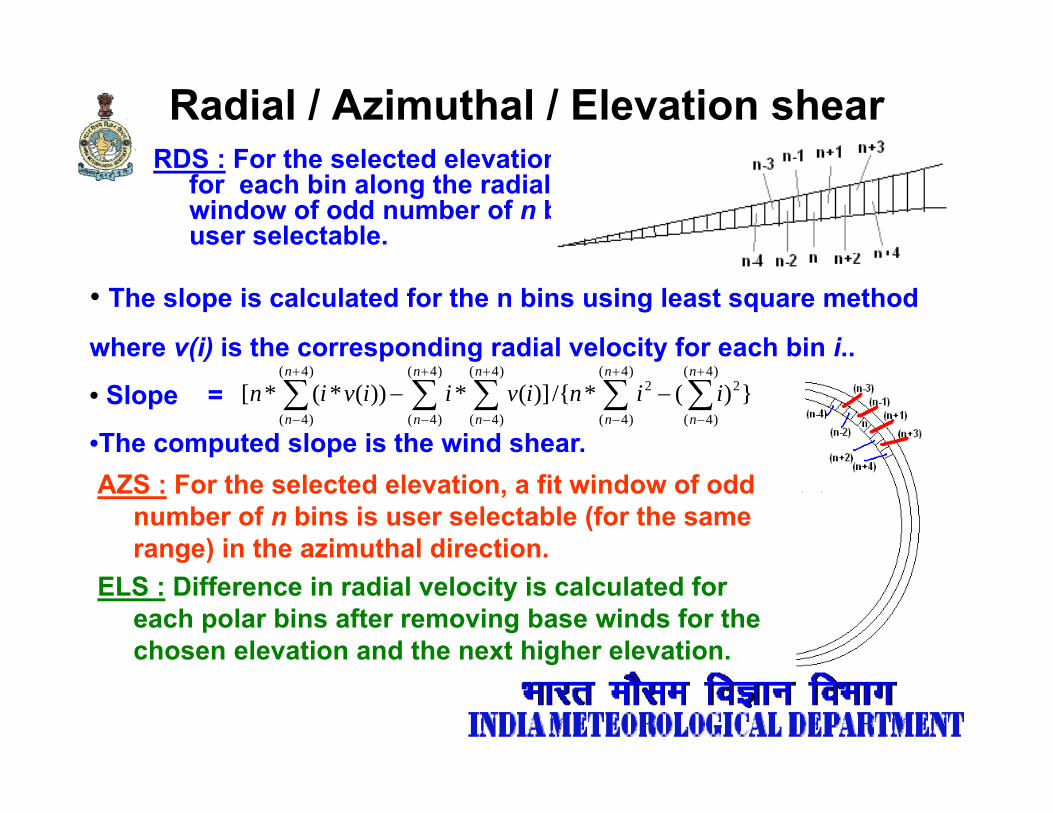
Radial / Azimuthal / Elevation shearRDS F th l t d l ti dRDS : For the selected elevation and
for each bin along the radial, a fit window of odd number of n bins is user selectable.
• The slope is calculated for the n bins using least square method
where v(i) is the corresponding radial velocity for each bin i..where v(i) is the corresponding radial velocity for each bin i..
• Slope =
•The computed slope is the wind shear. ∑ ∑ ∑ ∑∑+
−
+
−
+
−
+
−
+
−
−−)4(
)4(
)4(
)4(
)4(
)4(
)4(
)4(
22)4(
)4(})(*/{)](*))(*(*[
n
n
n
n
n
n
n
n
n
niiniviivin
AZS : For the selected elevation, a fit window of odd number of n bins is user selectable (for the same range) in the azimuthal direction.g )
ELS : Difference in radial velocity is calculated for each polar bins after removing base winds for the chosen elevation and the next higher elevation.g
Wind shear..contd.• Wind shear can be associated with convective currents, clear air,
convective clouds (Cb).• The most hazardous form of wind shear is that encountered in
thunderstormsthunderstorms. • “Microbursts" caused several aircraft accidents.• Wind shear can be found at any height, high altitude or near the
ground.• Wind shear can be mild or it can be extremely dangerous.• The severe and sudden changes in wind can exceed the
performance capabilities of many sophisticated aircraft.
Literature says that wind shear is a short lived phenomenonActual observation revealed that it has lasted as high as 11 hrs
Ch i i tover Chennai airport.Pilot’s inflight / debriefing report is needed.
Current methods of wind shear forecast
• Wind shear results Mechanical and/or thermal turbulence.• Estimated from 12 hourly Radio Sonde / Radio Wind data.Estimated from 12 hourly Radio Sonde / Radio Wind data.• Purely subjective (not location specific).• Wind shear reported by Pilots through ATC is being used for two
hours (4 METARS) to issue warning for other air planes (rule of th b)thumb).
• Doppler Weather Radars (DWR) are used to detect shear.• DWRs measure only radial velocity and not the prevailing wind
velocity.velocity.• Mathematical techniques to estimate prevailing wind from the
radial wind.• Shears along Radial, Azimuthal and Elevation direction can be
t d & ll ibl bi ti l b t dcomputed & all possible combinations can also be computed.• Validation require large volume of data.
Horizontal wind estimation from radial wind measured by DWR
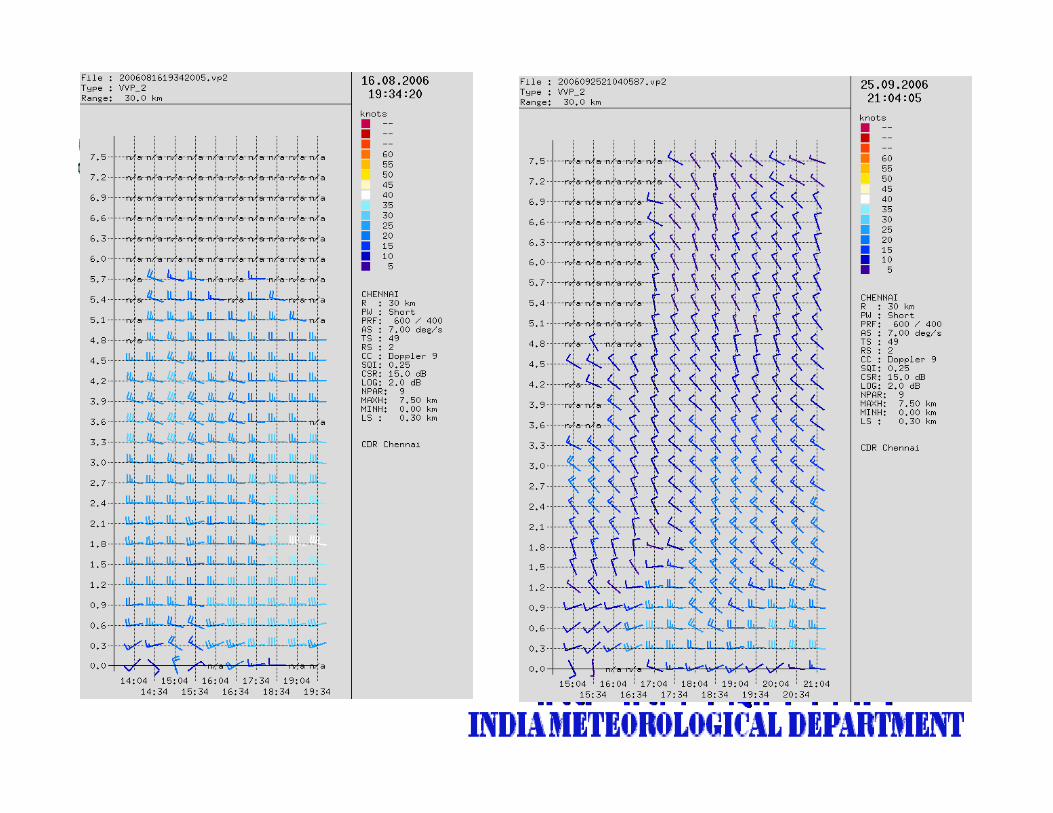
Volume Velocity Processing (VVP)
The display can be in the form of (i) a vertical time section of horizontal wind and/or(i) a vertical time section of horizontal wind and/or(ii) three separate displays depicting
height vis-a-vis wind direction,height vis-a-vis wind speed andheight vis a vis wind speed andvertical profile of horizontal divergence at a particular time
restricted to about 25km radius from the radar.
Volume Velocity Processing … contd
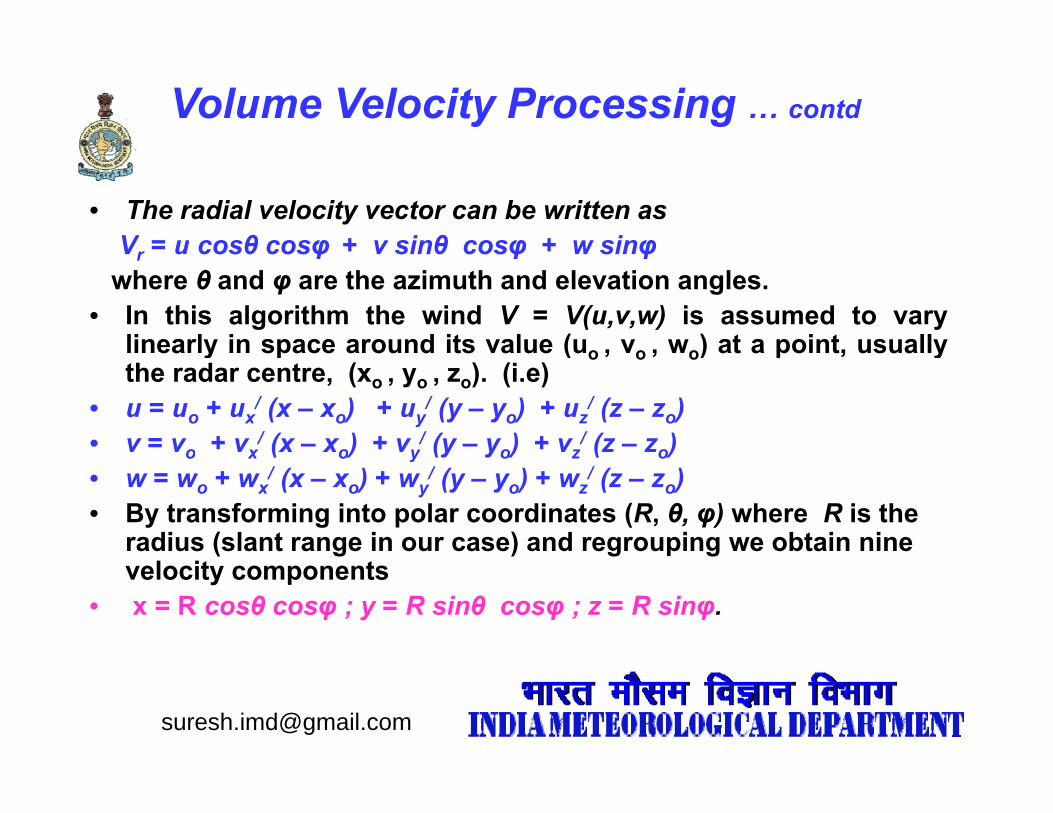
• The radial velocity vector can be written asVr = u cosθ cosφ + v sinθ cosφ + w sinφVr u cosθ cosφ v sinθ cosφ w sinφ
where θ and φ are the azimuth and elevation angles.• In this algorithm the wind V = V(u,v,w) is assumed to vary
linearly in space around its value (uo , vo , wo) at a point, usuallyy p ( o , o , o) p , ythe radar centre, (xo , yo , zo). (i.e)
• u = uo + ux/ (x – xo) + uy
/ (y – yo) + uz/ (z – zo)
• v = vo + vx/ (x – xo) + vy
/ (y – yo) + vz/ (z – zo)o x o y o z o
• w = wo + wx/ (x – xo) + wy
/ (y – yo) + wz/ (z – zo)
• By transforming into polar coordinates (R, θ, φ) where R is the radius (slant range in our case) and regrouping we obtain nine velocity components
• x = R cosθ cosφ ; y = R sinθ cosφ ; z = R sinφ.
Volume Velocity Processing … contd
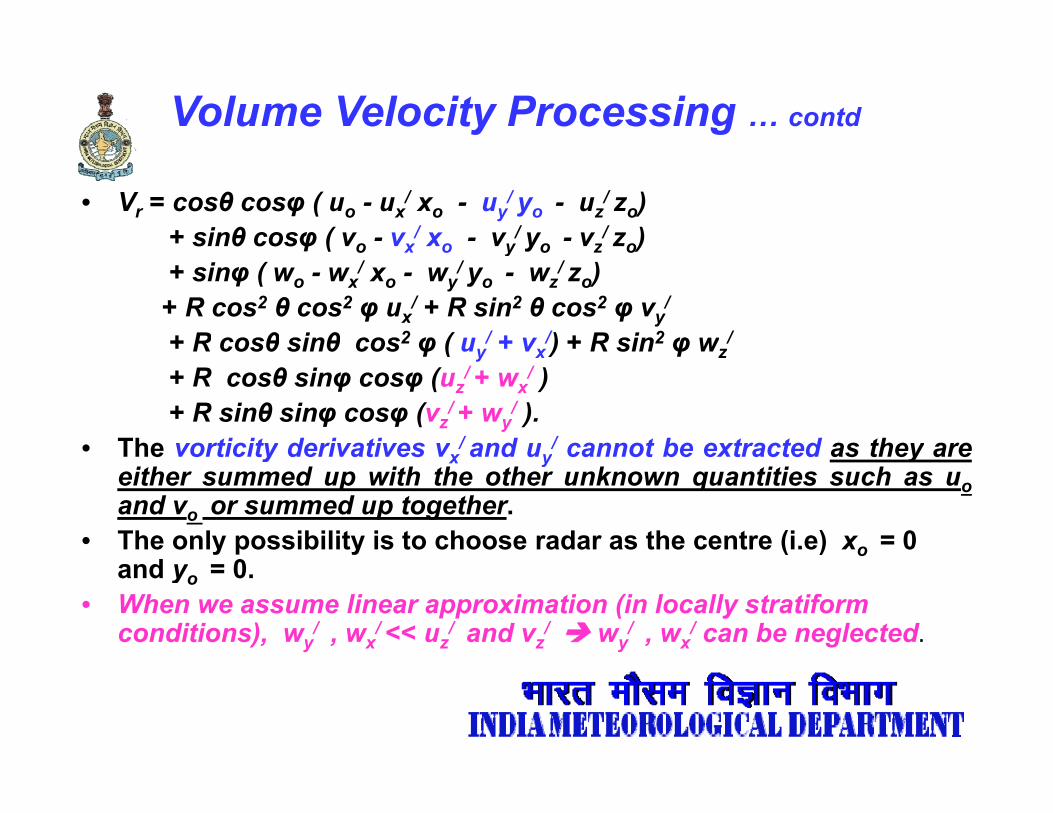
• Vr = cosθ cosφ ( uo - ux/ xo - uy
/ yo - uz/ zo)
+ sinθ cosφ ( vo - vx/ xo - vy
/ yo - vz/ zo)y
+ sinφ ( wo - wx/ xo - wy
/ yo - wz/ zo)
+ R cos2 θ cos2 φ ux/ + R sin2 θ cos2 φ vy
/
+ R cosθ sinθ cos2 φ ( uy/ + vx
/) + R sin2 φ wz/φ ( y x ) φ z
+ R cosθ sinφ cosφ (uz/ + wx
/ )+ R sinθ sinφ cosφ (vz
/ + wy/ ).
• The vorticity derivatives vx/ and uy
/ cannot be extracted as they arey x y yeither summed up with the other unknown quantities such as uoand vo or summed up together.
• The only possibility is to choose radar as the centre (i.e) xo = 0 d 0and yo = 0.
• When we assume linear approximation (in locally stratiform conditions), wy
/ , wx/ << uz
/ and vz/ wy
/ , wx/ can be neglected.
Volume Velocity Processing … contd
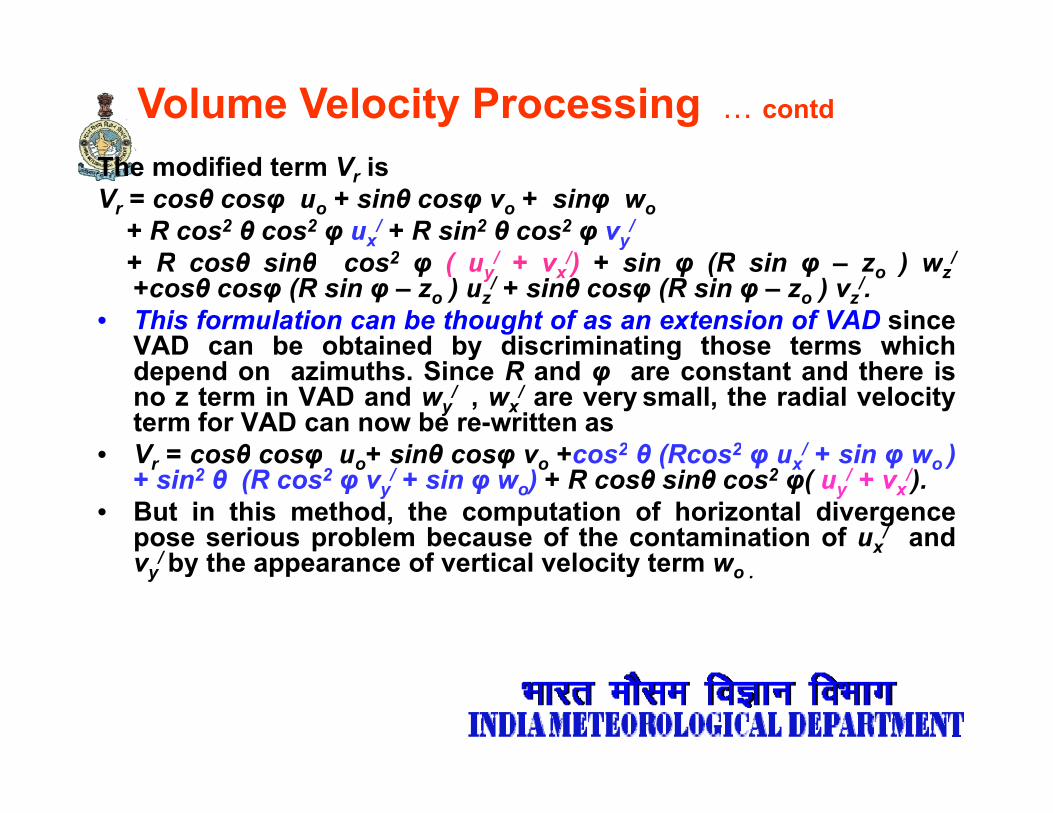
The modified term Vr isVr = cosθ cosφ uo + sinθ cosφ vo + sinφ wo
+ R cos2 θ cos2 φ ux/ + R sin2 θ cos2 φ vy
/
R θ i θ 2 ( / /) i (R i ) /+ R cosθ sinθ cos2 φ ( uy/ + vx
/) + sin φ (R sin φ – zo ) wz/
+cosθ cosφ (R sin φ – zo ) uz/ + sinθ cosφ (R sin φ – zo ) vz
/.• This formulation can be thought of as an extension of VAD since
VAD can be obtained by discriminating those terms whichy gdepend on azimuths. Since R and φ are constant and there isno z term in VAD and wy
/ , wx/ are very small, the radial velocity
term for VAD can now be re-written as• V = cosθ cosφ u + sinθ cosφ v +cos2 θ (Rcos2 φ u / + sin φ w )Vr = cosθ cosφ uo+ sinθ cosφ vo +cos θ (Rcos φ ux + sin φ wo )
+ sin2 θ (R cos2 φ vy/ + sin φ wo) + R cosθ sinθ cos2 φ( uy
/ + vx/).
• But in this method, the computation of horizontal divergencepose serious problem because of the contamination of ux
/ andv / by the appearance of vertical velocity term wvy
/ by the appearance of vertical velocity term wo .
Merits & de-merits of VVP• Vertical profile of prevailing velocity can be plotted around the
radar site ( < 30 km radius)• Horizontal divergence and hence vertical velocity can be
estimated.• Vertical wind shear can be estimated from the hor. wind derived
Validation requires a number of valid upper air wind data from the air craftsfrom the air crafts.
Air lines have been requested by Chennai ROC to provide 1000’ and 1800’ wind data through ATC.
200 valid data received during campaign mode operations 00 a d data ece ed du g ca pa g ode ope at o sJan 2006 – April 2007 (0.03 % of mean daily operations).
Layer Turbulencey
Turbulence
• Turbulence is an aviation hazard. • Of all weather-related commercial aircraft incidents, 65% can beOf all weather related commercial aircraft incidents, 65% can be
attributed to turbulence encounters• Major carriers pay out “tens of millions” per year towards injury
claims by passengers (Dutton and Panofsky, 1970; Knox, 1997; Sharman et al 2005)al., 2005).
• Turbulence is a daunting subject of fluid mechanics and classical physics.
• Turbulence is one of the hardest elements that can be modeled through classical physics and it is an open problem that is yet to be solved (Mandlebrot, 1982).
Turbulence .. contd..
• Turbulence may arise due to thermal and / or dynamic instability.• Forecasting turbulence is somewhat difficult because of lack of• Forecasting turbulence is somewhat difficult because of lack of
objective observational turbulence data. • Turbulence index (TI) has been proposed by various authors to
predict the turbulence using the upper air temperature and wind d tdata.
• Air crews visualized turbulence as bumpiness resulting out of a slow moving air mass (with 10 Kt speed) encountering with a jet stream (with > 60 kts speed).( p )
• Hence, turbulence was often regarded in literature as ‘air pocket’ albeit it is a misnomer.
• Turbulence is a daunting subject in classical physics
Probable areas of turbulence
Convective cloud (Cb)Non convective cloud environmentNon-convective cloud environment
• in the vicinity of thunderstorm• in the vicinity of jet streams• aloft mountainous regionaloft mountainous region• aloft frontal systems• in clear air or when sky is free from clouds.
Layer turbulence
• Since spectrum width (W) is a measure of turbulence.( )• Besides shear products another product of importance to
aviation is the Layer turbulence.• CAPPI (W) is generated for the user defined lower and upper
levels of a layer and for all intermediate levels separated by 125levels of a layer and for all intermediate levels separated by 125 m.
• Maximum value of W for each pixel is picked up and displayed as a plan view in Cartesian display.
• This is similar to top projection seen in a MAX(W) product but for a difference that the exact height of the maximum value is not readily known to the user.
• The layer having moderate to severe turbulence can be easily e aye a g ode ate to se e e tu bu e ce ca be eas yidentified through this product and is quite useful in aviation weather services to issue warning during take-off and landing operations.
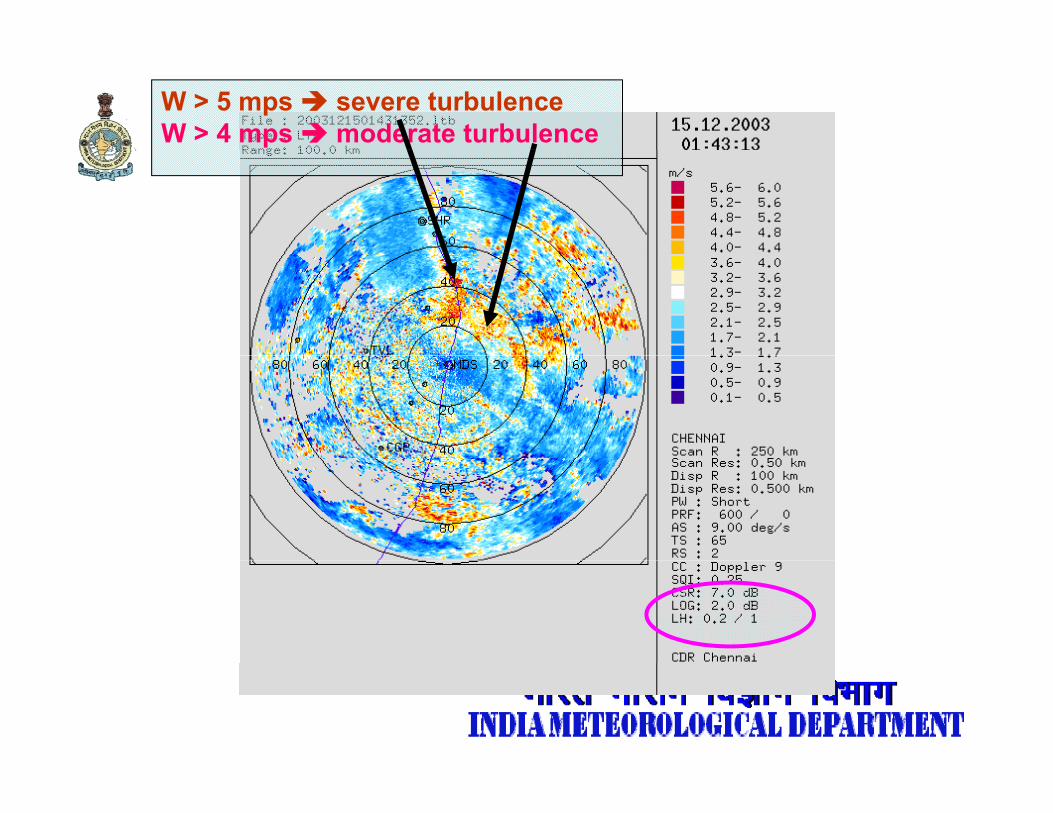
W > 5 mps severe turbulenceW > 4 mps moderate turbulence
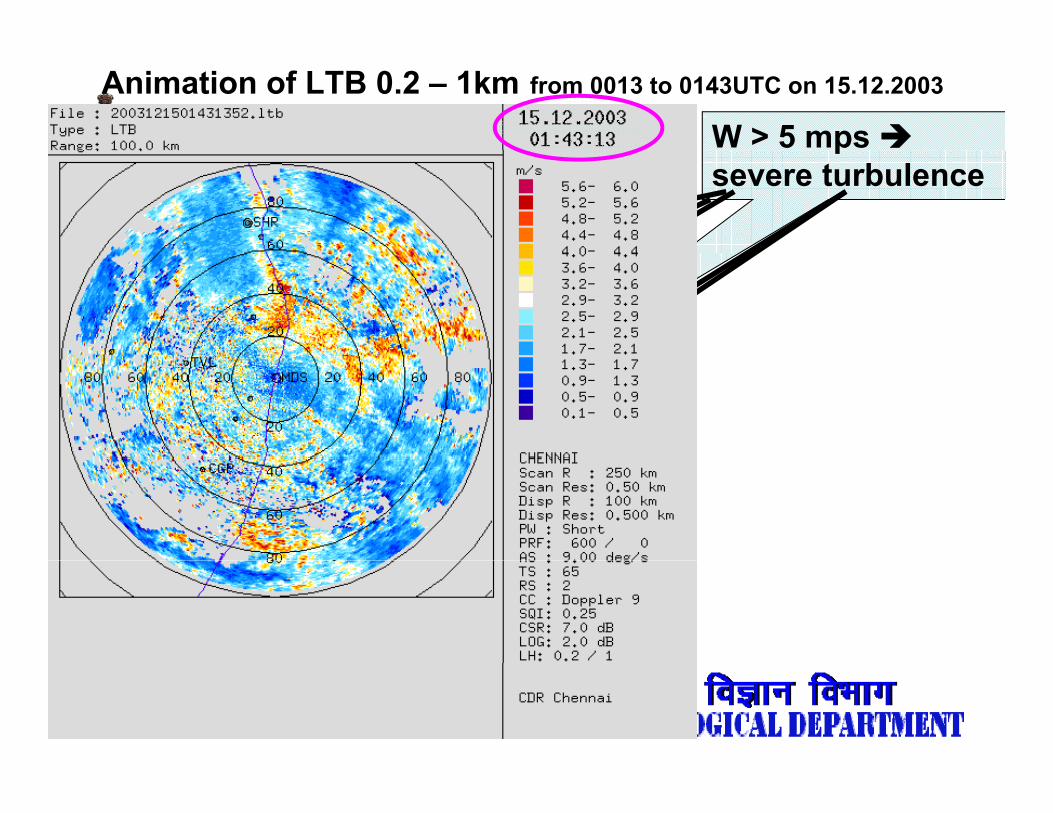
Animation of LTB 0.2 – 1km from 0013 to 0143UTC on 15.12.2003
W > 5 mps psevere turbulence
Turbulence intensities
• Light chop : slight, rapid and somewhat rhythmic bumpiness without noticeable changes in altitude or attitude.
• Moderate chop : moderate and rapid bumps or jolts without• Moderate chop : moderate and rapid bumps or jolts without obvious changes in altitude or attitude.
• Light turbulence : slight, erratic changes in altitude and/or attitude for a brief period.
• Moderate turbulence : moderate, erratic changes in altitude and/or attitude for a noticeable period. Significant variations in indicated air speed. However, the aircraft remains under control at all times.
• Severe turbulence : large abrupt changes in altitude/attitudeSevere turbulence : large, abrupt changes in altitude/attitude. Large variations in indicated airspeed. Aircraft may be temporarily out of control.
• Extreme turbulence : aircraft is violently tossed about and is impossible to control May cause structural damage to the aircraftimpossible to control. May cause structural damage to the aircraft.
• We need to have quantification of turbulence intensity through measurements and NOT qualitative assessments.
Clear Air Turbulence (CAT)
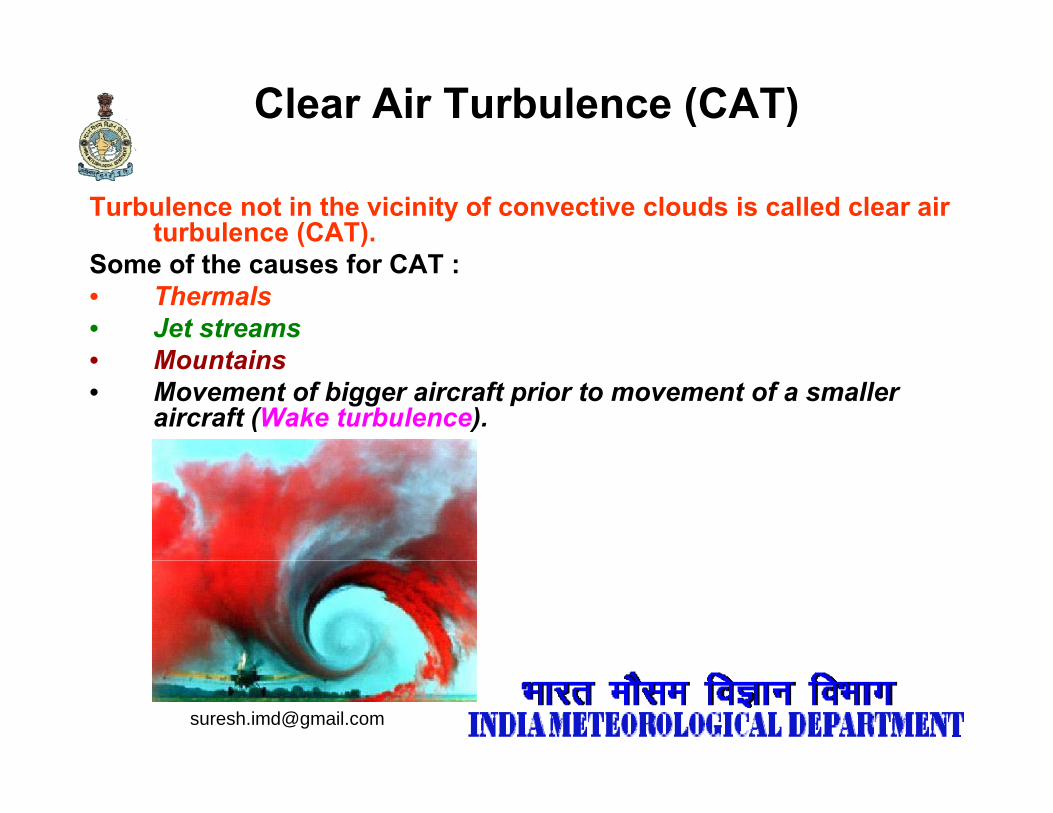
Turbulence not in the vicinity of convective clouds is called clear air turbulence (CAT).
Some of the causes for CAT :• Thermals• Jet streams
Mountains• Mountains• Movement of bigger aircraft prior to movement of a smaller
aircraft (Wake turbulence).
Predictability of CAT (Colson, 1963)
(a) The inclusion of vertical wind shear and wind speed criteria may eliminate some segments along the jet which do not show g g jturbulence.
(b) While the mountain wave associated turbulence usually result from a moderately strong flow normal to the ridge, the need for large horizontal or excessively large vertical wind shears does notlarge horizontal or excessively large vertical wind shears does not appear to be necessary.
(c) Over the regions of major troughs, combination of a large vector horizontal wind shear and a low Richardson number may be most useful besides the vertical motionuseful besides the vertical motion.
(d) Over the regions of high pressure circulations, low Richardson numbers caused by the proper combination of vertical wind shear and low stability in certain layers shall identify the CAT.
Turbulence Intensity estimation
• Modern aircrafts have provision to estimate the intensity of turbulence in an indirect wayturbulence in an indirect way.
• Turbulence is measured using the Inertial Navigation System on board as vertical acceleration ratio to normal gravity.
• The measured value is indicative of light, moderate and severe t b l (Ri k d 1998)turbulence (Rickard, 1998).
• Several thousand such reports are necessary for devising forecast algorithms.
• All aircrafts shall have provision to observe and report intensity ofAll aircrafts shall have provision to observe and report intensity of wind shear and turbulence in quantitative term.
Eddy Dissipation Rate & Turbulence IntensityTurbulence Intensity
Eddy Dissipation Rate (EDR)
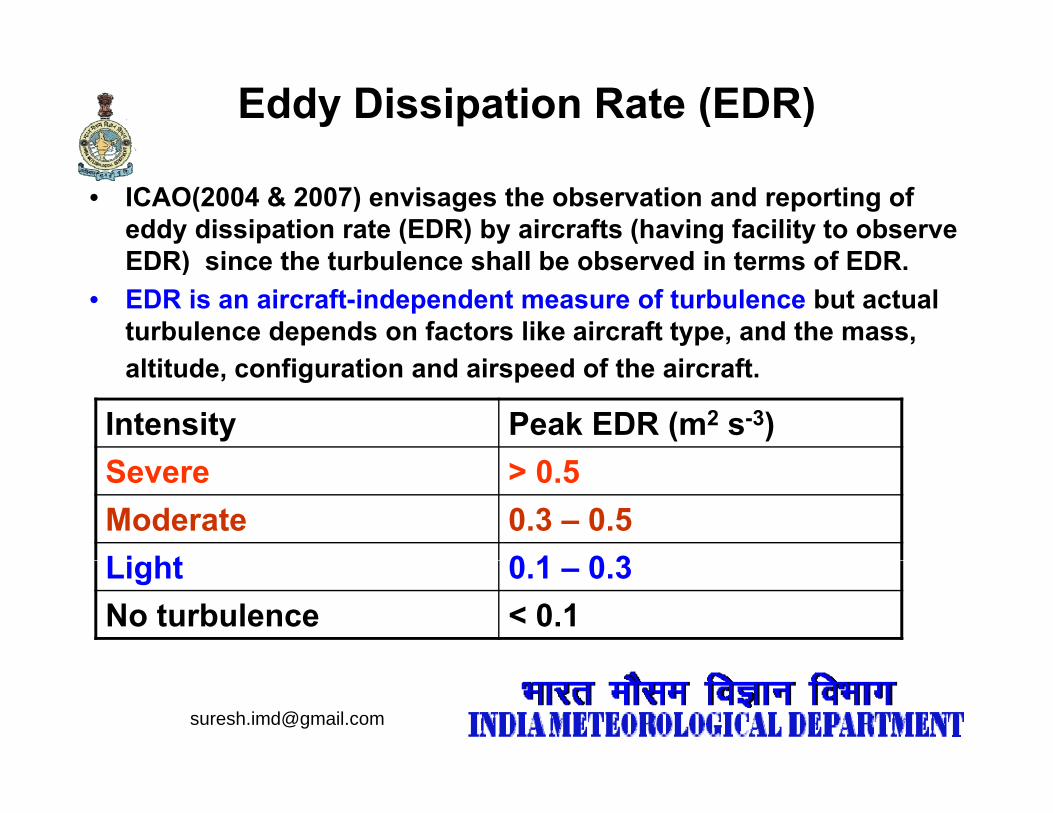
• ICAO(2004 & 2007) envisages the observation and reporting of eddy dissipation rate (EDR) by aircrafts (having facility to observe EDR) i th t b l h ll b b d i t f EDREDR) since the turbulence shall be observed in terms of EDR.
• EDR is an aircraft-independent measure of turbulence but actual turbulence depends on factors like aircraft type, and the mass, altitude, configuration and airspeed of the aircraft.
Intensity Peak EDR (m2 s-3)Severe > 0.5Moderate 0.3 – 0.5Li ht 0 1 0 3Light 0.1 – 0.3No turbulence < 0.1
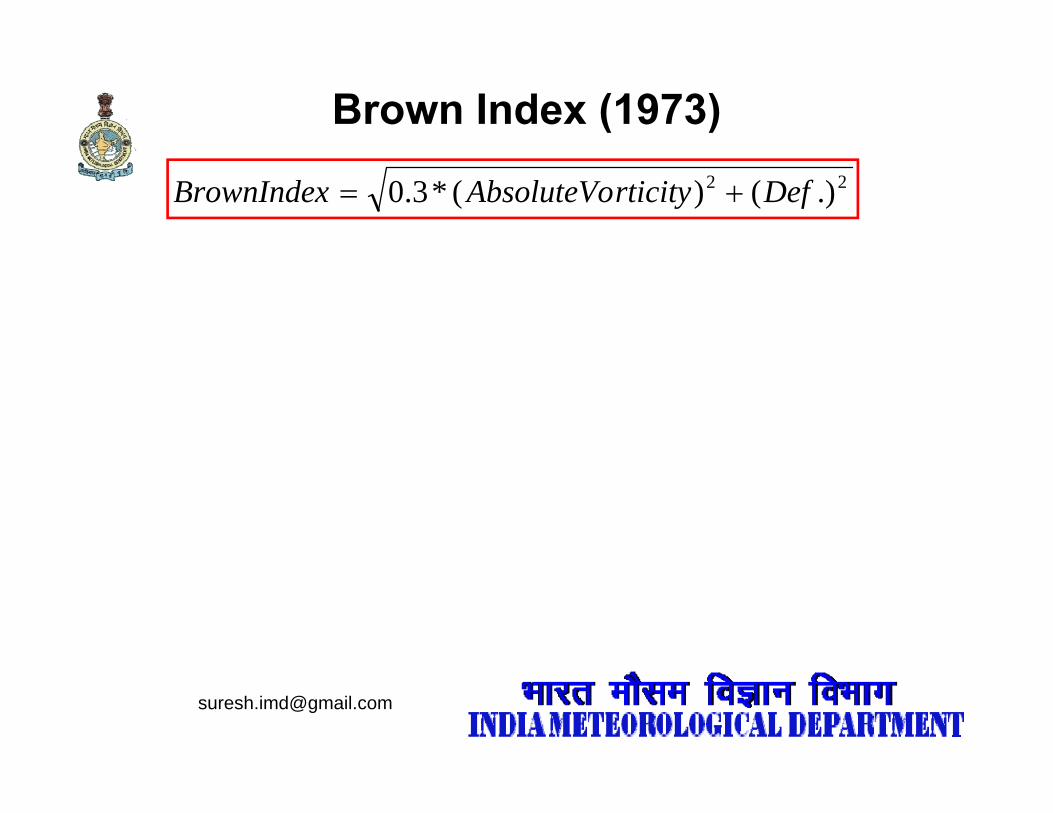
EDR vis-à-vis turbulence
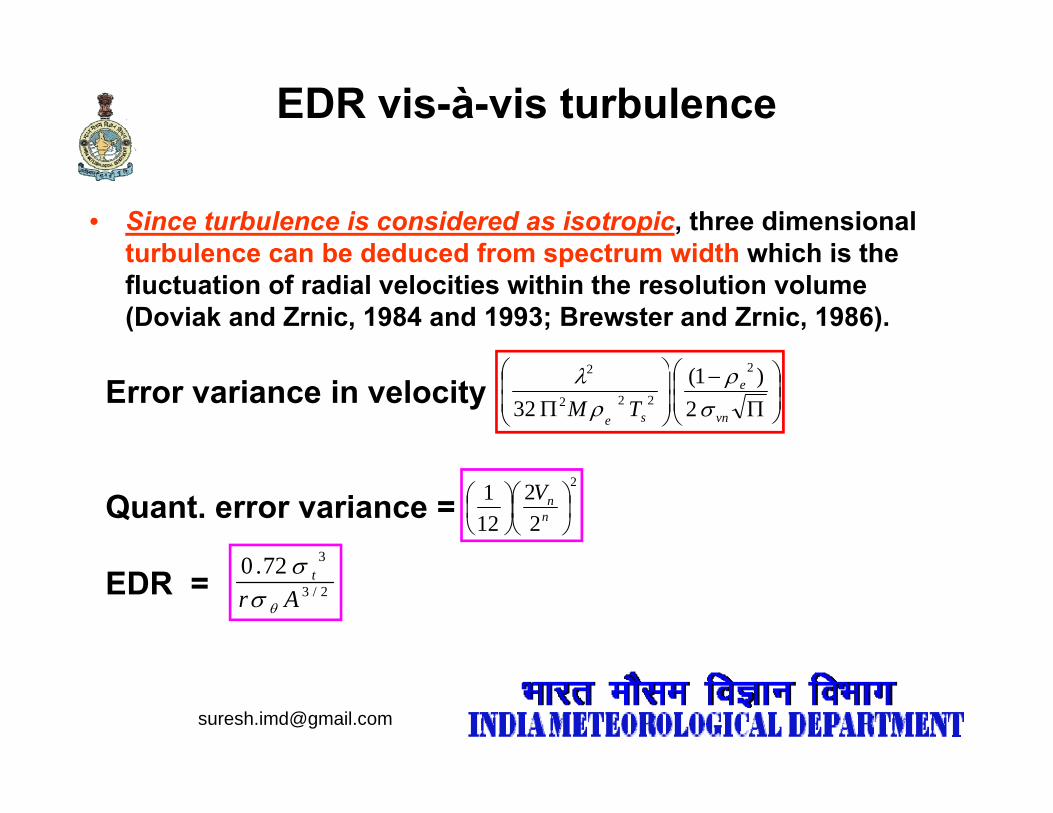
• Since turbulence is considered as isotropic, three dimensional turbulence can be deduced from spectrum width which is theturbulence can be deduced from spectrum width which is the fluctuation of radial velocities within the resolution volume (Doviak and Zrnic, 1984 and 1993; Brewster and Zrnic, 1986).
Error variance in velocity ⎜⎜⎝
⎛⎟⎟⎠
⎞
Π−
⎟⎟⎠
⎞⎜⎜⎝
⎛
Π vn
e
seTM σ
ρρ
λ2
)1(32
2
222
2
Quant. error variance =3720
2
22
121
⎟⎠⎞
⎜⎝⎛⎟⎠⎞
⎜⎝⎛
nnV
EDR = 2/3
372.0Ar
t
θσσ
EDR vis-à-vis turbulence contdEDR vis à vis turbulence .. contd..
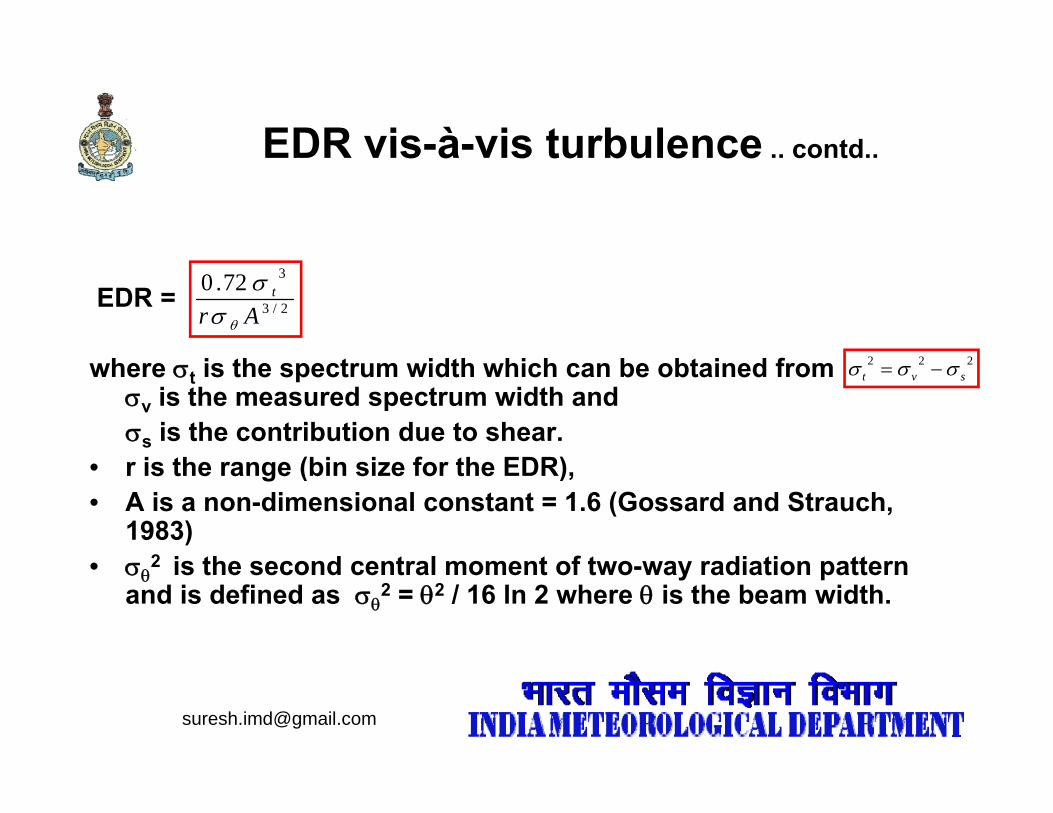
EDR = 2/3
372.0Ar
t
θσσ
where σt is the spectrum width which can be obtained from σv is the measured spectrum width and σs is the contribution due to shear.
i th (bi i f th EDR)
222svt σσσ −=
• r is the range (bin size for the EDR),• A is a non-dimensional constant = 1.6 (Gossard and Strauch,
1983)2 i th d t l t f t di ti tt• σθ2 is the second central moment of two-way radiation pattern
and is defined as σθ2 = θ2 / 16 ln 2 where θ is the beam width.
EDR vis-à-vis turbulence .. contd..EDR vis à vis turbulence .. contd..
• Seven cases of turbulence induced by low level wind shear had ybeen reported by Pilots at Chennai airport during 2006 – 2007 (Suresh,2009).
• Error variance 0.02 and 0.07 m2 s-2 (for 30 minutes prior to and 30 minutes later than the reported timings of seven incidences of moderate p gturbulence)
• In agreement with Brewster and Zrnic (1986). • The quantization error variance is very low at 0.0045 m2 s-2 thus
certifying the veracity of velocitycertifying the veracity of velocity.
Spectrum width Vs Turbulence
• DWR measured spectrum width data can be used as a tool to identify the intensity of turbulenceidentify the intensity of turbulence
• The lowest spectrum width was 3.2 m s-1 on 31.1.2007 and the highest was 4.6 m s-1 on 19.3.2007.
• It may be mentioned here that both these cases were not i t d ith ti l d d l tassociated with any convective cloud development.
• Spectrum width of more than 4 m s-1 is associated with severe turbulence and more than 3 m s-1 is associated with moderate turbulence (Wilson et al, 1984). ( , )
Ch i i d h b tiChennai wind shear observations
Year
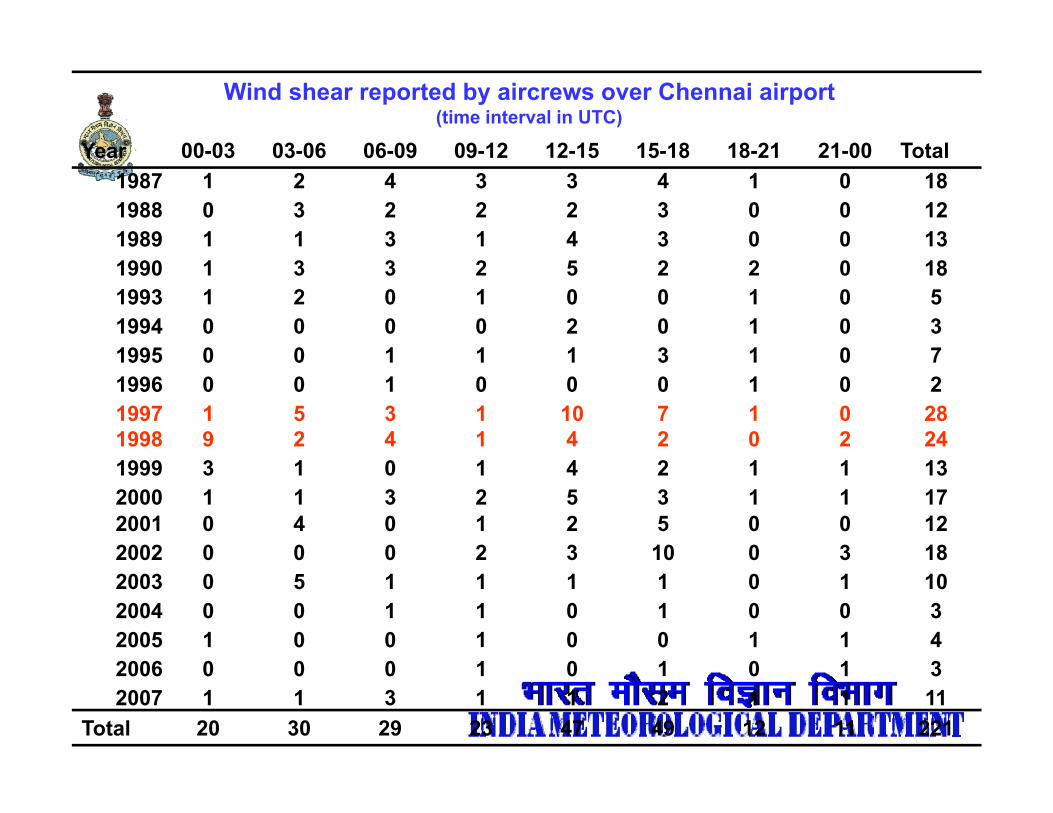
Wind shear reported by aircrews over Chennai airport(time interval in UTC)
Total00 03 03 06 06 09 09 12 12 15 15 18 18 21 21 00Year Total00-03 03-06 06-09 09-12 12-15 15-18 18-21 21-001987 1 2 4 3 3 4 1 0 181988 0 3 2 2 2 3 0 0 121989 1 1 3 1 4 3 0 0 131990 1 3 3 2 5 2 2 0 181993 1 2 0 1 0 0 1 0 51994 0 0 0 0 2 0 1 0 31995 0 0 1 1 1 3 1 0 71995 0 0 1 1 1 3 1 0 71996 0 0 1 0 0 0 1 0 21997 1 5 3 1 10 7 1 0 281998 9 2 4 1 4 2 0 2 241999 3 1 0 1 4 2 1 1 132000 1 1 3 2 5 3 1 1 172001 0 4 0 1 2 5 0 0 122002 0 0 0 2 3 10 0 3 182003 0 5 1 1 1 1 0 1 102004 0 0 1 1 0 1 0 0 32005 1 0 0 1 0 0 1 1 42006 0 0 0 1 0 1 0 1 32006 0 0 0 1 0 1 0 1 32007 1 1 3 1 1 2 1 1 11
Total 20 30 29 23 47 49 12 11 221
LLWS reports
• Reported LLWS frequency accounts to a meager 0.03% of mean operations per day from Chennai airport in campaign mode.y g
• Hong Kong international airport which has been assigned special task of issuing LLWS alert by ICAO has recorded 0.14% of mean daily operations during the campaign period (Cheng, 2002).
• LLWS reports depend upon the interest and working condition of the air crew concerned who is under pressure to safely land / take-off when encountering such wind shear conditions.
• (i e) though the air crew might have experienced LLWS he might• (i.e) though the air crew might have experienced LLWS, he might not have reported the same to the air traffic controllers
(a) by over sight or (b) might have considered as a routine phenomenon or(b) might have considered as a routine phenomenon or (c) considered not fit to be reported.
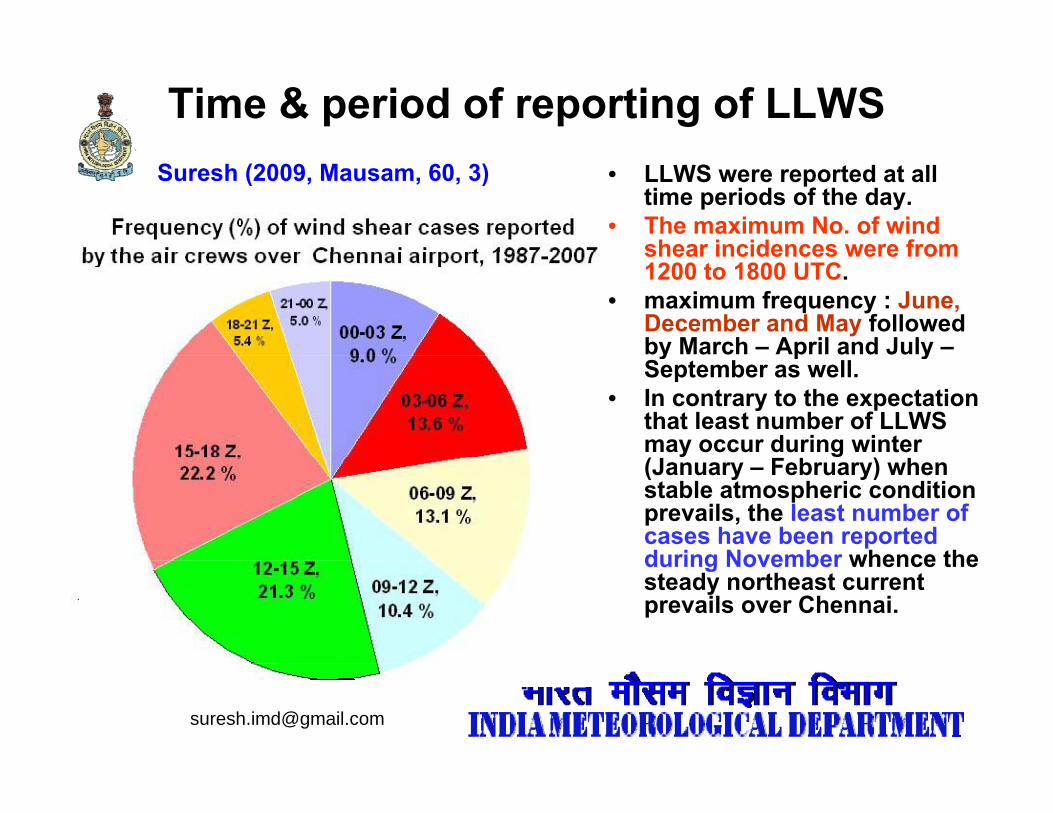
Time & period of reporting of LLWS• LLWS were reported at all
time periods of the day.• The maximum No. of wind
shear incidences were from
Suresh (2009, Mausam, 60, 3)
shear incidences were from 1200 to 1800 UTC.
• maximum frequency : June, December and May followed by March – April and July –y p ySeptember as well.
• In contrary to the expectation that least number of LLWS may occur during winter (J F b ) h(January – February) when stable atmospheric condition prevails, the least number of cases have been reported during November whence theduring November whence the steady northeast current prevails over Chennai.
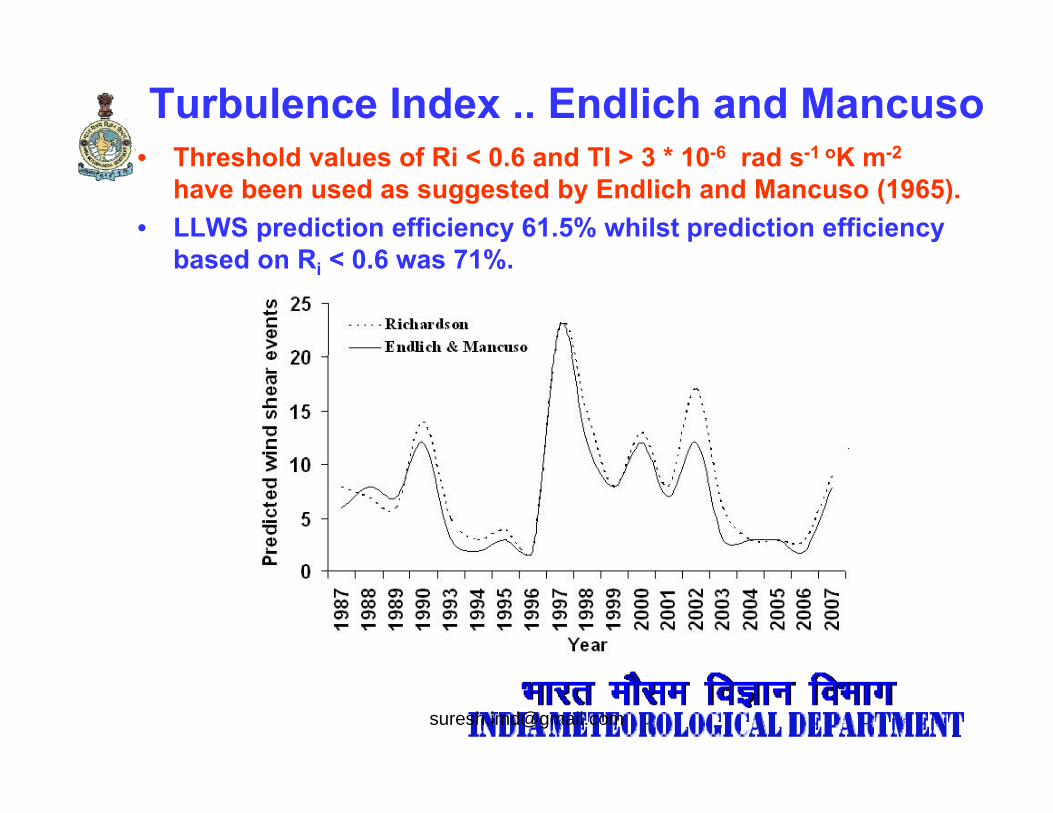
Turbulence Index .. Endlich and MancusoTh h ld l f Ri < 0 6 d TI > 3 * 10 6 d 1 oK 2• Threshold values of Ri < 0.6 and TI > 3 * 10-6 rad s-1 oK m-2
have been used as suggested by Endlich and Mancuso (1965).• LLWS prediction efficiency 61.5% whilst prediction efficiency
b d R < 0 6 71%based on Ri < 0.6 was 71%.
Prolonged active wind shear casesProlonged active wind shear casesover Chennai airport
DWR based 3 Dimensional Shear (3DS)
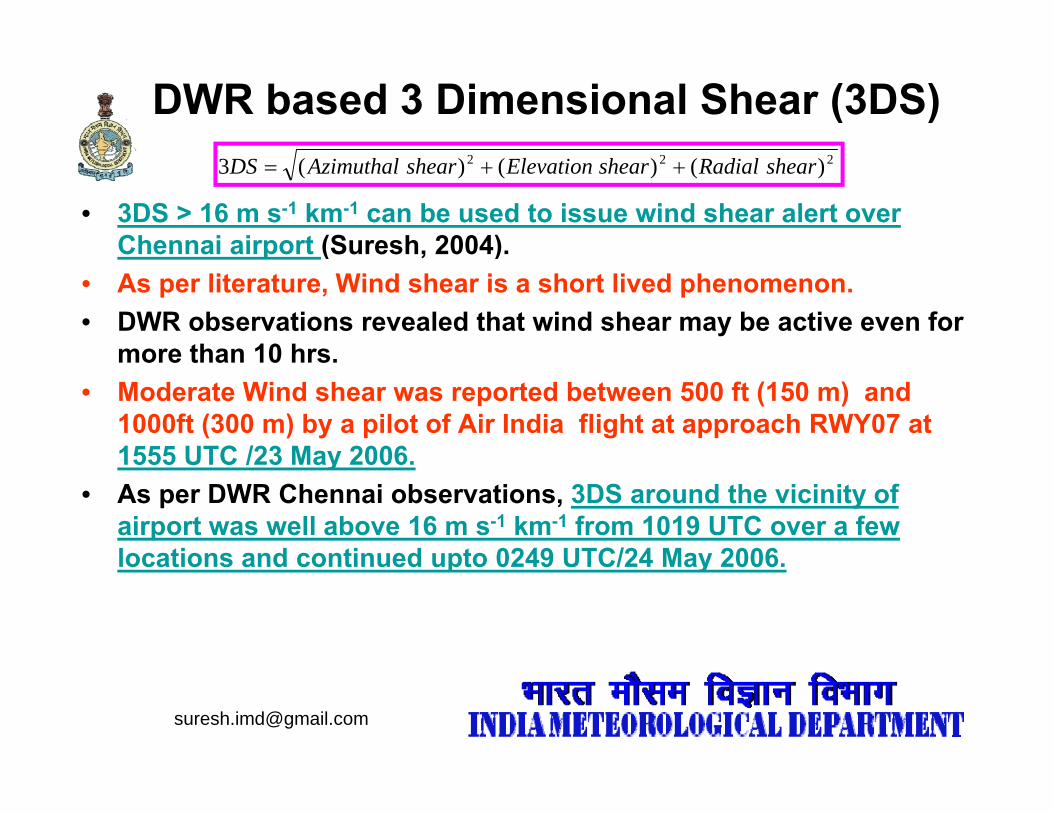
• 3DS > 16 m s-1 km-1 can be used to issue wind shear alert over Chennai airport (Suresh, 2004).
222 )()()(3 shearRadialshearElevationshearAzimuthalDS ++=
Chennai airport (Suresh, 2004).• As per literature, Wind shear is a short lived phenomenon.• DWR observations revealed that wind shear may be active even for
more than 10 hrsmore than 10 hrs.• Moderate Wind shear was reported between 500 ft (150 m) and
1000ft (300 m) by a pilot of Air India flight at approach RWY07 at 1555 UTC /23 May 20061555 UTC /23 May 2006.
• As per DWR Chennai observations, 3DS around the vicinity of airport was well above 16 m s-1 km-1 from 1019 UTC over a few locations and continued upto 0249 UTC/24 May 2006locations and continued upto 0249 UTC/24 May 2006.
Prolonged wind shear .. 15 March 2006
• Indian Airlines aircrafts at 1038 UTC and 1631 UTC on 15th
March 2006 and 0029 UTC on 16th March 2006 reported winds atMarch 2006 and 0029 UTC on 16 March 2006 reported winds at 1000 ft and 1800 ft.
• DWR observations indicate the prevalence of moderate LLWS from 1419 UTC/15th March 2006 upto early morning of 16th
March 2006March 2006.• As many as 62 landing operations during the time interval
stated above.Interaction with air crews / airline agencies reveal thatg
the Pilots are habituated with moderate / severe LLWS over Chennai their concentration is to have a safe landing and subsequent take off operations in limited time spantake-off operations in limited time spanthere was no time even to de-brief.
Necessity of feedback and reporting ofNecessity of feedback and reporting of wind shear cases by aircrews
Necessity of Pilot’s inflight report
• Prolonged LLWS cases on 15th March and 23rd May 2006 were brought to the notice of air line operatorsbrought to the notice of air line operators.
• ICAO(2004 & 2007) guidelines on reporting LLWS were informed for the safe conduct of aviation services.
• The necessity of in-flight / debriefing report on wind shear / y g g pturbulence was stressed repeatedly through various forums.
• The necessity of feedback / in-flight report or de-briefing is inevitable to operationalise the 3DS threshold already arrived at. (Suresh 2004)(Suresh, 2004).
Necessity of feedback from air crews
• Wind shear can be active for many hours – a few recent cases(Suresh, 2009a & 2009b). ( , )
• The current practice of using the reported wind shear as a supplementary information in METARs for the next 2 hours may not be sufficient in the context of air safety.
• However unless in-flight report and/or de-brief information about• However, unless in-flight report and/or de-brief information about cessation of wind shear condition is received from the air crews, there is no alternative method than to continue the existing practice. Si bl d t b LLWS i b l t i it bl t d i• Sizeable database on LLWS is absolute inevitable to devise an alert strategy based on conventional & DWR data.
• Attempt made at Heathrow airport in the year 1977 (Roach, 1981) need to be followed to make the de-briefing mandatory.g y
• The response for the efforts we made during 2006-2008 at Chennai is not encouraging.
LLWS reports
• The LLWS frequency accounts to a meager 0.03% of mean operations per day from Chennai airportoperations per day from Chennai airport.
• Hong Kong international airport which has been assigned special task of issuing LLWS alert by ICAO has recorded 0.14% of mean daily operations during the campaign period (Cheng, 2002).daily operations during the campaign period (Cheng, 2002).
• LLWS reports depend upon the interest and working condition of the air crew concerned who is under pressure to safely land / take-off when encountering such wind shear conditions.
• (i.e) though the air crew might have experienced LLWS, he might not have reported the same to the air traffic controllers
(a) by over sight or (b) might have considered as a routine phenomenon or (c) considered not fit to be reported.
Instrumentation needed at airports
• The wind profilers have a sampling area 150 X 150 X 300 m at one d f th RWYend of the RWY.
• It is necessary to have more than one wind profiler in order to detect wind shear over approach area at either ends of RWY(s)
• As such, installation of wind profiler(s) may cost more in comparison to the installation of a single 360o azimuthal and elevation scanning DWR (TDWR).
Proposed LLWS detection network in India
• 8 DWRs already functioning for cyclone / storm surveillance and some of them being used as TDWR as well11 DWR b i i t ll d (2010 2011)• 11 more DWRs are being installed (2010-2011)
• Installation of one LIDAR at New Delhi is on the cards• 3 more LIDARS at Mumbai, Kolkata and Chennai will be
installed based on utility of Delhi proposed LIDAR• Installation of Microwave Radiometer has been proposed for
New Delhi.• A warning decision support system has been proposed for New
Delhi• Based on successful utilisation all major aerodromes will be j
provided all LLWS alert systems.
In-flight, post-flight and de-briefing may enhance our forecast and warning skills.
Coordination and cooperation from aircrews / airline agencies will help us to render yeoman service to the aviation community.
Ch i h l i d d i A 3 t k it d tChange in phraseology is needed in Annex 3 to make it mandatory on the part of Air crews to report wind shear on air safety grounds.
Diagnostic detection of LLWS cases using DWR data 2002 & 2003using DWR data … 2002 & 2003
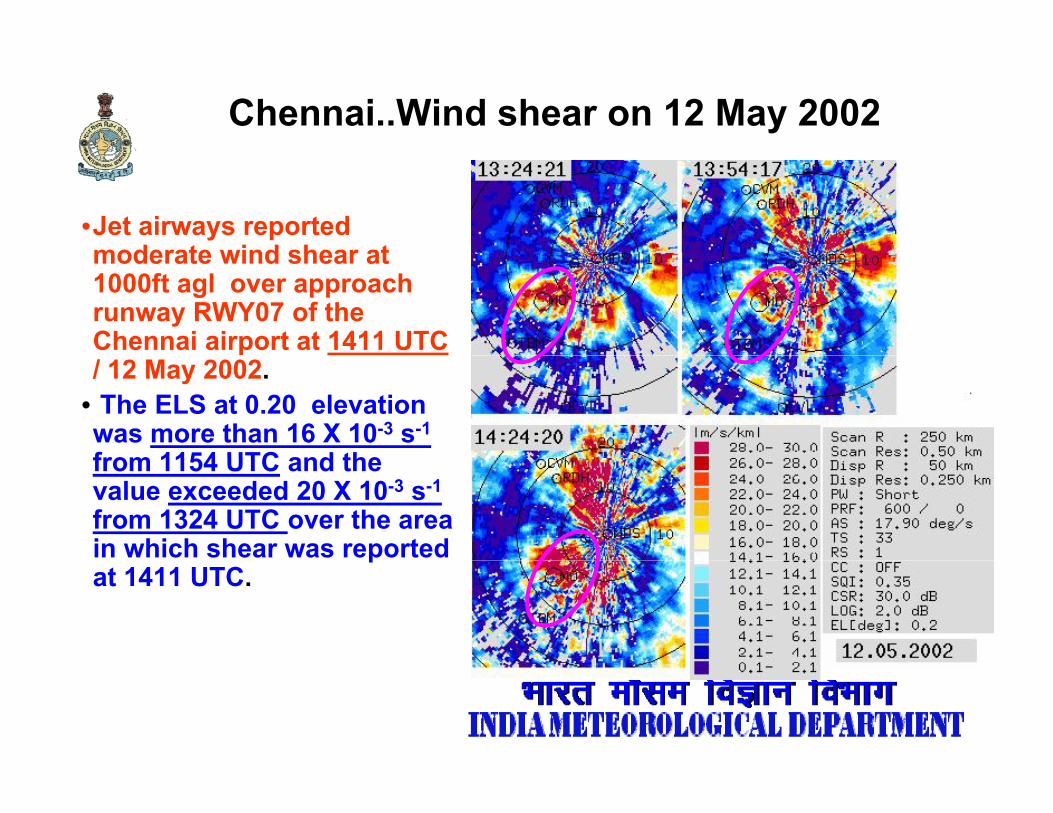
Chennai..Wind shear on 12 May 2002
•Jet airways reported moderate wind shear atmoderate wind shear at 1000ft agl over approach runway RWY07 of the Chennai airport at 1411 UTC/ 12 May 2002.
• The ELS at 0.20 elevation was more than 16 X 10-3 s-1
from 1154 UTC and thefrom 1154 UTC and the value exceeded 20 X 10-3 s-1
from 1324 UTC over the area in which shear was reported pat 1411 UTC.
Chennai..Wind shear on 12 May 2002..contd..
Though the ELS was more than 16 X 10-3 s-1 in south to west quadrant of the radar site as well as to the airport (labeled as MO i th fi ) f 1124UTC d th t b tin the figure) from 1124UTC onwards, there was no report about the wind shear during this period presumably due to any of the following reasons
(i)There could have been aircraft operations in the airfield under(i)There could have been aircraft operations in the airfield under study but the effect of which could have been neither felt nor considered worthy by the pilots for reporting to ATC while passing through the shear region
(ii) no in-flight report was passed on to the ATC by the pilots despite the fact that they might have experienced wind shear
(iii) no operations in this area at all.
Aviation shear - Chennai Airport 1458UTC/17June2002
• At 1458 UTC/17 June 2002, an aircraft over approach RWY07 reported moderate wind shear at an altitude of 2000 ft agl (0.6 km).
• Wind reported was 250/25 kt.• To study this aspect of wind shear induced moderate turbulence,
elevation shear, 3 dim shear, vertical shear etc are computed from Doppler radar wind data and the results are presented.
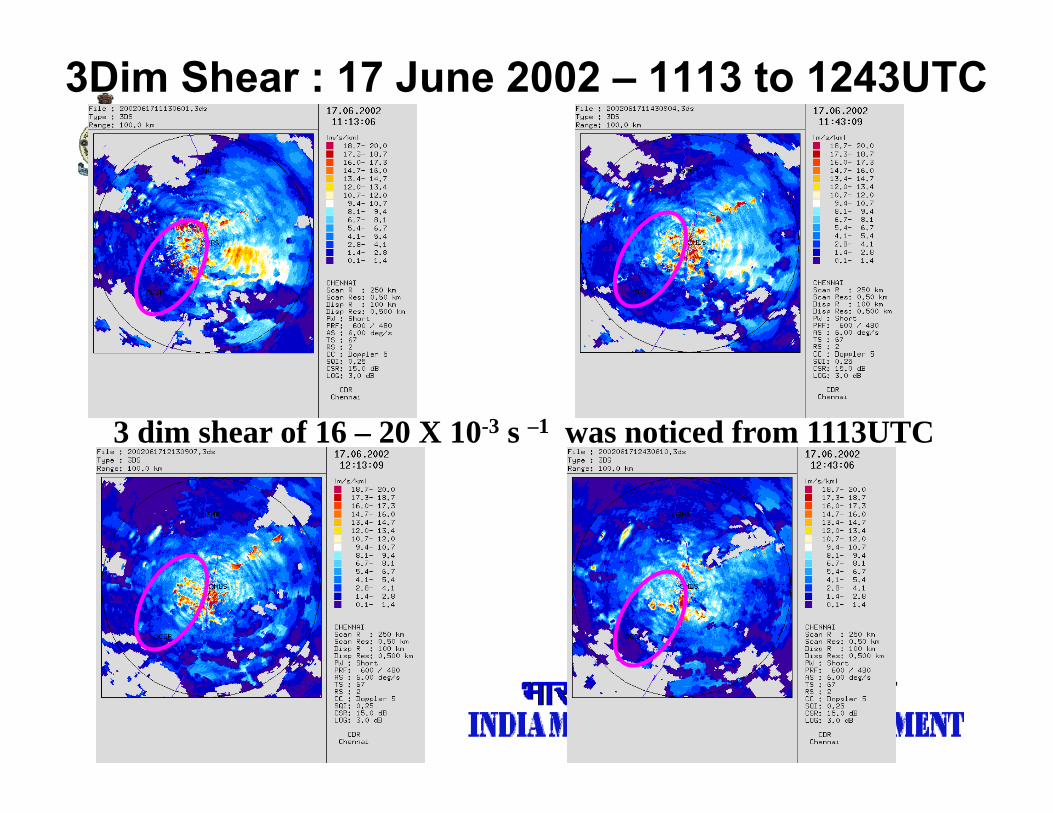
3Dim Shear : 17 June 2002 – 1113 to 1243UTC
3 dim shear of 16 – 20 X 10-3 s –1 was noticed from 1113UTC
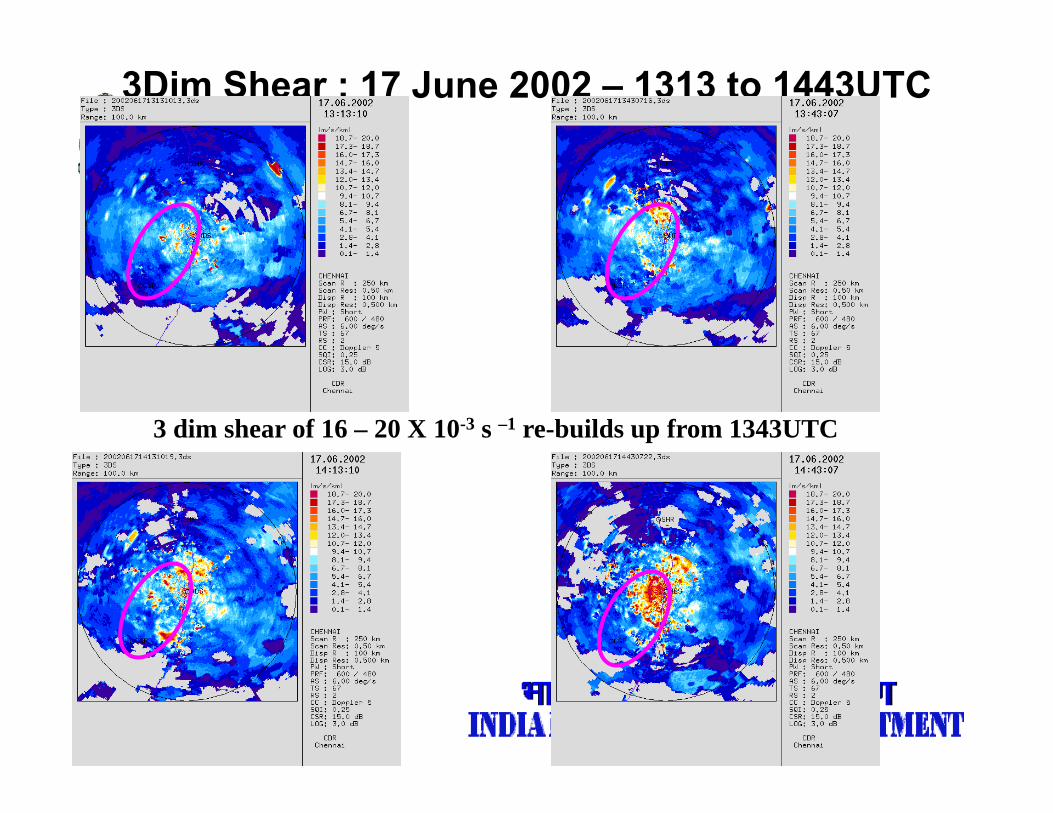
3Dim Shear : 17 June 2002 – 1313 to 1443UTC
3 dim shear of 16 – 20 X 10-3 s –1 re-builds up from 1343UTC
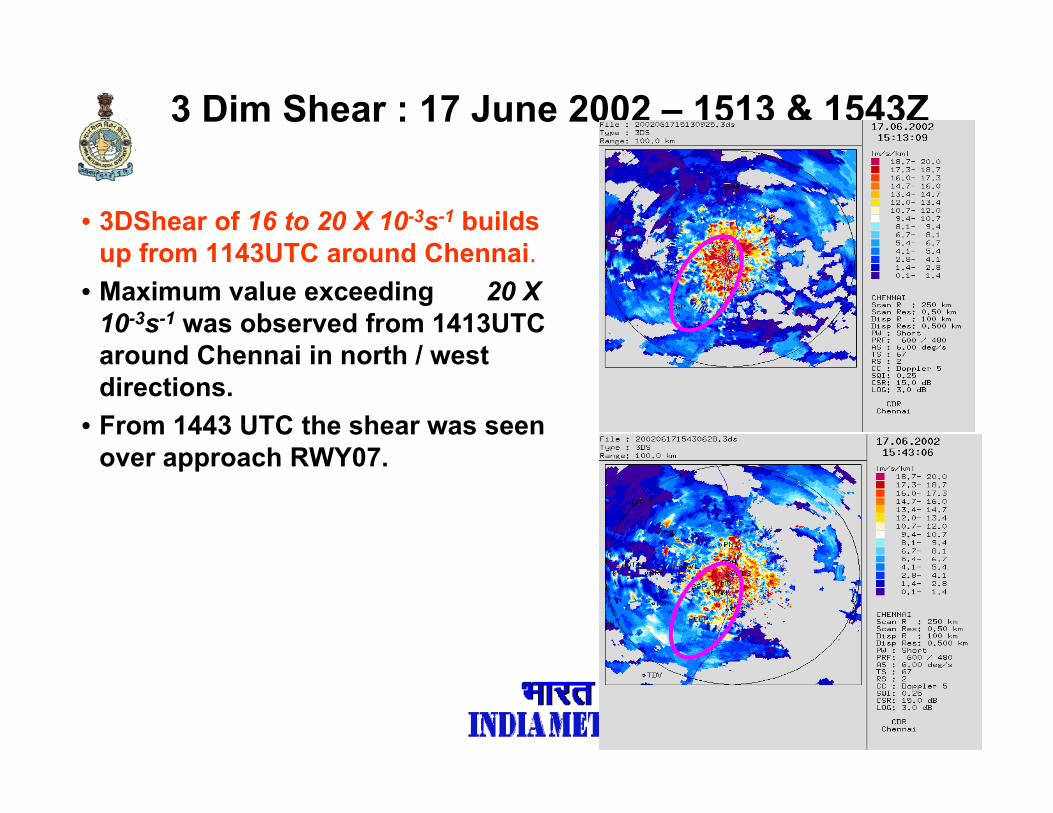
3 Dim Shear : 17 June 2002 – 1513 & 1543Z
• 3DShear of 16 to 20 X 10-3s-1 builds up from 1143UTC around Chennaiup from 1143UTC around Chennai.
• Maximum value exceeding 20 X 10-3s-1 was observed from 1413UTC around Chennai in north / westaround Chennai in north / west directions.
• From 1443 UTC the shear was seen over approach RWY07over approach RWY07.
Moderate wind shear on May 23, 2003
• Indian Airlines Corporation (IAC 932) reported moderate wind shear at FL 010 at 1011 UTC on May 23 2003 at 3 km before theshear at FL 010 at 1011 UTC on May 23, 2003 at 3 km before the touch down point of approach runway 07 (RWY 07).
• At 0945UTC, the 3DS was in the range of 10 – 12mps/km and at 1000 UTC it got increased to 12 – 14 mps/km. Th 3DS f 18 22 /k ti t d t 1015 UTC t 7 k WSW f• The 3DS of 18-22 mps/km estimated at 1015 UTC at 7 km WSW of MO, Chennai supports the wind shear experienced by the pilot at 1011 UTC at 3 km before the touch down point of RWY07 (which is of length 4 km).
• The 3DS of this magnitude was seen around the airport upto 1033 UTC.
• In this case we could not get any advanced information about the possibility of wind shear since 3DS was well below the thresholdpossibility of wind shear since 3DS was well below the threshold value of 16 mps/km.
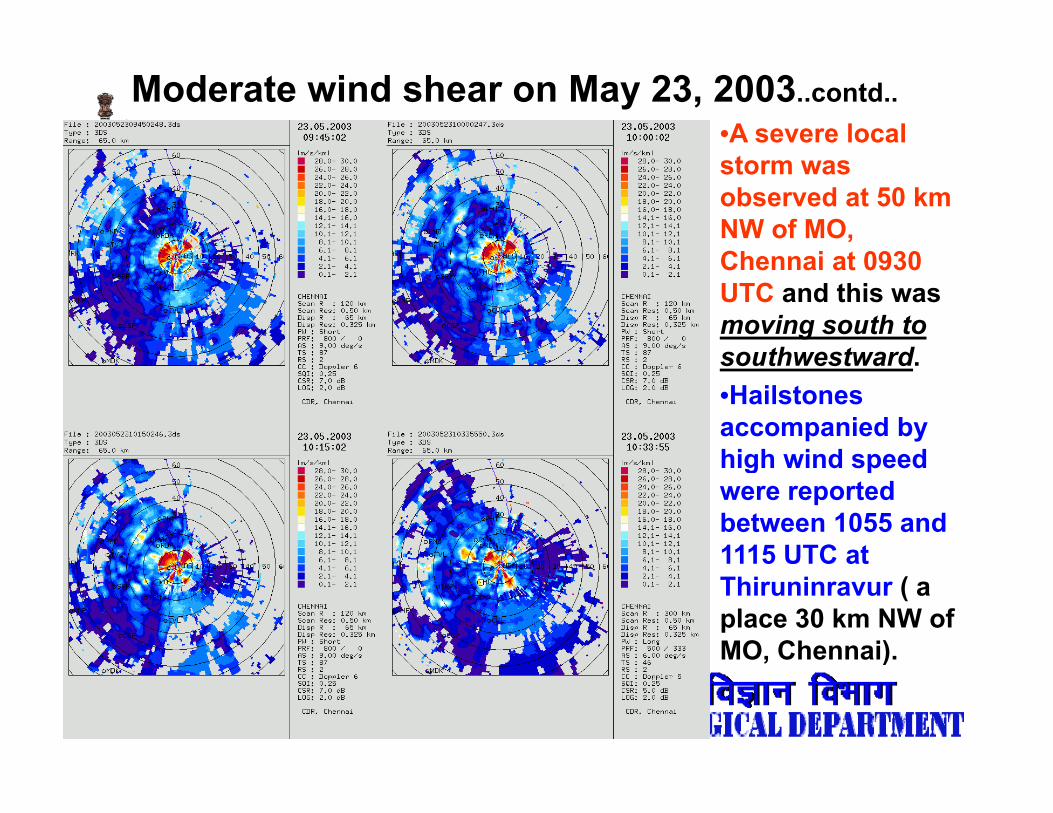
Moderate wind shear on May 23, 2003..contd..•A severe local storm was observed at 50 km NW of MO, Ch i t 0930Chennai at 0930 UTC and this was moving south to southwestwardsouthwestward. •Hailstones accompanied by high wind speedhigh wind speed were reported between 1055 and 1115 UTC at1115 UTC at Thiruninravur ( a place 30 km NW of MO, Chennai)., )
Moderate wind shear on May 23, 2003..contd..
• Since the gust fronts move ahead of the storm atleast by 30-40km (Atlas, 1990; Rinehart, 1999), the contributory mechanism40km (Atlas, 1990; Rinehart, 1999), the contributory mechanismfor the moderate wind shear experienced by the pilot at 1011UTC might have originated from the passage of gust front fromthe severe local storm.
• However, since the storm was maintaining a distance more than30km west of MO, Chennai, the shear experienced near theairport were not of very high order.
• This wind shear incident suggests that one should have a• This wind shear incident suggests that one should have aconstant watch on the track of local and severe local storms inaddition to monitoring of 3DS product generated at frequentintervals to issue wind shear alert.
• This case supports the fact that the wind shear are short livedphenomenon and continuous monitoring should be made toalert the pilot.
Conclusions drawn from wind shear incidents
(i) 3DS > 16mps/km gives a first hand information about the possible f h i th l b t 0 1 d 0 8k l ioccurrence of shear in the layers between 0.1 and 0.8km a.g.l, in a
time frame of 20 minutes to two hours ahead of the actual shear felt and reported by the air crews.
• This threshold obtained from a limited number cases may be• This threshold, obtained from a limited number cases, may be used for issuing wind shear alert / warning on trial basis since it has a prophylactic value.
• The feedback from the air crews about the validity of alert / ywarning only will help us to fine tune the threshold if needed.
(ii) Monitoring of movement of sea breeze front in conjunction with 3DS may be useful to issue wind shear warning.
(iii) The possibility of wind shear in association with gust front mayhave to be kept in mind when 3DS does not throw any light on thechances of wind shear.
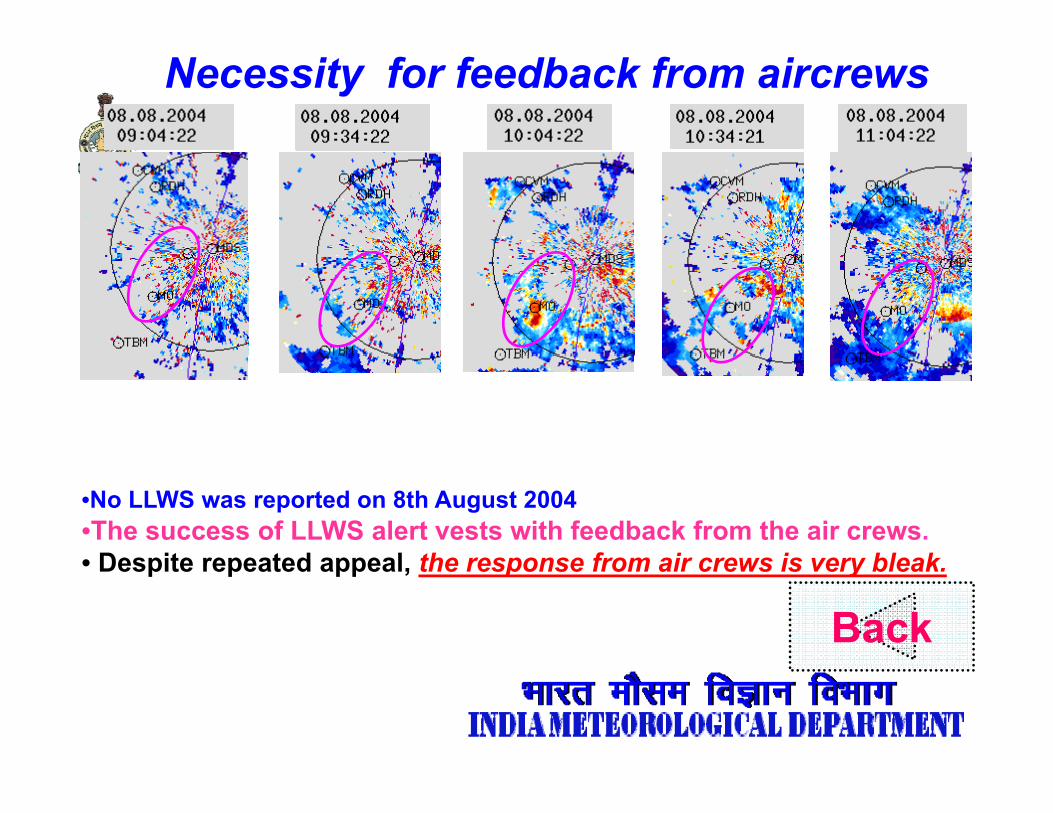
Necessity for feedback from aircrews
•No LLWS was reported on 8th August 2004•The success of LLWS alert vests with feedback from the air crews.• Despite repeated appeal the response from air crews is very bleak• Despite repeated appeal, the response from air crews is very bleak.
Back
P l d i i d hProlonged active wind shear casesChennai airport
Prolonged wind shear .. 15 March 2006
• Indian Airlines aircrafts at 1038 UTC and 1631 UTC on 15th
March 2006 and 0029 UTC on 16th March 2006 reported winds at 1000 ft and 1800 ft1000 ft and 1800 ft.
• DWR observations indicate the prevalence of moderate LLWS from 1419 UTC/15th March 2006 upto early morning of 16th
March 2006.• As many as 62 landing operations during the time interval
stated above.Interaction with air crews / airline agencies reveal that
the Pilots are habituated with moderate / severe LLWS overthe Pilots are habituated with moderate / severe LLWS over Chennai their concentration is to have a safe landing and subsequent take-off operations in limited time spanthere was no time even to de-brief.
Back
Moderate wind shear on 23 May 2006
• Moderate Wind shear was reported between 500 and 1000ft at approach RWY07 at 1555 UTC / 23 May2006. y
• 3DS from 1149 UTC suggests the presence of wind shear around Chennai airport and in NW sector.
• The shear magnitude was very high from 1349 UTC.• The shear was quite active even up to 2349 UTC and from 0019
UTC/24th the shear becomes less important.• The air crews either habituated with this sort of shear or
id d th t i fli ht ti / d b i fi d t b i tconsidered that inflight reporting / de-briefing need not be given to the Met unit directly or through ATC.
• Meteorologist has to necessarily depend on shear information from pilots through ATC or though de-briefing to devise a warningfrom pilots through ATC or though de-briefing to devise a warning strategy through his Doppler Weather Radar data.
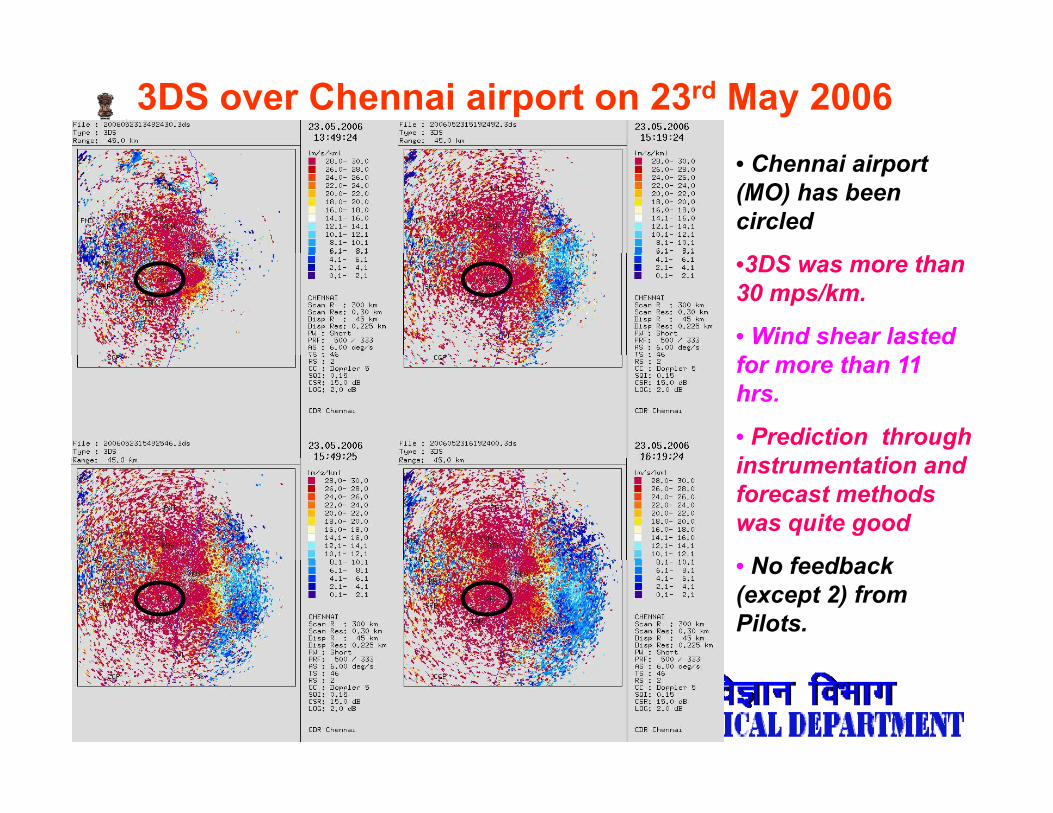
3DS over Chennai airport on 23rd May 2006• Chennai airport (MO) has been circled
•3DS was more than 30 mps/km.
• Wind shear lasted ffor more than 11 hrs.
• Prediction through i t t ti dinstrumentation and forecast methods was quite good
N f db k• No feedback (except 2) from Pilots.
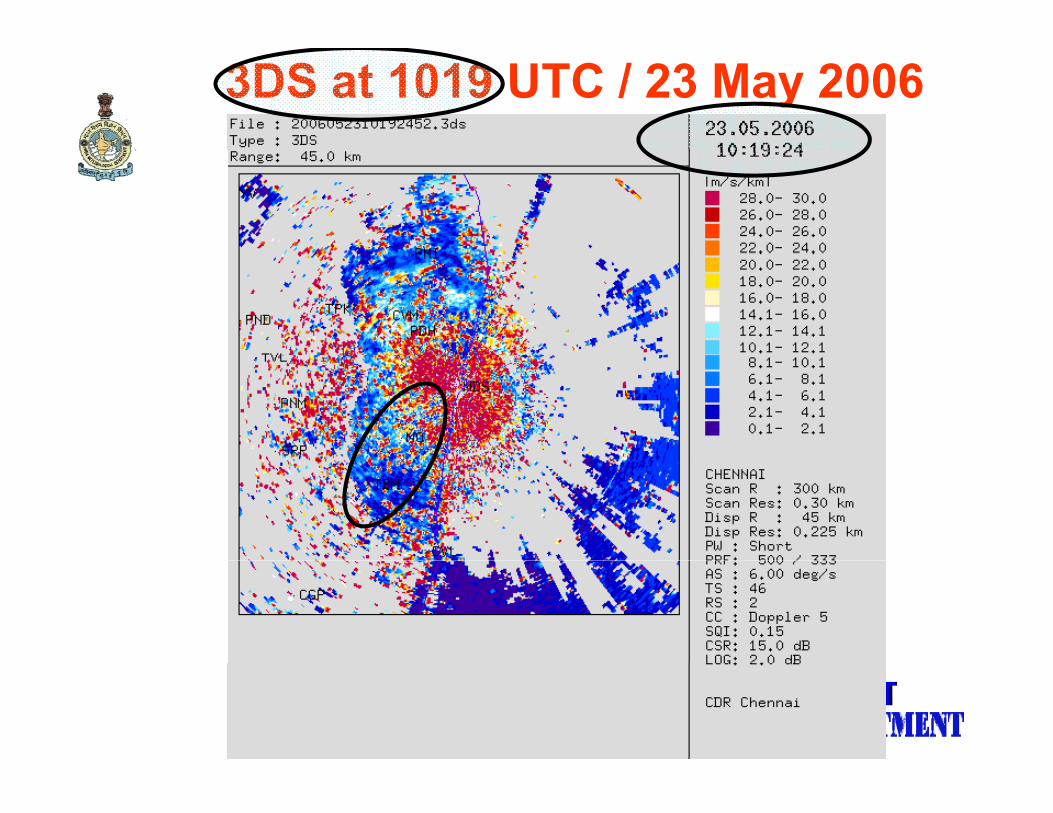
3DS at 1019 UTC / 23 May 2006
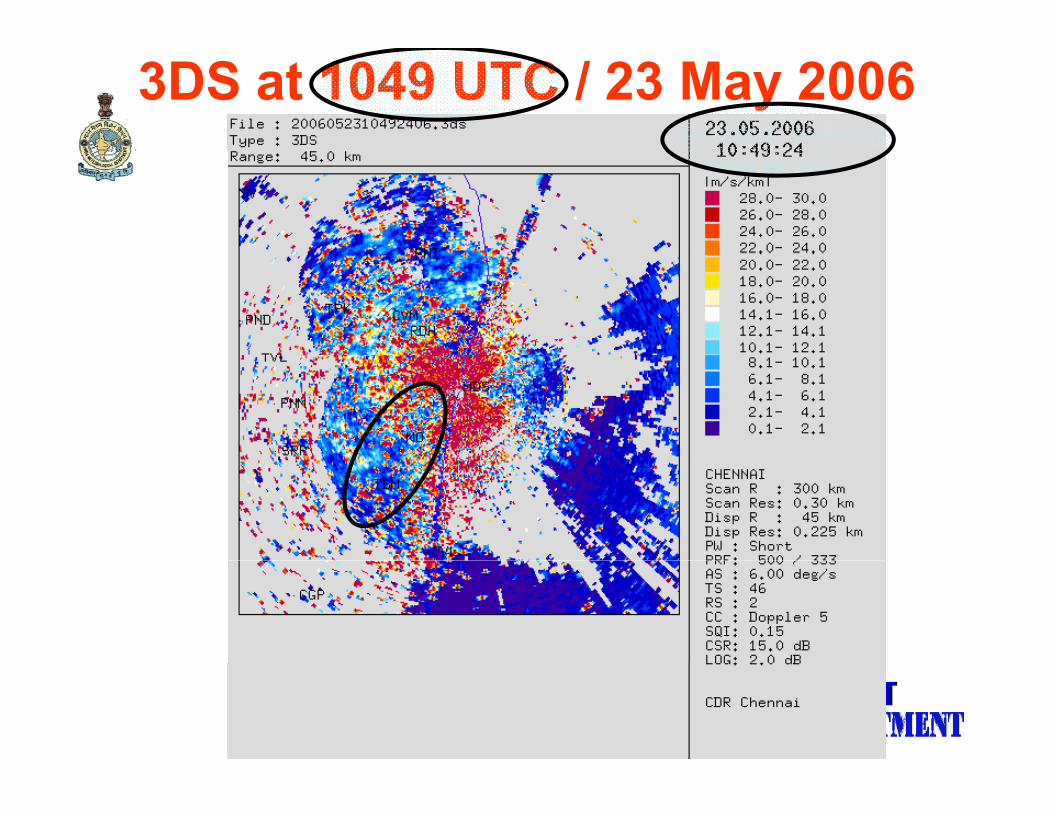
3DS at 1049 UTC / 23 May 2006
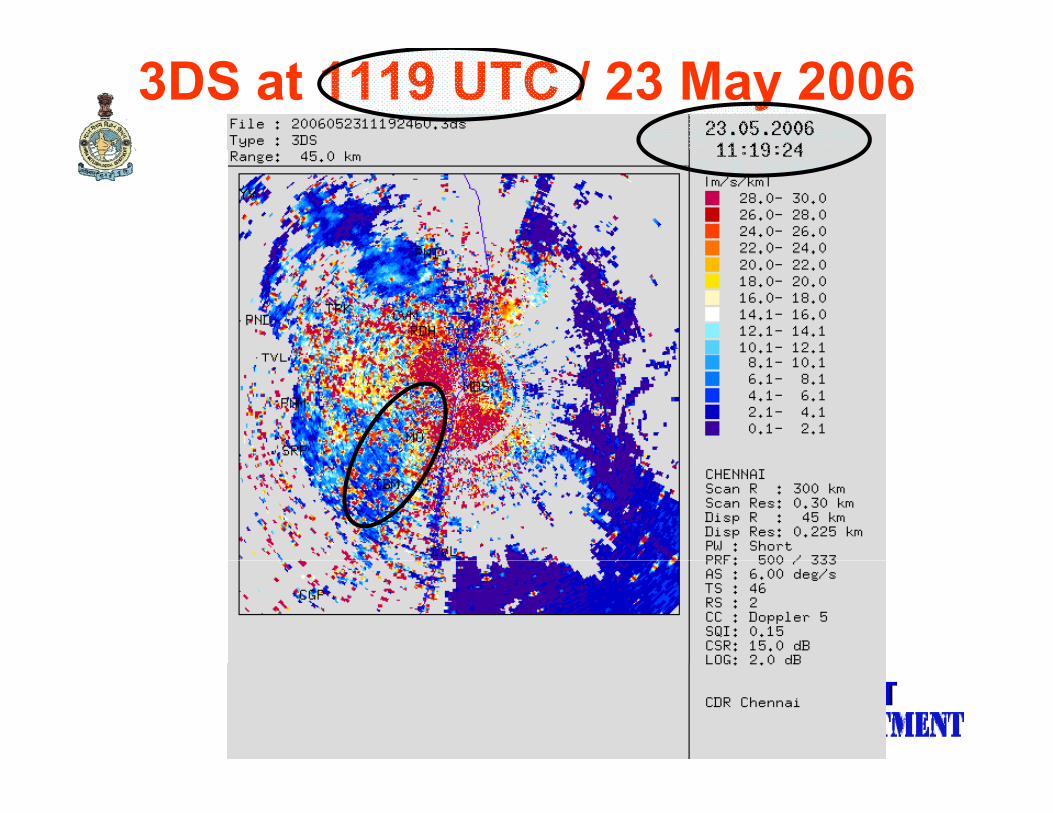
3DS at 1119 UTC / 23 May 2006
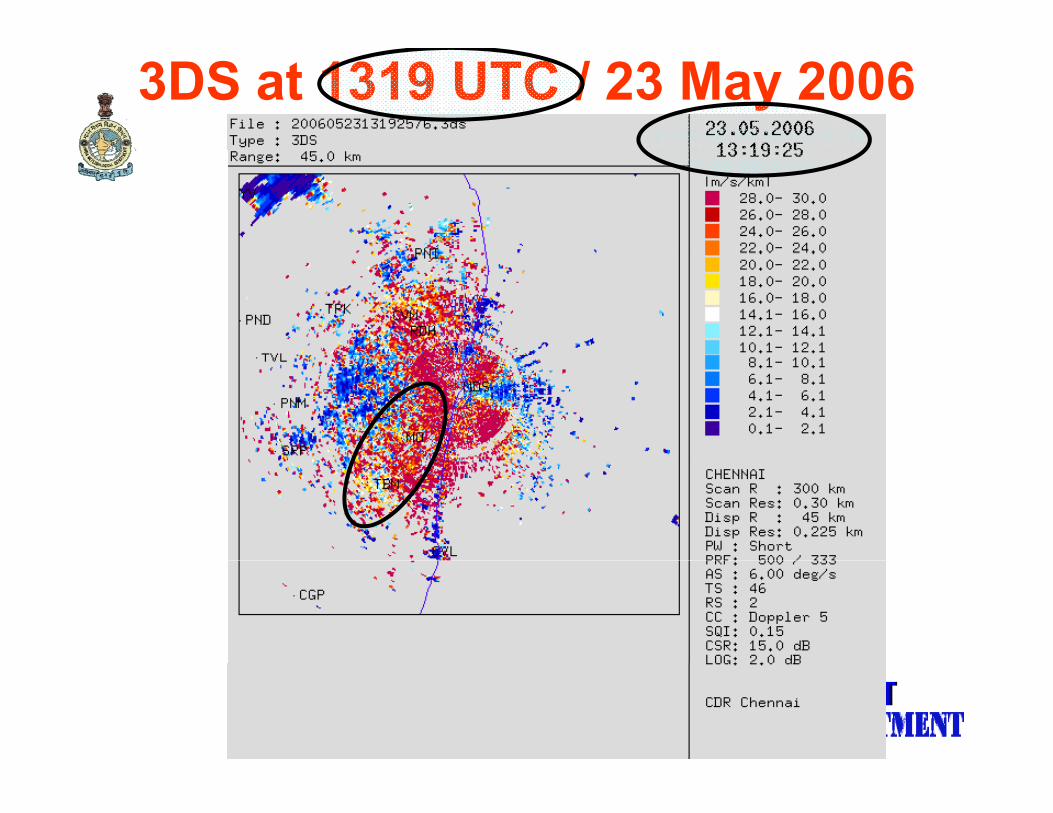
3DS at 1319 UTC / 23 May 2006
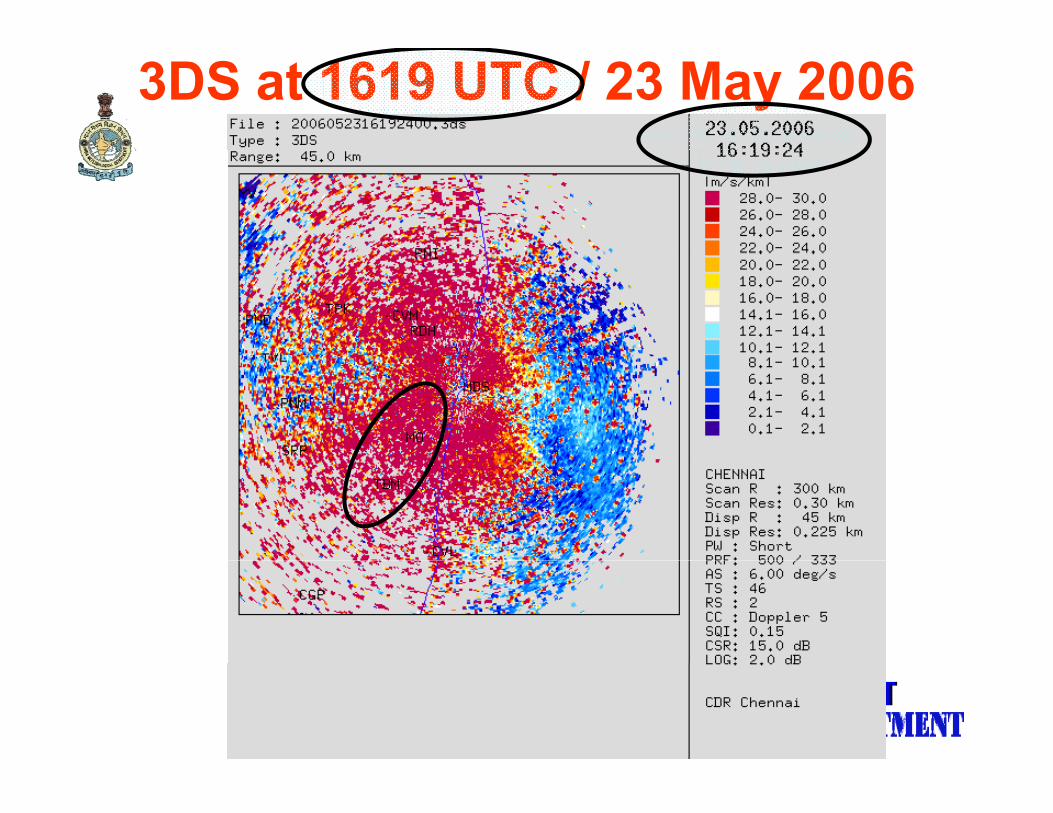
3DS at 1619 UTC / 23 May 2006
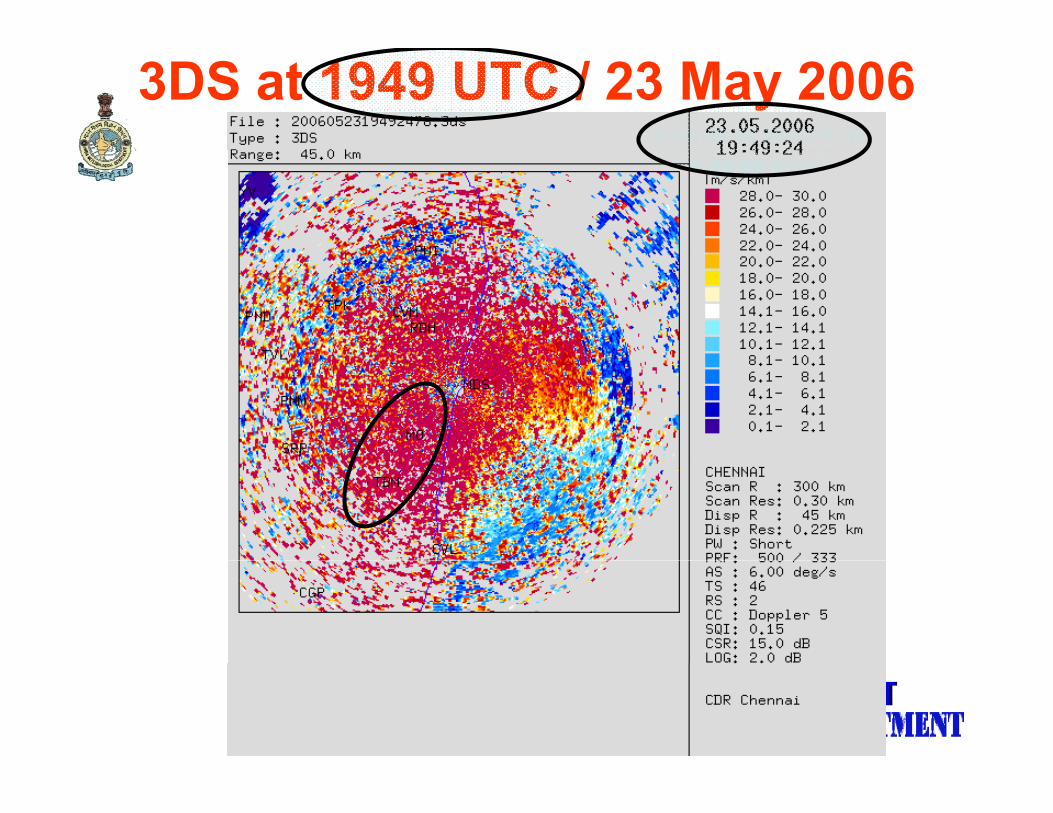
3DS at 1949 UTC / 23 May 2006
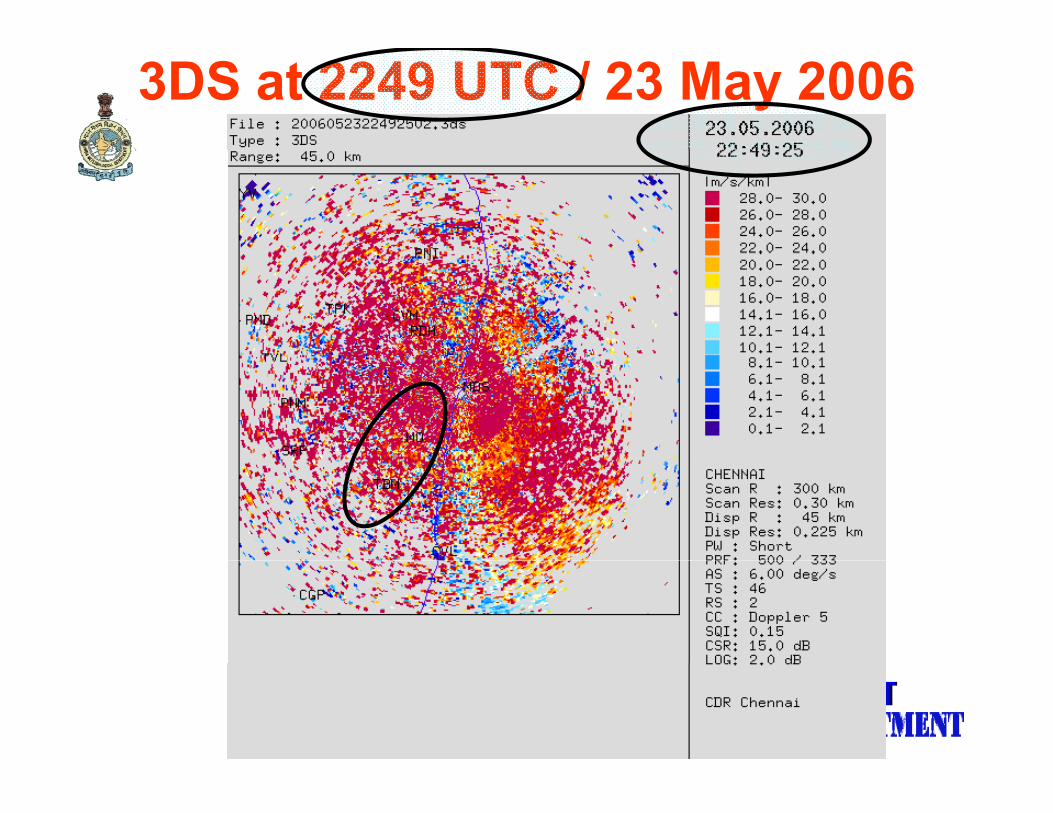
3DS at 2249 UTC / 23 May 2006
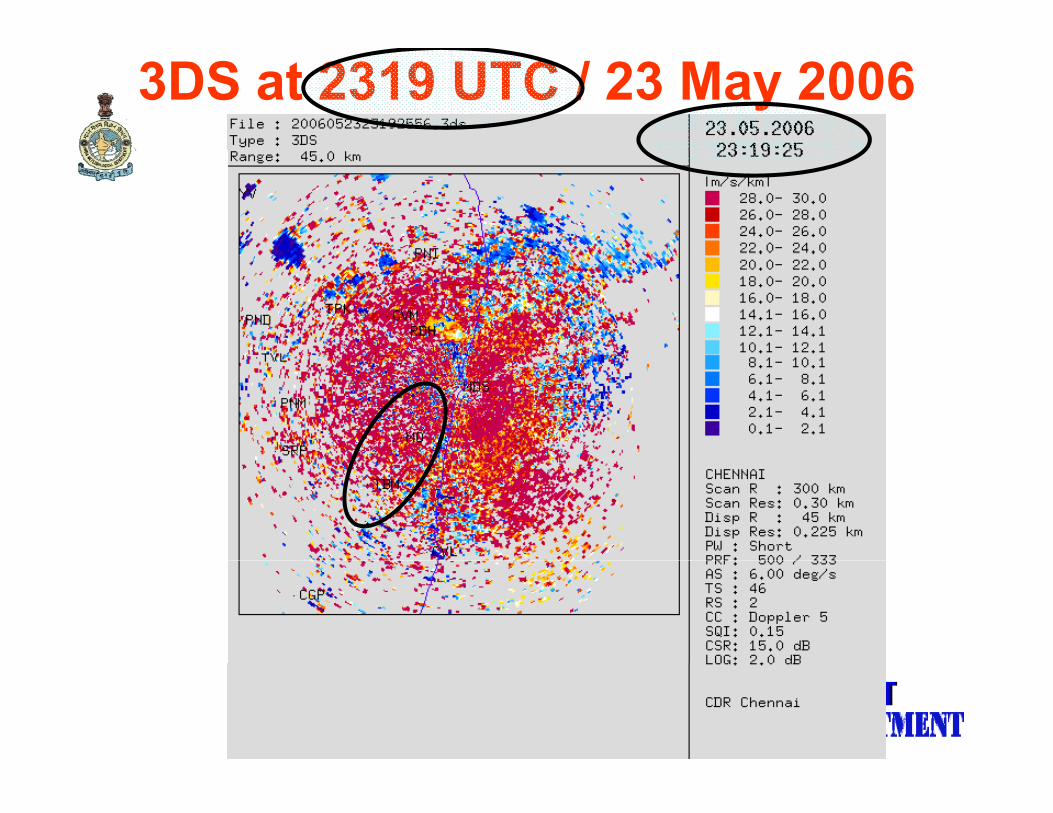
3DS at 2319 UTC / 23 May 2006
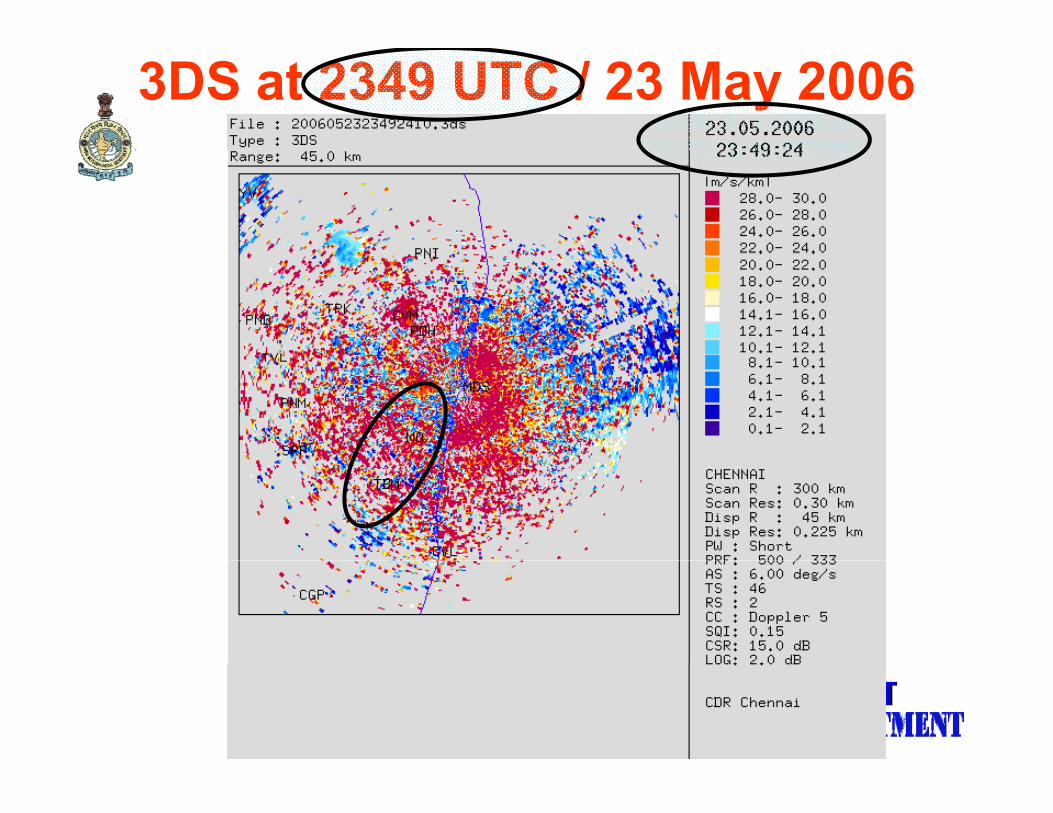
3DS at 2349 UTC / 23 May 2006
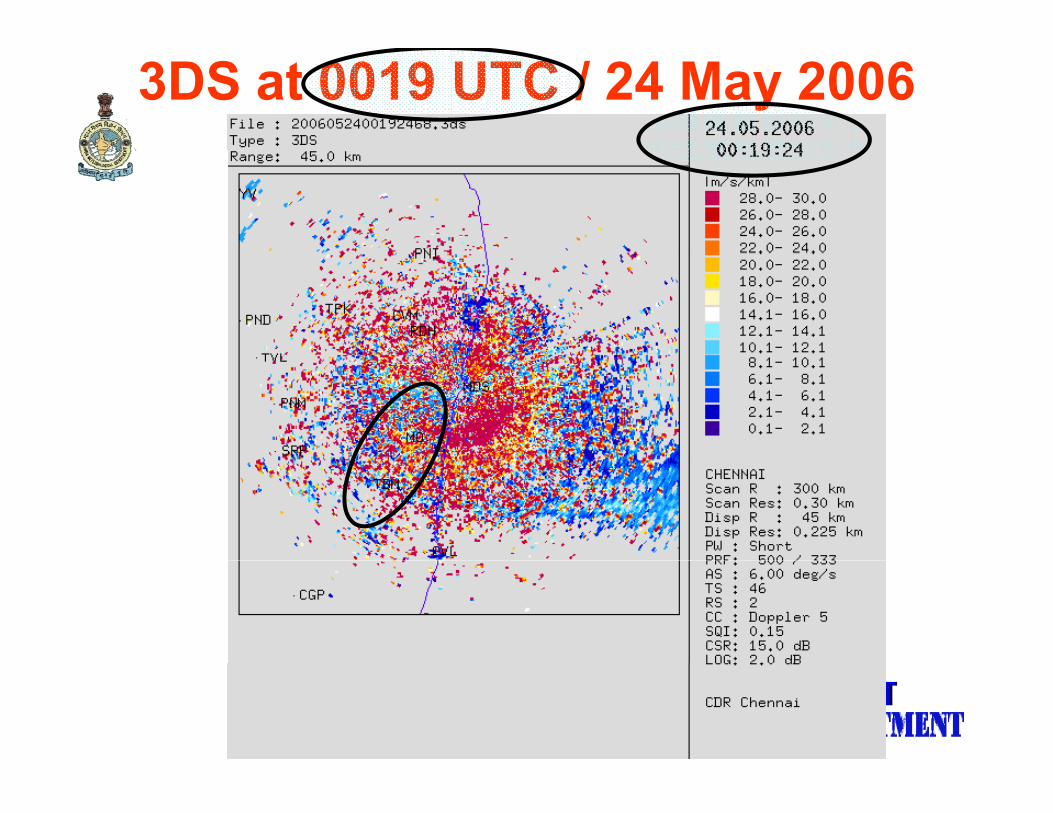
3DS at 0019 UTC / 24 May 2006
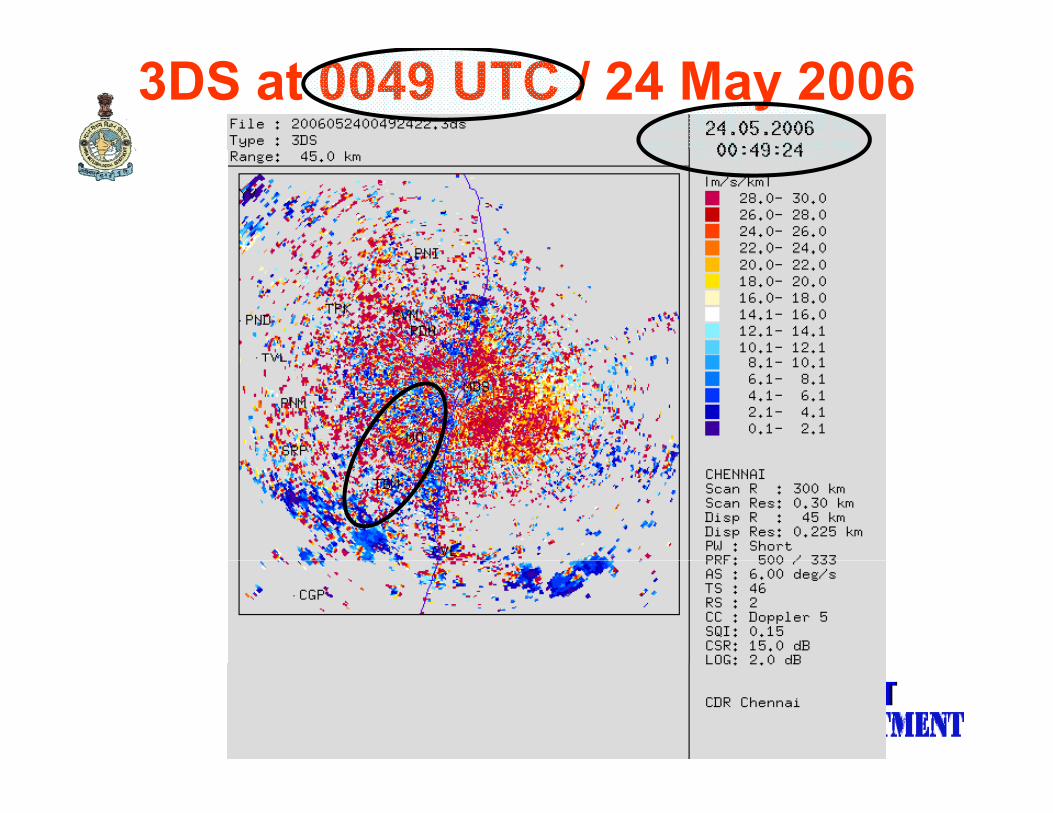
3DS at 0049 UTC / 24 May 2006
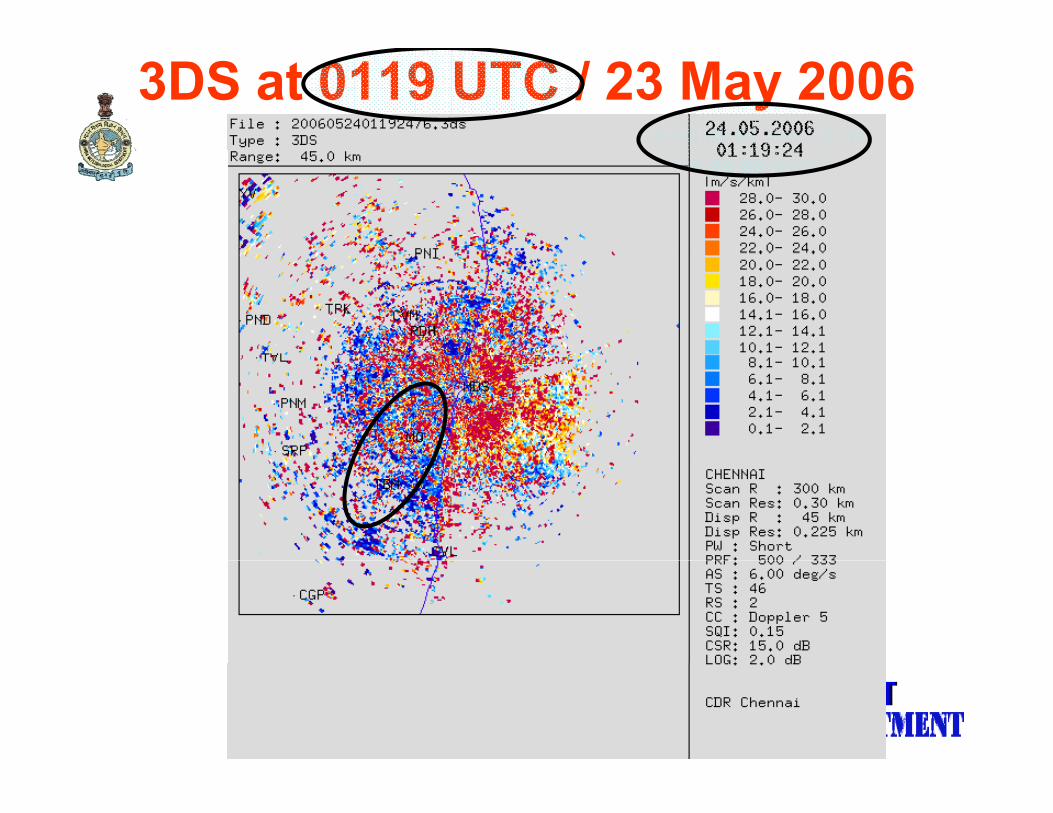
3DS at 0119 UTC / 23 May 2006
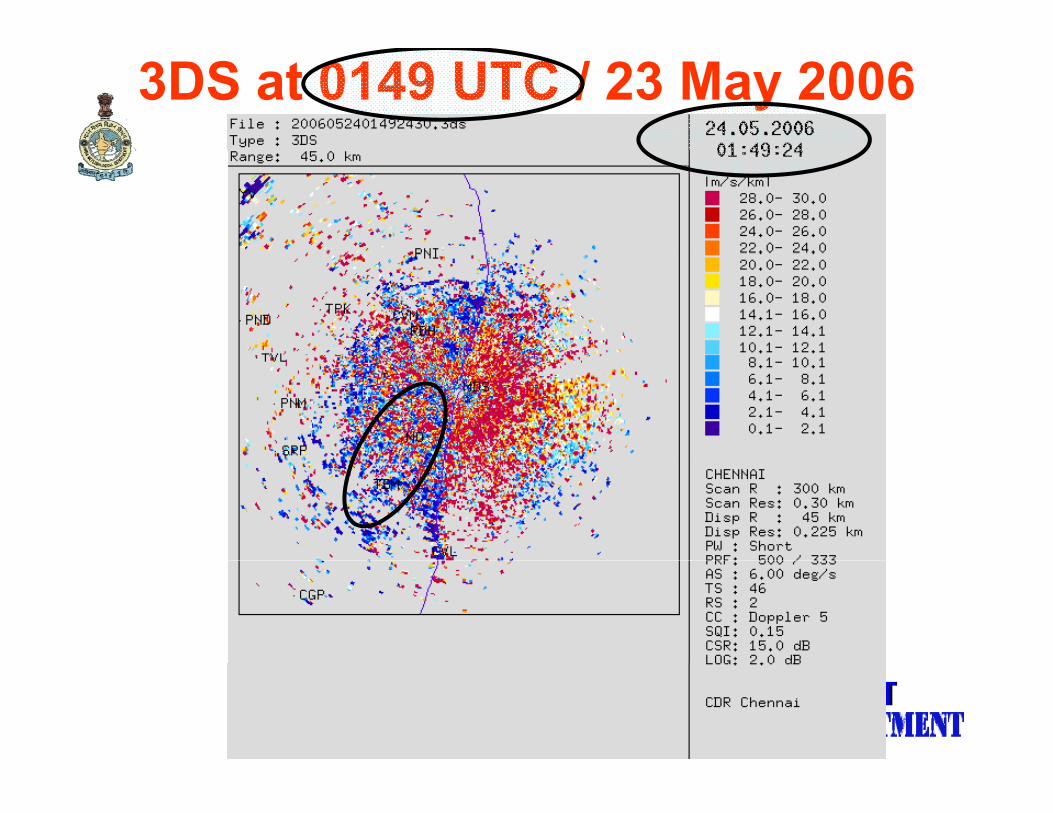
3DS at 0149 UTC / 23 May 2006
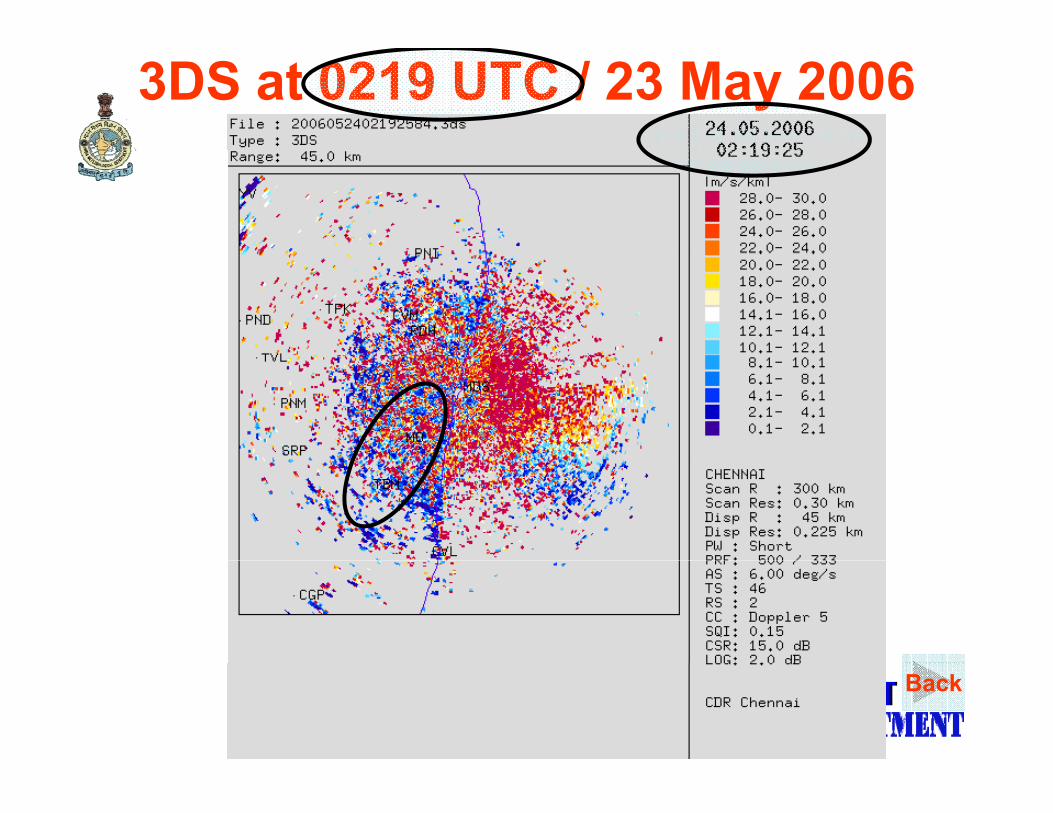
3DS at 0219 UTC / 23 May 2006
Back
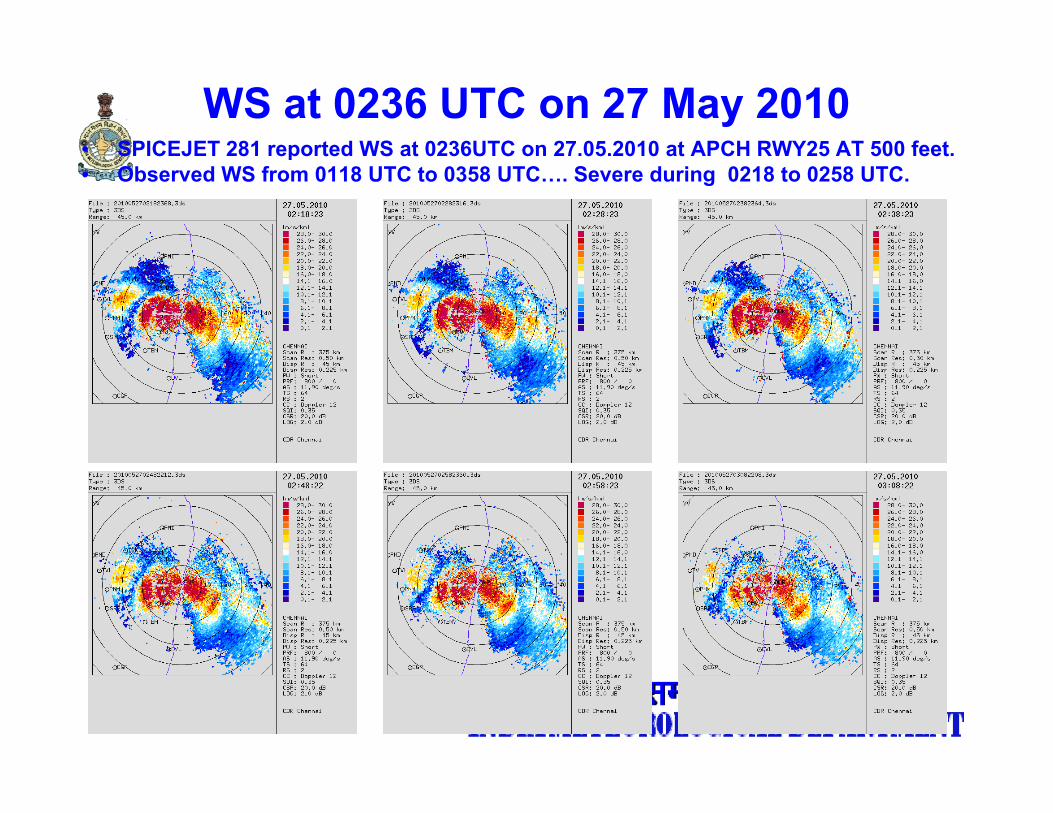
WS at 0236 UTC on 27 May 2010• SPICEJET 281 reported WS at 0236UTC on 27 05 2010 at APCH RWY25 AT 500 feet• SPICEJET 281 reported WS at 0236UTC on 27.05.2010 at APCH RWY25 AT 500 feet.• Observed WS from 0118 UTC to 0358 UTC…. Severe during 0218 to 0258 UTC.
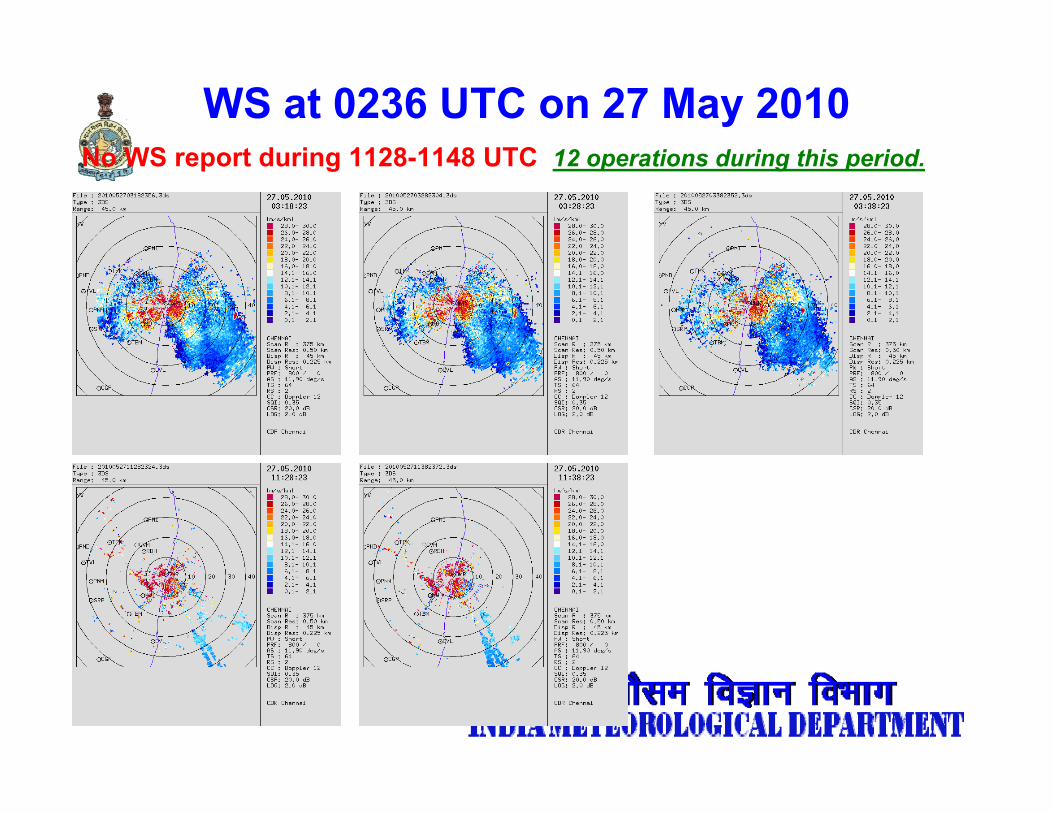
WS at 0236 UTC on 27 May 2010N WS t d i 1128 1148 UTC 12 ti d i thi i dNo WS report during 1128-1148 UTC 12 operations during this period.
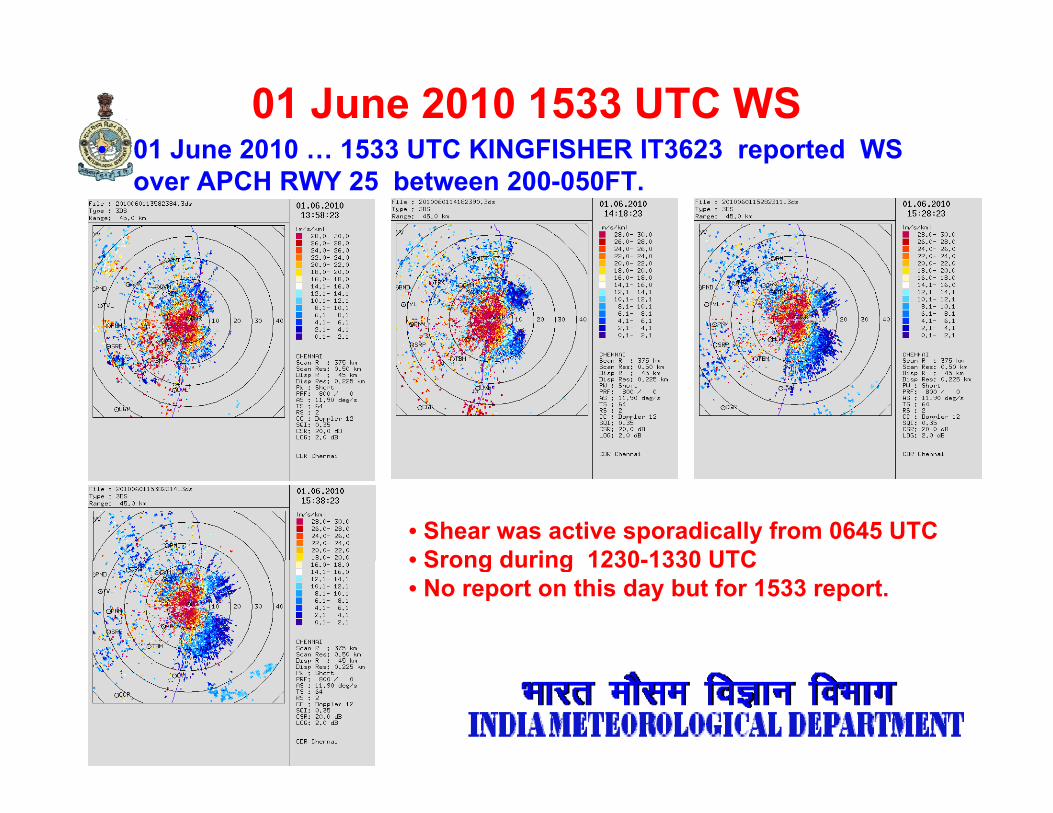
01 June 2010 1533 UTC WS• 01 June 2010 1533 UTC KINGFISHER IT3623 reported WS• 01 June 2010 … 1533 UTC KINGFISHER IT3623 reported WS
over APCH RWY 25 between 200-050FT.
• Shear was active sporadically from 0645 UTC• Srong during 1230-1330 UTC• Srong during 1230-1330 UTC• No report on this day but for 1533 report.
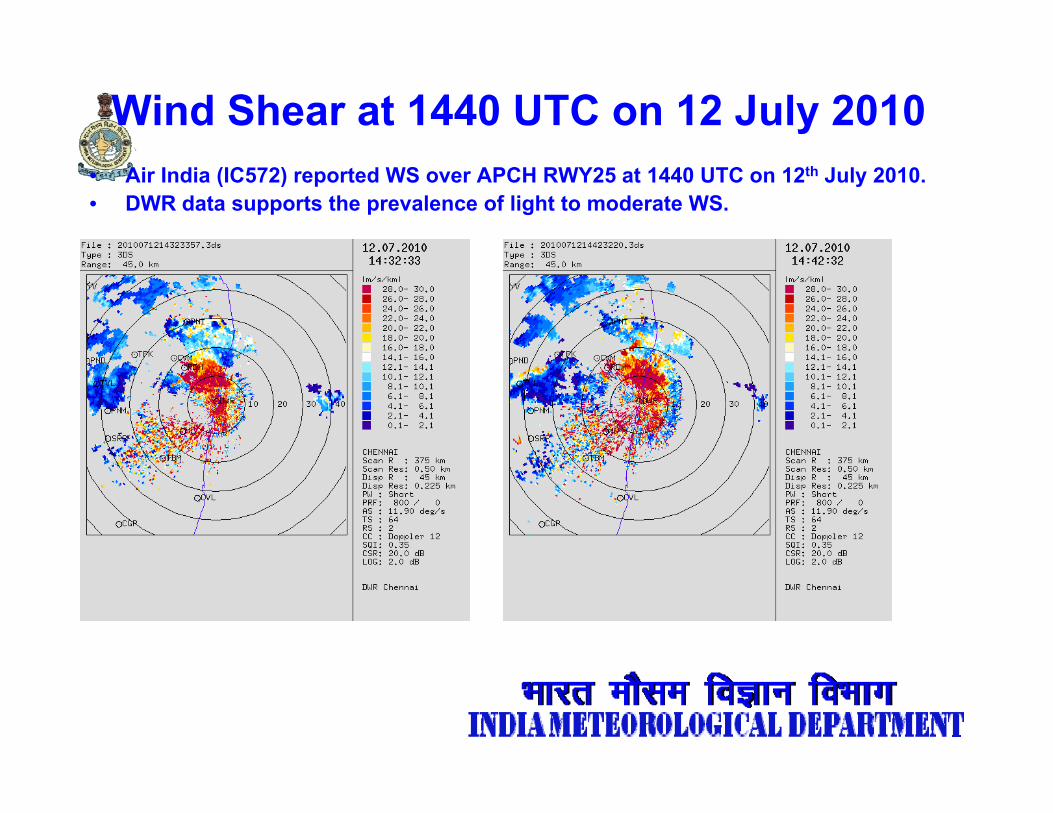
Wind Shear at 1440 UTC on 12 July 2010• Air India (IC572) reported WS over APCH RWY25 at 1440 UTC on 12th July 2010.• DWR data supports the prevalence of light to moderate WS.
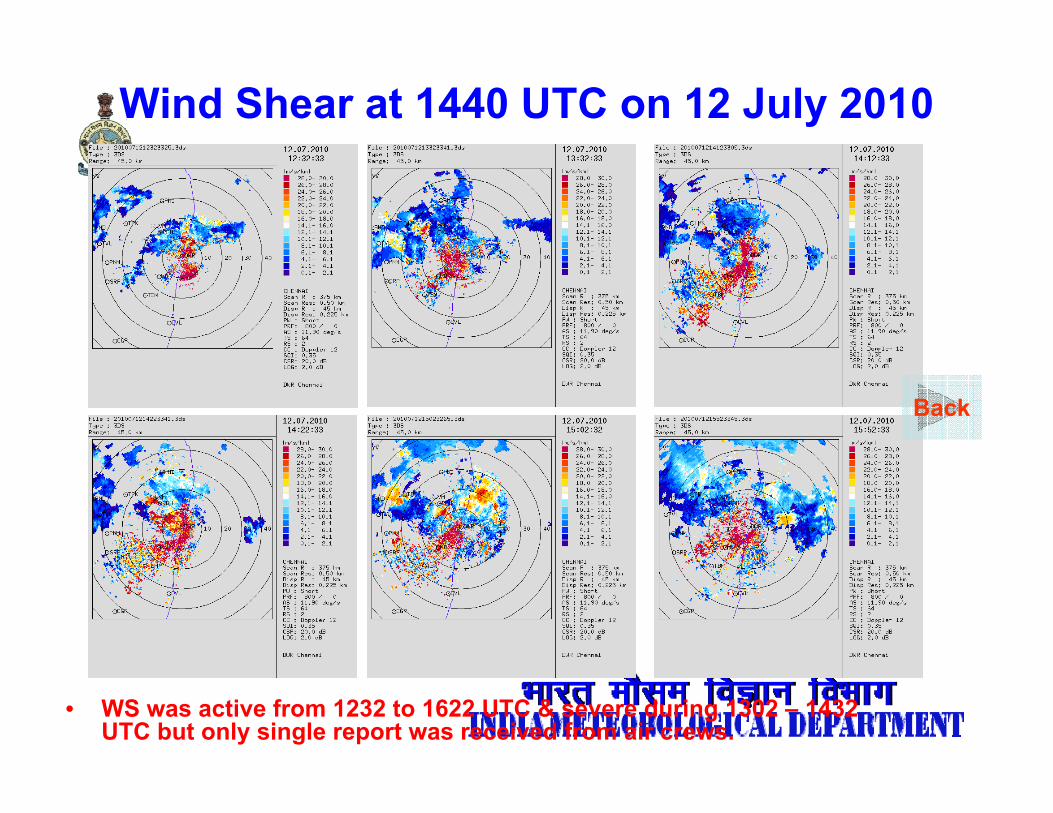
Wind Shear at 1440 UTC on 12 July 2010
Back
• WS was active from 1232 to 1622 UTC & severe during 1302 – 1432 UTC but only single report was received from air crews.
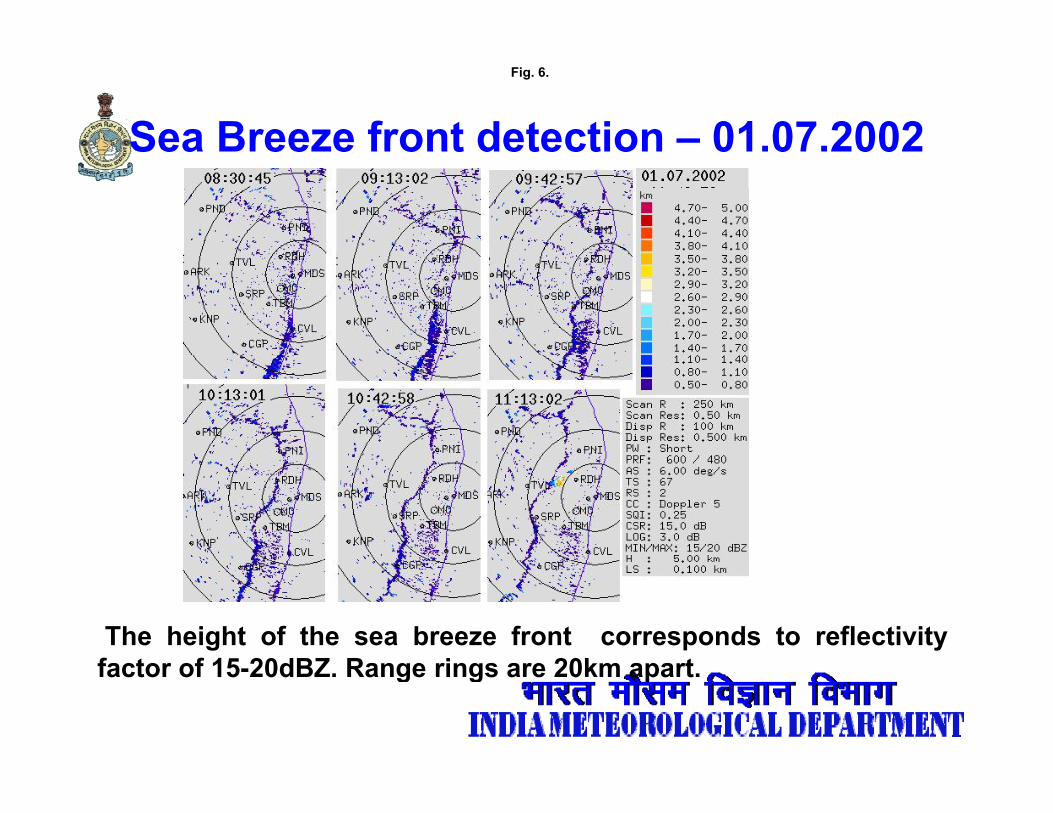
Sea Breeze front detection – 01.07.2002
Fig. 6.
Sea Breeze front detection 01.07.2002
The height of the sea breeze front corresponds to reflectivityfactor of 15 20dBZ Range rings are 20km apartfactor of 15-20dBZ. Range rings are 20km apart.
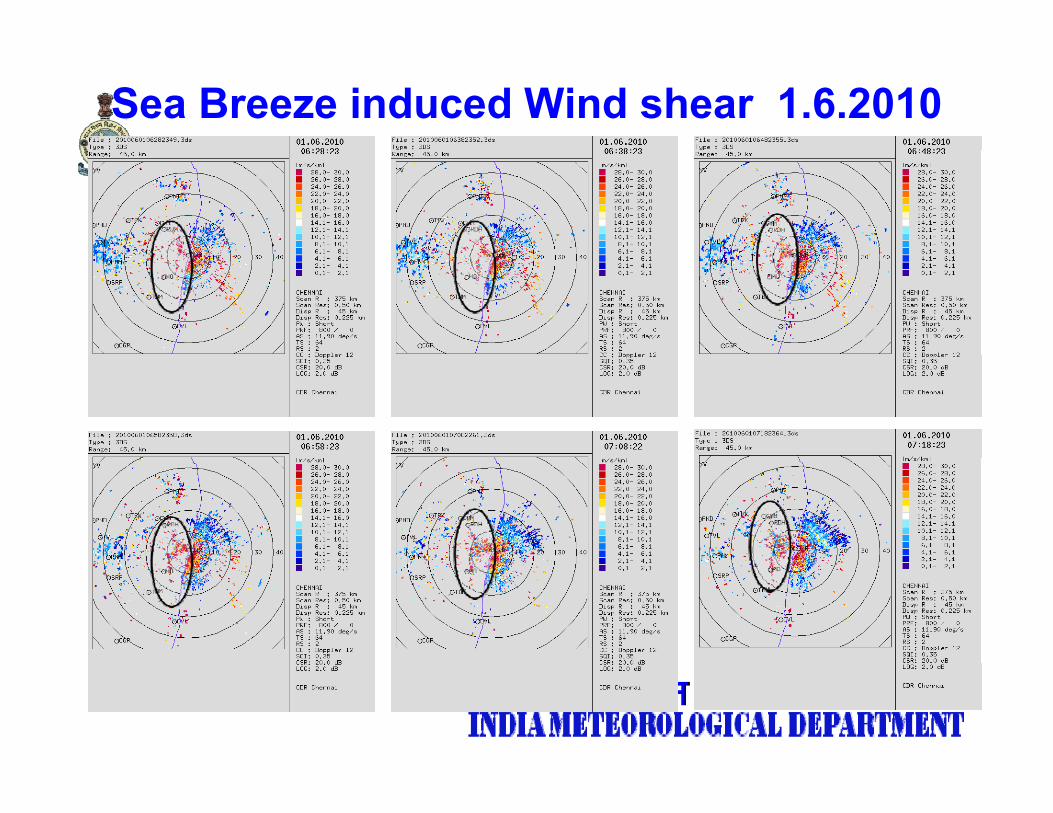
Sea Breeze induced Wind shear 1.6.2010
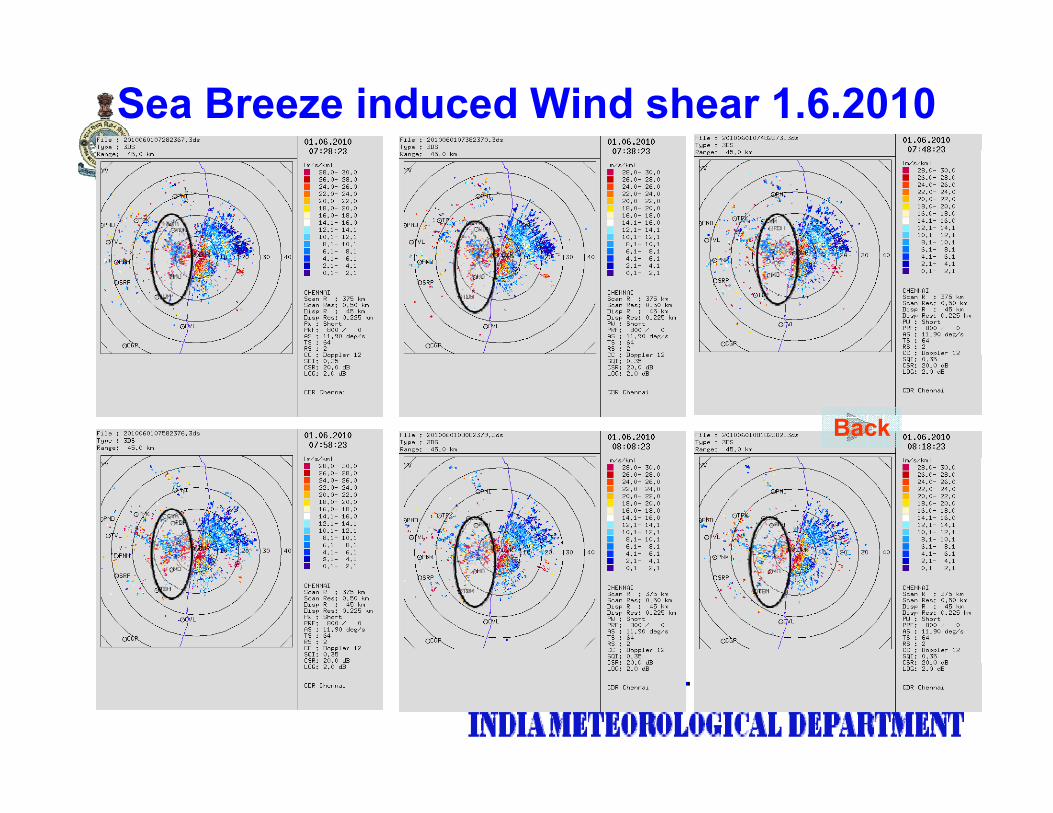
Sea Breeze induced Wind shear 1.6.2010
Back