Embed Size (px)
Citation preview
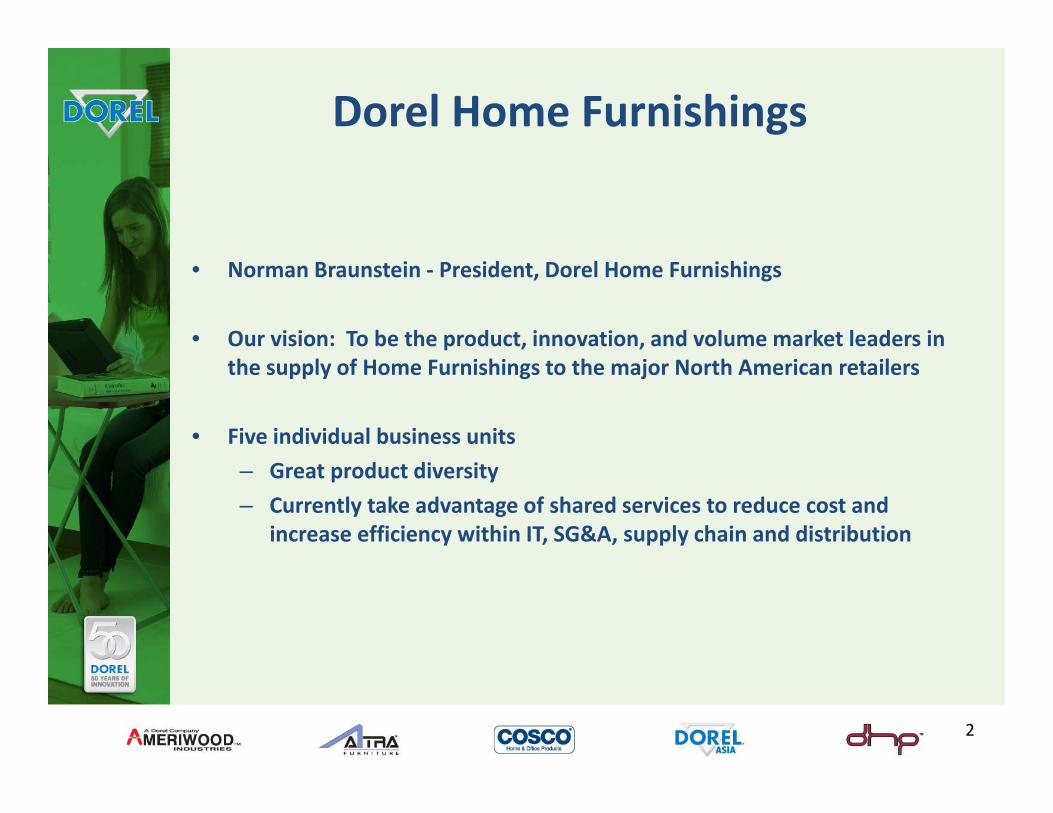
Dorel Home Furnishings
• Norman Braunstein ‐ President, Dorel Home Furnishings
• Our vision: To be the product, innovation, and volume market leaders in the supply of Home Furnishings to the major North American retailers
• Five individual business units
– Great product diversity
– Currently take advantage of shared services to reduce cost and increase efficiency within IT, SG&A, supply chain and distribution
2
Today’s agenda
• Overview of the furniture industryy
• Dorel Home Furnishings Divisions– Cosco Home and Office
A i d– Ameriwood
– Altra
– DHP
– Dorel Asia
• E‐Commerce
C l i• Conclusion
$
3
Note: amounts are in US$
Overview of US Furniture Market
Aft t f d li th US f it k t 4% i 2010 d• After two years of decline, the US furniture market grew 4% in 2010 and 2.4% in 2011.
• Furniture demand is strongly tied to new home and home sale increases.Furniture demand is strongly tied to new home and home sale increases. Both of these data points have been fairly stagnant in the US., but are now showing signs of improvement.
• Upholstery is expected to be the fastest growing segment as home owners invest in their homes. Bedroom is the largest segment.
• Furniture stores continue to be the largest sales channel however non• Furniture stores continue to be the largest sales channel, however non‐traditional channels such as Internet and mass merchants are growing at a much faster rate.
• Walmart, including Sam’s Club, is US’s largest furniture retailer.
• Ashley (furniture store), Walmart (mass merchant) and IKEA (specialty) are the three largest retailers of furniture.
4
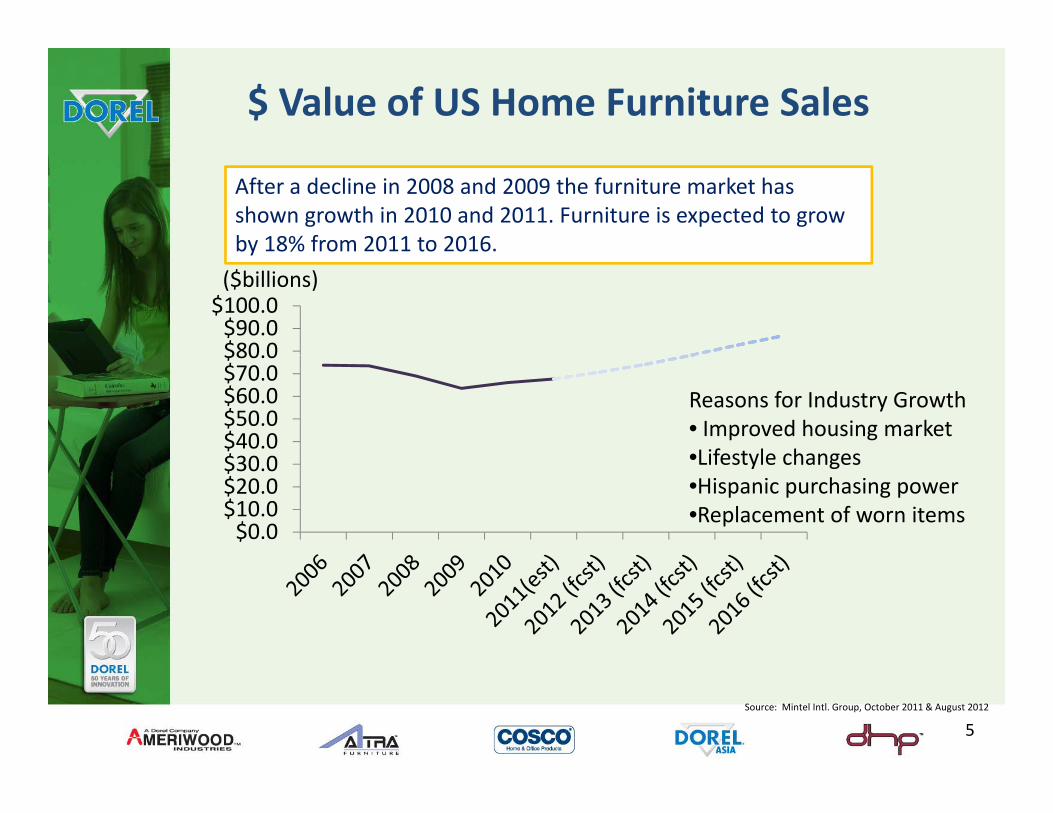
$ Value of US Home Furniture Sales
After a decline in 2008 and 2009 the furniture market has shown growth in 2010 and 2011. Furniture is expected to grow by 18% from 2011 to 2016.
$80.0$90.0$100.0
y
($billions)
$30 0$40.0$50.0$60.0$70.0$80.0
Reasons for Industry Growth• Improved housing market•Lifestyle changes
$0.0$10.0$20.0$30.0 •Lifestyle changes
•Hispanic purchasing power•Replacement of worn items
Source: Mintel Intl. Group, October 2011 & August 2012
5
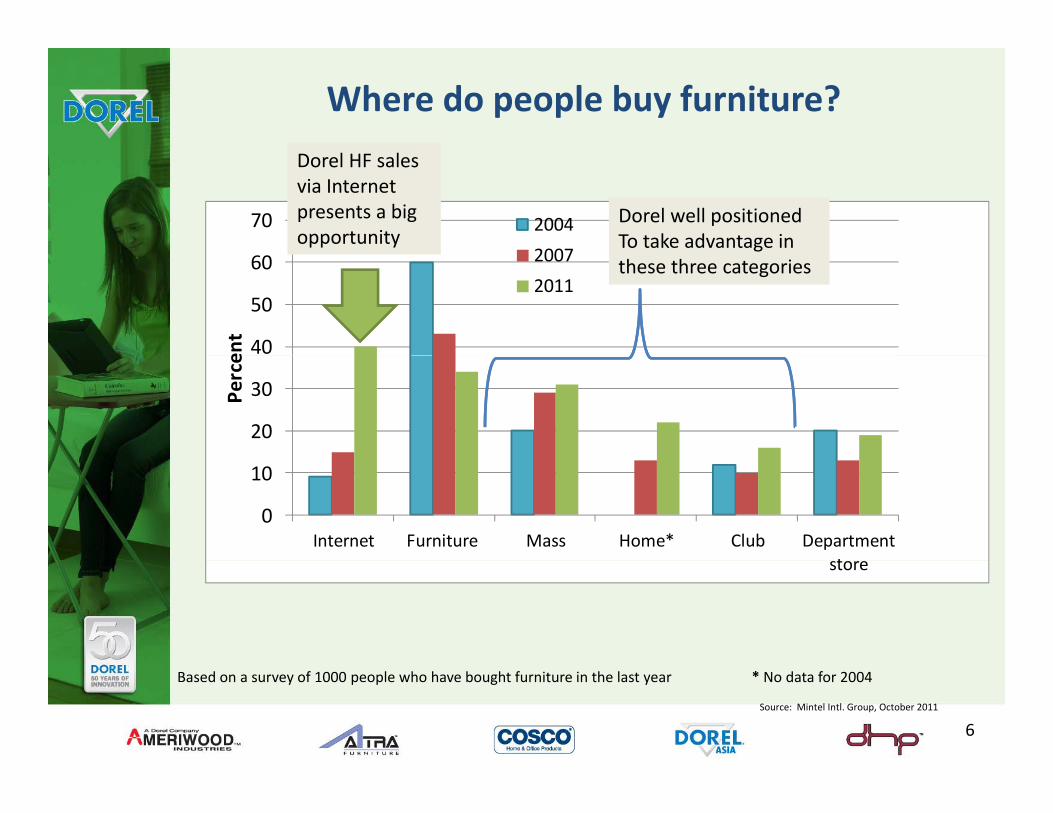
Where do people buy furniture?
70 2004
2007
Dorel HF sales via Internet presents a big opportunity
Dorel well positioned To take advantage in
40
50
60en
t 2007
2011these three categories
20
30Perce
0
10
Internet Furniture Mass Home* Club Department tstore
Based on a survey of 1000 people who have bought furniture in the last year * No data for 2004
Source: Mintel Intl. Group, October 2011
6
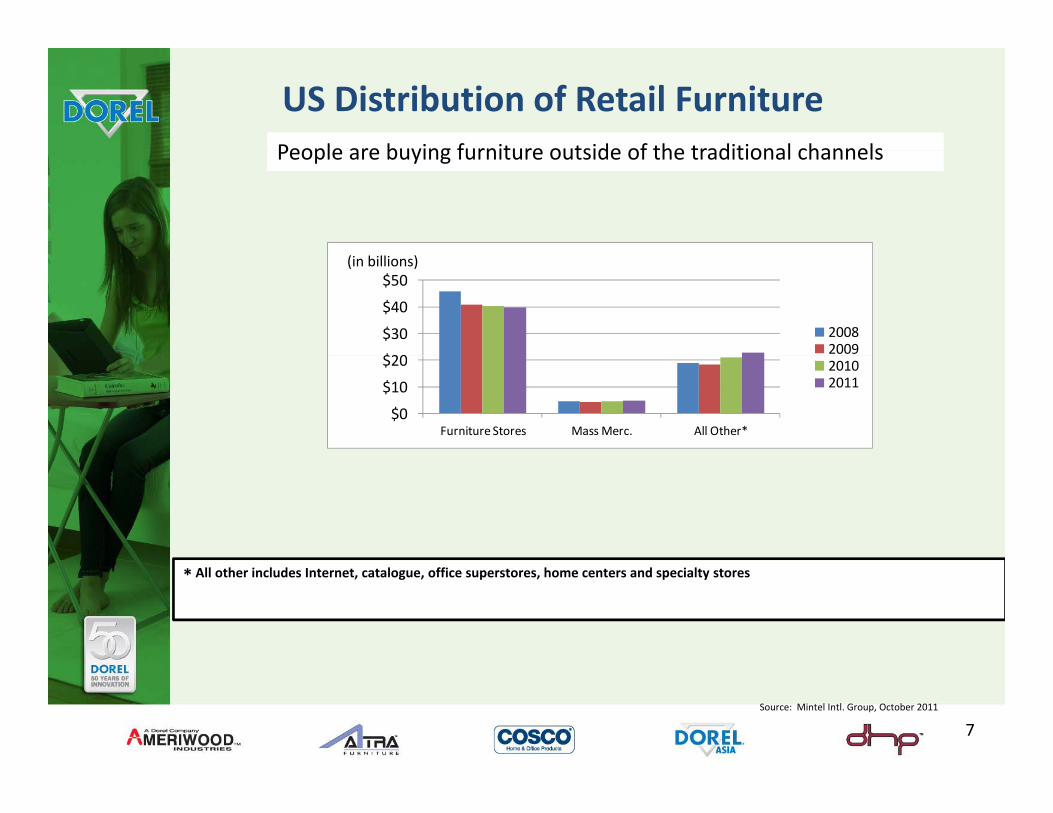
US Distribution of Retail FurniturePeople are buying furniture outside of the traditional channelsPeople are buying furniture outside of the traditional channels
$20
$30
$40
$50
20082009
(in billions)
$0
$10
$20
Furniture Stores Mass Merc. All Other*
20102011
* All other includes Internet, catalogue, office superstores, home centers and specialty stores
Source: Mintel Intl. Group, October 2011
7
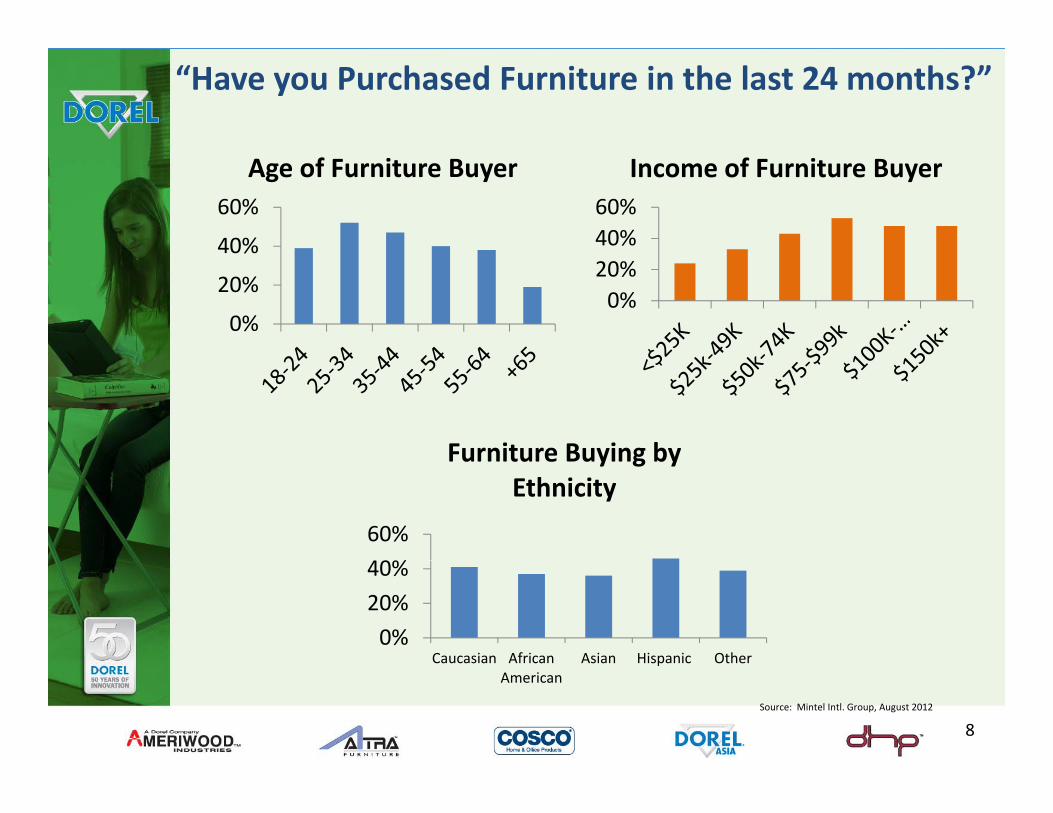
“Have you Purchased Furniture in the last 24 months?”
40%
60%
Age of Furniture Buyer
40%60%
Income of Furniture Buyer
0%
20%
40%
0%20%
Furniture Buying by
40%
60%
Furniture Buying by Ethnicity
0%
20%
40%
Caucasian African Asian Hispanic Other
Source: Mintel Intl. Group, August 2012
Caucasian AfricanAmerican
Asian Hispanic Other
8
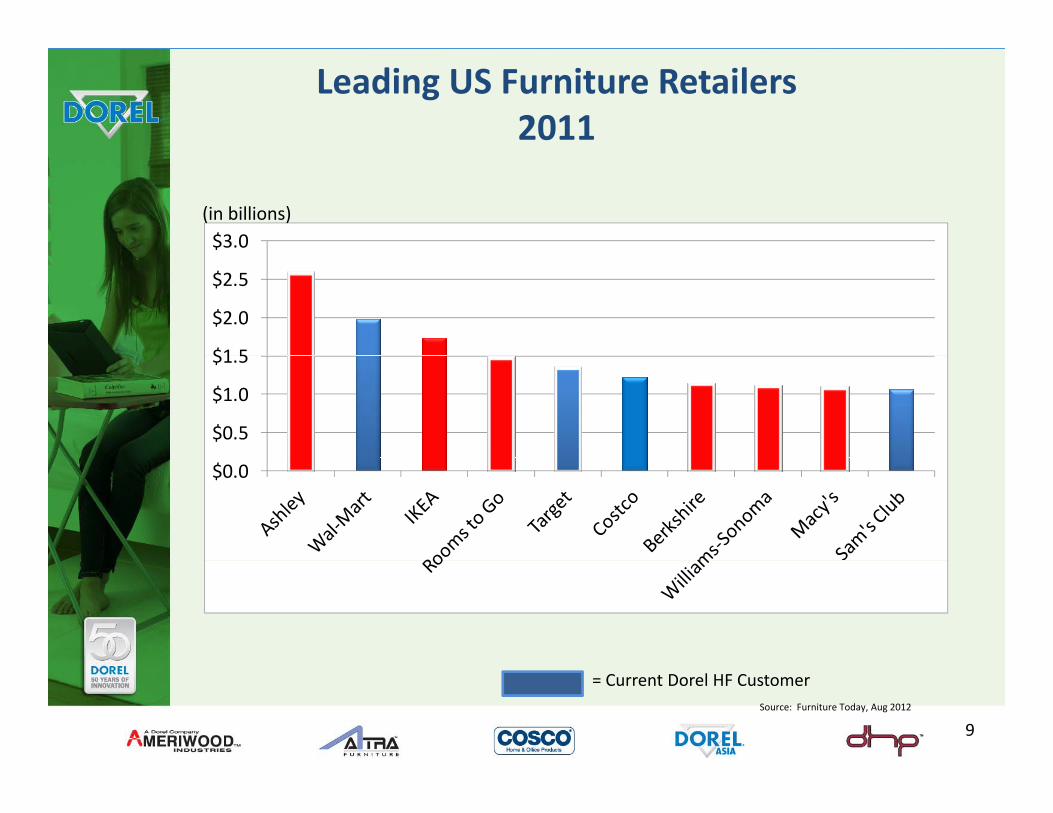
Leading US Furniture Retailers2011
$3.0(in billions)
$1 5
$2.0
$2.5
$0.5
$1.0
$1.5
$0.0
= Current Dorel HF CustomerSource: Furniture Today, Aug 2012
9
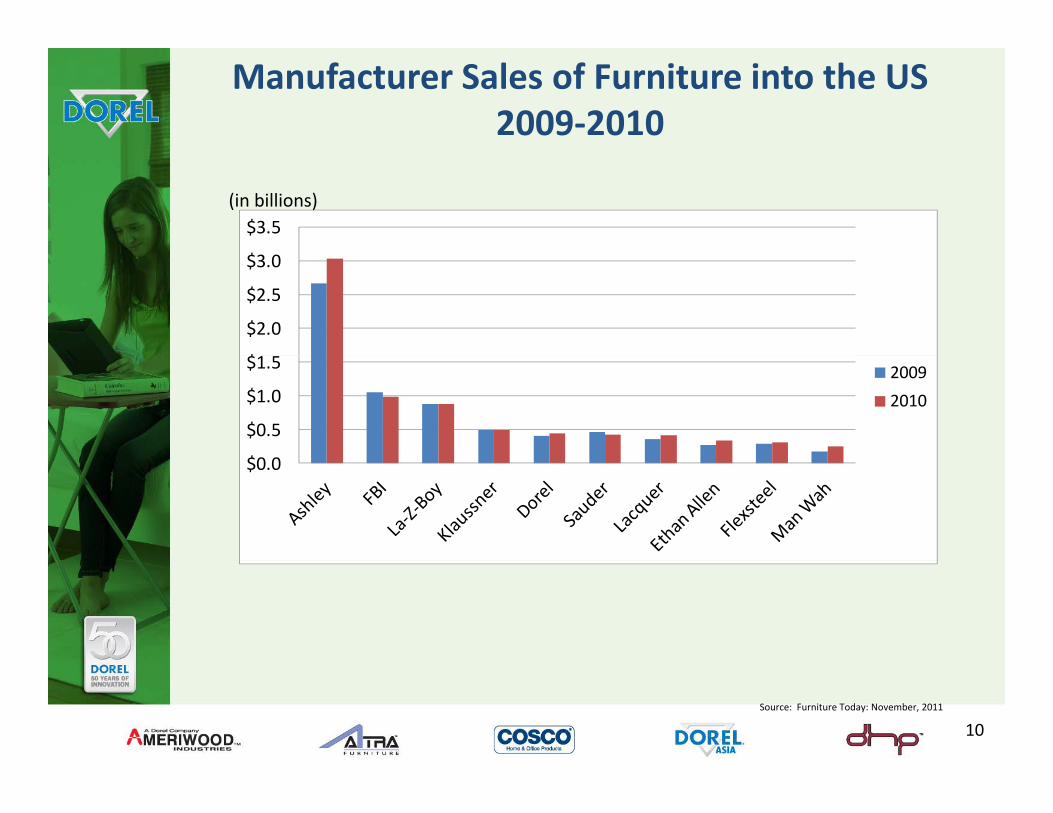
Manufacturer Sales of Furniture into the US2009‐2010
$
$3.5(in billions)
$
$2.0
$2.5
$3.0
$0 0
$0.5
$1.0
$1.5 2009
2010
$0.0
Source: Furniture Today: November, 2011
10
Dorel Home Furnishings
11
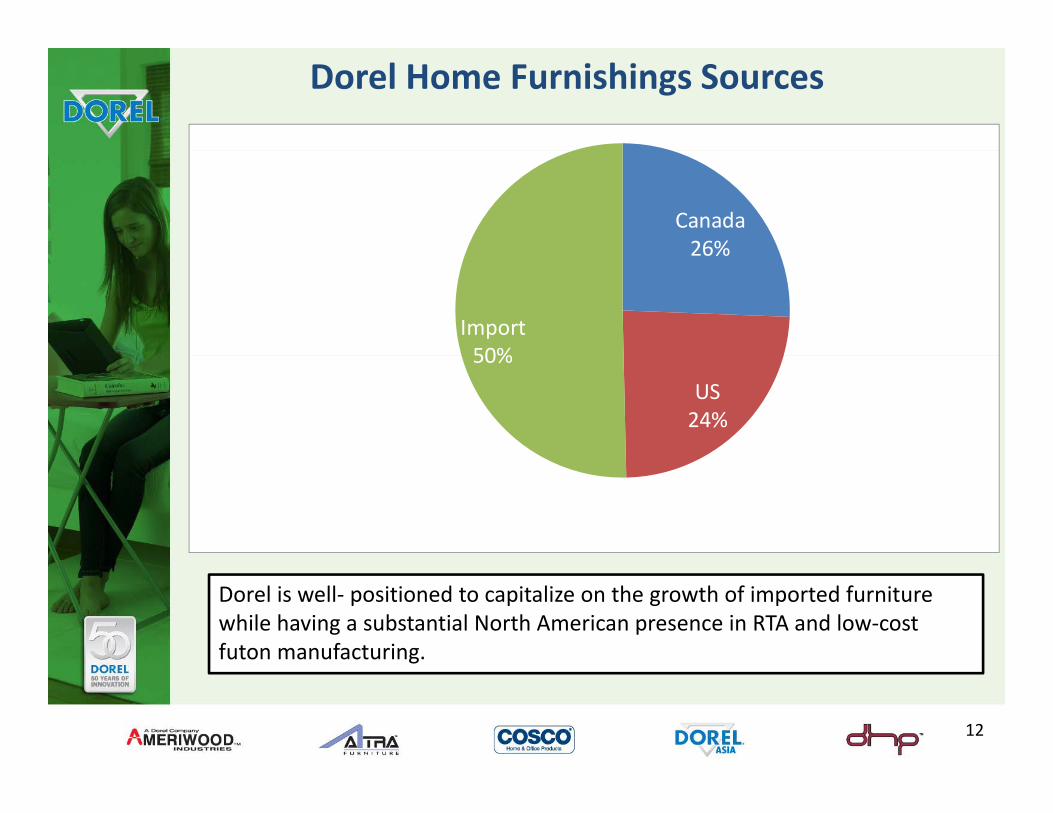
Dorel Home Furnishings Sources
Canada26%26%
Import50%
US24%
50%
Dorel is well‐ positioned to capitalize on the growth of imported furniture while having a substantial North American presence in RTA and low‐cost futon manufacturing.g
12
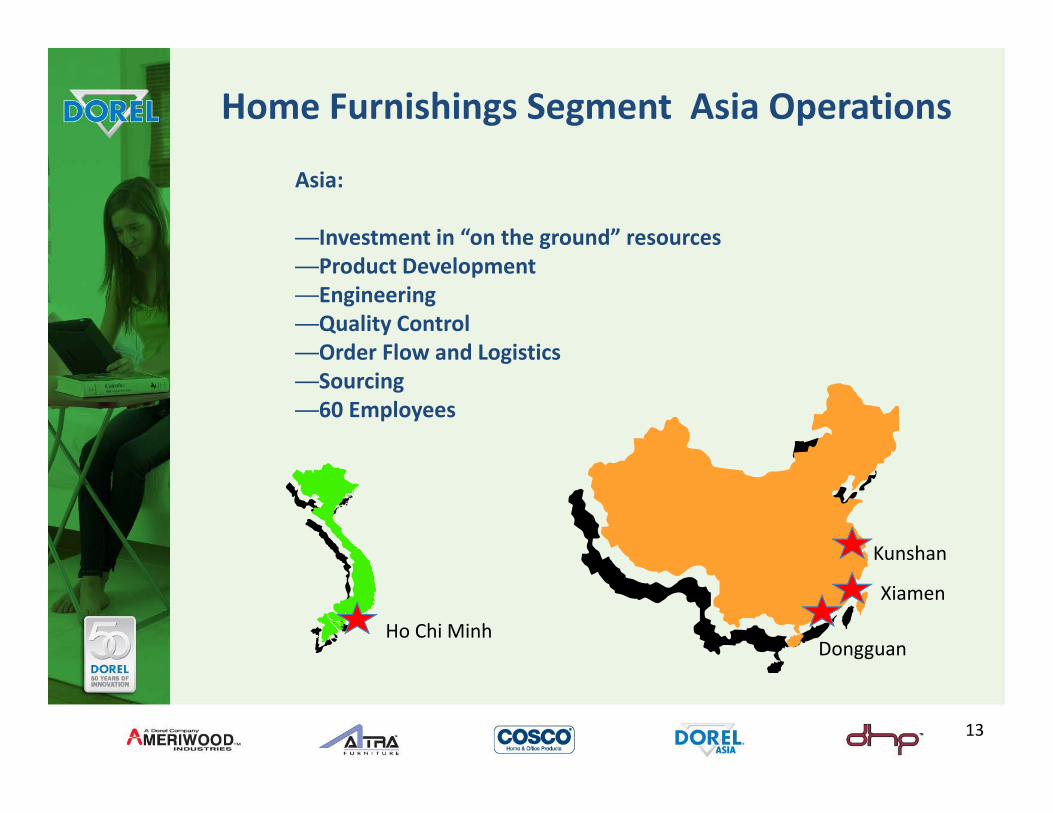
Home Furnishings Segment Asia Operations
Asia:
—Investment in “on the ground” resources—Product Development—Engineering—Quality Control—Order Flow and LogisticsOrder Flow and Logistics—Sourcing—60 Employees
Kunshan
Xiamen
DongguanHo Chi Minh
13
Home Furnishings Geographic Strategy
• Canada
– Reorganized our Canadian Home Furnishings organization in 2009
– Substantial growth in the last three years
– Sell product from all Dorel Home Furnishings divisions
– Target Canada opportunity
• Exploring sales opportunities outside North America
– South America/Central America
– Europe
– Australia/ New Zealand
– China
14
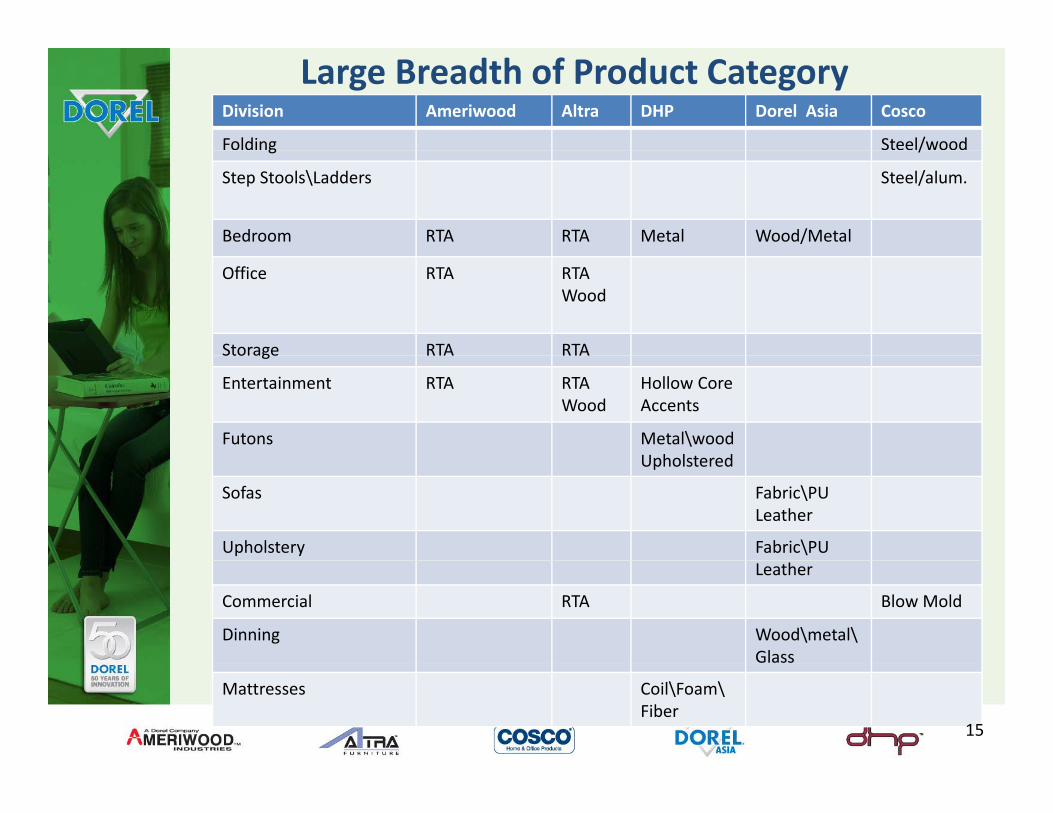
Large Breadth of Product CategoryDivision Ameriwood Altra DHP Dorel Asia Cosco
Folding Steel/woodg /
Step Stools\Ladders Steel/alum.
Bedroom RTA RTA Metal Wood/Metal
Office RTA RTAWood
Storage RTA RTAStorage RTA RTA
Entertainment RTA RTAWood
Hollow CoreAccents
Futons Metal\woodUpholsteredUpholstered
Sofas Fabric\PULeather
Upholstery Fabric\PULeather
Commercial RTA Blow Mold
Dinning Wood\metal\Glass
Mattresses Coil\Foam\Fiber
15
Cosco Home & Office
• Location ‐ Columbus, IN,
• Imports – folding furniture, step stools, hand trucks and specialty ladders
• Import distribution facilities – Ontario, California and Savannah, Georgia
• Main customers‐Mass merchants clubs home centersMain customers‐Mass merchants, clubs, home centers, commercial office suppliers, hardware chains
16
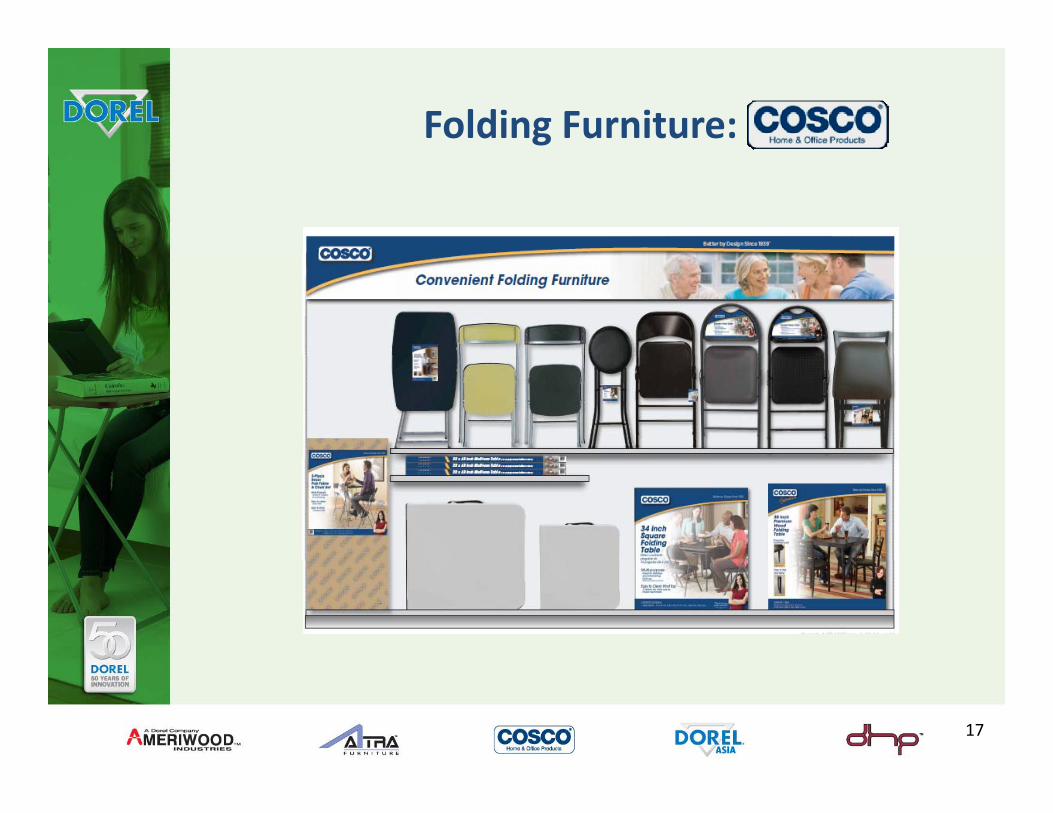
Folding Furniture:
17
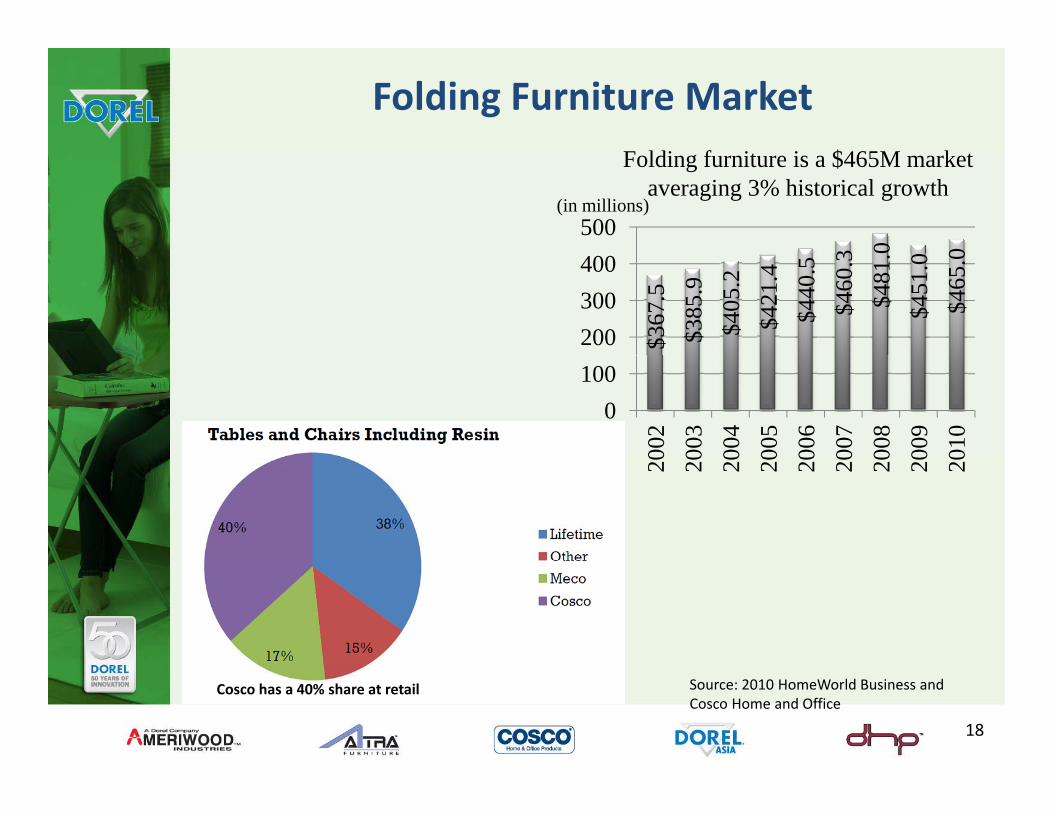
Folding Furniture Marketldi f i i $ kFolding furniture is a $465M market averaging 3% historical growth
3 0 0
500(in millions)
$367
.5$3
85.9
$405
.2$4
21.4
$440
.5$4
60. 3
$481
.0$4
51.0
$465
.0
200300400
0100
002
003
004
005
006
007
008
009
010
20 20 20 20 20 20 20 20 20
Source: 2010 HomeWorld Business and Cosco Home and Office
Cosco has a 40% share at retail
18
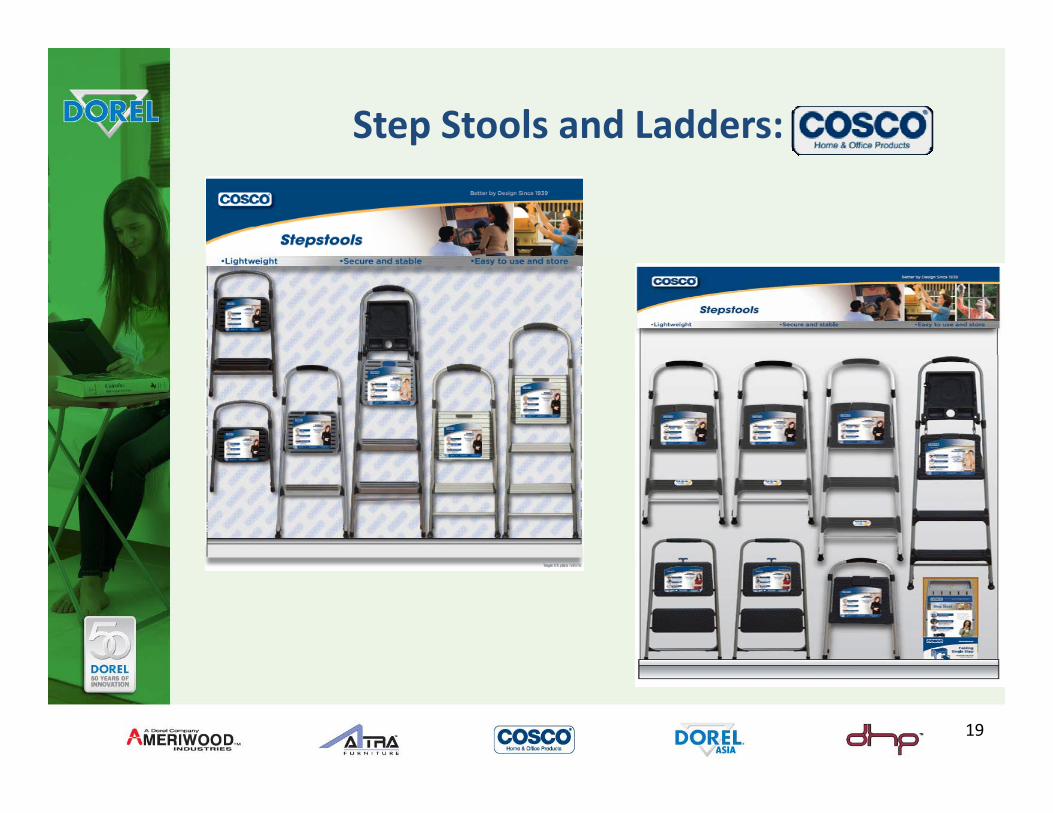
Step Stools and Ladders:
19
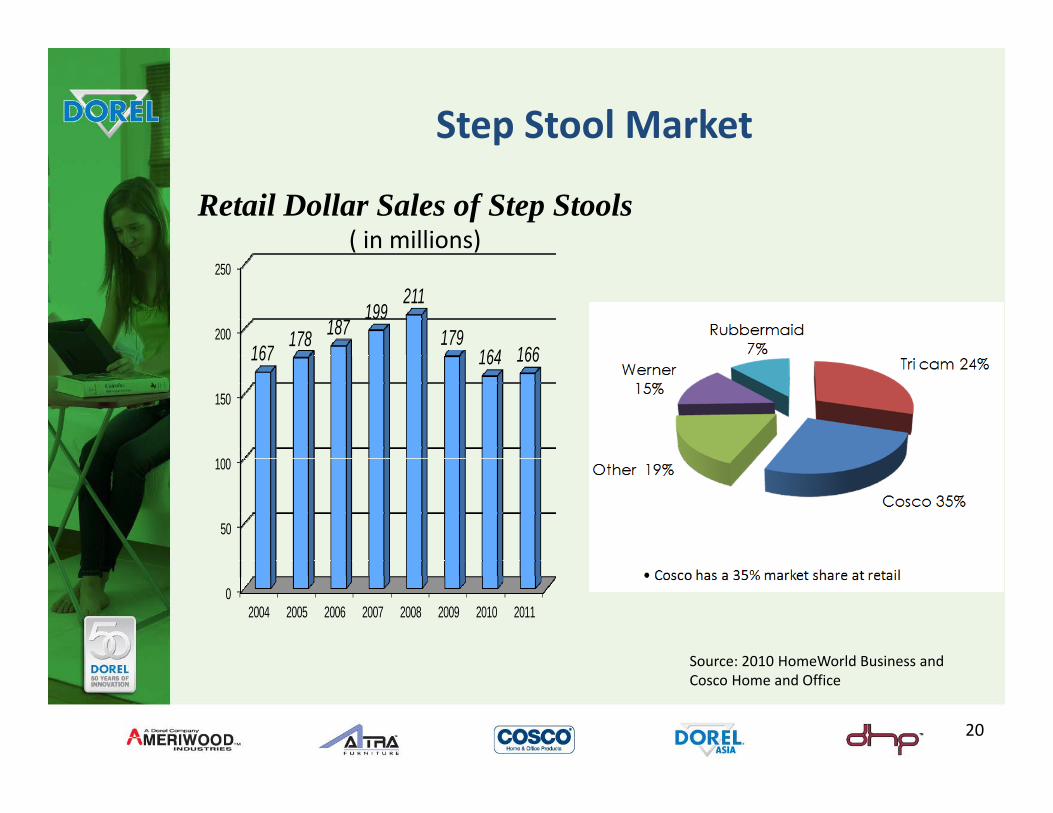
Step Stool Market
Retail Dollar Sales of Step Stools ( in millions)
200
250
167178 187
199211
179164 166
150
167 164 166
50
100
Source: 2010 HomeWorld Business and
02004 2005 2006 2007 2008 2009 2010 2011
Source: 2010 HomeWorld Business and Cosco Home and Office
20
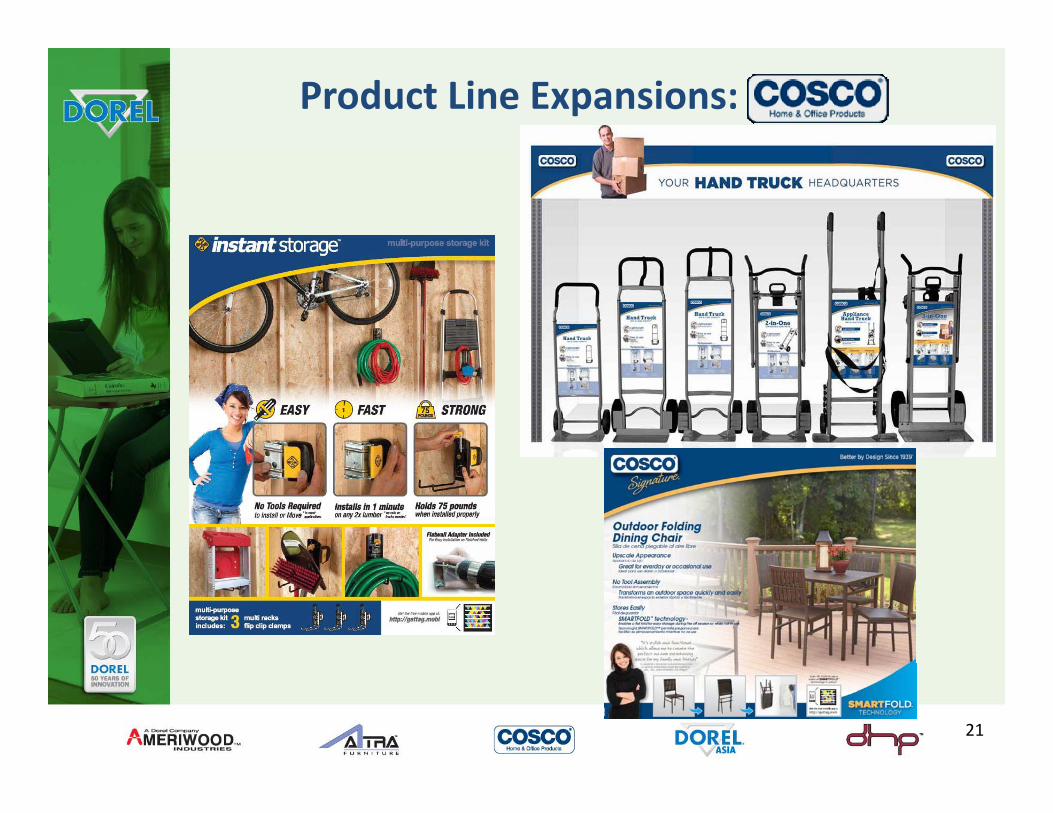
Product Line Expansions: :
21
Ameriwood
• Location Wright City MO• Location ‐ Wright City, MO
• Domestic manufacturer of RTA. Main categories include home office, entertainment, bedroom, garage and multi‐purpose storage
• Manufacturing and distribution facilities– Cornwall, ON, Tiffin OH and Dowagiac MITiffin, OH and Dowagiac, MI
• Main customers‐mass merchants, home centers, office superstores
22
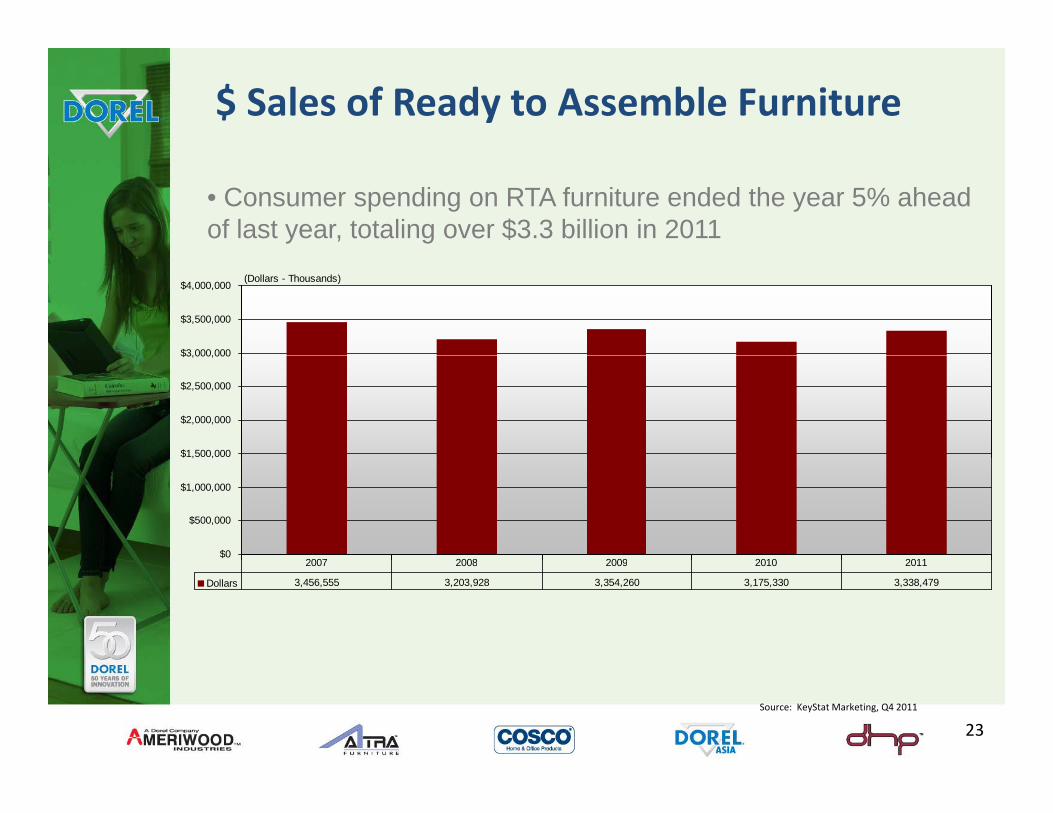
$ Sales of Ready to Assemble Furniture
• Consumer spending on RTA furniture ended the year 5% ahead of last year, totaling over $3.3 billion in 2011
$3,000,000
$3,500,000
$4,000,000(Dollars - Thousands)
$1,500,000
$2,000,000
$2,500,000
$3,000,000
$0
$500,000
$1,000,000
, ,
2007 2008 2009 2010 2011
Dollars 3,456,555 3,203,928 3,354,260 3,175,330 3,338,479
2007 2008 2009 2010 2011
Source: KeyStat Marketing, Q4 2011
23
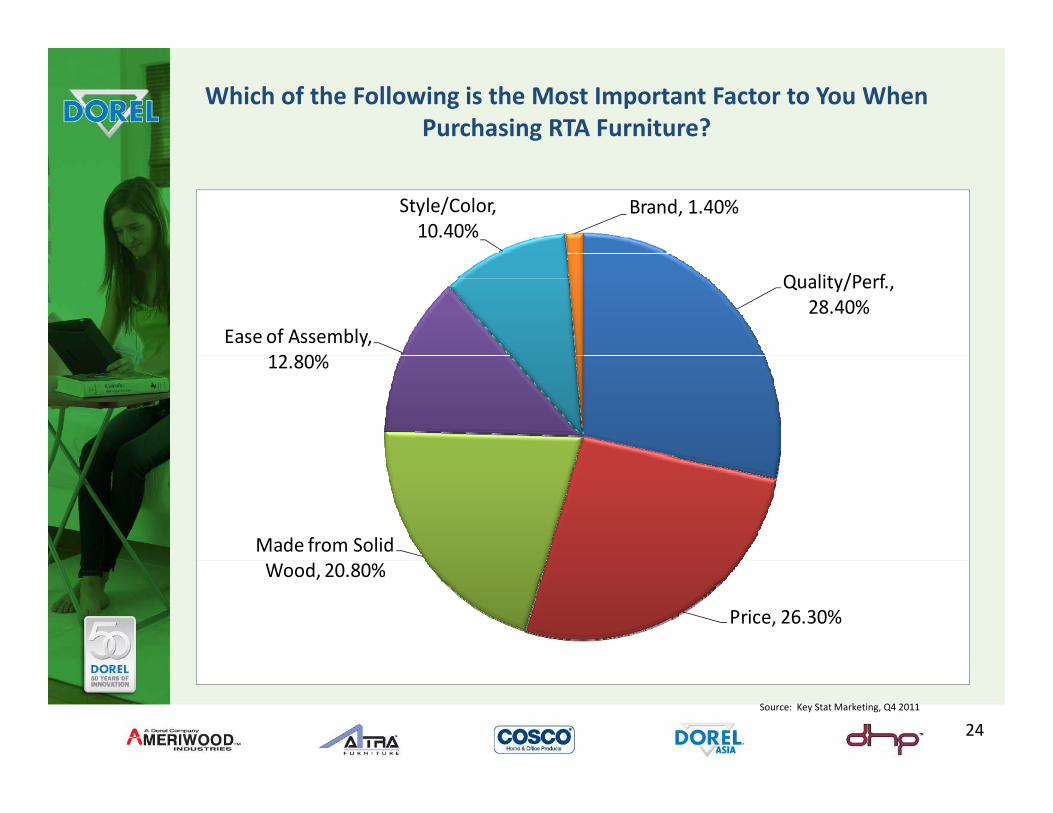
Which of the Following is the Most Important Factor to You When Purchasing RTA Furniture?
Style/Color, 10.40%
Brand, 1.40%
Quality/Perf., 28.40%
Ease of Assembly, 12 80%12.80%
Made from Solid
Price, 26.30%
Wood, 20.80%
Source: Key Stat Marketing, Q4 2011
24
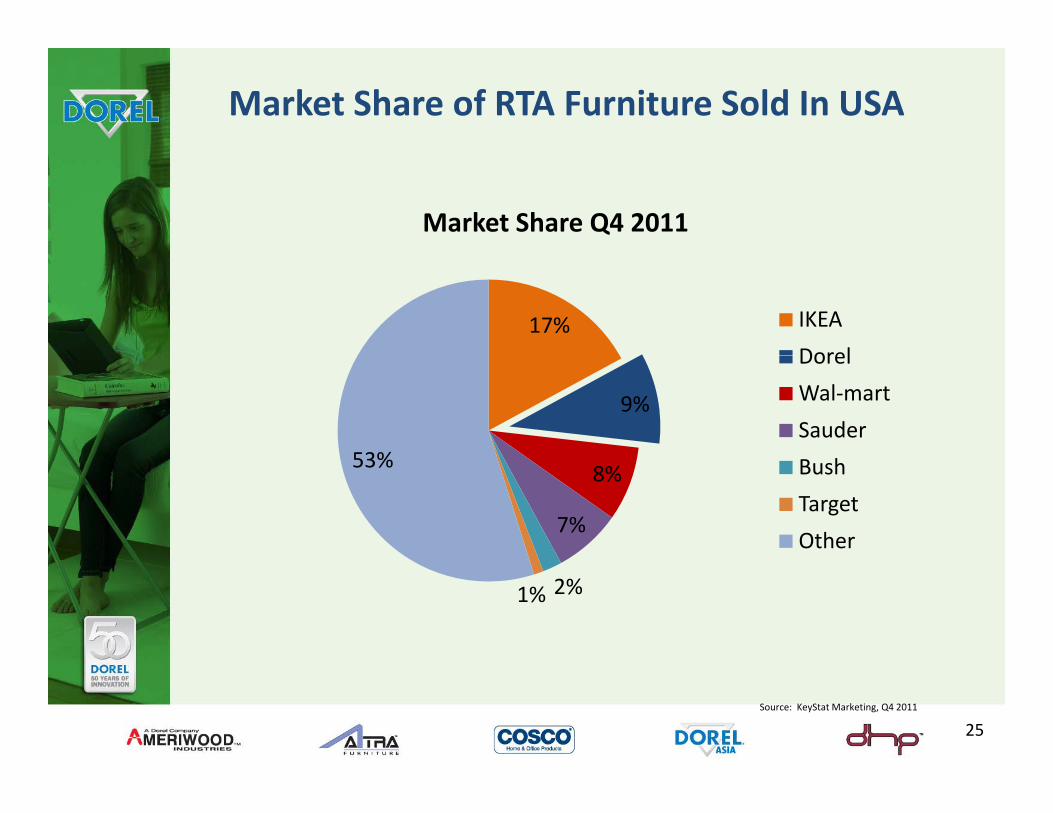
Market Share of RTA Furniture Sold In USA
Market Share Q4 2011
17% IKEA
Dorel
9%
53%
Dorel
Wal‐mart
Sauder
h8%
7%
53% Bush
Target
Other
2%1%
Source: KeyStat Marketing, Q4 2011
25
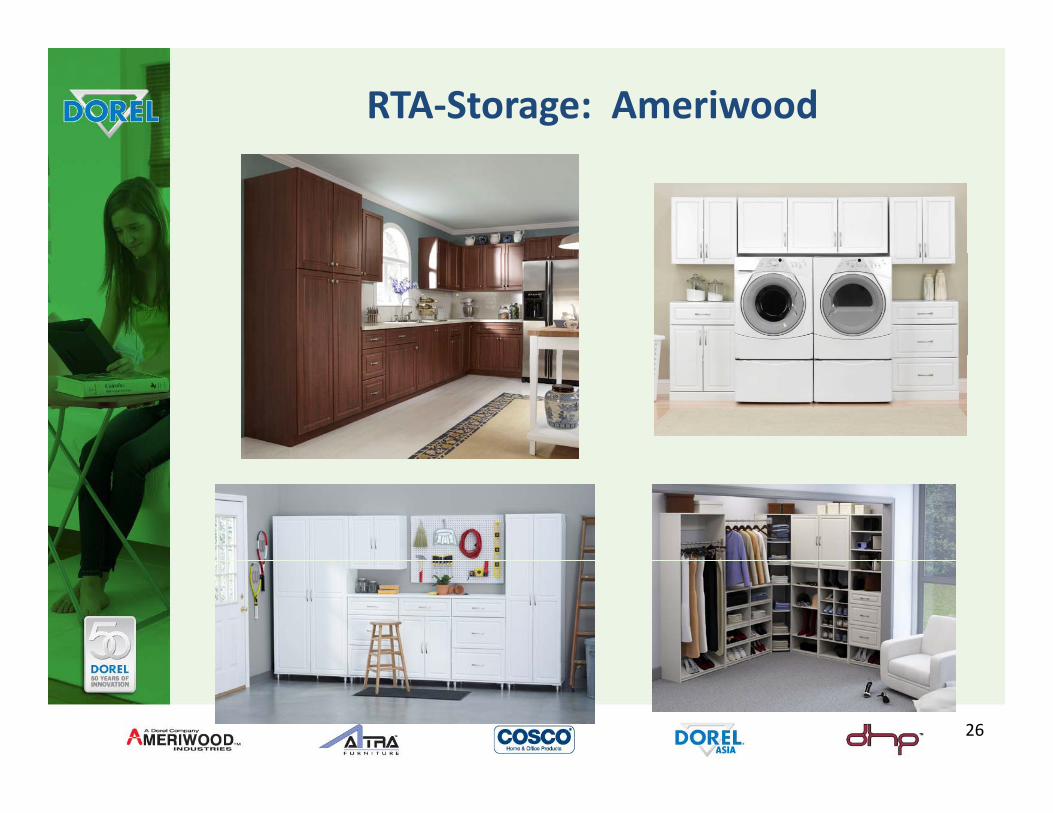
RTA‐Storage: Ameriwood
26
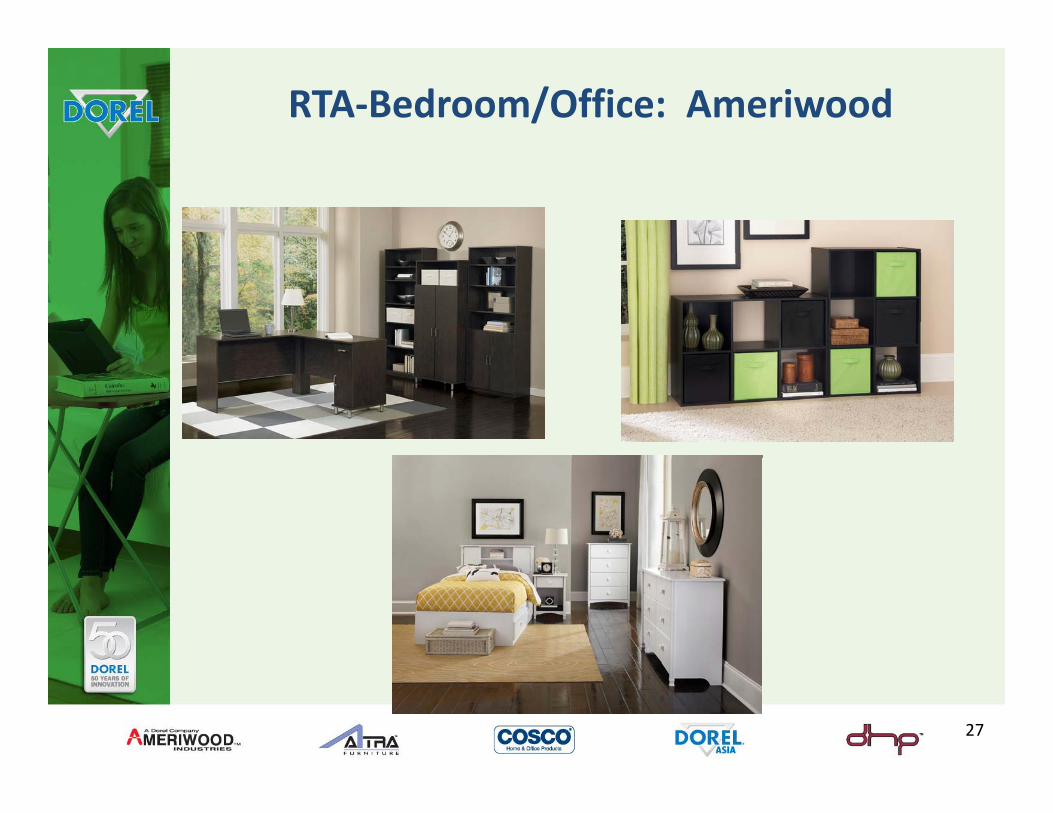
RTA‐Bedroom/Office: Ameriwood
27
Dorel has the Advantage of Domestically Produced RTA
• Ameriwood, through its domestic manufacturing facilities, is a significant source of cash generation and revenue for Dorel Home FurnishingsFurnishings.
• Ameriwood operates three highly efficient/low CAPEX manufacturing and distribution facilities
Cornwall ON– Cornwall, ON
– Tiffin, OH
– Dowagiac, MI• Retailers recognize the advantages of domestic production
– Shorter lead‐times– Reduced inventory costs– Reduced freight costs
• More stable cost environment compared to import• “Made in North America”
28
Altra Furniture
• Location ‐ Wright City, MOg y,
• Importer of RTA with concentration in home entertainment, home office, commercial office, and storage furniture
• Importer of case pieces for home office and home entertainment
• Import distribution facilities– Ontario California andImport distribution facilities Ontario, California and Savannah, Georgia
• Main customers‐mass merchants, office superstores, home entertainment superstores, clubs
29
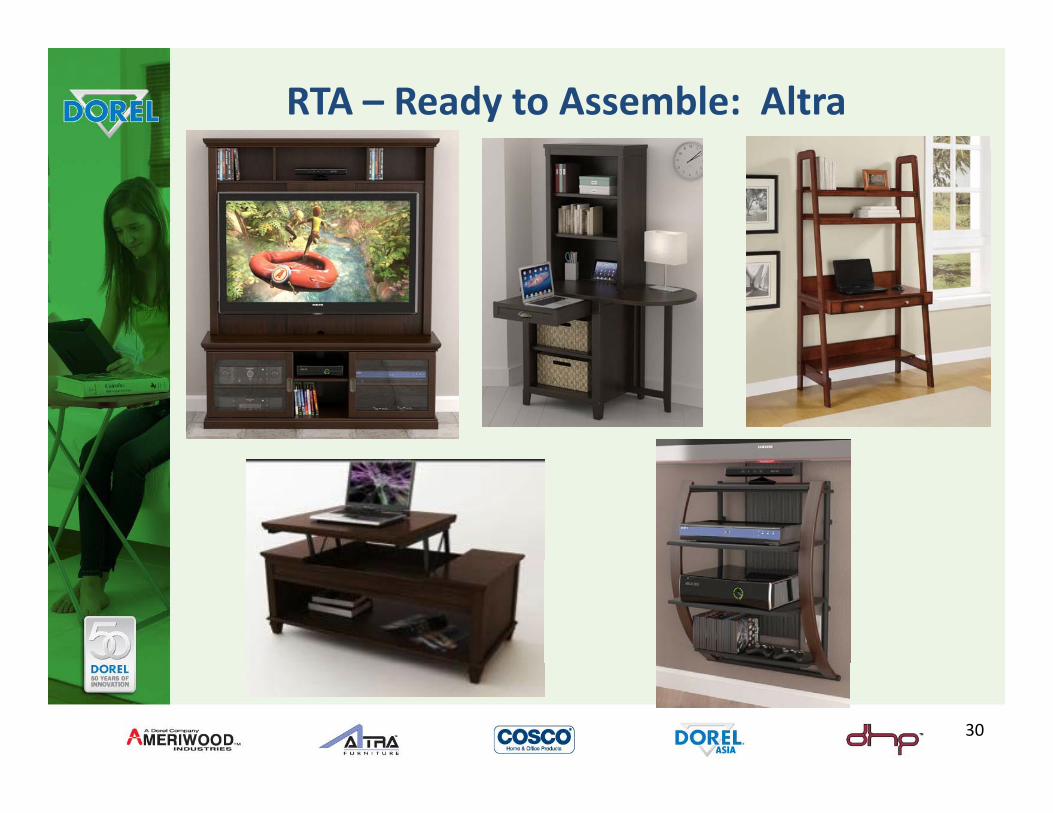
RTA – Ready to Assemble: Altra
30
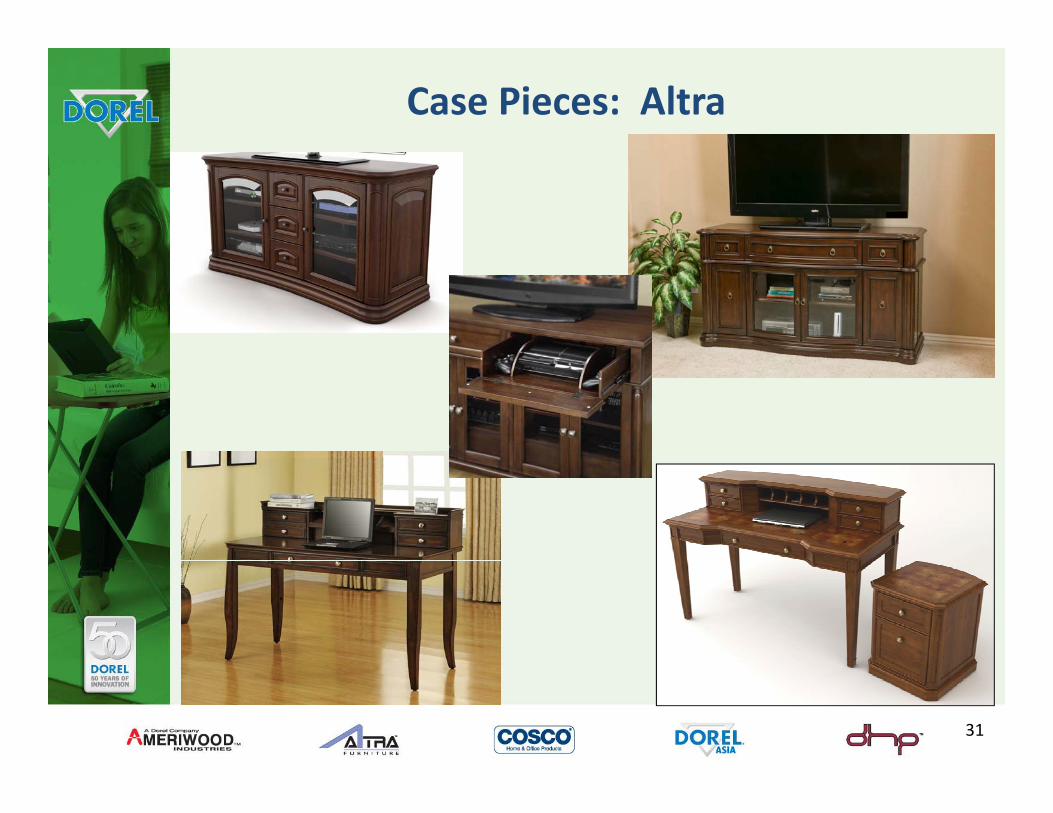
Case Pieces: Altra
31

RTA/Back to College: Altra
32
Dorel Home Products
• Location ‐ Montreal, QC
• Manufacturer and importer of futons, mattresses, baby mattresses
• Importer of futons accent tables leisure seating and metal• Importer of futons, accent tables, leisure seating and metal bunk and loft beds
• Import distribution facility– Ontario, California, Savannah, Georgia
• Domestic distribution facility‐Montreal, QC
M i t h t di t h i I t t• Main customers‐mass merchants, discount chains, Internet
33
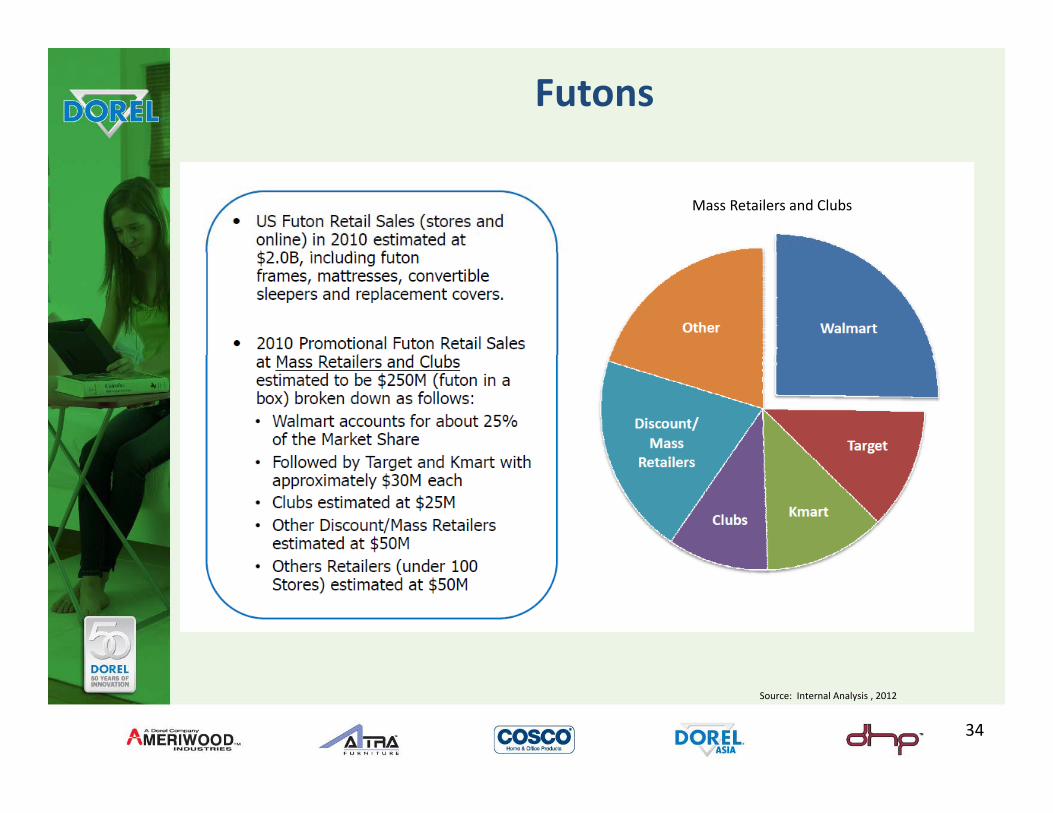
Futons
Mass Retailers and Clubs
Source: Internal Analysis , 2012
34
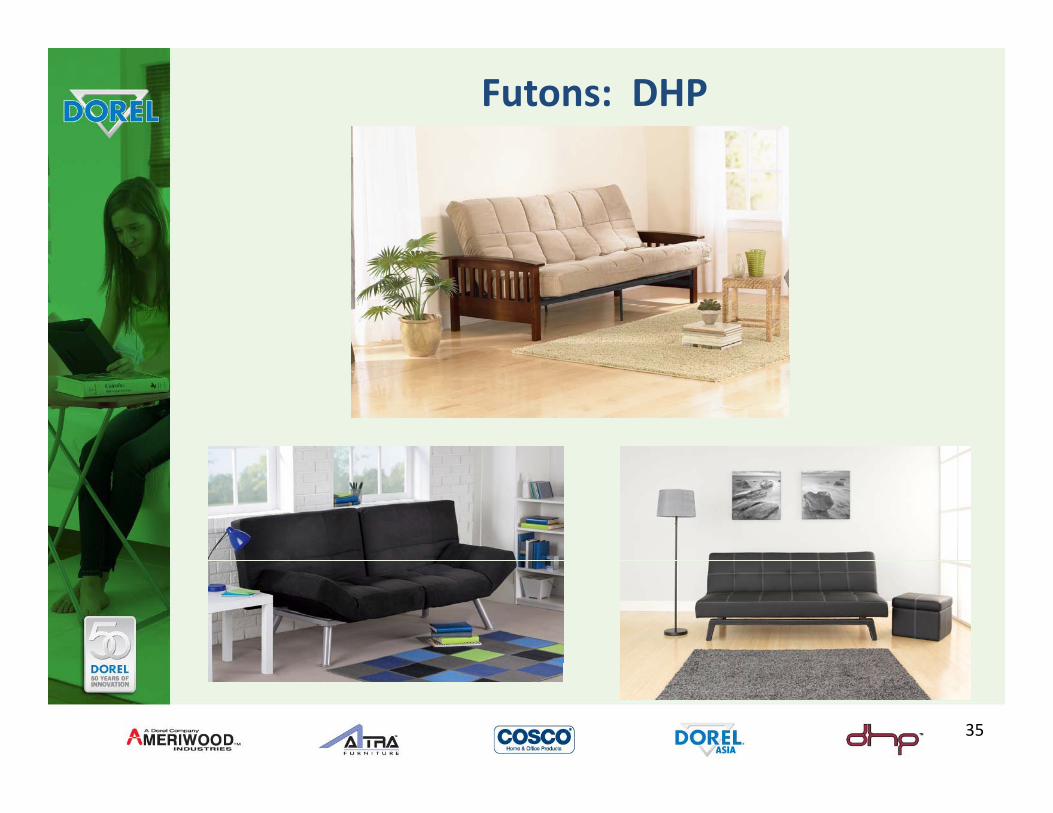
Futons: DHP
35
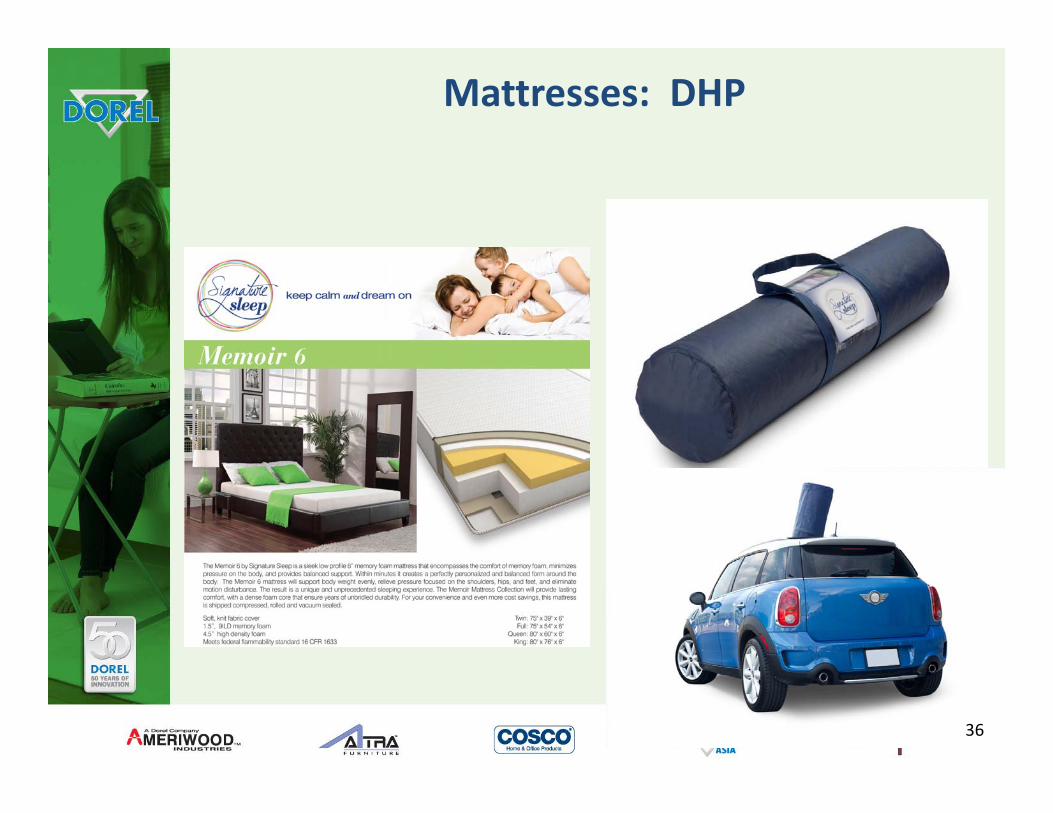
Mattresses: DHP
36
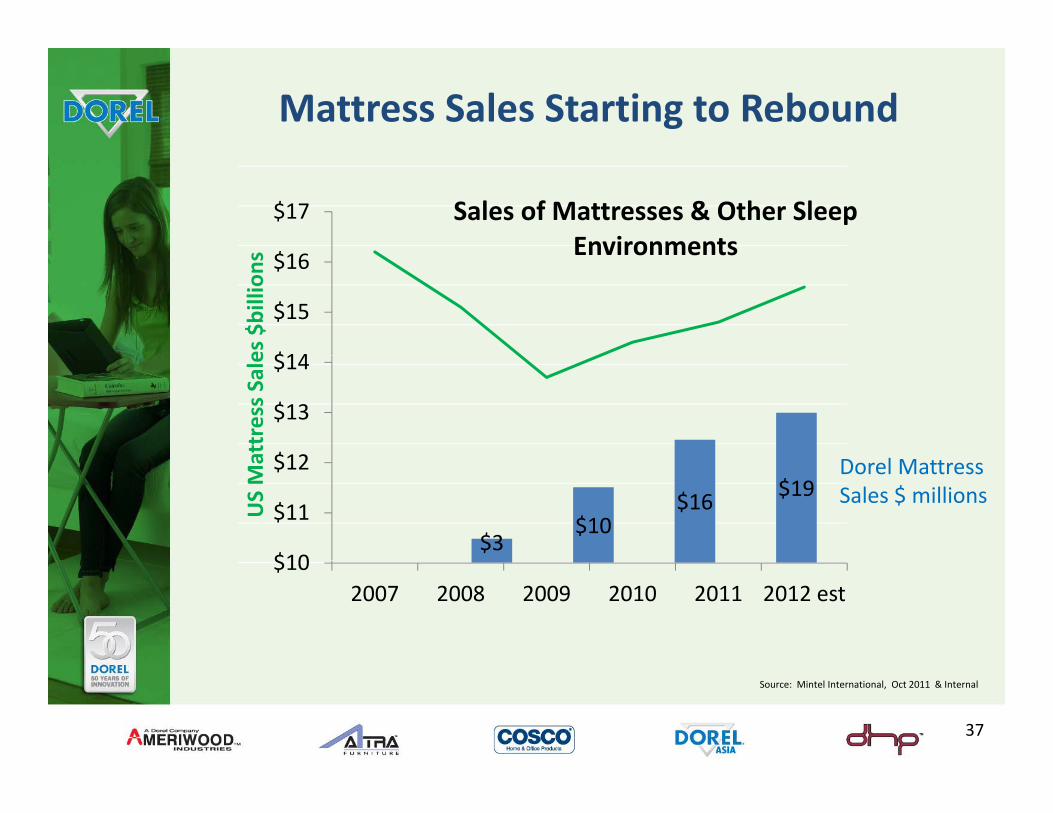
Mattress Sales Starting to Rebound
$
$17
s
Sales of Mattresses & Other Sleep Environments
$14
$15
$16es $billion
s Environments
l$12
$13
$14
attress Sale
$3$10
$16 $19Dorel Mattress Sales $ millions
$10
$11
$12
US Ma
$102007 2008 2009 2010 2011 2012 est
Source: Mintel International, Oct 2011 & Internal
37

38
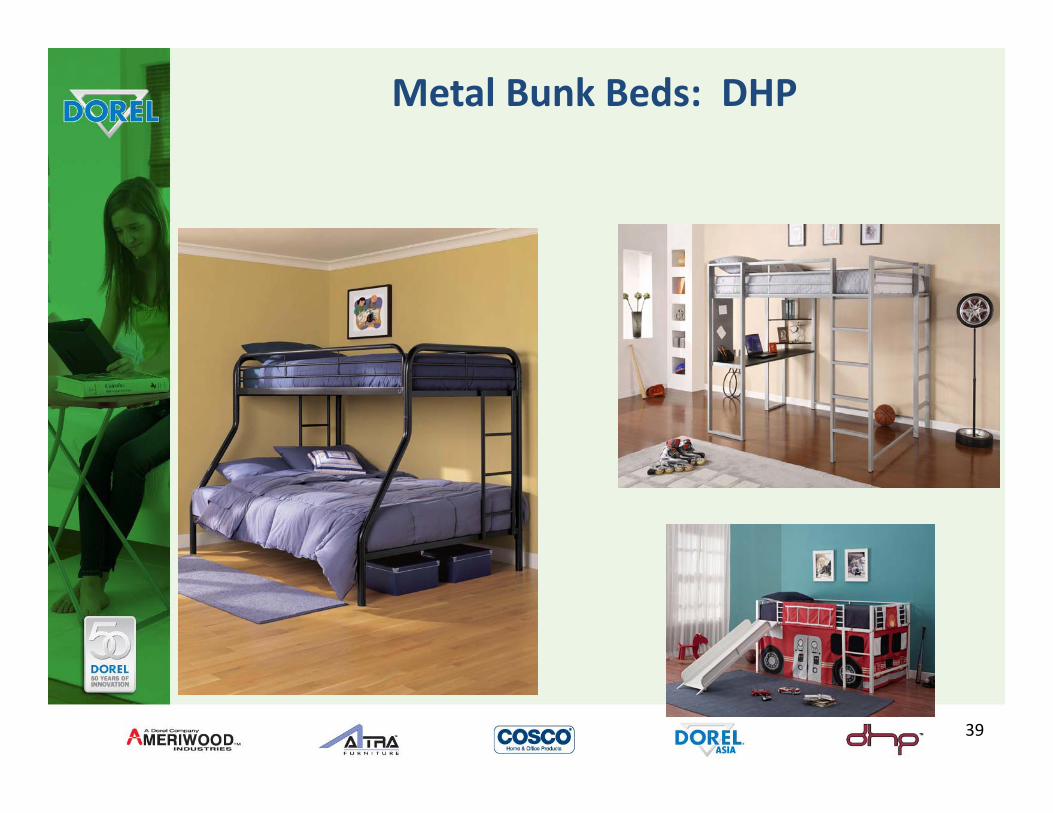
Metal Bunk Beds: DHP
39
Dorel Asia
• Importer
Upholstery– Upholstery
– Bedroom
– Dining and KitchenDining and Kitchen
– Youth
– Accent
• Import distribution facility– Ontario, California, Savannah,
GeorgiaGeorgia
• Main customers‐mass merchants, clubs, Internet
40
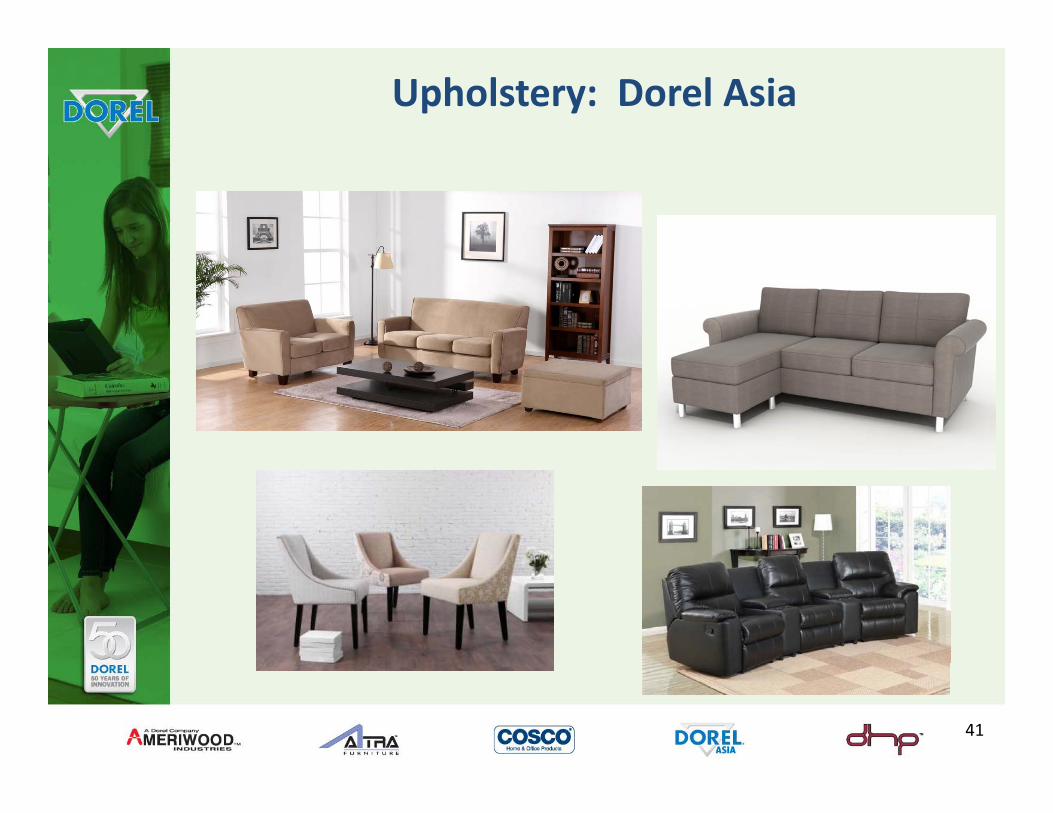
Upholstery: Dorel Asia
41
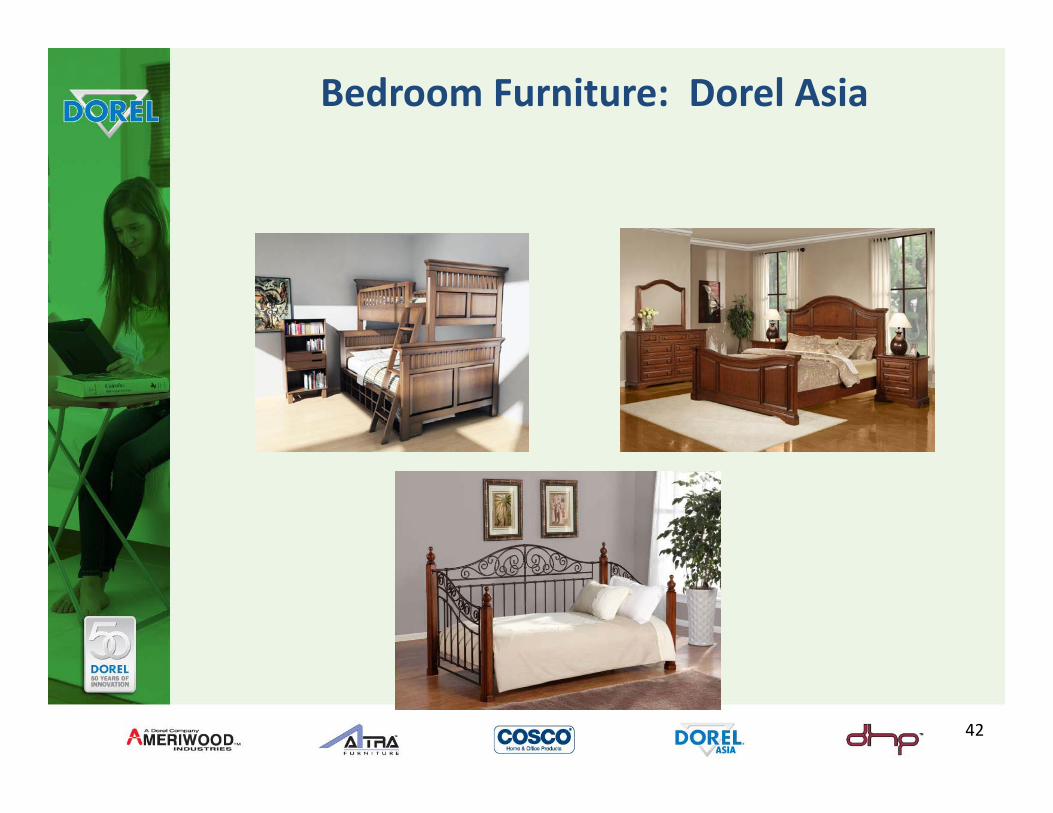
Bedroom Furniture: Dorel Asia
42
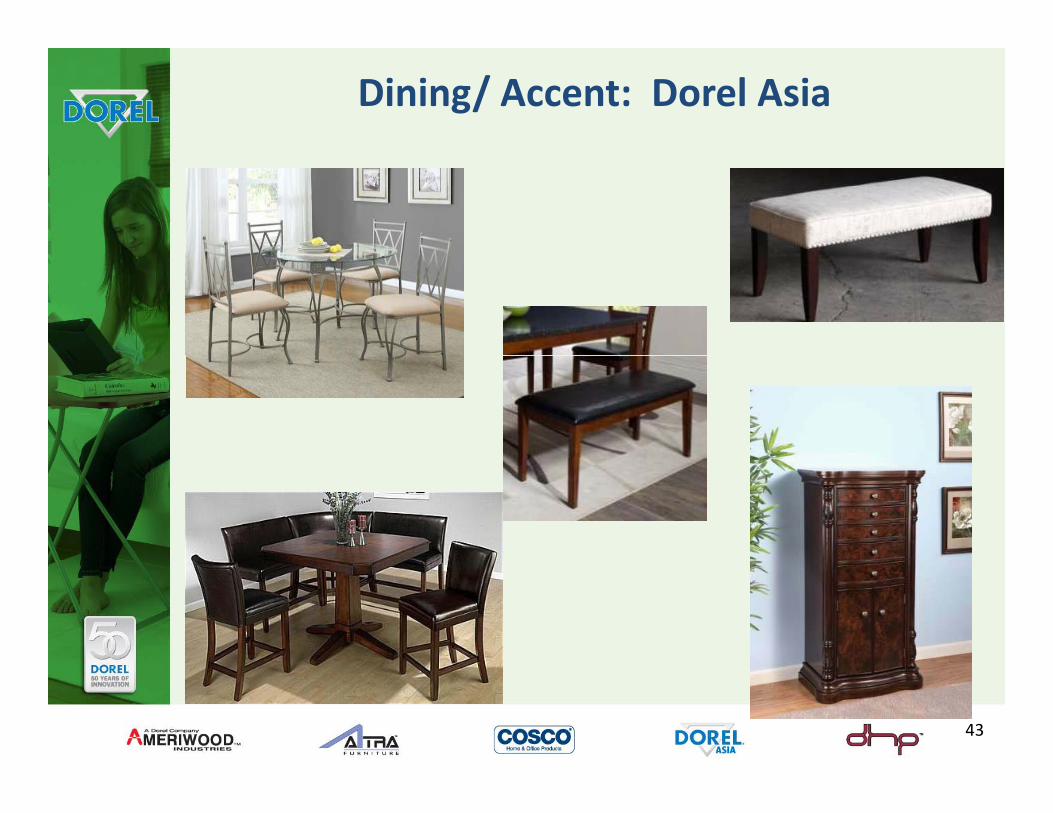
Dining/ Accent: Dorel Asia
43
E‐Commerce• On‐line research now very important for comparison shopping
• “Free Ship” sights or “free pick‐up at store” driving on‐line purchasespurchases
• Importance of on‐line reviews in buying decision
• Physical footprint of furniture at “brick and mortar” retailers is d l ldriving on‐line line extensions
• Ability to use video and animation will allow for increases on‐line
• 2/3rds of consumers still want to touch and feel furniture before purchase, especially at the higher end
• Younger consumers increasingly likely to buy on‐line
44
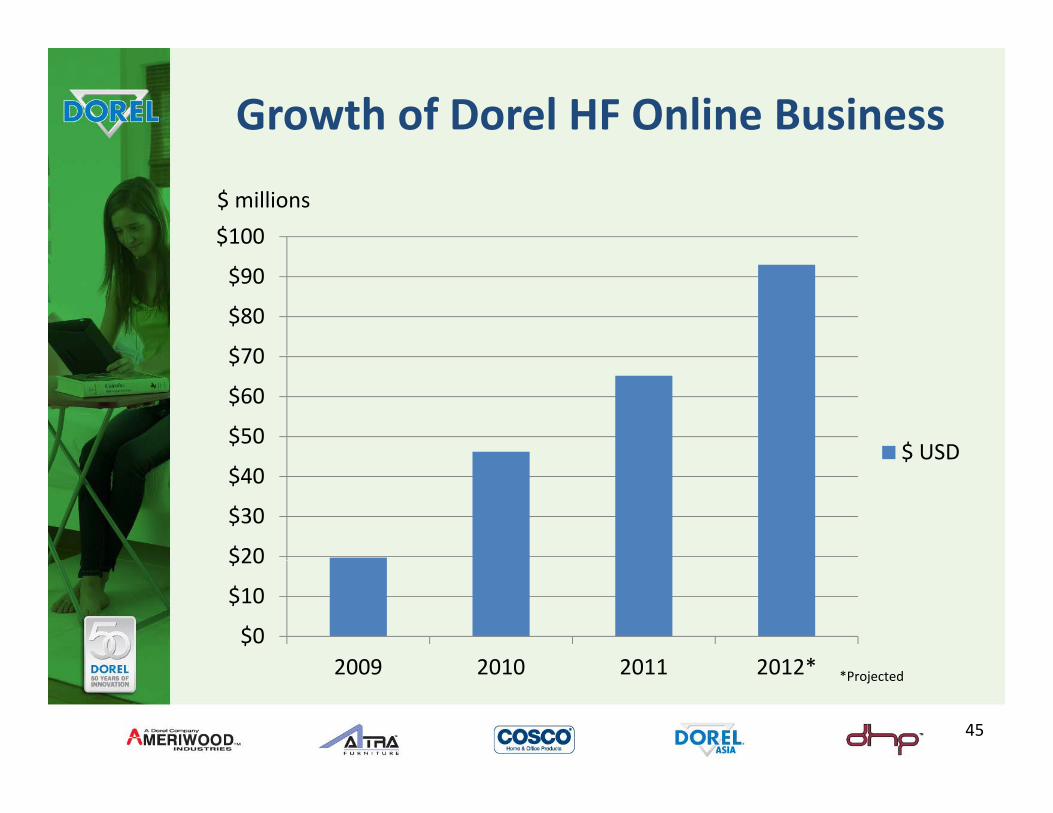
Growth of Dorel HF Online Business
$100
$ millions
$70
$80
$90
$50
$60
$70
$ USD
$20
$30
$40$ USD
$0
$10
$20
2009 2010 2011 2012*2009 2010 2011 2012* *Projected
45
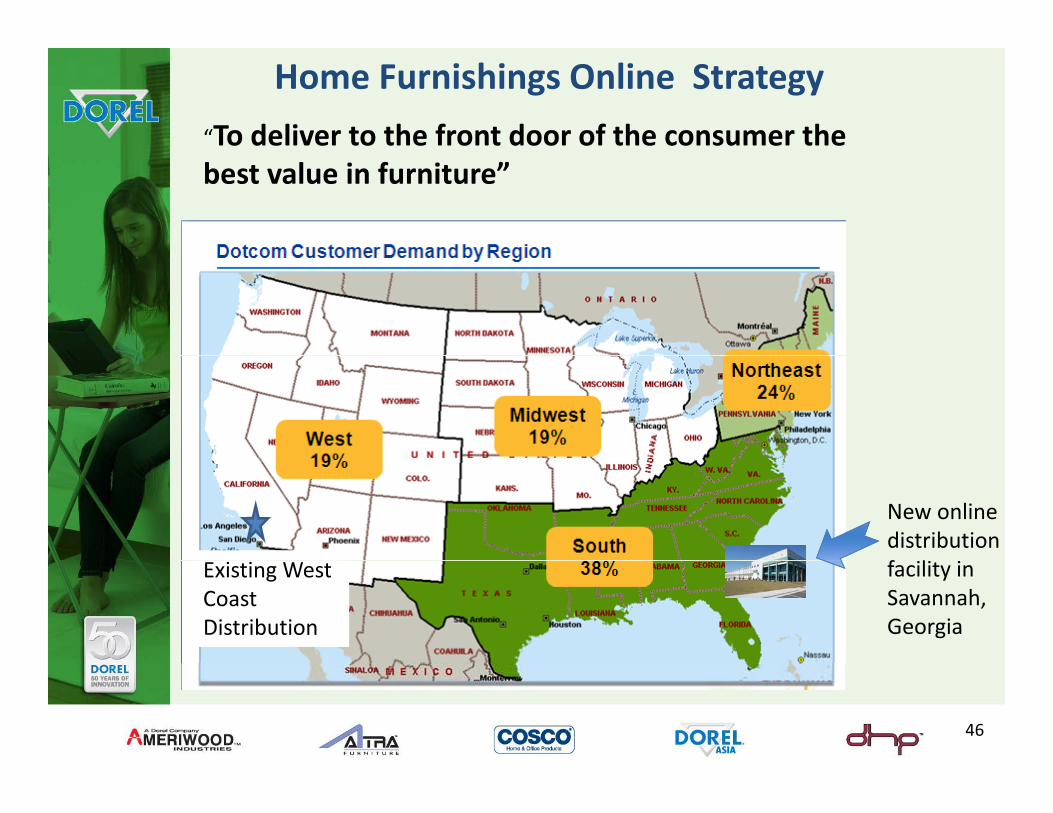
Home Furnishings Online Strategy
“To deliver to the front door of the consumer the best value in furniture”
New online distribution f lfacility in Savannah,Georgia
Existing West Coast Distribution
46
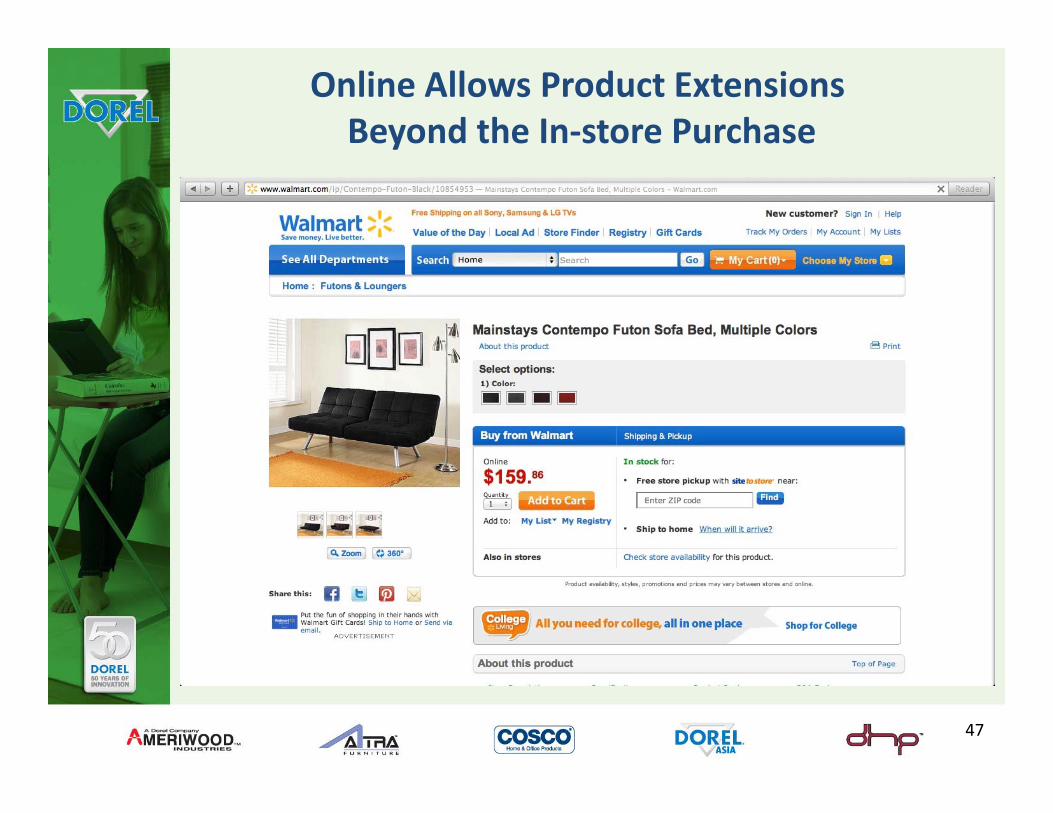
Online Allows Product ExtensionsBeyond the In‐store Purchase
47
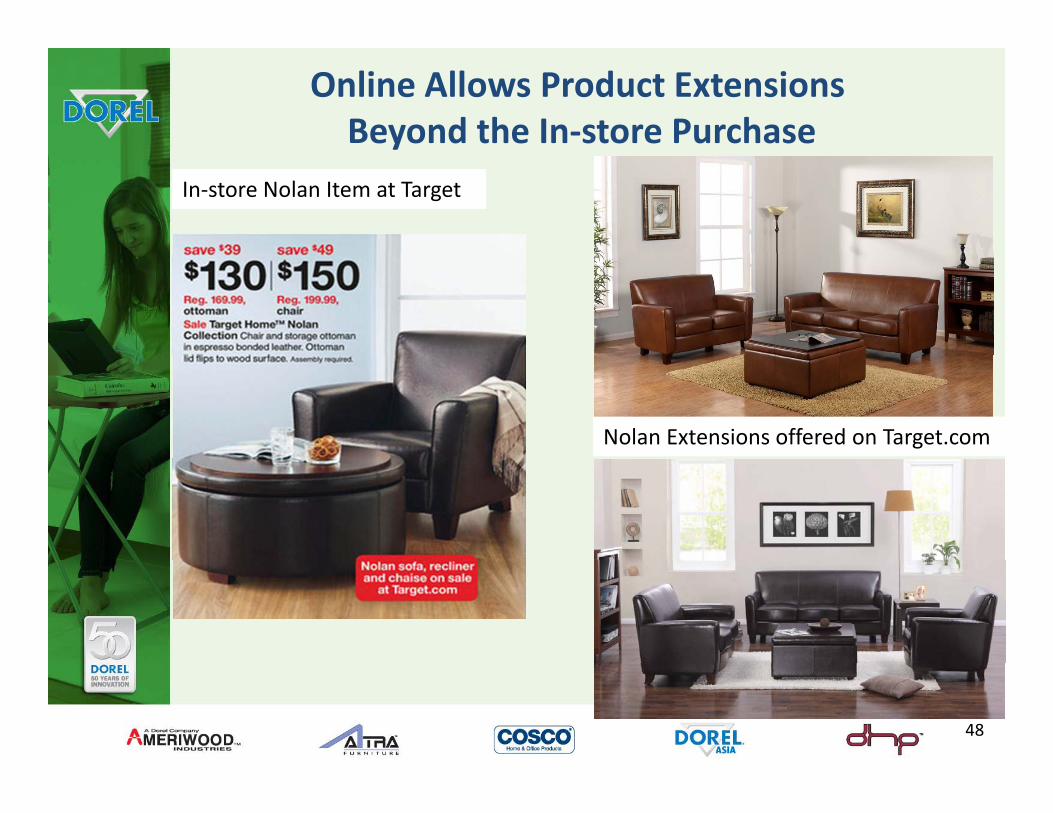
Online Allows Product ExtensionsBeyond the In‐store Purchase
In‐store Nolan Item at Target
Nolan Extensions offered on Target.com
48
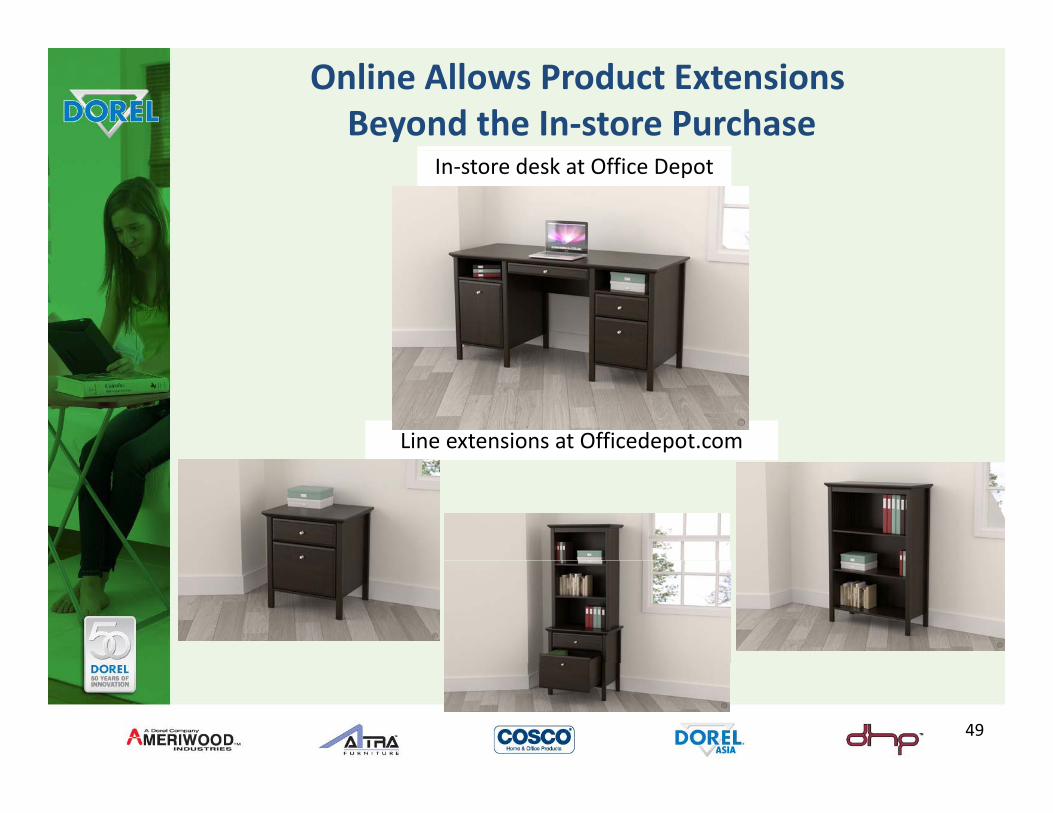
Online Allows Product ExtensionsBeyond the In‐store Purchase
In‐store desk at Office Depot
Line extensions at Officedepot.com
49
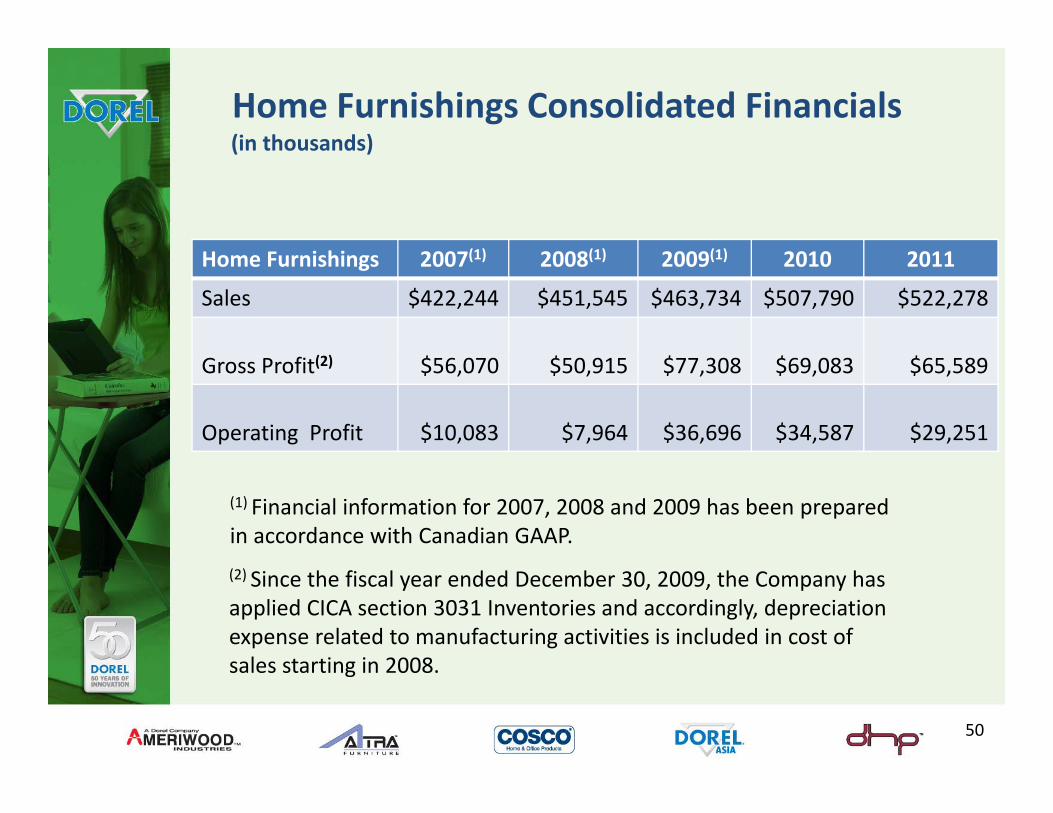
Home Furnishings Consolidated Financials(in thousands)
H F i hi 2007(1) 2008(1) 2009(1) 2010 2011
(in thousands)
Home Furnishings 2007(1) 2008(1) 2009(1) 2010 2011
Sales $422,244 $451,545 $463,734 $507,790 $522,278
( ) $ $ $ $ $Gross Profit(2) $56,070 $50,915 $77,308 $69,083 $65,589
Operating Profit $10,083 $7,964 $36,696 $34,587 $29,251
(1) Financial information for 2007, 2008 and 2009 has been prepared in accordance with Canadian GAAP.
(2) Since the fiscal year ended December 30, 2009, the Company has applied CICA section 3031 Inventories and accordingly, depreciation expense related to manufacturing activities is included in cost of sales starting in 2008
50
sales starting in 2008.
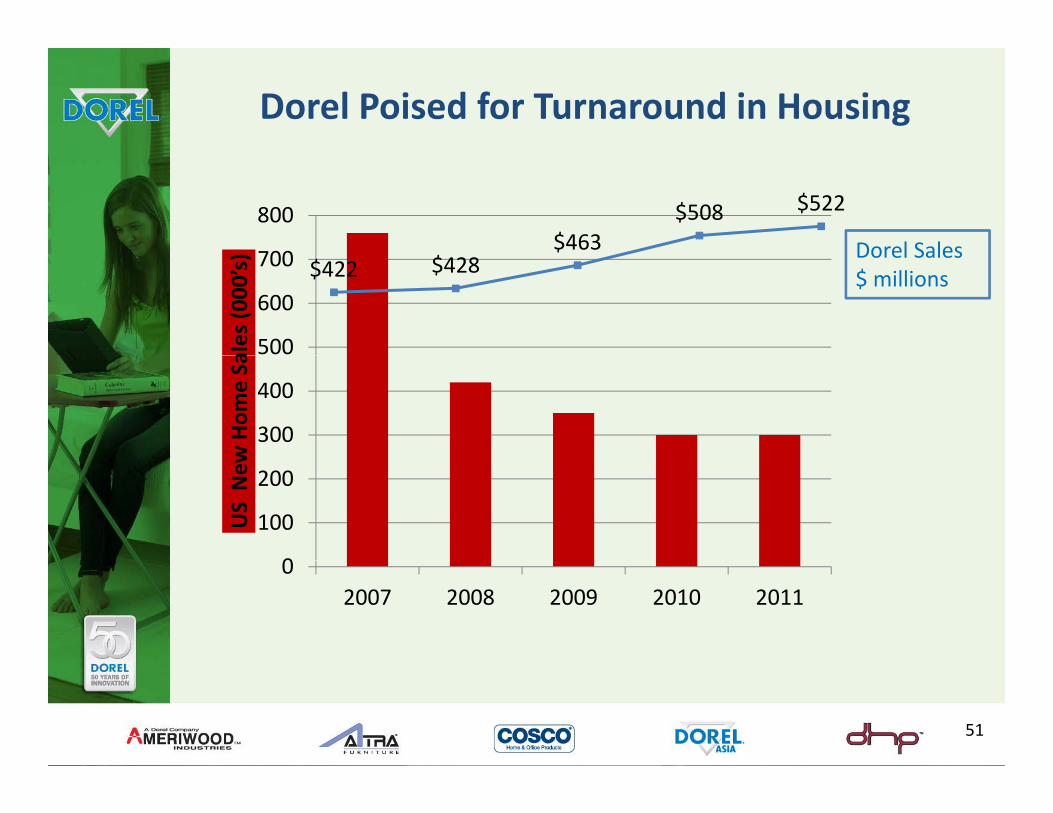
Dorel Poised for Turnaround in Housing
700
800$463
$508 $522
Dorel Sales
500
600
700ales (0
00’s)
$422 $428Dorel Sales $ millions
300
400
w Hom
e Sa
0
100
200
US New
02007 2008 2009 2010 2011
51
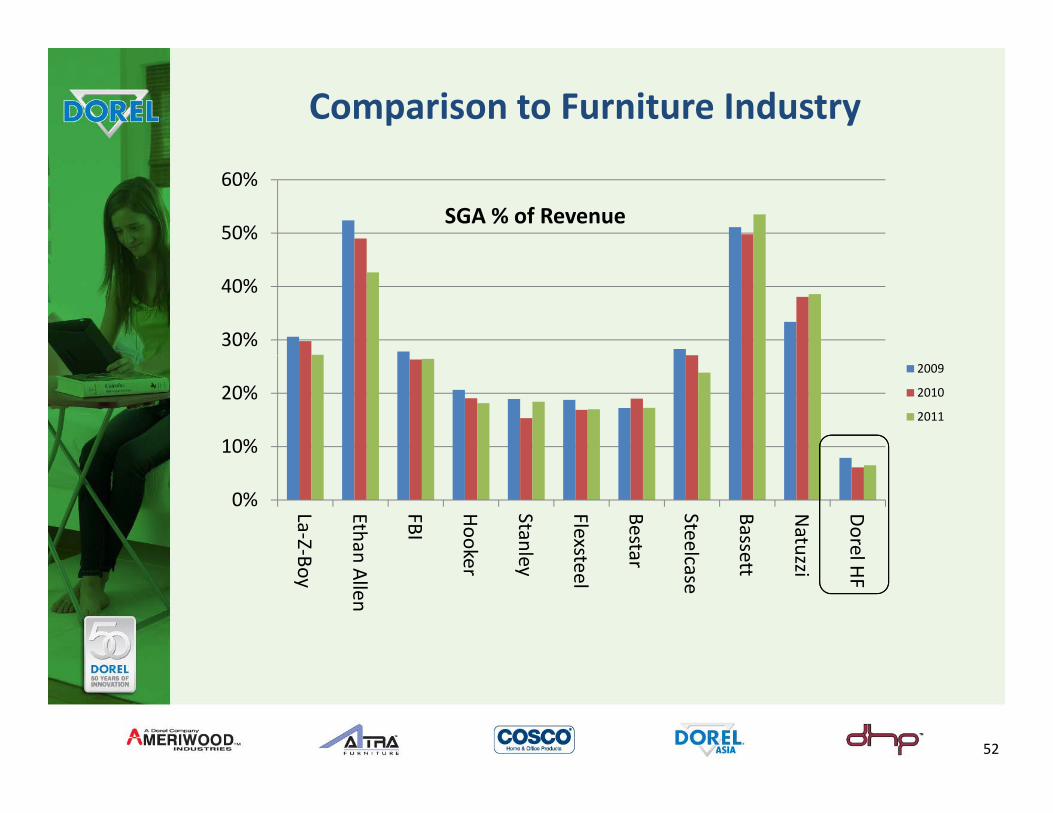
Comparison to Furniture Industry
50%
60%
SGA % of Revenue
30%
40%
10%
20%2009
2010
2011
0% La‐Z‐B
Ethan
FBI
Hooke
Stanle
Flexst
Besta
Steelc
Basse
Natuz
Dorel Boy
n Allen
er
ey
teel
r case
ett
zzi HF
52
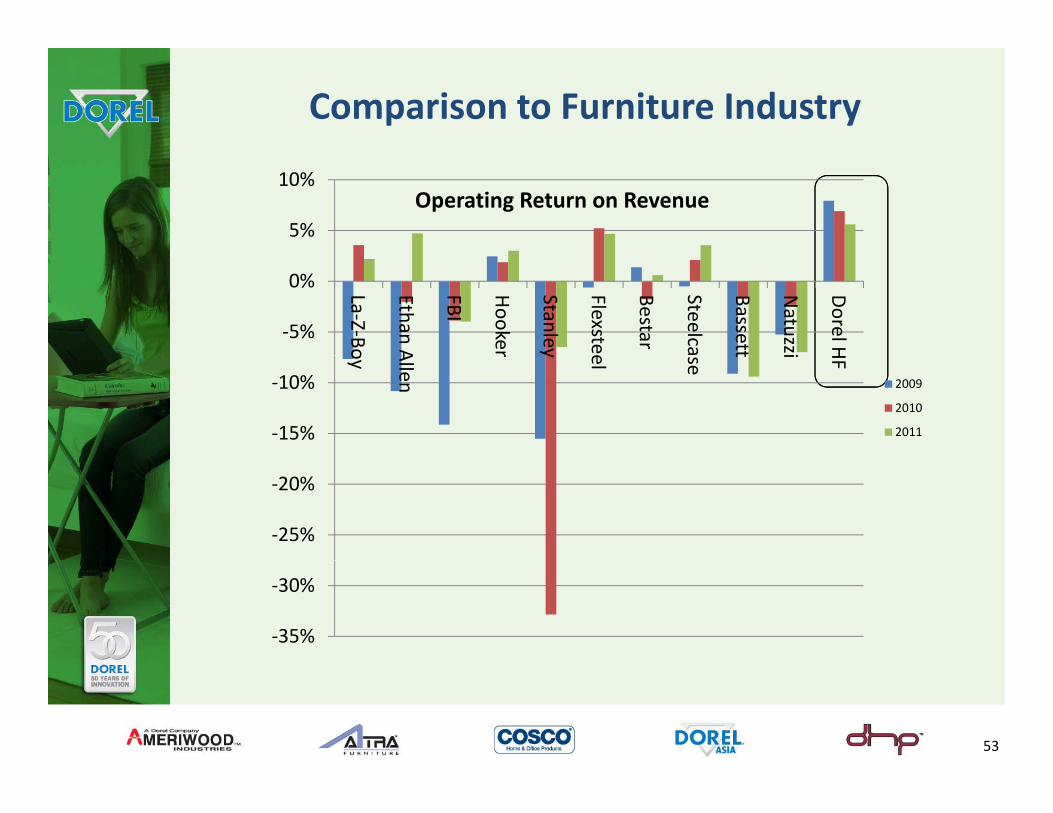
Comparison to Furniture Industry
5%
10%Operating Return on Revenue
‐5%
0% La‐Z‐Bo
Ethan A
FBI
Hooke r
Stanley
Flexstee
Bestar
Steelca
Basset t
Natuzzi
Dorel H
‐15%
‐10%
oy
Allen
r y el
se
t i HF
2009
2010
2011
‐25%
‐20%
‐35%
‐30%
53

The Next Three Years
• Continue to generate significant cash flow for Dorel Industries
• Revenue growth through the development of value‐ oriented, ell designed prod ctwell‐designed product
• Increased penetration: additional customers and channels Strong effort to increase on‐line sales
• Possible consolidation of divisions to increase profitability, efficiencies and effectiveness in product development, sourcing, and customer presentations
• Possible acquisitions in order to drive revenue, expand our product line, or enable vertical integration
• Continued focus on bottom line profitability while increasing d lrevenue and return on capital
54
In Conclusion: The Dorel Advantage
• Diversification
• Domestic manufacturing and import distribution footprint
• Industry leaders in folding furniture, step stools, futons, and among the leaders in RTA
• Customer Base: Focus on big box retailers‐ fastest growing furniture segment. Provide product, sourcing, and logistics expertise
• Taking advantage of consumer trends
• Potential to leverage cross‐divisional synergies through administrative, distribution, and sales/marketing consolidation
• Strong divisional management teamg g
• Corporate strength
THANK YOU.....ANY QUESTIONS?55