Embed Size (px)
Citation preview
Dosage, Implementation and Continuous Quality Improvement in
Public Preschool Education in Chile
Hirokazu Yoshikawa, New York University
MaryCatherine Arbour, Brigham and Women’s Hospital, Harvard Medical School Sidney Atwood, Brigham and Women’s Hospital
Francis Duran, Fundación Educacional Oportunidad Felipe Godoy Ossa, Universidad Diego Portales Ernesto Treviño, Universidad Católica de Chile
Catherine E. Snow, Harvard Graduate School of Education
IDB / EdePO Meeting on Early Childhood Development Program Evaluation, London, June 2016
DRAFT
Funded by Fundación Educacional Oportunidad
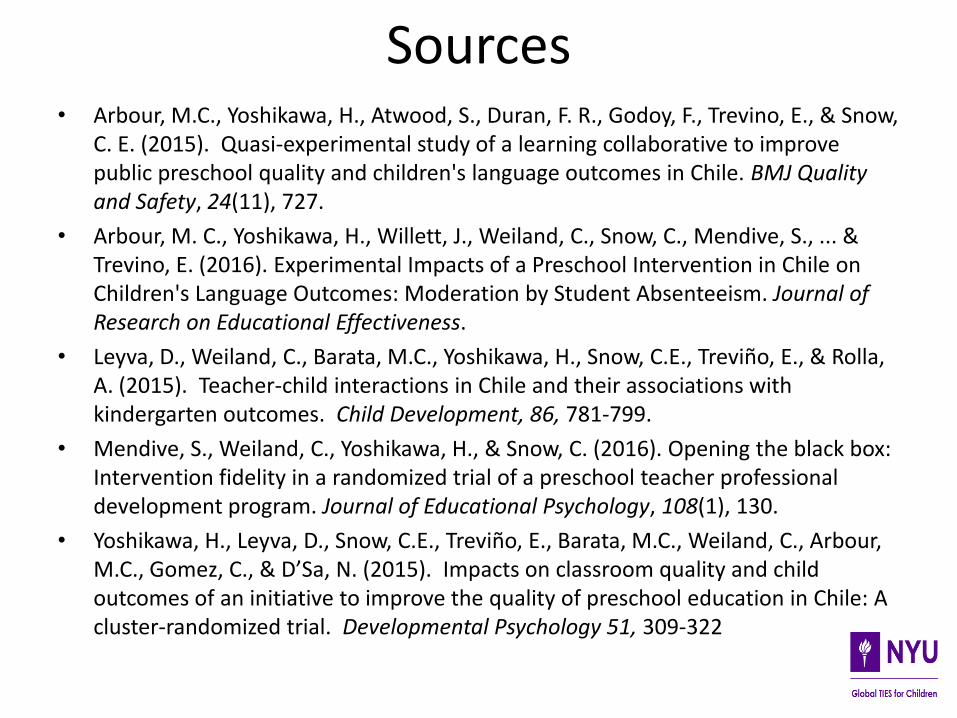
Sources • Arbour, M.C., Yoshikawa, H., Atwood, S., Duran, F. R., Godoy, F., Trevino, E., & Snow,
C. E. (2015). Quasi-experimental study of a learning collaborative to improve public preschool quality and children's language outcomes in Chile. BMJ Quality and Safety, 24(11), 727.
• Arbour, M. C., Yoshikawa, H., Willett, J., Weiland, C., Snow, C., Mendive, S., ... & Trevino, E. (2016). Experimental Impacts of a Preschool Intervention in Chile on Children's Language Outcomes: Moderation by Student Absenteeism. Journal of Research on Educational Effectiveness.
• Leyva, D., Weiland, C., Barata, M.C., Yoshikawa, H., Snow, C.E., Treviño, E., & Rolla, A. (2015). Teacher-child interactions in Chile and their associations with kindergarten outcomes. Child Development, 86, 781-799.
• Mendive, S., Weiland, C., Yoshikawa, H., & Snow, C. (2016). Opening the black box: Intervention fidelity in a randomized trial of a preschool teacher professional development program. Journal of Educational Psychology, 108(1), 130.
• Yoshikawa, H., Leyva, D., Snow, C.E., Treviño, E., Barata, M.C., Weiland, C., Arbour, M.C., Gomez, C., & D’Sa, N. (2015). Impacts on classroom quality and child outcomes of an initiative to improve the quality of preschool education in Chile: A cluster-randomized trial. Developmental Psychology 51, 309-322
3
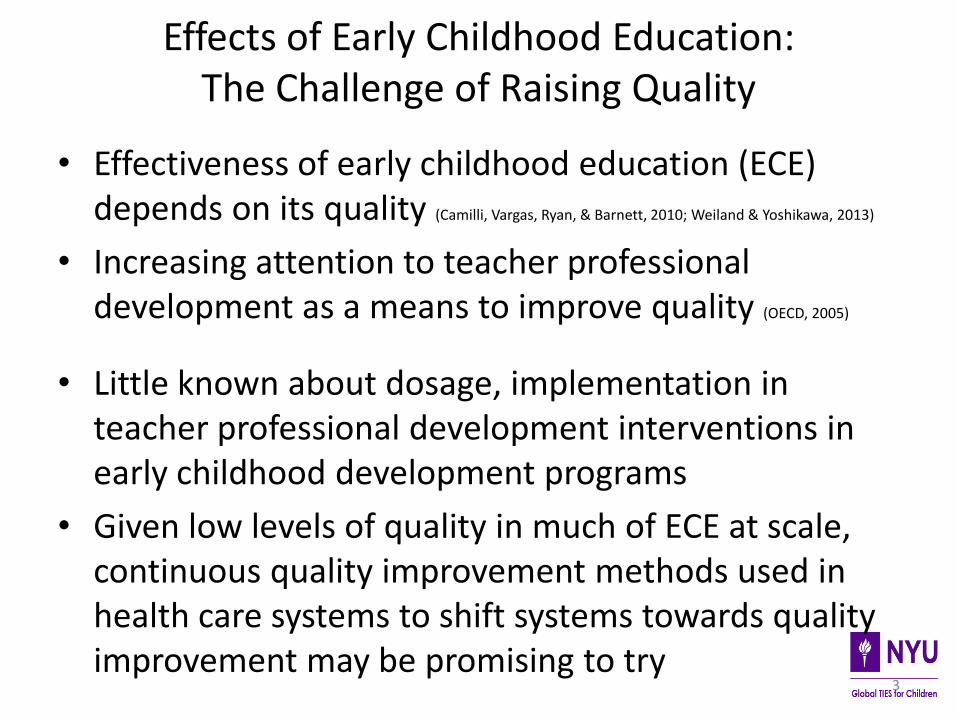
Effects of Early Childhood Education: The Challenge of Raising Quality
• Effectiveness of early childhood education (ECE) depends on its quality (Camilli, Vargas, Ryan, & Barnett, 2010; Weiland & Yoshikawa, 2013)
• Increasing attention to teacher professional development as a means to improve quality (OECD, 2005)
• Little known about dosage, implementation in teacher professional development interventions in early childhood development programs
• Given low levels of quality in much of ECE at scale, continuous quality improvement methods used in health care systems to shift systems towards quality improvement may be promising to try
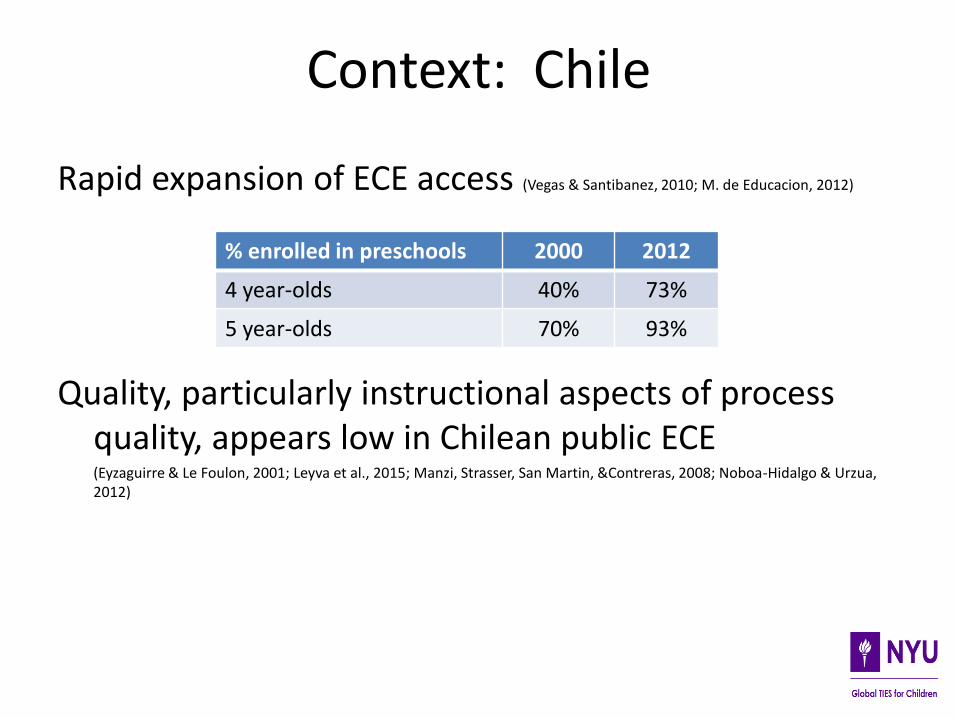
Context: Chile
Rapid expansion of ECE access (Vegas & Santibanez, 2010; M. de Educacion, 2012)
Quality, particularly instructional aspects of process quality, appears low in Chilean public ECE
(Eyzaguirre & Le Foulon, 2001; Leyva et al., 2015; Manzi, Strasser, San Martin, &Contreras, 2008; Noboa-Hidalgo & Urzua, 2012)
% enrolled in preschools 2000 2012
4 year-olds 40% 73%
5 year-olds 70% 93%
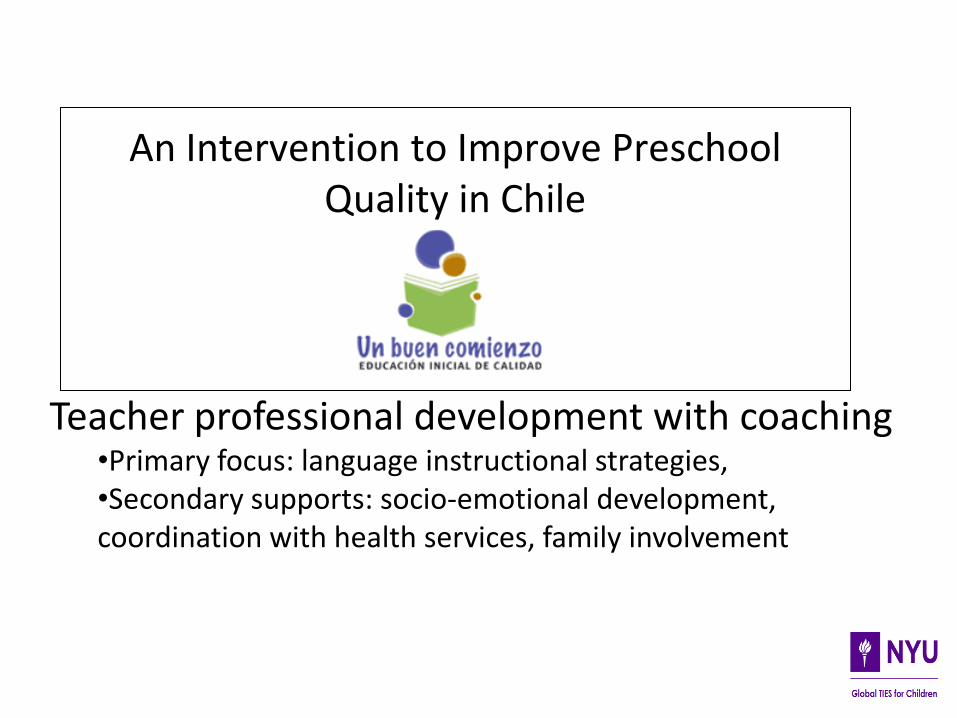
An Intervention to Improve Preschool
Quality in Chile Teacher professional development with coaching
•Primary focus: language instructional strategies, •Secondary supports: socio-emotional development, coordination with health services, family involvement
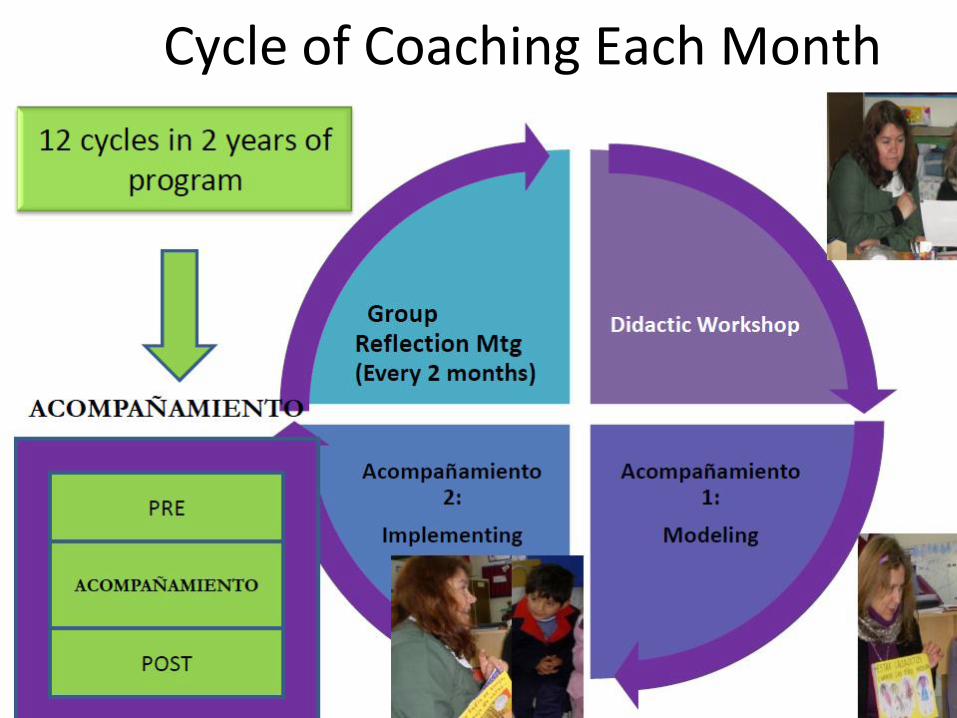
Cycle of Coaching Each Month
-0.07 0.09 -0.03 -0.06 0.002
0.181 0.214 -0.11
-1
-0.8
-0.6
-0.4
-0.2
0
0.2
0.4
0.6
0.8
1
Vo
cab
ula
ry
Lett
er-w
ord
ID
Emer
gen
t W
riti
ng
Co
mp
reh
ensi
on
Q1
, Vo
cab
ula
ry
Q1
, Let
ter-
wo
rd ID
Q1
, Em
erge
nt
Wri
tin
g
Q1
, Co
mp
reh
ensi
on
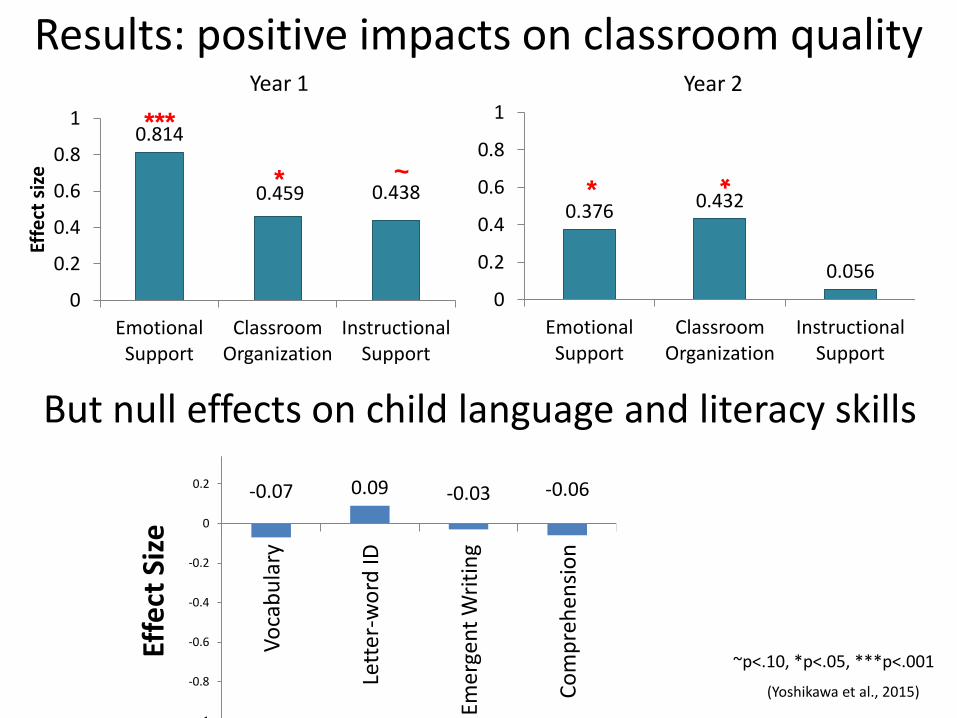
0.376 0.432
0.056
0
0.2
0.4
0.6
0.8
1
Emotional Support
Classroom Organization
Instructional Support
Results: positive impacts on classroom quality
0.814
0.459 0.438
0
0.2
0.4
0.6
0.8
1
Emotional Support
Classroom Organization
Instructional Support
Effe
ct s
ize
***
* ~
~p<.10, *p<.05, ***p<.001
*
*
Effe
ct S
ize
But null effects on child language and literacy skills
(Yoshikawa et al., 2015)
Year 1 Year 2
What did children actually experience? Fidelity of Implementation Study
(Mendive, Weiland, Yoshikawa, & Snow, 2015, Jl of Educational Psychology)
• Minute-by-minute video coding of targeted and non-targeted teaching strategies in both experimental and treatment group
• Same video segments (80 minutes per day) used to code the CLASS measure of classroom quality
• Codes: • UBC targeted literacy strategies (e.g. print knowledge,
vocabulary, emergent writing, oral comprehension, adult reading to children)
• Non-targeted literacy strategies (e.g. oral routines, conversation about a theme, isolated phonemic awareness, drawing after listening to a story)
8
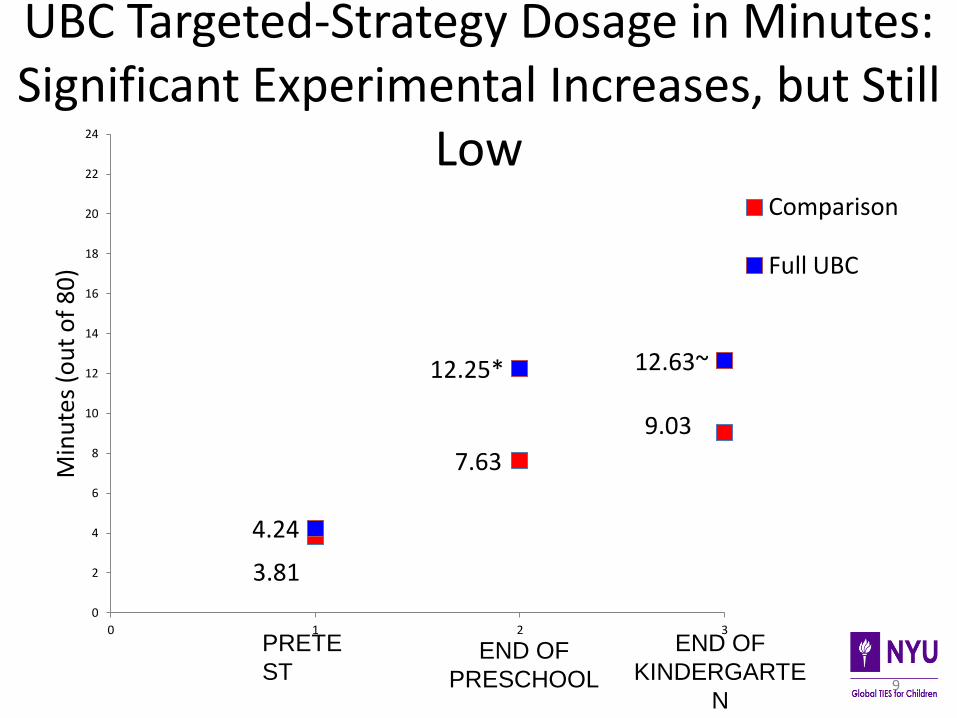
UBC Targeted-Strategy Dosage in Minutes: Significant Experimental Increases, but Still
Low
9
3.81
7.63
9.03
4.24
12.25* 12.63~
0
2
4
6
8
10
12
14
16
18
20
22
24
0 1 2 3
Min
ute
s (o
ut
of
80
)
Comparison
Full UBC
PRETE
ST END OF
PRESCHOOL
END OF
KINDERGARTE
N
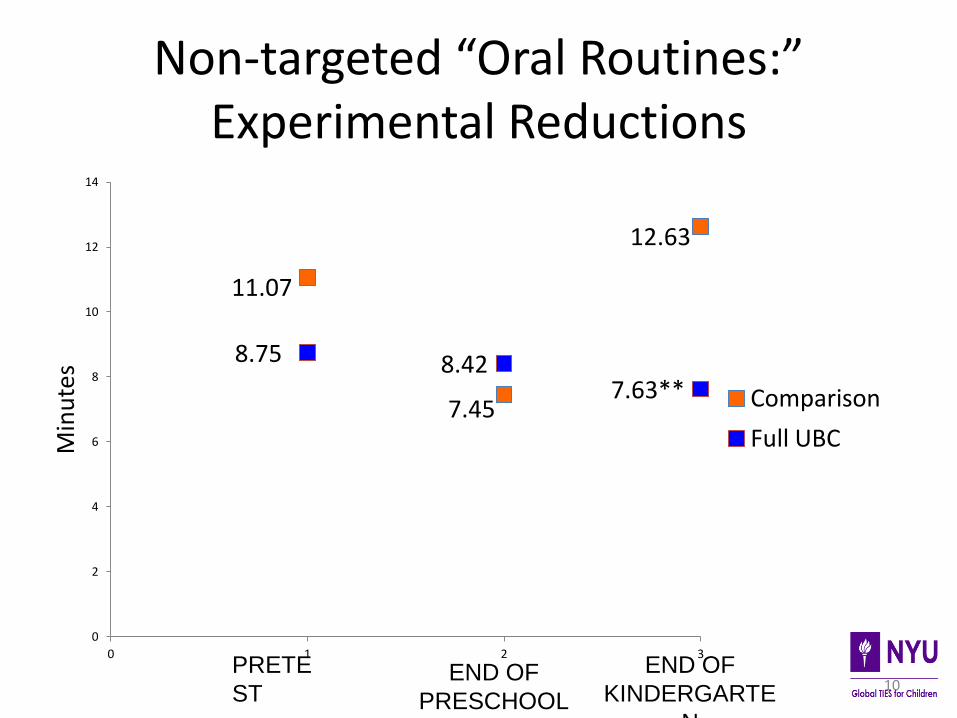
Non-targeted “Oral Routines:” Experimental Reductions
10
11.07
7.45
12.63
8.75 8.42 7.63**
0
2
4
6
8
10
12
14
0 1 2 3
Min
ute
s
Comparison
Full UBC
PRETE
ST END OF
PRESCHOOL
END OF
KINDERGARTE
N
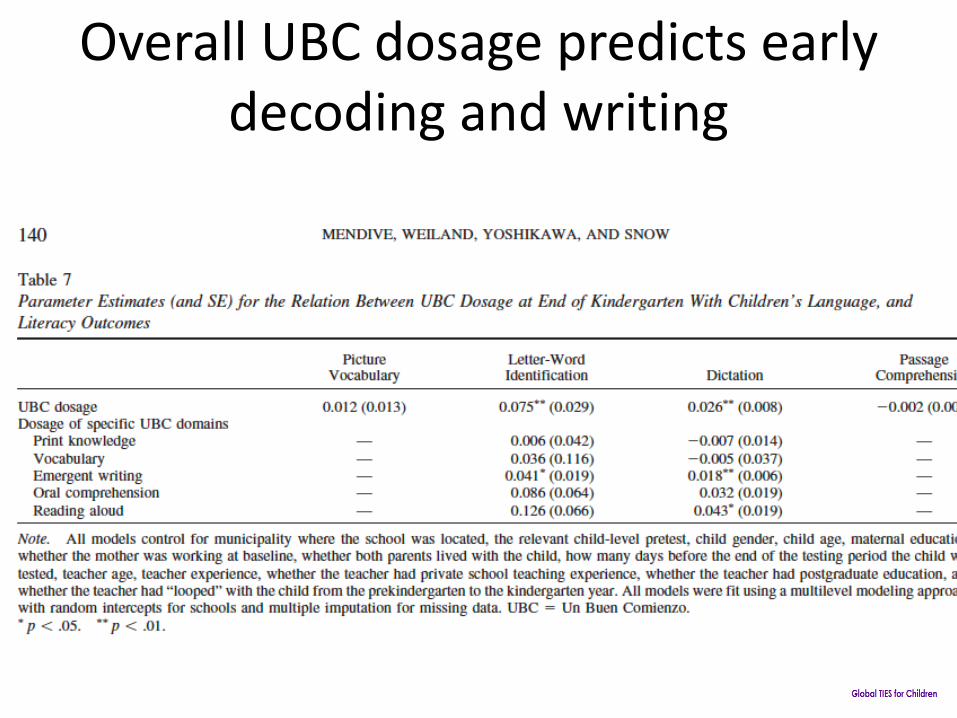
Overall UBC dosage predicts early decoding and writing
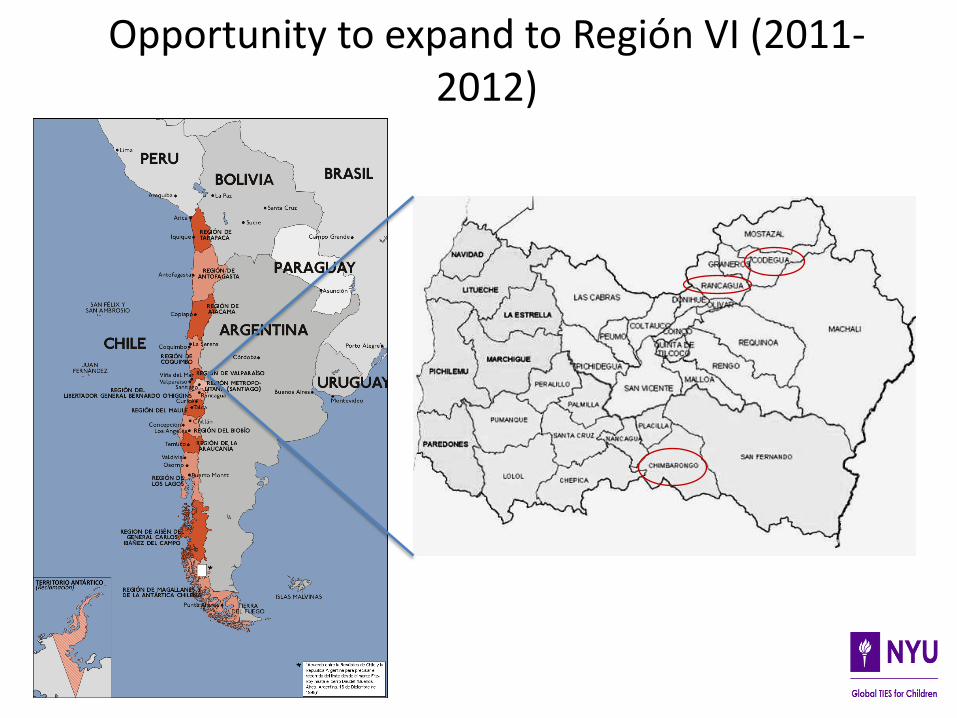
Opportunity to expand to Región VI (2011-2012)
13
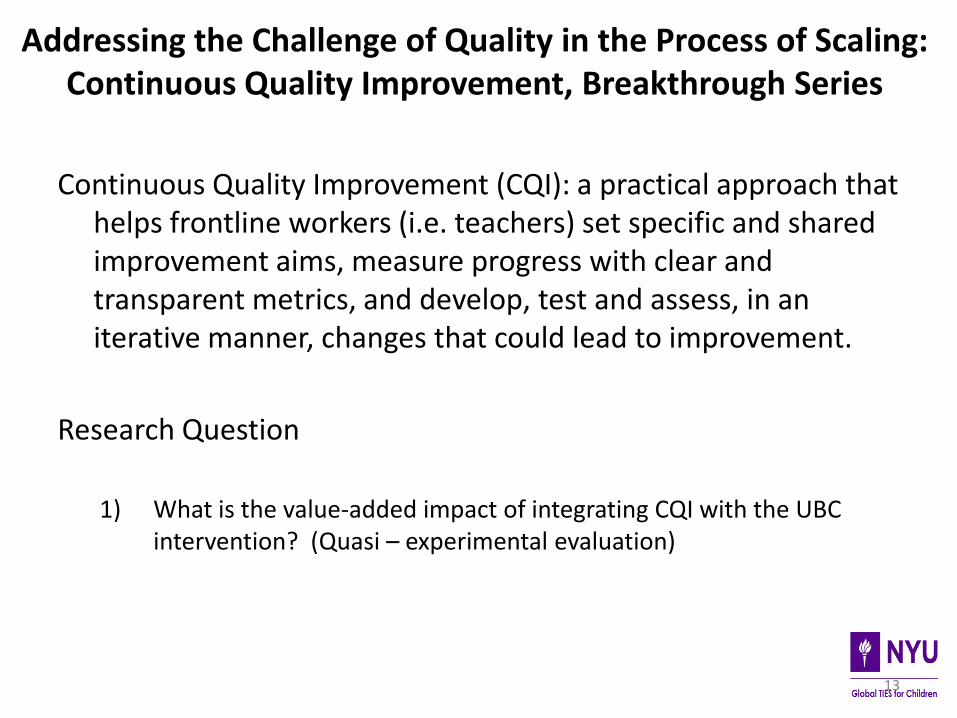
Addressing the Challenge of Quality in the Process of Scaling: Continuous Quality Improvement, Breakthrough Series
Continuous Quality Improvement (CQI): a practical approach that helps frontline workers (i.e. teachers) set specific and shared improvement aims, measure progress with clear and transparent metrics, and develop, test and assess, in an iterative manner, changes that could lead to improvement.
Research Question
1) What is the value-added impact of integrating CQI with the UBC intervention? (Quasi – experimental evaluation)
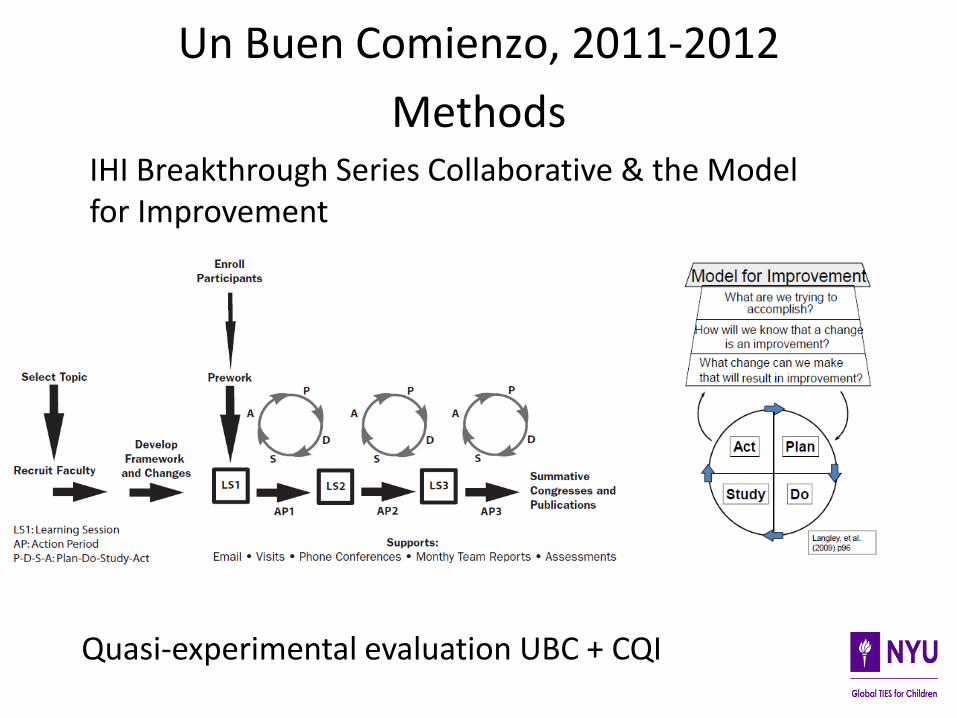
IHI Breakthrough Series Collaborative & the Model for Improvement
Un Buen Comienzo, 2011-2012
Methods
Quasi-experimental evaluation UBC + CQI
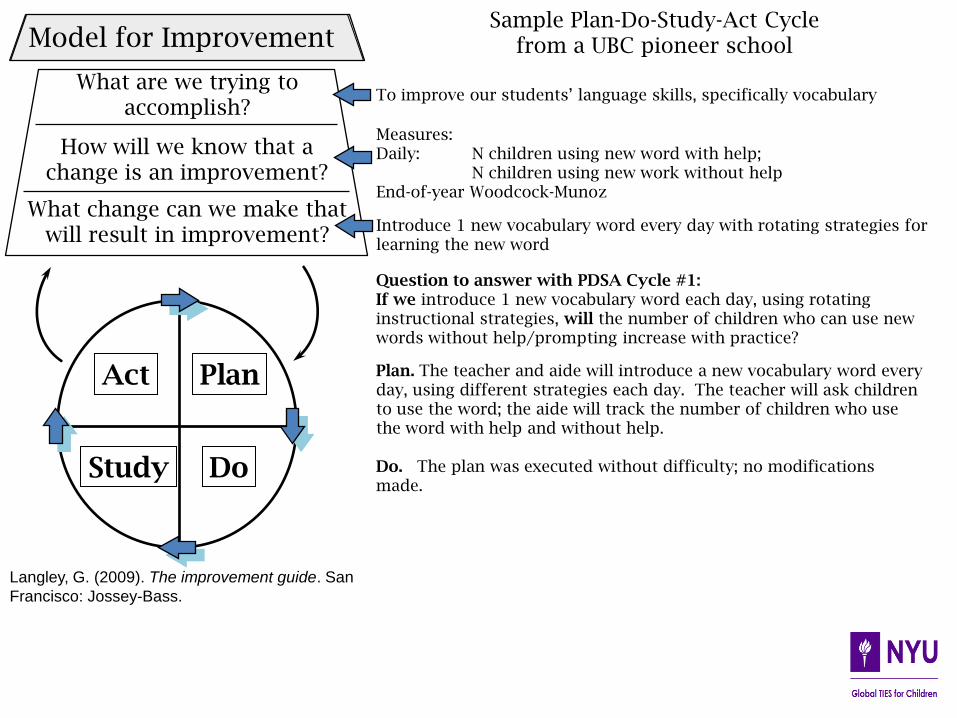
What are we trying to accomplish?
How will we know that a change is an improvement?
What change can we make that will result in improvement?
Model for Improvement
Act Plan
Study Do
Langley, G. (2009). The improvement guide. San
Francisco: Jossey-Bass.
Plan. The teacher and aide will introduce a new vocabulary word every day, using different strategies each day. The teacher will ask children to use the word; the aide will track the number of children who use the word with help and without help. Do. The plan was executed without difficulty; no modifications made.
To improve our students’ language skills, specifically vocabulary
Measures: Daily: N children using new word with help; N children using new work without help End-of-year Woodcock-Munoz
Introduce 1 new vocabulary word every day with rotating strategies for learning the new word
Question to answer with PDSA Cycle #1: If we introduce 1 new vocabulary word each day, using rotating instructional strategies, will the number of children who can use new words without help/prompting increase with practice?
Sample Plan-Do-Study-Act Cycle from a UBC pioneer school
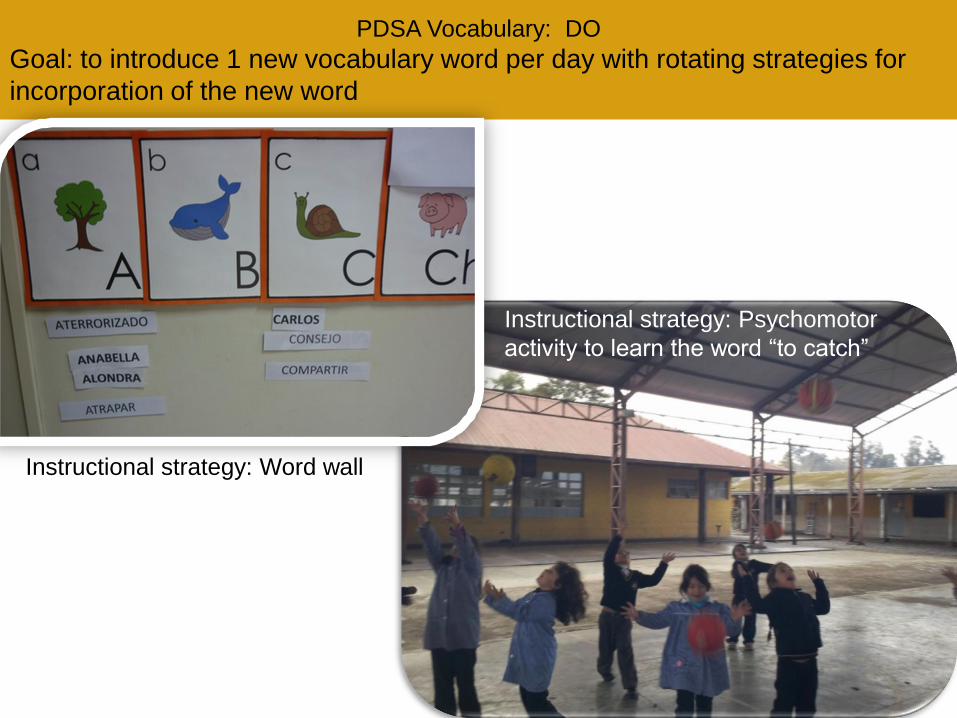
PDSA Vocabulary: DO
Goal: to introduce 1 new vocabulary word per day with rotating strategies for
incorporation of the new word
Instructional strategy: Word wall
Instructional strategy: Psychomotor
activity to learn the word “to catch”
0
1
2
3
4
5
6
7
8
9
N o
f C
hild
ren
Date
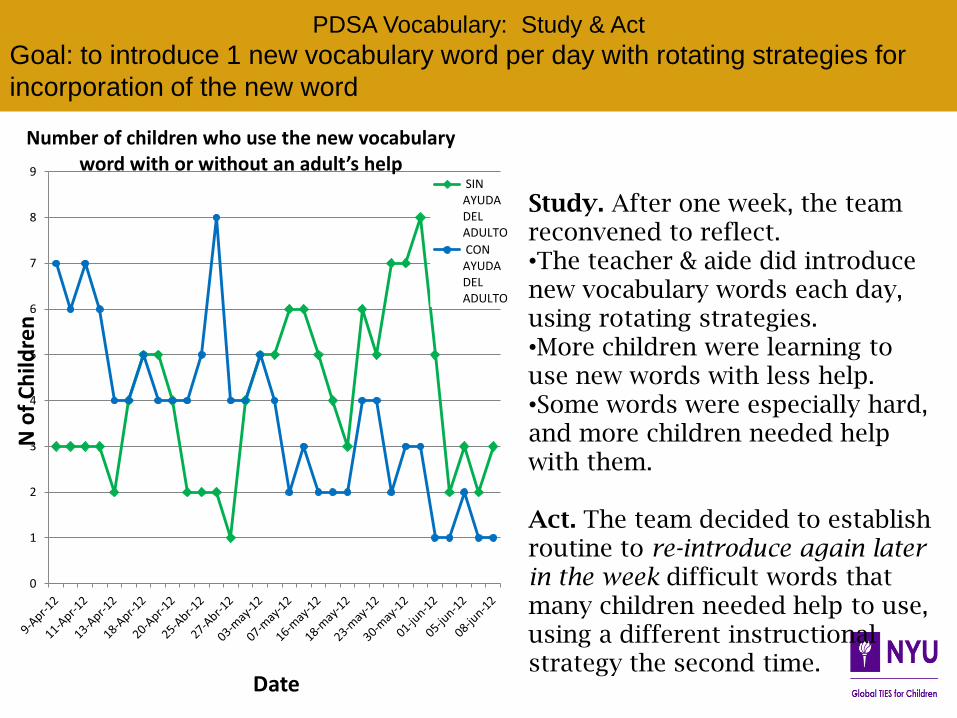
Number of children who use the new vocabulary word with or without an adult’s help
SIN AYUDA DEL ADULTO
CON AYUDA DEL ADULTO
PDSA Vocabulary: Study & Act
Goal: to introduce 1 new vocabulary word per day with rotating strategies for
incorporation of the new word
Study. After one week, the team reconvened to reflect. •The teacher & aide did introduce new vocabulary words each day, using rotating strategies. •More children were learning to use new words with less help. •Some words were especially hard, and more children needed help with them. Act. The team decided to establish routine to re-introduce again later in the week difficult words that many children needed help to use, using a different instructional strategy the second time.
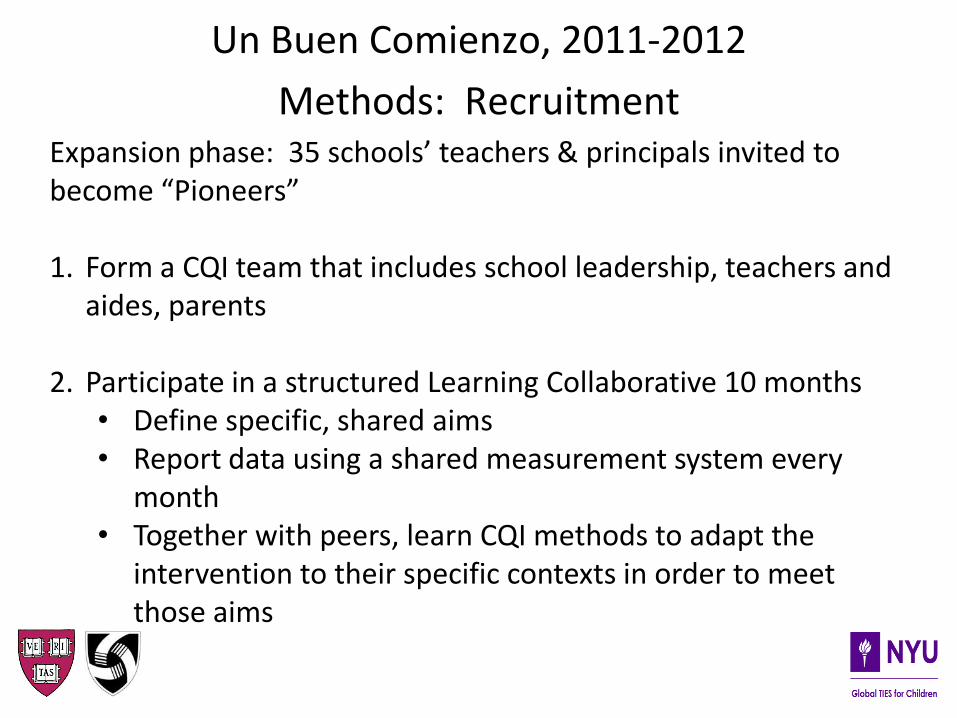
Un Buen Comienzo, 2011-2012
Methods: Recruitment Expansion phase: 35 schools’ teachers & principals invited to become “Pioneers” 1. Form a CQI team that includes school leadership, teachers and
aides, parents
2. Participate in a structured Learning Collaborative 10 months • Define specific, shared aims • Report data using a shared measurement system every
month • Together with peers, learn CQI methods to adapt the
intervention to their specific contexts in order to meet those aims
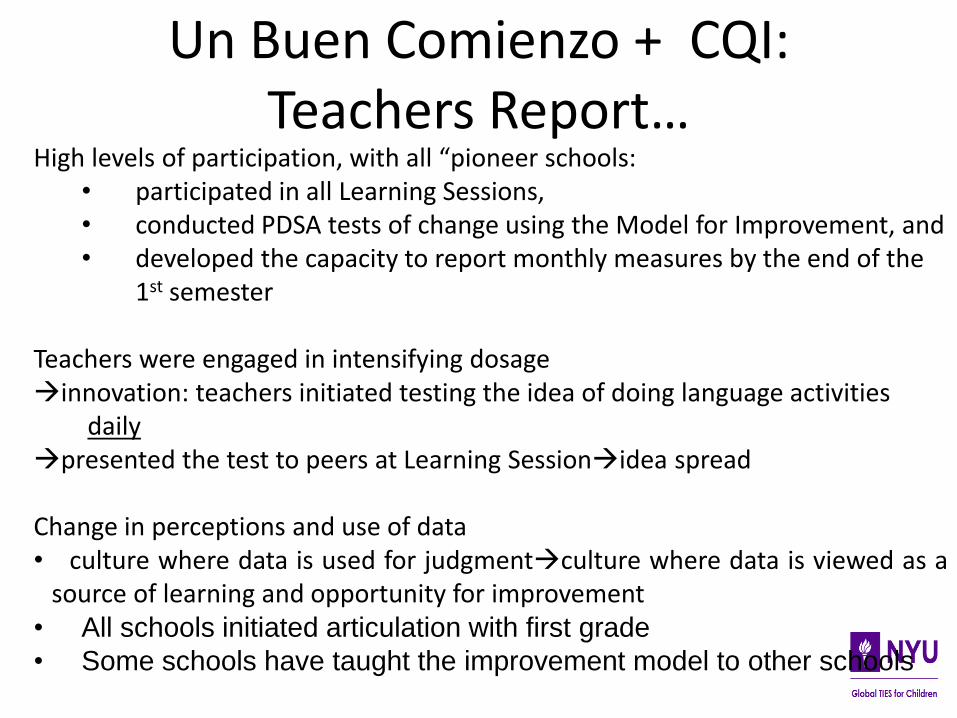
High levels of participation, with all “pioneer schools: • participated in all Learning Sessions, • conducted PDSA tests of change using the Model for Improvement, and • developed the capacity to report monthly measures by the end of the
1st semester
Teachers were engaged in intensifying dosage innovation: teachers initiated testing the idea of doing language activities
daily presented the test to peers at Learning Sessionidea spread Change in perceptions and use of data • culture where data is used for judgmentculture where data is viewed as a
source of learning and opportunity for improvement • All schools initiated articulation with first grade
• Some schools have taught the improvement model to other schools
Un Buen Comienzo + CQI: Teachers Report…
20
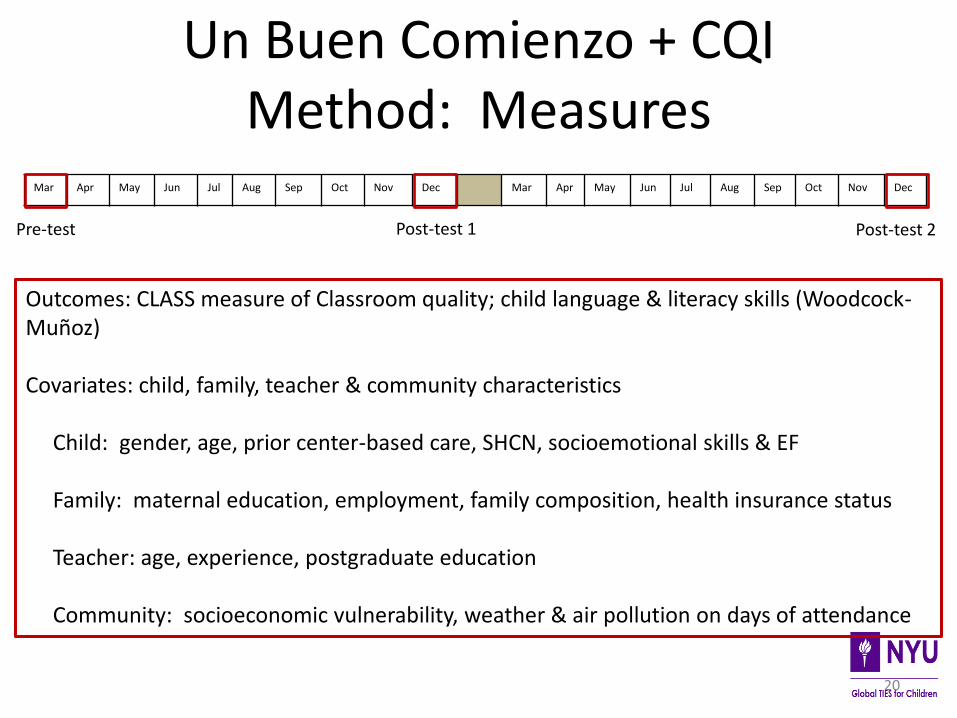
Un Buen Comienzo + CQI Method: Measures
Outcomes: CLASS measure of Classroom quality; child language & literacy skills (Woodcock-Muñoz) Covariates: child, family, teacher & community characteristics Child: gender, age, prior center-based care, SHCN, socioemotional skills & EF Family: maternal education, employment, family composition, health insurance status Teacher: age, experience, postgraduate education Community: socioeconomic vulnerability, weather & air pollution on days of attendance
Mar Apr May Jun Jul Aug Sep Oct Nov Dec Mar Apr May Jun Jul Aug Sep Oct Nov Dec
Pre-test Post-test 1 Post-test 2
3.0
3.5
4.0
4.5
5.0
5.5
6.0
0 1 2 3
0.0
0.5
1.0
1.5
2.0
2.5
3.0
0 1 2 3
UBC
UBC + CQI
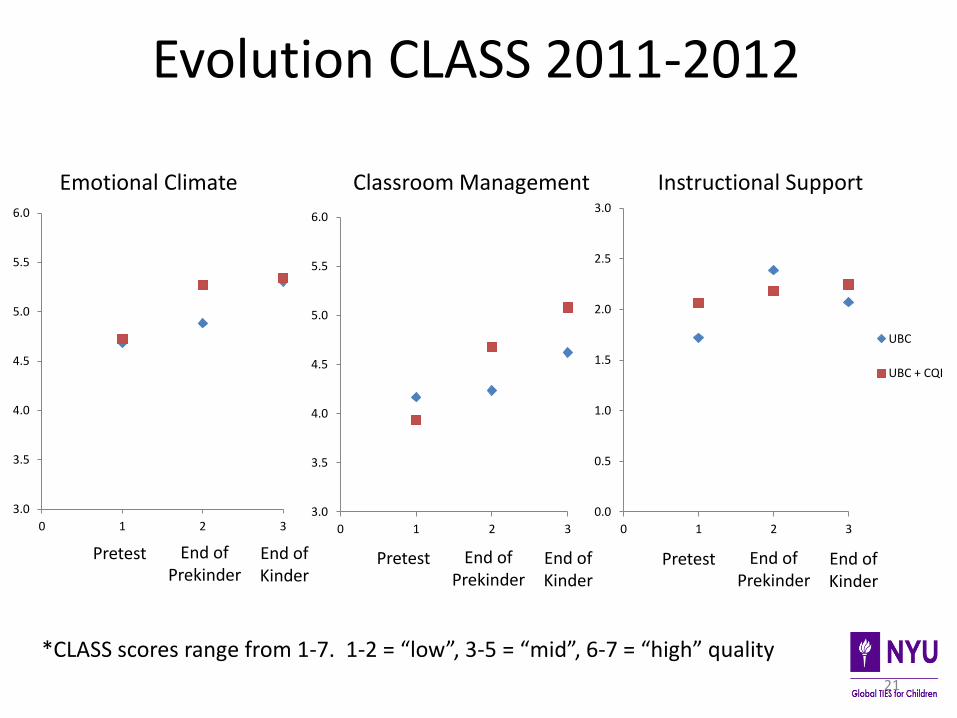
Evolution CLASS 2011-2012
21
3.0
3.5
4.0
4.5
5.0
5.5
6.0
0 1 2 3
Emotional Climate Classroom Management Instructional Support
*CLASS scores range from 1-7. 1-2 = “low”, 3-5 = “mid”, 6-7 = “high” quality
Pretest End of Prekinder
End of Kinder
Pretest End of Prekinder
End of Kinder
Pretest End of Prekinder
End of Kinder
Research Question: What is the impact of UBC + CQI versus UBC alone? Propensity score matching within multilevel model with clustering: 2 steps
Quasi-experimental Study UBC + CQI Method: Analysis Strategy
Quasi-experimental Study UBC + CQI Method: Analysis Strategy
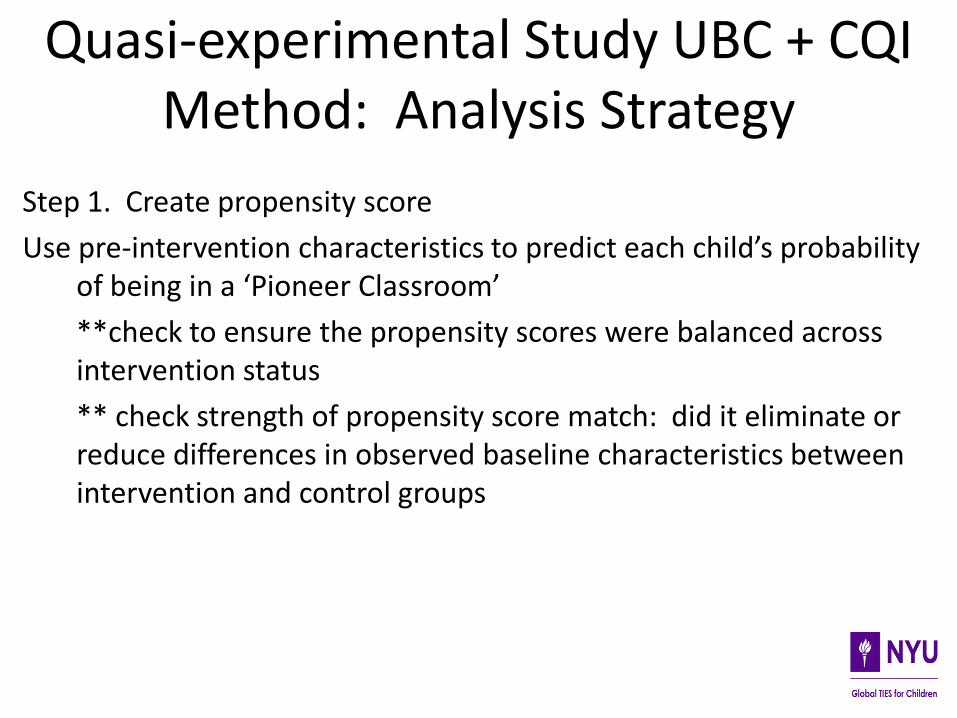
Step 1. Create propensity score
Use pre-intervention characteristics to predict each child’s probability of being in a ‘Pioneer Classroom’
**check to ensure the propensity scores were balanced across intervention status
** check strength of propensity score match: did it eliminate or reduce differences in observed baseline characteristics between intervention and control groups
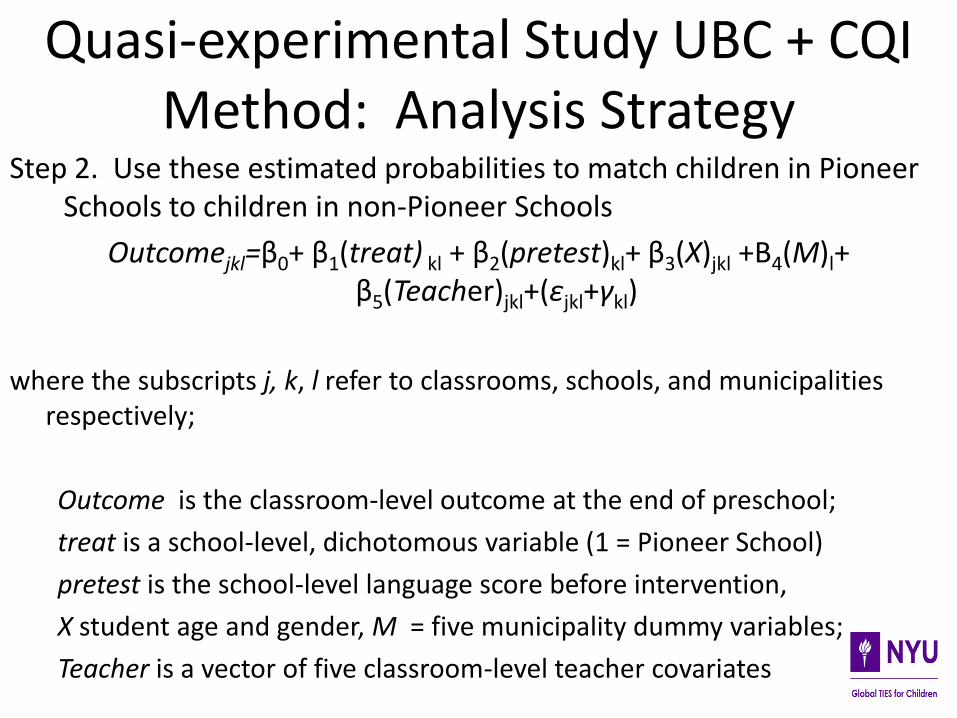
Step 2. Use these estimated probabilities to match children in Pioneer Schools to children in non-Pioneer Schools
Outcomejkl=β0+ β1(treat) kl + β2(pretest)kl+ β3(X)jkl +B4(M)l+ β5(Teacher)jkl+(εjkl+γkl)
where the subscripts j, k, l refer to classrooms, schools, and municipalities respectively;
Outcome is the classroom-level outcome at the end of preschool;
treat is a school-level, dichotomous variable (1 = Pioneer School)
pretest is the school-level language score before intervention,
X student age and gender, M = five municipality dummy variables;
Teacher is a vector of five classroom-level teacher covariates
Quasi-experimental Study UBC + CQI Method: Analysis Strategy

25
1159 children
(in schools)
Control Group 1031 children in 49 Schools that received UBC alone
Treatment group 128 children in 14 ‘Pioneer Schools’
Results: Sample
Final sample: 85.7% of eligible children
There were differences in baseline characteristics across intervention and control schools
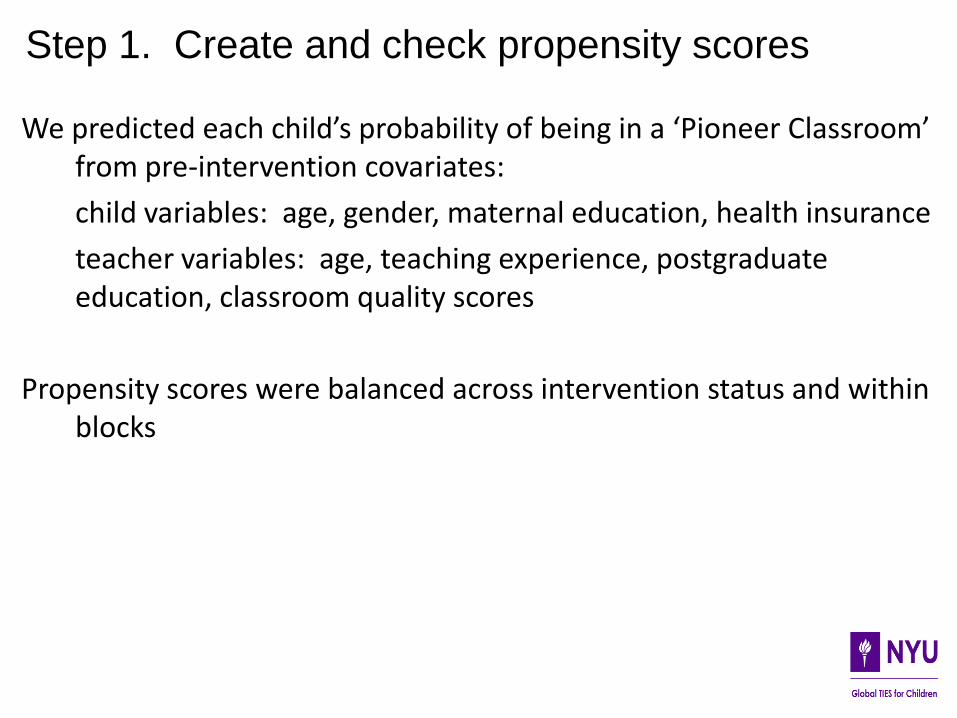
We predicted each child’s probability of being in a ‘Pioneer Classroom’ from pre-intervention covariates:
child variables: age, gender, maternal education, health insurance
teacher variables: age, teaching experience, postgraduate education, classroom quality scores
Propensity scores were balanced across intervention status and within blocks
Step 1. Create and check propensity scores
No Propensity Score Matching Propensity Score Matching
Pioneer
Schools
Non Pioneer
Schools
Pioneer
Schools
Non Pioneer
Schools
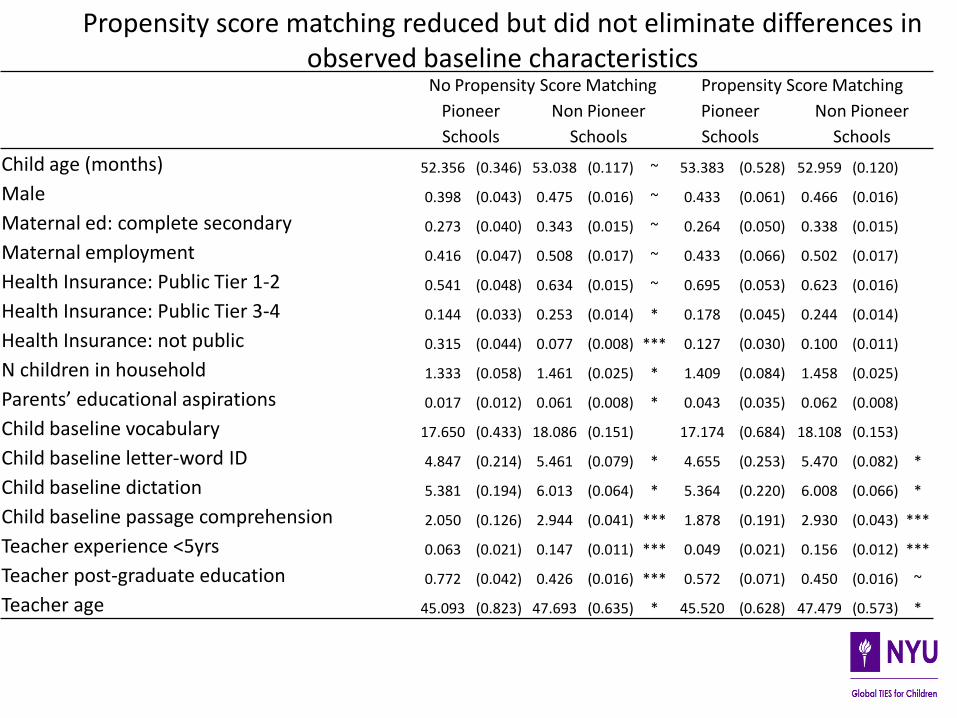
Child age (months) 52.356 (0.346) 53.038 (0.117) ~ 53.383 (0.528) 52.959 (0.120)
Male 0.398 (0.043) 0.475 (0.016) ~ 0.433 (0.061) 0.466 (0.016)
Maternal ed: complete secondary 0.273 (0.040) 0.343 (0.015) ~ 0.264 (0.050) 0.338 (0.015)
Maternal employment 0.416 (0.047) 0.508 (0.017) ~ 0.433 (0.066) 0.502 (0.017)
Health Insurance: Public Tier 1-2 0.541 (0.048) 0.634 (0.015) ~ 0.695 (0.053) 0.623 (0.016)
Health Insurance: Public Tier 3-4 0.144 (0.033) 0.253 (0.014) * 0.178 (0.045) 0.244 (0.014)
Health Insurance: not public 0.315 (0.044) 0.077 (0.008) *** 0.127 (0.030) 0.100 (0.011)
N children in household 1.333 (0.058) 1.461 (0.025) * 1.409 (0.084) 1.458 (0.025)
Parents’ educational aspirations 0.017 (0.012) 0.061 (0.008) * 0.043 (0.035) 0.062 (0.008)
Child baseline vocabulary 17.650 (0.433) 18.086 (0.151) 17.174 (0.684) 18.108 (0.153)
Child baseline letter-word ID 4.847 (0.214) 5.461 (0.079) * 4.655 (0.253) 5.470 (0.082) *
Child baseline dictation 5.381 (0.194) 6.013 (0.064) * 5.364 (0.220) 6.008 (0.066) *
Child baseline passage comprehension 2.050 (0.126) 2.944 (0.041) *** 1.878 (0.191) 2.930 (0.043) ***
Teacher experience <5yrs 0.063 (0.021) 0.147 (0.011) *** 0.049 (0.021) 0.156 (0.012) ***
Teacher post-graduate education 0.772 (0.042) 0.426 (0.016) *** 0.572 (0.071) 0.450 (0.016) ~
Teacher age 45.093 (0.823) 47.693 (0.635) * 45.520 (0.628) 47.479 (0.573) *
Propensity score matching reduced but did not eliminate differences in observed baseline characteristics
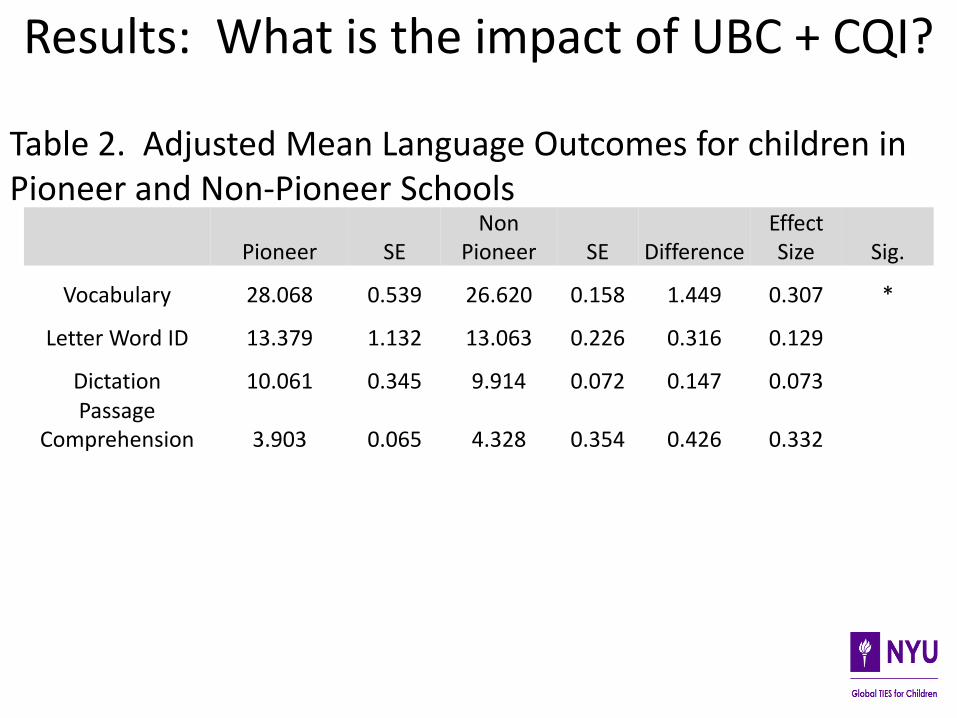
Results: What is the impact of UBC + CQI?
Pioneer SE Non
Pioneer SE Difference Effect Size Sig.
Vocabulary 28.068 0.539 26.620 0.158 1.449 0.307 *
Letter Word ID 13.379 1.132 13.063 0.226 0.316 0.129
Dictation 10.061 0.345 9.914 0.072 0.147 0.073 Passage
Comprehension 3.903 0.065 4.328 0.354 0.426 0.332
Table 2. Adjusted Mean Language Outcomes for children in Pioneer and Non-Pioneer Schools
Lessons about Teacher Well-Being and Implications for Professional Development
The UBC team witnessed among participating teachers
•This approach – CQI – was challenging, but it
produced results
•Drew positive attention & recognition from the school
& municipal leadership
•They adopted this idea of improving continuously &
became champions of the approach within their
networks
30
Limitations
Magnitude of reduction of observed differences through propensity score technique was moderate
This is one year of experience – currently in 4th year of CQI + UBC
Conclusion
CQI may be feasible in early childhood education systems
CQI may help increase dosage of evidence-based
teacher practices This was difficult to prescribe “top down” from the Ministry of Education or the UBC program as first evaluated in the RCT phase
Adding CQI to UBC improved the program and appeared to lead to positive impacts on one of four language and literacy outcomes

• Thanks to primary funder:
• Fundación Educacional Oportunidad
• Yoshikawa’s time partially supported by NYU Abu Dhabi Research Institute grant to Global TIES for Children Center at NYU
• Partner universities:
• Universidad Diego Portales; Universidad Católica de Chile; Harvard Graduate School of Education; New York University
• Seed funders: UNICEF, the World Bank, Harvard Center on the Developing Child, Harvard University David Rockefeller Center for Latin American Studies
Teacher Quality and Learning Outcomes in Kindergarten
M. Caridad Araujo Pedro Carneiro
Yyannú Cruz-Aguayo Norbert Schady
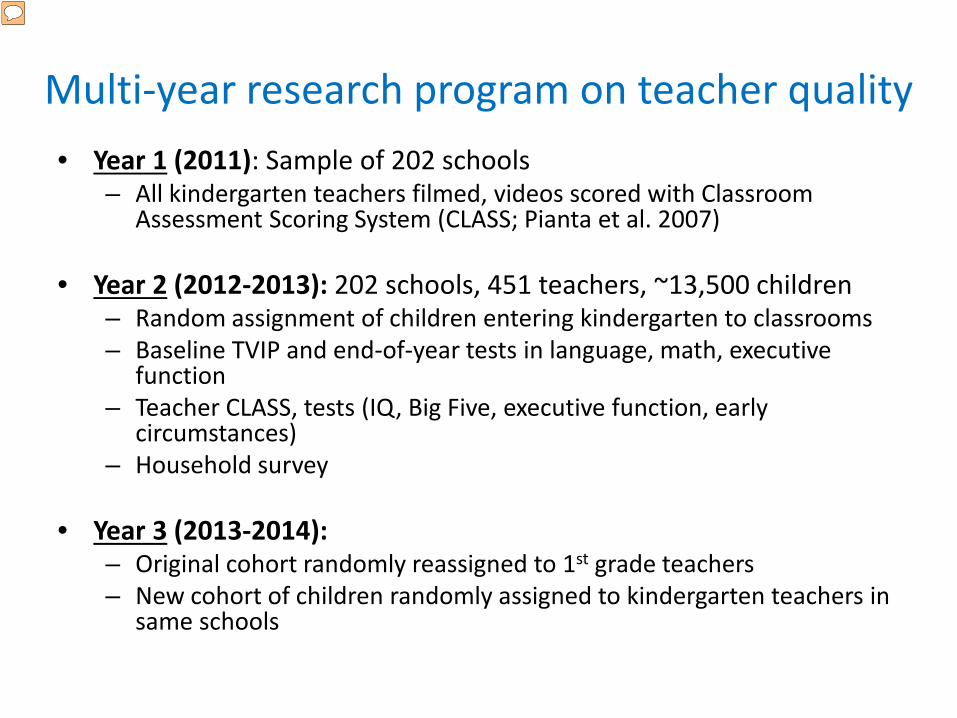
Multi-year research program on teacher quality • Year 1 (2011): Sample of 202 schools
– All kindergarten teachers filmed, videos scored with Classroom Assessment Scoring System (CLASS; Pianta et al. 2007)
• Year 2 (2012-2013): 202 schools, 451 teachers, ~13,500 children
– Random assignment of children entering kindergarten to classrooms – Baseline TVIP and end-of-year tests in language, math, executive
function – Teacher CLASS, tests (IQ, Big Five, executive function, early
circumstances) – Household survey
• Year 3 (2013-2014): – Original cohort randomly reassigned to 1st grade teachers – New cohort of children randomly assigned to kindergarten teachers in
same schools
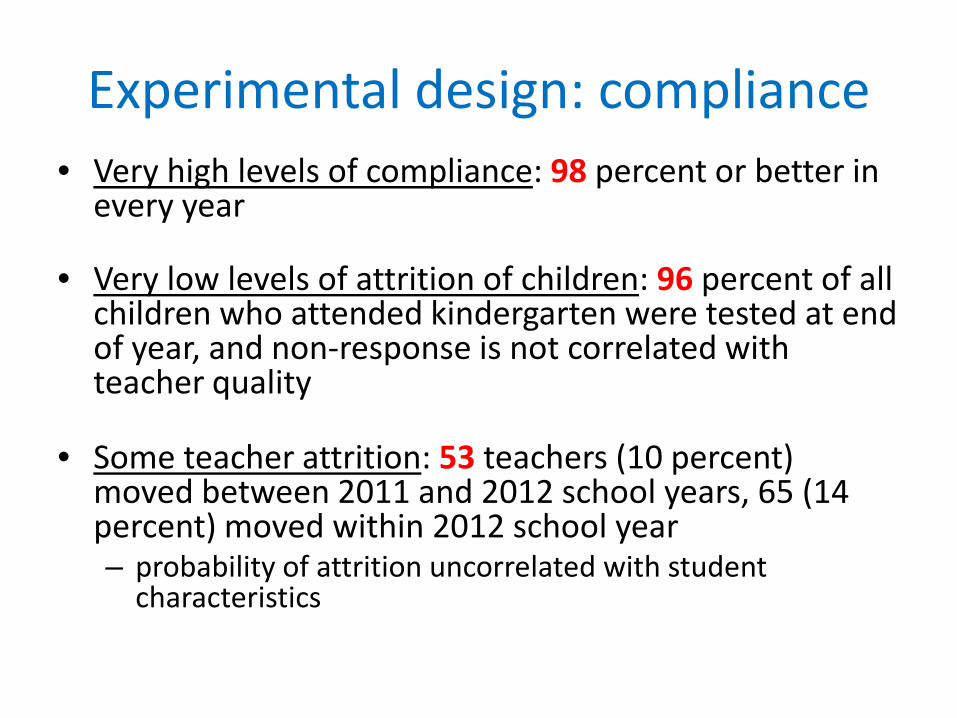
Experimental design: compliance • Very high levels of compliance: 98 percent or better in
every year
• Very low levels of attrition of children: 96 percent of all children who attended kindergarten were tested at end of year, and non-response is not correlated with teacher quality
• Some teacher attrition: 53 teachers (10 percent) moved between 2011 and 2012 school years, 65 (14 percent) moved within 2012 school year – probability of attrition uncorrelated with student
characteristics
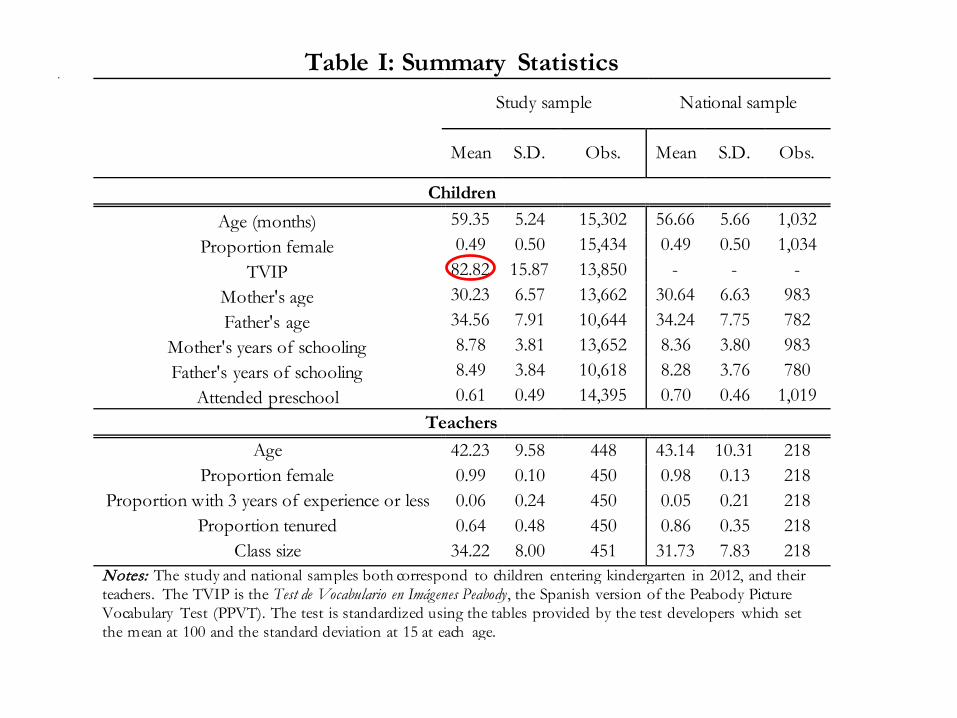
. Table I: Summary Statistics
Study sample National sample
Mean S.D. Obs. Mean S.D. Obs.
Children Age (months) 59.35 5.24 15,302 56.66 5.66 1,032
Proportion female 0.49 0.50 15,434 0.49 0.50 1,034 TVIP 82.82 15.87 13,850 - - -
Mother's age 30.23 6.57 13,662 30.64 6.63 983 Father's age 34.56 7.91 10,644 34.24 7.75 782
Mother's years of schooling 8.78 3.81 13,652 8.36 3.80 983 Father's years of schooling 8.49 3.84 10,618 8.28 3.76 780
Attended preschool 0.61 0.49 14,395 0.70 0.46 1,019 Teachers
Age 42.23 9.58 448 43.14 10.31 218 Proportion female 0.99 0.10 450 0.98 0.13 218
Proportion with 3 years of experience or less 0.06 0.24 450 0.05 0.21 218 Proportion tenured 0.64 0.48 450 0.86 0.35 218
Class size 34.22 8.00 451 31.73 7.83 218 Notes: The study and national samples both correspond to children entering kindergarten in 2012, and their teachers. The TVIP is the Test de Vocabulario en Imágenes Peabody, the Spanish version of the Peabody Picture Vocabulary Test (PPVT). The test is standardized using the tables provided by the test developers which set the mean at 100 and the standard deviation at 15 at each age.

Motivation
• Question 1: How much do teachers matter? • Question 2: What characteristics/behaviors define a good
teacher? (Do the observed characteristics of teachers explain differences in their effectiveness?)
How much do teachers matter?
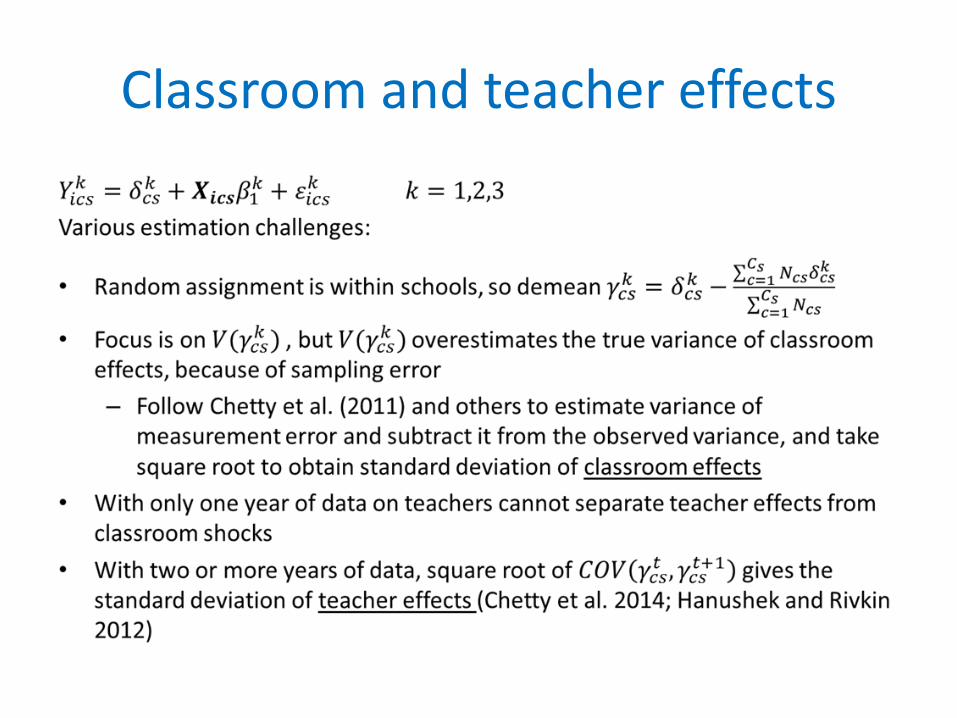
Classroom and teacher effects
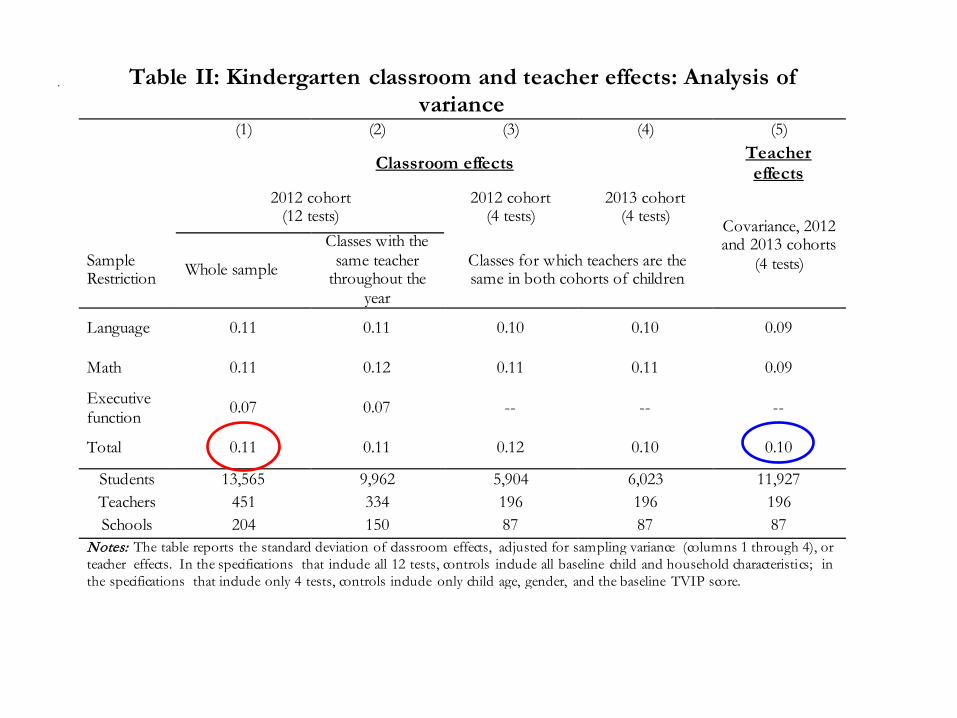
. Table II: Kindergarten classroom and teacher effects: Analysis of variance
(1) (2) (3) (4) (5)
Classroom effects Teacher effects
2012 cohort (12 tests)
2012 cohort (4 tests)
2013 cohort (4 tests) Covariance, 2012
and 2013 cohorts (4 tests) Sample
Restriction Whole sample
Classes with the same teacher
throughout the year
Classes for which teachers are the same in both cohorts of children
Language 0.11 0.11 0.10 0.10 0.09
Math 0.11 0.12 0.11 0.11 0.09
Executive function 0.07 0.07 -- -- --
Total 0.11 0.11 0.12 0.10 0.10
Students 13,565 9,962 5,904 6,023 11,927 Teachers 451 334 196 196 196 Schools 204 150 87 87 87
Notes: The table reports the standard deviation of classroom effects, adjusted for sampling variance (columns 1 through 4), or teacher effects. In the specifications that include all 12 tests, controls include all baseline child and household characteristics; in the specifications that include only 4 tests, controls include only child age, gender, and the baseline TVIP score.
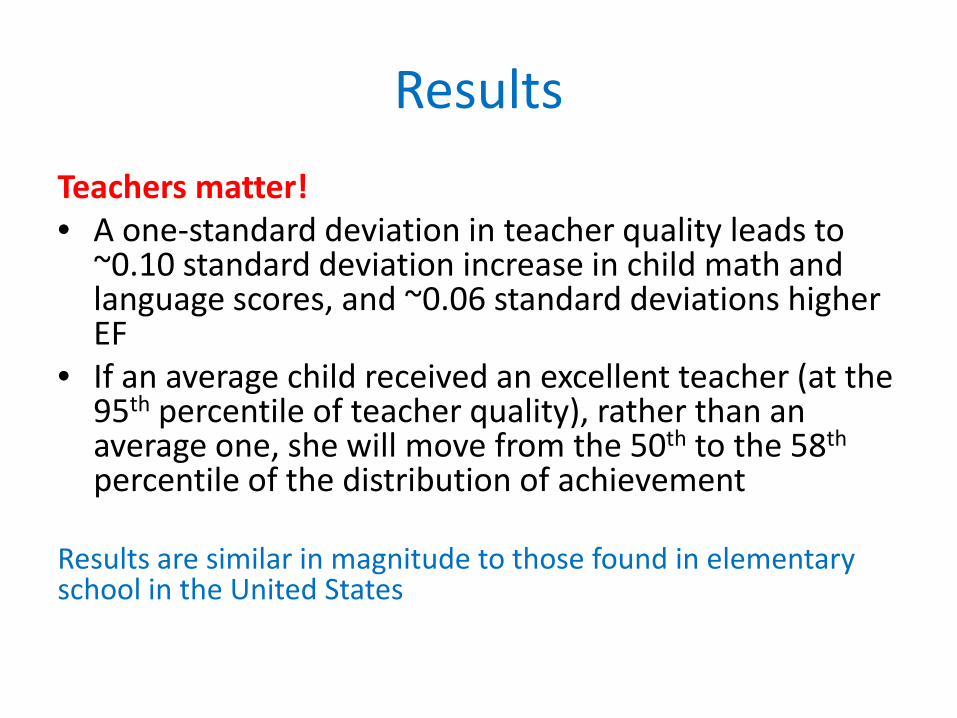
Results Teachers matter! • A one-standard deviation in teacher quality leads to
~0.10 standard deviation increase in child math and language scores, and ~0.06 standard deviations higher EF
• If an average child received an excellent teacher (at the 95th percentile of teacher quality), rather than an average one, she will move from the 50th to the 58th percentile of the distribution of achievement
Results are similar in magnitude to those found in elementary school in the United States
What characteristics/behaviors define a good teacher?
(Do the observed characteristics of teachers explain differences in their effectiveness?)
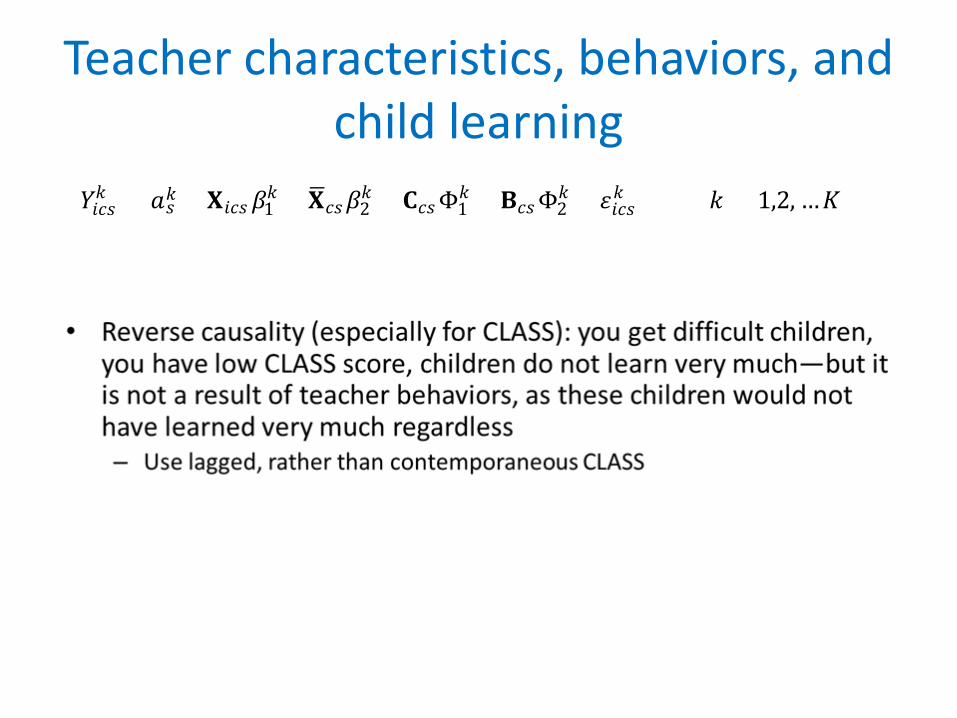
Teacher characteristics, behaviors, and child learning
𝑌𝑌𝑖𝑖𝑖𝑖𝑖𝑖𝑘𝑘 = 𝑎𝑎𝑖𝑖𝑘𝑘 + 𝐗𝐗𝑖𝑖𝑖𝑖𝑖𝑖 𝛽𝛽1𝑘𝑘 + 𝐗𝐗�𝑖𝑖𝑖𝑖𝛽𝛽2
𝑘𝑘 + 𝐂𝐂𝑖𝑖𝑖𝑖Φ1𝑘𝑘 +𝐁𝐁𝑖𝑖𝑖𝑖Φ2
𝑘𝑘 + 𝜀𝜀𝑖𝑖𝑖𝑖𝑖𝑖𝑘𝑘 𝑘𝑘 = 1,2, …𝐾𝐾
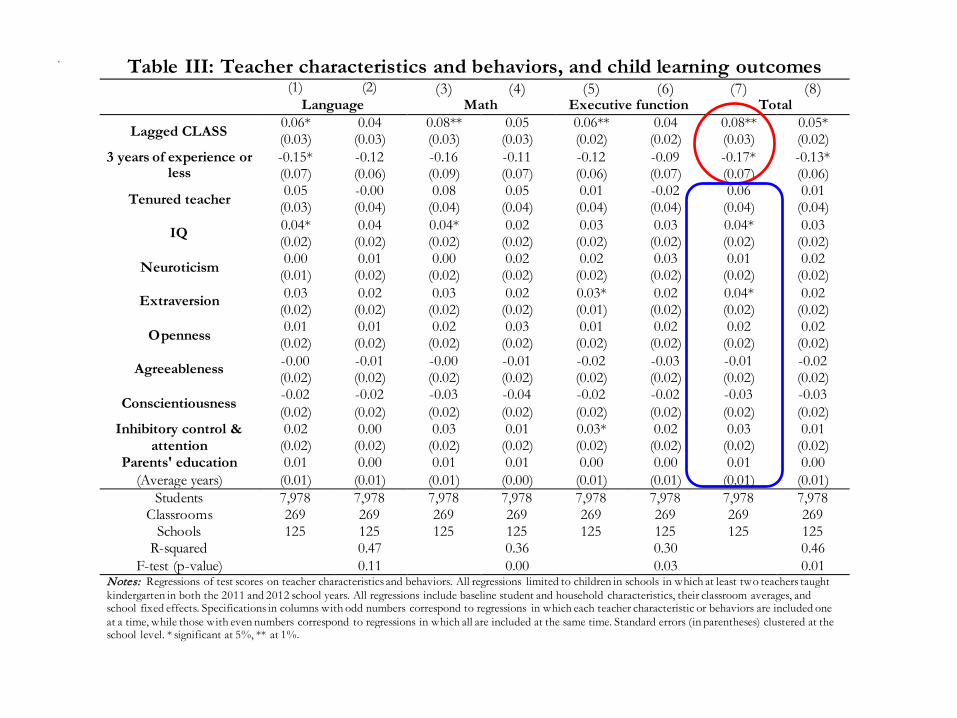
. Table III: Teacher characteristics and behaviors, and child learning outcomes (1) (2) (3) (4) (5) (6) (7) (8) Language Math Executive function Total
Lagged CLASS 0.06* 0.04 0.08** 0.05 0.06** 0.04 0.08** 0.05* (0.03) (0.03) (0.03) (0.03) (0.02) (0.02) (0.03) (0.02)
3 years of experience or less
-0.15* -0.12 -0.16 -0.11 -0.12 -0.09 -0.17* -0.13* (0.07) (0.06) (0.09) (0.07) (0.06) (0.07) (0.07) (0.06)
Tenured teacher 0.05 -0.00 0.08 0.05 0.01 -0.02 0.06 0.01 (0.03) (0.04) (0.04) (0.04) (0.04) (0.04) (0.04) (0.04)
IQ 0.04* 0.04 0.04* 0.02 0.03 0.03 0.04* 0.03 (0.02) (0.02) (0.02) (0.02) (0.02) (0.02) (0.02) (0.02)
Neuroticism 0.00 0.01 0.00 0.02 0.02 0.03 0.01 0.02 (0.01) (0.02) (0.02) (0.02) (0.02) (0.02) (0.02) (0.02)
Extraversion 0.03 0.02 0.03 0.02 0.03* 0.02 0.04* 0.02 (0.02) (0.02) (0.02) (0.02) (0.01) (0.02) (0.02) (0.02)
Openness 0.01 0.01 0.02 0.03 0.01 0.02 0.02 0.02 (0.02) (0.02) (0.02) (0.02) (0.02) (0.02) (0.02) (0.02)
Agreeableness -0.00 -0.01 -0.00 -0.01 -0.02 -0.03 -0.01 -0.02 (0.02) (0.02) (0.02) (0.02) (0.02) (0.02) (0.02) (0.02)
Conscientiousness -0.02 -0.02 -0.03 -0.04 -0.02 -0.02 -0.03 -0.03 (0.02) (0.02) (0.02) (0.02) (0.02) (0.02) (0.02) (0.02)
Inhibitory control & attention
0.02 0.00 0.03 0.01 0.03* 0.02 0.03 0.01 (0.02) (0.02) (0.02) (0.02) (0.02) (0.02) (0.02) (0.02)
Parents' education 0.01 0.00 0.01 0.01 0.00 0.00 0.01 0.00 (Average years) (0.01) (0.01) (0.01) (0.00) (0.01) (0.01) (0.01) (0.01)
Students 7,978 7,978 7,978 7,978 7,978 7,978 7,978 7,978 Classrooms 269 269 269 269 269 269 269 269
Schools 125 125 125 125 125 125 125 125 R-squared 0.47 0.36 0.30 0.46
F-test (p-value) 0.11 0.00 0.03 0.01 Notes: Regressions of test scores on teacher characteristics and behaviors. All regressions limited to children in schools in which at least two teachers taught kindergarten in both the 2011 and 2012 school years. All regressions include baseline student and household characteristics, their classroom averages, and school fixed effects. Specifications in columns with odd numbers correspond to regressions in which each teacher characteristic or behaviors are included one at a time, while those with even numbers correspond to regressions in which all are included at the same time. Standard errors (in parentheses) clustered at the school level. * significant at 5%, ** at 1%.
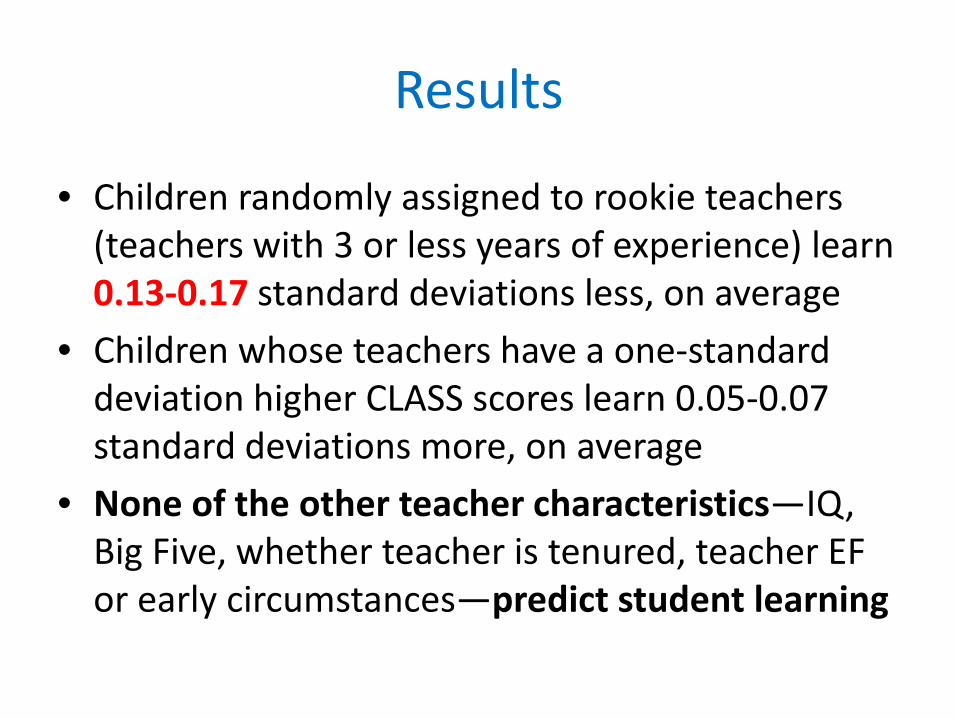
Results
• Children randomly assigned to rookie teachers (teachers with 3 or less years of experience) learn 0.13-0.17 standard deviations less, on average
• Children whose teachers have a one-standard deviation higher CLASS scores learn 0.05-0.07 standard deviations more, on average
• None of the other teacher characteristics—IQ, Big Five, whether teacher is tenured, teacher EF or early circumstances—predict student learning
Out-of-sample predictions
• We know that teachers matter, that there is important variability in teacher quality within the same school.
• We also know that besides behaviors and experience, no other teacher characteristics predict learning.
• Should we give up trying to predict learning? Could we predict learning with learning?
Out-of-sample predictions
• How well does value added in one year predict value added the following year?
• Do other teacher attributes predict learning outcomes? – For 4 tests (2 math tests, and 2 language tests),
we can calculate value added for the same teachers (196 teachers) with two cohorts of children (both based on random assignment)
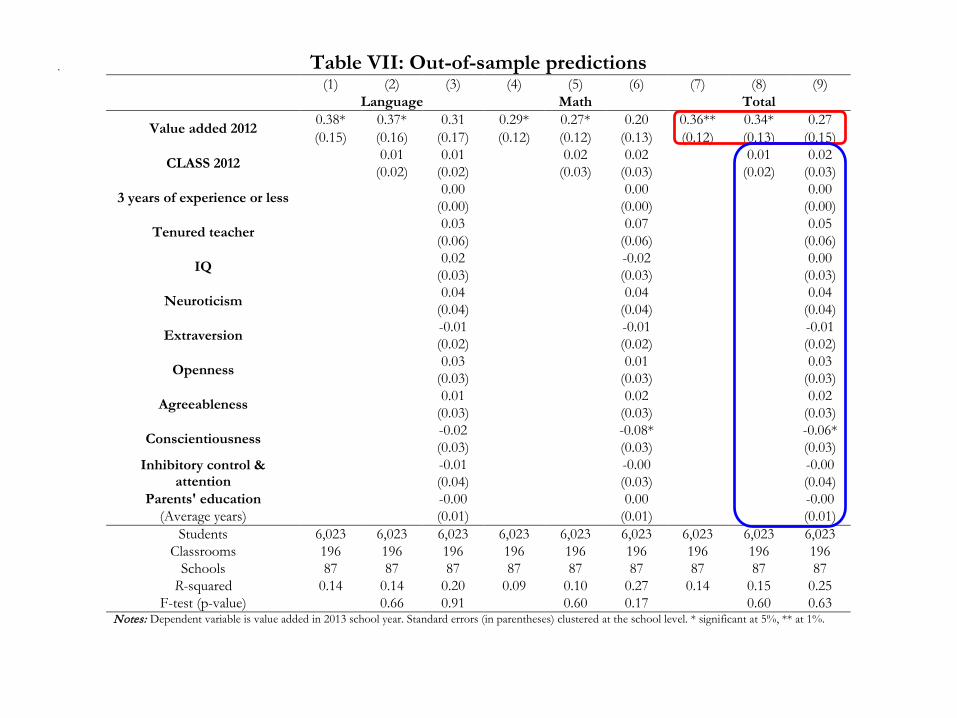
. Table VII: Out-of-sample predictions (1) (2) (3) (4) (5) (6) (7) (8) (9) Language Math Total
Value added 2012 0.38* 0.37* 0.31 0.29* 0.27* 0.20 0.36** 0.34* 0.27 (0.15) (0.16) (0.17) (0.12) (0.12) (0.13) (0.12) (0.13) (0.15)
CLASS 2012 0.01 0.01 0.02 0.02 0.01 0.02 (0.02) (0.02) (0.03) (0.03) (0.02) (0.03)
3 years of experience or less 0.00 0.00 0.00 (0.00) (0.00) (0.00)
Tenured teacher 0.03 0.07 0.05 (0.06) (0.06) (0.06)
IQ 0.02 -0.02 0.00 (0.03) (0.03) (0.03)
Neuroticism 0.04 0.04 0.04 (0.04) (0.04) (0.04)
Extraversion -0.01 -0.01 -0.01 (0.02) (0.02) (0.02)
Openness 0.03 0.01 0.03 (0.03) (0.03) (0.03)
Agreeableness 0.01 0.02 0.02 (0.03) (0.03) (0.03)
Conscientiousness -0.02 -0.08* -0.06* (0.03) (0.03) (0.03)
Inhibitory control & attention
-0.01 -0.00 -0.00 (0.04) (0.03) (0.04)
Parents' education -0.00 0.00 -0.00 (Average years) (0.01) (0.01) (0.01)
Students 6,023 6,023 6,023 6,023 6,023 6,023 6,023 6,023 6,023 Classrooms 196 196 196 196 196 196 196 196 196
Schools 87 87 87 87 87 87 87 87 87 R-squared 0.14 0.14 0.20 0.09 0.10 0.27 0.14 0.15 0.25
F-test (p-value) 0.66 0.91 0.60 0.17 0.60 0.63 Notes: Dependent variable is value added in 2013 school year. Standard errors (in parentheses) clustered at the school level. * significant at 5%, ** at 1%.
Results
• VA at t is a noisy estimate of VA at t+1 (correlation of 0.36) – This is very much in line with US estimates
• Koedel et al. (2015) report that the correlation for studies that include school fixed effects ranges from 0.18 to 0.33
• Staiger and Rockoff (2010) report correlations of 0.28-0.37 for language and 0.39-0.50 for math
– Appears “low” but is in fact in the same ballpark (0.33 to 0.40) as year-on-year correlations in other professions:
Results Including:
• Volume of home sales for realtors • Returns on investment funds • Productivity of field-service personnel for utility companies • Output of sewing machine operators • Patient mortality rates for surgeons and hospitals • Batting averages for professional baseball players
Glazerman et al. (2012): “The use of imprecise measures to make high stakes decisions that place societal or institutional interests above those of individuals is wide spread and accepted in fields outside of teaching”

Results
Once you know a teacher’s VA in year t nothing else (CLASS, all of her other attributes) helps predict her VA in t+1
Can parents tell better from worse teachers (and what do they do about it)?
• Parents asked to rate teachers on a 1-5 point scale: – They generally give very high scores to teachers: 58 percent of
teachers get a 5, another 37.5 percent get a 4 • Question 1: Can parents tell better from worse teachers? • Question 2: Do parents reinforce the effects of better
teachers, or compensate children who received worse teachers? – Related literature includes Todd and Wolpin (2003), Pop-Eleches
and Urquiola (2013) – Detailed module in household survey on home inputs (for
example, whether children’s books are available) and stimulation (for example, whether parents read to children): We aggregate into two indices
Results
• Parents can generally tell better from worse teachers, but they do not change their investments (behaviors or inputs) in response to differences in teacher quality – So observed teacher effects are the direct effect of
teachers on learning outcomes
Conclusions
• First study of teacher effects based on random assignment in a developing country – Very high levels of compliance – Very low levels of attrition
• First study of classroom effects on EF (in developed or developing country)
• Very rich measures of teacher characteristics and behaviors
• Rich data on parents
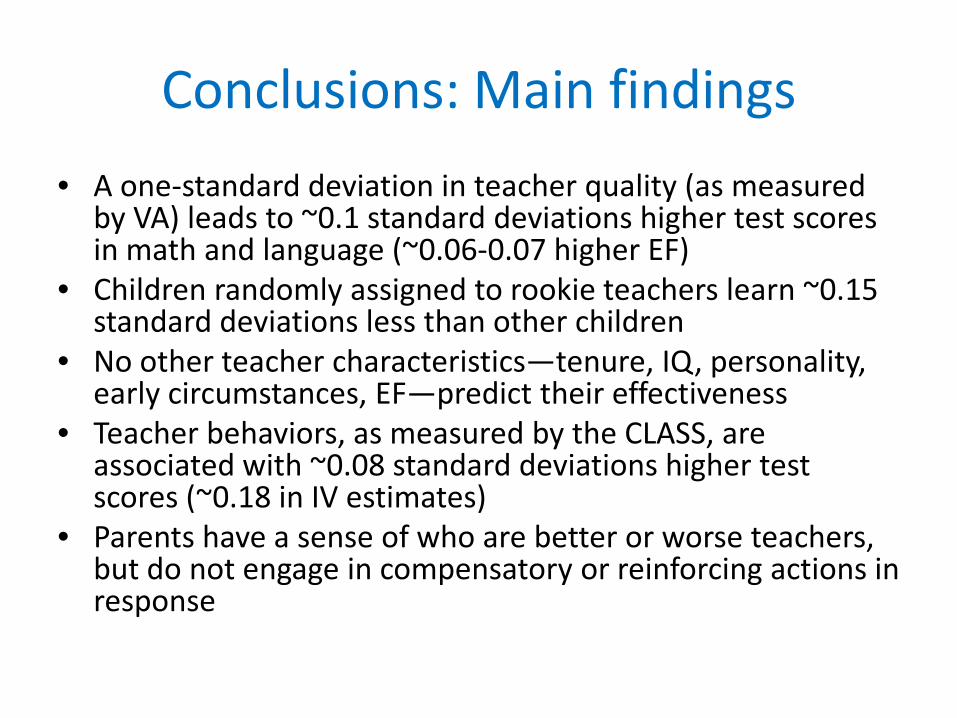
Conclusions: Main findings • A one-standard deviation in teacher quality (as measured
by VA) leads to ~0.1 standard deviations higher test scores in math and language (~0.06-0.07 higher EF)
• Children randomly assigned to rookie teachers learn ~0.15 standard deviations less than other children
• No other teacher characteristics—tenure, IQ, personality, early circumstances, EF—predict their effectiveness
• Teacher behaviors, as measured by the CLASS, are associated with ~0.08 standard deviations higher test scores (~0.18 in IV estimates)
• Parents have a sense of who are better or worse teachers, but do not engage in compensatory or reinforcing actions in response