Embed Size (px)
Citation preview
Access to Electronic Thesis
Author: Mohammed Almalki
Thesis title: Molecular Identification and Characterisation of Extremely Acid Tolerant Microorganisms Isolated From Rivelin and Limb Valleys
Qualification: PhD
This electronic thesis is protected by the Copyright, Designs and Patents Act 1988. No reproduction is permitted without consent of the author. It is also protected by the Creative Commons Licence allowing Attributions-Non-commercial-No derivatives. If this electronic thesis has been edited by the author it will be indicated as such on the title page and in the text.
Molecular Identification and Characterisation
of Acid Tolerant Microorganisms Isolated
from Rivelin and Limb Valleys
By
Mohammed Almalki
MSc., King Saud University, Riyadh, Saudi Arabia
MPhil, University of Sheffield, England
Thesis submitted in part fulfillment of the requirement for the degree
of Doctor of Philosophy
Department of Molecular Biology and Biotechnology The University of Sheffield, UK
January 2012

ii
Dedication To my dear parents, my loving wife ‘Sarah’ and my sweet
daughters ‘Layan, Layali and Lora’ To my brothers and sisters

iii
Acknowledgements
First of all, my thanks to Almighty Allah who blessed me with countless great
blessing which enabled me to carry out practical researches and writing up
this thesis. I would like to express my sincere thanks to my supervisor Dr. Jim
Gilmour for his supervision, advice, guidance, support and valuable criticism
during this study. Also my deep thanks to Professor Milton Wainwright and
Professor Julie Gray for their advice and help in this project.
I am grateful to Professor Mike Williamson and Mrs. Andrea Hounslow for
their cooperation and assistance in NMR analysis. I cannot forget Mr. Chris
Hill for his help in electron microscope work. My Special thanks to my best
friend Sami Alyahia. Also my thanks belong to my colleagues in Dr.
Gilmour’s and Prof Wainwright’s laboratories.
My special and deep thanks to my beloved parents, brothers and sisters in
Saudi Arabia for their Du’a and encouragement and for my lovely wife
‘Sarah’ who’s help, encouraged and patience supported me during the period
of my study in the UK.
Finally, I would like to thank King Faisal University for the scholarship
which allowed me to study my PhD in the UK.
iv
Abstract
The Rivelin and Limb Valleys in Sheffield have a long history of Industrial activity and
were chosen as acidic environments. The first aim was to analyse the microbial diversity
present in the collected water samples from both sites using batch cultures. Two
bacterial strains (Bacillus cereus and Micrococcus luteus) and two yeast strains
(Aureobasidium pullulans and Debaryomyces hansenii) were successfully isolated
and identified using 16S and 18S rDNA molecular identification techniques.
Physiological characterisations were carried out on all four strains to examine their
response to different pH values and high salinity. On the basis of these results, D.
hansenii and M. luteus were chosen for further study based on their growth at high
salinity at pH 3. Further physiological studies showed that D. hansenii was well
adapted to grow at different, extreme conditions in M9 minimal and rich YPD media,
while M. luteus required rich LB medium to successfully adapt to combined acid and salt
stress. NMR spectroscopy showed when subject to high salinities, M. luteus accumulated
betaine as the main compatible solute while D. hansenii accumulated glycerol. Most
importantly, glycine betaine was identified as an additional compatible solute in D.
hansenii. This is the first report of glycine betaine acting as a compatible solute in a
yeast cell. D. hansenii was shown to maintain an internal pH of 6.7 when grown in
pH 3 medium and unlike most acid tolerant microorganisms, their membrane
potential remained negative when grown at pH 3. pH shock experiments (varying
external pH between 3 and 7) suggested that it takes longer than 30 minutes for the D.
hansenii cells to return their internal pH to pre-stress levels.
v
Table of Contents
Dedication……………………………………………………………………………………...…………………………………………ii
Acknowledgement………………………………………………………………………………….……………………………….iii
Abstract……………………………………………………………………………………………….……….………………………….iv
Table of Contents………………………………………………………………………….……….…………….……………………v
List of Figures……………………………………………………………………………………………………………………………ix
List of Tables……………………………………………………………………………………………………………………………xiii
Abbreviations…………………………………………………………………………….…………………………………………….xv
1 INTRODUCTION AND AIMS ................................................................................................... 2
1.1 Microbial Life ................................................................................................................. 2
1.2 Extreme Environments and Extremophiles ................................................................... 3
1.3 Acidic Environments....................................................................................................... 9
1.4 Acidophiles and Diversity ............................................................................................. 13
1.5 Mechanisms of Cytoplasmic pH Regulation in Acidophiles ......................................... 20
1.6 Molecular Biology Techniques and Microbial Identification ....................................... 26
1.7 Aims of the Project ....................................................................................................... 33
2 MATERIALS AND METHODS ................................................................................................ 35
2.1 Area of Study ................................................................................................................ 35
2.1.1 Rivelin Valley ........................................................................................................ 35
2.1.2 Limb Valley ........................................................................................................... 35
2.2 Chemical Analysis of Water Samples ........................................................................... 36
2.3 Sample Collection......................................................................................................... 36
2.4 Growth Media .............................................................................................................. 38
2.4.1 FeTSB Liquid Medium .......................................................................................... 38
2.4.2 FeTSB Solid Medium ............................................................................................ 38
2.4.3 M9 Medium.......................................................................................................... 39
2.4.4 ½ LB Medium........................................................................................................ 39
2.4.5 LB Medium ........................................................................................................... 39
2.4.6 YPD Medium: ....................................................................................................... 40
2.5 Isolation of Acidophilic or Acid tolerant Microorganisms ........................................... 40
2.6 Purity of Acidophilic Strains ......................................................................................... 40
vi
2.7 Maintenance of Acidophilic Strains ............................................................................. 41
2.8 Identification of Acidophilic Strains ............................................................................. 41
2.8.1 Colony Morphology .............................................................................................. 41
2.8.2 Cell Morphology ................................................................................................... 42
2.8.3 Motility of Bacteria .............................................................................................. 42
2.9 Effect of Medium pH on Growth of Isolated Strains and Growth Curve ..................... 42
2.10 Measurement of External pH of Overnight Cultures of Strains in Different Media .... 43
2.11 Measurement of Respiration Rate (Oxygen Uptake) of Isolated Strains ..................... 43
2.12 Determination of Protein Content ............................................................................... 48
2.12.1 Determination of Standard Curve ........................................................................ 48
2.12.2 Determination of Sample Protein ........................................................................ 49
2.13 Effect of High Sodium Concentration on the Growth of the Cells ............................... 51
2.14 Effect of High Sodium Concentration on the Respiration Rate of the Cells ................ 52
2.15 Effect of Iron, Sulphur and Aluminium on the Growth of RV4 and LV1 Cells ............... 52
2.16 Anaerobic Growth of Bacteria ..................................................................................... 53
2.17 Physiological Characteristics of Yeast Species ............................................................. 53
2.17.1 Cycloheximide Resistance .................................................................................... 53
2.17.2 Assimilation of Glucose ........................................................................................ 54
2.17.3 Assimilation of α-Methyl glucoside ...................................................................... 54
2.17.4 Assimilation of Nitrate ......................................................................................... 54
2.17.5 Assimilation of Cadaverine .................................................................................. 54
2.18 NMR Analysis of Compatible Solutes ........................................................................... 55
2.18.1 Preparation of Samples for NMR Analysis ........................................................... 55
2.18.2 Effect of Adaptation to Different Salinity, pH and Growth Media ....................... 55
2.19 Electron Microscopy .................................................................................................... 56
2.19.1 Scanning Electron Microscope (SEM) .................................................................. 56
2.19.2 Transmission Electron Microscope (TEM)............................................................ 57
2.20 Silicone Oil Technique .................................................................................................. 58
2.20.1 Determination of Intracellular Volume (ICV) of RV4 ............................................ 59
2.20.2 The Measurement of Membrane Potential (ΔΨ) in RV4 Cells ............................. 63
2.20.3 Determination of Internal pH (pHi) of RV4 Cells .................................................. 64
2.20.4 Measurement of Isotope Uptake over Time ........................................................ 65
vii
2.21 Molecular Identification of Unknown Organisms ........................................................ 66
2.21.1 Genomic DNA Extraction ..................................................................................... 66
2.21.2 Polymerase Chain Reaction (PCR) Amplification of 16S rRNA ............................. 66
2.21.3 Purification of PCR Products ................................................................................ 67
2.21.4 Agarose Gel Electrophoresis ................................................................................ 67
2.21.5 TOPO Cloning Reaction ........................................................................................ 68
2.21.5.1 Ligation…………………………………………………………………………………………….68
2.21.5.2 Transformation and Miniprep Procedure………………….………………………68
2.21.5.3 Digestion………………………………………………………………………………………….68
2.21.6 Phylogenetic (DNA Sequence) Analysis ............................................................... 69
2.22 Statistics ....................................................................................................................... 69
3 Isolation and Initial Characterisation of Acidophiles from Rivelin and Limb Valleys ....... 71
3.1 Introduction ................................................................................................................. 71
3.2 Results and Discussion ................................................................................................. 73
3.2.1 Sample collection ................................................................................................. 73
3.2.2 Chemical Analysis of Water Samples ................................................................... 76
3.2.3 Isolation and Selection of Culturable Microorganisms ........................................ 77
3.2.4 Initial Characterisation of Bacterial Strains RV3 and LV1 ...................................... 78
3.2.5 Initial Characterisation of Yeast Strains RV2 and RV4 ........................................... 78
3.2.6 Further Characteristics of Isolated Yeast Strains ................................................. 83
3.2.7 Growth Characterisation of Isolated Strains RV2, RV3, RV4 and LV1 ..................... 85
3.2.8 Effect of External pH on Respiration Rate of RV2, RV3, RV4 and LV1 Strains ........ 95
3.2.9 Effect of High Salinity on the Overnight Growth of RV2, RV3, RV4 and LV1 ........ 101
3.2.10 Measurement of External pH of Overnight Cultures…… .................................... 105
3.3 Conclusions ................................................................................................................ 108
4 Molecular Identification of RV2, RV3, RV4 and LV1 Strains ............................................... 111
4.1 Introduction ............................................................................................................... 111
4.2 Results and Discussion ............................................................................................... 113
4.2.1 Bacterial Strains ................................................................................................. 113
4.2.1.1 Extraction of Genomic DNA………………………………………………………………….113
4.2.1.2 PCR amplification of 16S rRNA Gene of Bacterial Isolates…….……………...115
4.2.1.3 Cloning of PCR Products and Transformation of E. coli…………………………118
viii
4.2.1.4 Sequencing of 16S rRNA Gene of Bacterial Isolates………………………………121
4.2.1.5 Phylogenetic Analysis…………………………………………………………………………..123
4.2.2 Yeast Strains ....................................................................................................... 130 4.2.2.1 The Identification of Yeast Strains…………………………………………………….....130
4.3 Conclusions ................................................................................................................ 141 5 Physiological Growth of Debaryomyces hansenii (RV4) and Micrococcus luteus (LV1)
Under Acidity and Salinity ........................................................................................... 147
5.1 Introduction ............................................................................................................... 147
5.2 Results and Discussion ............................................................................................... 150
5.2.1 Electron Microscope Analysis of Debaryomyces hansenii (RV4) and Micrococcus luteus (LV1) Cells Grown at pH 3 and pH 7 ......................................................................... 150
5.2.2 Effect of External pH Medium on Growth Rate of D. hansenii and M. luteus ... 156
5.2.3 Effect of High Salinity and External pH on the Growth Rate of D. hansenii and M. luteus……. ........................................................................................................................... 161
5.2.4 Effect of High Salinity and External pH Medium on the Final Biomass of D. hansenii and M. luteus Cells ............................................................................................... 181
5.2.5 Measurement of External pH After Overnight Growth……. ............................... 184
5.2.6 Effect of Salinity and pH on Respiration Rate of D. hansenii and M. luteus ...... 189
5.2.7 Determination of Compatible Solutes (Osmolytes) by NMR Spectroscopy ....... 192
5.2.8 Effect of Sulphur, Aluminium and Iron on the Growth……. ............................... 201
5.3 Conclusions ................................................................................................................ 203
6 Bioenergetics of Growth of Debaryomyces hansenii ....................................................... 211
6.1 Introduction……….………………………………………………………………………….……………..………211
6.2 Results and Discussion……………..……………………………………………………………………………213
6.2.1 Determination of Intracellular Volume of D. hansenii at pH 3 and pH 7..…...….213
6.2.2 Determination of Membrane Potential (ΔΨ) of D. hansenii………….……..…..…….218
6.2.3 Determination of Internal pH (pHi) and ΔpH of D. hansenii.…….……………..…..…223
6.3 Conclusions…………………….…………..……….……………………..….……………………………………..230
7 General Conclusions and Future Work ............................................................................. 234
7.1 Conclusions ................................................................................................................... 234
7.2 Future Work .................................................................................................................. 237
References…………………………………………………………………………………………………………………………….239
Appendices……………………………………..…………………………………………………………………………………….259
ix
List of Figures
Figure 1-1: The universal phylogenetic tree, constructed from rRNA.................................... 6
Figure 1-2: Acidic (sulfur-enriched geothermal) environment in Yellowstone................... 10
Figure 1-3: Diagrammatic representation of commonly occurring ................................ 22
Figure 1-4: Flow diagram of the different stages in the molecular methods. ...................... 27
Figure 1-5: Schematic diagram illustrating the processing steps of (PCR) .......................... 29
Figure 1-6: Color map superimposed on the 16S rRNA secondary structure model .......... 32
Figure 2-1: Map locations of Sheffield main rivers taken from (Addy, 1888). .................. 37
Figure 2-2: Schematic diagram illustrating the key components of an oxygen electrode.. 45
Figure 2-3: A diagram of the oxygen electrode showing more details ....................................... 46
Figure 2-4: Silicone oil density selection for intracellular volume, ..................................... 61
Figure 2-5: Intracellular volume (ICV) determination using 3H2O and 14C-dextran. .......... 62
Figure 3-1: Photographs showing the sampling sites in the Rivelin Valley ......................... 74
Figure 3-2: Photographs showing the sampling sites in the Limb Valley. ............................ 75
Figure 3-3: Phase contrast photomicrograph of RV3 cells grown in ½ LB medium ..... 81
Figure 3-4: Phase contrast photomicrgraph of LV1 cells grown in ½ LB medium ....... 81
Figure 3-5: Phase contrast photomicrograph of RV4 cells grown in M9 medium ......... 82
Figure 3-6: Phase contrast photomicrograph of RV2 cells grown in M9 medium ......... 82
Figure 3-7: Growth curves for RV2, RV3, RV4 and LV1 cells growing in M9 minimal ............ 87
Figure 3-8: Growth curves for RV2, RV3, RV4 and LV1 cells growing in M9 minimal ............ 88
Figure 3-9: Growth curves for RV2, RV3, RV4 and LV1 cells growing in M9 minimal ........ 89
Figure 3-10: Effect of external pH on the doubling times of strains ........................................ 90
Figure 3-11: Growth curves for RV2, RV3, RV4 and LV1 cells growing in ½ LB medium ...... 91
Figure 3-12: Growth curves for RV2, RV3, RV4 and LV1 cells growing in ½ LB medium ... 92
Figure 3-13: Growth curves for RV2, RV3, RV4 and LV1 cells growing in ½ LB medium ... 93
Figure 3-14: Effect of external pH on the doubling times of strains ..................................... 94
Figure 3-15: Effect of different NaCl concentrations on the overnight growth ................. 102
Figure 3-16: Effect of different NaCl concentrations on the overnight growth ................. 103
Figure 3-17: Effect of different NaCl concentrations on the overnight growth ................. 104
Figure 4-1: Agarose gel 1% electrophoresis with ethidium bromide ................................. 114
Figure 4-2: Agarose gel 1% electrophoresis with ethidium bromide ................................. 116
Figure 4-3: Agarose gel 1% electrophoresis with ethidium bromide ................................. 117
x
Figure 4-4: Selective LB agar plate containing 50 µl ml-1 ampicillin ................................... 119
Figure 4-5: Agarose gel 1% electrophoresis with ethidium bromide ................................. 120
Figure 4-6: 16S rRNA gene sequence of facultative aerobic strain RV3. ............................. 121
Figure 4-7: 16S rRNA gene sequence of obligate aerobic strain LV1. ................................. 122
Figure 4-8: Neighbour joining phylogenetic tree for RV3 strain ......................................... 125
Figure 4-9: Sequence alignment of 16S rRNA gene sequence ............................................. 126
Figure 4-10: Neighbour joining phylogenetic tree for LV1 strain. ....................................... 128
Figure 4-11: Sequence alignment of 16S rRNA gene sequence ........................................... 129
Figure 4-12 : Agarose gel 1% electrophoresis with ethidium bromide ............................. 131
Figure 4-13: Agarose gel 1% electrophoresis with ethidium bromide .............................. 132
Figure 4-14:18S rRNA gene sequence of RV2 strain ............................................................. 133
Figure 4-15: 18S rRNA gene sequence of RV4 strain ............................................................ 134
Figure 4-16: Neighbour joining phylogenetic tree for RV2 strain ....................................... 136
Figure 4-17: Sequence alignment of 18S rRNA gene sequence of yeast strain RV2 ........... 137
Figure 4-18: Neighbour joining phylogenetic tree for RV4 strain. ...................................... 139
Figure 4-19: Sequence alignment of 16S rRNA gene sequence ........................................... 140
Figure 5-1: Electron micrographs of D. hansenii cells .......................................................... 152
Figure 5-2: Electron micrographs of ultra-thin sections of D. hansenii cells ...................... 153
Figure 5-3: Electron micrographs of M. luteus cells grown overnight in M9 ..................... 154
Figure 5-4: Electron micrographs of ultra-thin sections of M. luteus cells ......................... 155
Figure 5-5: Growth curves for D. hansenii. Cells were incubated in YPD medium ............ 157
Figure 5-6: Effect of external pH on the doubling times of D. hansenii ............................... 158
Figure 5-7: Growth curves for M. luteus. Cells were incubated in LB medium .................. 159
Figure 5-8: Effect of external pH on the doubling times of M. luteus ................................. 160
Figure 5-9: Growth curves for D. hansenii. Cells were grown in M9 medium .................... 163
Figure 5-10: Growth curves for D. hansenii. Cells were grown in M9 medium .................. 163
Figure 5-11: Growth curves for D. hansenii. Cells were grown in M9 medium .................. 164
Figure 5-12: Growth curves for D. hansenii. Cells were grown in M9 medium .................. 164
Figure 5-13: Growth curves for D. hansenii. Cells were grown in M9 medium .................. 165
Figure 5-14: Growth curves for D. hansenii. Cells were grown in M9 medium .................. 165
Figure 5-15: Effect of different NaCl concentrations on the doubling times ...................... 166
Figure 5-16: Growth curves for D. hansenii. Cells were grown in YPD medium ................ 167
xi
Figure 5-17: Growth curves for D. hansenii. Cells were grown in YPD medium ................ 167
Figure 5-18: Growth curves for D. hansenii. Cells were grown in YPD medium ................ 168
Figure 5-19: Growth curves for D. hansenii. Cells were grown in YPD medium ................ 168
Figure 5-20: Growth curves for D. hansenii. Cells were grown in YPD medium ................ 169
Figure 5-21: Growth curves for D. hansenii. Cells were grown in YPD medium ................ 169
Figure 5-22: Growth curves for D. hansenii. Cells were grown in YPD medium ................ 170
Figure 5-23: Growth curves for D. hansenii. Cells were grown in YPD medium ................ 170
Figure 5-24: Effect of different NaCl concentrations on the doubling times ...................... 171
Figure 5-25: Growth curves for M. luteus. Cells were grown in M9 medium ..................... 173
Figure 5-26: Growth curves for M. luteus. Cells were grown in M9medium ...................... 173
Figure 5-27: Growth curves for M. luteus. Cells were grown in M9 medium ..................... 174
Figure 5-28: Effect of different NaCl concentrations on the doubling times of M. luteus .. 175
Figure 5-29: Growth curves for M. luteus. Cells were grown in LB medium ...................... 176
Figure 5-30: Growth curves for M. luteus. Cells were grown in LB medium ...................... 176
Figure 5-31: Growth curves for M. luteus. Cells were grown in LB medium ...................... 177
Figure 5-32: Growth curves for M. luteus. Cells were grown in LB medium ...................... 177
Figure 5-33: Growth curves for M. luteus. Cells were grown in LB medium ...................... 178
Figure 5-34: Growth curves for M. luteus. Cells were grown in LB medium ...................... 178
Figure 5-35: Growth curves for M. luteus. Cells were grown in LB medium ...................... 179
Figure 5-36: Effect of different NaCl concentrations on the doubling times of M. luteus. . 180
Figure 5-37: Effect of different NaCl concentrations on the biomass ................................. 182
Figure 5-38: Effect of different NaCl concentrations on the biomass ................................. 182
Figure 5-39: Effect of different NaCl concentrations on the biomass ................................. 183
Figure 5-40: Effect of different NaCl concentrations on the biomass ................................. 183
Figure 5-41: External pH of D. hansenii cultures grown overnight in M9 medium ........... 186
Figure 5-42: External pH of D. hansenii cultures grown overnight in YPD medium ......... 186
Figure 5-43: External pH of M. luteus cultures grown overnight in M9 medium .............. 187
Figure 5-44: External pH of M. luteus cultures grown overnight in LB medium ............... 187
Figure 5-45: One-dimensional 1H-NMR spectra of culture supernatant ........................... 188
Figure 5-46: Respiration rate of D. hansenii subjected to different salinity ....................... 190
Figure 5-47: Respiration rate of M. luteus subjected to different salinity .......................... 191
Figure 5-48: One-dimensional 1H-NMR spectra of cell extracts derived ........................... 193
xii
Figure 5-49: One-dimensional 1H-NMR spectra of cell extracts derived ........................... 193
Figure 5-50: One-dimensional 1H-NMR spectra of cell extracts derived ........................... 194
Figure 5-51: One-dimensional 1H-NMR spectra of cell extracts derived ........................... 195
Figure 5-52: One-dimensional 1H-NMR spectra of cell extracts derived .......................... 195
Figure 5-53: One-dimensional 1H-NMR spectra of cell extracts derived ........................... 196
Figure 5-54: One-dimensional 1H-NMR spectra of cell extracts derived ........................... 196
Figure 5-55: One-dimensional 1H-NMR spectra of cell extracts derived ........................... 198
Figure 5-56: One-dimensional 1H-NMR spectra of cell extracts derived ........................... 198
Figure 5-57: One-dimensional 1H-NMR spectra of cell extracts derived ........................... 199
Figure 5-58: One-dimensional 1H-NMR spectra of cell extracts derived ........................... 199
Figure 5-59: One-dimensional 1H-NMR spectra of cell extracts derived ........................... 200
Figure 5-60: One-dimensional 1H-NMR spectra of cell extracts derived ........................... 200
Figure 5-61: Effect of iron, sulphur and aluminium on the growth of D. hansenii. ............ 202
Figure 5-62: Effect of sulphur, iron and aluminium on the growth of M luteus. ................ 202
Figure 6-1: Time course of 3H2O uptake by D. hansenii. DPM in supernatants .................. 215
Figure 6-2: Time course of 3H2O uptake by D. hansenii. DPM in supernatants .................. 215
Figure 6-3: Time course of 14C-Dextran uptake by D. hansenii. ........................................... 216
Figure 6-4: Time course of 14C-Dextran uptake by D. hansenii.. .......................................... 216
Figure 6-5: Time course of 14C-TTP+ uptake by D. hansenii. ................................................ 220
Figure 6-6: Time course of 14C-TTP+ uptake by D. hansenii. ................................................ 220
Figure 6-7: Time course of 14C-Benzoic acid uptake by D. hansenii. ................................... 224
Figure 6-8: Time course of 14C-Benzoic acid uptake by D. hansenii. ................................... 224
xiii
List of Tables
Table 1-1: Characteristics of different groups of extremophiles ............................................ 7
Table 1-2: Acidophilic prokaryotic microorganisms. ............................................................ 16
Table 2-1: Components in test tubes which were needed to make a standard protein curve. ..... 50
Table 3-1: Cations and anions of Rivelin and Limb Valley water samples ........................... 76
Table 3-2: Cations and anions of Rivelin and Limb Valley water samples ........................... 76
Table 3-3: The basic characteristics of the isolated bacterial strains ................................... 79
Table 3-4: Basic physical characteristics of the isolated yeast strains ................................. 80
Table 3-5: Some of physiological characterisations of isolated yeast strains. ..................... 84
Table 3-6: Effect of external pH on the doubling times of strains ......................................... 90
Table 3-7: Effect of external pH on the doubling times of strains ......................................... 94
Table 3-8: Respiration rate for strain RV2 subjected to pH stress ........................................ 97
Table 3-9: Respiration rate for strain RV3 subjected to pH stress ........................................ 98
Table 3-10: Respiration rate for strain RV4 subjected to pH stress ...................................... 99
Table 3-11: Respiration rate for strain LV1 subjected to pH stress .................................... 100
Table 3-12: Overnight cultures external pH of RV2, RV3, RV4 and LV1 strains ................... 106
Table 3-13: Overnight cultures external pH of RV2, RV3, RV4 and LV1 strains ................... 107
Table 4-1: Similarity between 16S rRNA gene sequence ..................................................... 124
Table 4-2: Similarity between 16S rRNA gene sequence ..................................................... 127
Table 4-3: Similarity between 18S rRNA gene sequence ..................................................... 135
Table 4-4: Similarity between 18S rRNA gene sequence ..................................................... 138
Table 5-1: Effect of external pH on the doubling times of D. hansenii ................................ 158
Table 5-2: Effect of external pH on the doubling times of M. luteus .................................... 160
Table 5-3: Effect of different NaCl concentrations on the doubling times of D. hansenii .. 166
xiv
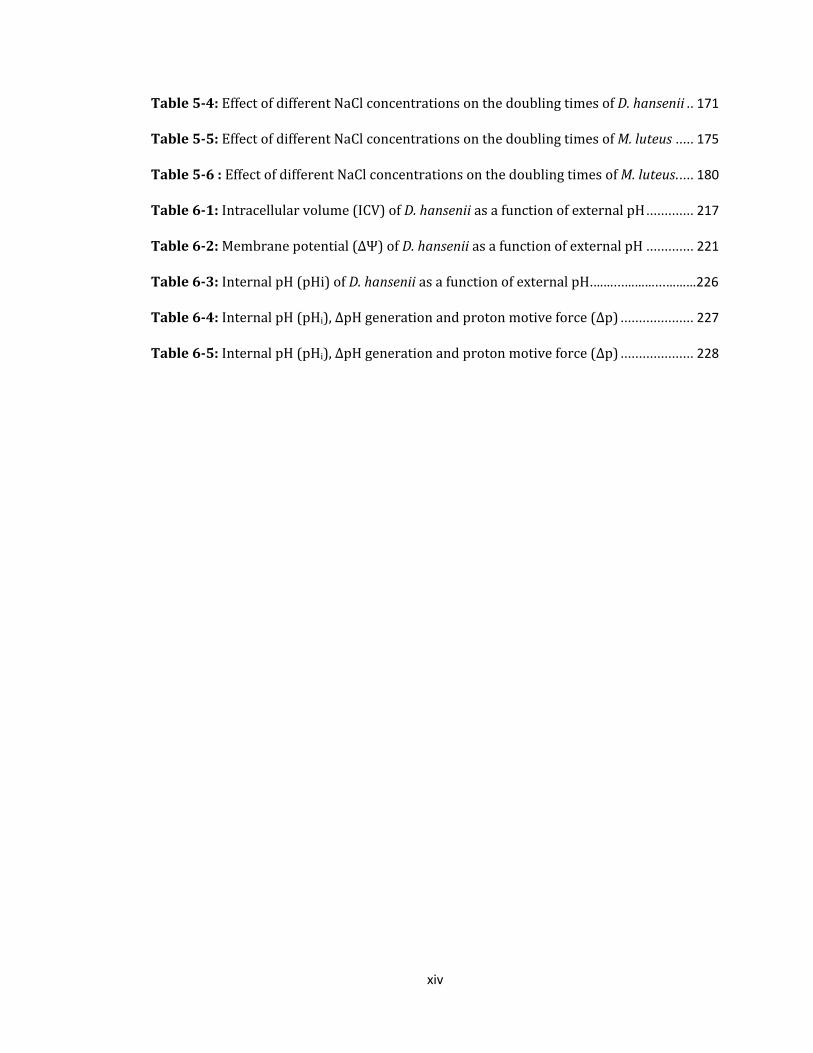
Table 5-4: Effect of different NaCl concentrations on the doubling times of D. hansenii .. 171
Table 5-5: Effect of different NaCl concentrations on the doubling times of M. luteus ..... 175
Table 5-6 : Effect of different NaCl concentrations on the doubling times of M. luteus. .... 180
Table 6-1: Intracellular volume (ICV) of D. hansenii as a function of external pH ............. 217
Table 6-2: Membrane potential (ΔΨ) of D. hansenii as a function of external pH ............. 221
Table 6-3: Internal pH (pHi) of D. hansenii as a function of external pH.……...………...………226
Table 6-4: Internal pH (pHi), ΔpH generation and proton motive force (Δp) .................... 227
Table 6-5: Internal pH (pHi), ΔpH generation and proton motive force (Δp) .................... 228
xv
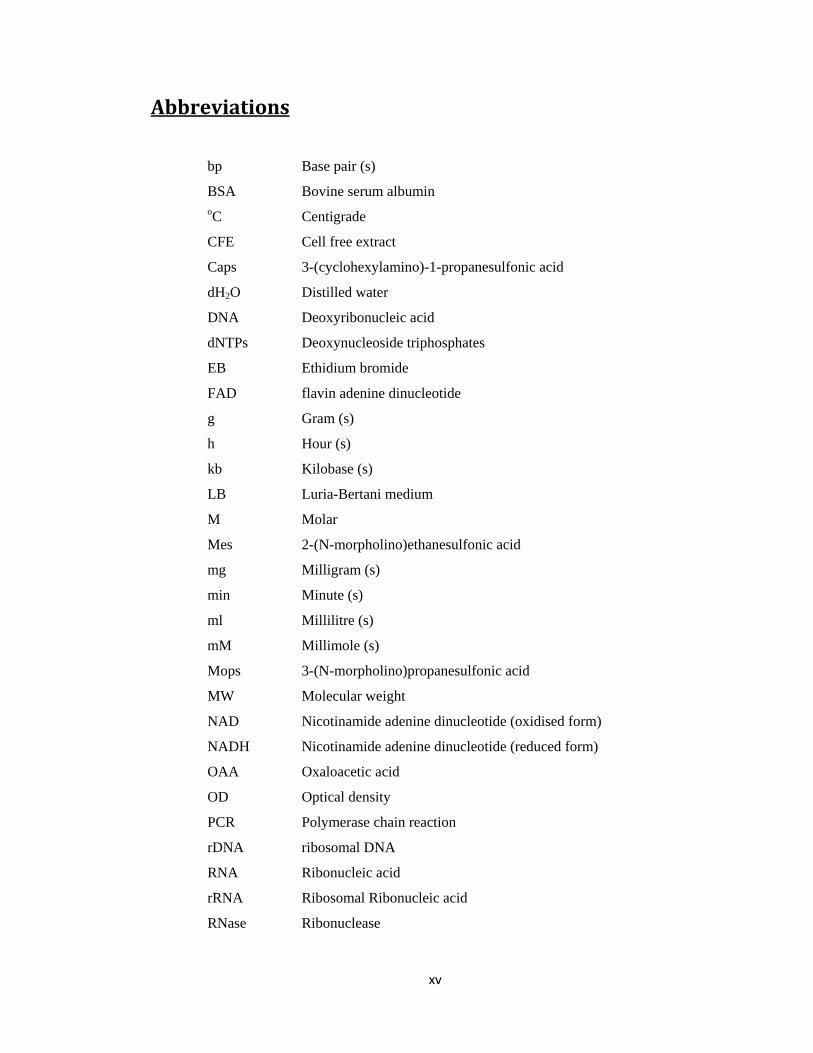
Abbreviations
bp
BSA oC
CFE
Caps
dH2O
DNA
dNTPs
EB
FAD
g
h
kb
LB
M
Mes
mg
min
ml
mM
Mops
MW
NAD
NADH
OAA
OD
PCR
rDNA
RNA
rRNA
RNase
Base pair (s)
Bovine serum albumin
Centigrade
Cell free extract
3-(cyclohexylamino)-1-propanesulfonic acid
Distilled water
Deoxyribonucleic acid
Deoxynucleoside triphosphates
Ethidium bromide
flavin adenine dinucleotide
Gram (s)
Hour (s)
Kilobase (s)
Luria-Bertani medium
Molar
2-(N-morpholino)ethanesulfonic acid
Milligram (s)
Minute (s)
Millilitre (s)
Millimole (s)
3-(N-morpholino)propanesulfonic acid
Molecular weight
Nicotinamide adenine dinucleotide (oxidised form)
Nicotinamide adenine dinucleotide (reduced form)
Oxaloacetic acid
Optical density
Polymerase chain reaction
ribosomal DNA
Ribonucleic acid
Ribosomal Ribonucleic acid
Ribonuclease
xvi
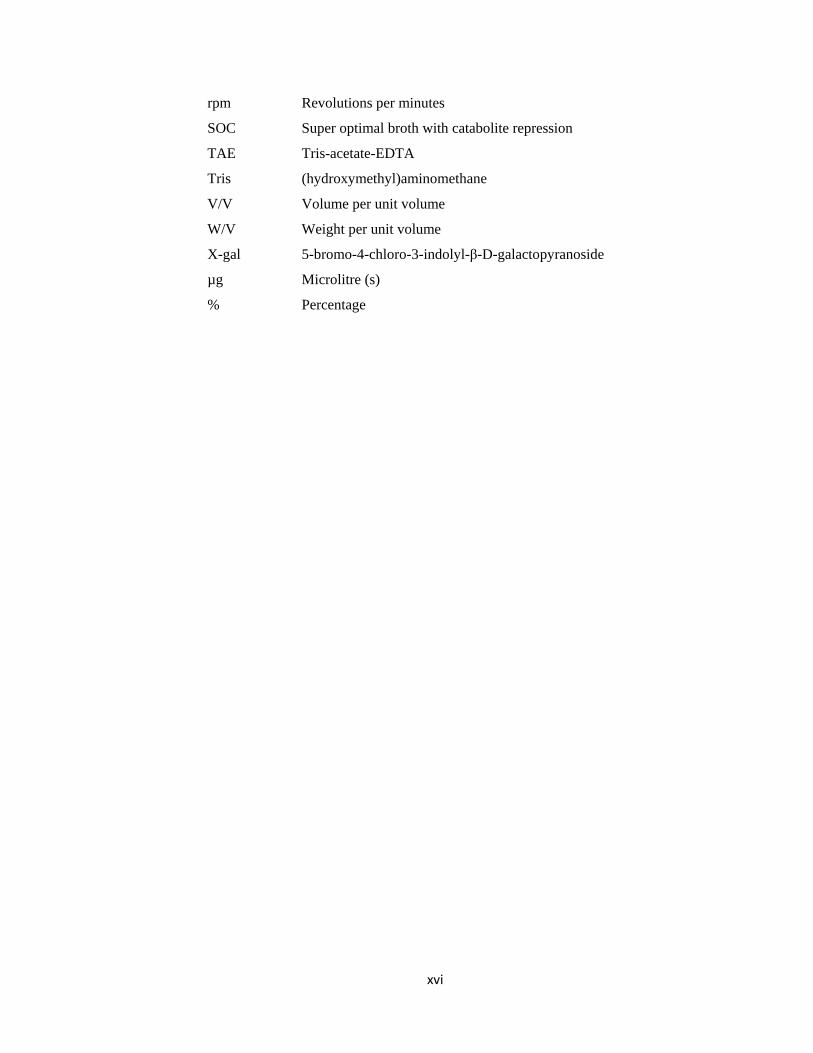
rpm
SOC
TAE
Tris
V/V
W/V
X-gal
µg
%
Revolutions per minutes
Super optimal broth with catabolite repression
Tris-acetate-EDTA
(hydroxymethyl)aminomethane
Volume per unit volume
Weight per unit volume
5-bromo-4-chloro-3-indolyl-β-D-galactopyranoside
Microlitre (s)
Percentage

1
CCHHAAPPTTEERR OONNEE
2
1 INTRODUCTION AND AIMS
1.1 Microbial Life
When a biosphere existed and long before plants and animals evolved on Earth, the planet
teemed with microbial life. Microorganisms continue to thrive, evolve and make all other
life on Earth possible (Staley, 2002). Generally, microbial cells thrive in populations which
are in association with other cells, but nevertheless, a number of biological, physical and
chemical factors control the continued existence of a microorganism. In fact, the physical
environmental factors sometimes deter adaptation and define an absolute limit beyond
which no life can exist (Lin and Reysenbach, 2003).
The evidence indicates that there may be complex interactions between microbes
growing in the environment. For example, when a particular organism starts
metabolising a particular compound, it may reduce or remove inhibiting material and
thus allow growth of other organisms. Kimura et al. (2006) have reported that, in the
presence of acetic acid, sulphate reducing bacteria cannot grow. These bacteria
require aerobic organisms to remove the acetic acid, a toxic by-product of their
anaerobic sulphate reduction.
In 1998 the known organisms consisted of 1.5 million animal species, 0.3 million plant
species (Cases and De Lorenzo, 2002) and half a million insects (Pace, 1997), compared to
only 4500 prokaryotes (Torsvik et al., 2002). This is significantly less than 1% of the total
number of species on Earth, which is an astonishingly small percent when one considers
that prokaryotes have been estimated to contain between 60-100 % of the total carbon
contained in plants (Whitman et al., 1998). This strongly suggests that there are a great
3
number of microorganism species over the three domains of life (Figure 1-1) still to be
discovered and characterised (Pace, 1997). Therefore, recent research has included
intensive studies of microbial life in unusual environments such as a stratosphere, space,
and Mars in order to isolate novel species.
1.2 Extreme Environments and Extremophiles
Life can be found on Earth in a wide range of environments, some of which are
normal from a human viewpoint and others are extreme in human terms (DasSarma,
2006). In this sense, normal environments are environments with a temperature
between 20 and 40°C, pH near neutral, with sufficient levels of accessible water,
essential nutrients, air pressure at 1 atmosphere and relatively low salt concentration.
Therefore, any environmental condition that varies significantly from the normal
condition can be considered as an extreme condition (Satyanarayana et al., 2005).
There are various types of extreme environments such as extreme (acidity i.e.
environments that have pH values lower than 4) or high alkalinity environments that
have pH values above 9, high temperature between 55 to 121°C (volcanoes and hot
springs) or extreme cold environments between -10 to 0°C (polar ice), and high-salt
environments containing 2 – 5 M NaCl (saline lakes) (Hough and Danson, 1999, van
den Burg, 2003, Gomes and Steiner, 2004). There are also high pressure
environments that have hydrostatic pressures up to 1400 atmospheres (Satyanarayana
et al., 2005). Additionally, there are manmade, extreme conditions including cool
houses, steam heated buildings and acid mine waters (Satyanarayana et al., 2005).
4
Life in extreme environments has been studied intensively, focusing attention on the
diversity of organisms and the molecular and regulatory mechanisms involved.
Extremophiles are structurally adapted at the molecular level to resist these extreme
conditions (Gomes and Steiner, 2004). MacElroy (1974) was one of the first to use
the term extremophile to refer to an organism that can grow and thrive in extreme
environmental conditions, as reported by Gomes and Steiner (2004). Many
extremophiles are found within the Domain Archaea (Woese et al., 1990, Albers et
al., 2001), however, many Bacteria and even some Eukarya can tolerate extreme
conditions (Figure 1-1) (Albers et al., 2001, Konings et al., 2002). Unlike many
microorganisms that cannot grow and survive under extreme conditions, extreme
microorganisms can develop and grow optimally when one or several stress
conditions are in the extreme range (Edwards, 1990, Horikoshi and Grant, 1991,
Albers et al., 2001).
Furthermore, some extremophiles are polyextremophiles that are able to withstand
multiple extremes (i.e. adapted to more than one type of extreme environment).
Examples are the acidothermophiles Sulfolobus solfataricus and Sulfolobus
acidocaldarius that have been grown at high acidity and 80°C (Gomes and Steiner,
2004, Irwin and Baird, 2004). Thermophilic alkalitolerant bacteria have also been
isolated, such as Anaerobranca spp. (Engle et al., 1995).
Additionally, the extremozymes (biocatalysts) produced by extreme microorganisms
are proteins that can work under extreme conditions via their extreme stability, they
suggest new opportunities for biotransformations and biocatalysis (Gomes and
Steiner, 2004).
5
Table 1-1 shows the different groups of extremophiles and the extremozymes which
have been obtained from these microorganisms (Hough and Danson, 1999, van den
Burg, 2003). It is clear that extremophiles may have important industrial applications
in terms of the utility of their metabolic ability in extreme environments and their
ability to produce unusual enzymes (Russell, 2000, Goto et al., 2005).
Extremophilic microorganisms are classified according to the environmental
conditions required for optimum growth e.g. acidophiles (pH < 4), alkaliphiles (pH >
9), halophiles (NaCl > 2M), thermophiles (temperature > 55°C), psychrophiles
(temperature < 10°C) and osmophiles (water activity less than 0.8) (Edwards, 1990,
Gilmour, 1990, Jennings, 1990, Horikoshi and Grant, 1991, ve Habitatlar, 2002,
Gomes and Steiner, 2004). Moreover, it is fascinating to note that many
extremophilic bacteria are amongst the most primitive of bacteria, as suggested by
their location close to the root of the universal phylogenetic tree (Figure 1-1) (Hough
and Danson, 1999).
On interesting line of recent work has focused on isolating extremophilic
microorganisms from non extreme environments to demonstrate their ubiquitous
presence in many so-called normal habitats (Staley and Gosink, 1999, Ma et al.,
2010)
6
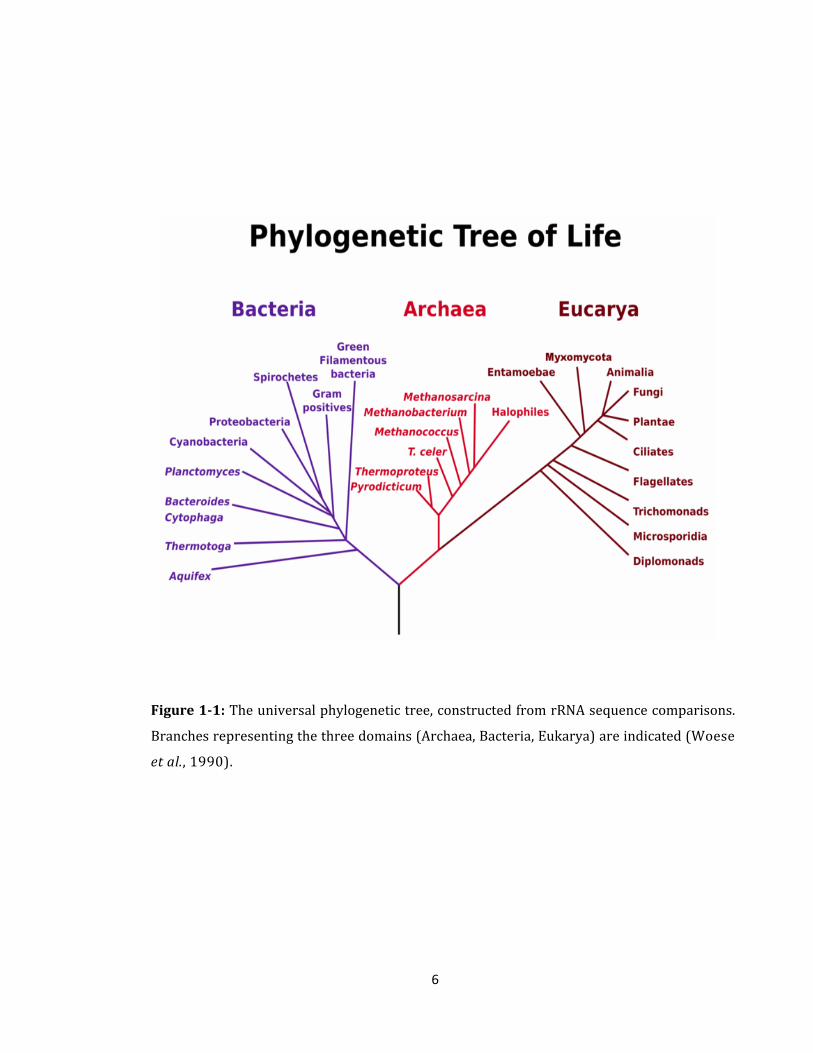
Figure 1-1: The universal phylogenetic tree, constructed from rRNA sequence comparisons.
Branches representing the three domains (Archaea, Bacteria, Eukarya) are indicated (Woese
et al., 1990).
7
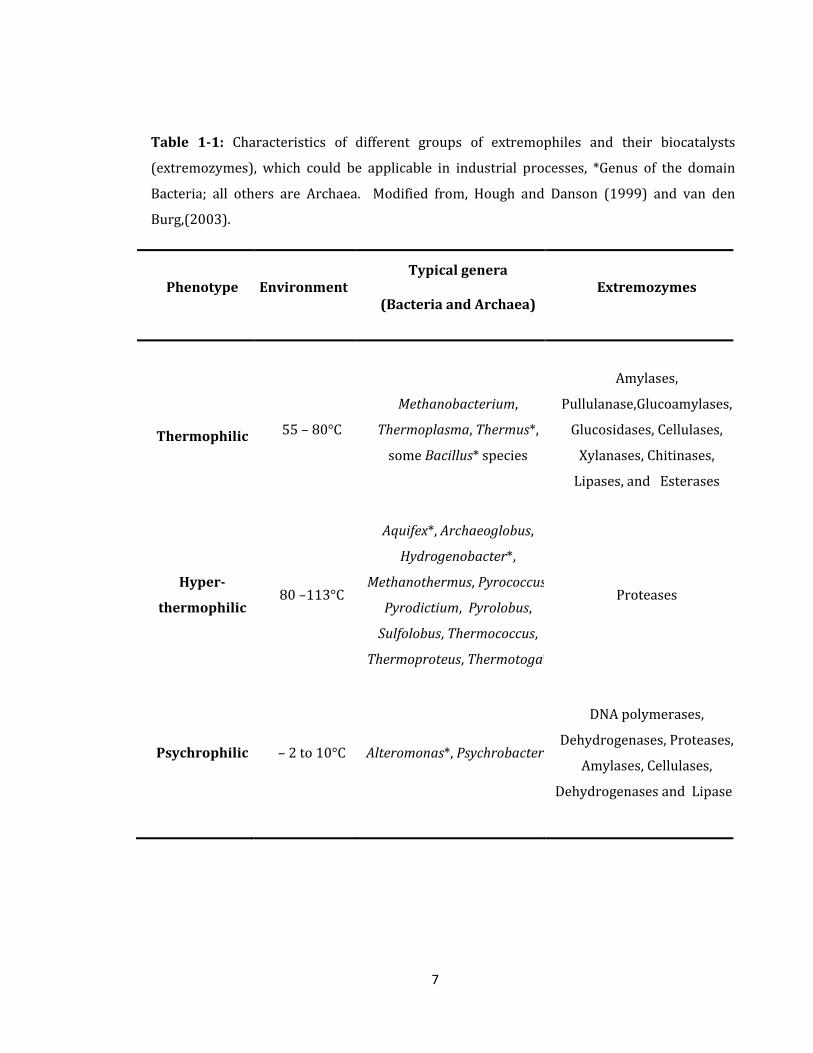
Table 1-1: Characteristics of different groups of extremophiles and their biocatalysts
(extremozymes), which could be applicable in industrial processes, *Genus of the domain
Bacteria; all others are Archaea. Modified from, Hough and Danson (1999) and van den
Burg,(2003).
Phenotype Environment Typical genera
(Bacteria and Archaea) Extremozymes
Thermophilic 55 – 80°C
Methanobacterium,
Thermoplasma, Thermus*,
some Bacillus* species
Amylases,
Pullulanase,Glucoamylases,
Glucosidases, Cellulases,
Xylanases, Chitinases,
Lipases, and Esterases
Hyper-
thermophilic 80 –113°C
Aquifex*, Archaeoglobus,
Hydrogenobacter*,
Methanothermus, Pyrococcus
Pyrodictium, Pyrolobus,
Sulfolobus, Thermococcus,
Thermoproteus, Thermotoga*
Proteases
Psychrophilic – 2 to 10°C Alteromonas*, Psychrobacter*
DNA polymerases,
Dehydrogenases, Proteases,
Amylases, Cellulases,
Dehydrogenases and Lipases
8
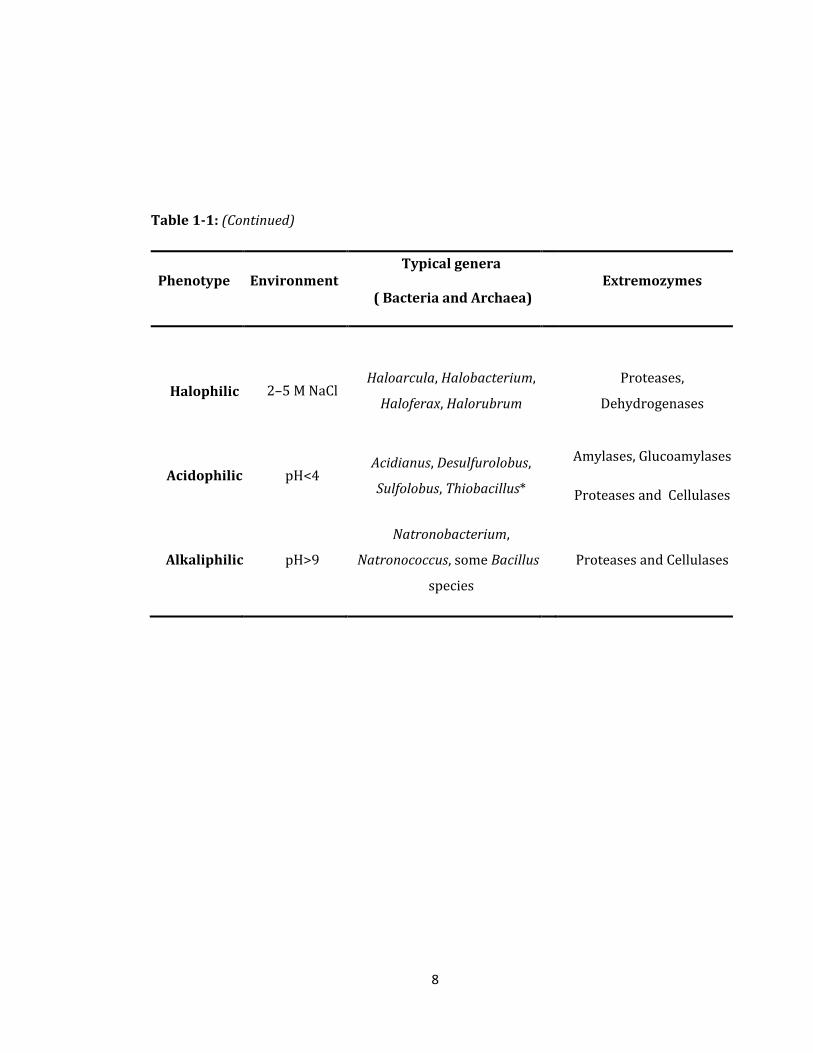
Table 1-1: (Continued)
Phenotype Environment Typical genera
( Bacteria and Archaea) Extremozymes
Halophilic
2–5 M NaCl Haloarcula, Halobacterium,
Haloferax, Halorubrum
Proteases,
Dehydrogenases
Acidophilic pH<4 Acidianus, Desulfurolobus,
Sulfolobus, Thiobacillus*
Amylases, Glucoamylases
Proteases and Cellulases
Alkaliphilic pH>9
Natronobacterium,
Natronococcus, some Bacillus*
species
Proteases and Cellulases
9
1.3 Acidic Environments
Acidic environments are environments which have a pH value less than 5. Extremely
low pH value environments are not very abundant, and are often due to large amounts
of pyrite and sulphur being exposed to oxygen causing several chemical processes to
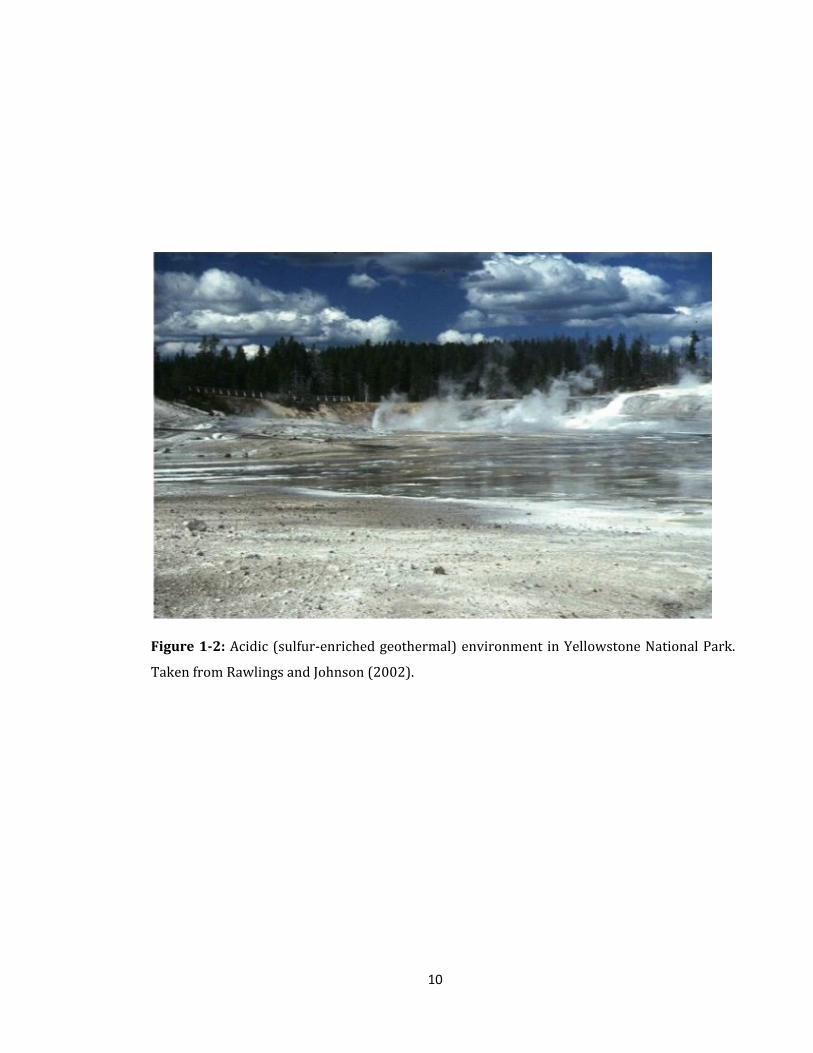
lower pH values (Figure 1-2) (Rainey and Oren, 2006). Other less typical
environments, such as those contaminated by heavy metals or other pollutants, are
also extreme. Prokaryotes (both bacteria and archaea) are the dominant
microorganisms in most extreme environments, but some extremophilic eukaryotes
are known.
Acidic environments capable of sustaining life are usually dominated by sulphate
anions, and there is usually only a low concentration of dissolved organic substances,
with as little as 20 mg l-1 dissolved carbon in some environments (Johnson, 1998).
Extremely acidic environments may be formed by processes that are entirely natural.
However, anthropogenic influences (both direct and indirect) have become
increasingly important in creating such environments, particularly since the onset of
the industrial revolution. Indeed, the majority of extremely acidic sites now in
existence worldwide have their origin in one particular human activity, the mining of
metals and coal.
10
Figure 1-2: Acidic (sulfur-enriched geothermal) environment in Yellowstone National Park.
Taken from Rawlings and Johnson (2002).
11
A variety of microbial activities create net acidity. These include nitrification, and the
formation and accumulation of organic acids either during fermentation or as
products of aerobic metabolism. Most relevant, however, to the genesis of extremely
acidic environments is the microbial dissimilatory oxidation of elemental sulfur,
reduced sulfur compounds (RSCs), and ferrous iron.
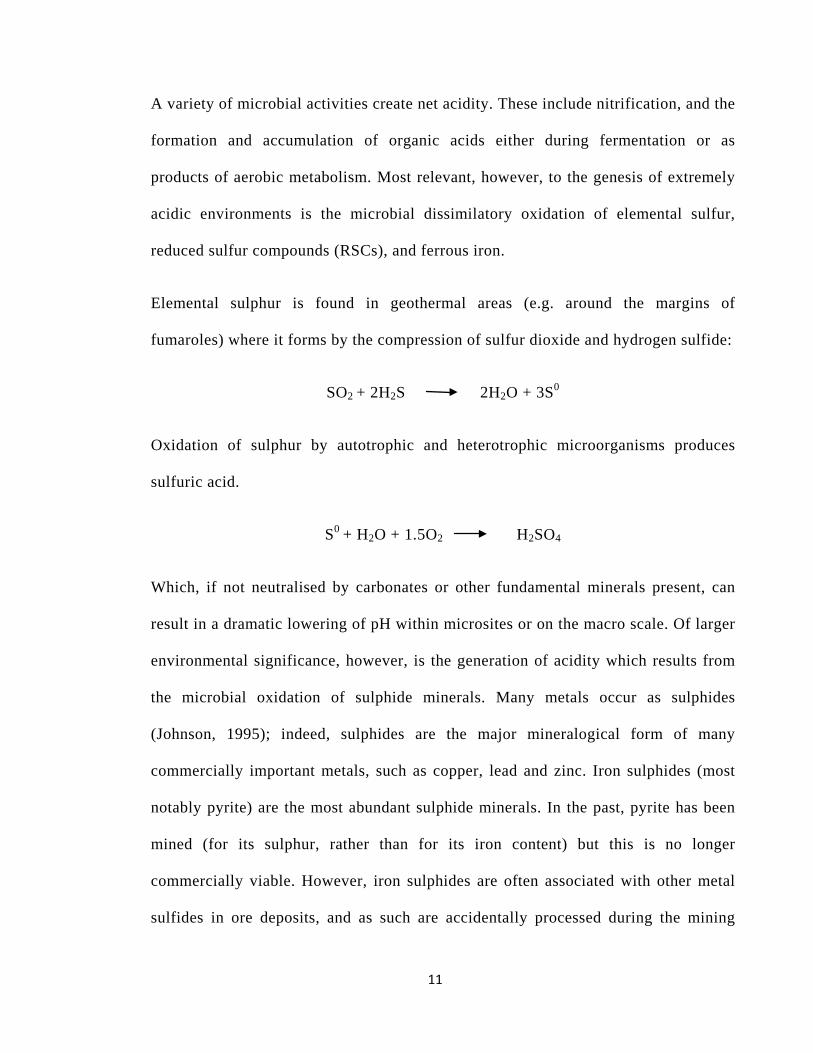
Elemental sulphur is found in geothermal areas (e.g. around the margins of
fumaroles) where it forms by the compression of sulfur dioxide and hydrogen sulfide:
SO2 + 2H2S 2H2O + 3S0
Oxidation of sulphur by autotrophic and heterotrophic microorganisms produces
sulfuric acid.
S0 + H2O + 1.5O2 H2SO4
Which, if not neutralised by carbonates or other fundamental minerals present, can
result in a dramatic lowering of pH within microsites or on the macro scale. Of larger
environmental significance, however, is the generation of acidity which results from
the microbial oxidation of sulphide minerals. Many metals occur as sulphides
(Johnson, 1995); indeed, sulphides are the major mineralogical form of many
commercially important metals, such as copper, lead and zinc. Iron sulphides (most
notably pyrite) are the most abundant sulphide minerals. In the past, pyrite has been
mined (for its sulphur, rather than for its iron content) but this is no longer
commercially viable. However, iron sulphides are often associated with other metal
sulfides in ore deposits, and as such are accidentally processed during the mining
12
process, ending up as waste materials (in mineral tailings etc.). Pyrite and other iron
sulphides are also present in coal deposits (range: < 1 to > 20%) and, inevitably, in
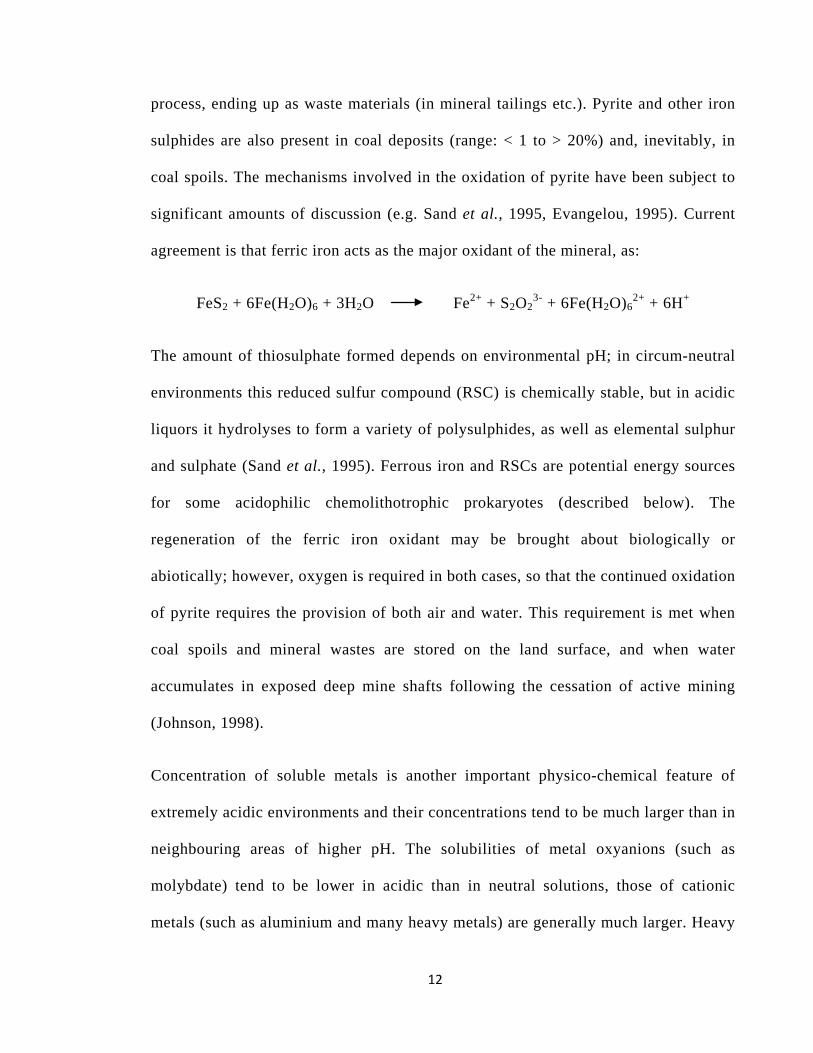
coal spoils. The mechanisms involved in the oxidation of pyrite have been subject to
significant amounts of discussion (e.g. Sand et al., 1995, Evangelou, 1995). Current
agreement is that ferric iron acts as the major oxidant of the mineral, as:
FeS2 + 6Fe(H2O)6 + 3H2O Fe2+ + S2O23- + 6Fe(H2O)6
2+ + 6H+
The amount of thiosulphate formed depends on environmental pH; in circum-neutral
environments this reduced sulfur compound (RSC) is chemically stable, but in acidic
liquors it hydrolyses to form a variety of polysulphides, as well as elemental sulphur
and sulphate (Sand et al., 1995). Ferrous iron and RSCs are potential energy sources
for some acidophilic chemolithotrophic prokaryotes (described below). The
regeneration of the ferric iron oxidant may be brought about biologically or
abiotically; however, oxygen is required in both cases, so that the continued oxidation
of pyrite requires the provision of both air and water. This requirement is met when
coal spoils and mineral wastes are stored on the land surface, and when water
accumulates in exposed deep mine shafts following the cessation of active mining
(Johnson, 1998).
Concentration of soluble metals is another important physico-chemical feature of
extremely acidic environments and their concentrations tend to be much larger than in
neighbouring areas of higher pH. The solubilities of metal oxyanions (such as
molybdate) tend to be lower in acidic than in neutral solutions, those of cationic
metals (such as aluminium and many heavy metals) are generally much larger. Heavy
13
metals types and concentrations which present in any specific extremely acidic
environment are much dictated by the local geochemistry; metals may originate
directly from the oxidation of sulphide minerals (various chalcophilic metals) or from
the accelerated mineral weathering which occurs under conditions of high acidity
(e.g. aluminium from the weathering of clay minerals). Also high concentrations of
soluble metalloid elements may occur in extremely acidic environments, of which the
most important (from the point of view of ecotoxicology) is arsenic, which occurs in
several sulphide minerals such as arsenopyrite (FeAsS) and realgar (AsS) (Johnson,
1998).
1.4 Acidophiles and Diversity
Under conditions of low pH, acidophiles flourish. These microorganisms are termed
extreme acidophiles if they capable of optimal growth at less than pH 3 and moderate
acidophiles if they are capable of optimal growth at pH 3 – 5. Microorganisms
capable of growth at low pH are largely prokaryotes, and comprise relatively few
species of Bacteria and Archaea (Johnson and Hallberg, 2003, Baker-Austin and
Dopson, 2007, Johnson and Hallberg, 2008).
Therefore, most acidophilic microorganisms have been isolated from extreme
environments that present an inaccessible physical barrier which reduces the
colonization potential of other microorganisms that grow at or around neutral pH
(neutralophilic). These extreme environments include both man-made and natural
acidic environments that occur in the biosphere such as acid mine drainage and
geothermal vents (Futterer et al., 2004, Johnson and Hallberg, 2003). True
14
acidophiles such as the archaea Picrophilus torridus and P. oshimae have been grown
optimally at pH 0.7 and at 60°C (Gomes and Steiner, 2004). The biodiversity of
extreme acidophiles has recently attracted considerable attention with regard to their
physiology and phylogenetic affiliations (Table 1-2). The ability to use inorganic
chemicals as electron donors is common among extreme acidophiles, as ferrous iron
and sulfur represent two major energy sources in many extremely acidic
environments (Johnson and Hallberg, 2008). Reduction of iron and sulfur by
acidophilic microorganisms is driven by their use as electron acceptors under oxygen
limited conditions and in turn these reactions drive major biogeochemical processes
in low pH environments. Acidophiles show considerable diversity in how they
assimilate carbon, some are obligate autotrophs and others are obligate heterotrophs,
whereas a great number use either organic or inorganic carbon, depending on the
availability of the former (Johnson and Hallberg, 2008).
However, acidic effluents associated with acid mine drainage can cause huge
environmental pollution such as the contamination of drinking water. Therefore, the
reduction of this pollution is one of the important biotechnological applications of
acidophiles, in addition to their role in metal extraction from ores (Rohwerder et al.,
2003, Golyshina and Timmis, 2005). Furthermore, acidophilic microorganisms can be
used as a source of acid-stable enzymes with applications as lubricants and catalysts
(van den Burg, 2003). These enzymes included, pullulanases, amylases glucosidases
and glucoamylases (Gomes and Steiner, 2004).
15
According to their carbon source and method of energy generation and further
subdivided based on their growth optimum temperature acidophiles are most
commonly grouped as shown in (Table 1-2).
Most extremely acidic environments contain relatively low concentrations (< 20 mg l-
1) of dissolved organic carbon, and may therefore be classed as oligotrophic. Primary
production in sites which do not receive sunlight (e.g. abandoned deep mines) is
based exclusively on chemolithoautotrophy, and is inexorably linked to the oxidation
of ferrous iron and reduced sulphur compounds. The main focus of research in this
area of microbiology is chemolithotrophic acidophiles, and much is known of the
detailed physiology and biochemistry of some of these prokaryotes, most notably the
iron/ sulphur-oxidising bacterium Acidothiobacillus ferrooxidans (Leduc and Ferroni,
1994). Most iron- and sulfur-oxidising acidophiles are regarded as autotrophic,
though the ability to assimilate organic carbon has been demonstrated with some of
these (e.g. utilisation of formic acid by At. ferrooxidans (Pronk et al., 1991)). Either
mixotrophic (i.e. may assimilate organic and inorganic carbon) or obligately
heterotrophic are other prokaryotes which catalyse the dissimilatory oxidation of iron
and/or RSCs.
In those extremely acidic environments that are illuminated, primary production may
also be mediated by phototrophic acidophiles. The majority of these are eukaryotic
microalgae, and include filamentous and unicellular forms, and diatoms (Gyure et al.,
1987, Lopez-Archilla et al., 1995).
16
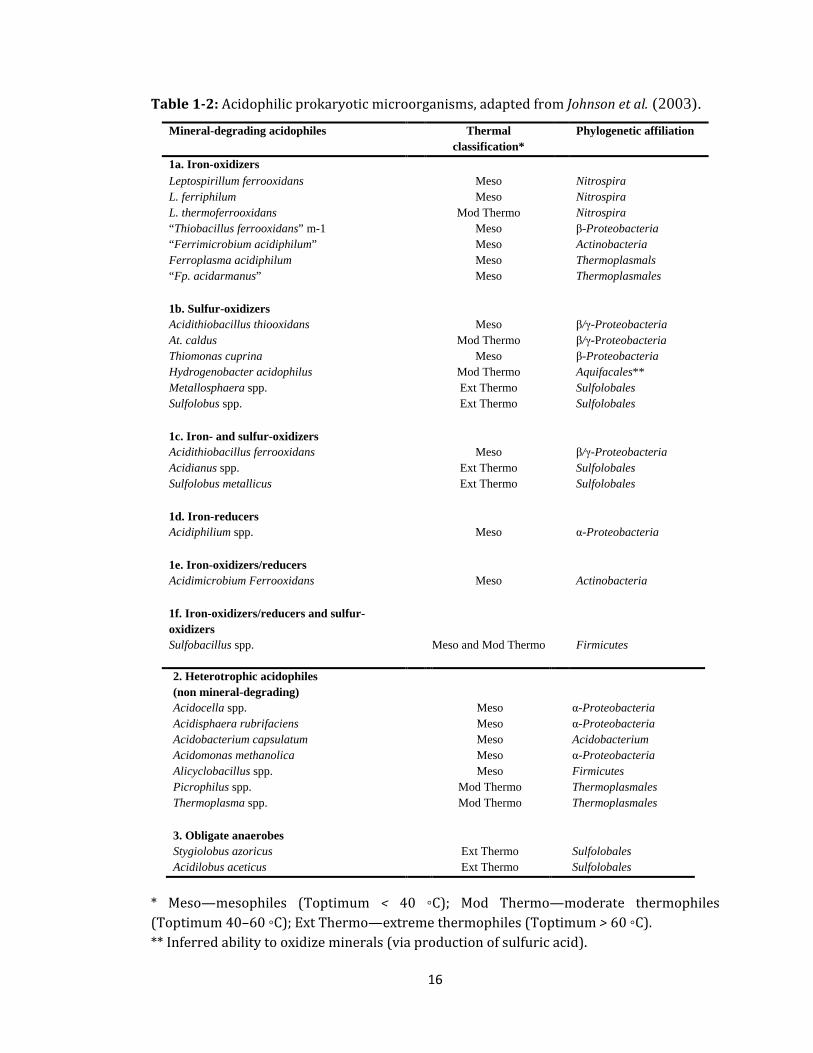
Table 1-2: Acidophilic prokaryotic microorganisms, adapted from Johnson et al. (2003). Mineral-degrading acidophiles Thermal
classification*
Phylogenetic affiliation
1a. Iron-oxidizers Leptospirillum ferrooxidans Meso Nitrospira L. ferriphilum Meso Nitrospira L. thermoferrooxidans Mod Thermo Nitrospira “Thiobacillus ferrooxidans” m-1 Meso β-Proteobacteria “Ferrimicrobium acidiphilum” Meso Actinobacteria Ferroplasma acidiphilum Meso Thermoplasmals “Fp. acidarmanus” Meso Thermoplasmales 1b. Sulfur-oxidizers Acidithiobacillus thiooxidans Meso β/γ-Proteobacteria At. caldus Mod Thermo β/γ-Proteobacteria Thiomonas cuprina Meso β-Proteobacteria Hydrogenobacter acidophilus Mod Thermo Aquifacales** Metallosphaera spp. Ext Thermo Sulfolobales Sulfolobus spp. Ext Thermo Sulfolobales 1c. Iron- and sulfur-oxidizers Acidithiobacillus ferrooxidans Meso β/γ-Proteobacteria Acidianus spp. Ext Thermo Sulfolobales Sulfolobus metallicus Ext Thermo Sulfolobales 1d. Iron-reducers Acidiphilium spp. Meso α-Proteobacteria 1e. Iron-oxidizers/reducers Acidimicrobium Ferrooxidans Meso Actinobacteria 1f. Iron-oxidizers/reducers and sulfur-oxidizers
Sulfobacillus spp. Meso and Mod Thermo
Firmicutes
2. Heterotrophic acidophiles (non mineral-degrading)
Acidocella spp. Meso α-Proteobacteria Acidisphaera rubrifaciens Meso α-Proteobacteria Acidobacterium capsulatum Meso Acidobacterium Acidomonas methanolica Meso α-Proteobacteria Alicyclobacillus spp. Meso Firmicutes Picrophilus spp. Mod Thermo Thermoplasmales Thermoplasma spp. Mod Thermo Thermoplasmales 3. Obligate anaerobes Stygiolobus azoricus Ext Thermo Sulfolobales Acidilobus aceticus Ext Thermo Sulfolobales
* Meso—mesophiles (Toptimum < 40 ◦C); Mod Thermo—moderate thermophiles (Toptimum 40–60 ◦C); Ext Thermo—extreme thermophiles (Toptimum > 60 ◦C). ** Inferred ability to oxidize minerals (via production of sulfuric acid).
17
Mesophilic acidophilic phototrophs include Euglena spp., Chlorella spp.,
Chlamydomonas acidophila, Ulothrix zonata and Klebsormidium fuitans. The
unicellular rhodophyte Galdieria sulphuraria (formerly Cyanidium caldarium) has
been isolated from geothermal acidic springs and streams in Yellowstone National
Park and elsewhere (Brock, 1978). This moderate thermophile may grow as a
heterotroph in the absence of light (as may Euglena spp.) and has been reported to
grow at pH values around zero (Schleper et al., 1995).
Heterotrophic microorganisms may easily be isolated from most extremely acidic
environments. Many are adept scavengers and rely to a greater or lesser extent on
carbon originating as leakage or lysis products from chemolithotrophic acidophiles.
Obligately acidophilic heterotrophs include archaea, bacteria, fungi, yeasts and
protozoa. Some prokaryotic acidophilic heterotrophs have a direct role in the
dissimilatory oxido-reduction of iron (Pronk and Johnson, 1992). These include the
iron-oxidiser `Ferromicrobium acidophilus' (Johnson, 1998) which appears to use the
energy from iron-oxidation to support growth, and various Acidiphilium-like isolates
which can use ferric iron as terminal electron acceptor. Many acidophilic archaea
(Table 1-2) are obligate heterotrophs, including Sulfolobus acidocaldarius; early
reports of this archaeon being a facultative chemolithotroph are now thought to be
due to the inadvertent use of mixed cultures of Sf. acidocaldarius and another
extreme thermophile (possibly Sulfolobus metallicus (Johnson, 1998)). The two
characterized species of the moderately thermophilic heterotrophic archaeon
Picrophilus have the lowest recorded pH optima for growth (ca. pH -0.7) of all
known acidophilic microorganisms (Schleper et al., 1995).
18
A number of yeasts have also been reported to inhabit extremely acidic environments.
Rhodotorula spp. are frequently encountered (and readily isolated) in acid mine
drainage waters, and isolates belonging to other genera (e.g. Candida, Cryptococcus)
have also been described (Lopez-Archilla et al., 1995). Among the filamentous fungi
which have been isolated from acidic sites are some of the most acidophilic of all
microorganisms; Acontium cylatium, Trichosporon cerebriae and a Cephalosporium
sp. have all been reported to grow at ca. pH 0 (Schleper et al., 1995). Protozoa are
frequently encountered in acidic mineral leaching and related environments. A
laboratory study of three flagellates (Eutreptia/Bodo spp.), a ciliate (Cinetochilium
sp.) and an amoeba (Vahlkampvia sp.) showed that all were obligately acidophilic
(growing in media poised at pH 1.6 and above) and that they grazed mineral-
oxidising (and other) acidophilic bacteria (Johnson and Rang, 1993).
The basis of acidophilic microorganisms response to different temperatures is one of
the more convenient ways of subdividing them (e.g. (Norris and Johnson, 1998)).
Three groups have been recognised: mesophiles (Topt ca. 20-40oC), moderate
thermophiles (Topt ca. 40-60oC) and extreme thermophiles (Topt >60oC; Table 1-2).
Moderately thermophilic acidophilic prokaryotes include archaea and bacteria (the
majority of which are Gram-positive), while the extreme thermophiles group is made
up exclusively of archaea. In contrast, mesophilic acidophiles (autotrophs and
heterotrophs) are dominantly by rod-shaped, Gram-negative bacteria. Exceptions to
this general tendency include `F. acidophilus' which, on the basis of 16S rDNA base
sequence analysis, is located within the Actinobacteria (Johnson, 1998), and
Sulfobacillus disulfidooxidans, a mesophilic spore-forming Gram-positive bacterium
19
which has been reported to use pyrite and elemental sulphur as sole energy sources or
to grow heterotrophically on various organic substrates (Dufresne et al., 1996).
However, there is some uncertainty regarding the capacity of S. disulfidooxidans to
grow chemolithotrophically, and the isolate is, in fact, more closely related to the
obligately heterotrophic Alicyclobacillus spp. than to the iron/sulfur-oxidising
Sulfobacillus spp. Relatively few studies have focused on psychrophilic and
psychrotolerant acidophiles, even though many extremely acidic, low-temperature
sites are known, such as subterranean mine waters in the mid-high latitudes.
Berthelot et al. (1994) isolated acidophilic bacteria from water draining a uranium
mine in Ontario, and studied their ability to grow at between 4oC and 37oC. Although
96% of the iron-oxidising isolates and 54% of the heterotrophic isolates were classed
as psychrotolerant, none was shown to be truly psychrophilic. Water samples were
collected in the winter months, when temperatures ranged from 0.5 to 5oC and it is
conceivable that the higher summer temperatures experienced at the mine may have
precluded the establishment of psychrophilic strains.
Langdahl and Ingvorsen in 1997 reported the presence of Thiobacillus-like and
heterotrophic acidophiles in an exposed sulphide ore deposit located in the High
Arctic; the mean air temperature at this site was between ˗ 15 and ˗ 20oC (range ˗ 30
to +10oC). Although autotrophic and heterotrophic carbon assimilation of
microorganisms from the site were both recorded to be optimum at ca. 21oC,
microbial ore dissolution at 0oC was noted to be 30% of the maximum recorded (at
21oC). There is likely to be a potentially important biotechnological function (e.g. in
20
in situ mining) for mineral-mobilising acidophilic bacteria which are active at very
low temperatures (Langdahl and Ingvorsen, 1997).
1.5 Mechanisms of Cytoplasmic pH Regulation in Acidophiles
There are many different mechanisms and complex processes which support the
survival of microorganisms in acidic habitats. Intracellular pH homeostasis is one of
the most important mechanisms for the survival of any cell in acidic environments,
regardless of the external pH. Growth in external pH values as low as -0.7 requires
stringent control and regulation of internal pH in order for the cell to continue to
function normally. In most cases, acidophiles must maintain a near-neutral
intracellular pH, which can be several pH units higher than the pH of the external
environment (Matin, 1990).
Proton motive force (Δp) is a key factor in energy generation and pH homeostasis for
all microorganisms. The Δp describes the energised state of the cell membrane, and is
composed of membrane potential, ΔΨ, which is the difference in charge separation
between the membrane and the external medium and ΔpH, the difference in pH
between the internal (cytoplasm) and external environment (ΔpH = pHin – pHout). Δp
is calculated as follows:
Δp (mV) = ΔΨ – 60 ΔpH (at 25oC).
In most neutralophiles, Δp is approximately -200 mV (inside negative), which results
from a slightly negative ΔpH, in the approximate range -0.1 to -1.5 for most
microorganisms, and a ΔΨ around 100 mV. However, acidophiles have a much
greater ΔpH. This could be seen as advantageous as it allows the formation of a larger
Δp and therefore for a greater proton influx though F0F1-ATPases and consequently
21
increased ATP generation. However, uncontrolled influx of protons into a cell can be
extremely harmful, potentially leading to cell death. An increased proton
concentration within the cell inhibits protein function and stability of nucleic acids,
impedes enzymatic activity, protein synthesis and transcription of DNA, ultimately
resulting in the complete dissipation of ΔpH which would result in a much decreased
Δp incapable of meeting the cells energy requirements (Baker-Austin and Dopson,
2007).
Acidophiles can minimise or prevent proton influx into their cells by several known
mechanisms, as well as other mechanisms which allow the cell to tolerate and survive
a small influx of protons into the cell. Mechanisms which inhibit or prevent proton
influx into the cell include reversing the membrane potential (ΔΨ), possessing a
highly impermeable cell membrane and proton pumping. Meanwhile, cytoplasmic
buffering, along with the presence of chemicals and enzymes which sequester protons
within the cell and an increased number of secondary transporters help the cell to
cope with proton influx (Matin, 1990).
A reversal of membrane potential is one of the most commonly observed adaptations
in acidophiles. All neutralophilic microorganisms have an inside negative ΔΨ
whereas most acidophiles possess an inside positive ΔΨ, a reversal of the normal
membrane potential (Figure 1-3). A reversed membrane potential is a mechanism for
reducing proton influx into the cell as it forms a chemiosmotic barrier which deflects
positively charged protons, preventing them from entering the cell.
22
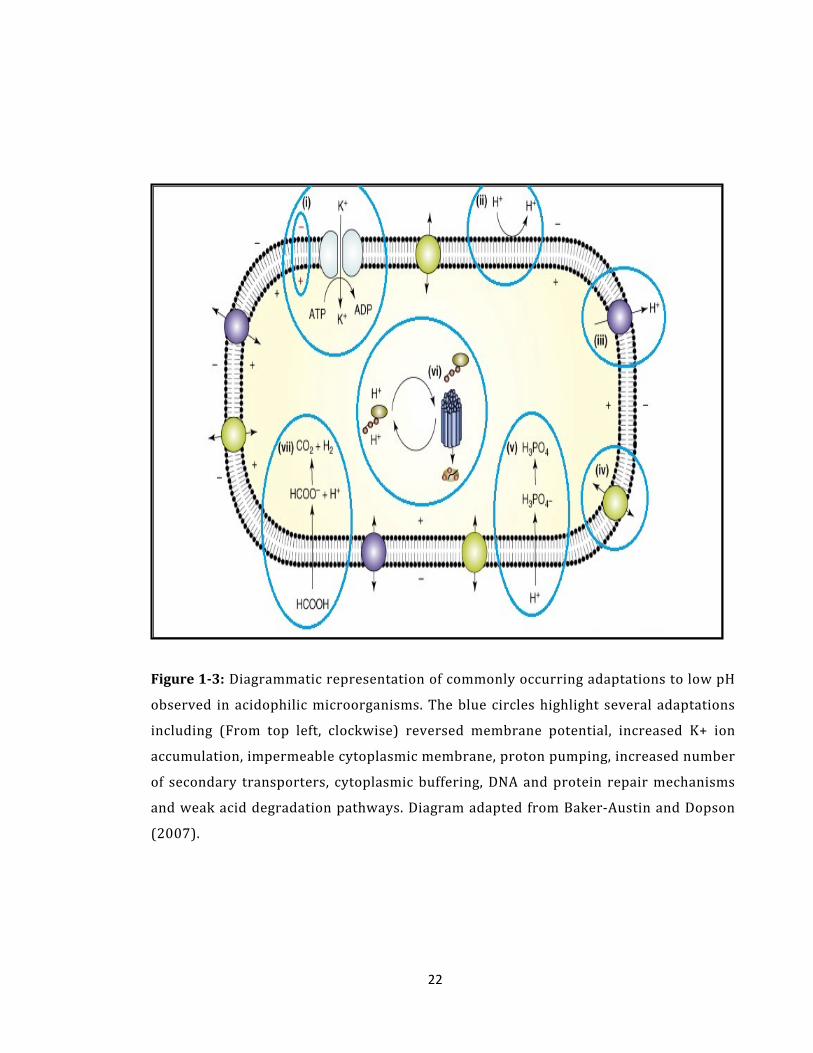
Figure 1-3: Diagrammatic representation of commonly occurring adaptations to low pH
observed in acidophilic microorganisms. The blue circles highlight several adaptations
including (From top left, clockwise) reversed membrane potential, increased K+ ion
accumulation, impermeable cytoplasmic membrane, proton pumping, increased number
of secondary transporters, cytoplasmic buffering, DNA and protein repair mechanisms
and weak acid degradation pathways. Diagram adapted from Baker-Austin and Dopson
(2007).
23
It is thought that the reversed ΔΨ is generated by a Donnan potential (Donnan, 1924)
of positively charged molecules, particularly accumulation of K+ ions. The creation of
a reversed ΔΨ by an accumulation of K+ ions is supported by evidence that there is an
increased number of potassium-transporting ATPases found in acidophile genomes
(Futterer et al., 2004, Tyson et al., 2004). Reversal of ΔΨ results in a decrease in the
overall proton motive force; however the reversed ΔΨ detracts from such a large ΔpH
that the final Δp is large enough to meet the cells energy demands.
As a result of the reversed membrane potential further difficulties are encountered.
When the cell is in acidic media, the positive inside membrane potential results in the
exclusion of permeant cations and the accumulation of permeant anions, which can
begin to poison the cell. Whilst this is true there is one exception, SO42- , the most
common anion in acidic environments. Acidophiles are able to tolerate higher levels
of SO42- than other anions for two reasons. The first reason is that acidophiles have
adapted systems to remove SO42- from inside the cell, whilst the second is that SO4
2-
is less membrane permeable than other anions since it has additional polarity and
carries a double charge (Johnson, 2006).
Research into the cytoplasmic membranes of some acidophiles has discovered a
cytoplasmic membrane which is highly resistant to proton entry, particularly in
archaeal species which synthesise tetraether lipids (van de Vossenberg et al., 1998)
(Figure 1-3). A delicate balance of membrane proton permeability is required, since
the need to minimise proton influx is offset by the cells need to transport other ions
and nutrients into the cell and pump protons out of the cell. This balance will
determine if a cell can cope with a particular Δp. In silico shotgun sequencing of
24
several acidophilic bacterial species’ genomes from a biofilm revealed a large and
varied set of genes for cell membrane biosynthesis (Tyson et al., 2004). These data
imply that a complex structure, with an as yet unknown function, may be formed and
could be an intrinsic component in acid tolerance.
Certainly the cell cannot exclude all protons from the cytoplasm, therefore active
proton pumping may be utilised in order to maintain a near-neutral intracellular pH
(Figure 1-3) (Michels and Bakker, 1985). However, there is no definitive evidence
which shows induced or increased expression of systems which exclude protons from
the cytoplasm as yet. Putative proton efflux systems have been identified in all of the
acidophilic genomes sequenced to date (Baker-Austin and Dopson, 2007) including
the Leptospirillum species in the biofilm present in acid mine drainage at Iron
Mountain, California (Tyson et al., 2004). An increased number of secondary
transporters have also been noted in the genomes of some acidophiles, which is
thought to be a further adaptation to growth in extremely low pH, since cells will
utilise the Δp generated for metabolic purposes (Figure 1-3).
The ability of the cytoplasm to buffer the intracellular pH of the cell has been
observed and shown to be involved in maintaining a near-neutral intracellular pH in
acidic conditions. All cells have the ability to buffer the cytoplasm, either releasing or
sequestering protons as appropriate using basic amino acids such as lysine, arginine
and histidine. The buffering capacity of respiration inhibited cells of Thiobacillus
acidophilus and Acidithiobacillus facile were measured and compared to the
buffering capacity of growth medium containing Tris buffer. The buffering capacity
of the microorganisms was shown to be approximately 100 nmol H+ mg protein-1 pH
25
unit-1 (Matin, 1990), showing a much smaller decrease in cytoplasmic acidification
than would be expected given the net H+ influx into the cells compared to the
buffered medium. Comparison of buffering capacity between E. coli and
Acidithiobacilus acidophilum was carried out, with buffering capacities of 85 nmol
H+ mg protein -1 and 97 nmol H+ mg protein -1, respectively (Zychlinsky and Matin,
1983) (Figure 1-3).
Of particular concern to acidophiles is the uptake of weak acids (HA) as they function
as uncouplers of the respiratory chain, which shuttle the net uniport of protons and
‘uncouple’ proton transport from cellular processes (Ciaramella et al., 2005). These
compounds can cross the cell wall in their undissociated form as they are uncharged
at acidic pH (the external pH), but once they enter the cell, near-neutral pH, they
become undissociated (H+ and A-) and can no longer leave the cell in their charged
form. Accumulation of weak acids by this process is problematic for cells, as
protonation of the cytoplasm can occur quickly therefore some acidophiles have
developed active mechanisms of weak acid degradation in order to overcome this
problem (Ciaramella et al., 2005) (Figure 1-3).
Other mechanisms involved in pH homeostasis include the use of DNA and protein
repair chaperones and the use of iron to stabilise enzymes and enzyme complexes
(Baker-Austin and Dopson, 2007). However, after comparisons of the genomes of
several acidophilic microorganisms there appears to be no definitive individual
adaptation or set of adaptations present in every acidophile which enables growth in
low pH environments.
26
1.6 Molecular Biology Techniques and Microbial Identification
It has been recorded that less than 0.1% of the total microbial population of a natural
habitat can be successfully isolated in pure culture. This is due to the bacteria being
highly selective with their growth requirements. For this reason, a variety of media
must be employed to obtain diverse microbial populations (Hill et al., 2000).
Therefore, every process which avoids the need to cultivate microorganisms before
examining their characteristics and diversity will have the potential to become a
powerful tool in microbial ecology (Marilley et al., 1998).
Compared to traditional visual and microscopic diagnostic methods, molecular
methods have a higher specificity and sensitivity and therefore may be useful to find
infections pre-symptoms and identify the target diseases without time-consuming
isolation and culturing of pathogens (Martin et al., 2000). Therefore, traditional
microbiology methods which have been used to classify organisms depending on
phenotypic characters such as morphology, physiology, and metabolism are being
supplemented by genotypic analysis (Scow et al., 2001). Amann et al. (1997)
suggested that fluorescently labeled, rRNA-targeted nucleic acid probes are very
useful for many fields of microbial ecology and also, described stages in the
molecular methods to identify microorganisms from environmental samples (Figure 1-
4).
27
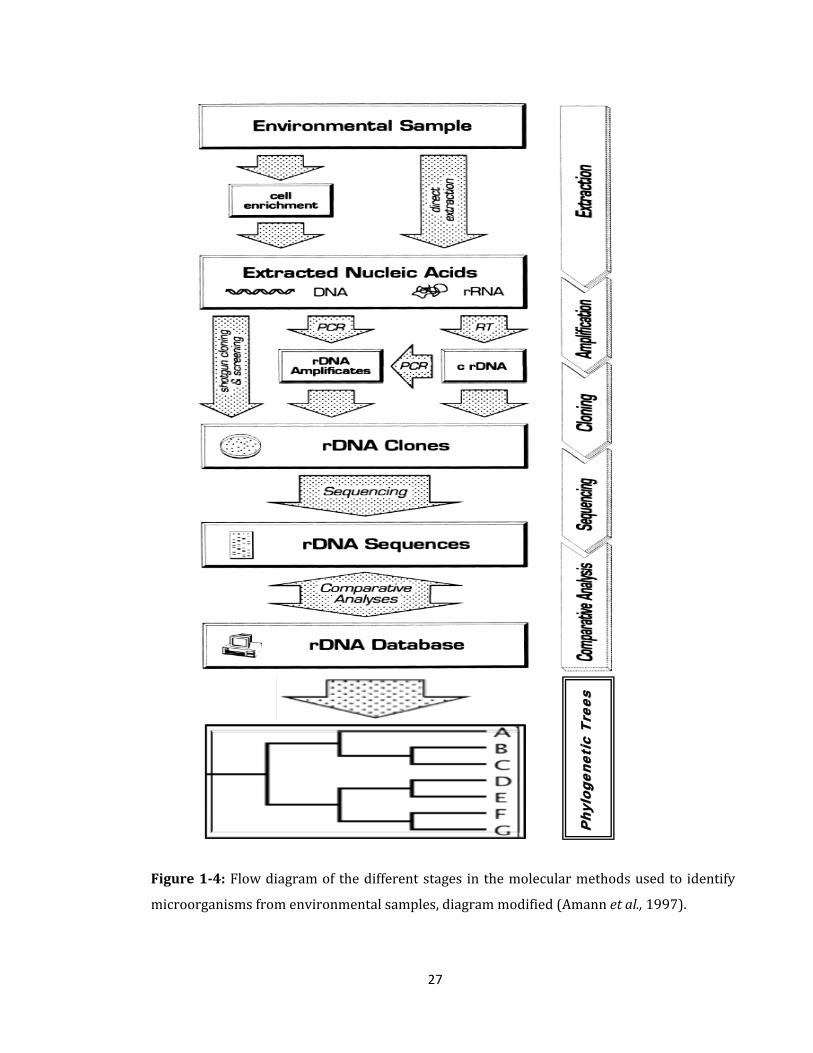
Figure 1-4: Flow diagram of the different stages in the molecular methods used to identify
microorganisms from environmental samples, diagram modified (Amann et al., 1997).
PP hh yy
ll oogg ee
nn eett ii
cc TT r
r eeee ss
28
Nucleic acid sequence information (16S rRNA gene for prokaryotes or 18S rRNA
gene for eukaryotes) is being used to identify and determine the degree of similarity
between groups of organisms and relationships of microorganisms and all other life-
forms. Therefore, the large genetic sequence database of known species can be used
to identify sequences of rDNA from unknown species isolated from environmental
samples.
In fact, there are many modern molecular applications involving the extraction and
analysis of DNA and RNA, (PCR, gene clone libraries, amplified ribosomal DNA
restriction analysis, restriction fragment length polymorphism and fluorescent in situ
hybridization) now being widely used to identify microorganisms without previous
cultivation within their natural habitats, such as in soil, drinking water, oligotrophic lakes
and marine environments (Bockelmann et al., 2000). Pernthaler and Amann (2005)
showed that 16S rRNA gene is most suitable to define microbial diversity in novel
environments. Therefore, extraction of complete or partial sequences of DNA isolated
from natural environments or directly from cells concentrated on membrane filters could
be amplified by PCR (Figure 1-5) with bacterial primers. PCR products are ligated into
vectors and then transferred into E. coli. Crump et al. (1999) used a molecular approach
(PCR-amplified 16S rRNA genes) to study particle-attached and free-living bacteria in the
Columbia River and this study showed the large number of particle-attached bacterial
clones (almost 75%) linked to members of the Proteobacteria. While, 48% of the free
living bacterial clones correlated with cosmopolitan freshwater bacteria (Beta-
Proteobacteria, Gram-positive bacteria, and Verrucomicrobium spp).
29
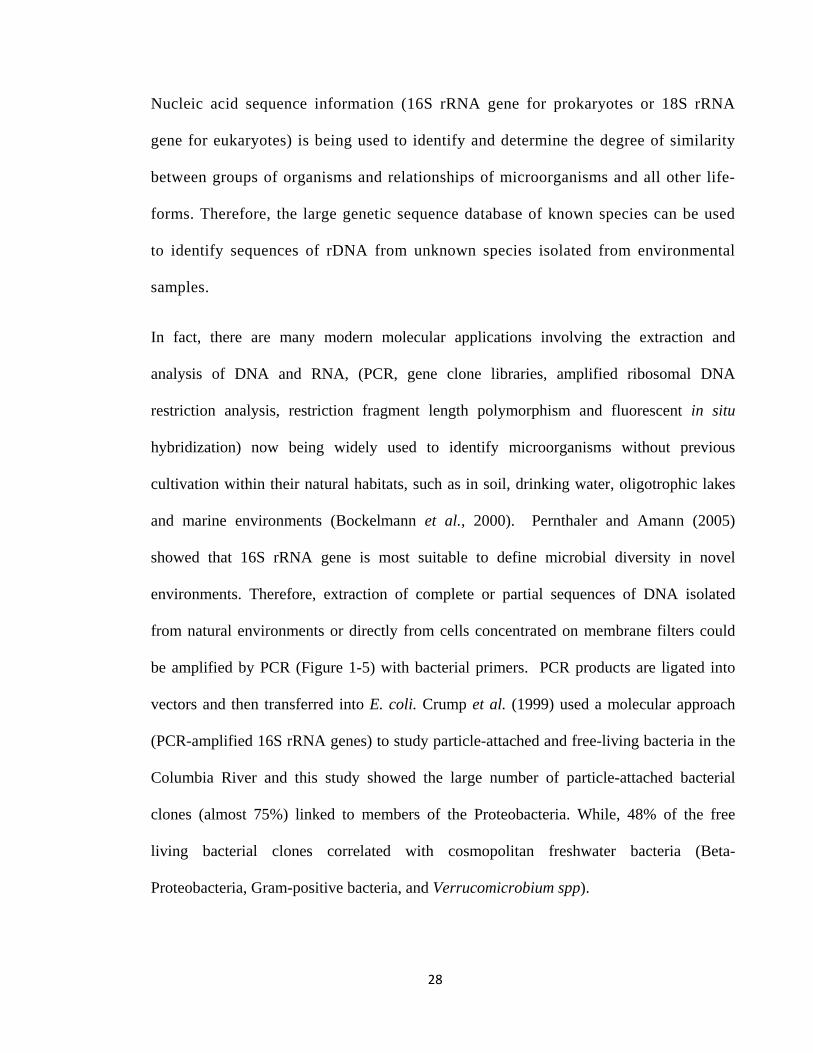
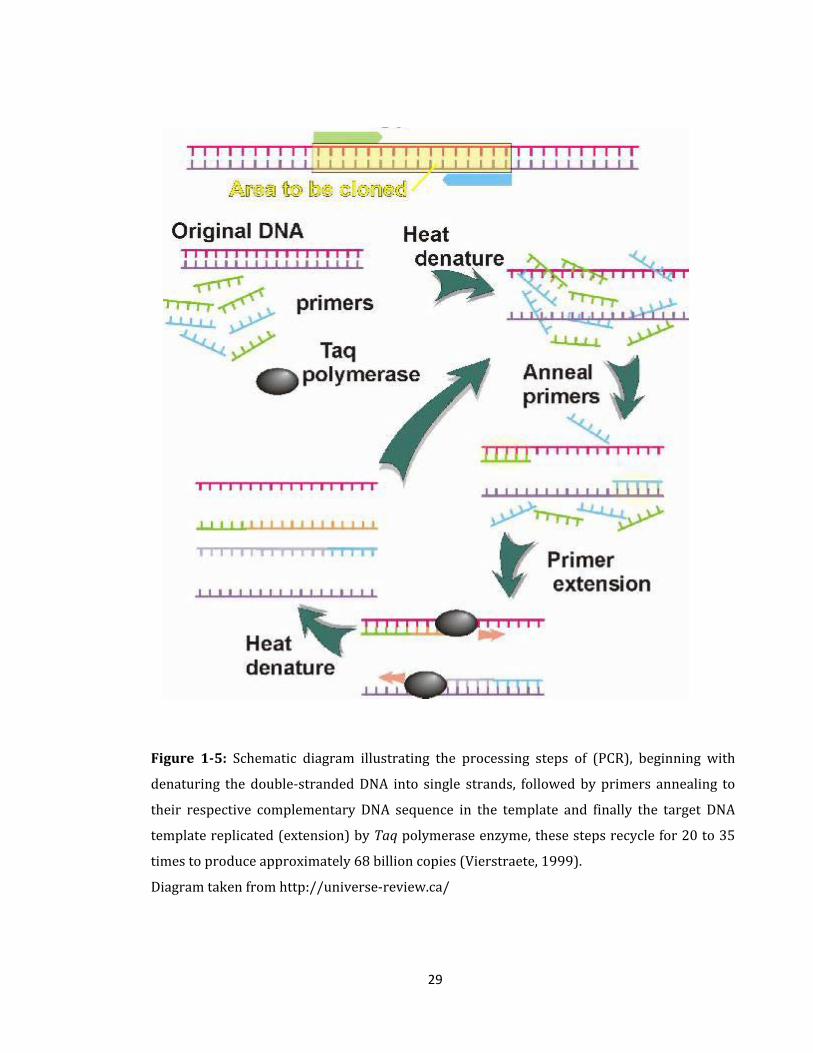
Figure 1-5: Schematic diagram illustrating the processing steps of (PCR), beginning with
denaturing the double-stranded DNA into single strands, followed by primers annealing to
their respective complementary DNA sequence in the template and finally the target DNA
template replicated (extension) by Taq polymerase enzyme, these steps recycle for 20 to 35
times to produce approximately 68 billion copies (Vierstraete, 1999).
Diagram taken from http://universe-review.ca/
30
Johnson et al. (2001) isolated acidophilic bacteria from three samples of metal-rich waters
with different pH values from a sub-arctic copper mine in Norway. The solid selective
medium was used to isolate acidophiles and 16S rRNA sequence was used to identify the
isolated microorganisms, the results indicated that Acidithiobacillus ferrooxidans was the
dominant acidophile in all three waters. Yoon et al. (2004) isolated and identified
Halobacillus as a new species by using molecular methods. Inagaki et al. (2002) used a
molecular ecological approach to detect and identify microorganisms in a deep sea extreme
environment, molecular phylogenetic analyses of RNA and PCR amplification of 16S
rDNA were used.
Drancourt and Raoult (2005) showed that the sequence of the 16S rRNA gene might not be
enough for characterization of a new bacterial species. Some essential phenotypic
characters must be applied to describe unknown bacteria, for example Gram-stain, colony
morphology, and motility, conditions for optimum growth such as temperature, spore
formation and electron microscopic examination. Biochemical tests such as oxidase and
catalase tests and the capability to metabolize major carbohydrates could also be helpful
for initial description of unknown strains.
The polymerase chain reaction (PCR) (Figure 1-5) is a powerful tool in molecular biology
to exponentially amplify specific DNA sequences (Lexa et al., 2001, Fenollar et al., 2006,
Yeung et al., 2009); a large amount of target DNA sequences can be amplified from tiny
amounts of DNA. However, the success of PCR analysis is highly dependent on the
selection of appropriate primers (Lexa et al., 2001). A useful primer must have various
properties; it must be specific to the region that needs to be replicated, it must join with
enough energy to support the experimental conditions and it must not allow the formation
31
of structures that might weaken the reaction. The number of cycles of amplification is
performed in the same vial so that enough copies of the desired sequence are reproduced
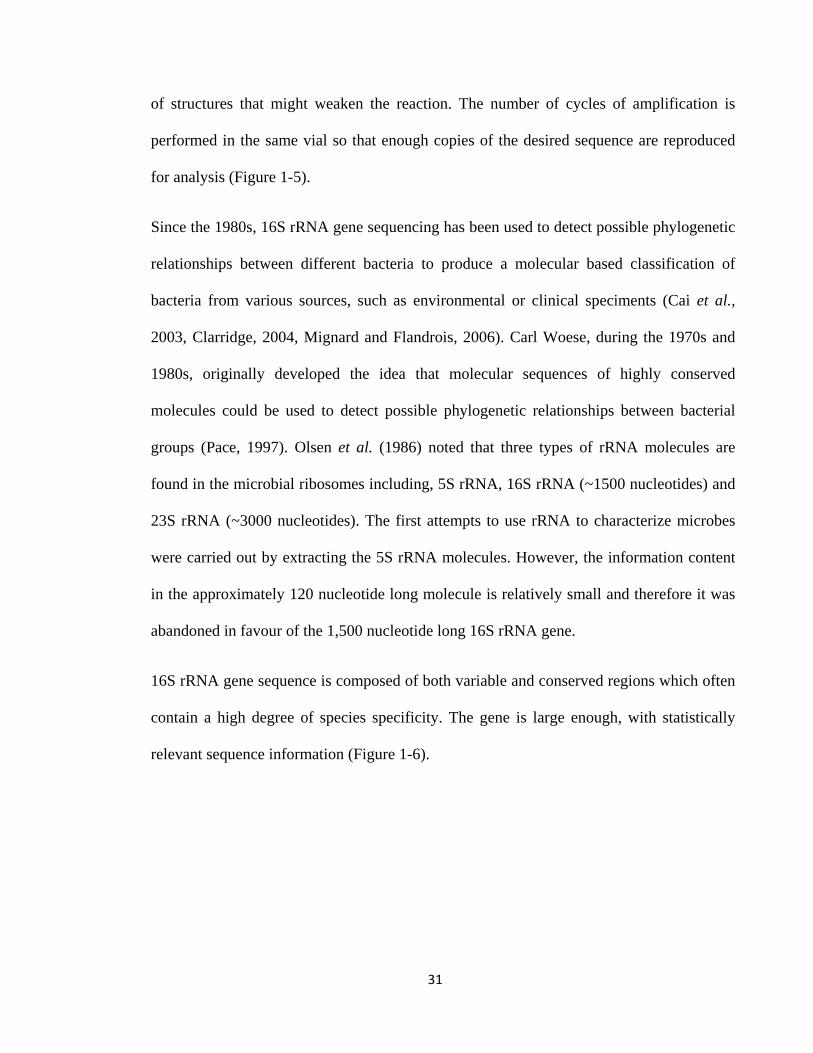
for analysis (Figure 1-5).
Since the 1980s, 16S rRNA gene sequencing has been used to detect possible phylogenetic
relationships between different bacteria to produce a molecular based classification of
bacteria from various sources, such as environmental or clinical speciments (Cai et al.,
2003, Clarridge, 2004, Mignard and Flandrois, 2006). Carl Woese, during the 1970s and
1980s, originally developed the idea that molecular sequences of highly conserved
molecules could be used to detect possible phylogenetic relationships between bacterial
groups (Pace, 1997). Olsen et al. (1986) noted that three types of rRNA molecules are
found in the microbial ribosomes including, 5S rRNA, 16S rRNA (~1500 nucleotides) and
23S rRNA (~3000 nucleotides). The first attempts to use rRNA to characterize microbes
were carried out by extracting the 5S rRNA molecules. However, the information content
in the approximately 120 nucleotide long molecule is relatively small and therefore it was
abandoned in favour of the 1,500 nucleotide long 16S rRNA gene.
16S rRNA gene sequence is composed of both variable and conserved regions which often
contain a high degree of species specificity. The gene is large enough, with statistically
relevant sequence information (Figure 1-6).
32
Figure 1-6: Color map superimposed on the 16S rRNA secondary structure model of E. coli.
Nucleotides are subdivided into five groups of increasing variability. The most variable
positions are in red, the most conserved in blue. Absolutely conserved positions are indicated
in purple. Nucleotides present in E. coli but absent in >75% of the bacterial sequences
considered are indicated in pink. Taken from, Van de Peer (1996).
33
1.7 Aims of the Project
The Rivelin Valley River and Limb Brook in Sheffield were used for industrial
activities over a long period dating back to the industrial revolution. So it was
assumed that both sites would still contain some polluted acidic environments.
Therefore, various liquid and sediment samples were collected from different places
from both valleys at different times in order to isolate extremophilic microorganisms
from these habitats. Many different media such as FeTSB, M9 minimal and ½ LB
medium were set up at pH 3 to select for acidophilic microorganisms.
The microbial strains isolated in pH 3 medium were further characterised to
categorise them as acidophilic or acid tolerant (Chapter 3). Four microbial strains
were identified using 16S rRNA and 18S rRNA sequencing (Chapter 4). The
physiological characteristics such as growth rates, respiration rates and effects of high
salinity on the growth rate of two species (Debaryomyces hansenii and Micrococcus
luteus) were determined (Chapter 5). Also the accumulation of compatible solutes by
D. hansenii and M. luteus was demonstrated using NMR spectroscopy (Chapter 5). In
addition, scanning electron microscope (SEM) and transmission electron microscope
(TEM) were used to examine the cell structure of the two species under different
acidic conditions (Chapter 5). In the final result chapter the bioenergetics of
acidophilic growth of D. hansenii were investigated using silicone oil technique
(Chapter 6).

34
CCHHAAPPTTEERR TTWWOO
35
2 MATERIALS AND METHODS
2.1 Area of Study
2.1.1 Rivelin Valley
“The River Rivelin is a river in South Yorkshire, England (Figure 2-1). It rises in the
Hallam moors, North West of Sheffield, and on the outskirts of Sheffield joins the
River Loxley (at Malin Bridge). The Rivelin Valley, through which the river flows, is
a three and a half mile long woodland valley which includes the popular Rivelin
Valley Nature Trail which was created in 1967. The valley has farmland on its gentler
upper slopes.
A relatively fast flowing river (it drops 80 metres between Rivelin Mill Bridge and
Malin Bridge), the Rivelin is fed by a constant release of water from the nearby
moorland peat. Its flow was exploited for centuries as a power source, driving the
water wheels of up to twenty industries (forges, metal-working and flour mills) along
its course” (Wikipedia web site).
2.1.2 Limb Valley
The Limb Brook is a stream in Sheffield, South Yorkshire, England. It rises at the
village of Ringinglow, flowing east through Whirlow and Ecclesall Woods into
Abbeydale in the Beauchief area, where it merges with the River Sheaf (Figure 2-1).
Near this point part of the stream has been diverted to provide the goit (leat or
millstream) for the Abbeydale Industrial Hamlet millpond, and this channel flows
through what is now Beauchief Gardens.
36
Limb Brook lies entirely within the City of Sheffield boundaries, but used to form
(with the connecting River Sheaf and Meers Brook) part of the border between
Yorkshire and Derbyshire. This boundary dates back to the Anglo-Saxon kingdoms
of Mercia and Northumbria (Addy, 1888), (Wikipedia web site).
2.2 Chemical Analysis of Water Samples
In order to identify the levels of cations and anions present, water samples from the
River Rivelin and from Limb Brook were chemically analyzed. 10 ml of each raw
water sample were sent to Chemistry Department in the University of Sheffield for
the required analysis.
2.3 Sample Collection
Water samples were collected from Rivelin River and Limb Brook and evidence of iron
deposition was found. However, the pH of the samples from the Rivelin River was only
slightly acidic at around pH 6.5, while the pH of the samples from Limb Brook was pH 5.
Various samples were collected from the River Rivelin at two different times; the
first collection was on 15th February 2009, and the second collection was on 6th April
2009. During the both collections, the samples were transferred into sterile 50 ml
Falcon tubes. Each sample was labelled at the time and a photograph taken at each
sampling location. The pH of samples was measured in situ using a portable pH
meter. Samples were stored at 4oC until required. Same procedure of sample
collecting was performed when various samples were collected from a ditch near
Limb Brook on the 7th May 2010.

37
Figure 2-1: Map locations of Sheffield main rivers taken from (Addy, 1888).
38
2.4 Growth Media
2.4.1 FeTSB Liquid Medium
Ferrooxidans medium was prepared by using three solutions, solution A (Basal salt
solution) was prepared by dissolving 2.4 g (NH4)2SO4, 0.5 g MgSO4.7H2O, 0.05g
KH2PO4, 0.05 g KCl and 0.014 g Ca(NO3)2 in 900 ml distilled water. Solution B was
prepared by dissolving 0.5 g NaCl and 0.25 g K2HPO4 in 100 ml distilled water.
Solution C was prepared by dissolving 29.13 g FeSO4.7H2O in 80 ml distilled water
and sterilized by filtration. Then, 4 ml was added from solution B to the solution A
and made up to 920 ml with distilled water and autoclaved.
To prepare 50 ml culture, 46 ml was added from solution A+B to 4 ml solution C
(Johnson et al., 1987).
2.4.2 FeTSB Solid Medium
Ferrooxidans solid medium was prepared by using four solutions, solution A (Basal
salt solution) was prepared by dissolving 1.26 g (NH4)2SO4, 0.49 g MgSO4.7H2O in
600 ml distilled water. Solution B (tryptone soya broth (TSB)) was prepared by
dissolving 1.7 g bactotryptone, 0.5 g NaCl and 0.25 g K2HPO4 in 100 ml distilled
water. Solution C (Ferrous sulphate solution) was prepared by dissolving 18.21 g
FeSO4.7H2O in 50 ml distilled water, solution D (gelling solution) was prepared by
dissolving 7 g agarose in 250 ml.
Next, 10 ml of solution B was added to the solution A, and made up to 700 ml using
distilled water, then the 50 ml of solution C and the 250 ml of gelling solution were
added to the previous solution to prepare one litre of FeTSB solid medium. Each
39
solution has been autoclaved separately except solution C which was sterilized by the
filtration method. All solutions were allowed to cool to approximately 50oC,
combined aseptically and gently inverted to mix before being poured into sterile
plastic Petri dishes and left to set (Johnson et al., 1987).
2.4.3 M9 Medium
M9 minimal medium was prepared by dissolving 11.3 g M9 minimal salts (Sigma M-
6030) in 980 ml distilled water and adjusting the pH as necessary with 1 M H2SO4 or
1 M NaOH, and the following four solutions were autoclaved separately and added as
follows; 1 ml MgSO4 (1 M), 9 ml NH4Cl (5 g in 45 ml distilled water), 9 ml glucose
(15 g in 45 ml distilled water) and 1 ml CaCl2 (100 mM). Solid M9 minimal medium
was prepared by adding 15 g agar No 1 directly to the pH 7 medium, while pH 3
plates were made by preparing a separate gelling solution of 15 g agar No 1 (final
concentration 1.5% w/v).
2.4.4 ½ LB Medium
Half Luria Bertani (1/2 LB) plates were prepared by adding 2.5 g yeast extract, 5 g
tryptone and 2.5 g NaCl to 490 ml of distilled water, adjusting the required pH using
1 M H2SO4 or 1 M NaOH and autoclaving. A separate solidifying solution was
prepared by adding 10 g of agar No.1 to 500 ml of distilled water, and then continues
as described in section (2.4.2). The liquid medium consisted of 2.5 g yeast extract, 5
g tryptone and 2.5 g NaCl per litre.
2.4.5 LB Medium
Luria Bertani (LB) medium consisted of 5 g yeast extract, 10 g tryptone, 10 g NaCl in
1000 ml of distilled water to produce liquid medium and was adjusted for the required
40
pH using 1 M H2SO4 or 1 M NaOH. For solid medium 15 g of bacteriological agar
No.1 were added per litre.
2.4.6 YPD Medium:
YPD medium was prepared by dissolving 20 g peptone, 10 g yeast extract and 20 g
glucose in 990 ml distilled water and was adjusted to the required pH with 1 M
H2SO4 or 1 M NaOH. 10 g agar No. 1 was added if solid YPD medium was required.
2.5 Isolation of Acidophilic or Acid tolerant Microorganisms
Isolation of acidophilic or acid tolerant microorganisms was carried out using FeTSB,
M9 and ½ LB medium. 1 ml of each river water sample was inoculated into 50 ml of
FeTSB, M9 and ½ LB. All flasks were incubated overnight at 25ºC with shaking (250
rpm).
In parallel, approximately 200 µl of raw environmental sample was spread plated
onto FeTSB, ½ LB and M9 minimal media. Each plate was labelled and incubated at
25oC. Growth of liquid and solid cultures was monitored daily for 3 days and any
growth obtained in liquid culture or any colonies appearing on plates were streaked
onto fresh plates in order to isolate pure cultures. After the third generation of plate
growth, a single colony from each isolate was inoculated into approximately 10 ml of
the appropriate liquid medium and sub-cultured into 250 ml flasks, containing 50 ml
of medium, and shaken at 250 rpm.
2.6 Purity of Acidophilic Strains
The purity of strains was monitored by streaking a loopful of the culture on agar
plates of pH 3 M9 and ½ LB medium. After incubation, the plates were first
41
examined for colony morphology and then single colonies were picked off and
observed as a wet mount using a phase contrast microscope.
2.7 Maintenance of Acidophilic Strains
All isolated strains were maintained by adding 2 ml of overnight culture (active
inoculum) to 2 ml of sterile glycerol (50% v/v) and kept in a freezer at – 20ºC. When
required, the frozen cells were thawed at room temperature and inoculated into 250
ml conical flasks plugged with cotton wool containing 50 ml of M9 medium of the
same pH, and incubated overnight at 25ºC on a rotary shaker at 250 rpm. In addition,
once every two months each strain of acidophilic bacteria was maintained by
streaking three pH 3 M9 or ½ LB medium plates.
The plates were incubated for 24 – 48 h at 25ºC. When pure colonies had developed
on the plates, a piece of parafilm was stretched around each plate’s edge and then one
set of plates was stored at room temperature and the other put in the fridge until
required. Sub-culturing of the strains was also performed routinely once every two
weeks to minimize contamination over time by adding 1 ml of overnight culture into
250 ml conical flasks containing 50 ml of M9 or ½ LB medium of the same pH. The
flasks were incubated at 25ºC on a rotary shaker at 250 rpm and then kept at room
temperature until required.
2.8 Identification of Acidophilic Strains
2.8.1 Colony Morphology
The differences between colony shapes when growing on FeTSB, M9 or ½ LB media
were noted.
42
2.8.2 Cell Morphology
A simple stain (Safranin) was used to determine the shape of yeast cells, while the
Gram stain was carried out on bacterial overnight cultures as follows (Kirkpatrick et
al., 1993). A droplet of water was placed onto a slide, and an inoculating loop was
used to transfer some cells into the water droplet. The slide was allowed to dry and
then was heat-fixed by passing through a Bunsen flame. The cells were then washed
in an excess of crystal violet solution and then treated with iodine solution as a
mordant for approximately one minute. Ethanol was then added to decolourise the
stain (for about 30 seconds). The cells were then counterstained with safranin
solution for 1 minute and the excess stain was removed. The slides were examined
under a light microscope at 1000 times magnification (oil immersion). Gram positive
cells appear purple, whereas Gram negative cells will be pink.
2.8.3 Motility of Bacteria
The motility of the bacteria was examined by using a hanging drop preparation and
then viewing the slide under the light microscope (Allen and Baumann, 1971).
2.9 Effect of Medium pH on Growth of Isolated Strains and Growth
Curve Determination
The effect of different pH values on the growth of isolated strains was determined
using overnight cultures in parallel half enrichment medium (½ LB) and minimal
medium (M9). 1 ml of active inoculum from each strain was inoculated into ½ LB
and M9 medium pH 7, pH 5 and pH 3 and the optical density (OD) at 600 nm was
measured using the Unicam Helisα spectrophotometer against a distilled water blank
43
in 1 ml plastic cuvettes. To produce a growth curve, 4 x 250 ml conical flasks
containing 50 ml of each pH value ½ LB and M9 medium were inoculated with 1 ml
of the same pH adapted cells from an overnight culture. The OD660 was measured
against a water blank immediately after inoculation then every two hours over an
incubation period at 25ºC on a rotary shaker at 250 rpm. The growth curves were
plotted against time of incubation.
2.10 Measurement of External pH of Overnight Cultures of Strains in
Different Media
In order to investigate the behaviour of isolated strains with different pH values, the
pH of overnight cultures was measured using a Mettler Toledo MP225 pH meter.
To test the external pH, four 250 ml flaks containing 50 ml of either M9 or ½ LB or
LB or YPD media at pH 7, pH 5 and pH 3 were inoculated with 1 ml of active
inoculum from each strain and then incubated overnight at 25ºC on a rotary shaker at
250 rpm. The overnight cultures were centrifuged for 10 min at 3000 g, then 10 ml of
supernatant was taken and the pH was measured.
2.11 Measurement of Respiration Rate (Oxygen Uptake) of Isolated
Strains
Respiration rate was measured using a modified Clarke oxygen electrode (Hansatech
Scientific Instruments, Kings Lynn, UK) with a Servoscribe 1S potentiometric chart
recorder as described by Delieu and Walker (1972). Schematic drawings of the
oxygen electrode unit are shown in Figures 2.2 and 2.3. The electrode consists of
platinum wire sealed in plastic as the cathode and an anode of circular silver wire
44
bathed in a saturated potassium chloride (KCl) solution which forms a bridge between
the electrodes. The electrodes were separated from the reaction mixture (chamber) by
an oxygen- permeable Teflon membrane. The reaction mixture in the Perspex
container was stirred constantly with a small magnetic stirring rod.
When a voltage was applied across the two electrodes using the polarising meter the
platinum electrode became negative with respect to the reference electrode and the
oxygen in the solution is thought to undergo electrolytic reduction at the cathode.
4H+ + O2 + 4e- 2H2O
The flow of current in the circuit when the polarising volts were set between 0.5 and
0.8 V varied in linear relationship to the partial pressure of oxygen in solution. The
current flowing was measured by connecting the electrode to a sensitive
potentiometric chart recorder. The reaction chamber of the oxygen electrode was
maintained at a constant temperature similar to the culture temperature (25°C), by
circulating water from a temperature controlled water bath (Figure 2-2 and Figure 2-
3).
A 12 V, 100 W tungsten halogen lamp was used to illuminate the chamber when
required, approximate output intensity 1800 μmol m -2 s -1.
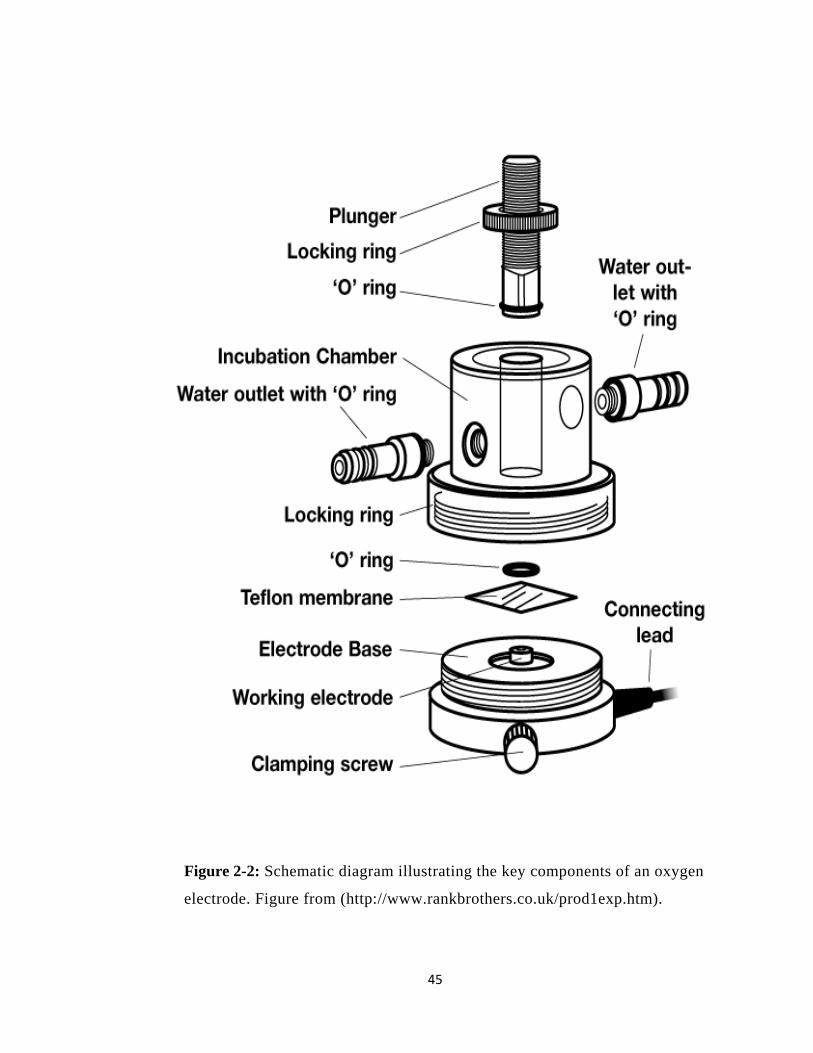
45
Figure 2-2: Schematic diagram illustrating the key components of an oxygen
electrode. Figure from (http://www.rankbrothers.co.uk/prod1exp.htm).
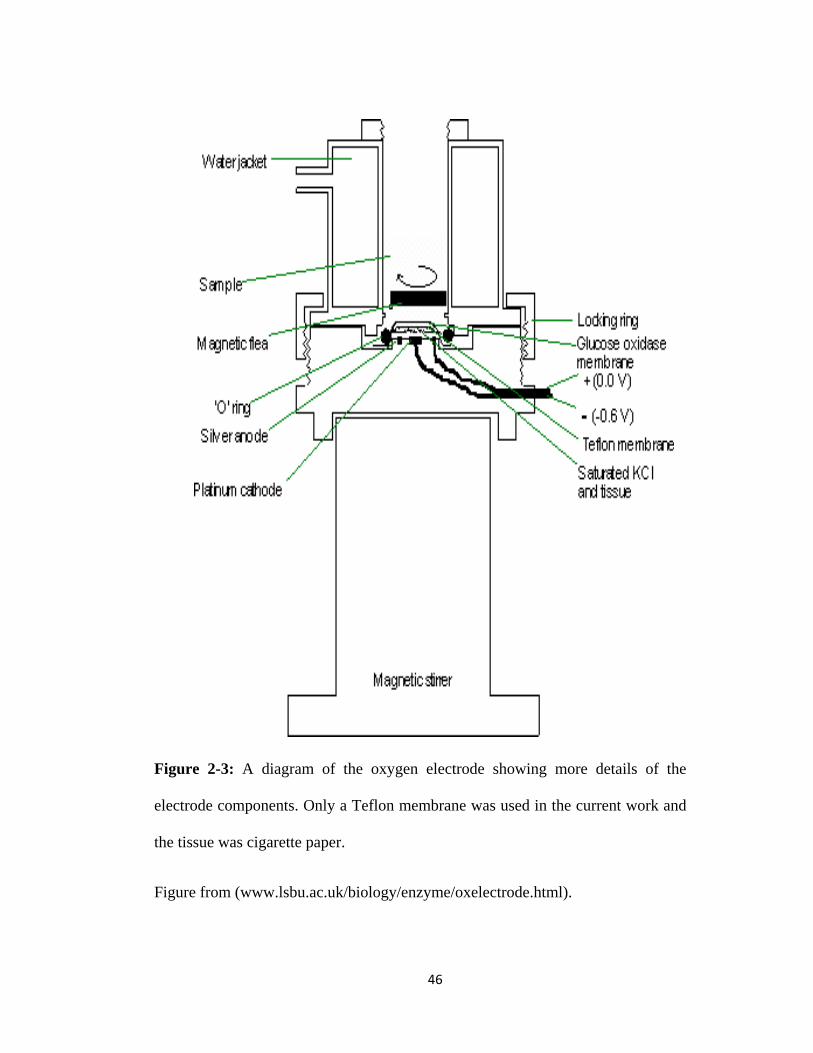
46
Figure 2-3: A diagram of the oxygen electrode showing more details of the
electrode components. Only a Teflon membrane was used in the current work and
the tissue was cigarette paper.
Figure from (www.lsbu.ac.uk/biology/enzyme/oxelectrode.html).
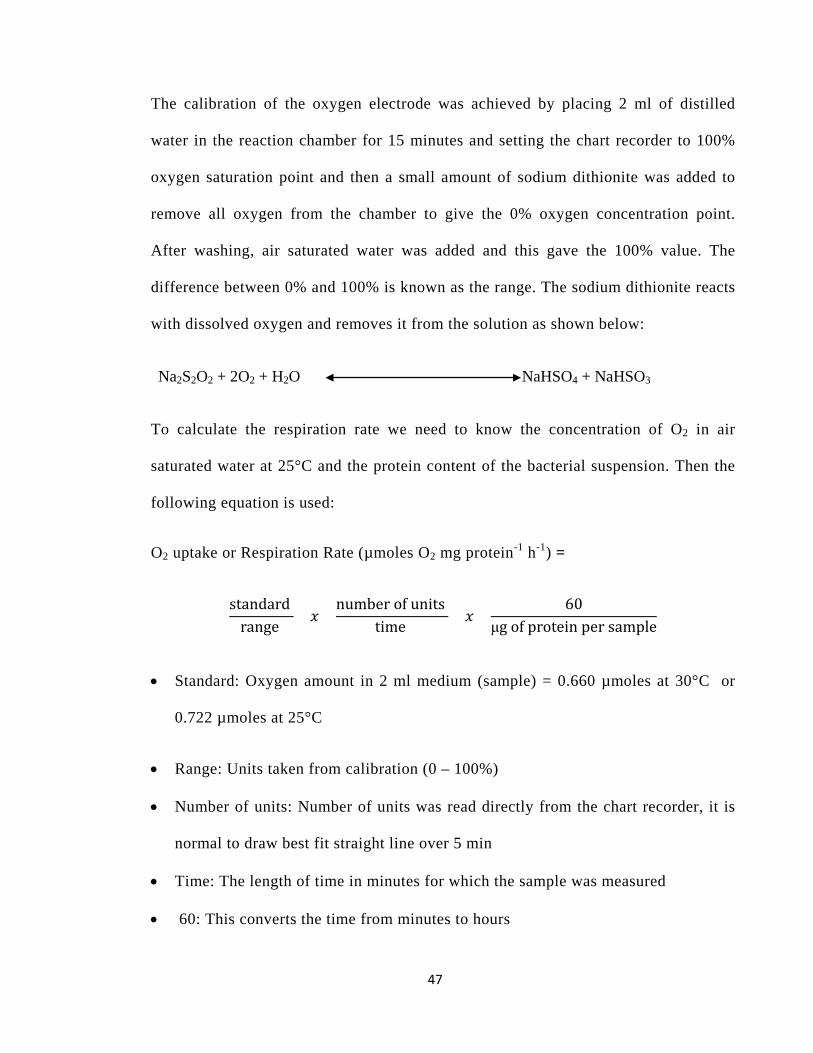
47
The calibration of the oxygen electrode was achieved by placing 2 ml of distilled
water in the reaction chamber for 15 minutes and setting the chart recorder to 100%
oxygen saturation point and then a small amount of sodium dithionite was added to
remove all oxygen from the chamber to give the 0% oxygen concentration point.
After washing, air saturated water was added and this gave the 100% value. The
difference between 0% and 100% is known as the range. The sodium dithionite reacts
with dissolved oxygen and removes it from the solution as shown below:
Na2S2O2 + 2O2 + H2O NaHSO4 + NaHSO3
To calculate the respiration rate we need to know the concentration of O2 in air
saturated water at 25°C and the protein content of the bacterial suspension. Then the
following equation is used:
O2 uptake or Respiration Rate (µmoles O2 mg protein-1 h-1) =
standard range
𝑥 number of units
time 𝑥
60μg of protein per sample
• Standard: Oxygen amount in 2 ml medium (sample) = 0.660 µmoles at 30°C or
0.722 µmoles at 25°C
• Range: Units taken from calibration (0 – 100%)
• Number of units: Number of units was read directly from the chart recorder, it is
normal to draw best fit straight line over 5 min
• Time: The length of time in minutes for which the sample was measured
• 60: This converts the time from minutes to hours
48
• Protein present in sample (μg): this relates to amount of protein in a sample of 2
ml of cells from Bradford assay (see section 2.12).
To prepare cells for measurements in the oxygen electrode, the OD600 of all cultures
was measured and 5 to 10 ml of cells from each sample (grown overnight at pH 7, pH
5, and pH 3 in ½ LB or LB or YPD medium) were transferred to a 50 ml Falcon tube
and harvested by centrifugation at 3000 g for 10 minutes. Each pellet was then
resuspended in a fresh 10 ml of same medium as they were grown and same pH. The
cells were also normally concentrated twofold and the protein content was determined
(section 2.12). The viability of the cultures grown overnight was measured by adding
0.5 ml of concentrated cells to 1.5 ml of fresh medium of the same pH in the chamber
of oxygen electrode (keeping the overall volume at 2 ml to allow standardisation of
the results) and the plunger placed on top and was left for 5 minutes without
illumination to induce oxygen uptake. The plunger was removed and the sample
unloaded using a Pasteur pipette. Distilled water was used to clean both the chamber
and the plunger. When the effect of increasing external salinity on the respiration rate
was studied the same procedure was employed except that the washing step was
carried out with sodium free desired medium. Then the cells were resuspended in
different concentrations of sodium chloride for the measurements in the oxygen
electrode.
2.12 Determination of Protein Content
2.12.1 Determination of Standard Curve
A standard curve was produced using bovine serum albumin (BSA) in the range of 0
- 100 µg by dissolving 250 mg of BSA in 50 ml of distilled water. The final
49
concentration of protein in the stock solution was 5 mg ml-1 (5 μg µl-1). The stock
solution was used to make a range of protein concentrations by a series of dilutions
as shown in Table 2-1.
Three replicates were made for each test tube above. To each test tube, 3 ml of
Bradford Reagent (Sigma) were added then thoroughly mixed and left on the bench
for 5 min. Optical density was measured for each sample at 595 nm using a 3 ml glass
cuvette. The blank was used to zero the Unicam Helisα spectrophotometer. The
protein standard curve (Appendix A) was plotted from which protein concentration
for each sample can be determined. Standard deviation for each sample was
calculated and shown on the curve.
2.12.2 Determination of Sample Protein
Soluble protein in bacterial cells was measured using the method described by
Bradford (1976). Bovine serum albumin (BSA) was used as the standard as described
in section 2.12.1.
Samples were prepared for protein determination as follows:
• 0.1 ml from the same concentrated cells which were prepared for respiration rate
measurements (see section 2.11) was placed into a clean test tube and then 0.9 ml
of 1M NaOH was added. The sample was then thoroughly mixed and heated at
90°C for 10 minutes.
• The test tube was cooled on ice for 5 minutes and dried outside and then
centrifuged for 10 minutes in bench centrifuge at full speed (3000 g).
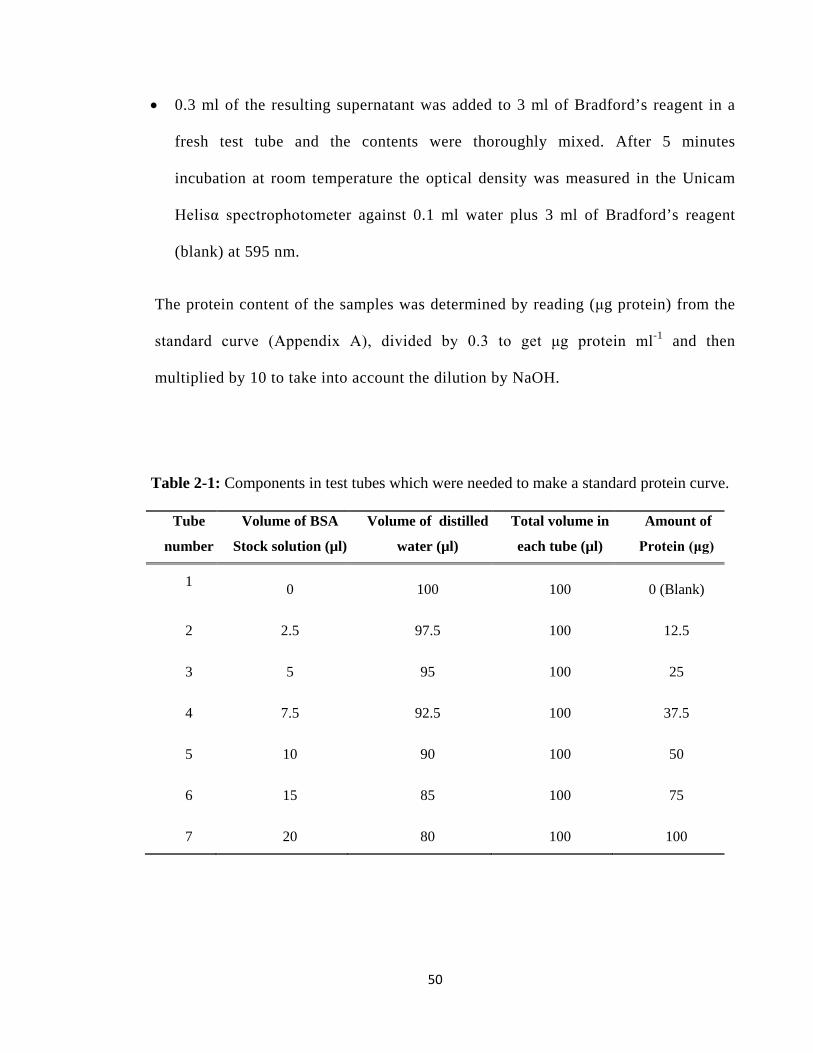
50
• 0.3 ml of the resulting supernatant was added to 3 ml of Bradford’s reagent in a
fresh test tube and the contents were thoroughly mixed. After 5 minutes
incubation at room temperature the optical density was measured in the Unicam
Helisα spectrophotometer against 0.1 ml water plus 3 ml of Bradford’s reagent
(blank) at 595 nm.
The protein content of the samples was determined by reading (μg protein) from the
standard curve (Appendix A), divided by 0.3 to get μg protein ml-1 and then
multiplied by 10 to take into account the dilution by NaOH.
Table 2-1: Components in test tubes which were needed to make a standard protein curve.
Tube
number
Volume of BSA
Stock solution (µl)
Volume of distilled
water (µl)
Total volume in
each tube (µl)
Amount of
Protein (μg)
1 0 100 100 0 (Blank)
2 2.5 97.5 100 12.5
3 5 95 100 25
4 7.5 92.5 100 37.5
5 10 90 100 50
6 15 85 100 75
7 20 80 100 100
51
2.13 Effect of High Sodium Concentration on the Growth of the Cells of
RV4 and LV1 Strains
To prepare sodium free M9 minimal medium, the pH of medium was adjusted to pH
7, pH 5 and pH 3 as necessary using either 1 M HCl or 1 M KOH (instead of NaOH)
and 200 mM potassium carbonate buffer was used instead of sodium carbonate with
different concentrations of sodium chloride (0, 0.175, 0.4, 1 and 1.5 M) being added.
The same procedure was used to prepare YPD and LB medium except that a tiny sodium
chloride in yeast extract (approximately 0.05 mM NaCl) cannot be removed. Then media
containing different sodium chloride concentrations were prepared (0.4, 1, 1.5, 2, 2.5 M).
An overnight culture (50 ml) grown in M9, YPD or LB medium to mid-exponential
phase at pH 10 was transferred into a 50 ml Falcon tube and then harvested by
centrifugation in a bench top centrifuge (3000 g) for 15 minutes. The pellet was
resuspended (washed) three times in 50 ml of sodium free medium of the same pH
and then 1 ml of cells was added into a number of 250 ml conical flasks containing
50 ml of desired medium with different concentrations of sodium chloride (0 – 2.5
M). The optical density (OD) at 600 nm was measured in the Unicam Helisα
spectrophotometer against sterilized medium blank, immediately after inoculation,
and then all flasks were incubated at 25ºC on a rotary shaker at 250 rpm, the OD at
600 nm was measured every hour or every 3 hours or daily depending on the speed
of growth and used as growth parameter.
52
2.14 Effect of High Sodium Concentration on the Respiration Rate of
the Cells of RV4 and LV1 Strains
The effect of increasing external salinity in the media on the oxygen consumption of
both RV4 and LV1 strains was determined using YPD and LB medium, respectively
and a modified Clarke type oxygen electrode as described in section 2.11. The pH
adjustment and media preparation were done as explained in section 2.13.
To prepare cells for measurements in the oxygen electrode, 40 ml of overnight culture
grown to mid-exponential phase at pH 7, pH 5 and pH 3 in YPD medium for RV4 strain
and LB medium for LV strain were transferred into a 50 ml Falcon tube and harvested by
centrifugation in a bench top centrifuge at 3000 g for 15 minutes and the pellet was
resuspended (washed) three times in 20 ml of sodium free YPD or LB medium. The
respiration rate of the cells was measured in the oxygen electrode by adding 0.1 ml of
concentrated cells to 1.9 ml of fresh YPD or LB medium with different NaCl
concentrations and 1.9 ml of normal YPD and LB were also used as controls (keeping the
overall volume at 2 ml to allow standardization of the results). A Bradford assay (see
section 2.12) was performed on the concentrated cell suspensions to determine the protein
concentration for use in calculating the respiration rate of the cells.
2.15 Effect of Iron, Sulphur and Aluminium on the Growth of RV4 and
LV1 Cells
To prepare media containing iron, sulphur and aluminium, M9 minimal medium has
been used with both RV4 and LV1 strains. First of all, normal M9 minimal medium
has been prepared as usual and pH adjusted using H2SO4 and NaOH. Then the desired
53
concentrations of iron, sulphur and aluminium dissolved with distilled water were
prepared and autoclaved separately (the concentrations were adjusted to be the same
concentrations in the rivers (see Chapter 3, section 3.2.2), left to cool down, and then
mixed together with M9 medium.
To study the effects of iron, sulphur and aluminium, on the growth rates of strains
RV4 and LV1, 4 x 250 ml conical flasks containing 50 ml of each amended medium
against a control (M9 medium without addition of iron, sulphur or aluminium) were
inoculated with 1 to 3 ml of pre-adapted cells from an overnight culture. The OD660
was measured against a medium blank immediately after inoculation, then every three
hours over an incubation period at 25ºC on a rotary shaker at 250 rpm. The growth
was plotted against time of incubation.
2.16 Anaerobic Growth of Bacteria Anaerobic growth of bacteria was carried out using fresh overnight cultures in
normal LB medium. Triplicate LB medium plates were inoculated with a single
colony from each strain and then placed in an anaerobic jar and incubated overnight
at 25ºC. The growth was monitored to check if anaerobic growth was possible.
2.17 Physiological Characteristics of Yeast Species 2.17.1 Cycloheximide Resistance
50 μl of Cycloheximide stock solution (100 mg ml-1 in DMSO) was added to 50 ml
M9 medium and inoculated with 1 ml of Yeast strain cells, left overnight in 25oC
incubator with shaking, and then the optical density (OD) at 600 nm was measured using
the Unicam Helisα spectrophotometer against sterilized medium as a blank in 1 ml plastic
cuvettes.
54
2.17.2 Assimilation of Glucose
Normal M9 medium was used to check the ability of Yeast strain to use glucose as a
carbon source. The growth was checked as described in section 2.17.1.
2.17.3 Assimilation of α-Methyl glucoside
M9 (α-Methyl glucoside) medium did not contain any carbon source except α-Methyl
glucoside. To prepare 1 litre of M9 (α-Methyl glucoside) medium, 33.9 g disodium
phosphate, 15 g monopotassium phosphate, 2.5 g sodium chloride and 20 ml (20mM) α-
Methyl glucoside, were dissolved and then then made up to 1 litre using distilled water.
Growth was detected as described in section 2.17.1.
2.17.4 Assimilation of Nitrate
A modified M9 (nitrate) medium was prepared with nitrate as the sole source of nitrogen.
To prepare 1 litre of M9 (nitrate) medium, 33.9 g disodium phosphate, 15 g
monopotassium phosphate, 2.5 g sodium chloride, 5 g nitrate and 20 ml 1 M glucose, were
dissolved and then made up to 1 litre by adding distilled water. Growth was measured as
described in section 2.17.1.
2.17.5 Assimilation of Cadaverine
M9 (cadaverine) medium was prepared as described for M9 (nitrate) medium in section
2.17.4 but 117 ml of 1 M cadaverine was added instead of nitrate, and then the growth was
measured as described in section 2.17.1.
55
2.18 NMR Analysis of Compatible Solutes
2.18.1 Preparation of Samples for NMR Analysis
Samples (5ml) of RV4 and LV1 strains were put into 15 ml tubes, centrifuged at 3000
g for 10 minutes and the supernatant was discarded. The pellets were kept in -80°C
freezer until the analysis was due.
The pellets were thawed, resuspended in 1 ml of distilled water and vortexed for 1
minute at room temperature. Then the samples were sonicated (2 x 20 seconds) and
centrifuged at full speed in the microfuge for 10 minutes. The supernatants were
transferred into two 1.5 ml Eppendorf tubes, transferred to -80°C freezer for 2 hours
and then freeze dried for two days. Freeze dried samples were prepared for Nuclear
Magnetic Resonance (NMR) analysis by dissolving them in 500 µl of D2O in an
Eppendorf tube and then 5 µl of trimethyl syle propionate (TSP) were added. Next,
the dissolved sample was transferred into an NMR tube and run in the NMR (Frings
et al., 1993).
2.18.2 Effect of Adaptation to Different Salinity, pH and Growth Media on
Compatible Solutes Accumulated by RV4 and LV1 Strains
RV4 and LV1 strains were adapted to different concentrations of NaCl (0.4 and 1 M)
in M9 minimal medium and (0.4, 1, 1.5, 2 and 2.5 M) in YPD medium for RV4 and
LB medium for LV1 strain, with 3 different pH values (pH 7, pH 5 and pH 3). After
incubation for 24 – 48 hours at 250C with shaking, 5 ml of each sample were
centrifuged for 10 minutes, the supernatant was poured off and the pellet was kept in
freezer until used. NMR analysis was carried out as described in section 2.18.1.
56
2.19 Electron Microscopy
Electron microscopy was carried out using a scanning electron microscope (SEM)
and a transmission electron microscope (TEM). Both types were used to examine RV4
and LV1 cells under normal conditions (pH 7) and extreme condition (pH 3). The
analysis was performed in the Biomedical Science Department.
2.19.1 Scanning Electron Microscope (SEM)
To produce very high-resolution images of a sample surface, SEM was used. First
step was to prepare the sample for examination by pelleting 1.5 ml of overnight
culture for 10 minutes at 3000 g and discarding the supernatant. The cells were fixed
in 3% glutaraldehyde in 0.1 M phosphate buffer for 4 hours at 40C, then the cells
were washed in 0.1 M phosphate buffer, twice with 15 intervals at 40C.
Secondary fixation was carried out in 2% aqueous osmium tetroxide for 1 hour at
room temperature. The wash step was repeated and dehydration was achieved through
a graded series of ethanol solutions as follows:
75% ethanol for 15 minutes
95% ethanol for 15 minutes
100% ethanol for 15 minutes
100% ethanol for 15 minutes
100% ethanol dried over anhydrous copper sulphate for 15 minutes.
All the above steps were carried out at room temperature.
The cells were then air dried from hexamethyldisilazane. Initially they were placed in
a 50/50 mixture of 100% ethanol and hexamethyldisiazane for 30 minutes followed
57
by 30 minutes in 100% hexamethyldisilazane. The cells were then allowed to air dry
overnight before mounting.
Upon completion of drying, the cells were mounted on 12.5 mm diameter stubs,
attached with Sticky Tabs and then coated in an Edwards S150B sputter coater with
approximately 25 nm of gold.
The cells were examined in a Philips XL-20 Scanning Electron Microscope at an
accelerating voltage of 20 Kv.
2.19.2 Transmission Electron Microscope (TEM)
TEM has been used to obtain thin, minimally deformed cells that allow for the
observation of the internal structures of cells. After preparing cells as described in
section 2.19.1 in an Eppendorf tube, fresh 3% glutaradehyde in 0.1 M phosphate
buffer was added to the pellet (re-suspended to ensure optimal fixation) and left
overnight at 40°C. The cells were then washed in 0.1 M phosphate buffer, twice with
30 min intervals at 40°C.
Secondary fixation was carried out in 2% aqueous osmium tetroxide for 2 hours at
room temperature, washed in buffer as above. Followed by dehydration through a
graded series of ethanol solutions at room temperature as described in section 2.19.1,
except the last dehydration step was repeated twice.
The cells were then placed in an intermediate solvent, propylene oxide, for two
changes of 15 minutes duration. Infiltration was accomplished by placing the cells in
a 50/50 mixture of propylene oxide/Araldite resin. The cells were left in this 50/50
mixture overnight at room temperature.
58
The cells were left in full strength Araldite resin for 6-8 hours at room temperature
(resin was changed after 3-4 hours) after which they were embedded in fresh Araldite
resin for 48-72 hours at 60°C.
Araldite resin contained:
CY212 resin 10 ml
DDSA hardener 10 ml
BDMA accelerator 1 drop per 1 ml of resin mixture
Semi-thin sections approximately 0.5 μm thick were cut on a Leica ultramicrotome
and stained with 1% Toluidine blue in 1% Borax.
Ultrathin sections, approximately 70-90 nm thick, were cut on a Leica ultramicrotome
and stained for 25 minutes with saturated aqueous uranyl acetate followed by staining
with Reynold’s lead citrate for 5 minutes. The sections were examined using a FEI
Tecnai TEM at an accelerating voltage of 80 Kv. Electron micrographs were taken
using a Gatan digital camera.
2.20 Silicone Oil Technique
Centrifugation through silicone oil was used to completely separate cells from
medium (Gimmler et al., 1978). A range of oils with different densities were
produced by mixing individual silicone oils with different densities (Dow Corning
200/1 grade oil was mixed with Dow Corning 550 grade oil). Cell suspensions of the
density to be used in experiments (with no isotopes added) were used to find the oil
which is dense enough to restrict mixing with the medium, but which allows the cells
to pass through the oil during centrifugation and produce a pellet (Figure 2-4).
59
2.20.1 Determination of Intracellular Volume (ICV) of RV4
Estimation of cell volume was carried out using the silicone oil technique based on
the method described by Rottenberg (1979).
Two 1 ml samples of concentrated cells (10 ml of cells from an overnight culture
grown in M9 minimal medium at pH 7 or pH 3 were transferred to a 50 ml Falcon
tube and harvested by centrifugation at 3000 g for 10 minutes. The yeast cell pellet
was resuspended in 8 ml of fresh medium of the same pH and placed in 1.5 ml
Eppendorf tubes. 10 µl of 3H2O (1850 kBq ml-1) were added to one sample of
concentrated cells to give 18.5 kBq ml-1 and 20 µl of 14C-dextran (MW = 70000, 1850
kBq ml-1) were added to second sample of concentrated cells to give 14.8 kBq ml-1.
Both samples were vortexed thoroughly.
After 5 minutes incubation at room temperature the 1.5 ml Eppendorf tubes were
vortexed again, triplicate samples (300 µl) were taken from each 1.5 ml Eppendorf
tube and layered onto 300 µl of the silicone oil mixture (right density) in fresh 1.5 ml
Eppendorf tubes. The samples were then centrifuged for 1 minute at 13000 rpm
(11340 g) in a bench top micro centrifuge (MSE, Micro-Centaur). From the aqueous
supernatant fraction, triplicate samples (50 µl) were taken and placed into separate
scintillation vials containing 5 ml of FluoranSafe scintillation fluid (VWR) and
labelled appropriately.
The tips of the 1.5 ml Eppendorf tubes, which contain the pellet of yeast, were
carefully cut off using a razor blade within the oil layer and placed cut end down into
1.5 ml Eppendorf tubes containing 300 µl distilled water. They were then centrifuged
60
for approximately 15 seconds at 13000 rpm (11340 g) to remove the pellet from the
tips which were then discarded.
Each pellet was resuspended in the water and then the whole sample was pipetted out
and placed into separate scintillation vials containing 5 ml of FluoranSafe
scintillation fluid (labelled appropriately) and then dispersed using a vortex agitator.
All the vials were placed in racks and counted for 5 minutes per vial in a Beckman LS
1801 Liquid Scintillation Counter.
The 3H2O was evenly distributed throughout the pellet, whereas the 14C-dextran was
only found in the spaces between the cells and the pellet due to its high molecular
weight (Figure 2-4). The pellet volume (PV) and the extracellular volume (ECV)
were calculated from the ratio of 3H2O and 14C-dextran in the pellet and supernatant
fractions respectively using the following equations given in Hard and Gilmour
(1996).
Pellet volume (PV) (µl) = 0306tsupernatanin dpm OH3
pelletindpmOH3
2
2×
×
Extracellular volume (ECV) (µl) = 3006tsupernatanindpmdextran C
pelletindpmdextran C 14
14
××−
−
The intracellular volume (ICV) was calculated by subtracting the ECV from the total
pellet volume (PV) (Rottenberg, 1979).
* dpm = Disintegrations per minute
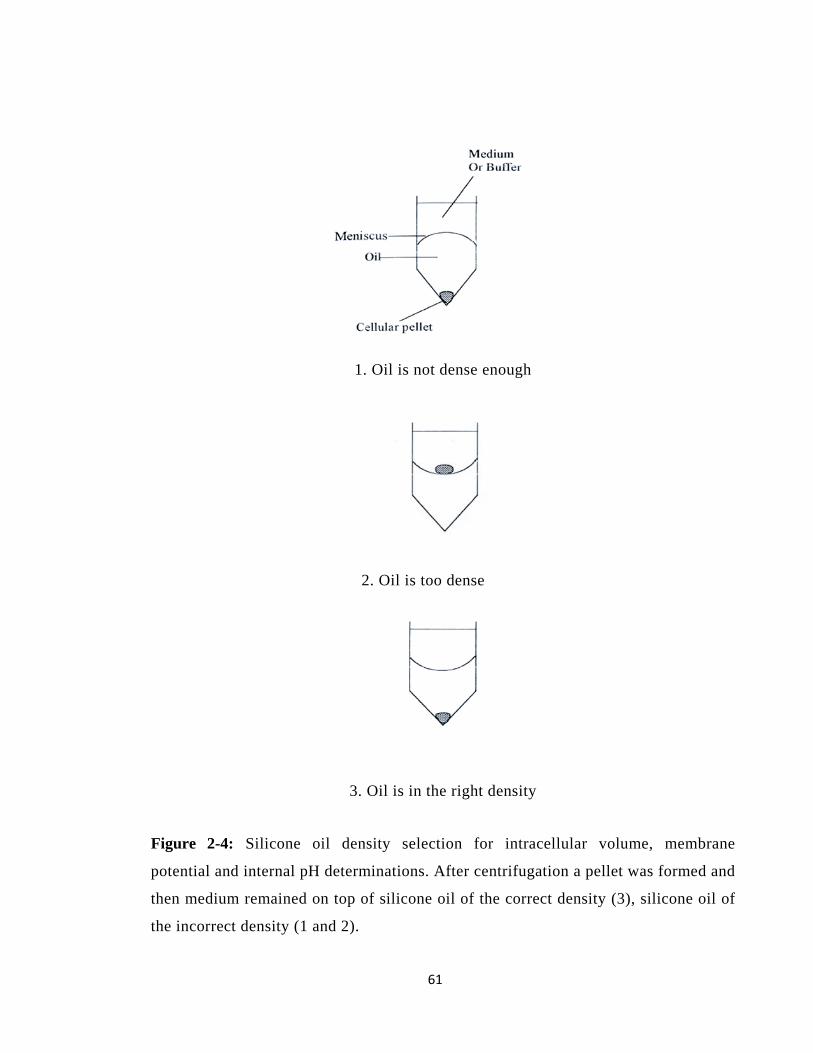
61
1. Oil is not dense enough
2. Oil is too dense
3. Oil is in the right density
Figure 2-4: Silicone oil density selection for intracellular volume, membrane
potential and internal pH determinations. After centrifugation a pellet was formed and
then medium remained on top of silicone oil of the correct density (3), silicone oil of
the incorrect density (1 and 2).
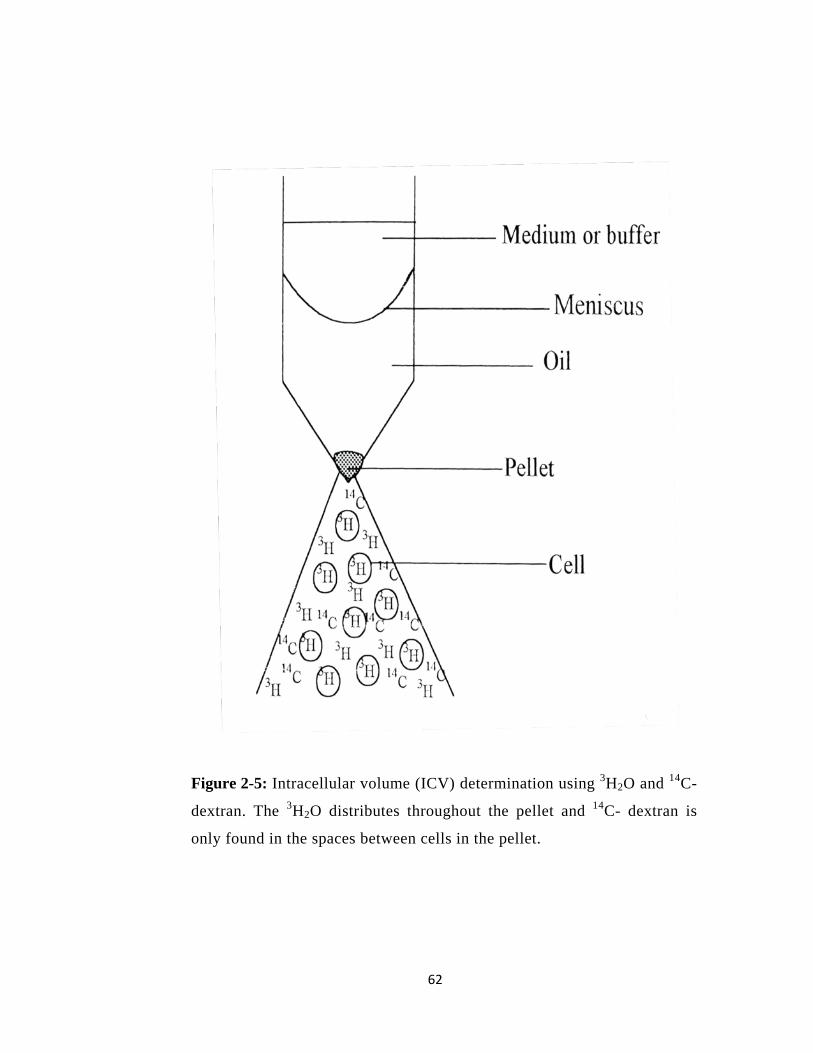
62
Figure 2-5: Intracellular volume (ICV) determination using 3H2O and 14C-
dextran. The 3H2O distributes throughout the pellet and 14C- dextran is
only found in the spaces between cells in the pellet.
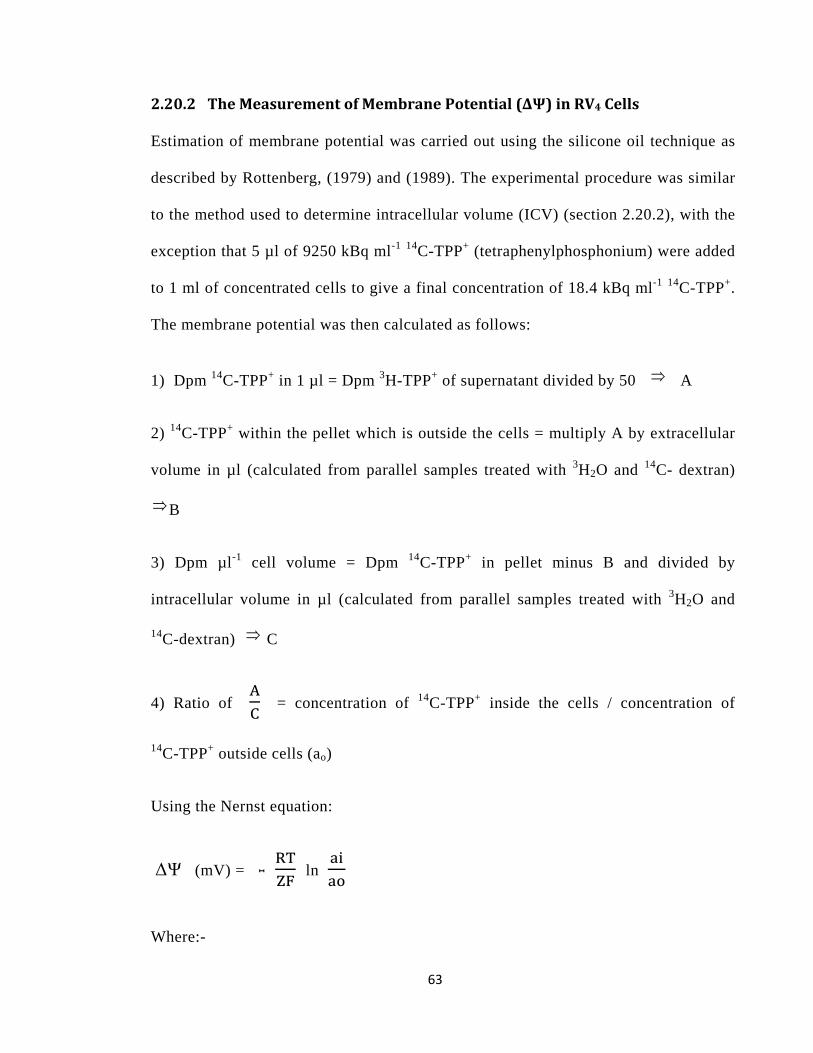
63
2.20.2 The Measurement of Membrane Potential (ΔΨ) in RV4 Cells
Estimation of membrane potential was carried out using the silicone oil technique as
described by Rottenberg, (1979) and (1989). The experimental procedure was similar
to the method used to determine intracellular volume (ICV) (section 2.20.2), with the
exception that 5 µl of 9250 kBq ml-1 14C-TPP+ (tetraphenylphosphonium) were added
to 1 ml of concentrated cells to give a final concentration of 18.4 kBq ml-1 14C-TPP+.
The membrane potential was then calculated as follows:
1) Dpm 14C-TPP+ in 1 µl = Dpm 3H-TPP+ of supernatant divided by 50 ⇒ A
2) 14C-TPP+ within the pellet which is outside the cells = multiply A by extracellular
volume in µl (calculated from parallel samples treated with 3H2O and 14C- dextran)
⇒B
3) Dpm µl-1 cell volume = Dpm 14C-TPP+ in pellet minus B and divided by
intracellular volume in µl (calculated from parallel samples treated with 3H2O and
14C-dextran) ⇒ C
4) Ratio of AC
= concentration of 14C-TPP+ inside the cells / concentration of
14C-TPP+ outside cells (ao)
Using the Nernst equation:
ΔΨ (mV) = ˗ RTZF
ln aiao
Where:-
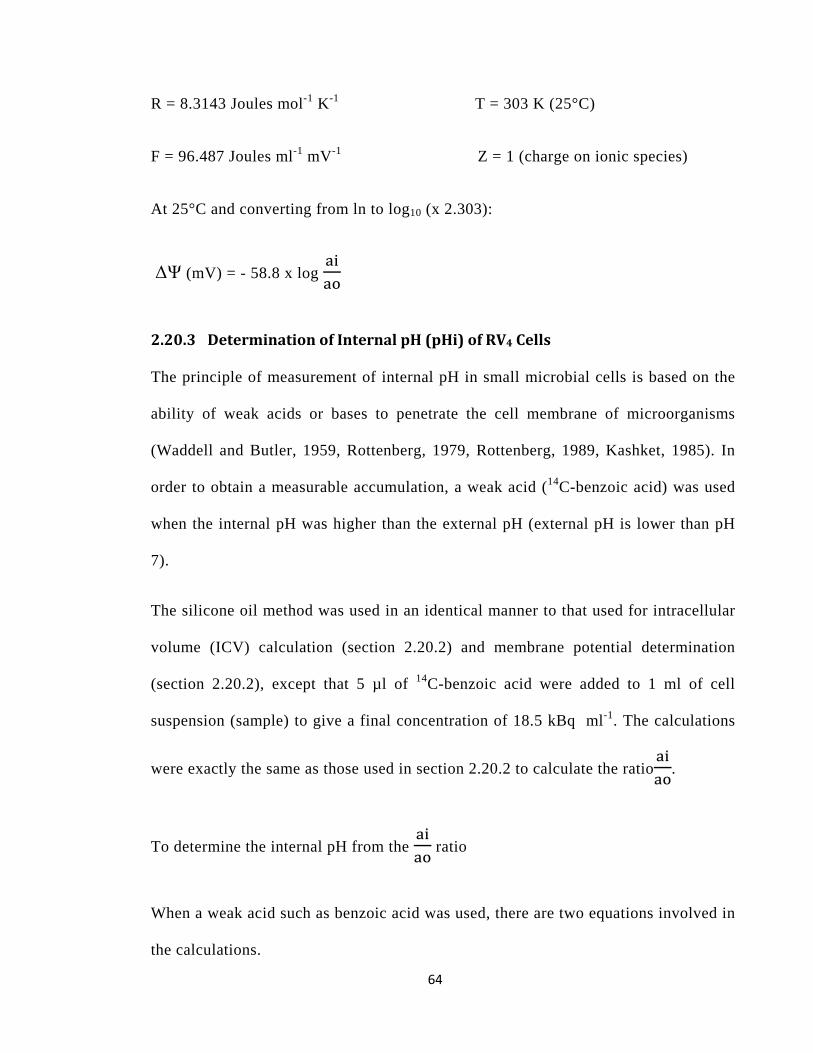
64
R = 8.3143 Joules mol-1 K-1 T = 303 K (25°C)
F = 96.487 Joules ml-1 mV-1 Z = 1 (charge on ionic species)
At 25°C and converting from ln to log10 (x 2.303):
ΔΨ (mV) = - 58.8 x log aiao
2.20.3 Determination of Internal pH (pHi) of RV4 Cells
The principle of measurement of internal pH in small microbial cells is based on the
ability of weak acids or bases to penetrate the cell membrane of microorganisms
(Waddell and Butler, 1959, Rottenberg, 1979, Rottenberg, 1989, Kashket, 1985). In
order to obtain a measurable accumulation, a weak acid (14C-benzoic acid) was used
when the internal pH was higher than the external pH (external pH is lower than pH
7).
The silicone oil method was used in an identical manner to that used for intracellular
volume (ICV) calculation (section 2.20.2) and membrane potential determination
(section 2.20.2), except that 5 µl of 14C-benzoic acid were added to 1 ml of cell
suspension (sample) to give a final concentration of 18.5 kBq ml-1. The calculations
were exactly the same as those used in section 2.20.2 to calculate the ratioaiao
.
To determine the internal pH from the aiao
ratio
When a weak acid such as benzoic acid was used, there are two equations involved in
the calculations.
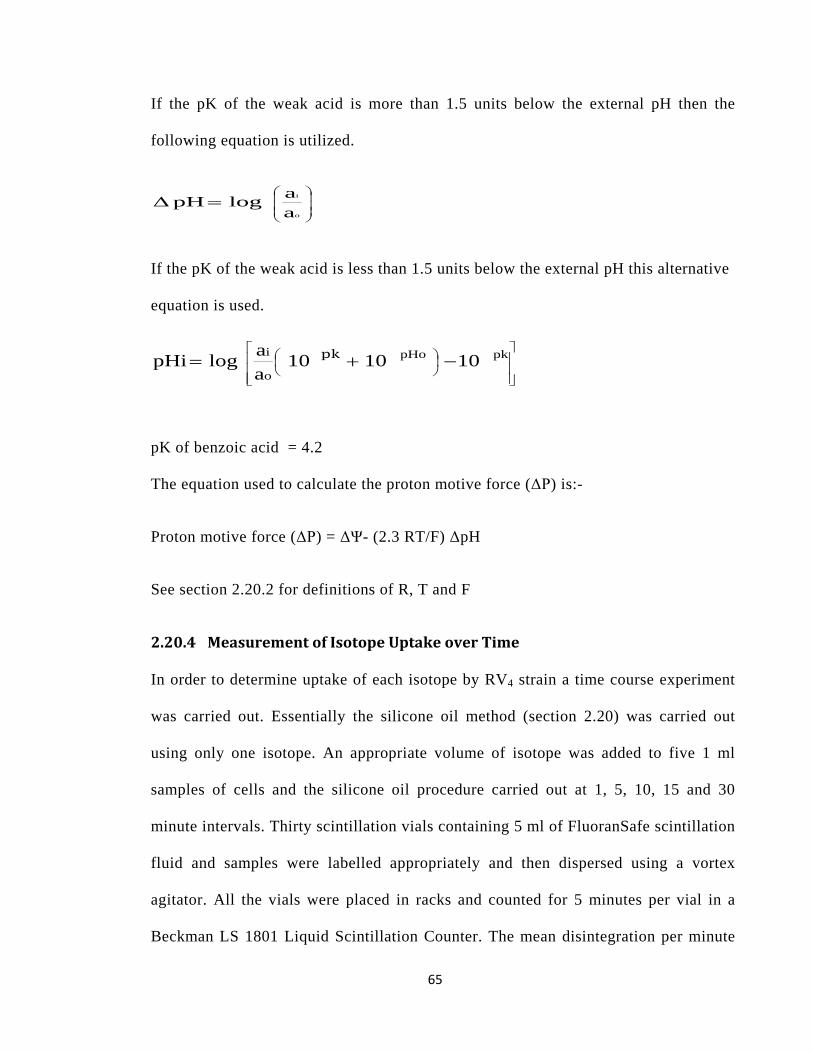
65
If the pK of the weak acid is more than 1.5 units below the external pH then the
following equation is utilized.
=
o
i
aalogpHΔ
If the pK of the weak acid is less than 1.5 units below the external pH this alternative
equation is used.
pK of benzoic acid = 4.2
The equation used to calculate the proton motive force (ΔP) is:-
Proton motive force (ΔP) = ΔΨ- (2.3 RT/F) ΔpH
See section 2.20.2 for definitions of R, T and F
2.20.4 Measurement of Isotope Uptake over Time
In order to determine uptake of each isotope by RV4 strain a time course experiment
was carried out. Essentially the silicone oil method (section 2.20) was carried out
using only one isotope. An appropriate volume of isotope was added to five 1 ml
samples of cells and the silicone oil procedure carried out at 1, 5, 10, 15 and 30
minute intervals. Thirty scintillation vials containing 5 ml of FluoranSafe scintillation
fluid and samples were labelled appropriately and then dispersed using a vortex
agitator. All the vials were placed in racks and counted for 5 minutes per vial in a
Beckman LS 1801 Liquid Scintillation Counter. The mean disintegration per minute
−+= pkpHo
o
i 101010aa logpHi pk
66
(dpm) for the pellet and supernatant triplicates per time point were calculated and
plotted against time.
2.21 Molecular Identification of Unknown Organisms
2.21.1 Genomic DNA Extraction
CTAB method as described by Chen et al., (2001) (Appendix B) was used as first
attempt to extract genomic DNA from all four strains.
The second method used was QIAgen Genomic-Tip kit following manufacturers
guidelines.
ANACHEM Key Prep kit was the third method used in this study to extract genomic
DNA from all four strains using liquid cultures and then following manufacturer’s
protocol.
2.21.2 Polymerase Chain Reaction (PCR) Amplification of 16S rRNA
Following extraction of genomic DNA, polymerase chain reaction (PCR) was carried
out in order to amplify the 16S rRNA gene, the primers used to amplify the 16S
rRNA gene were two universal bacterial primers: Forward primer (f D1: 5’CCG AAT
TCG TCG ACA ACA GAG TTT GAT CCT GGC TCA G 3’) and Reverse primer (r
D1: 5’ CCC GGG ATC CAA GCT TAC GGC TAC CTT GTT ACG ACT T 3’)
designed to target the conserved regions of the 16S rRNA gene (Weisburg et al.,
1991). The reaction mixture contained the following reagents in a 0.2 ml thin walled
PCR tube: 39 µl Distilled Water, 5 µl 10x Buffer, 2.5 µl 50 mM MgCl2, 0.5 µl
Forward Primer, 0.5 µl Reverse Primer, 1 µl 25 mM dNTPs, 1 µl genomic DNA and
0.5 µl Taq polymerase (Bioline).
67
Amplifications were carried out in a MyCycler thermocycler (BioRad) and began
with an initial denaturation step consisting of 94°C for 3 min followed by 30 cycles
consisting of 1 min at 94°C, 1 min at 60oC, and 1 min at 72°C followed by a final
extension at 72oC for 5 minutes.
2.21.3 Purification of PCR Products
PCR reactions were cleaned up using QIAgen PCR purification kit and ANACHEM
Key Prep Purification as per the manufacturer’s protocols. This stage was used to
remove any remaining primers and dNTPs. After the clean up, the PCR product can
be sent for direct sequencing.
2.21.4 Agarose Gel Electrophoresis
After PCR and after purification process, gel electrophoresis was used to check and
confirm the correct gene had been amplified (16S rRNA is 1.5 kbp). The gel was
made by adding 2 ml of 50X TAE into a conical flask, add distilled water up to 100
ml and add 1 g of agarose to produce a 1% gel, This mixture was then heated in a
microwave until the agarose had melted, after which it was allowed to cool whilst
being stirred, and 5 µl of ethidium bromide (Biorad #161-0433) was added prior to
pouring into a Biorad Subcell GT electrophoretic tank with a 30 well comb. Once the
gel had set, it was covered with 1X TAE buffer and run at 90 – 100 V using a Biorad
PowerPack 300.
PCR products were loaded on the gel as follows, 2 µl of the PCR reaction was added
to 2 µl of Orange G loading dye and analysed on a 1 % agarose gel against 1 µl of 1
68
kb GeneRuler ladder (Fermentas) (Appendix B). Gels were visualised using the
Uvitec “Uvidoc” mounted camera system.
2.21.5 TOPO Cloning Reaction
2.21.5.1 Ligation
The ligation stage is used to ligate 16S rRNA into a vector or plasmid which is a
naturally occurring circular piece of DNA which most bacteria possess (Appendix B).
Bacteria use them to spread antibiotic resistance genes between each other for
example, which is useful to use as a selective marker.
2.21.5.2 Transformation & Miniprep Procedure
After ligation of 16S rRNA gene into the vector, competent Escherichia coli cells
were transformed with the vector containing the 16S rRNA insert. Basically,
transformation is the process of forcing the E. coli cells to take up the plasmid DNA.
Competent E. coli cells are made especially so that they can take up plasmid. Ligation
reaction and transformation were carried out by using TOPO 10 cloning reaction
protocol.
2.21.5.3 Digestion
Digest step is usually used to confirm if the plasmid has the correct insert or not. This
involves cutting the DNA in a specific place using a restriction enzyme. Restriction
digests usually contain 1 µl of enzyme, 1 µl 10X buffer (appropriate to the enzyme),
2 µl plasmid DNA and 6 µl MilliQ water, and then the mixture was incubated at 37°C
for 2 hours. The results are checked using gel electrophoresis and samples containing
69
the correct insert are sent to Medical School for sequencing. The sequences were then
compared to other sequences using the NCBI Blast web site.
For high quality plasmid DNA, the PureLinkTM HiPure Plasmid DNA MiniprepKit was
used as described in the manufacturer’s protocol.
2.21.6 Phylogenetic (DNA Sequence) Analysis
For the phylogenetic placement of RV2 and RV4, 16S rRNA gene sequences were
processed by The National Collection of Industrial, Marine and Food Bacteria
(NCIMB) using the MicroSeq database and the EMBL public database. RV3 16S
rRNA gene sequences were produced by Eurofins MWG while LV1 16S rRNA gene
sequences were processed by the Medical School in the University of Sheffield.
2.22 Statistics
Most of the experiments in this study were carried out in triplicate and error bars
represent standard errors of the means. If no error bars are shown, they were smaller
than symbol used to represent the mean. For experiments carried out in duplicate,
both values plus the average are shown.

70
CCHHAAPPTTEERR TTHHRREEEE
71
3 Isolation and Initial Characterisation of
Acidophiles from Rivelin and Limb Valleys
3.1 Introduction
Recent research has examined microbial life in extremely low pH environments either
neutral or man-made environments. This research has focused on prokaryotic
microorganisms due to the importance of these microorganisms (bacteria or archaea) in
environmental pollution and biotechnology applications such as biodegradation. However,
eukaryotic microorganisms (algae, fungi and yeasts) are also known to be obligate
acidophiles which may form stable communities with prokaryotes (Norris et al., 1992,
Norris and Johnson, 1998, Johnson, 1998).
However, extremophiles have also been isolated from habitats where they are not expected
to be actively growing (Echigo et al., 2005). Therefore, it is possible that extremely
tolerant or even extremophilic microorganisms can be isolated from a wide range of
environments including fresh water (Kristjansson and Hreggvidsson, 1995, Schleper et al.,
1997, Purdy et al., 2004, Oren, 2008).
As noted in Chapter 1, microorganisms that live at extreme pH values (acidophilic or
alkaliphilic) must maintain a cytoplasmic pH that is compatible with optimal functional
and structural integrity of the cytoplasmic proteins that support growth (Krulwich and
Guffanti, 1983, Padan et al., 2001). Although acidophiles tolerate pH gradients [pH
gradient (ΔpH) = pHin minus pHout] several orders of magnitude greater than
neutralophiles, acidophiles require a moderate intracellular pH. The ΔpH across the
72
cytoplasmic membrane is intrinsically linked to cellular bioenergetics because it is the
major contributor to the proton motive force in acidophiles. However, the influx of protons
through the F0F1 ATPase to produce ATP intensifies cellular protonation and, if left
unchecked, will rapidly dissipate the ΔpH. The functions of proteins and nucleic acids are
impaired by protonation, and interference caused by free intracellular protons can impair
processes such as DNA transcription, protein synthesis and enzyme activities (Madshus,
1988, Baker-Austin and Dopson, 2007).
Nevertheless, internal pH regulation mechanisms in acidophilic microorganisms although
poorly understood, are essential for the survival and growth of this ecologically and
biotechnologically important group of microorganisms.
The Rivelin and Limb Valleys in Sheffield have long history of industrial activity dating
back to the Industrial Revolution. Therefore, it was assumed that even today, the rivers
would remain polluted acidic environments. For that reason, analysis of the microbial
diversity present in water samples from Rivelin and Limb Valleys was carried out
using classical microbiology techniques using batch culture to isolate microorganisms
from Rivelin and Limb Valley water samples which can grow at low pH values such
as pH 5 and pH 3.
In this chapter, initial characterisations were performed on all four isolated strains
such as cell shape under light microscope, growth curves, their ability to grow in
different pH values, respiration rates, the range of salinities that all isolated strains
can tolerate and some salient physiological characteristics of both prokaryotic and
eukaryotic microorganisms.
73
3.2 Results and Discussion
3.2.1 Sample collection
3.2.1.1 Rivelin Valley
The collections of samples from the River Rivelin were carried out at two different
times.
3.2.1.1.1 First Collection
A total of three samples were collected from the Rivelin Valley on 15th February
2009 (Rivelin Valley was filled with snow which made it difficult to collect samples).
Samples were numbered according to their type i.e. surface water, deep water and
sediment). The pH of samples was measured upon returning to the laboratory and not
on site, pH value for the three samples was 7.3, 6.68 and 7.15, respectively.
3.2.1.1.2 Second Collection
On 6th April 2009 a total of four samples were collected from Rivelin Valley. The pH
of samples was measured in the field and the readings were 6.3 to 7 for the four
samples. The samples were numbered and photographs taken during sampling in the
Rivelin Valley (Figure 3-1).
3.2.1.2 Limb Valley:
A total of three samples were collected from water in the Limb Valley on the 7th May
2010. The pH of samples was measured in the field, the highest pH was 6.5 and the
lowest was 5, this latter sample was taken from a ditch in the Limb Valley. The
samples were numbered and photographs taken during sampling (Figure 3-2).
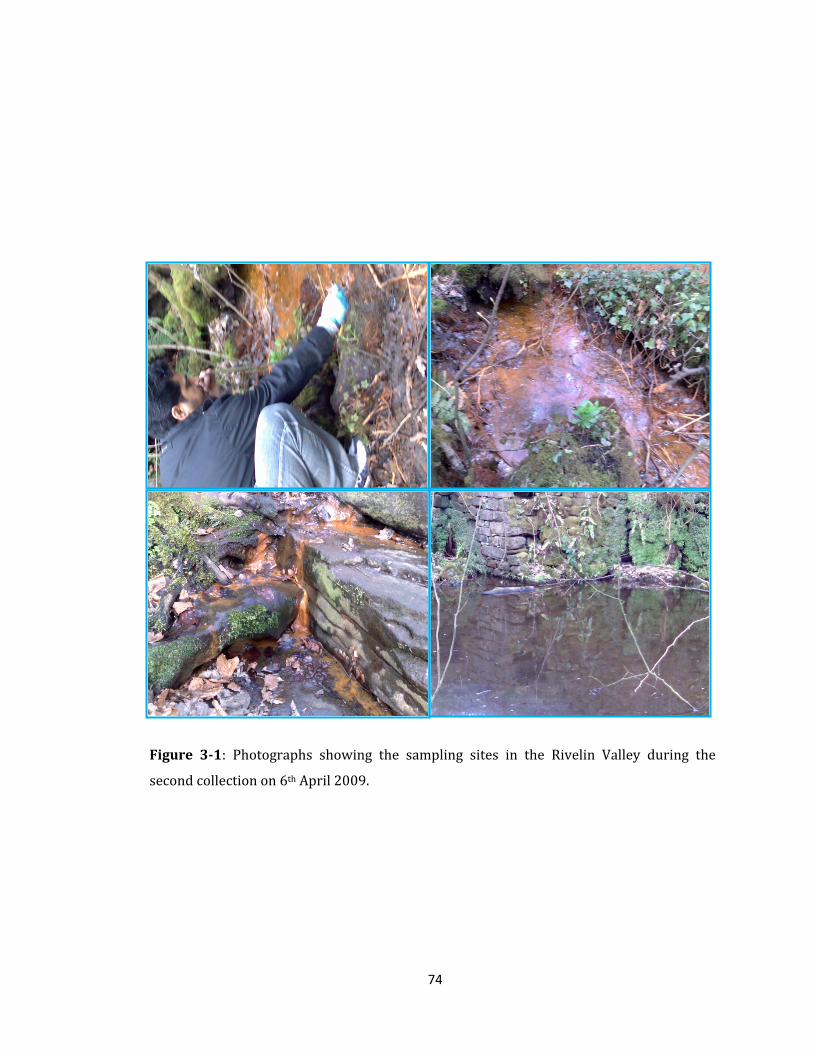
74
Figure 3-1: Photographs showing the sampling sites in the Rivelin Valley during the
second collection on 6th April 2009.
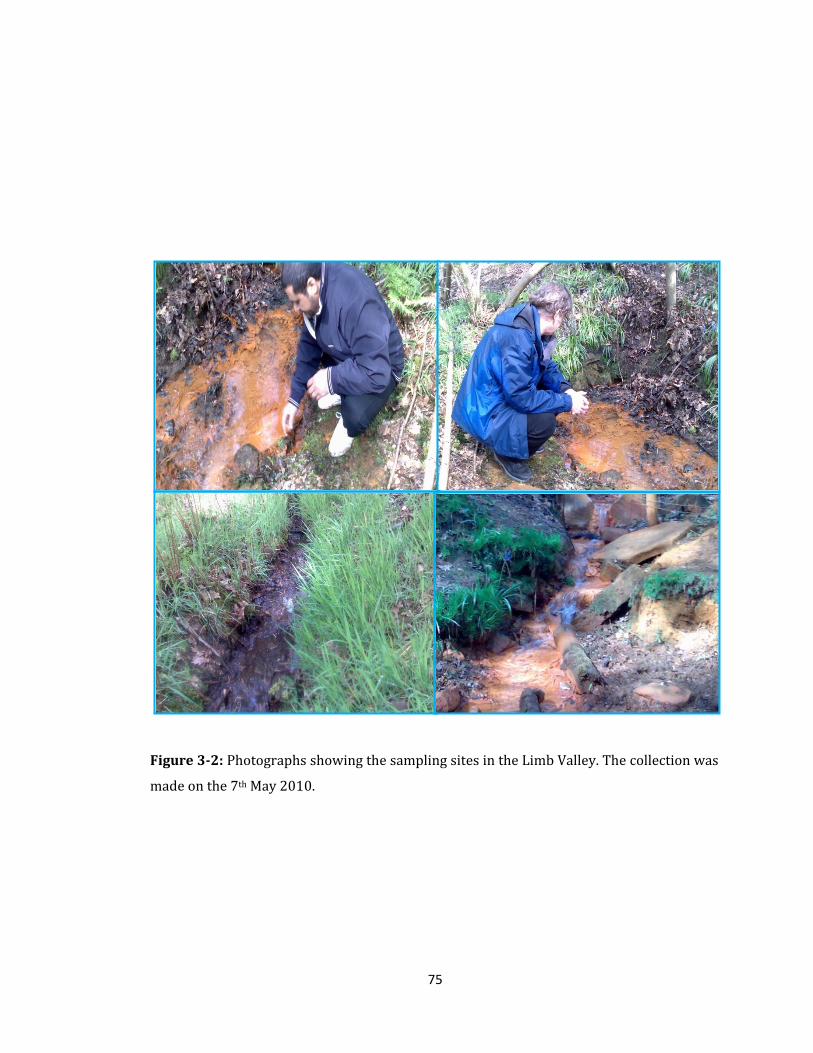
75
Figure 3-2: Photographs showing the sampling sites in the Limb Valley. The collection was
made on the 7th May 2010.
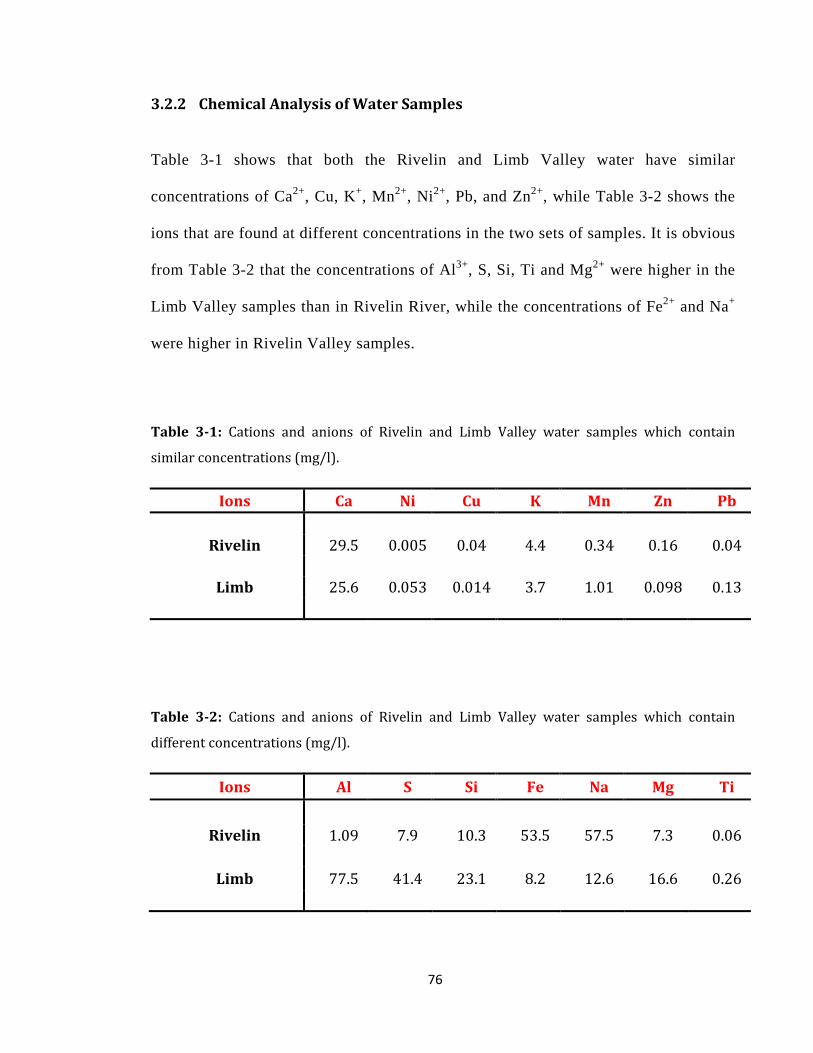
76
3.2.2 Chemical Analysis of Water Samples
Table 3-1 shows that both the Rivelin and Limb Valley water have similar
concentrations of Ca2+, Cu, K+, Mn2+, Ni2+, Pb, and Zn2+, while Table 3-2 shows the
ions that are found at different concentrations in the two sets of samples. It is obvious
from Table 3-2 that the concentrations of Al3+, S, Si, Ti and Mg2+ were higher in the
Limb Valley samples than in Rivelin River, while the concentrations of Fe2+ and Na+
were higher in Rivelin Valley samples.
Table 3-1: Cations and anions of Rivelin and Limb Valley water samples which contain
similar concentrations (mg/l).
Ions Ca Ni Cu K Mn Zn Pb
Rivelin 29.5 0.005 0.04 4.4 0.34 0.16 0.04
Limb 25.6 0.053 0.014 3.7 1.01 0.098 0.13
Table 3-2: Cations and anions of Rivelin and Limb Valley water samples which contain
different concentrations (mg/l).
Ions Al S Si Fe Na Mg Ti
Rivelin 1.09 7.9 10.3 53.5 57.5 7.3 0.06
Limb 77.5 41.4 23.1 8.2 12.6 16.6 0.26
77
3.2.3 Isolation and Selection of Culturable Microorganisms
Initially in order to isolate acidophilic or acid tolerant microorganisms, FeTSB liquid
and solid media (sections 2.4.1 and 2.4.2) were selected for isolation of strains
(Johnson et al., 1987). Unfortunately, after several attempts, there was no observation
of any microbial growth in this medium.
Therefore, M9 minimal medium (section 2.4.3) was used for initial isolation of strains
instead of FeTSB medium. M9 medium was adjusted to three different pH values 3, 5
and 7. Seven samples of water (four from the first collection and three from the
second) were collected from different points on the Rivelin River (Figure 3-1), and
three samples of water were collected from Limb River and the ditch beside the river.
1 ml of each river water sample was inoculated in to 50 ml of M9 medium. Flasks
were incubated overnight at 25ºC with shaking (250 rpm). In parallel, a modified ½
LB medium which has half the normal concentration of LB medium components
(section 2.4.4) was used as well as M9 in order to isolate a wider variety of
acidophiles or acid tolerant microorganisms.
The biomass obtained from the flasks was spread on M9 and ½ LB agar plates and
single colonies from these plates were used to purify three strains from Rivelin valley
RV2, RV3, and RV4, and one strain from Limb valley designed as LV1. Three strains
RV2, RV3 and RV4 were able to grow well in both media at three different pH values
3, 5 and 7 while LV1 strain took a longer time to adapt and grow in low pH,
especially in M9 medium. Good growth was defined as reaching at least an OD600 of
1 after overnight growth at 25°C with shaking (250 rpm).
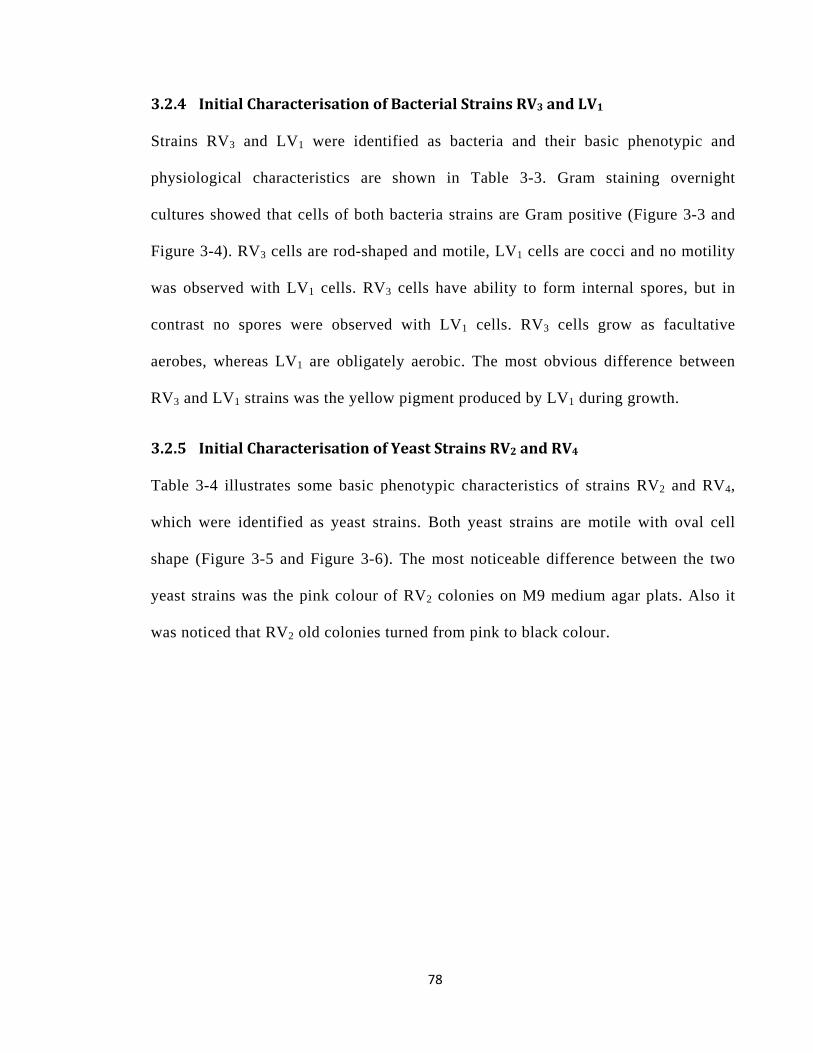
78
3.2.4 Initial Characterisation of Bacterial Strains RV3 and LV1
Strains RV3 and LV1 were identified as bacteria and their basic phenotypic and
physiological characteristics are shown in Table 3-3. Gram staining overnight
cultures showed that cells of both bacteria strains are Gram positive (Figure 3-3 and
Figure 3-4). RV3 cells are rod-shaped and motile, LV1 cells are cocci and no motility
was observed with LV1 cells. RV3 cells have ability to form internal spores, but in
contrast no spores were observed with LV1 cells. RV3 cells grow as facultative
aerobes, whereas LV1 are obligately aerobic. The most obvious difference between
RV3 and LV1 strains was the yellow pigment produced by LV1 during growth.
3.2.5 Initial Characterisation of Yeast Strains RV2 and RV4
Table 3-4 illustrates some basic phenotypic characteristics of strains RV2 and RV4,
which were identified as yeast strains. Both yeast strains are motile with oval cell
shape (Figure 3-5 and Figure 3-6). The most noticeable difference between the two
yeast strains was the pink colour of RV2 colonies on M9 medium agar plats. Also it
was noticed that RV2 old colonies turned from pink to black colour.
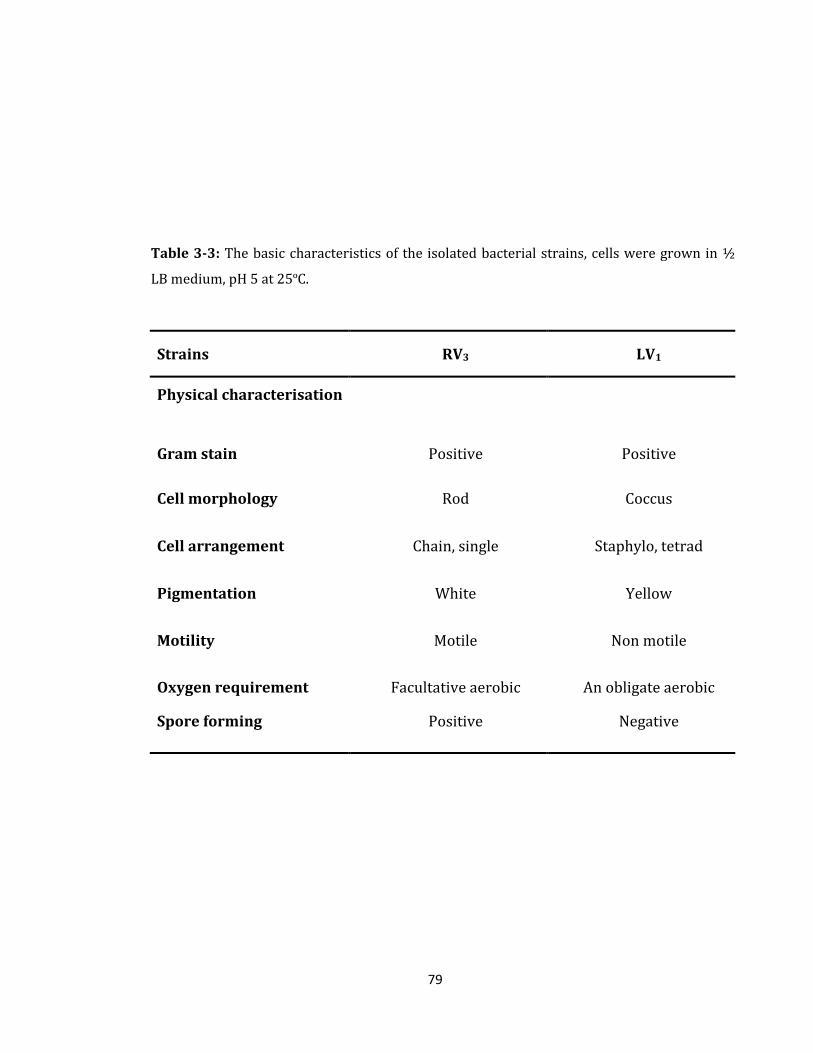
79
Table 3-3: The basic characteristics of the isolated bacterial strains, cells were grown in ½
LB medium, pH 5 at 25ºC.
Strains RV3 LV1
Physical characterisation
Gram stain Positive Positive
Cell morphology Rod Coccus
Cell arrangement Chain, single Staphylo, tetrad
Pigmentation White Yellow
Motility Motile Non motile
Oxygen requirement Facultative aerobic An obligate aerobic
Spore forming Positive Negative
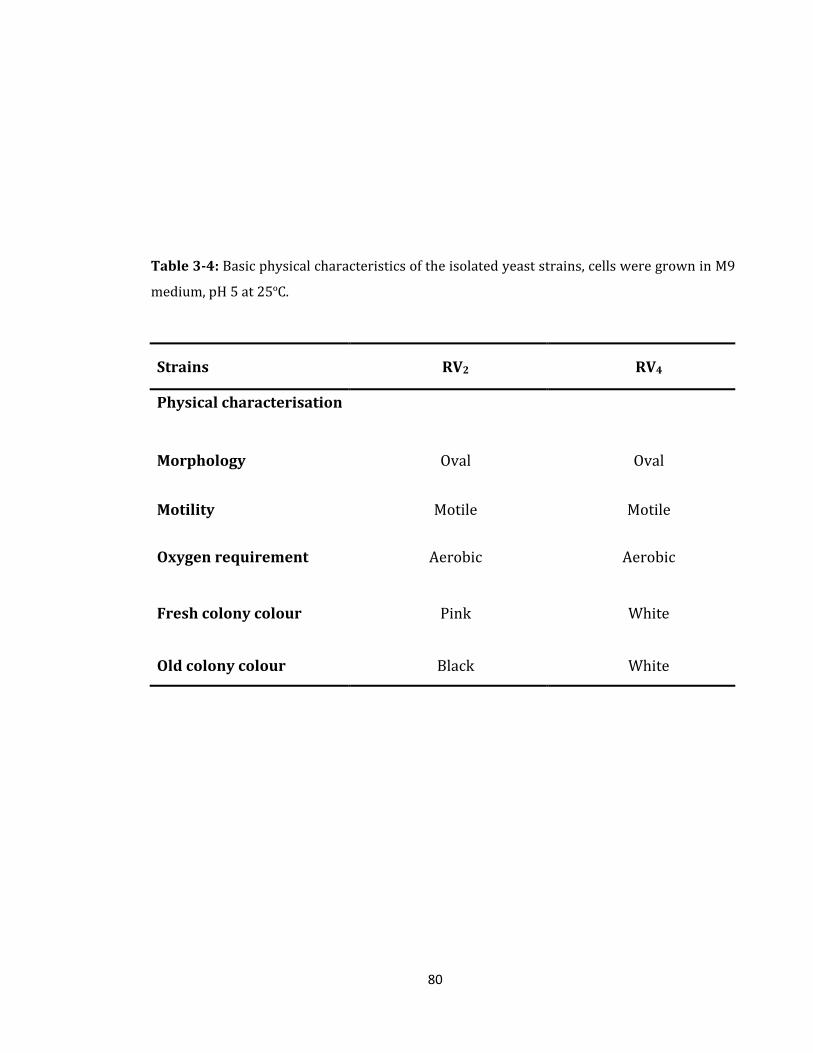
80
Table 3-4: Basic physical characteristics of the isolated yeast strains, cells were grown in M9
medium, pH 5 at 25ºC.
Strains RV2 RV4
Physical characterisation Morphology Oval Oval
Motility Motile Motile
Oxygen requirement Aerobic Aerobic
Fresh colony colour Pink White
Old colony colour Black White
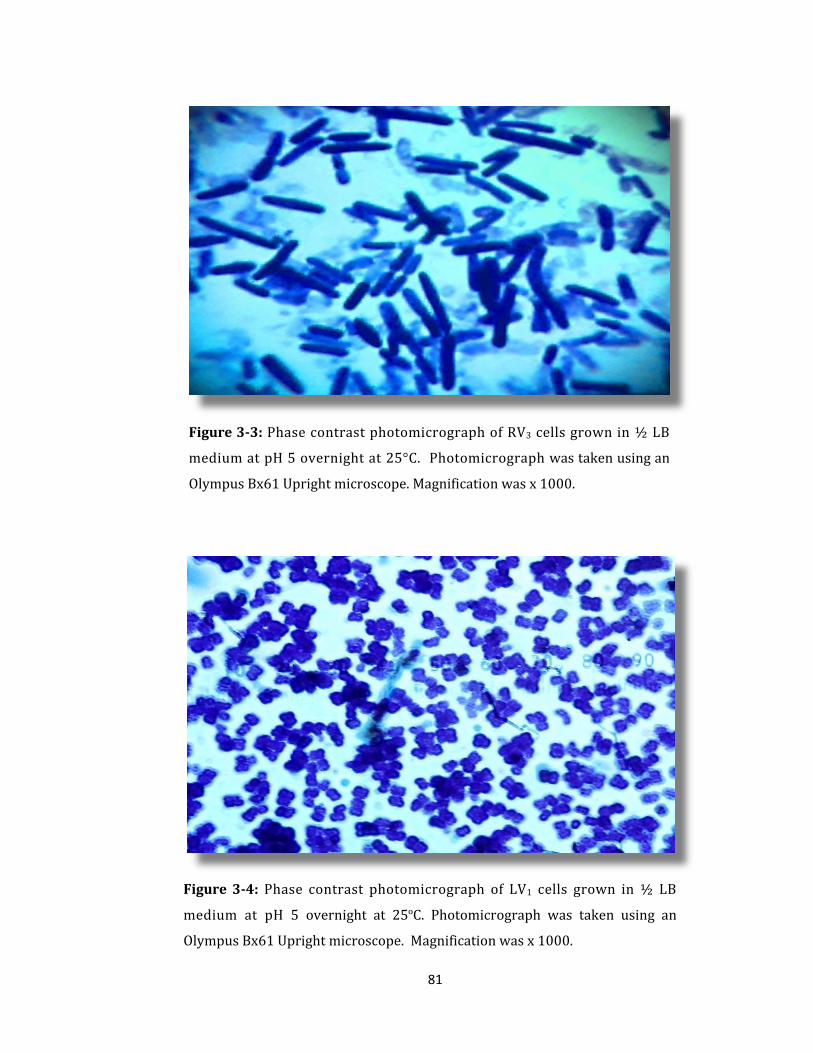
81
Figure 3-4: Phase contrast photomicrograph of LV1 cells grown in ½ LB
medium at pH 5 overnight at 25ºC. Photomicrograph was taken using an
Olympus Bx61 Upright microscope. Magnification was x 1000.
Figure 3-3: Phase contrast photomicrograph of RV3 cells grown in ½ LB
medium at pH 5 overnight at 25°C. Photomicrograph was taken using an
Olympus Bx61 Upright microscope. Magnification was x 1000.
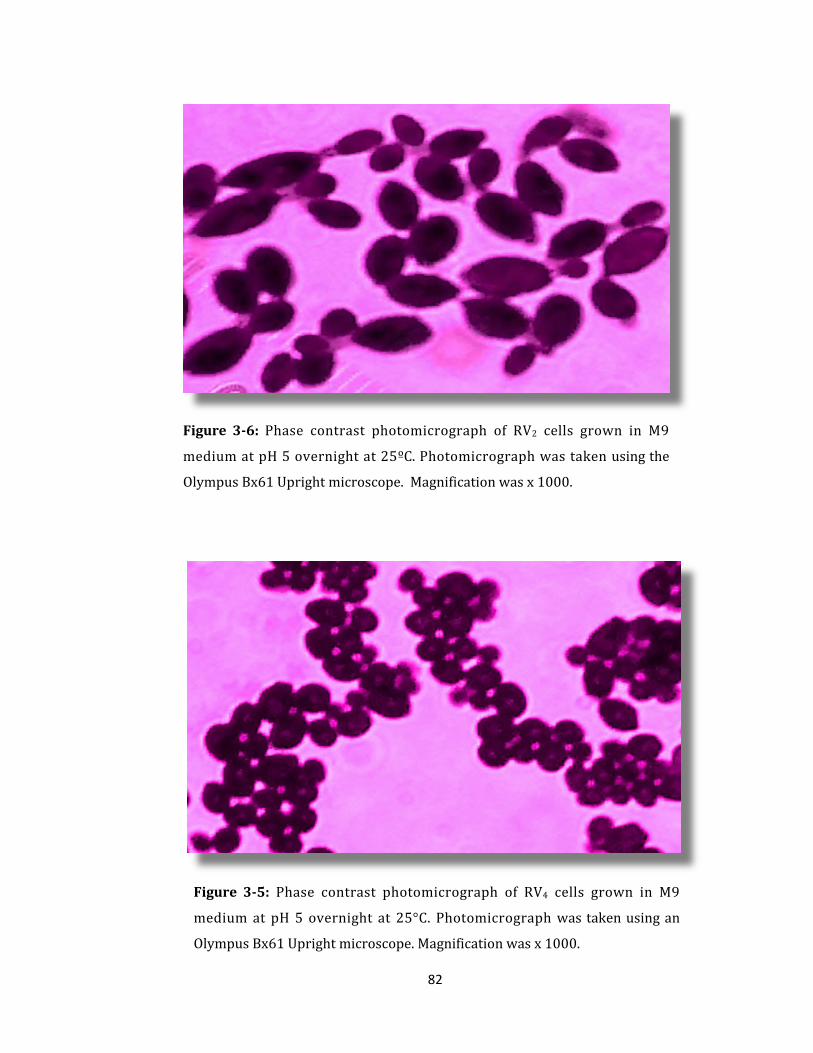
82
Figure 3-6: Phase contrast photomicrograph of RV2 cells grown in M9
medium at pH 5 overnight at 25ºC. Photomicrograph was taken using the
Olympus Bx61 Upright microscope. Magnification was x 1000.
Figure 3-5: Phase contrast photomicrograph of RV4 cells grown in M9
medium at pH 5 overnight at 25°C. Photomicrograph was taken using an
Olympus Bx61 Upright microscope. Magnification was x 1000.
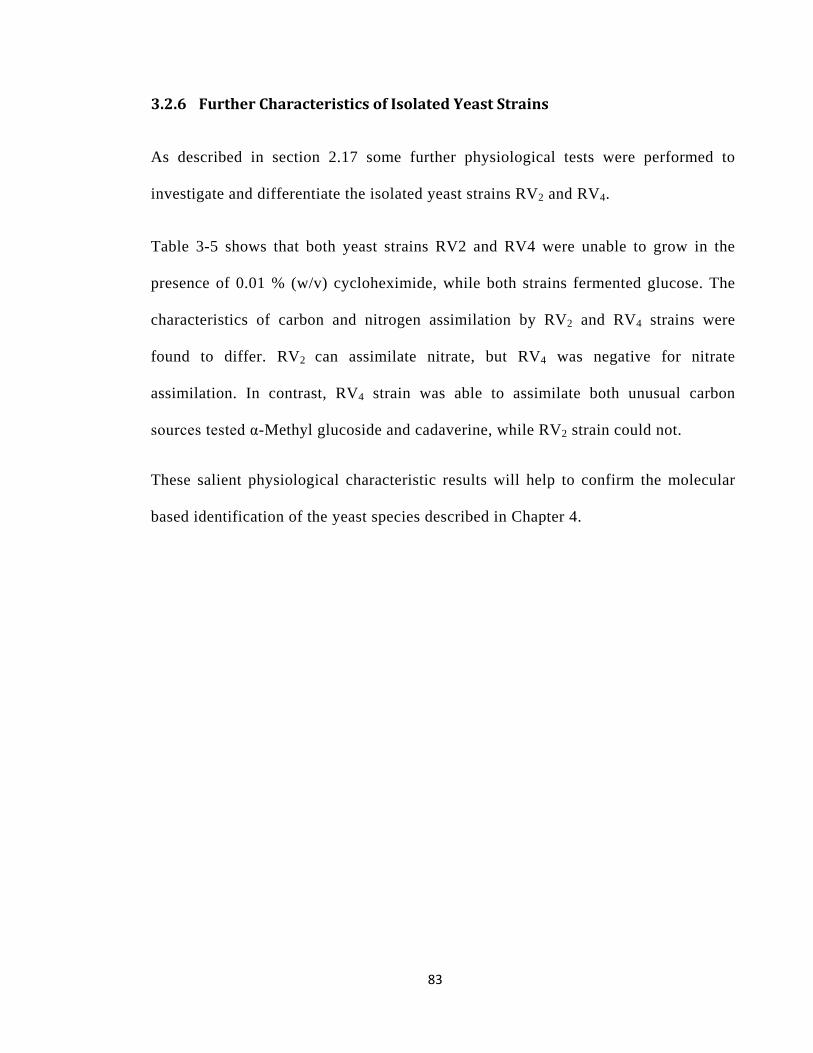
83
3.2.6 Further Characteristics of Isolated Yeast Strains
As described in section 2.17 some further physiological tests were performed to
investigate and differentiate the isolated yeast strains RV2 and RV4.
Table 3-5 shows that both yeast strains RV2 and RV4 were unable to grow in the
presence of 0.01 % (w/v) cycloheximide, while both strains fermented glucose. The
characteristics of carbon and nitrogen assimilation by RV2 and RV4 strains were
found to differ. RV2 can assimilate nitrate, but RV4 was negative for nitrate
assimilation. In contrast, RV4 strain was able to assimilate both unusual carbon
sources tested α-Methyl glucoside and cadaverine, while RV2 strain could not.
These salient physiological characteristic results will help to confirm the molecular
based identification of the yeast species described in Chapter 4.
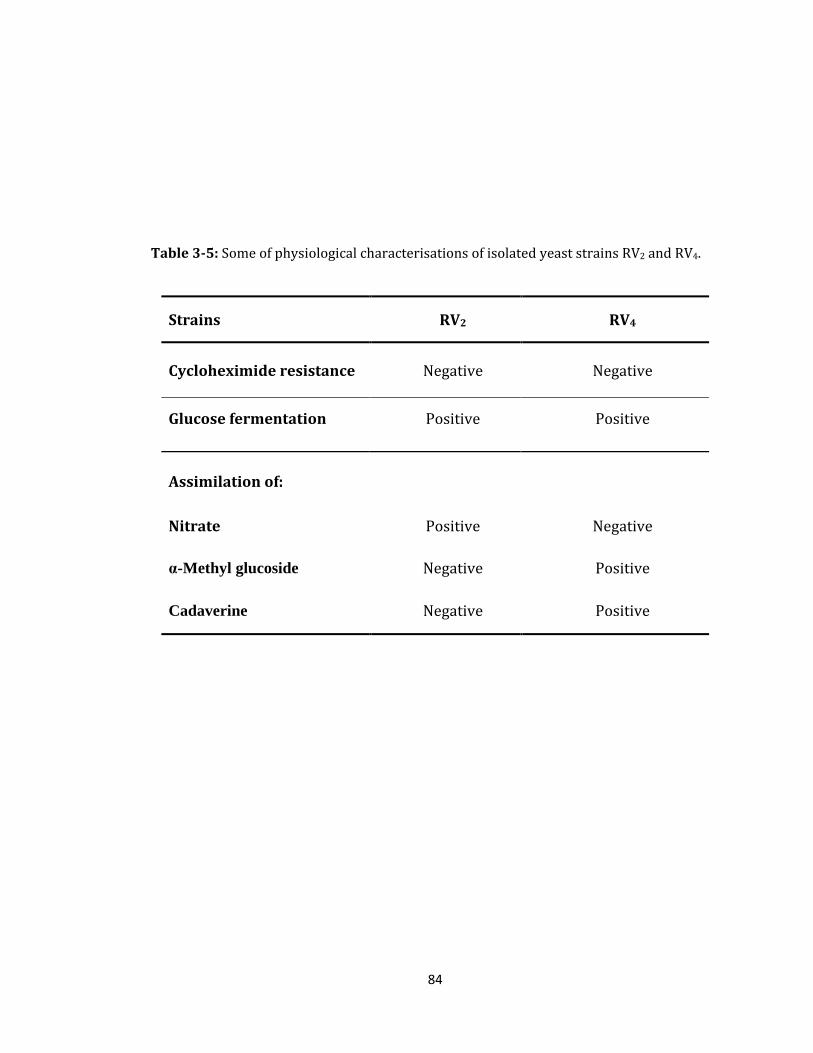
84
Table 3-5: Some of physiological characterisations of isolated yeast strains RV2 and RV4.
Strains RV2 RV4
Cycloheximide resistance Negative Negative
Glucose fermentation Positive Positive
Assimilation of:
Nitrate Positive Negative
α-Methyl glucoside Negative Positive
Cadaverine Negative Positive
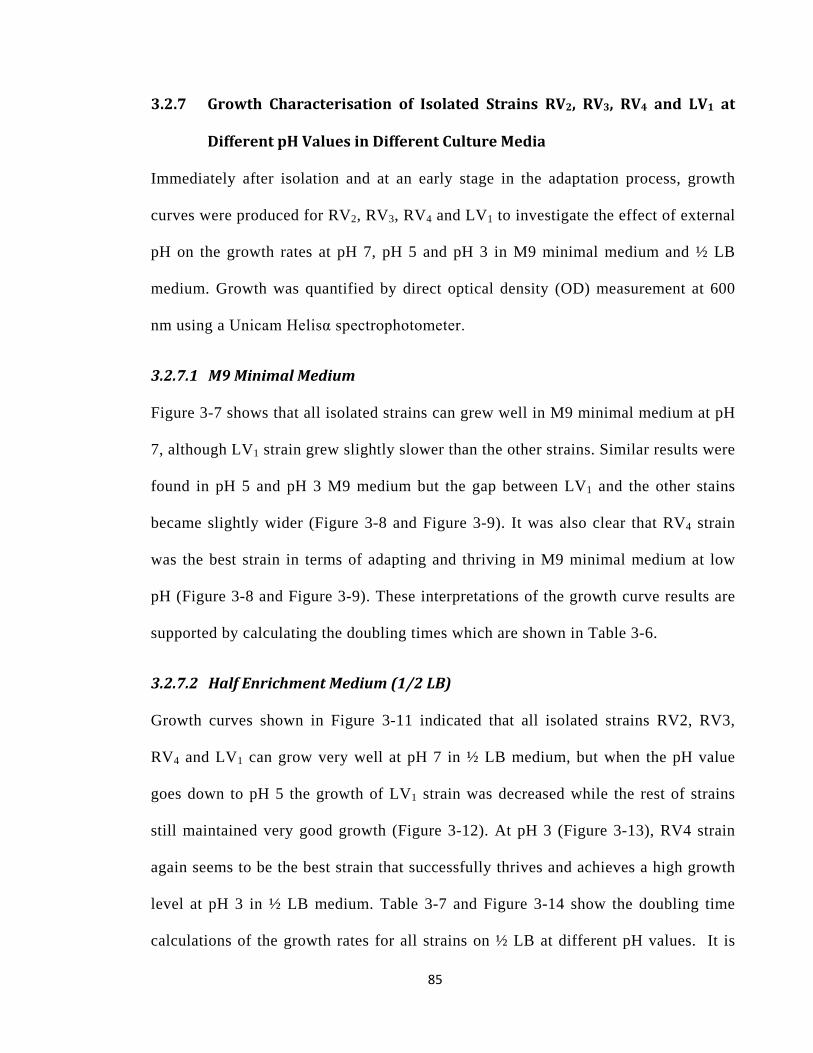
85
3.2.7 Growth Characterisation of Isolated Strains RV2, RV3, RV4 and LV1 at
Different pH Values in Different Culture Media
Immediately after isolation and at an early stage in the adaptation process, growth
curves were produced for RV2, RV3, RV4 and LV1 to investigate the effect of external
pH on the growth rates at pH 7, pH 5 and pH 3 in M9 minimal medium and ½ LB
medium. Growth was quantified by direct optical density (OD) measurement at 600
nm using a Unicam Helisα spectrophotometer.
3.2.7.1 M9 Minimal Medium
Figure 3-7 shows that all isolated strains can grew well in M9 minimal medium at pH
7, although LV1 strain grew slightly slower than the other strains. Similar results were
found in pH 5 and pH 3 M9 medium but the gap between LV1 and the other stains
became slightly wider (Figure 3-8 and Figure 3-9). It was also clear that RV4 strain
was the best strain in terms of adapting and thriving in M9 minimal medium at low
pH (Figure 3-8 and Figure 3-9). These interpretations of the growth curve results are
supported by calculating the doubling times which are shown in Table 3-6.
3.2.7.2 Half Enrichment Medium (1/2 LB)
Growth curves shown in Figure 3-11 indicated that all isolated strains RV2, RV3,
RV4 and LV1 can grow very well at pH 7 in ½ LB medium, but when the pH value
goes down to pH 5 the growth of LV1 strain was decreased while the rest of strains
still maintained very good growth (Figure 3-12). At pH 3 (Figure 3-13), RV4 strain
again seems to be the best strain that successfully thrives and achieves a high growth
level at pH 3 in ½ LB medium. Table 3-7 and Figure 3-14 show the doubling time
calculations of the growth rates for all strains on ½ LB at different pH values. It is
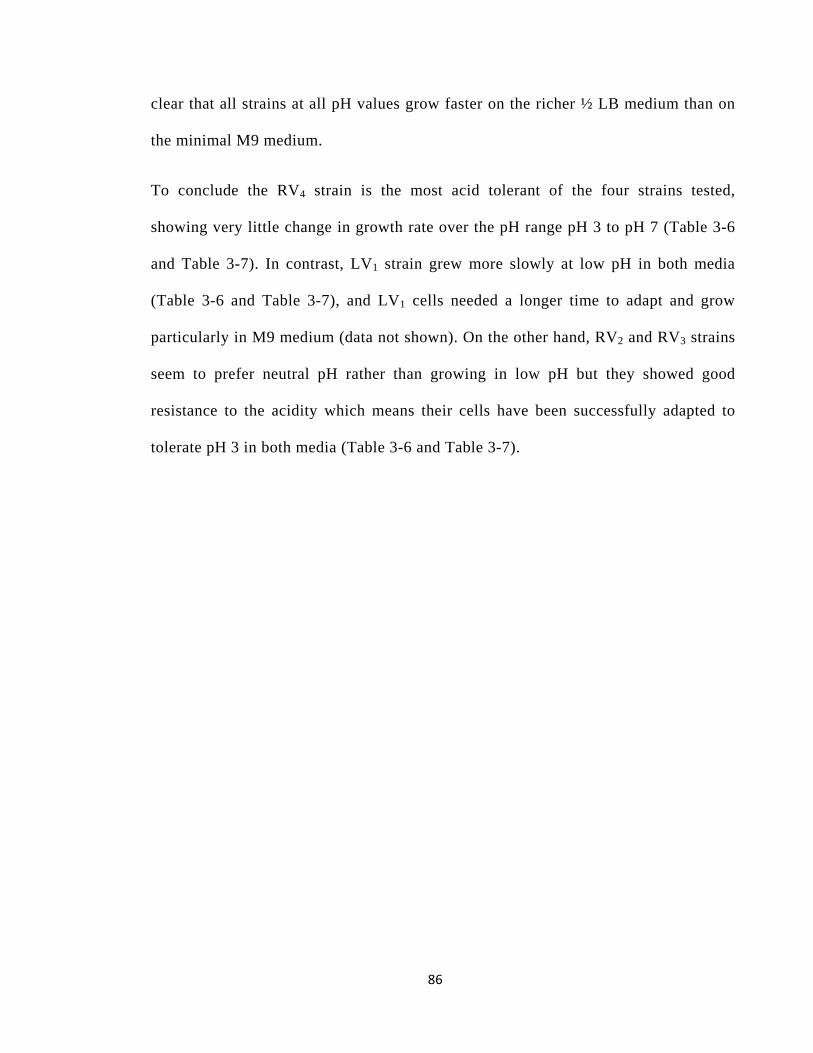
86
clear that all strains at all pH values grow faster on the richer ½ LB medium than on
the minimal M9 medium.
To conclude the RV4 strain is the most acid tolerant of the four strains tested,
showing very little change in growth rate over the pH range pH 3 to pH 7 (Table 3-6
and Table 3-7). In contrast, LV1 strain grew more slowly at low pH in both media
(Table 3-6 and Table 3-7), and LV1 cells needed a longer time to adapt and grow
particularly in M9 medium (data not shown). On the other hand, RV2 and RV3 strains
seem to prefer neutral pH rather than growing in low pH but they showed good
resistance to the acidity which means their cells have been successfully adapted to
tolerate pH 3 in both media (Table 3-6 and Table 3-7).
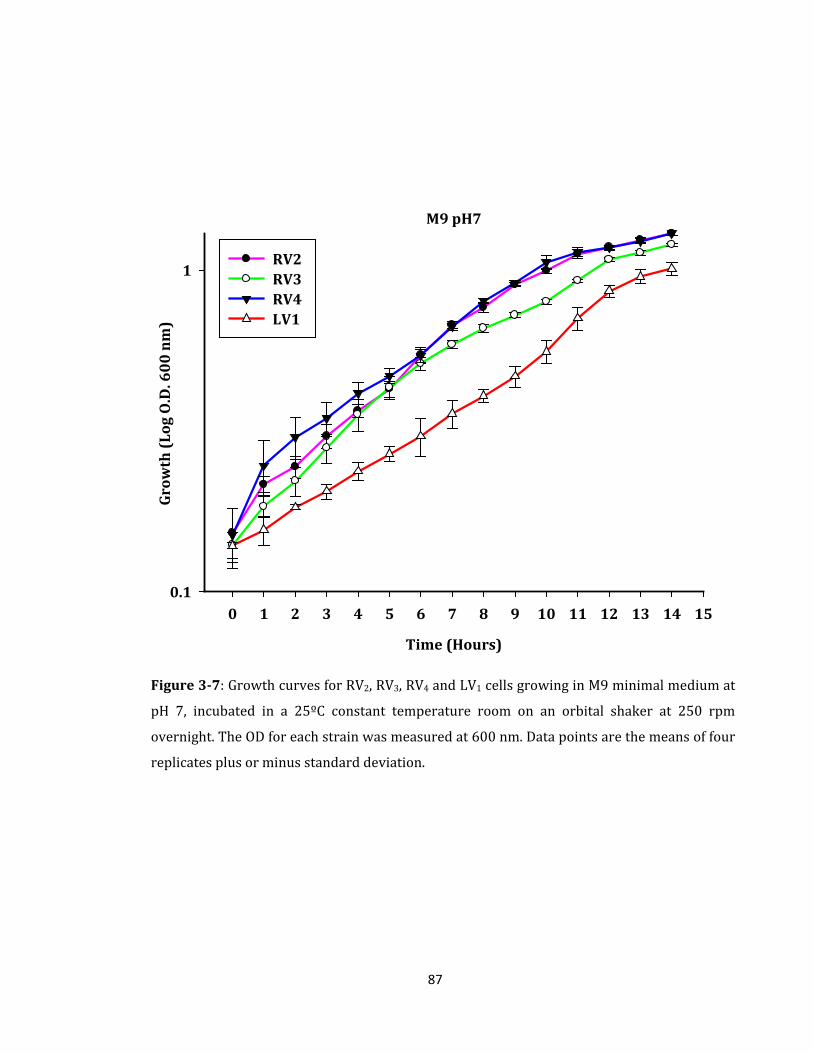
87
M9 pH7
Time (Hours)
0 1 2 3 4 5 6 7 8 9 10 11 12 13 14 15
Gro
wth
(Lo
g O
.D. 6
00
nm
)
0.1
1RV2 RV3 RV4 LV1
Figure 3-7: Growth curves for RV2, RV3, RV4 and LV1 cells growing in M9 minimal medium at
pH 7, incubated in a 25ºC constant temperature room on an orbital shaker at 250 rpm
overnight. The OD for each strain was measured at 600 nm. Data points are the means of four
replicates plus or minus standard deviation.
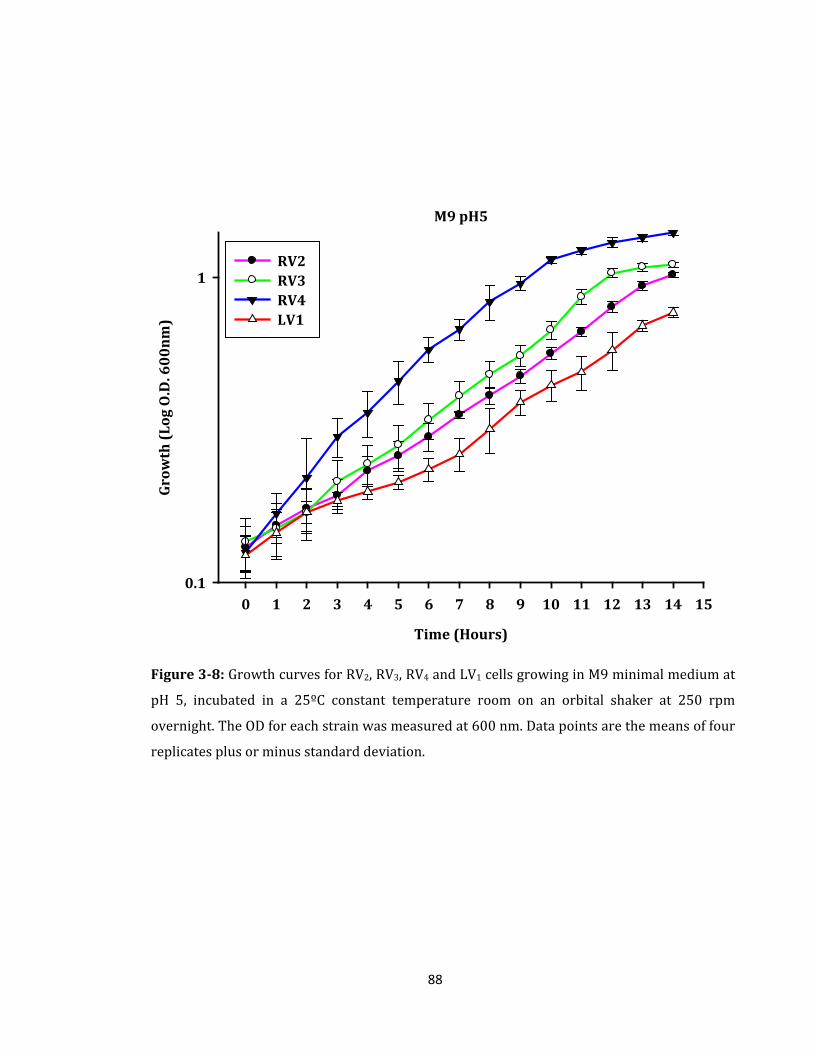
88
M9 pH5
Time (Hours)
0 1 2 3 4 5 6 7 8 9 10 11 12 13 14 15
Gro
wth
(Lo
g O
.D. 6
00
nm
)
0.1
1RV2 RV3 RV4 LV1
Figure 3-8: Growth curves for RV2, RV3, RV4 and LV1 cells growing in M9 minimal medium at
pH 5, incubated in a 25ºC constant temperature room on an orbital shaker at 250 rpm
overnight. The OD for each strain was measured at 600 nm. Data points are the means of four
replicates plus or minus standard deviation.
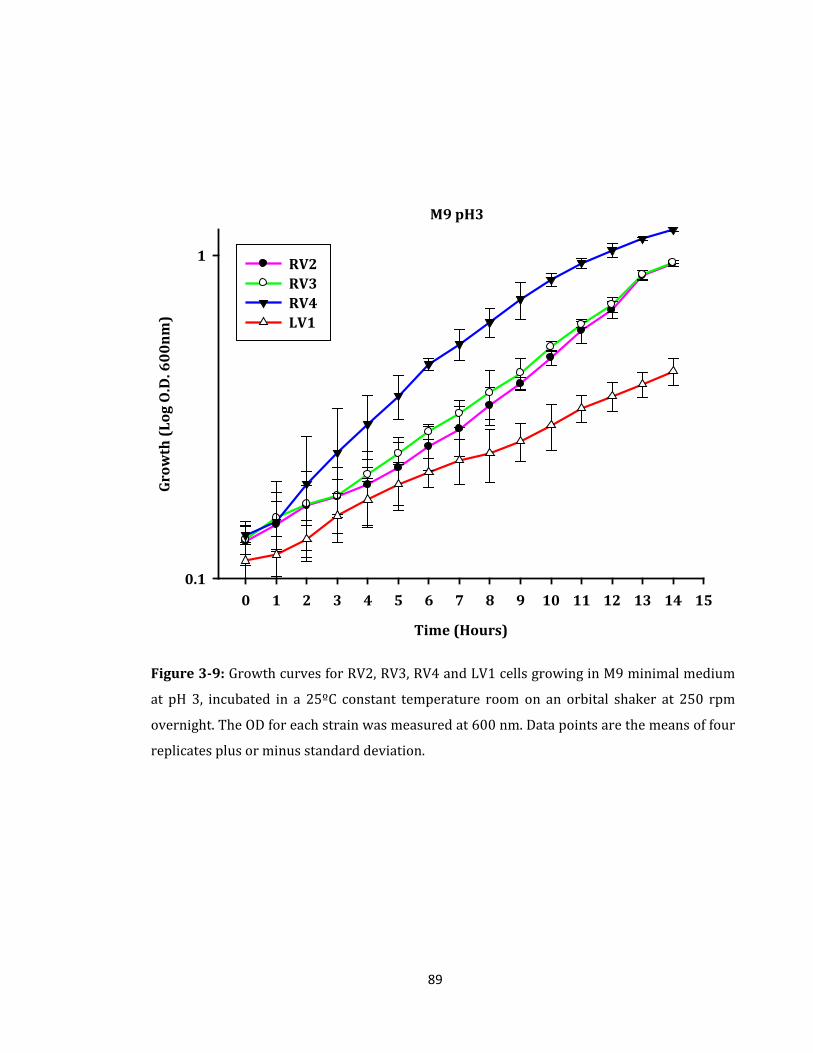
89
M9 pH3
Time (Hours)
0 1 2 3 4 5 6 7 8 9 10 11 12 13 14 15
Gro
wth
(Lo
g O
.D. 6
00
nm
)
0.1
1 RV2 RV3 RV4 LV1
Figure 3-9: Growth curves for RV2, RV3, RV4 and LV1 cells growing in M9 minimal medium
at pH 3, incubated in a 25ºC constant temperature room on an orbital shaker at 250 rpm
overnight. The OD for each strain was measured at 600 nm. Data points are the means of four
replicates plus or minus standard deviation.
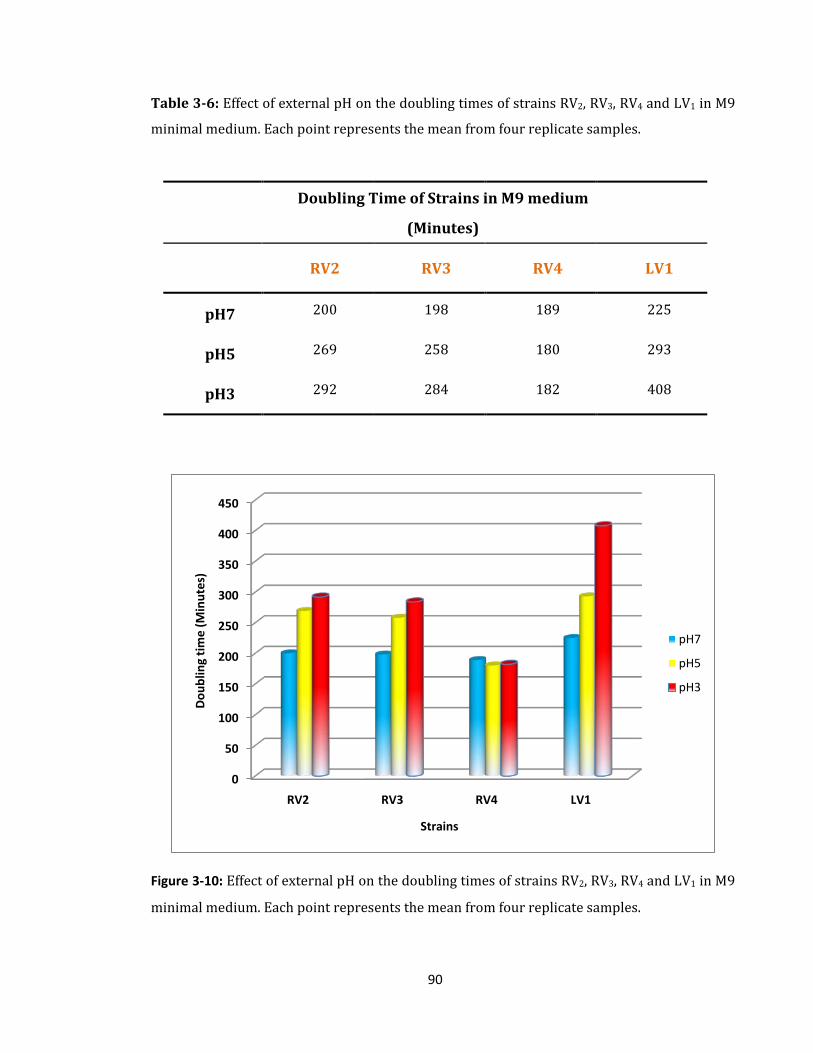
90
Table 3-6: Effect of external pH on the doubling times of strains RV2, RV3, RV4 and LV1 in M9
minimal medium. Each point represents the mean from four replicate samples.
Doubling Time of Strains in M9 medium
(Minutes)
RV2 RV3 RV4 LV1
pH7 200 198 189 225
pH5 269 258 180 293
pH3 292 284 182 408
Figure 3-10: Effect of external pH on the doubling times of strains RV2, RV3, RV4 and LV1 in M9
minimal medium. Each point represents the mean from four replicate samples.
0
50
100
150
200
250
300
350
400
450
RV2 RV3 RV4 LV1
Dou
blin
g ti
me
(Min
utes
)
Strains
pH7
pH5
pH3
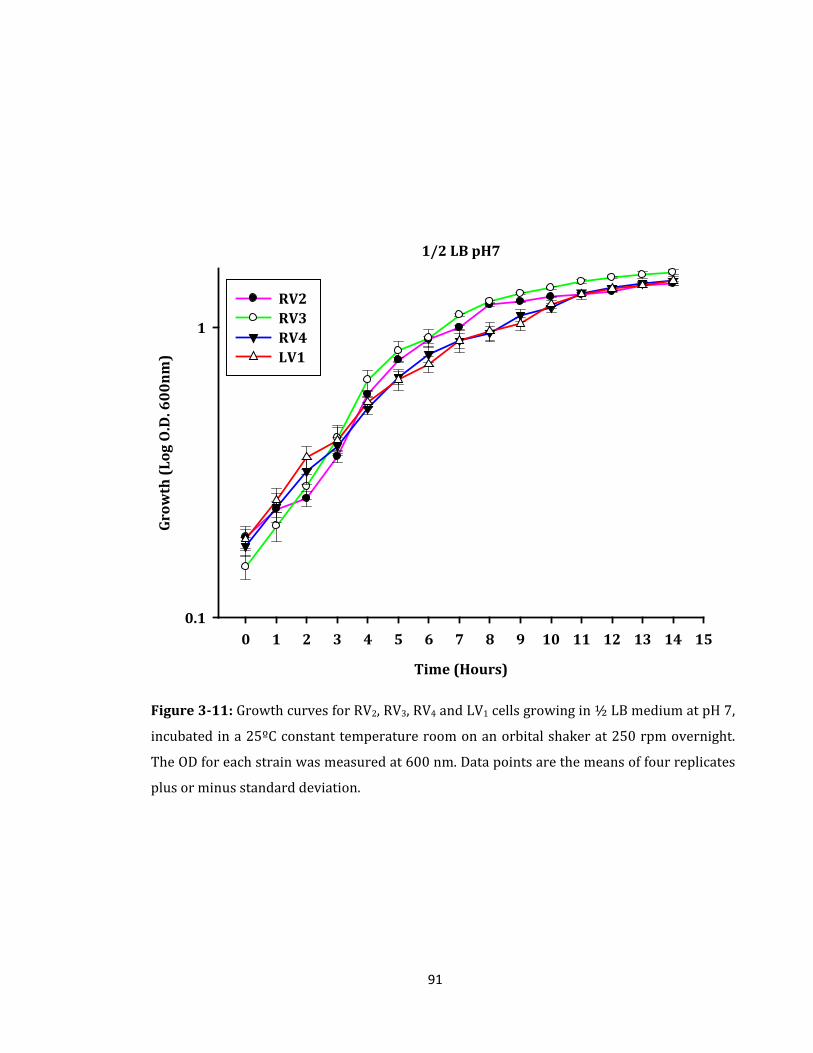
91
1/2 LB pH7
Time (Hours)
0 1 2 3 4 5 6 7 8 9 10 11 12 13 14 15
Gro
wth
(Lo
g O
.D. 6
00
nm
)
0.1
1
RV2 RV3 RV4 LV1
Figure 3-11: Growth curves for RV2, RV3, RV4 and LV1 cells growing in ½ LB medium at pH 7,
incubated in a 25ºC constant temperature room on an orbital shaker at 250 rpm overnight.
The OD for each strain was measured at 600 nm. Data points are the means of four replicates
plus or minus standard deviation.
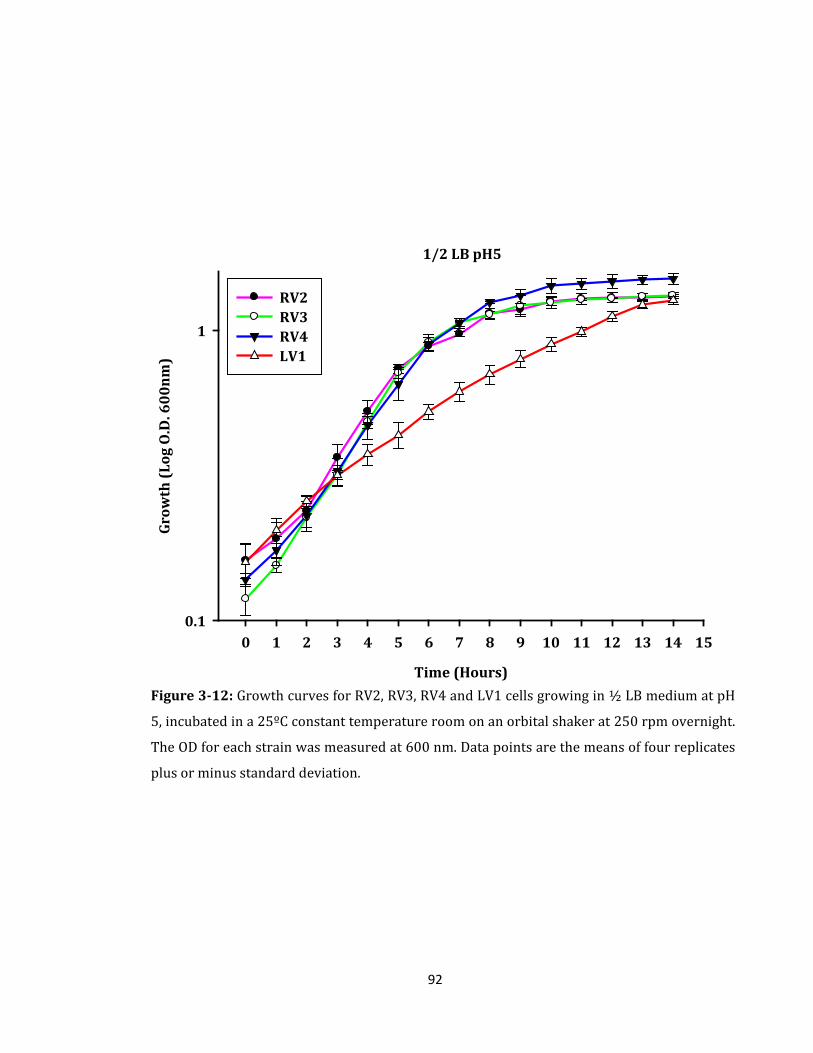
92
1/2 LB pH5
Time (Hours)
0 1 2 3 4 5 6 7 8 9 10 11 12 13 14 15
Gro
wth
(Lo
g O
.D. 6
00
nm
)
0.1
1
RV2 RV3 RV4 LV1
Figure 3-12: Growth curves for RV2, RV3, RV4 and LV1 cells growing in ½ LB medium at pH
5, incubated in a 25ºC constant temperature room on an orbital shaker at 250 rpm overnight.
The OD for each strain was measured at 600 nm. Data points are the means of four replicates
plus or minus standard deviation.
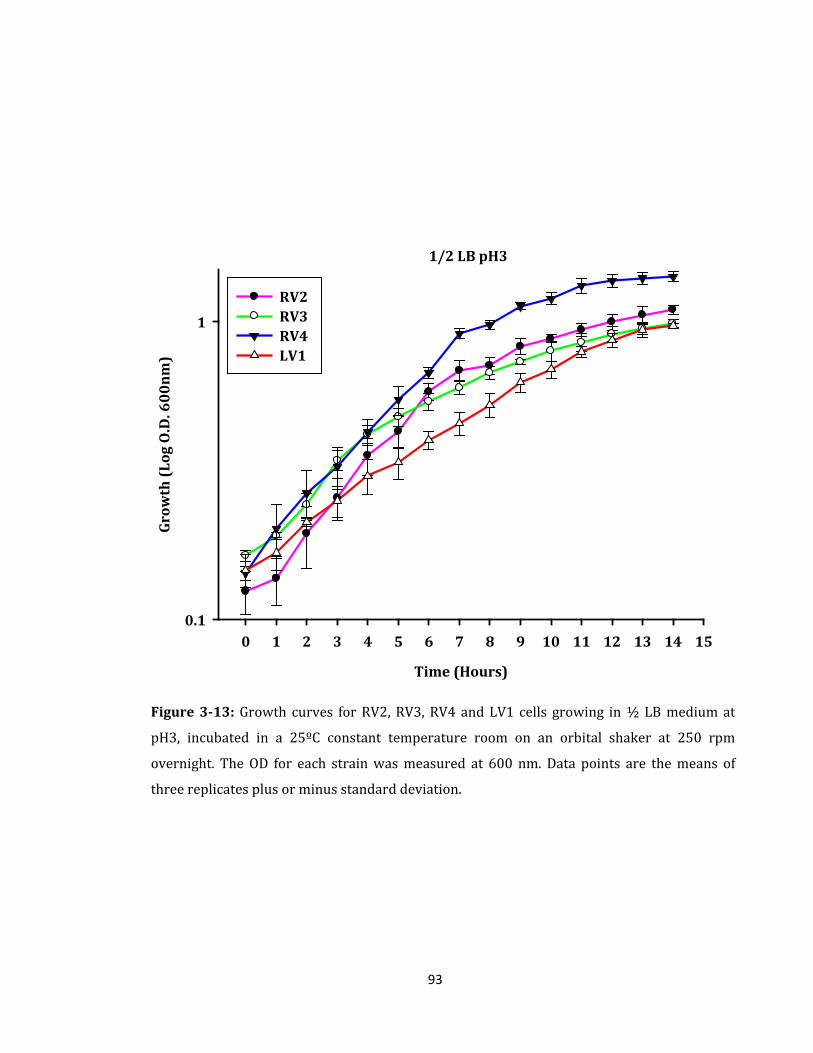
93
1/2 LB pH3
Time (Hours)
0 1 2 3 4 5 6 7 8 9 10 11 12 13 14 15
Gro
wth
(Lo
g O
.D. 6
00
nm
)
0.1
1
RV2 RV3 RV4 LV1
Figure 3-13: Growth curves for RV2, RV3, RV4 and LV1 cells growing in ½ LB medium at
pH3, incubated in a 25ºC constant temperature room on an orbital shaker at 250 rpm
overnight. The OD for each strain was measured at 600 nm. Data points are the means of
three replicates plus or minus standard deviation.
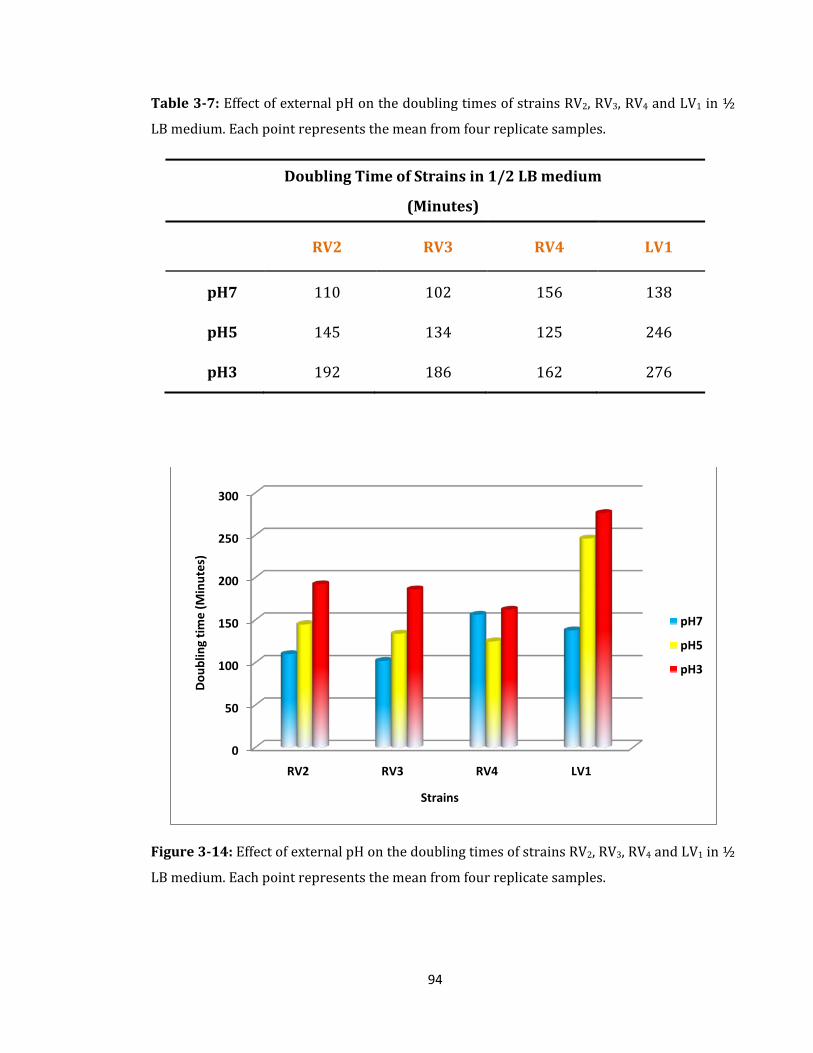
94
Table 3-7: Effect of external pH on the doubling times of strains RV2, RV3, RV4 and LV1 in ½
LB medium. Each point represents the mean from four replicate samples.
Doubling Time of Strains in 1/2 LB medium
(Minutes)
RV2 RV3 RV4 LV1
pH7 110 102 156 138
pH5 145 134 125 246
pH3 192 186 162 276
Figure 3-14: Effect of external pH on the doubling times of strains RV2, RV3, RV4 and LV1 in ½
LB medium. Each point represents the mean from four replicate samples.
0
50
100
150
200
250
300
RV2 RV3 RV4 LV1
Dou
blin
g ti
me
(Min
utes
)
Strains
pH7
pH5
pH3
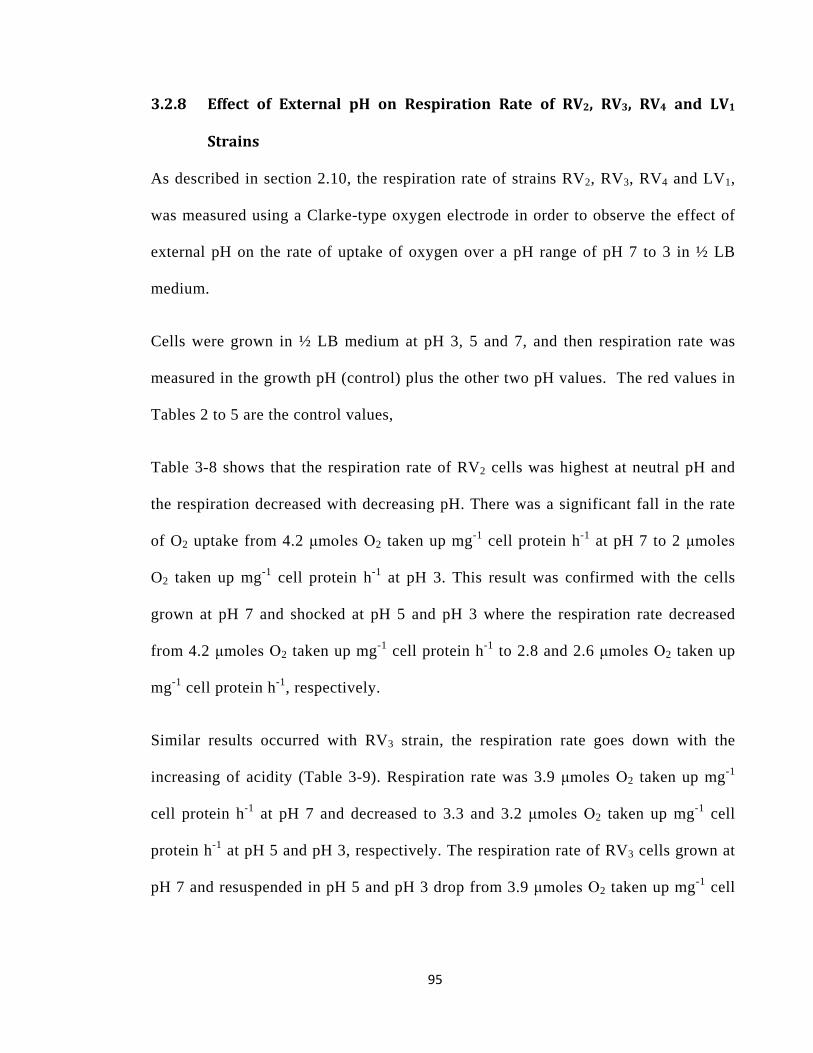
95
3.2.8 Effect of External pH on Respiration Rate of RV2, RV3, RV4 and LV1
Strains
As described in section 2.10, the respiration rate of strains RV2, RV3, RV4 and LV1,
was measured using a Clarke-type oxygen electrode in order to observe the effect of
external pH on the rate of uptake of oxygen over a pH range of pH 7 to 3 in ½ LB
medium.
Cells were grown in ½ LB medium at pH 3, 5 and 7, and then respiration rate was
measured in the growth pH (control) plus the other two pH values. The red values in
Tables 2 to 5 are the control values,
Table 3-8 shows that the respiration rate of RV2 cells was highest at neutral pH and
the respiration decreased with decreasing pH. There was a significant fall in the rate
of O2 uptake from 4.2 μmoles O2 taken up mg-1 cell protein h-1 at pH 7 to 2 μmoles
O2 taken up mg-1 cell protein h-1 at pH 3. This result was confirmed with the cells
grown at pH 7 and shocked at pH 5 and pH 3 where the respiration rate decreased
from 4.2 μmoles O2 taken up mg-1 cell protein h-1 to 2.8 and 2.6 μmoles O2 taken up
mg-1 cell protein h-1, respectively.
Similar results occurred with RV3 strain, the respiration rate goes down with the
increasing of acidity (Table 3-9). Respiration rate was 3.9 μmoles O2 taken up mg-1
cell protein h-1 at pH 7 and decreased to 3.3 and 3.2 μmoles O2 taken up mg-1 cell
protein h-1 at pH 5 and pH 3, respectively. The respiration rate of RV3 cells grown at
pH 7 and resuspended in pH 5 and pH 3 drop from 3.9 μmoles O2 taken up mg-1 cell
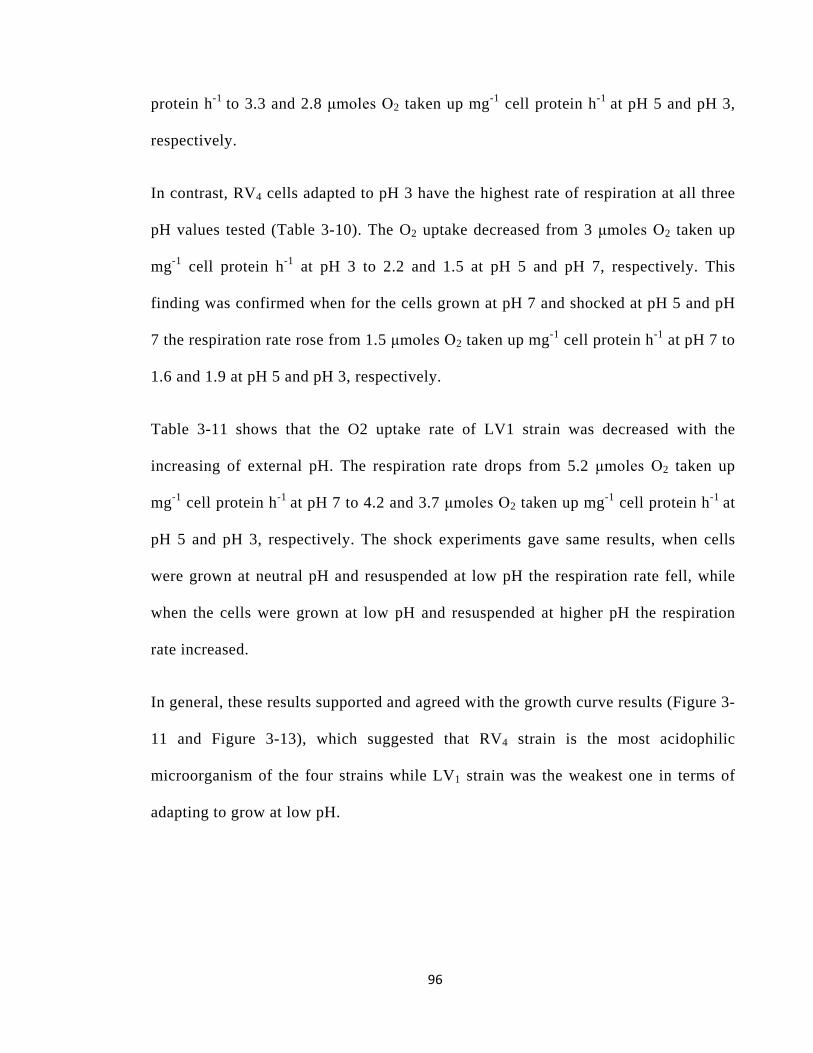
96
protein h-1 to 3.3 and 2.8 μmoles O2 taken up mg-1 cell protein h-1 at pH 5 and pH 3,
respectively.
In contrast, RV4 cells adapted to pH 3 have the highest rate of respiration at all three
pH values tested (Table 3-10). The O2 uptake decreased from 3 μmoles O2 taken up
mg-1 cell protein h-1 at pH 3 to 2.2 and 1.5 at pH 5 and pH 7, respectively. This
finding was confirmed when for the cells grown at pH 7 and shocked at pH 5 and pH
7 the respiration rate rose from 1.5 μmoles O2 taken up mg-1 cell protein h-1 at pH 7 to
1.6 and 1.9 at pH 5 and pH 3, respectively.
Table 3-11 shows that the O2 uptake rate of LV1 strain was decreased with the
increasing of external pH. The respiration rate drops from 5.2 μmoles O2 taken up
mg-1 cell protein h-1 at pH 7 to 4.2 and 3.7 μmoles O2 taken up mg-1 cell protein h-1 at
pH 5 and pH 3, respectively. The shock experiments gave same results, when cells
were grown at neutral pH and resuspended at low pH the respiration rate fell, while
when the cells were grown at low pH and resuspended at higher pH the respiration
rate increased.
In general, these results supported and agreed with the growth curve results (Figure 3-
11 and Figure 3-13), which suggested that RV4 strain is the most acidophilic
microorganism of the four strains while LV1 strain was the weakest one in terms of
adapting to grow at low pH.
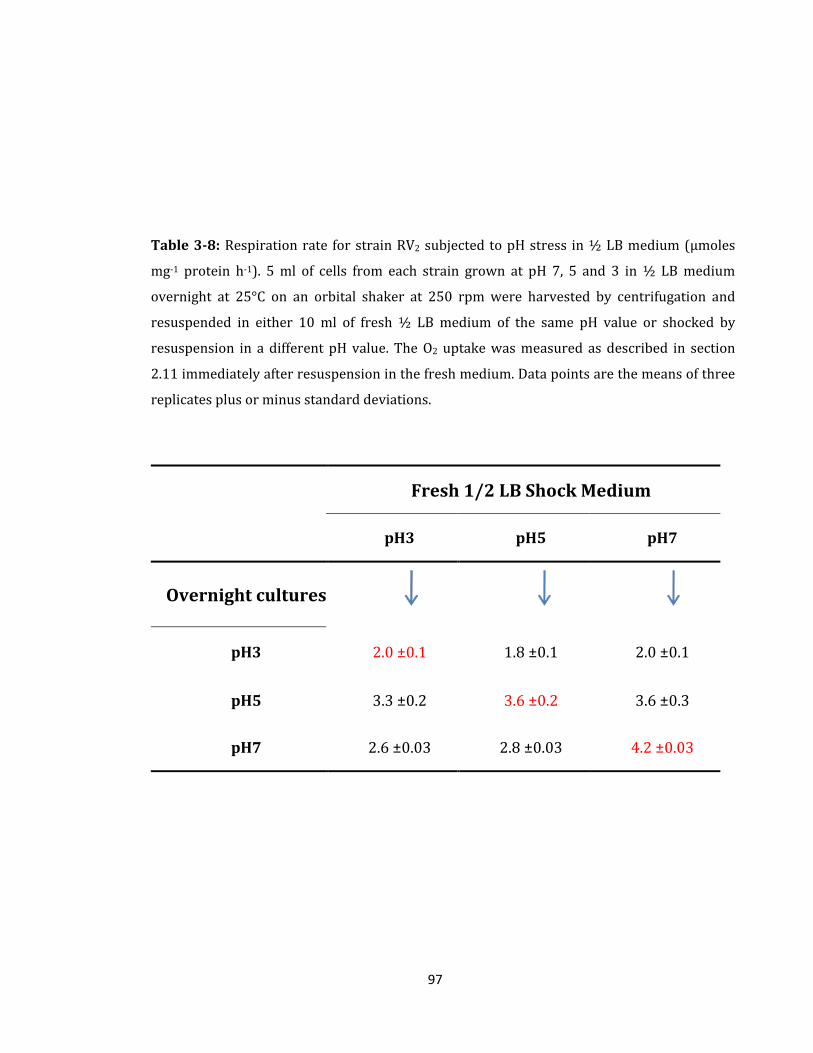
97
Table 3-8: Respiration rate for strain RV2 subjected to pH stress in ½ LB medium (µmoles
mg-1 protein h-1). 5 ml of cells from each strain grown at pH 7, 5 and 3 in ½ LB medium
overnight at 25°C on an orbital shaker at 250 rpm were harvested by centrifugation and
resuspended in either 10 ml of fresh ½ LB medium of the same pH value or shocked by
resuspension in a different pH value. The O2 uptake was measured as described in section
2.11 immediately after resuspension in the fresh medium. Data points are the means of three
replicates plus or minus standard deviations.
Fresh 1/2 LB Shock Medium
pH3 pH5 pH7
Overnight cultures
pH3 2.0 ±0.1 1.8 ±0.1 2.0 ±0.1
pH5 3.3 ±0.2 3.6 ±0.2 3.6 ±0.3
pH7 2.6 ±0.03 2.8 ±0.03 4.2 ±0.03
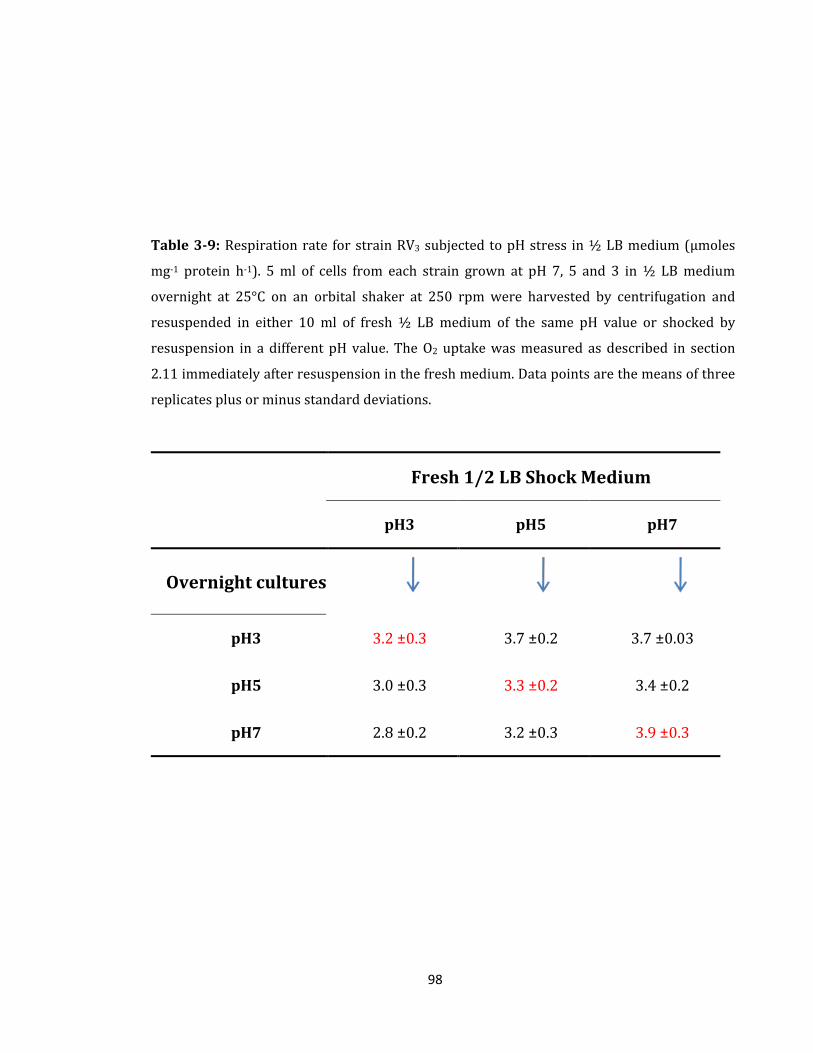
98
Table 3-9: Respiration rate for strain RV3 subjected to pH stress in ½ LB medium (µmoles
mg-1 protein h-1). 5 ml of cells from each strain grown at pH 7, 5 and 3 in ½ LB medium
overnight at 25°C on an orbital shaker at 250 rpm were harvested by centrifugation and
resuspended in either 10 ml of fresh ½ LB medium of the same pH value or shocked by
resuspension in a different pH value. The O2 uptake was measured as described in section
2.11 immediately after resuspension in the fresh medium. Data points are the means of three
replicates plus or minus standard deviations.
Fresh 1/2 LB Shock Medium
pH3 pH5 pH7
Overnight cultures
pH3 3.2 ±0.3 3.7 ±0.2 3.7 ±0.03
pH5 3.0 ±0.3 3.3 ±0.2 3.4 ±0.2
pH7 2.8 ±0.2 3.2 ±0.3 3.9 ±0.3
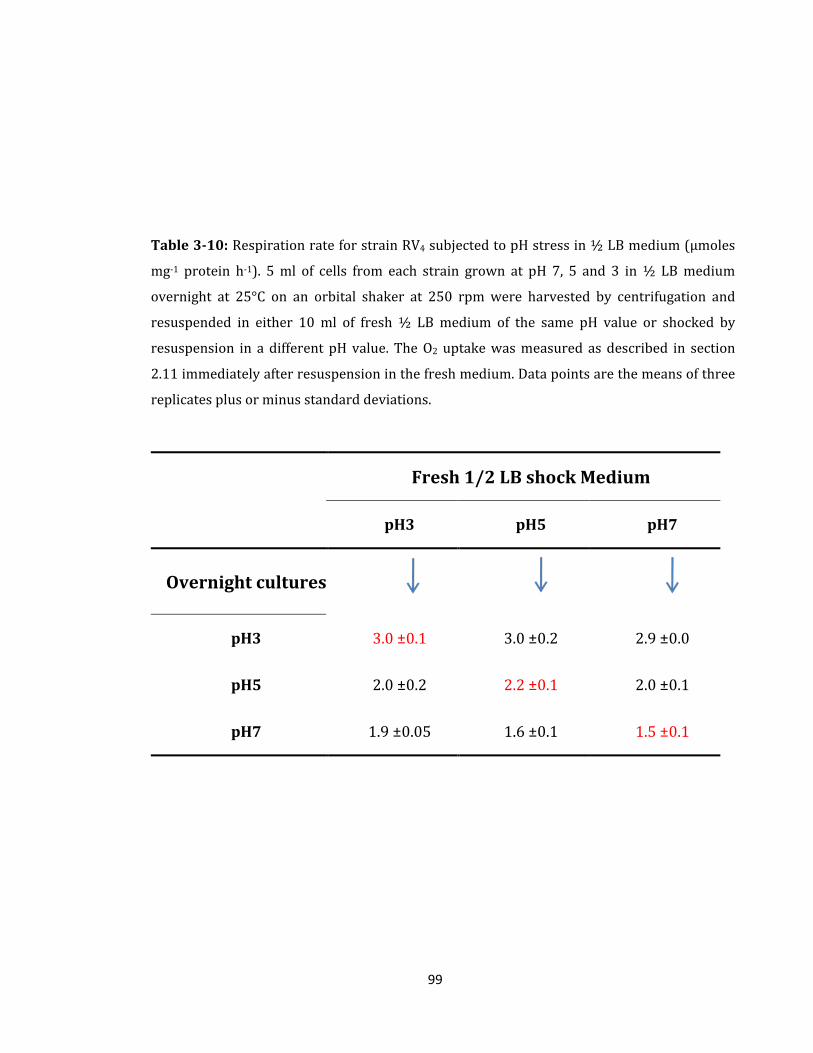
99
Table 3-10: Respiration rate for strain RV4 subjected to pH stress in ½ LB medium (µmoles
mg-1 protein h-1). 5 ml of cells from each strain grown at pH 7, 5 and 3 in ½ LB medium
overnight at 25°C on an orbital shaker at 250 rpm were harvested by centrifugation and
resuspended in either 10 ml of fresh ½ LB medium of the same pH value or shocked by
resuspension in a different pH value. The O2 uptake was measured as described in section
2.11 immediately after resuspension in the fresh medium. Data points are the means of three
replicates plus or minus standard deviations.
Fresh 1/2 LB shock Medium
pH3 pH5 pH7
Overnight cultures
pH3 3.0 ±0.1 3.0 ±0.2 2.9 ±0.0
pH5 2.0 ±0.2 2.2 ±0.1 2.0 ±0.1
pH7 1.9 ±0.05 1.6 ±0.1 1.5 ±0.1
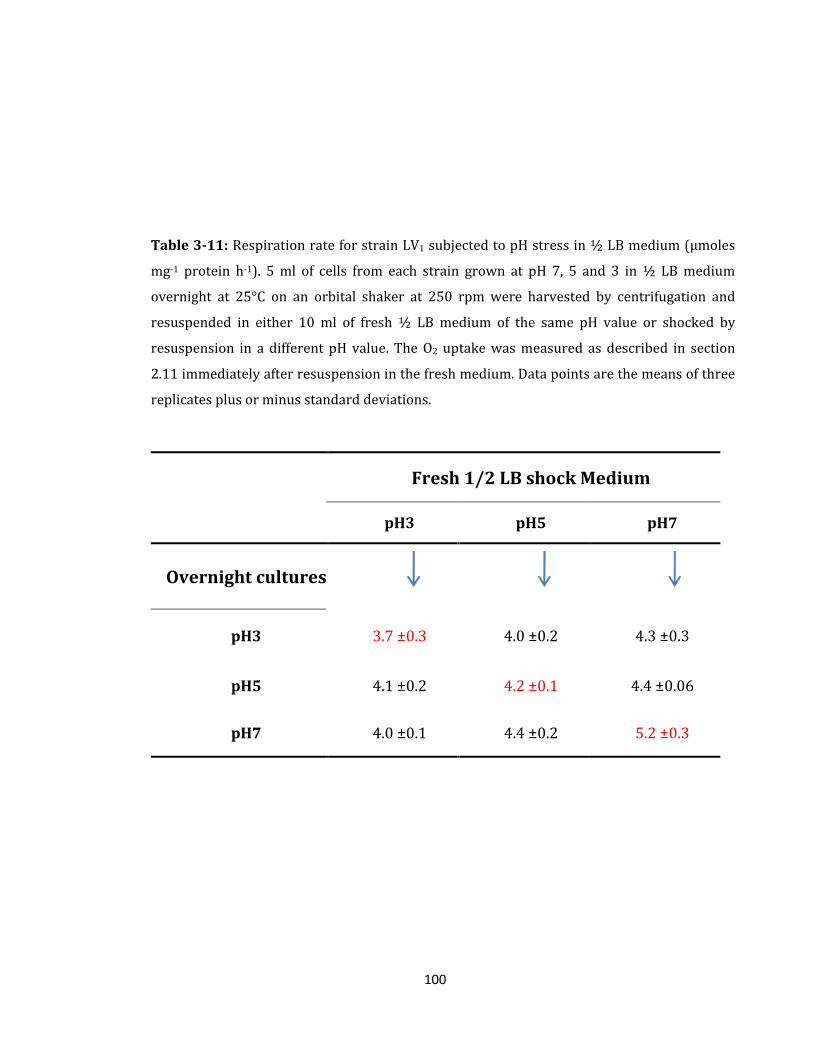
100
Table 3-11: Respiration rate for strain LV1 subjected to pH stress in ½ LB medium (µmoles
mg-1 protein h-1). 5 ml of cells from each strain grown at pH 7, 5 and 3 in ½ LB medium
overnight at 25°C on an orbital shaker at 250 rpm were harvested by centrifugation and
resuspended in either 10 ml of fresh ½ LB medium of the same pH value or shocked by
resuspension in a different pH value. The O2 uptake was measured as described in section
2.11 immediately after resuspension in the fresh medium. Data points are the means of three
replicates plus or minus standard deviations.
Fresh 1/2 LB shock Medium
pH3 pH5 pH7
Overnight cultures
pH3 3.7 ±0.3 4.0 ±0.2 4.3 ±0.3
pH5 4.1 ±0.2 4.2 ±0.1 4.4 ±0.06
pH7 4.0 ±0.1 4.4 ±0.2 5.2 ±0.3
101
3.2.9 Effect of High Salinity on the Overnight Growth of RV2, RV3, RV4 and LV1
Strains in ½ LB Medium at Different pH Values
In order to investigate the range of salinities that the isolated strains can tolerate, cells
of each strain were repeatedly sub-cultured in ½ LB medium containing higher levels
of NaCl at different pH values 7, 5 and 3on an incremental basis. Initially, all strains
were adapted to grow in 0.4, 1 and 1.5 M NaCl, then 2, 2.5 and 3 M NaCl over a
period of several weeks.
Figure 3-15 shows the effect of different concentrations of sodium chloride on the
growth of all isolated strains in ½ LB medium at pH 7. The results indicate that RV4
and LV1 strains seem to be halophiles or at least halotolerant microorganisms, both
strains were able to grow with optimally at 0.4 to 1.0 M NaCl respectively, but when
the NaCl concentration was increasing up to 1.5 M there was an inhibitory effect and
the growth of both strains was significantly slower at 2 M NaCl. Similar results were
found for RV4 and LV1 at pH 5 and pH 3 as shown in Figure 3-16 and Figure 3-17
showing clearly that both strains were capable of tolerating high salinity
concentrations.
On the other hand, Figure 3-15 shows that RV2 and RV3 strains were able to grow
optimally at 0.1 M NaCl. Growth was similar to growth in control ½ LB medium at
pH 7 which contains 50 mM NaCl. Increasing the concentration of NaCl to more than
0.4 M NaCl significantly reduced the growth rate of both strains and there was no
growth above 1 M NaCl. Furthermore, when pH was decreased to pH 5 and pH 3 both
strains barely grew when salinity reached 0.4 M NaCl and there was no growth at
salinities above this level as shown in Figure 3-16 and Figure 3-17. So, these results
suggested that RV2 and RV3 strains cells could not tolerate more than 0.4 M NaCl.
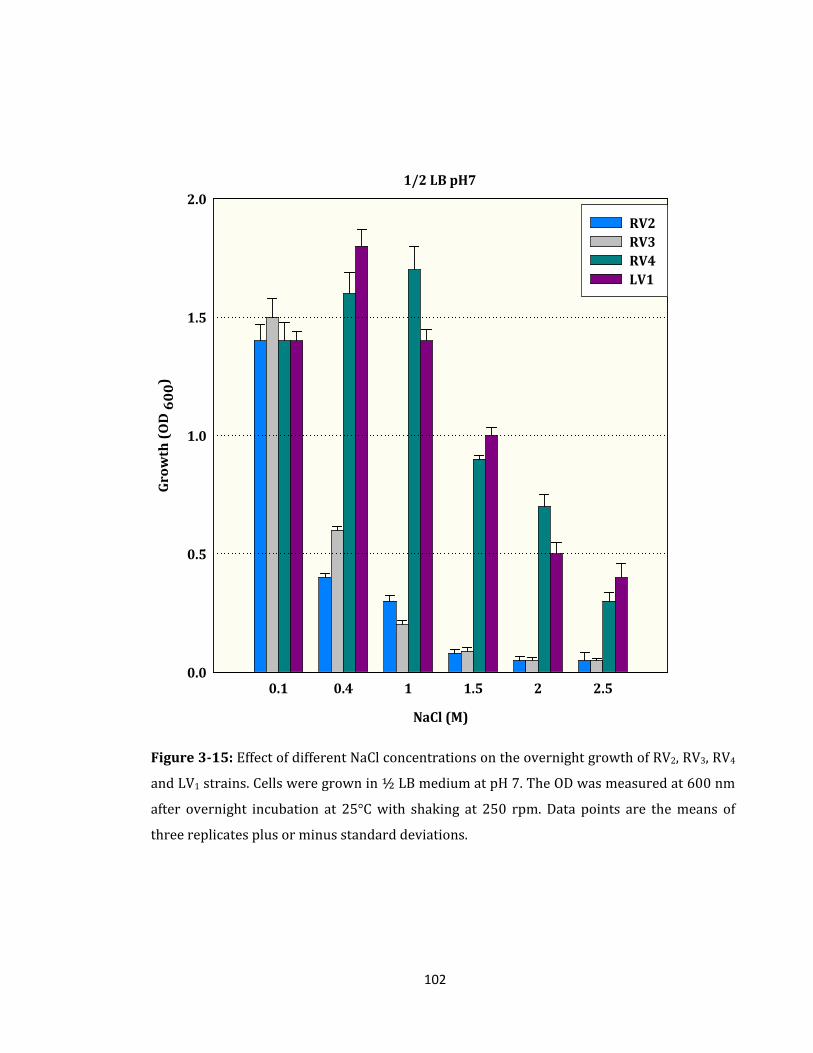
102
1/2 LB pH7
NaCl (M)
0.1 0.4 1 1.5 2 2.5
Gro
wth
(O
D 6
00
)
0.0
0.5
1.0
1.5
2.0
RV2 RV3 RV4 LV1
Figure 3-15: Effect of different NaCl concentrations on the overnight growth of RV2, RV3, RV4
and LV1 strains. Cells were grown in ½ LB medium at pH 7. The OD was measured at 600 nm
after overnight incubation at 25°C with shaking at 250 rpm. Data points are the means of
three replicates plus or minus standard deviations.
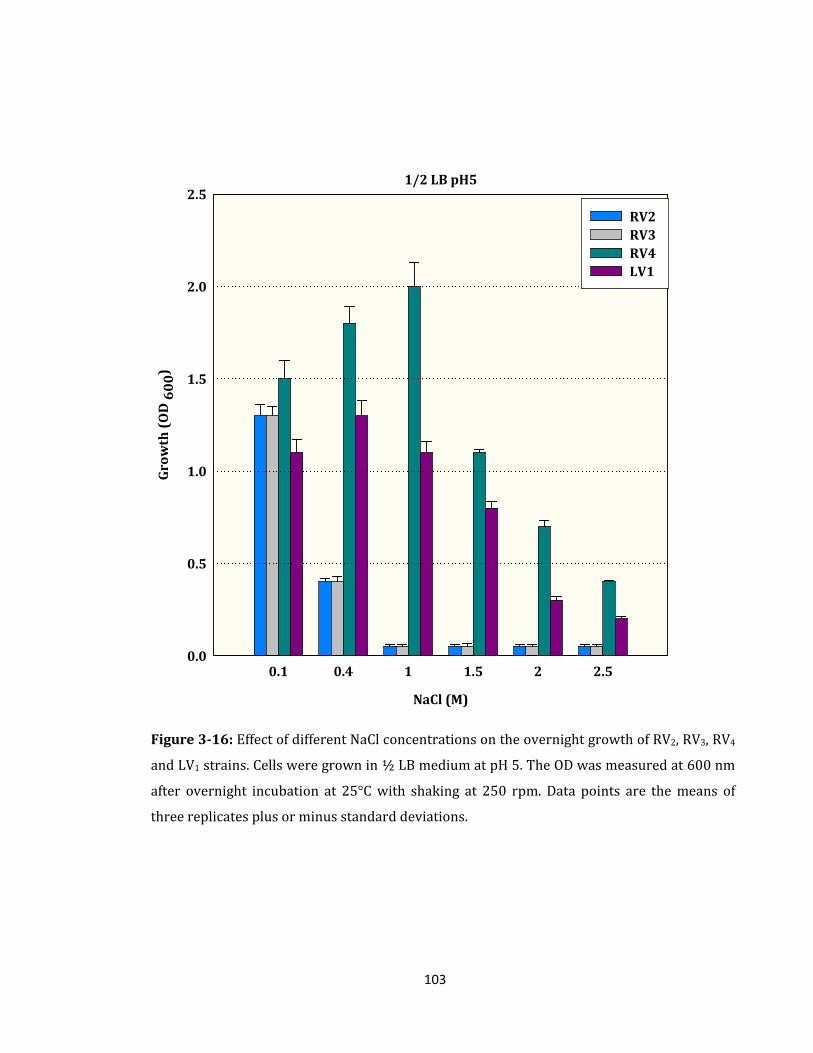
103
1/2 LB pH5
NaCl (M)
0.1 0.4 1 1.5 2 2.5
Gro
wth
(O
D 6
00
)
0.0
0.5
1.0
1.5
2.0
2.5
RV2 RV3 RV4 LV1
Figure 3-16: Effect of different NaCl concentrations on the overnight growth of RV2, RV3, RV4
and LV1 strains. Cells were grown in ½ LB medium at pH 5. The OD was measured at 600 nm
after overnight incubation at 25°C with shaking at 250 rpm. Data points are the means of
three replicates plus or minus standard deviations.
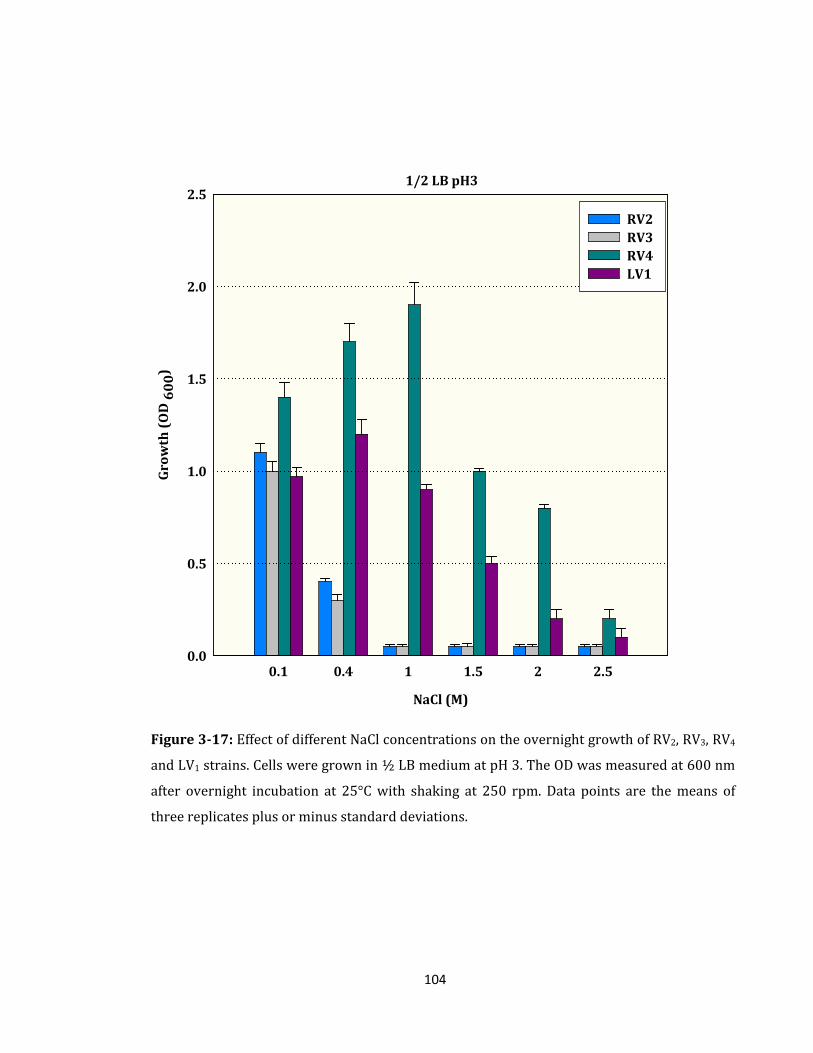
104
1/2 LB pH3
NaCl (M)
0.1 0.4 1 1.5 2 2.5
Gro
wth
(O
D 6
00
)
0.0
0.5
1.0
1.5
2.0
2.5
RV2 RV3 RV4 LV1
Figure 3-17: Effect of different NaCl concentrations on the overnight growth of RV2, RV3, RV4
and LV1 strains. Cells were grown in ½ LB medium at pH 3. The OD was measured at 600 nm
after overnight incubation at 25°C with shaking at 250 rpm. Data points are the means of
three replicates plus or minus standard deviations.
105
3.2.10 Measurement of External pH of Overnight Cultures of RV2, RV3, RV4 and
LV1 strains
As described in section 2.12 the external pH of overnight cultures of all strains was
measured in order to investigate the ability of the strains to alter the external pH of
M9 and ½ LB media set to pH values 7, 5 and 3.
Table 3-12 illustrated that all four strains did not made any significant changes to the
external pH in M9 medium, except RV4 strain where the pH was reduced from 5 to
3.65. In contrast when RV2, RV3, and RV4 were grown in ½ LB medium at pH 3 their
cells increased the pH to 7.7, 6.5, and 6.8 respectively, while only a slight increase
from pH 3 to pH 4.3 happened with LV1 strain possibly due to the weaker growth of
LV1 at pH 3 (Table 3-13).
Large changes of external pH also occurred when strains were cultured in ½ LB
medium at pH 5 and pH 7, all strains increased the pH values as shown in Table 3-13.
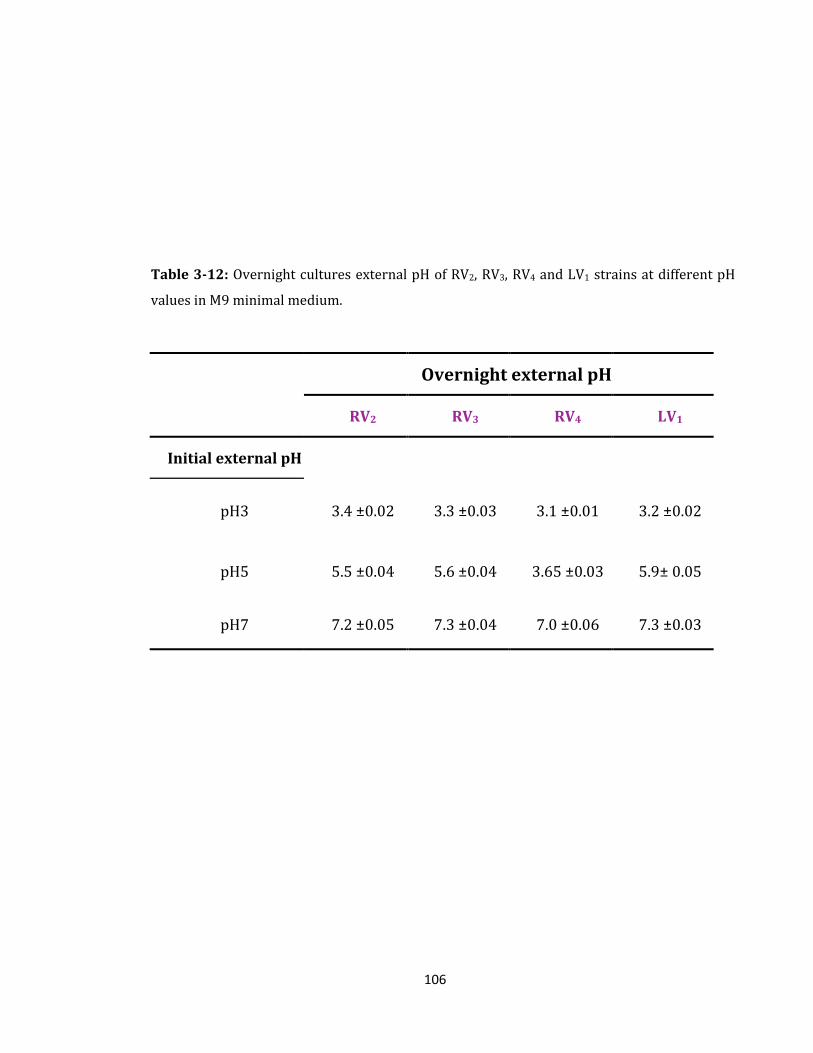
106
Table 3-12: Overnight cultures external pH of RV2, RV3, RV4 and LV1 strains at different pH
values in M9 minimal medium.
Overnight external pH
RV2 RV3 RV4 LV1
Initial external pH
pH3 3.4 ±0.02 3.3 ±0.03 3.1 ±0.01 3.2 ±0.02
pH5 5.5 ±0.04 5.6 ±0.04 3.65 ±0.03 5.9± 0.05
pH7 7.2 ±0.05 7.3 ±0.04 7.0 ±0.06 7.3 ±0.03
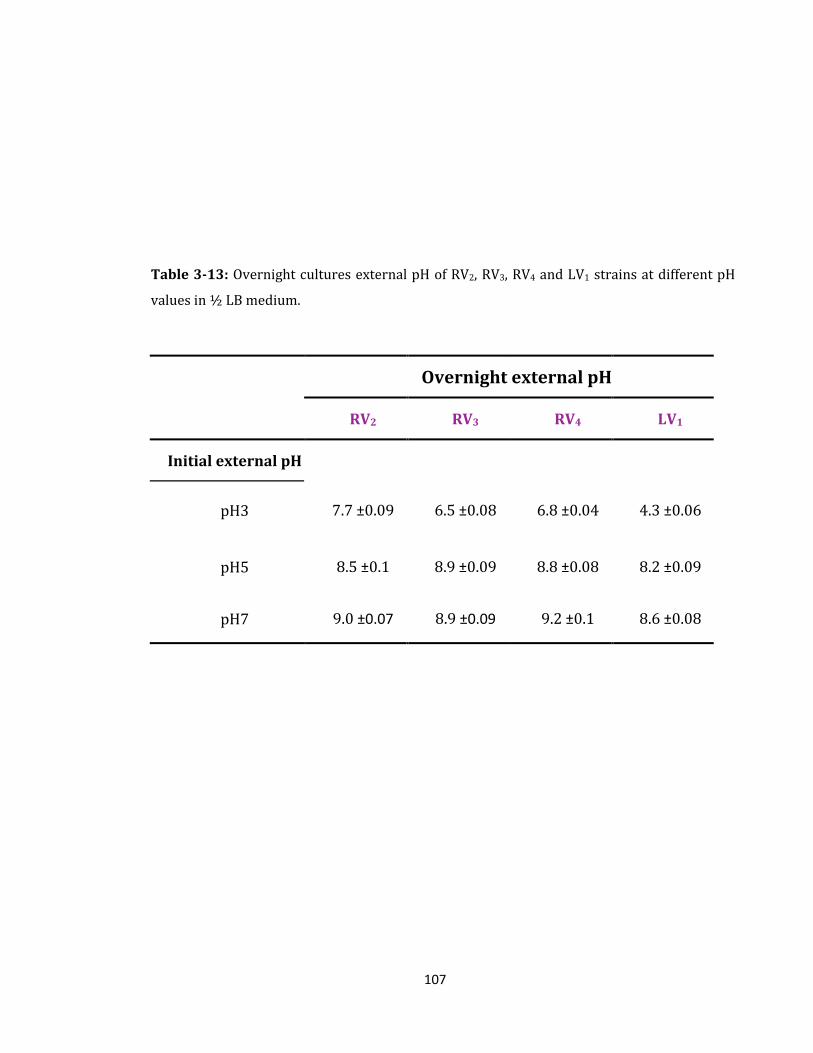
107
Table 3-13: Overnight cultures external pH of RV2, RV3, RV4 and LV1 strains at different pH
values in ½ LB medium.
Overnight external pH
RV2 RV3 RV4 LV1
Initial external pH
pH3 7.7 ±0.09 6.5 ±0.08 6.8 ±0.04 4.3 ±0.06
pH5 8.5 ±0.1 8.9 ±0.09 8.8 ±0.08 8.2 ±0.09
pH7 9.0 ±0.07 8.9 ±0.09 9.2 ±0.1 8.6 ±0.08
108
3.3 Conclusions
Various samples of sediment and liquid were collected from Rivelin and Limb
Valleys in Sheffield and minimal and half enrichment cultures were set up at pH 3,
pH 5 and pH 7 in M9 and ½ LB medium at 25ºC to grow and isolate acidophilic or
acid tolerant microorganisms. Four strains (RV2, RV3, RV4 and LV1) were chosen for
further studies due to their good growth at different pH values of pH 7, 5 and 3, and
also RV4 and LV1 were chosen for further studies due to their ability to grow at high
salinities.
Two prokaryotic strains RV3 and LV1 were successfully isolated and shown to be
Gram-positive, aerobic microorganisms. RV3 strain was motile while LV1 strain was
non-motile. Moreover, the other two strains isolated from the Rivelin Valley samples
(RV2 and RV4) were eukaryotic microorganisms and characterised as yeast strains.
Both strains were able to ferment glucose and could not grow in the presence of
cycloheximide. RV2 strain was found to assimilate nitrate while RV4 could not. On
the other hand, RV4 strain was able to assimilate α-methyl glucoside and cadaverine
while RV2 strain could not.
At an early stage in the adaptation process, LV1 strain did not grow at pH 3 in M9
medium, while RV2, RV3 and RV4 showed a good growth at all pH values in M9
minimal medium. However, RV4 strain was the best strain in terms of producing the
best growth at pH 5 and pH 3 in both media. LV1 strain showed the lowest growth at
low pH, particularly in M9 medium, and it should be noted that repeated sub-
109
culturing for several weeks was required to allow LV1 strain to adapt and grow at pH
3 in both media.
The impact of different external pH values on the respiration rates of the four strains
was also measured. RV2, RV3 and LV1 strains showed their highest respiration rates
at pH 7, while RV4 showed its highest respiration rate at pH 3. The respiration results
showed broad agreement with growth curve results. So, on the basis of these
characteristics, the RV4 strain was classified as aerobic acidophilic yeast and was
selected for further study.
The tolerance of the strains to different salinities was examined, and the results
indicated that RV4 and LV1 strains were able to grow at high salinities up to 2.5 M
NaCl in M9 minimal and ½ LB medium.
To conclude, it was decided to further investigate the bioenergetics of the growth of
RV4 strain at pH 3 including the determination of membrane potential, and internal
pH (Chapter 6). Furthermore, it was decided that further physiological work was
required to investigate the metabolic processes that allow RV4 and LV1 strains to
adapt and grow at high salinity (Chapter 5).
However, first of all in the next chapter, the four strains will be identified using
molecular identification techniques, including DNA extraction, PCR amplification
and purification of 16S rRNA gene for bacteria strains and 18S rRNA gene for yeast
strains.

110
CCHHAAPPTTEERR FFOOUURR
111
4 Molecular Identification of RV2, RV3, RV4 and
LV1 Strains
4.1 Introduction
Using phenotypic information as the only method to identify species in
microbiology is no longer recommended, but this information is helpful for initial
description of unknown strains. Therefore, traditional microbiology methods which
have been used use to classify organisms depending on phenotypic characters such
as morphology, physiology, and metabolism are being supplemented by genotypic
analysis (Scow et al., 2001).
Since the discovery of the polymerase chain reaction (PCR), molecular methods are
much more reliable for relating and classifying organisms than phenotypic
information, because they are more informative with regard to evolutionary
relationships and they are also now more readily available (Woese, 1987, Lexa et
al., 2001, Fenollar et al., 2006, Yeung et al., 2009)
Ribosomal RNA (rRNA) is the most commonly used molecular marker for several
reasons. Firstly and most importantly, it is present in all organisms and has been for
a very long time (Olsen et al., 1986). The overall structure of rRNA is well
conserved between all organisms which means that it is easy to identify rRNA by
size alone (Olsen et al., 1986, Woo et al., 2000). rRNA molecules are a necessary
element of one of the most basic cellular functions, protein synthesis, and thus,
form a significant proportion of cellular mass, therefore rRNA is readily
recoverable from all cell types (Olsen et al., 1986). In addition, it is possible to
112
sequence rRNA directly and rapidly using reverse transcriptase (Woese, 1987,
Hugenholtz and Pace, 1996). 16S rRNA gene sequence is also chosen because it
contains regions of conserved, variable and hyper variable sequence. For example,
archaeal 16S rRNA molecules are easily identified from bacterial 16S rRNA or
eukaryal 18S rRNA by their unique structure between positions 180 and 197
(Woese et al., 1990, Johnson et al., 2001, Ma et al., 2004). In addition, 16S rRNA
molecules are large (approximately 13 times larger than 5S rRNA) and consist of
many domains which also facilitate their use as molecular markers and contain
sufficient information for identification and phylogenetic analyses of organisms
(Woese et al., 1990, Drancourt et al., 2000, Patel, 2001).
In this chapter, RV3 and LV1 bacterial strains, isolated from Rivelin and Limb
valleys respectively, were identified to the genus level by the use of 16S rRNA
gene sequencing. The 16S rRNA gene was amplified using bacterial primers by the
polymerase chain reaction (PCR) technique. PCR products were ligated into the
cloning vector pCR2.1 and then transferred into E. coli competent cells. The
plasmid was then isolated and the 16S rRNA gene sequenced as described in
section 2.21.5. The sequences from RV3 and LV1 were compared with known 16S
rRNA gene sequences using the NCBI Blast function. Phylogenetic trees were also
constructed for both strains to predict their genetic relatedness to known strains in
the database.
The yeast strains RV2 and RV4, after many unsuccessful attempts to extract their
genomic DNA using many different methods such as chemical CTAB protocol,
QIAgen Genomic Kit and Anachem Key Prep kits, were sent to The National
113
Collection of Industrial, Marine and Food Bacteria (NCIMB) for 16S rDNA
sequencing and their identification was achieved by using the MicroSeq database
and the EMBL public database.
4.2 Results and Discussion
4.2.1 Bacterial Strains
4.2.1.1 Extraction of Genomic DNA
High molecular weight genomic DNA was extracted from the bacterial strains as
described in section 2.12. RV3 and LV1 cultures were grown overnight on ½ LB
medium at pH 3 to produce the biomass required for DNA extraction. The DNA
extraction process normally involves cell breakage by digesting cell wall,
centrifugation to remove the cell fragments and debris and then nucleic acid
precipitation and purification.
Figure 4-1 shows that genomic DNA was successfully extracted from RV3 strain
(lanes 2 and 3) and LV1 strain (lanes 6 and 7) using Anachem Key Prep Genomic
DNA kit. In addition, the figure shows the purity of DNA and the efficiency of the
Anachem Key Prep kit in removing polysaccharides, proteins and any other
contaminating molecules. Also from this result it can be noted the high molecular
weight DNA is free from RNA contamination to allow the amplification of 16S
rRNA gene using PCR technique.
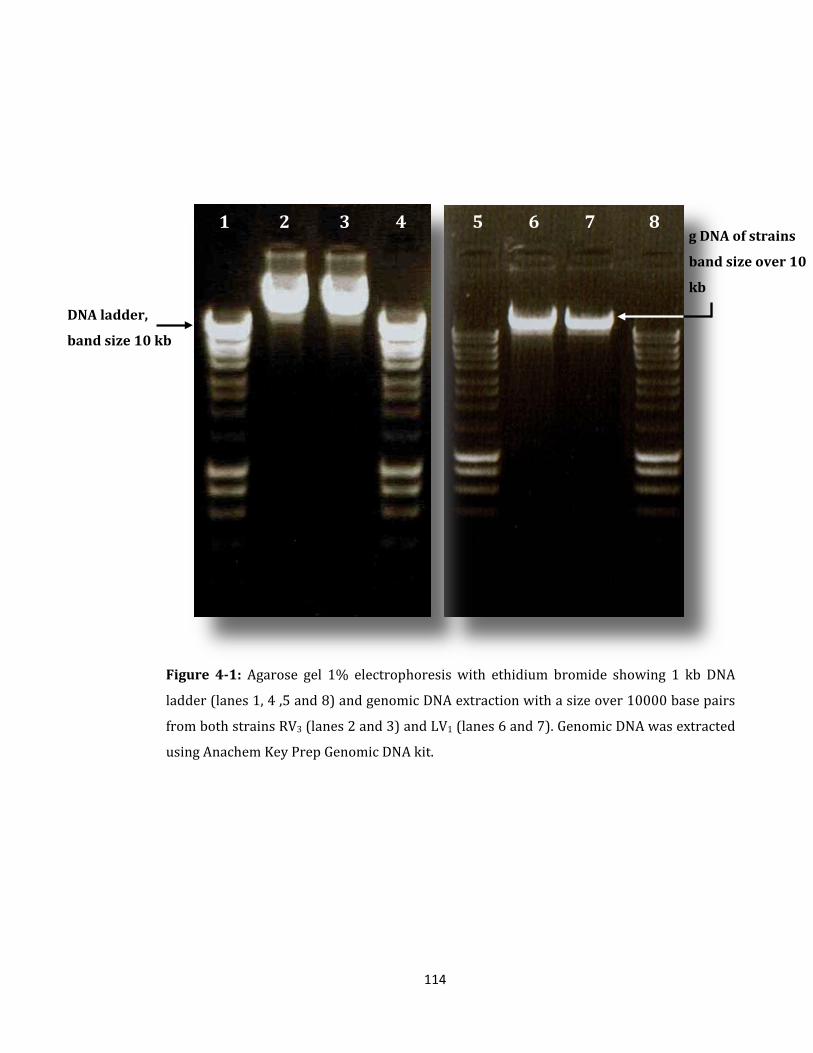
114
Figure 4-1: Agarose gel 1% electrophoresis with ethidium bromide showing 1 kb DNA
ladder (lanes 1, 4 ,5 and 8) and genomic DNA extraction with a size over 10000 base pairs
from both strains RV3 (lanes 2 and 3) and LV1 (lanes 6 and 7). Genomic DNA was extracted
using Anachem Key Prep Genomic DNA kit.
1 2 3 4 5 6 7 8
DNA ladder,
band size 10 kb
g DNA of strains
band size over 10
kb
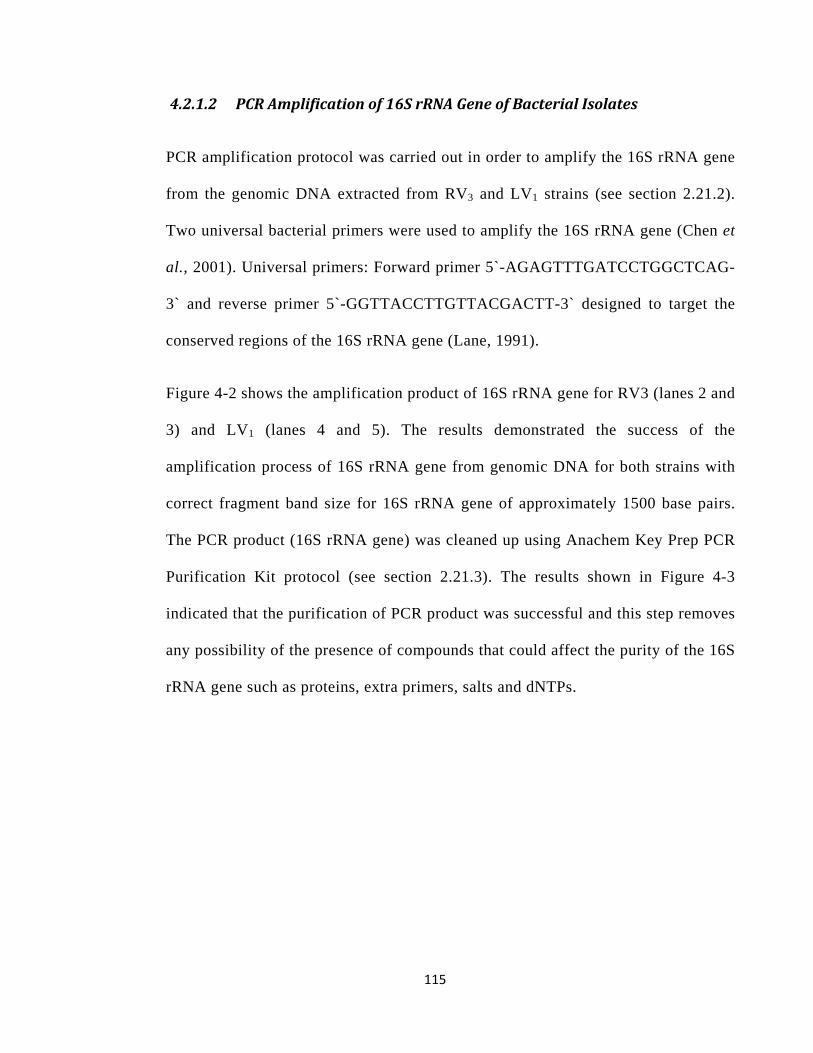
115
4.2.1.2 PCR Amplification of 16S rRNA Gene of Bacterial Isolates
PCR amplification protocol was carried out in order to amplify the 16S rRNA gene
from the genomic DNA extracted from RV3 and LV1 strains (see section 2.21.2).
Two universal bacterial primers were used to amplify the 16S rRNA gene (Chen et
al., 2001). Universal primers: Forward primer 5`-AGAGTTTGATCCTGGCTCAG-
3` and reverse primer 5`-GGTTACCTTGTTACGACTT-3` designed to target the
conserved regions of the 16S rRNA gene (Lane, 1991).
Figure 4-2 shows the amplification product of 16S rRNA gene for RV3 (lanes 2 and
3) and LV1 (lanes 4 and 5). The results demonstrated the success of the
amplification process of 16S rRNA gene from genomic DNA for both strains with
correct fragment band size for 16S rRNA gene of approximately 1500 base pairs.
The PCR product (16S rRNA gene) was cleaned up using Anachem Key Prep PCR
Purification Kit protocol (see section 2.21.3). The results shown in Figure 4-3
indicated that the purification of PCR product was successful and this step removes
any possibility of the presence of compounds that could affect the purity of the 16S
rRNA gene such as proteins, extra primers, salts and dNTPs.
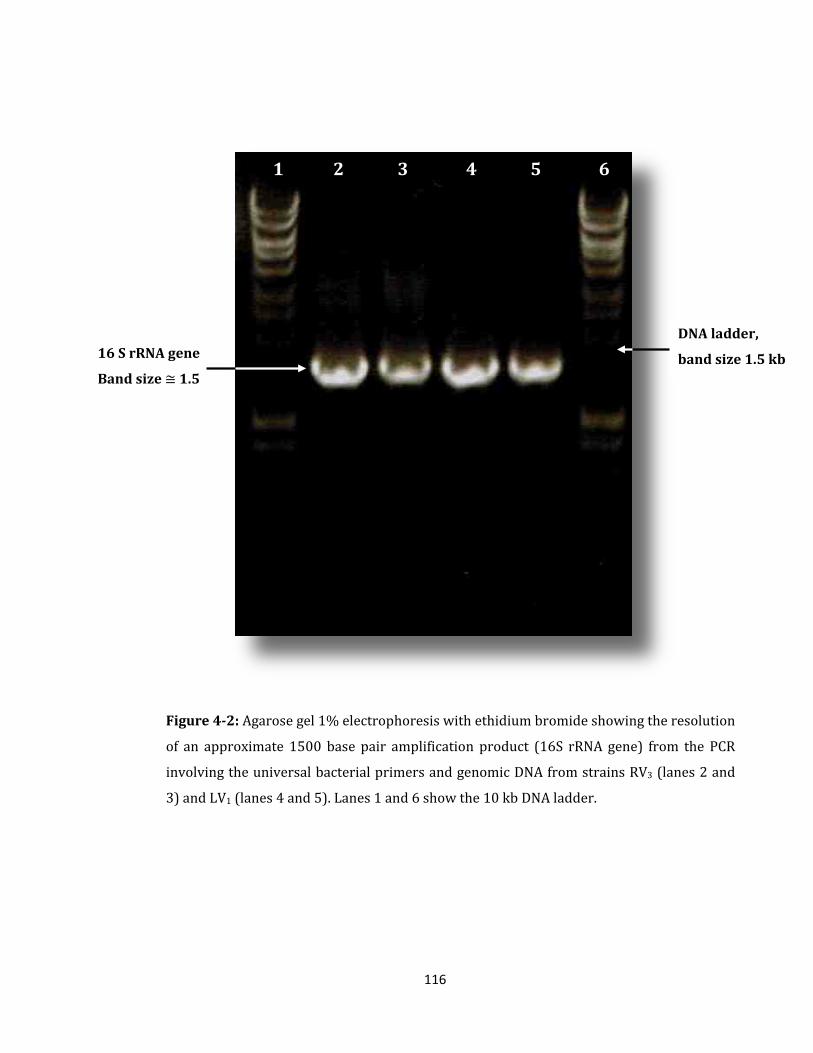
116
Figure 4-2: Agarose gel 1% electrophoresis with ethidium bromide showing the resolution
of an approximate 1500 base pair amplification product (16S rRNA gene) from the PCR
involving the universal bacterial primers and genomic DNA from strains RV3 (lanes 2 and
3) and LV1 (lanes 4 and 5). Lanes 1 and 6 show the 10 kb DNA ladder.
1 2 3 4 5 6
DNA ladder,
band size 1.5 kb
16 S rRNA gene
Band size ≅ 1.5
117
Figure 4-3: Agarose gel 1% electrophoresis with ethidium bromide showing the resolution
of an approximate 1500 base pair purification products (16S rRNA gene) from the PCR
after purification using Anachem Key Prep PCR Purification Kit. RV3 strain (lane 2) and LV1
strain (lane 3). Lanes 1 and 4 show the 10 kb DNA ladder.
1 2 3 4
16 S rRNA gene
Band size ≅1.5
DNA ladder,
band size 1.5 kb
118
4.2.1.3 Cloning of PCR Products and Transformation of E. coli
Bacterial 16S rRNA gene sequences can be obtained directly from PCR products.
However, the sequence returned from direct sequencing of PCR products is often
only 800 - 1000 bp, significantly shorter than the full 1500 bp. Therefore, in this
study the amplified 16S rRNA gene of both strains RV3 and LV1 was ligated into
pCR2.1 vector (3.9 kb) (see appendix B) in order to obtain a longer read of the
sequences (1.5 kb) for better comparison with other sequences in the genomic DNA
databases.
Transformation (the process of the E. coli DH5α competent cells taking up the
plasmid by heat shock) with the vector containing the 16S rRNA gene insert was
performed using ampicillin as the selectable marker with blue-white screening
using X-gal as described in section 2.21.4. The successful ligation of the 16S rRNA
gene into the vector is confirmed by the production of white colonies on the plates
(Figure 4-4). Blue colonies confirm that there was no insertion, the lacZ gene was
transcribed and the X-gal substrate was used by the E. coli cells.
Immediately after overnight growth on plates, single white colonies were picked
(each colony was added to a small volume of liquid media containing the
antibiotic) and grown in order to generate a large number of copies of the plasmid.
Plasmid was isolated using QIAgen Mini-Prep kit following the manufacturer’s
protocol. Plasmid DNA was cut using EcoR1 to confirm that the plasmid has the
correct insert. pCR2.1 is 3.9 kbp in length and has EcoR1 sites where the 16S
rRNA sequence (1.5 kbp) should have inserted. Each digest produced two products
(vector pCR 2.1 and 16S rRNA gene) at 3.9 kb and 1.5 kb band, respectively
(Figure 4-5).
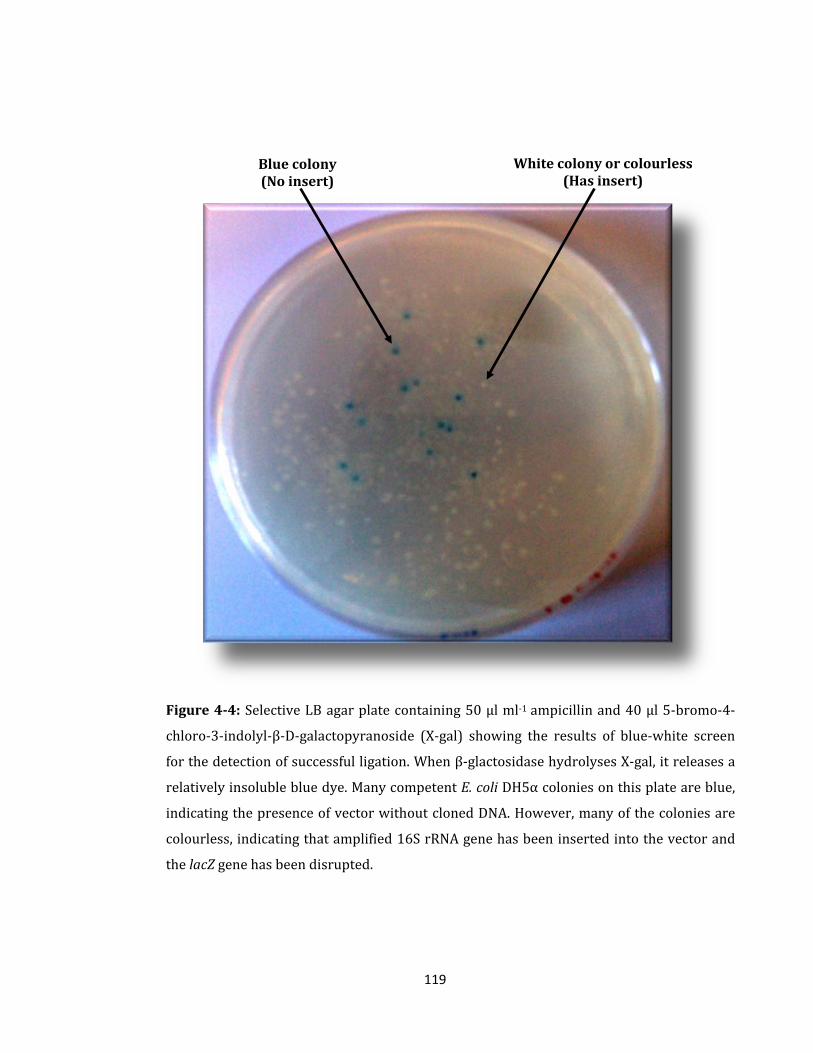
119
Figure 4-4: Selective LB agar plate containing 50 µl ml-1 ampicillin and 40 µl 5-bromo-4-
chloro-3-indolyl-β-D-galactopyranoside (X-gal) showing the results of blue-white screen
for the detection of successful ligation. When β-glactosidase hydrolyses X-gal, it releases a
relatively insoluble blue dye. Many competent E. coli DH5α colonies on this plate are blue,
indicating the presence of vector without cloned DNA. However, many of the colonies are
colourless, indicating that amplified 16S rRNA gene has been inserted into the vector and
the lacZ gene has been disrupted.
Blue colony (No insert)
White colony or colourless (Has insert)
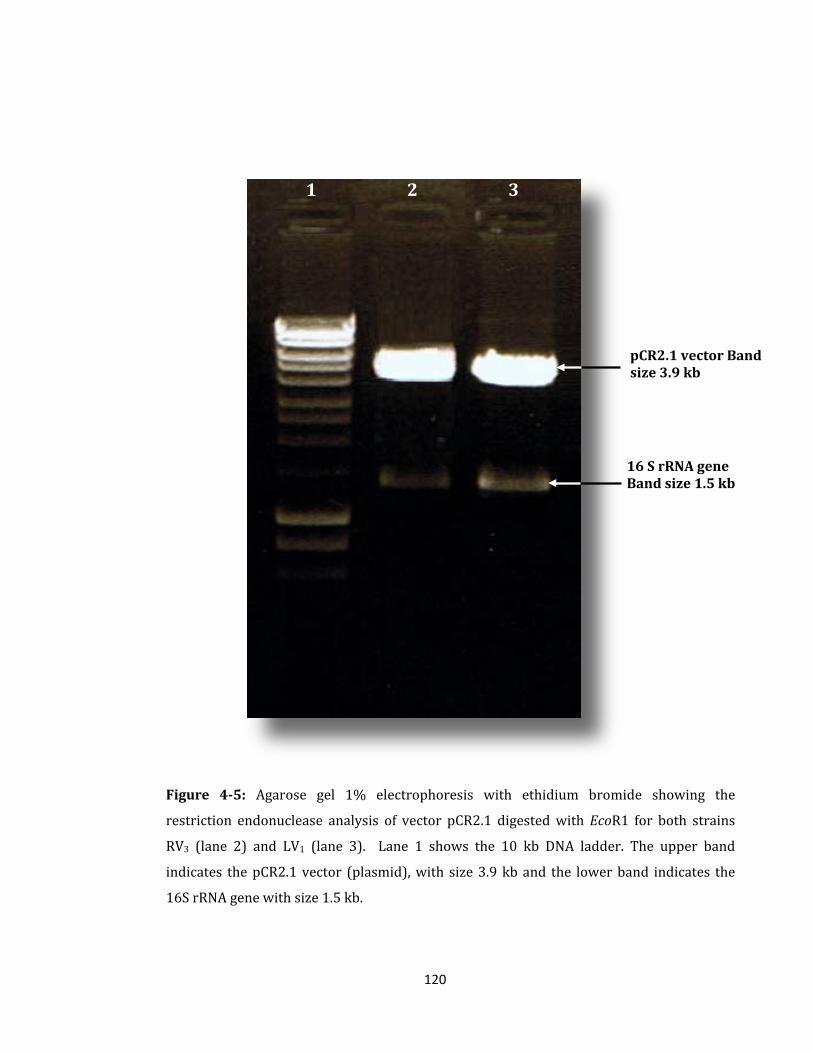
120
Figure 4-5: Agarose gel 1% electrophoresis with ethidium bromide showing the
restriction endonuclease analysis of vector pCR2.1 digested with EcoR1 for both strains
RV3 (lane 2) and LV1 (lane 3). Lane 1 shows the 10 kb DNA ladder. The upper band
indicates the pCR2.1 vector (plasmid), with size 3.9 kb and the lower band indicates the
16S rRNA gene with size 1.5 kb.
pCR2.1 vector Band size 3.9 kb
16 S rRNA gene Band size 1.5 kb
1 2 3
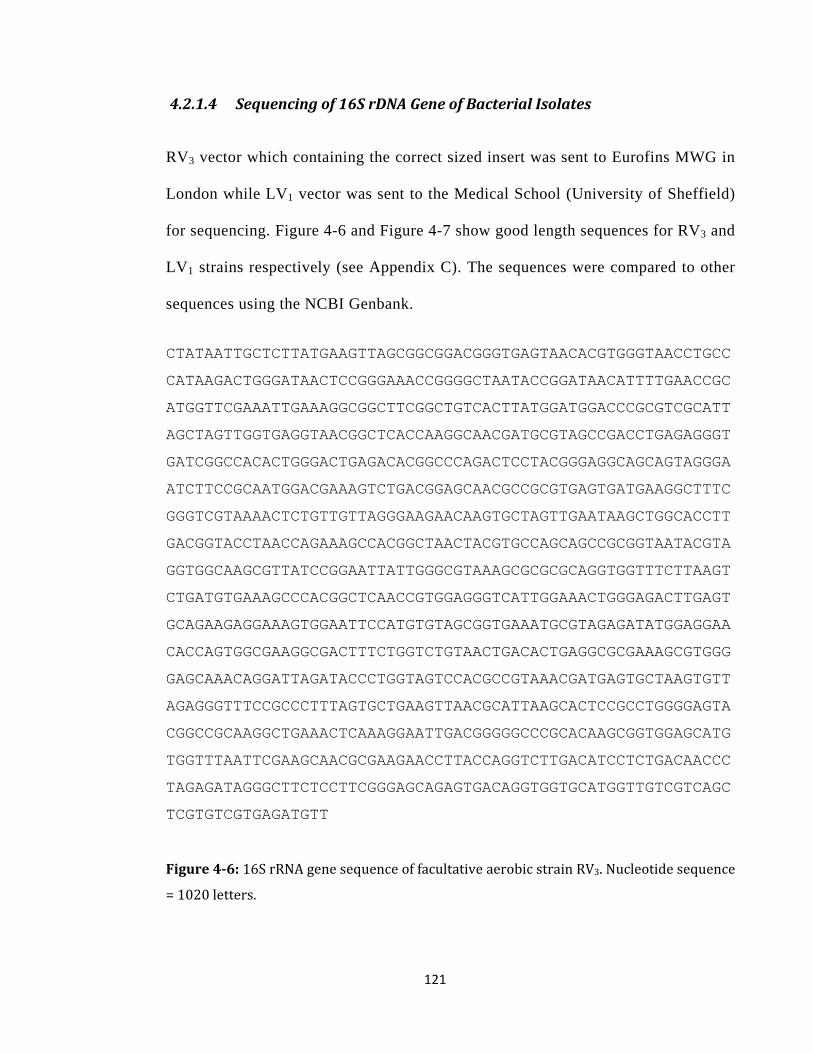
121
4.2.1.4 Sequencing of 16S rDNA Gene of Bacterial Isolates
RV3 vector which containing the correct sized insert was sent to Eurofins MWG in
London while LV1 vector was sent to the Medical School (University of Sheffield)
for sequencing. Figure 4-6 and Figure 4-7 show good length sequences for RV3 and
LV1 strains respectively (see Appendix C). The sequences were compared to other
sequences using the NCBI Genbank.
CTATAATTGCTCTTATGAAGTTAGCGGCGGACGGGTGAGTAACACGTGGGTAACCTGCC
CATAAGACTGGGATAACTCCGGGAAACCGGGGCTAATACCGGATAACATTTTGAACCGC
ATGGTTCGAAATTGAAAGGCGGCTTCGGCTGTCACTTATGGATGGACCCGCGTCGCATT
AGCTAGTTGGTGAGGTAACGGCTCACCAAGGCAACGATGCGTAGCCGACCTGAGAGGGT
GATCGGCCACACTGGGACTGAGACACGGCCCAGACTCCTACGGGAGGCAGCAGTAGGGA
ATCTTCCGCAATGGACGAAAGTCTGACGGAGCAACGCCGCGTGAGTGATGAAGGCTTTC
GGGTCGTAAAACTCTGTTGTTAGGGAAGAACAAGTGCTAGTTGAATAAGCTGGCACCTT
GACGGTACCTAACCAGAAAGCCACGGCTAACTACGTGCCAGCAGCCGCGGTAATACGTA
GGTGGCAAGCGTTATCCGGAATTATTGGGCGTAAAGCGCGCGCAGGTGGTTTCTTAAGT
CTGATGTGAAAGCCCACGGCTCAACCGTGGAGGGTCATTGGAAACTGGGAGACTTGAGT
GCAGAAGAGGAAAGTGGAATTCCATGTGTAGCGGTGAAATGCGTAGAGATATGGAGGAA
CACCAGTGGCGAAGGCGACTTTCTGGTCTGTAACTGACACTGAGGCGCGAAAGCGTGGG
GAGCAAACAGGATTAGATACCCTGGTAGTCCACGCCGTAAACGATGAGTGCTAAGTGTT
AGAGGGTTTCCGCCCTTTAGTGCTGAAGTTAACGCATTAAGCACTCCGCCTGGGGAGTA
CGGCCGCAAGGCTGAAACTCAAAGGAATTGACGGGGGCCCGCACAAGCGGTGGAGCATG
TGGTTTAATTCGAAGCAACGCGAAGAACCTTACCAGGTCTTGACATCCTCTGACAACCC
TAGAGATAGGGCTTCTCCTTCGGGAGCAGAGTGACAGGTGGTGCATGGTTGTCGTCAGC
TCGTGTCGTGAGATGTT
Figure 4-6: 16S rRNA gene sequence of facultative aerobic strain RV3. Nucleotide sequence
= 1020 letters.
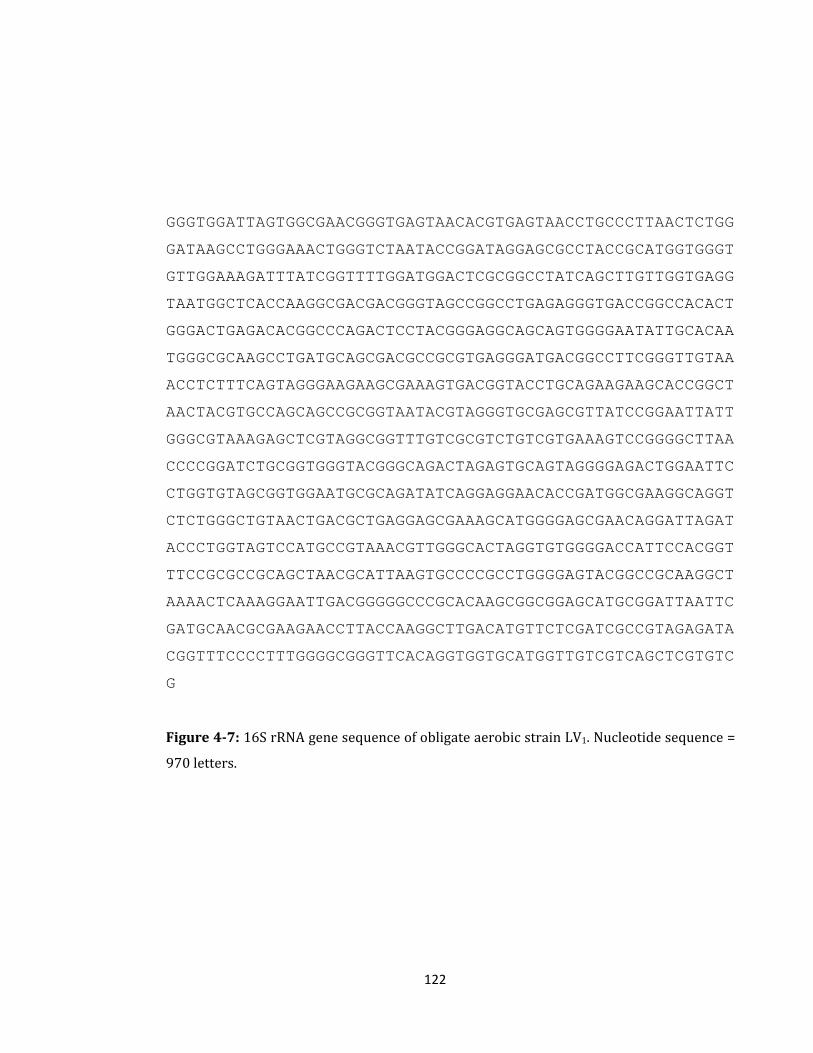
122
GGGTGGATTAGTGGCGAACGGGTGAGTAACACGTGAGTAACCTGCCCTTAACTCTGG
GATAAGCCTGGGAAACTGGGTCTAATACCGGATAGGAGCGCCTACCGCATGGTGGGT
GTTGGAAAGATTTATCGGTTTTGGATGGACTCGCGGCCTATCAGCTTGTTGGTGAGG
TAATGGCTCACCAAGGCGACGACGGGTAGCCGGCCTGAGAGGGTGACCGGCCACACT
GGGACTGAGACACGGCCCAGACTCCTACGGGAGGCAGCAGTGGGGAATATTGCACAA
TGGGCGCAAGCCTGATGCAGCGACGCCGCGTGAGGGATGACGGCCTTCGGGTTGTAA
ACCTCTTTCAGTAGGGAAGAAGCGAAAGTGACGGTACCTGCAGAAGAAGCACCGGCT
AACTACGTGCCAGCAGCCGCGGTAATACGTAGGGTGCGAGCGTTATCCGGAATTATT
GGGCGTAAAGAGCTCGTAGGCGGTTTGTCGCGTCTGTCGTGAAAGTCCGGGGCTTAA
CCCCGGATCTGCGGTGGGTACGGGCAGACTAGAGTGCAGTAGGGGAGACTGGAATTC
CTGGTGTAGCGGTGGAATGCGCAGATATCAGGAGGAACACCGATGGCGAAGGCAGGT
CTCTGGGCTGTAACTGACGCTGAGGAGCGAAAGCATGGGGAGCGAACAGGATTAGAT
ACCCTGGTAGTCCATGCCGTAAACGTTGGGCACTAGGTGTGGGGACCATTCCACGGT
TTCCGCGCCGCAGCTAACGCATTAAGTGCCCCGCCTGGGGAGTACGGCCGCAAGGCT
AAAACTCAAAGGAATTGACGGGGGCCCGCACAAGCGGCGGAGCATGCGGATTAATTC
GATGCAACGCGAAGAACCTTACCAAGGCTTGACATGTTCTCGATCGCCGTAGAGATA
CGGTTTCCCCTTTGGGGCGGGTTCACAGGTGGTGCATGGTTGTCGTCAGCTCGTGTC
G
Figure 4-7: 16S rRNA gene sequence of obligate aerobic strain LV1. Nucleotide sequence =
970 letters.
123
4.2.1.5 Phylogenetic Analysis
The 16S rRNA gene sequences of both bacterial isolates were compared with the highly
similar sequences available from NCBI GenBank library by using the BLAST program.
The results show that RV3 was most similar to the species Bacillus cereus and LV1 was
most similar to Micrococcus luteus with sequence identity 100% for both strains (Table
4-1 and Table 4-2, respectively). Phylogenetic trees (neighbour joining) were
constructed on the basis of the 16S rRNA gene sequences which show the relationship of
the Rivelin and Limb valley isolates with the set of organisms that are the nearest
matches (Figure 4-8 and Figure 4-10). Sequence comparisons are shown in Figure 4-9
and Figure 4-11.
On the basis of this analysis, RV3 is most closely related to Bacillus cereus (Accession
No: HQ596560.1) and LV1 is most closely related to Micrococcus luteus (Accession No:
JN545040.1).
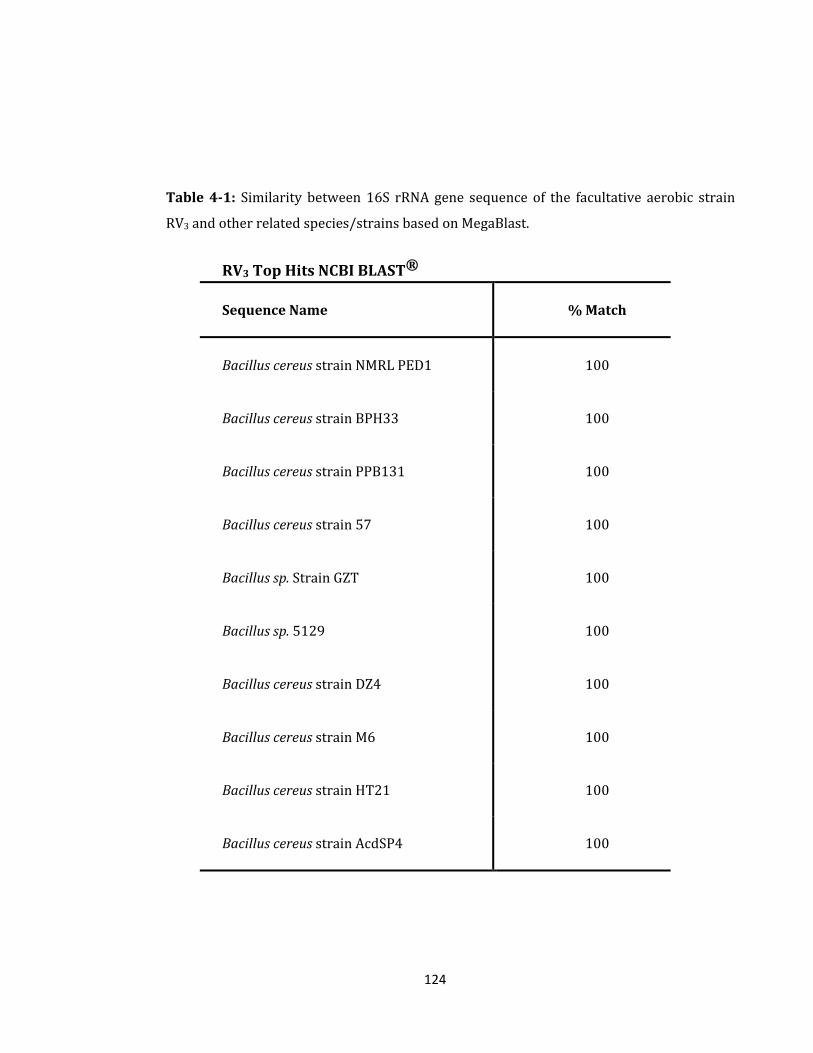
124
Table 4-1: Similarity between 16S rRNA gene sequence of the facultative aerobic strain
RV3 and other related species/strains based on MegaBlast.
RV3 Top Hits NCBI BLAST®
Sequence Name % Match
Bacillus cereus strain NMRL PED1 100
Bacillus cereus strain BPH33 100
Bacillus cereus strain PPB131 100
Bacillus cereus strain 57 100
Bacillus sp. Strain GZT 100
Bacillus sp. 5129 100
Bacillus cereus strain DZ4 100
Bacillus cereus strain M6 100
Bacillus cereus strain HT21 100
Bacillus cereus strain AcdSP4 100
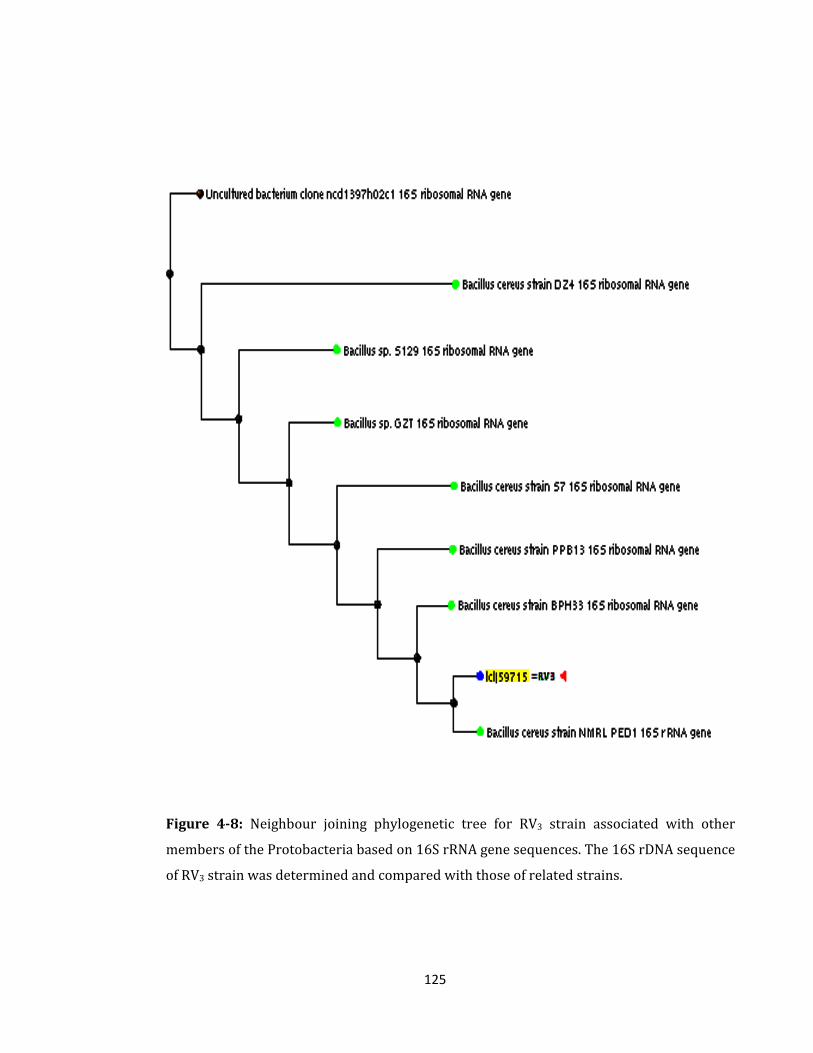
125
Figure 4-8: Neighbour joining phylogenetic tree for RV3 strain associated with other
members of the Protobacteria based on 16S rRNA gene sequences. The 16S rDNA sequence
of RV3 strain was determined and compared with those of related strains.
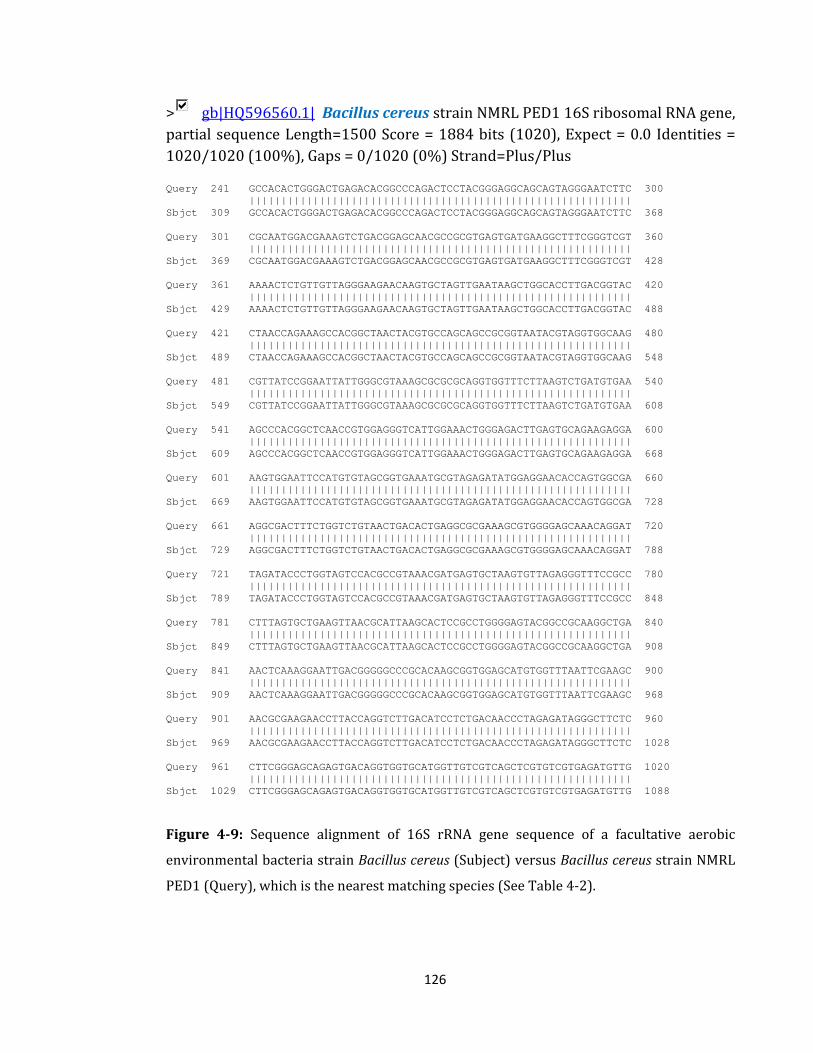
126
> gb|HQ596560.1| Bacillus cereus strain NMRL PED1 16S ribosomal RNA gene, partial sequence Length=1500 Score = 1884 bits (1020), Expect = 0.0 Identities = 1020/1020 (100%), Gaps = 0/1020 (0%) Strand=Plus/Plus Query 241 GCCACACTGGGACTGAGACACGGCCCAGACTCCTACGGGAGGCAGCAGTAGGGAATCTTC 300 |||||||||||||||||||||||||||||||||||||||||||||||||||||||||||| Sbjct 309 GCCACACTGGGACTGAGACACGGCCCAGACTCCTACGGGAGGCAGCAGTAGGGAATCTTC 368 Query 301 CGCAATGGACGAAAGTCTGACGGAGCAACGCCGCGTGAGTGATGAAGGCTTTCGGGTCGT 360 |||||||||||||||||||||||||||||||||||||||||||||||||||||||||||| Sbjct 369 CGCAATGGACGAAAGTCTGACGGAGCAACGCCGCGTGAGTGATGAAGGCTTTCGGGTCGT 428 Query 361 AAAACTCTGTTGTTAGGGAAGAACAAGTGCTAGTTGAATAAGCTGGCACCTTGACGGTAC 420 |||||||||||||||||||||||||||||||||||||||||||||||||||||||||||| Sbjct 429 AAAACTCTGTTGTTAGGGAAGAACAAGTGCTAGTTGAATAAGCTGGCACCTTGACGGTAC 488 Query 421 CTAACCAGAAAGCCACGGCTAACTACGTGCCAGCAGCCGCGGTAATACGTAGGTGGCAAG 480 |||||||||||||||||||||||||||||||||||||||||||||||||||||||||||| Sbjct 489 CTAACCAGAAAGCCACGGCTAACTACGTGCCAGCAGCCGCGGTAATACGTAGGTGGCAAG 548 Query 481 CGTTATCCGGAATTATTGGGCGTAAAGCGCGCGCAGGTGGTTTCTTAAGTCTGATGTGAA 540 |||||||||||||||||||||||||||||||||||||||||||||||||||||||||||| Sbjct 549 CGTTATCCGGAATTATTGGGCGTAAAGCGCGCGCAGGTGGTTTCTTAAGTCTGATGTGAA 608 Query 541 AGCCCACGGCTCAACCGTGGAGGGTCATTGGAAACTGGGAGACTTGAGTGCAGAAGAGGA 600 |||||||||||||||||||||||||||||||||||||||||||||||||||||||||||| Sbjct 609 AGCCCACGGCTCAACCGTGGAGGGTCATTGGAAACTGGGAGACTTGAGTGCAGAAGAGGA 668 Query 601 AAGTGGAATTCCATGTGTAGCGGTGAAATGCGTAGAGATATGGAGGAACACCAGTGGCGA 660 |||||||||||||||||||||||||||||||||||||||||||||||||||||||||||| Sbjct 669 AAGTGGAATTCCATGTGTAGCGGTGAAATGCGTAGAGATATGGAGGAACACCAGTGGCGA 728 Query 661 AGGCGACTTTCTGGTCTGTAACTGACACTGAGGCGCGAAAGCGTGGGGAGCAAACAGGAT 720 |||||||||||||||||||||||||||||||||||||||||||||||||||||||||||| Sbjct 729 AGGCGACTTTCTGGTCTGTAACTGACACTGAGGCGCGAAAGCGTGGGGAGCAAACAGGAT 788 Query 721 TAGATACCCTGGTAGTCCACGCCGTAAACGATGAGTGCTAAGTGTTAGAGGGTTTCCGCC 780 |||||||||||||||||||||||||||||||||||||||||||||||||||||||||||| Sbjct 789 TAGATACCCTGGTAGTCCACGCCGTAAACGATGAGTGCTAAGTGTTAGAGGGTTTCCGCC 848 Query 781 CTTTAGTGCTGAAGTTAACGCATTAAGCACTCCGCCTGGGGAGTACGGCCGCAAGGCTGA 840 |||||||||||||||||||||||||||||||||||||||||||||||||||||||||||| Sbjct 849 CTTTAGTGCTGAAGTTAACGCATTAAGCACTCCGCCTGGGGAGTACGGCCGCAAGGCTGA 908 Query 841 AACTCAAAGGAATTGACGGGGGCCCGCACAAGCGGTGGAGCATGTGGTTTAATTCGAAGC 900 |||||||||||||||||||||||||||||||||||||||||||||||||||||||||||| Sbjct 909 AACTCAAAGGAATTGACGGGGGCCCGCACAAGCGGTGGAGCATGTGGTTTAATTCGAAGC 968 Query 901 AACGCGAAGAACCTTACCAGGTCTTGACATCCTCTGACAACCCTAGAGATAGGGCTTCTC 960 |||||||||||||||||||||||||||||||||||||||||||||||||||||||||||| Sbjct 969 AACGCGAAGAACCTTACCAGGTCTTGACATCCTCTGACAACCCTAGAGATAGGGCTTCTC 1028 Query 961 CTTCGGGAGCAGAGTGACAGGTGGTGCATGGTTGTCGTCAGCTCGTGTCGTGAGATGTTG 1020 |||||||||||||||||||||||||||||||||||||||||||||||||||||||||||| Sbjct 1029 CTTCGGGAGCAGAGTGACAGGTGGTGCATGGTTGTCGTCAGCTCGTGTCGTGAGATGTTG 1088
Figure 4-9: Sequence alignment of 16S rRNA gene sequence of a facultative aerobic
environmental bacteria strain Bacillus cereus (Subject) versus Bacillus cereus strain NMRL
PED1 (Query), which is the nearest matching species (See Table 4-2).
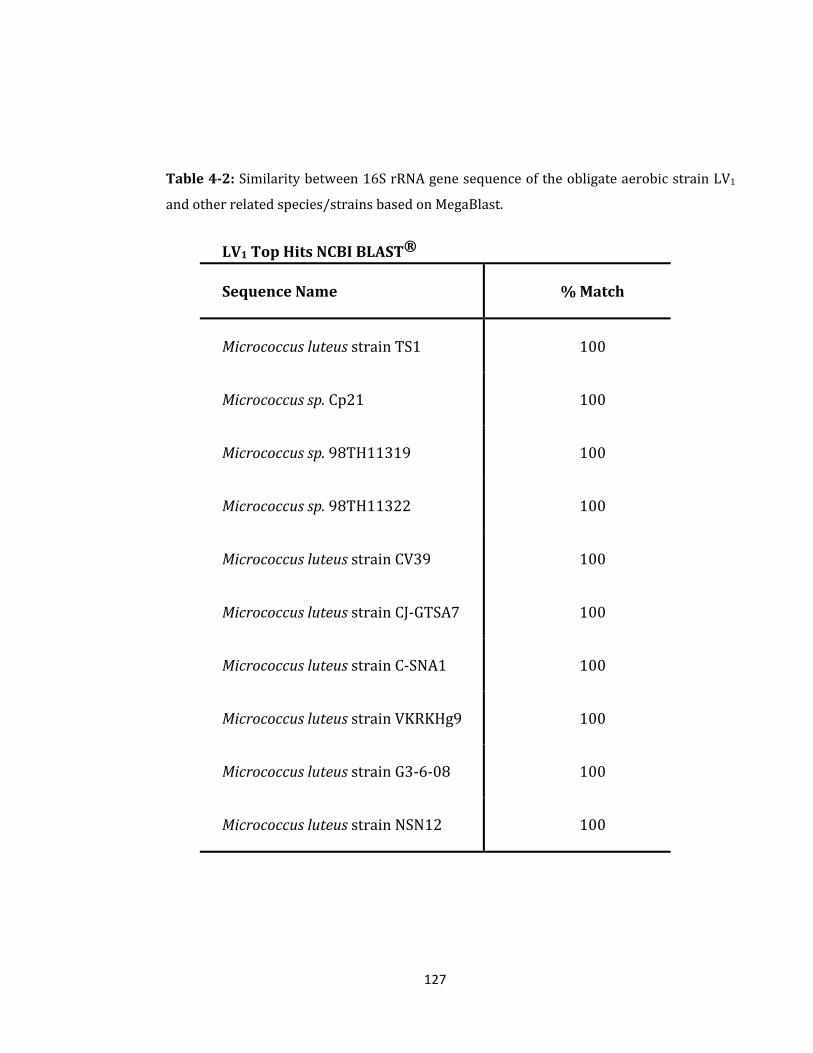
127
Table 4-2: Similarity between 16S rRNA gene sequence of the obligate aerobic strain LV1
and other related species/strains based on MegaBlast.
LV1 Top Hits NCBI BLAST®
Sequence Name % Match
Micrococcus luteus strain TS1 100
Micrococcus sp. Cp21 100
Micrococcus sp. 98TH11319 100
Micrococcus sp. 98TH11322 100
Micrococcus luteus strain CV39 100
Micrococcus luteus strain CJ-GTSA7 100
Micrococcus luteus strain C-SNA1 100
Micrococcus luteus strain VKRKHg9 100
Micrococcus luteus strain G3-6-08 100
Micrococcus luteus strain NSN12 100
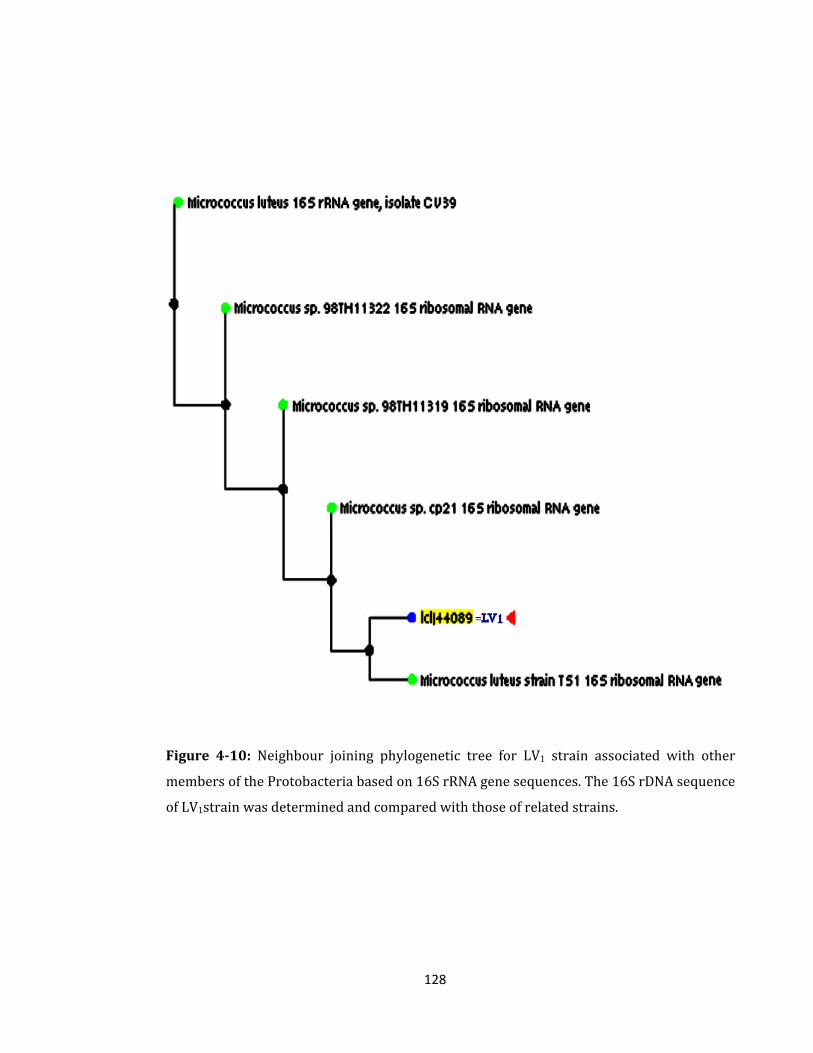
128
Figure 4-10: Neighbour joining phylogenetic tree for LV1 strain associated with other
members of the Protobacteria based on 16S rRNA gene sequences. The 16S rDNA sequence
of LV1strain was determined and compared with those of related strains.
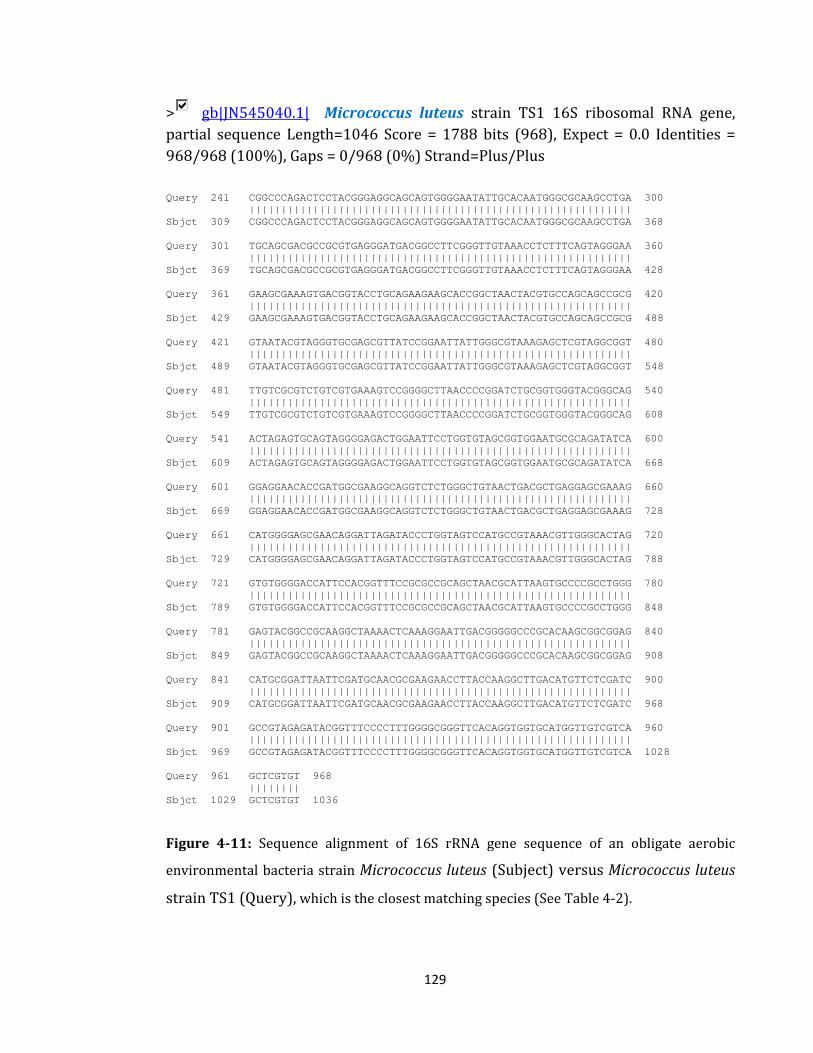
129
> gb|JN545040.1| Micrococcus luteus strain TS1 16S ribosomal RNA gene, partial sequence Length=1046 Score = 1788 bits (968), Expect = 0.0 Identities = 968/968 (100%), Gaps = 0/968 (0%) Strand=Plus/Plus Query 241 CGGCCCAGACTCCTACGGGAGGCAGCAGTGGGGAATATTGCACAATGGGCGCAAGCCTGA 300 |||||||||||||||||||||||||||||||||||||||||||||||||||||||||||| Sbjct 309 CGGCCCAGACTCCTACGGGAGGCAGCAGTGGGGAATATTGCACAATGGGCGCAAGCCTGA 368 Query 301 TGCAGCGACGCCGCGTGAGGGATGACGGCCTTCGGGTTGTAAACCTCTTTCAGTAGGGAA 360 |||||||||||||||||||||||||||||||||||||||||||||||||||||||||||| Sbjct 369 TGCAGCGACGCCGCGTGAGGGATGACGGCCTTCGGGTTGTAAACCTCTTTCAGTAGGGAA 428 Query 361 GAAGCGAAAGTGACGGTACCTGCAGAAGAAGCACCGGCTAACTACGTGCCAGCAGCCGCG 420 |||||||||||||||||||||||||||||||||||||||||||||||||||||||||||| Sbjct 429 GAAGCGAAAGTGACGGTACCTGCAGAAGAAGCACCGGCTAACTACGTGCCAGCAGCCGCG 488 Query 421 GTAATACGTAGGGTGCGAGCGTTATCCGGAATTATTGGGCGTAAAGAGCTCGTAGGCGGT 480 |||||||||||||||||||||||||||||||||||||||||||||||||||||||||||| Sbjct 489 GTAATACGTAGGGTGCGAGCGTTATCCGGAATTATTGGGCGTAAAGAGCTCGTAGGCGGT 548 Query 481 TTGTCGCGTCTGTCGTGAAAGTCCGGGGCTTAACCCCGGATCTGCGGTGGGTACGGGCAG 540 |||||||||||||||||||||||||||||||||||||||||||||||||||||||||||| Sbjct 549 TTGTCGCGTCTGTCGTGAAAGTCCGGGGCTTAACCCCGGATCTGCGGTGGGTACGGGCAG 608 Query 541 ACTAGAGTGCAGTAGGGGAGACTGGAATTCCTGGTGTAGCGGTGGAATGCGCAGATATCA 600 |||||||||||||||||||||||||||||||||||||||||||||||||||||||||||| Sbjct 609 ACTAGAGTGCAGTAGGGGAGACTGGAATTCCTGGTGTAGCGGTGGAATGCGCAGATATCA 668 Query 601 GGAGGAACACCGATGGCGAAGGCAGGTCTCTGGGCTGTAACTGACGCTGAGGAGCGAAAG 660 |||||||||||||||||||||||||||||||||||||||||||||||||||||||||||| Sbjct 669 GGAGGAACACCGATGGCGAAGGCAGGTCTCTGGGCTGTAACTGACGCTGAGGAGCGAAAG 728 Query 661 CATGGGGAGCGAACAGGATTAGATACCCTGGTAGTCCATGCCGTAAACGTTGGGCACTAG 720 |||||||||||||||||||||||||||||||||||||||||||||||||||||||||||| Sbjct 729 CATGGGGAGCGAACAGGATTAGATACCCTGGTAGTCCATGCCGTAAACGTTGGGCACTAG 788 Query 721 GTGTGGGGACCATTCCACGGTTTCCGCGCCGCAGCTAACGCATTAAGTGCCCCGCCTGGG 780 |||||||||||||||||||||||||||||||||||||||||||||||||||||||||||| Sbjct 789 GTGTGGGGACCATTCCACGGTTTCCGCGCCGCAGCTAACGCATTAAGTGCCCCGCCTGGG 848 Query 781 GAGTACGGCCGCAAGGCTAAAACTCAAAGGAATTGACGGGGGCCCGCACAAGCGGCGGAG 840 |||||||||||||||||||||||||||||||||||||||||||||||||||||||||||| Sbjct 849 GAGTACGGCCGCAAGGCTAAAACTCAAAGGAATTGACGGGGGCCCGCACAAGCGGCGGAG 908 Query 841 CATGCGGATTAATTCGATGCAACGCGAAGAACCTTACCAAGGCTTGACATGTTCTCGATC 900 |||||||||||||||||||||||||||||||||||||||||||||||||||||||||||| Sbjct 909 CATGCGGATTAATTCGATGCAACGCGAAGAACCTTACCAAGGCTTGACATGTTCTCGATC 968 Query 901 GCCGTAGAGATACGGTTTCCCCTTTGGGGCGGGTTCACAGGTGGTGCATGGTTGTCGTCA 960 |||||||||||||||||||||||||||||||||||||||||||||||||||||||||||| Sbjct 969 GCCGTAGAGATACGGTTTCCCCTTTGGGGCGGGTTCACAGGTGGTGCATGGTTGTCGTCA 1028 Query 961 GCTCGTGT 968 |||||||| Sbjct 1029 GCTCGTGT 1036
Figure 4-11: Sequence alignment of 16S rRNA gene sequence of an obligate aerobic
environmental bacteria strain Micrococcus luteus (Subject) versus Micrococcus luteus
strain TS1 (Query), which is the closest matching species (See Table 4-2).
130
4.2.2 Yeast Strains
4.2.2.1 The Identification of Yeast Strains
Initially, the CTAB method with sonication was used in order to extract genomic
DNA from both yeast strains, but no DNA has been obtained. So, QIAgen DNA
extraction kits were used, but after many trials no genomic DNA was extracted
(Figure 4-12). Another extraction kit (ANACHEM Key Prep) was used, and again
even with optimised extraction protocol and sonication a very low quality genomic
DNA was extracted from both strains which did not support the amplification
process of 18S rRNA using PCR protocol (Figure 4-13). So, both isolates were sent
as fresh colonies on plates to NCIMB in Aberdeen in order to identify them.
After two weeks, the sequencing of both strains was received (Figure 4-14 and
Figure 4-15) and confirmed as eukaryotes The results show that both strains were
yeast and most similar to the species Aureobasidium pullulans (RV2) and
Debaryomyces hansenii (RV4) with sequence identities 100% and 99.72%
respectively (Table 4-3 and Table 40-4). Phylogenetic trees (neighbour joining)
constructed on the basis of the 18S rRNA gene sequences show the relationship of
the Rivelin and Limb valleys isolates with the set of organisms that are the nearest
matches (Figure 4-16 and Figure 4-18). Sequence comparisons are shown in Figure
4-17 and Figure 4-19.
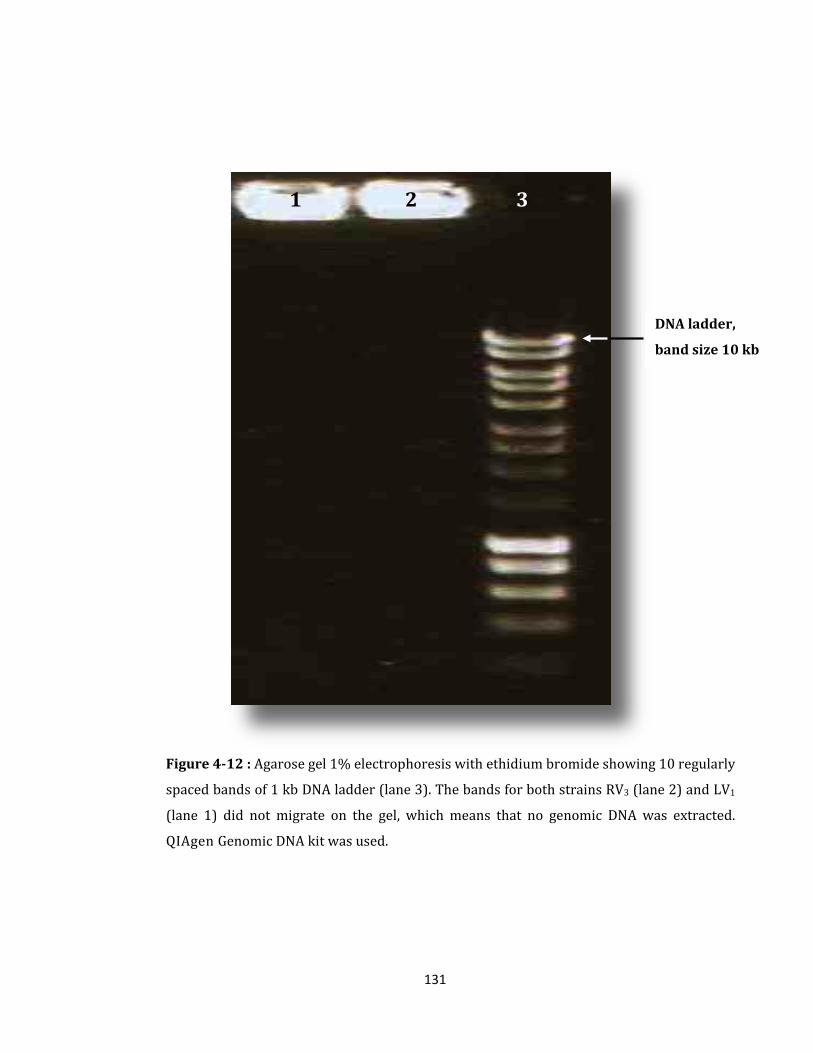
131
Figure 4-12 : Agarose gel 1% electrophoresis with ethidium bromide showing 10 regularly
spaced bands of 1 kb DNA ladder (lane 3). The bands for both strains RV3 (lane 2) and LV1
(lane 1) did not migrate on the gel, which means that no genomic DNA was extracted.
QIAgen Genomic DNA kit was used.
1 2 3
DNA ladder,
band size 10 kb
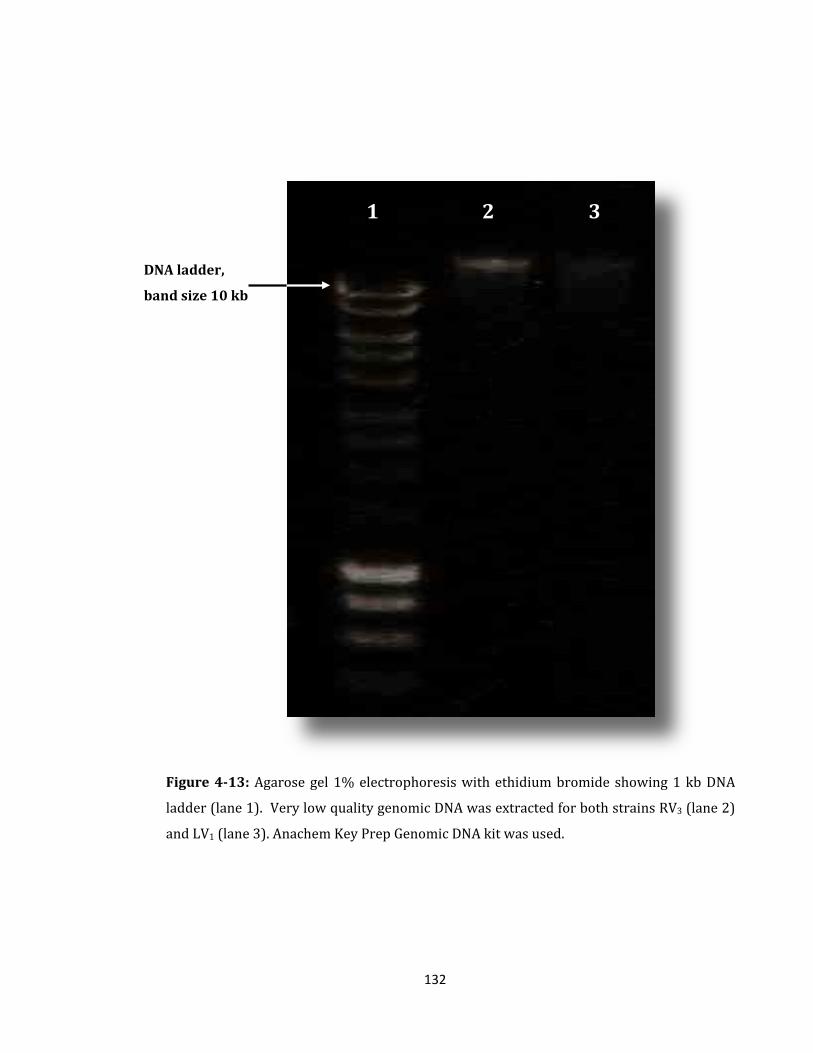
132
Figure 4-13: Agarose gel 1% electrophoresis with ethidium bromide showing 1 kb DNA
ladder (lane 1). Very low quality genomic DNA was extracted for both strains RV3 (lane 2)
and LV1 (lane 3). Anachem Key Prep Genomic DNA kit was used.
1 2 3
1 2 3
DNA ladder,
band size 10 kb
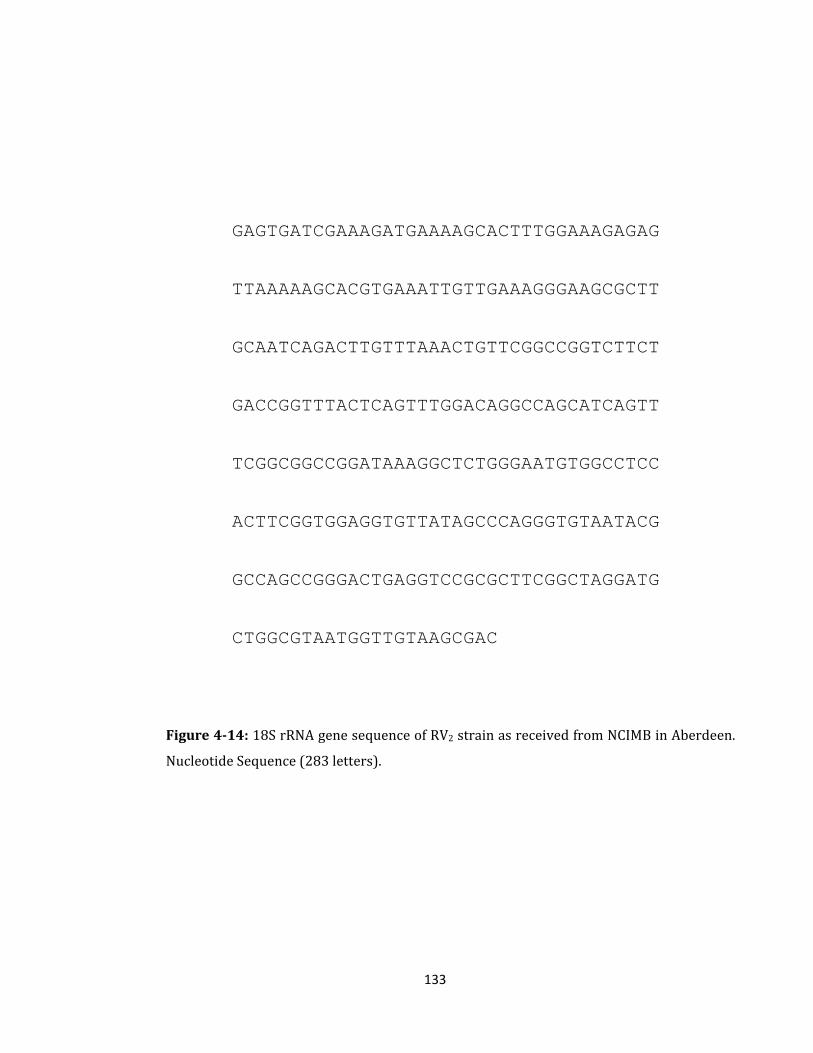
133
GAGTGATCGAAAGATGAAAAGCACTTTGGAAAGAGAG
TTAAAAAGCACGTGAAATTGTTGAAAGGGAAGCGCTT
GCAATCAGACTTGTTTAAACTGTTCGGCCGGTCTTCT
GACCGGTTTACTCAGTTTGGACAGGCCAGCATCAGTT
TCGGCGGCCGGATAAAGGCTCTGGGAATGTGGCCTCC
ACTTCGGTGGAGGTGTTATAGCCCAGGGTGTAATACG
GCCAGCCGGGACTGAGGTCCGCGCTTCGGCTAGGATG
CTGGCGTAATGGTTGTAAGCGAC
Figure 4-14: 18S rRNA gene sequence of RV2 strain as received from NCIMB in Aberdeen.
Nucleotide Sequence (283 letters).
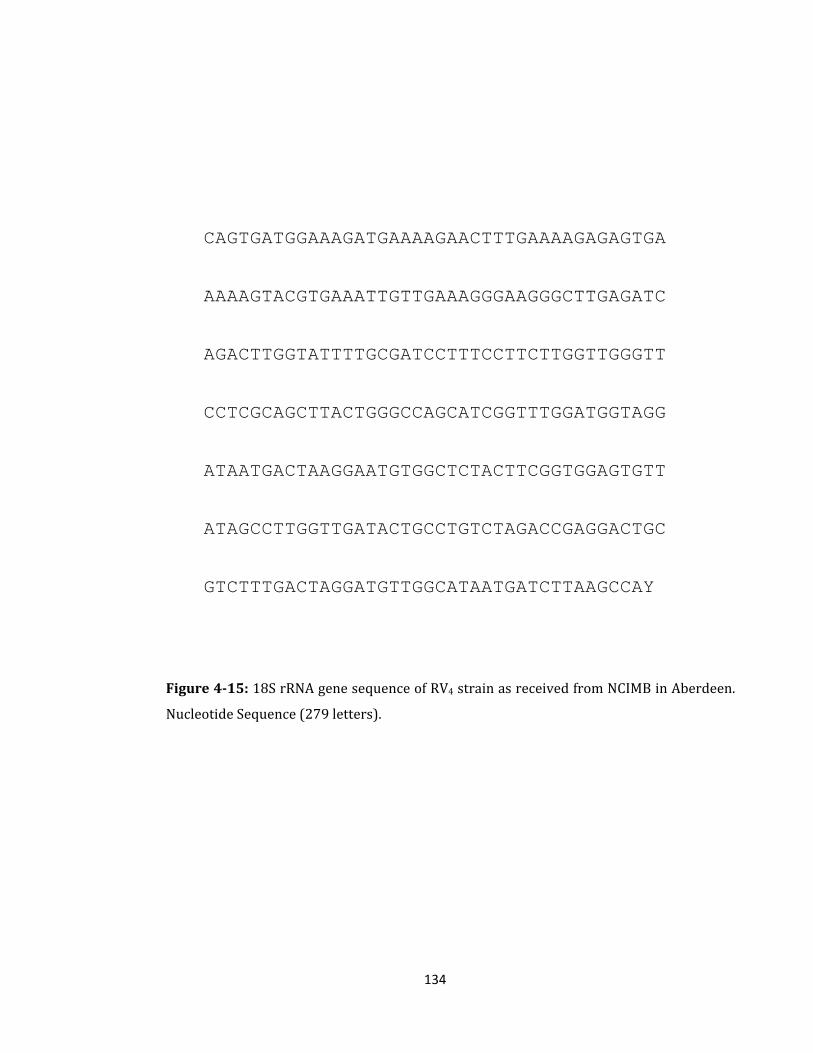
134
CAGTGATGGAAAGATGAAAAGAACTTTGAAAAGAGAGTGA
AAAAGTACGTGAAATTGTTGAAAGGGAAGGGCTTGAGATC
AGACTTGGTATTTTGCGATCCTTTCCTTCTTGGTTGGGTT
CCTCGCAGCTTACTGGGCCAGCATCGGTTTGGATGGTAGG
ATAATGACTAAGGAATGTGGCTCTACTTCGGTGGAGTGTT
ATAGCCTTGGTTGATACTGCCTGTCTAGACCGAGGACTGC
GTCTTTGACTAGGATGTTGGCATAATGATCTTAAGCCAY
Figure 4-15: 18S rRNA gene sequence of RV4 strain as received from NCIMB in Aberdeen.
Nucleotide Sequence (279 letters).
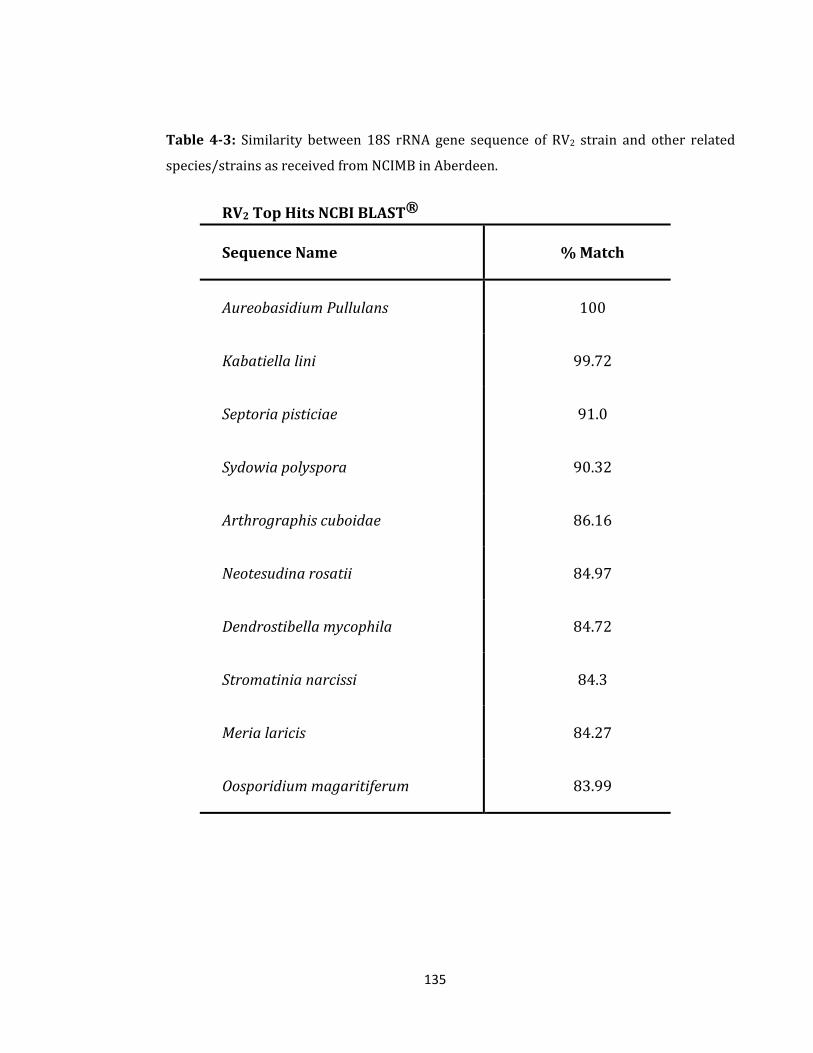
135
Table 4-3: Similarity between 18S rRNA gene sequence of RV2 strain and other related
species/strains as received from NCIMB in Aberdeen.
RV2 Top Hits NCBI BLAST®
Sequence Name % Match
Aureobasidium Pullulans 100
Kabatiella lini 99.72
Septoria pisticiae 91.0
Sydowia polyspora 90.32
Arthrographis cuboidae 86.16
Neotesudina rosatii 84.97
Dendrostibella mycophila 84.72
Stromatinia narcissi 84.3
Meria laricis 84.27
Oosporidium magaritiferum 83.99
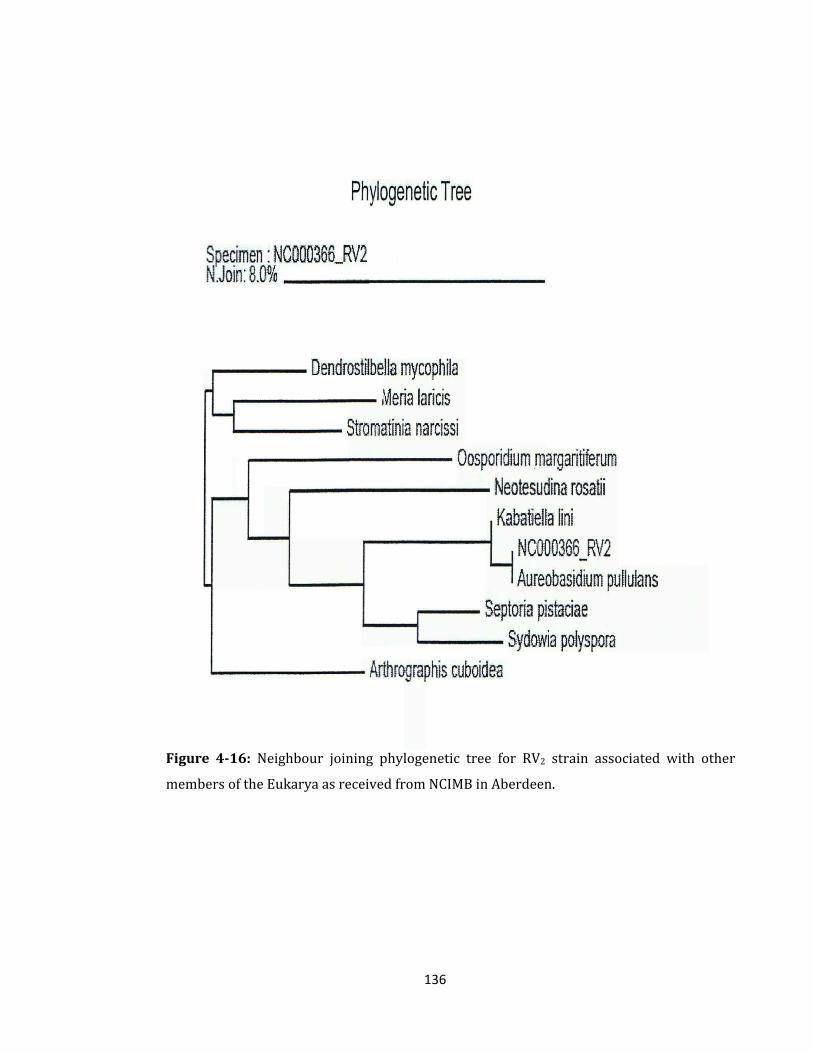
136
Figure 4-16: Neighbour joining phylogenetic tree for RV2 strain associated with other
members of the Eukarya as received from NCIMB in Aberdeen.
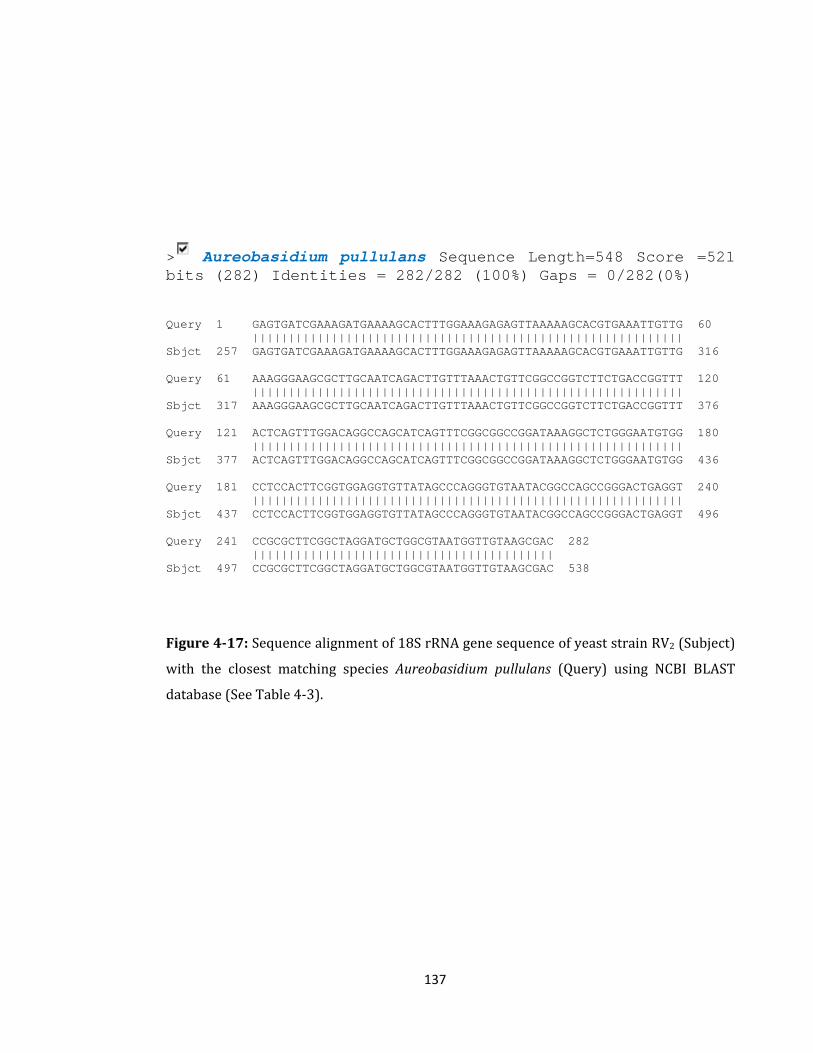
137
> Aureobasidium pullulans Sequence Length=548 Score =521 bits (282) Identities = 282/282 (100%) Gaps = 0/282(0%) Query 1 GAGTGATCGAAAGATGAAAAGCACTTTGGAAAGAGAGTTAAAAAGCACGTGAAATTGTTG 60 |||||||||||||||||||||||||||||||||||||||||||||||||||||||||||| Sbjct 257 GAGTGATCGAAAGATGAAAAGCACTTTGGAAAGAGAGTTAAAAAGCACGTGAAATTGTTG 316 Query 61 AAAGGGAAGCGCTTGCAATCAGACTTGTTTAAACTGTTCGGCCGGTCTTCTGACCGGTTT 120 |||||||||||||||||||||||||||||||||||||||||||||||||||||||||||| Sbjct 317 AAAGGGAAGCGCTTGCAATCAGACTTGTTTAAACTGTTCGGCCGGTCTTCTGACCGGTTT 376 Query 121 ACTCAGTTTGGACAGGCCAGCATCAGTTTCGGCGGCCGGATAAAGGCTCTGGGAATGTGG 180 |||||||||||||||||||||||||||||||||||||||||||||||||||||||||||| Sbjct 377 ACTCAGTTTGGACAGGCCAGCATCAGTTTCGGCGGCCGGATAAAGGCTCTGGGAATGTGG 436 Query 181 CCTCCACTTCGGTGGAGGTGTTATAGCCCAGGGTGTAATACGGCCAGCCGGGACTGAGGT 240 |||||||||||||||||||||||||||||||||||||||||||||||||||||||||||| Sbjct 437 CCTCCACTTCGGTGGAGGTGTTATAGCCCAGGGTGTAATACGGCCAGCCGGGACTGAGGT 496 Query 241 CCGCGCTTCGGCTAGGATGCTGGCGTAATGGTTGTAAGCGAC 282 |||||||||||||||||||||||||||||||||||||||||| Sbjct 497 CCGCGCTTCGGCTAGGATGCTGGCGTAATGGTTGTAAGCGAC 538
Figure 4-17: Sequence alignment of 18S rRNA gene sequence of yeast strain RV2 (Subject)
with the closest matching species Aureobasidium pullulans (Query) using NCBI BLAST
database (See Table 4-3).
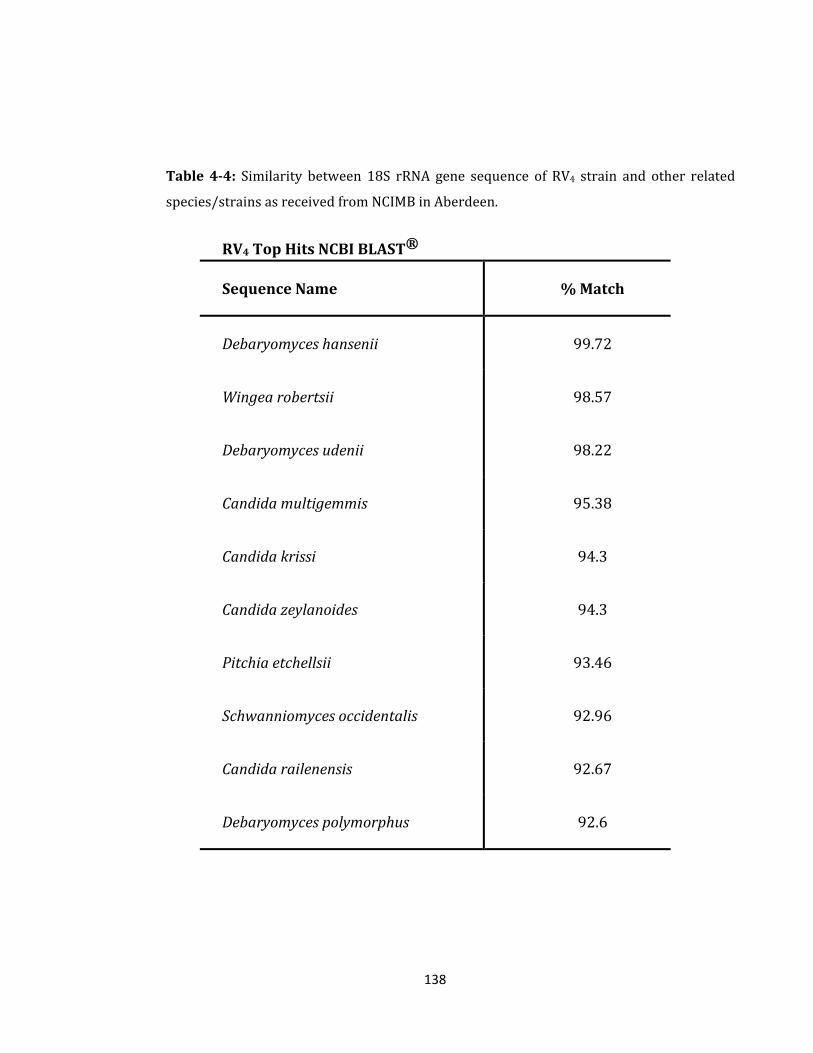
138
Table 4-4: Similarity between 18S rRNA gene sequence of RV4 strain and other related
species/strains as received from NCIMB in Aberdeen.
RV4 Top Hits NCBI BLAST®
Sequence Name % Match
Debaryomyces hansenii 99.72
Wingea robertsii 98.57
Debaryomyces udenii 98.22
Candida multigemmis 95.38
Candida krissi 94.3
Candida zeylanoides 94.3
Pitchia etchellsii 93.46
Schwanniomyces occidentalis 92.96
Candida railenensis 92.67
Debaryomyces polymorphus 92.6
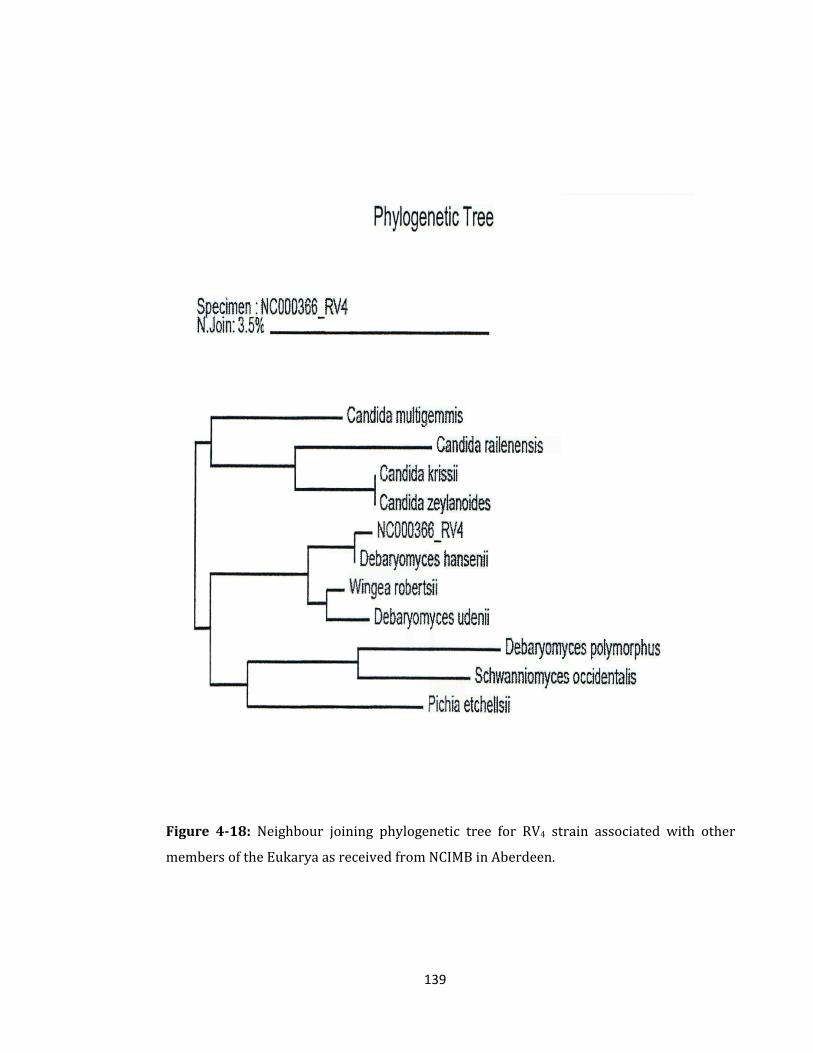
139
Figure 4-18: Neighbour joining phylogenetic tree for RV4 strain associated with other
members of the Eukarya as received from NCIMB in Aberdeen.
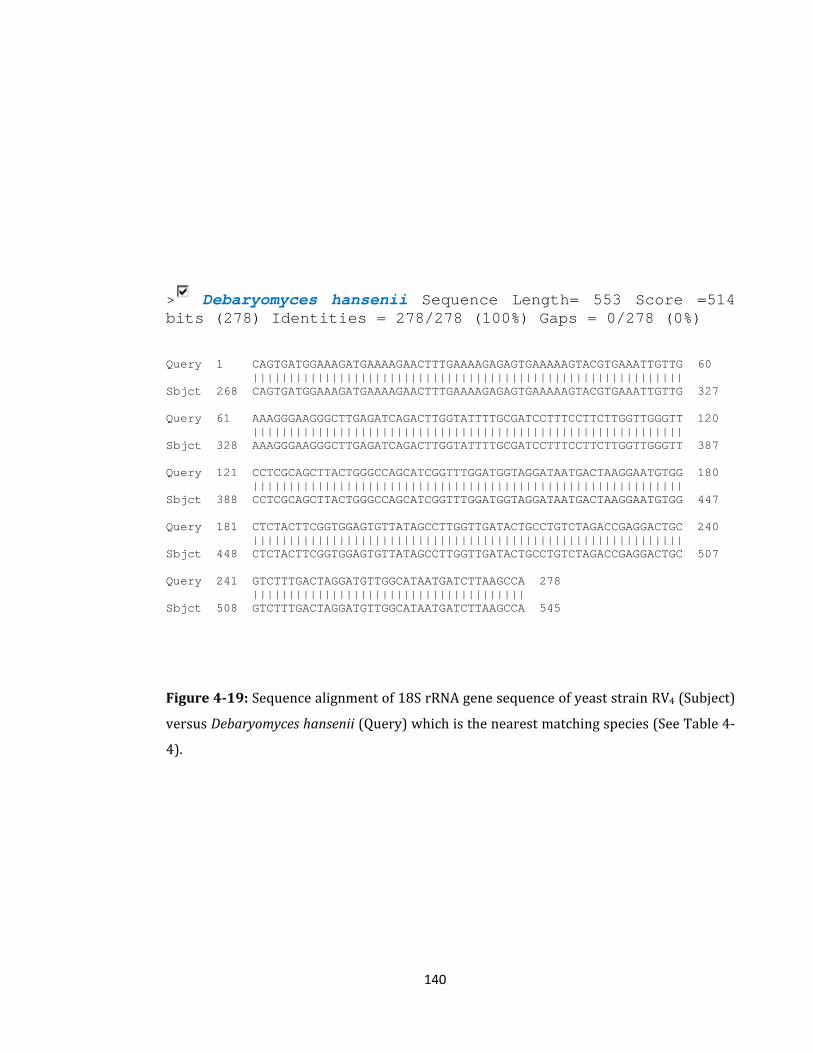
140
> Debaryomyces hansenii Sequence Length= 553 Score =514 bits (278) Identities = 278/278 (100%) Gaps = 0/278 (0%) Query 1 CAGTGATGGAAAGATGAAAAGAACTTTGAAAAGAGAGTGAAAAAGTACGTGAAATTGTTG 60 |||||||||||||||||||||||||||||||||||||||||||||||||||||||||||| Sbjct 268 CAGTGATGGAAAGATGAAAAGAACTTTGAAAAGAGAGTGAAAAAGTACGTGAAATTGTTG 327 Query 61 AAAGGGAAGGGCTTGAGATCAGACTTGGTATTTTGCGATCCTTTCCTTCTTGGTTGGGTT 120 |||||||||||||||||||||||||||||||||||||||||||||||||||||||||||| Sbjct 328 AAAGGGAAGGGCTTGAGATCAGACTTGGTATTTTGCGATCCTTTCCTTCTTGGTTGGGTT 387 Query 121 CCTCGCAGCTTACTGGGCCAGCATCGGTTTGGATGGTAGGATAATGACTAAGGAATGTGG 180 |||||||||||||||||||||||||||||||||||||||||||||||||||||||||||| Sbjct 388 CCTCGCAGCTTACTGGGCCAGCATCGGTTTGGATGGTAGGATAATGACTAAGGAATGTGG 447 Query 181 CTCTACTTCGGTGGAGTGTTATAGCCTTGGTTGATACTGCCTGTCTAGACCGAGGACTGC 240 |||||||||||||||||||||||||||||||||||||||||||||||||||||||||||| Sbjct 448 CTCTACTTCGGTGGAGTGTTATAGCCTTGGTTGATACTGCCTGTCTAGACCGAGGACTGC 507 Query 241 GTCTTTGACTAGGATGTTGGCATAATGATCTTAAGCCA 278 |||||||||||||||||||||||||||||||||||||| Sbjct 508 GTCTTTGACTAGGATGTTGGCATAATGATCTTAAGCCA 545
Figure 4-19: Sequence alignment of 18S rRNA gene sequence of yeast strain RV4 (Subject)
versus Debaryomyces hansenii (Query) which is the nearest matching species (See Table 4-
4).
141
4.3 Conclusions
Four microbial species have been isolated from Rivelin and Limb valleys, two bacterial
strains (RV3 and LV1) and two yeast strains (RV2 and RV4). The bacterial species have
been identified in the lab according to molecular identification techniques, starting with
the extraction of genomic DNA, followed by PCR amplification and purification of 16S
rRNA gene, and the transformation of competent E.coli cells. The sequences have been
subjected to computer analysis and compared with other sequences using the NCBI
GenBank which confirmed the identification of these bacteria as Bacillus cereus (RV3)
and Micrococcus luteus (LV1) with sequence identities of 100%.
On the other hand, both yeast strains RV2 and RV4 were identified by The National
Collection of Industrial, Marine and Food Bacteria (NCIMB) using the MicroSeq
database and the EMBL public database. The identifications as received were
Aureobasidium pullulans (RV2) and Debaryomyces hansenii (RV4) with sequence
identities 100% and 99.72%, respectively.
Bacillus cereus is a Gram-positive, rod-shaped, facultative aerobe, which produces
protective endospores and is beta hemolytic. It can be isolated from different
environments, but usually from soil environments (Luksiene et al., 2009). B. cereus
commonly grows on plants and is adapted for growth in the intestinal tract of insects and
mammals (Arnesen et al., 2008). From these environments it is easily spread to foods,
therefore, it can be isolated from a wide range of foods and also food ingredients,
including rice, spices, dried foods, dairy products (milk powder, milk substitute, and
dairy desserts), fresh vegetables and meat products (Reyes et al., 2007, Arnesen et al.,
142
2008). The bacterium is responsible for gastrointestinal disease and non-gastrointestinal
disease (wound and eye infections plus systemic infections) (Ehling-Schulz et al., 2004).
It is a major cause of two different forms of food poisoning (B. cereus foodborne
disease), the emetic and the diarrhoeal syndromes (Finlay et al., 2002a, Finlay et al.,
2002b, Ehling-Schulz et al., 2004, Clavel et al., 2007). The emetic type of food
poisoning is probably the most dangerous as it has been associated with life-threatening
acute conditions such as fulminant liver failure. It is caused by ingestion of a preformed
toxin in the food, while the diarrhoeal poisoning is caused by a variety of toxins that can
be formed in the food but also in the small intestine (Reyes et al., 2007). The emetic
toxin that causes vomiting is an extremely stable (heat and acid), small ring-form
dodecadepsipeptide (peptide) which is resistant to proteolytic degradation, pH extremes
and high temperature (Finlay et al., 2002a, Finlay et al., 2002b, Ehling-Schulz et al.,
2004, Arnesen et al., 2008). Whereas the diarrhoeal disease is caused by one or more
heat-labile protein enterotoxins produced during vegetative growth of B. cereus in the
small intestine (Ehling-Schulz et al., 2004, Arnesen et al., 2008).
Micrococcus luteus is a Gram-positive bacterium, spherical or cocci shape, the cells
arranged in tetrads producing yellow pigmented creamy colonies, obligate aerobe, which
produce acid from glucose (Madigan et al., 2009, Bergey and Boone, 2009). It can be
found in a wide range of environments such as water, soil, air and dust (Baird-Parker,
1965, Rosypal et al., 1966, Madigan et al., 2009). It can also be isolated from the skin of
mammals (Kloos et al., 1974). M. luteus is commonly resistance to reduced water
potential, can tolerate high salt concentrations and drying (Madigan et al., 2009). In
1994, Moriguchi et al. have reported two salt-tolerant glutaminases which play major
143
roles in supporting growth of M. luteus cells at high salt concentrations (Moriguchi et
al., 1994). Despite M. luteus being a non-spore forming bacterium, Greenblatt and others
recorded the ability of M. luteus to survive in oligotrophic environments. They
investigated the presence of M. luteus in a 120 million year-old block of amber
(Greenblatt et al., 2004).
Aureobasidium pullulans is a yeast like fungus which can be found ubiquitously, it
survives mainly in soil, water, air, limestone, rocks and commonly occurs on fruits
(Domsch et al., 1980, Deshpande et al., 1992, Urzi et al., 1999). Its colonies are white to
pink at first but after a while they turned to black due to chlamydospore production and
for this reason it is called the black yeast (Cooke, 1959, Domsch et al., 1980, Hoog,
1993, Kurtzman and Fell, 1998). A. pullulans causes plant tissue softening so it
demonstrated due to its osmotolerant properties (Hoog, 1993). It can be considered as a
secondary saprophyte after the colonisation of bacterial mats or other fungi due to the
low of its competitiveness in poor environments (Hoog, 1993). A. pullulans can divided
to three varities, A. pullulans var melanogenum, A. pullulans var pullulans and A.
pullulans var aubasedani Yurlova (Yurlova and De Hoog, 1997). A recent study carried
out by Chi et al. demonstrated that A. pullulans can produce enzymes such as pullulan,
amylase, mannanase, cellulose, proteinase, and siderophores which can used in many
different biotechnological applications in different fields (Chi et al., 2009).
A. pullulans has the ability to ferment glucose, assimilate nitrate, but α-methyl
glucoside and cadaverine are not assimilated. Also A. pullulans cannot grow in the
presence of cycloheximide (Kurtzman and Fell, 2000, Barnett et al., 2000, Senses-Ergul
et al., 2006). In the previous chapter (section 3.2.6), exactly these characteristics were
144
found for RV2 strongly supporting the molecular identification made in the current
chapter i.e. that RV2 is Aureobasidium pullulans.
Debaryomyces hansenii is classified as an ascomycetous yeast and associated with food
spoilage especially salted and low-water-activity foods. It can also be found in salty
water (Tokuoka, 1993, Kurtzman and Fell, 1998, Kurtzman and Robnett, 1998). It
usually uses traditional sausages and cheeses as a habitat and can contribute to the
production of special flavours (Seiler and Busse, 1990, Saldanha-da-Gama et al., 1997).
Therefore, the unusual ability of D. hansenii to sustain and thrive in high salinity has led
researchers to investigate its ability to accumulate lipids, which could be very important
for biotechnology applications such as oil production and degradation (Ratledge and
Tan, 1990). Furthermore, it has been recorded that D. hansenii can produce thermophilic
ß-glucosidases in wine production which are important in the production of alcohol-
based fuels (Saha and Bothast, 1996). In 2006, Breuer and Harms used D. hansenii in
the manufacture of many different foods such as dairy products and meat fermentation
(Breuer and Harms, 2006). Recent taxonomy divided D. hansenii into two varieties, D.
hansenii var. hansenii and D. hansenii var. fabryi, with different maximum growth
temperatures (Breuer and Harms, 2006). D. hansenii can ferment glucose, and has the
ability to assimilate α-methyl glucoside and cadaverine, whereas it cannot assimilate
nitrate (Kurtzman and Fell, 2000, Barnett et al., 2000, Senses-Ergul et al., 2006). In
previous chapter (section 3.2.6), these exact characteristics were found for RV4, strongly
supporting the molecular identification in this chapter (i.e. that RV4 is Debaryomyces
hansenii).

145
In the next chapter, the physiological adaptation of Debaryomyces hansenii (RV4) and
Micrococcus luteus (LV1) to different pH values and different high salinity
concentrations in M9 minimal and LB medium will be investigated.

146
CCHHAAPPTTEERR FFIIVVEE
147
5 Physiological Growth of Debaryomyces hansenii
(RV4) and Micrococcus luteus (LV1) Under Acidity
and Salinity
5.1 Introduction
Extremophilic microorganisms have the ability to grow and survive under extreme
environmental conditions that would be uncomfortable for the normal functioning of
humans (Gomes and Steiner, 2004). Several of these extremophiles are able to
withstand multiple extremes such as extreme acidity, high salinity and high
temperature (Irwin and Baird, 2004).
Recently, extremophiles have been isolated from environments where they are not
expected to be actively growing. Therefore, it is possible that acid tolerant or
halotolerant prokaryotes or eukaryotes can be isolated from a wide range of
environments including freshwater (Echigo et al., 2005). However, most organisms
have a relatively limited set of pH values and range of salt concentrations that
enable growth and also, the minimum, optimum and maximum pH values or salt
concentrations are often found to be dependent on the medium composition and
growth temperature (Ventosa et al., 1998, Oren, 2008). In 1990, Gilmour stated that
microorganisms requiring salt for growth can be divided into three groups: the first
group is slight halophiles including many marine organisms, seawater contains
about 0.5 M NaCl; second group is moderate halophiles that have optimal growth
between 0.2 and 2 M NaCl; third group is extreme halophiles with optimal growth
148
above 3 M NaCl. Furthermore, extremely halotolerant bacteria are able to grow and
survive over a wide range of NaCl (0.1 to 4.5 M) (Gilmour, 1990).
However, microorganisms have different mechanisms to cope with acidity or
salinity stresses depending on the stress encountered. For example, at high acidity
stress (low pH) there are passive and active pH regulation mechanisms. In passive
regulation the microorganisms produce biofilms to slow down the diffusion of
molecules into the cell, or change their cell membrane to incorporate substances
such as fatty acids that shield the cell against acidity, or they may secrete buffer
molecules which help to raise the external pH (Raven and Smith, 1973, Ahmed and
Booth, 1983, Booth, 1985). In addition, some microbes have the ability to pump
hydrogen ions out of their cells (active mechanisms) (Mitchell, 1973, Baronofsky et
al., 1984, Gonzalez-Toril et al., 2003). On the other hand, at high salinity
concentrations there are two mechanisms that help microorganisms to maintain the
osmotic equilibrium. Some microorganisms such as anaerobic bacteria (Rengpipat et
al., 1988) and halophilic archaea (Lanyi, 1974) are able to accumulate inorganic
ions like Na+ or K+ , while some methanogenic archaea (Robertson et al., 1990),
most halophilic bacteria (Severin et al., 1992) and halotolerant eukaryotes (Gunde-
Cimerman et al., 2009, Ben-Amotz and Avron, 1983) are able to accumulate or
synthesize organic osmolytes (compatible solutes) (Brown, 1976).
Thereby, the importance of these extremophiles or extreme-tolerant microorganisms
which adapt to grow and survive at both high acidity and high salinity is due to their
special unique characteristics that enable them to produce extremozymes like
amylase, cellulose, protease, catalase and lipase (Demirjian et al., 2001, van den
149
Burg, 2003) and compatible solutes including glycine betaine, proline, glycerol,
ectoine, alanine and sorbitol (Da Costa et al., 1998, Bremer and KrÃmer, 2000,
Demirjian et al., 2001, Gomes and Steiner, 2004).
In fact, compatible solutes allow organisms to adapt to a wide range of salinity
concentrations by adjusting the cytoplasm to the osmolarity of their environments,
and they also protect proteins, membranes, and even whole cells against
denaturation, inactivation, and inhibition by hyperosmotic stress (Yancey, 2005,
Schubert et al., 2007, Oren, 2008, Konrad and Bar-Zvi, 2008, Rajan et al., 2010, Ma
et al., 2010, Fallet et al., 2010). Moreover, the other reasons for the importance of
compatible solutes and extremozymes are due to the applications which can be
found in industrial biotechnology, medical biotechnology and other fields (Ratledge
and Tan, 1990, Hough and Danson, 1999, Demirjian et al., 2001, Irwin and Baird,
2004).
Nuclear magnetic resonance (NMR) spectroscopy is a suitable method for
determination of intracellular potential compatible solutes in cells after exposure to
high salinities (Landfald and Strom, 1986, Mendum and Smith, 2002). NMR has
been used to determine the compatible solutes in various Bacillus species (Bursy et
al., 2007); Halobacillus dabanensis (Gu et al., 2008); Salinivibrio costicola (Zhiu et
al., 2008), and Halomonas (Cummings et al., 1993), also NMR was used to detect
intact yeast cells and their compatible solutes (Salhany et al., 1975, Jovall et al.,
1990, Block et al., 2004).
150
Strain RV4 was identified in Chapter 4 as a strain of Debaryomyces hansenii and in
Chapter 3 D. hansenii (RV4) was shown to thrive in extreme low pH and flourish in
high salinity (Norkrans, 1966, Kreger-van Rij and W., 1984, Tokuoka, 1993,
Almagro et al., 2000). Strain LV1 was identified as a strain of Micrococcus luteus
in Chapter 4 and M. luteus (LV1) was shown to survive in pH 5 and thrive in high
salinity (Moriguchi et al., 1994, Madigan et al., 2009).
In the current chapter further studies are described that investigate the ability of the
two strains to grow under many extreme stresses simultaneously such as low
nutrients, low pH and high salinity. Furthermore, compatible solutes in both strains
were determined using NMR spectroscopy and the effect of sulphur, aluminium and
iron on the growth rate in M9 minimal medium was measured. In addition, the
electron microscope was used to analyze D. hansenii and M. luteus cells grown
under different conditions such as low nutrients, neutral pH and low pH in order to
investigate any changes to the cell structure in response to different stresses.
5.2 Results and Discussion
5.2.1 Electron Microscope Analysis of Debaryomyces hansenii (RV4) and
Micrococcus luteus (LV1) Cells Grown at pH 3 and pH 7
Scanning and transmission electron microscopes were used to observe any changes
in the external structures of the cells of both D. hansenii and M. luteus under
moderate and low pH values in low nutrient medium (M9 minimal medium). The
analysis was carried out in the Biomedical Science Department (The University of
Sheffield) as described in section 2.19.
151
Figure 5-1 shows scanning electron microscope images of D. hansenii grown at pH
3 (A and B) and at pH 7 (B and C), the main change observed was that the cells
grown at pH 7 were larger than the cells grown at pH 3. Moreover, a transmission
electron microscope was used to examine ultra-thin sections of D. hansenii cells
grown under both conditions (Figure 5-2), the high resolution micrographs show
that no significant changes were observed between cells at pH 3 (Figure 5-2; A1,
A2) or pH 7 (Figure 5-3; B1, B2).
The same procedure was performed to investigate any changes that may accrue to
M. luteus cells grown under acid stress in M9 minimal medium. However, despite
previous results showing poor growth of M. luteus at low pH (Chapter three), there
were no visible changes in the external structure of M. luteus cells observed when
using the scanning electron microscope (Figure 5-3; pH 3; A, B. pH 7; C, D).
However, high resolution TEM images of ultra-thin sections of overnight M. luteus
cells grown in M9 medium at pH 3 (Figure 5-4; A1, A2) and pH 7 (Figure 5-4; B1,
B2) show that the cell walls of cells grown at pH 3 were thicker than cell walls of
cells grown at pH 7. Also it was noted that some large vacuoles were found in M.
luteus cells when they were grown at pH 3 while no vacuoles were observed in cells
when they were grown at pH 7. In addition, M. luteus cells appeared to form clumps
more readily when grown at low pH which may help them to cope with the acidity
and sustain life (Figure 5-4). The good quality SEM and TEM images of both
microorganisms confirmed the phenotypic and phylogenic identifications arrived at
in Chapters 3 and 4.
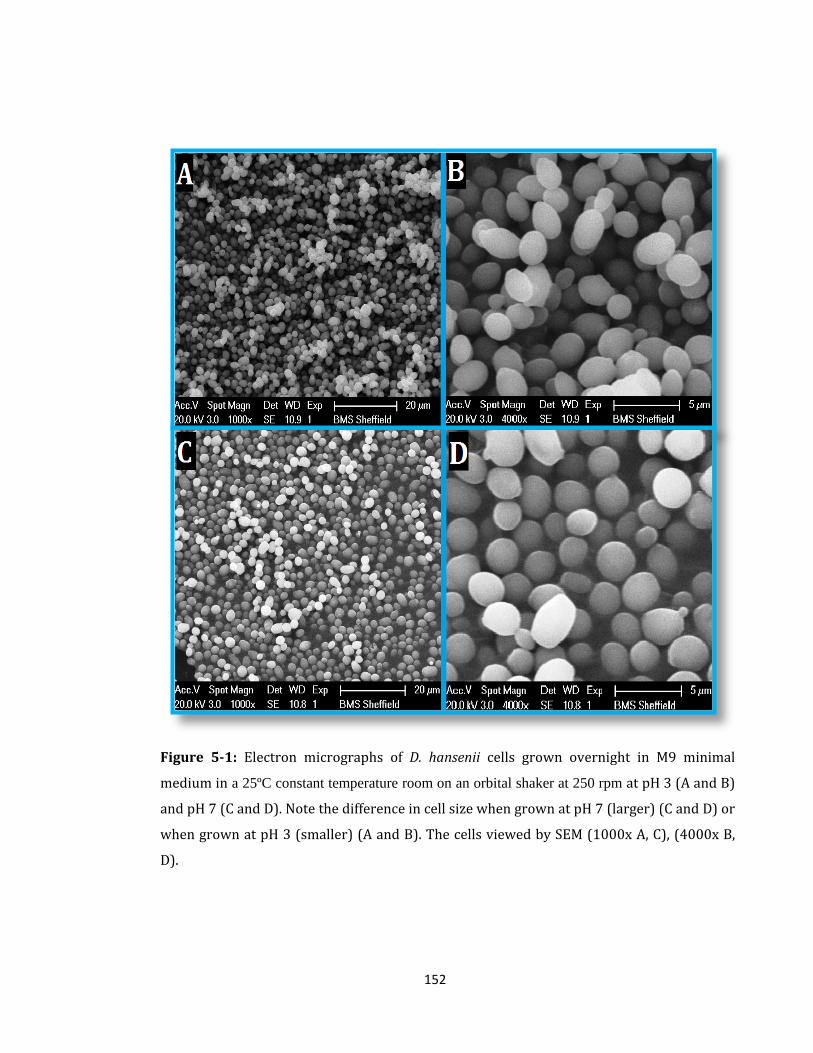
152
Figure 5-1: Electron micrographs of D. hansenii cells grown overnight in M9 minimal
medium in a 25ºC constant temperature room on an orbital shaker at 250 rpm at pH 3 (A and B)
and pH 7 (C and D). Note the difference in cell size when grown at pH 7 (larger) (C and D) or
when grown at pH 3 (smaller) (A and B). The cells viewed by SEM (1000x A, C), (4000x B,
D).
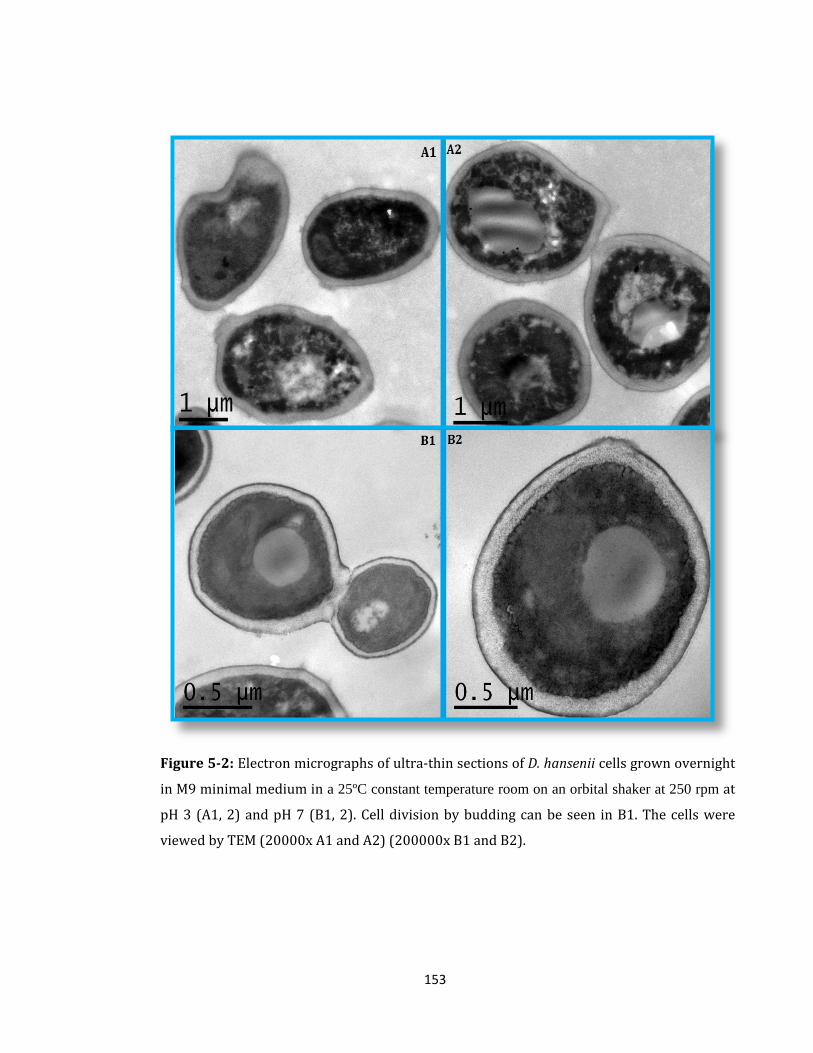
153
Figure 5-2: Electron micrographs of ultra-thin sections of D. hansenii cells grown overnight
in M9 minimal medium in a 25ºC constant temperature room on an orbital shaker at 250 rpm at
pH 3 (A1, 2) and pH 7 (B1, 2). Cell division by budding can be seen in B1. The cells were
viewed by TEM (20000x A1 and A2) (200000x B1 and B2).
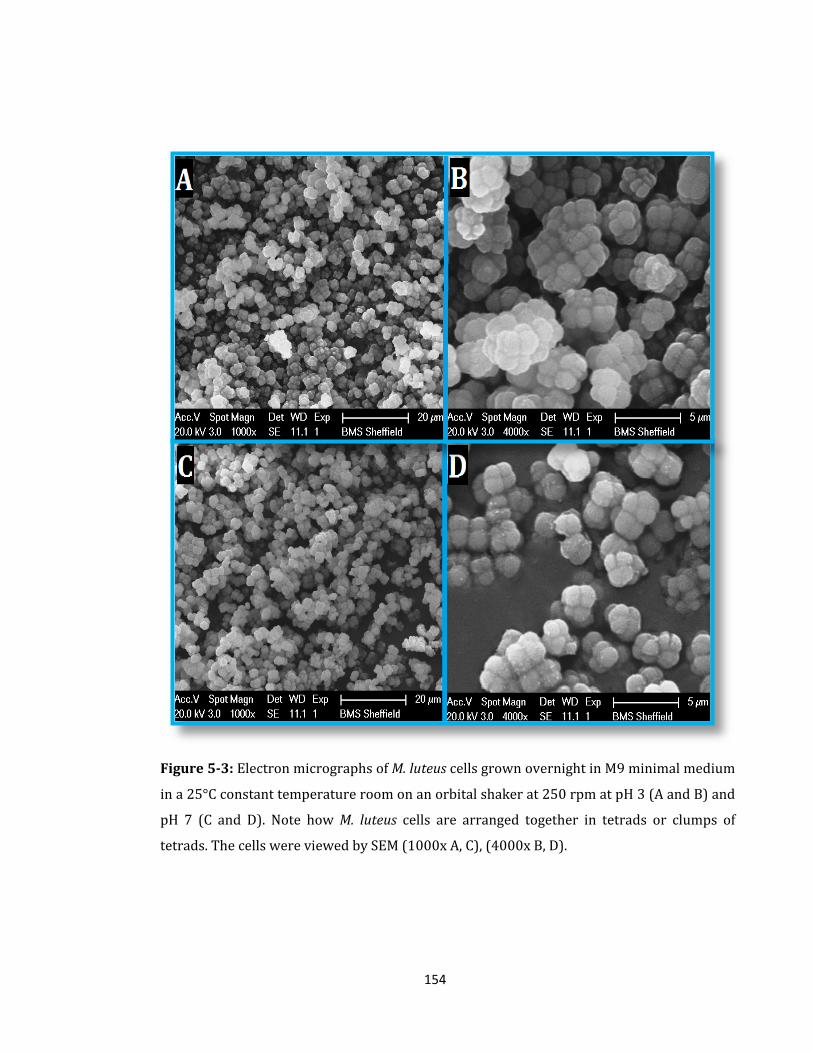
154
Figure 5-3: Electron micrographs of M. luteus cells grown overnight in M9 minimal medium
in a 25°C constant temperature room on an orbital shaker at 250 rpm at pH 3 (A and B) and
pH 7 (C and D). Note how M. luteus cells are arranged together in tetrads or clumps of
tetrads. The cells were viewed by SEM (1000x A, C), (4000x B, D).
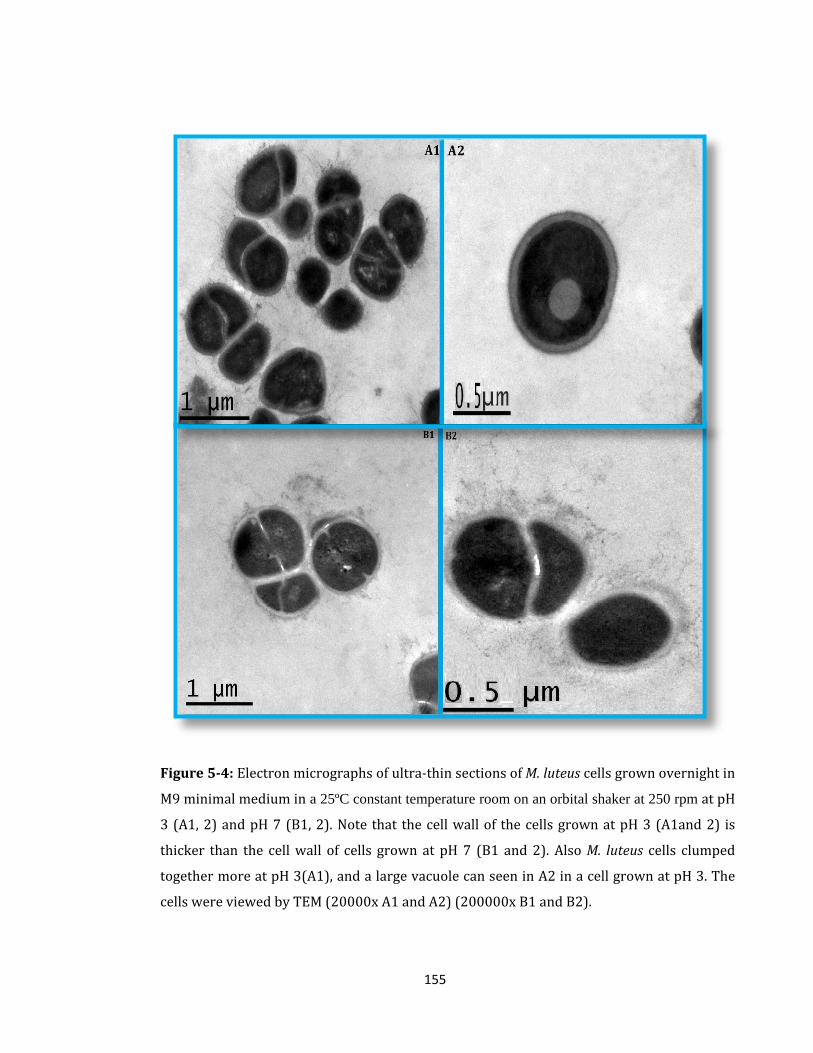
155
Figure 5-4: Electron micrographs of ultra-thin sections of M. luteus cells grown overnight in
M9 minimal medium in a 25ºC constant temperature room on an orbital shaker at 250 rpm at pH
3 (A1, 2) and pH 7 (B1, 2). Note that the cell wall of the cells grown at pH 3 (A1and 2) is
thicker than the cell wall of cells grown at pH 7 (B1 and 2). Also M. luteus cells clumped
together more at pH 3(A1), and a large vacuole can seen in A2 in a cell grown at pH 3. The
cells were viewed by TEM (20000x A1 and A2) (200000x B1 and B2).
156
5.2.2 Effect of External pH Medium on Growth Rate of D. hansenii and M. luteus
In section 3.2.7, the effect of external pH on the growth rates of D. hansenii (RV4)
and M. luteus (LV1) was measured in ½ LB and M9 medium. To further investigate
the effect of pH on growth of the two organisms, the same protocol was carried out
with other two other media, YPD the standard medium for D. hansenii and LB the
standard medium for M. luteus. Growth rates were produced for both strains at pH 3,
5 and 7. Growth was quantified by direct optical density (OD) readings at 600 nm
measured with Unicam Helisα spectrophotometer.
Figure 5-5 shows very good growth of D. hansenii cells at pH 5 and pH 7 while
lower growth was seen at pH 3, which differs from the results accrued when cells
were grown in M9 and ½ LB medium (section 3.2.7), where growth was similar in
all pH values in M9 and ½ medium. Growth at pH 3 in YPD medium is comparable
to the growth at pH 3 in M9 and ½ LB medium (Table 5-1 and Figure 5-6). So, the
biggest difference is the fast growth rates found at pH 5 and pH 7 in YPD medium
in comparison to growth at the same pH in M9 and ½ LB medium.
M. luteus cells also grew best at neutral pH in LB medium (Figure 5-7), but
significantly higher growth rates were found in LB medium at all pH values. The
doubling times show clearly that M. luteus prefers enriched media rather than low
nutrient media (Table 5-2 and Figure 5-8).
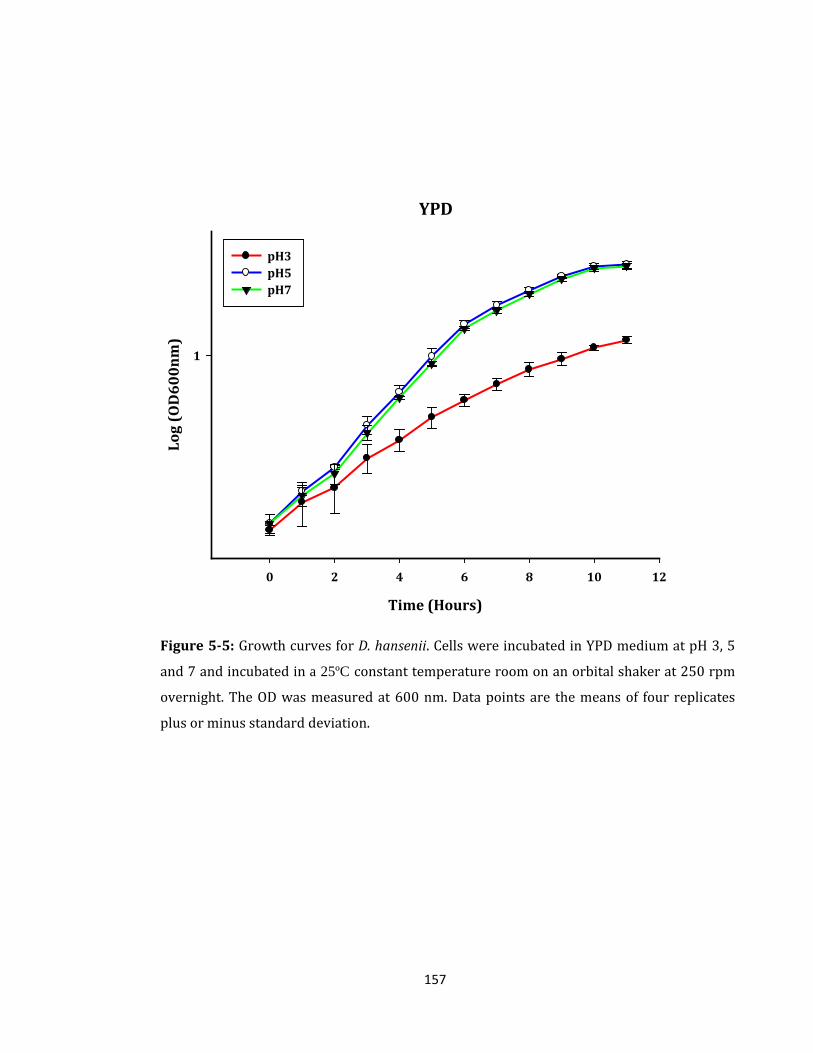
157
YPD
Time (Hours)
0 2 4 6 8 10 12
Log
(OD
60
0n
m)
1
pH3 pH5 pH7
Figure 5-5: Growth curves for D. hansenii. Cells were incubated in YPD medium at pH 3, 5
and 7 and incubated in a 25ºC constant temperature room on an orbital shaker at 250 rpm
overnight. The OD was measured at 600 nm. Data points are the means of four replicates
plus or minus standard deviation.
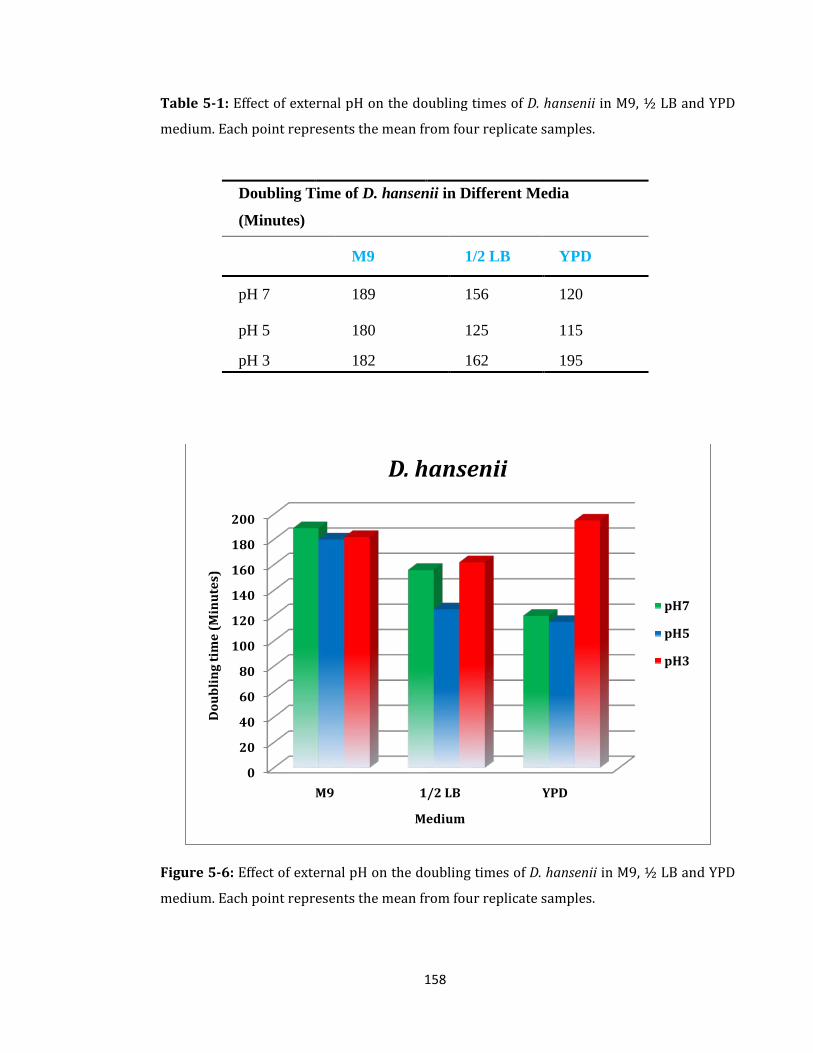
158
Table 5-1: Effect of external pH on the doubling times of D. hansenii in M9, ½ LB and YPD
medium. Each point represents the mean from four replicate samples.
Doubling Time of D. hansenii in Different Media
(Minutes)
M9 1/2 LB YPD
pH 7 189 156 120
pH 5 180 125 115
pH 3 182 162 195
Figure 5-6: Effect of external pH on the doubling times of D. hansenii in M9, ½ LB and YPD
medium. Each point represents the mean from four replicate samples.
0
20
40
60
80
100
120
140
160
180
200
M9 1/2 LB YPD
Dou
bli
ng
tim
e (M
inu
tes)
Medium
D. hansenii
pH7
pH5
pH3
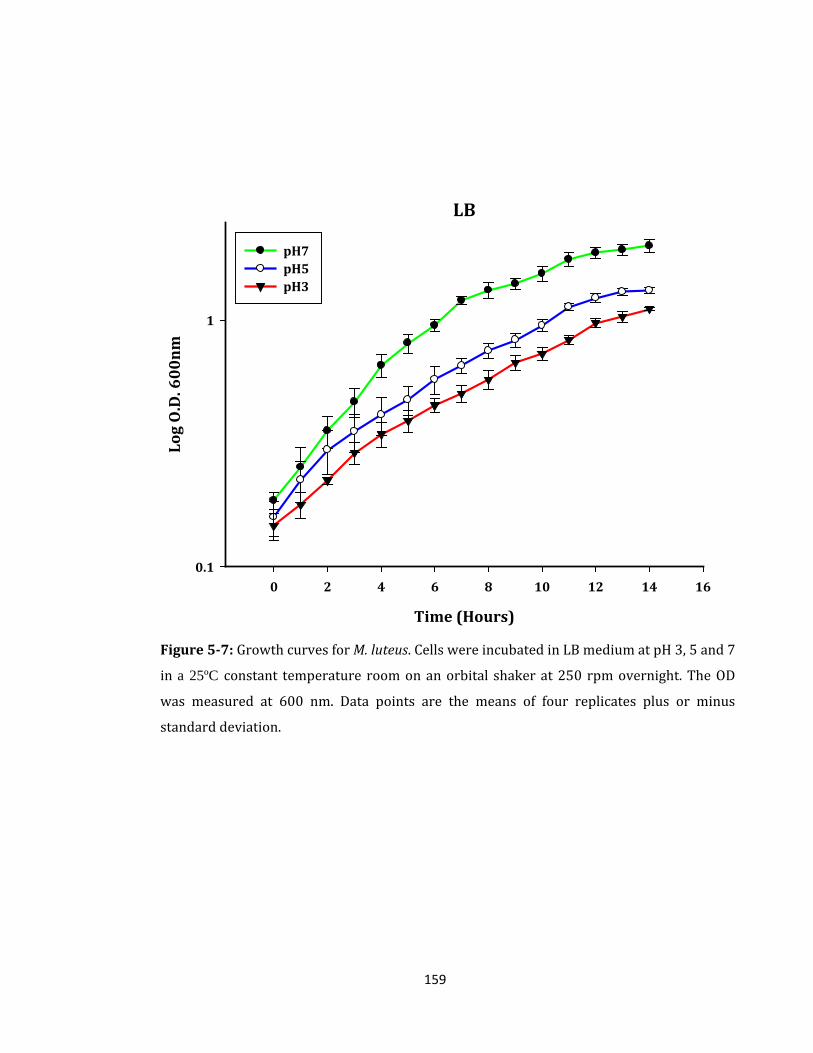
159
LB
Time (Hours)
0 2 4 6 8 10 12 14 16
Log
O.D
. 60
0n
m
0.1
1
pH7 pH5 pH3
Figure 5-7: Growth curves for M. luteus. Cells were incubated in LB medium at pH 3, 5 and 7
in a 25ºC constant temperature room on an orbital shaker at 250 rpm overnight. The OD
was measured at 600 nm. Data points are the means of four replicates plus or minus
standard deviation.
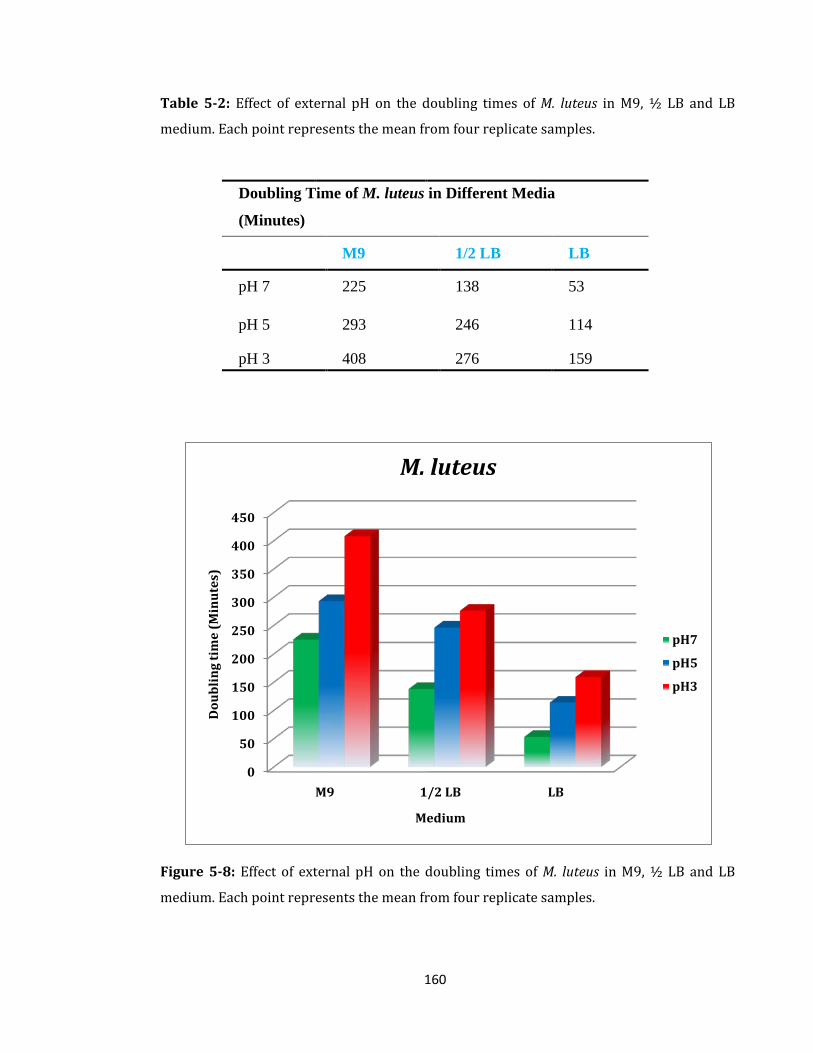
160
Table 5-2: Effect of external pH on the doubling times of M. luteus in M9, ½ LB and LB
medium. Each point represents the mean from four replicate samples.
Doubling Time of M. luteus in Different Media
(Minutes)
M9 1/2 LB LB
pH 7 225 138 53
pH 5 293 246 114
pH 3 408 276 159
Figure 5-8: Effect of external pH on the doubling times of M. luteus in M9, ½ LB and LB
medium. Each point represents the mean from four replicate samples.
0
50
100
150
200
250
300
350
400
450
M9 1/2 LB LB
Dou
bli
ng
tim
e (M
inu
tes)
Medium
M. luteus
pH7
pH5
pH3
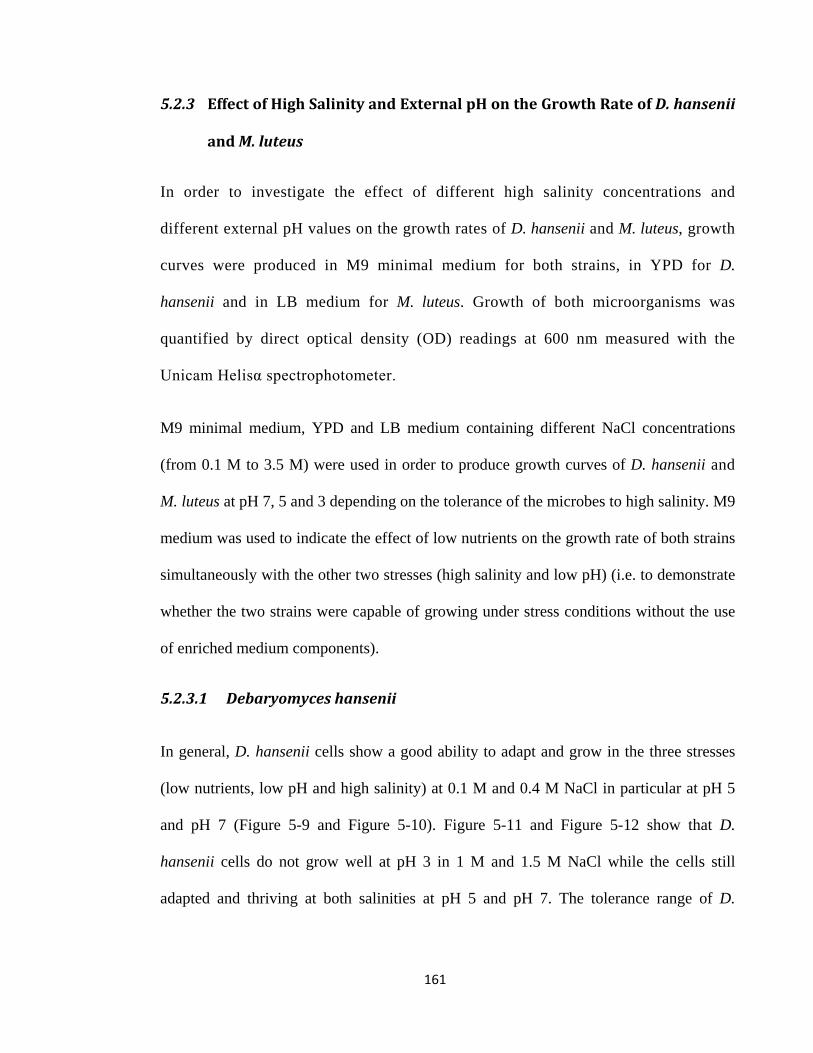
161
5.2.3 Effect of High Salinity and External pH on the Growth Rate of D. hansenii
and M. luteus
In order to investigate the effect of different high salinity concentrations and
different external pH values on the growth rates of D. hansenii and M. luteus, growth
curves were produced in M9 minimal medium for both strains, in YPD for D.
hansenii and in LB medium for M. luteus. Growth of both microorganisms was
quantified by direct optical density (OD) readings at 600 nm measured with the
Unicam Helisα spectrophotometer.
M9 minimal medium, YPD and LB medium containing different NaCl concentrations
(from 0.1 M to 3.5 M) were used in order to produce growth curves of D. hansenii and
M. luteus at pH 7, 5 and 3 depending on the tolerance of the microbes to high salinity. M9
medium was used to indicate the effect of low nutrients on the growth rate of both strains
simultaneously with the other two stresses (high salinity and low pH) (i.e. to demonstrate
whether the two strains were capable of growing under stress conditions without the use
of enriched medium components).
5.2.3.1 Debaryomyces hansenii
In general, D. hansenii cells show a good ability to adapt and grow in the three stresses
(low nutrients, low pH and high salinity) at 0.1 M and 0.4 M NaCl in particular at pH 5
and pH 7 (Figure 5-9 and Figure 5-10). Figure 5-11 and Figure 5-12 show that D.
hansenii cells do not grow well at pH 3 in 1 M and 1.5 M NaCl while the cells still
adapted and thriving at both salinities at pH 5 and pH 7. The tolerance range of D.
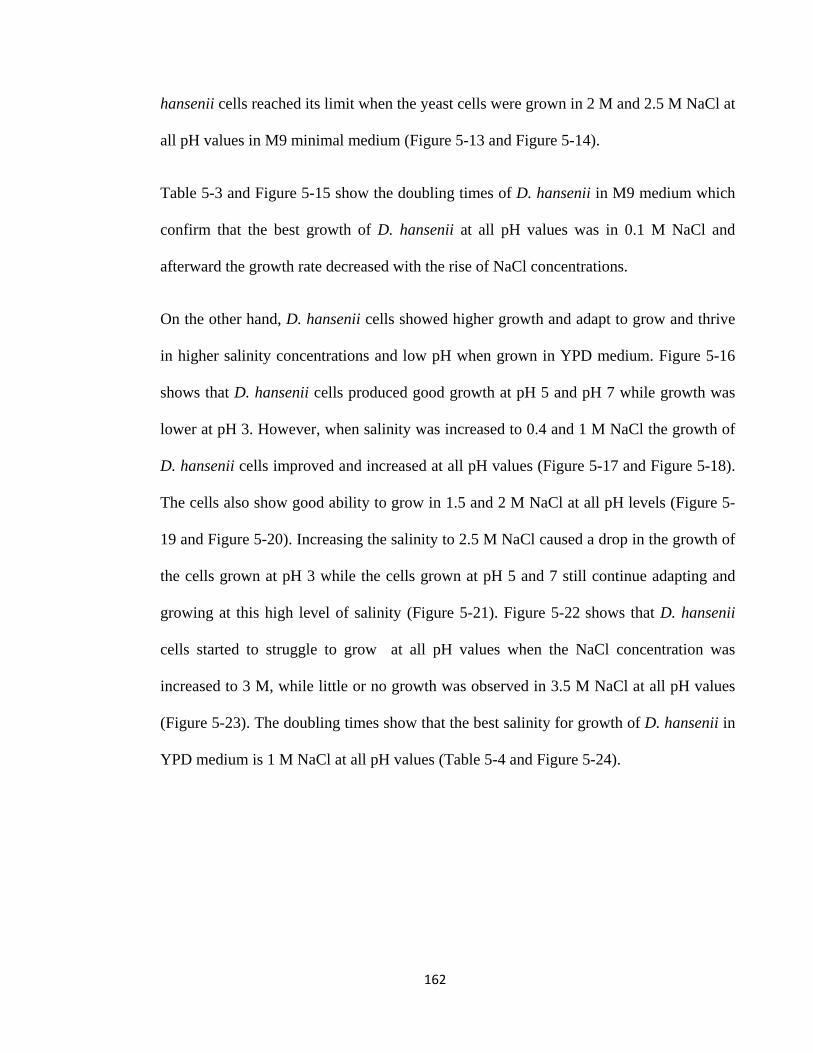
162
hansenii cells reached its limit when the yeast cells were grown in 2 M and 2.5 M NaCl at
all pH values in M9 minimal medium (Figure 5-13 and Figure 5-14).
Table 5-3 and Figure 5-15 show the doubling times of D. hansenii in M9 medium which
confirm that the best growth of D. hansenii at all pH values was in 0.1 M NaCl and
afterward the growth rate decreased with the rise of NaCl concentrations.
On the other hand, D. hansenii cells showed higher growth and adapt to grow and thrive
in higher salinity concentrations and low pH when grown in YPD medium. Figure 5-16
shows that D. hansenii cells produced good growth at pH 5 and pH 7 while growth was
lower at pH 3. However, when salinity was increased to 0.4 and 1 M NaCl the growth of
D. hansenii cells improved and increased at all pH values (Figure 5-17 and Figure 5-18).
The cells also show good ability to grow in 1.5 and 2 M NaCl at all pH levels (Figure 5-
19 and Figure 5-20). Increasing the salinity to 2.5 M NaCl caused a drop in the growth of
the cells grown at pH 3 while the cells grown at pH 5 and 7 still continue adapting and
growing at this high level of salinity (Figure 5-21). Figure 5-22 shows that D. hansenii
cells started to struggle to grow at all pH values when the NaCl concentration was
increased to 3 M, while little or no growth was observed in 3.5 M NaCl at all pH values
(Figure 5-23). The doubling times show that the best salinity for growth of D. hansenii in
YPD medium is 1 M NaCl at all pH values (Table 5-4 and Figure 5-24).
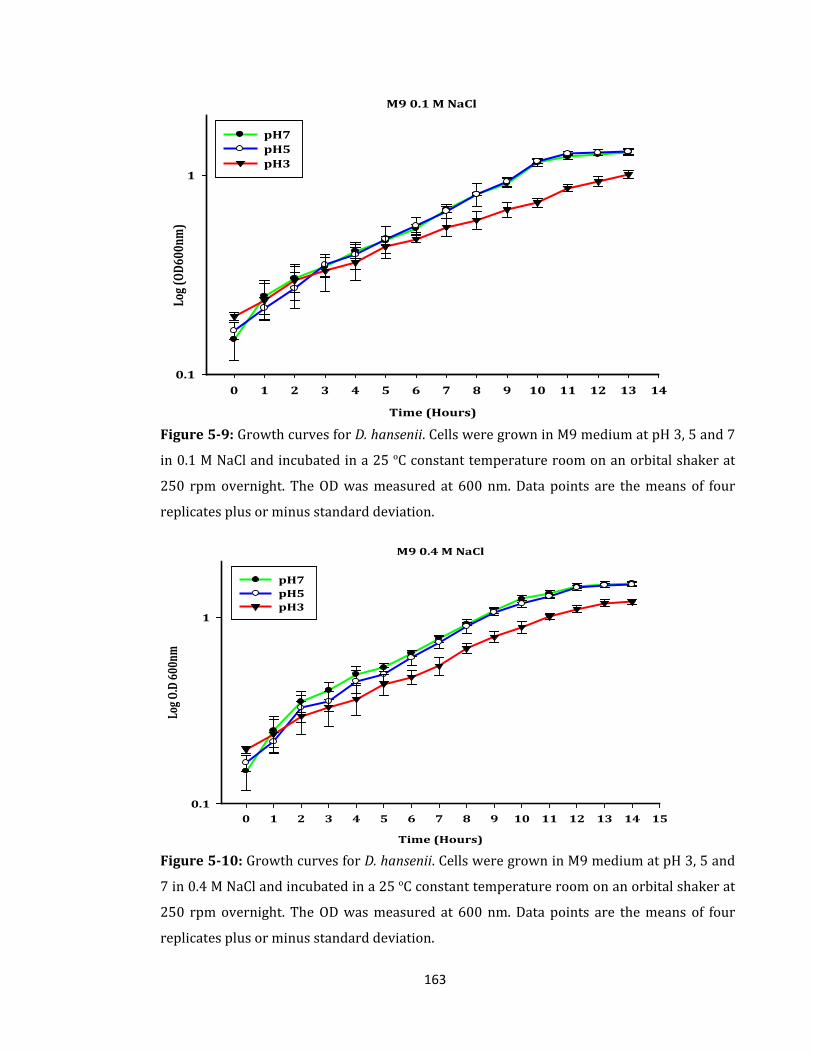
163
M9 0.1 M NaCl
Time (Hours)
0 1 2 3 4 5 6 7 8 9 10 11 12 13 140.1
1
pH7pH5 pH3
Log
(OD6
00nm
)
Figure 5-9: Growth curves for D. hansenii. Cells were grown in M9 medium at pH 3, 5 and 7
in 0.1 M NaCl and incubated in a 25 ºC constant temperature room on an orbital shaker at
250 rpm overnight. The OD was measured at 600 nm. Data points are the means of four
replicates plus or minus standard deviation.
M9 0.4 M NaCl
Time (Hours)
0 1 2 3 4 5 6 7 8 9 10 11 12 13 14 15
Log O
.D 6
00nm
0.1
1
pH7 pH5 pH3
Figure 5-10: Growth curves for D. hansenii. Cells were grown in M9 medium at pH 3, 5 and
7 in 0.4 M NaCl and incubated in a 25 ºC constant temperature room on an orbital shaker at
250 rpm overnight. The OD was measured at 600 nm. Data points are the means of four
replicates plus or minus standard deviation.
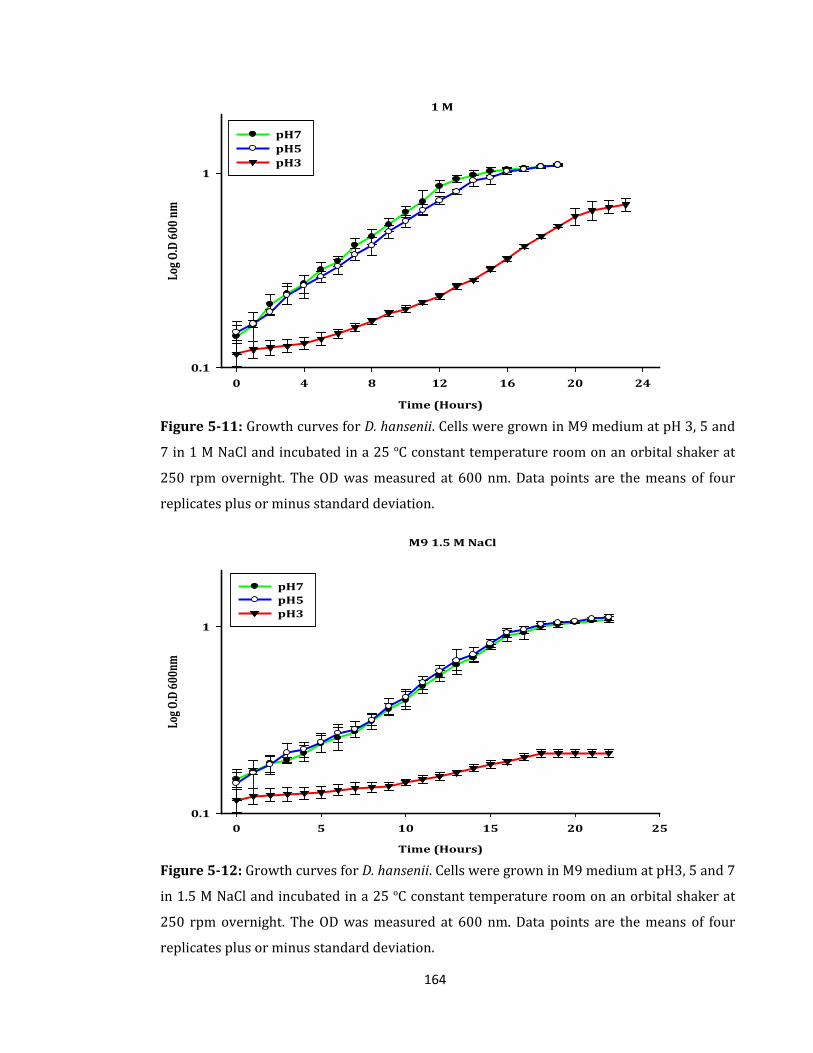
164
1 M
Time (Hours)
0 4 8 12 16 20 24
Log
O.D
600
nm
0.1
1
pH7 pH5 pH3
Figure 5-11: Growth curves for D. hansenii. Cells were grown in M9 medium at pH 3, 5 and
7 in 1 M NaCl and incubated in a 25 ºC constant temperature room on an orbital shaker at
250 rpm overnight. The OD was measured at 600 nm. Data points are the means of four
replicates plus or minus standard deviation.
M9 1.5 M NaCl
Time (Hours)
0 5 10 15 20 25
Log O
.D 6
00nm
0.1
1
pH7 pH5 pH3
Figure 5-12: Growth curves for D. hansenii. Cells were grown in M9 medium at pH3, 5 and 7
in 1.5 M NaCl and incubated in a 25 ºC constant temperature room on an orbital shaker at
250 rpm overnight. The OD was measured at 600 nm. Data points are the means of four
replicates plus or minus standard deviation.
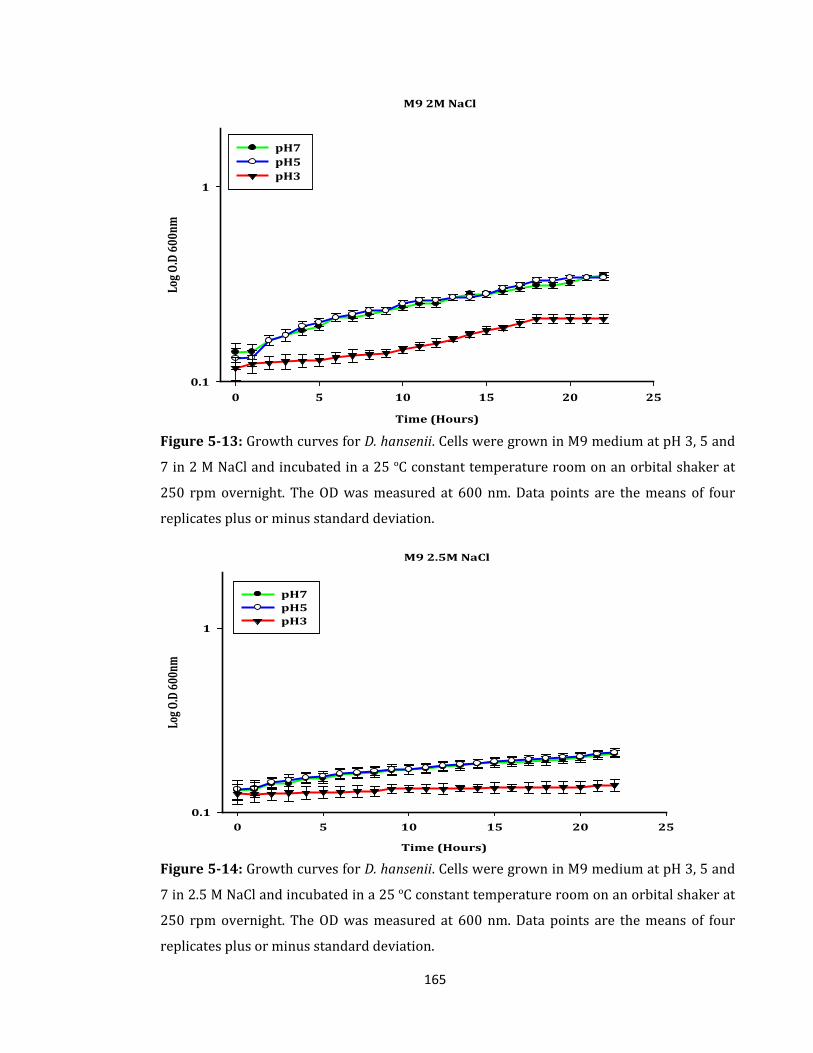
165
M9 2M NaCl
Time (Hours)
0 5 10 15 20 25
Log
O.D
600n
m
0.1
1
pH7 pH5 pH3
Figure 5-13: Growth curves for D. hansenii. Cells were grown in M9 medium at pH 3, 5 and
7 in 2 M NaCl and incubated in a 25 ºC constant temperature room on an orbital shaker at
250 rpm overnight. The OD was measured at 600 nm. Data points are the means of four
replicates plus or minus standard deviation.
M9 2.5M NaCl
Time (Hours)
0 5 10 15 20 25
Log O
.D 6
00nm
0.1
1
pH7 pH5 pH3
Figure 5-14: Growth curves for D. hansenii. Cells were grown in M9 medium at pH 3, 5 and
7 in 2.5 M NaCl and incubated in a 25 ºC constant temperature room on an orbital shaker at
250 rpm overnight. The OD was measured at 600 nm. Data points are the means of four
replicates plus or minus standard deviation.
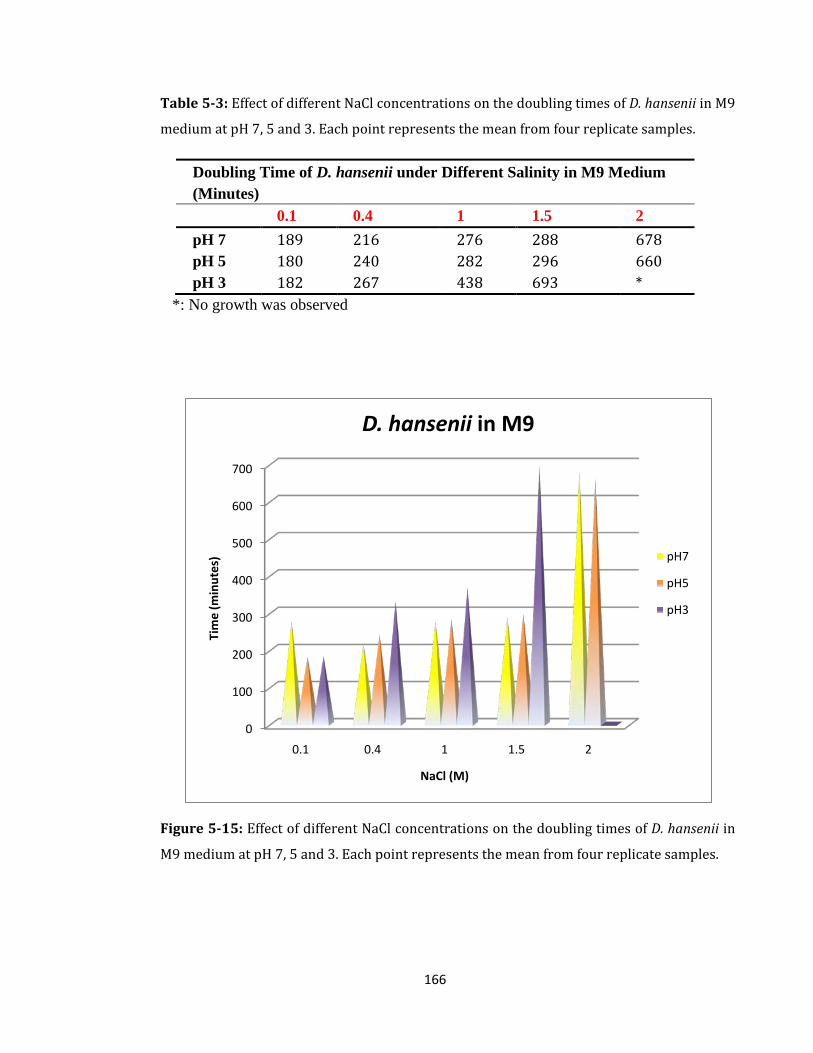
166
Table 5-3: Effect of different NaCl concentrations on the doubling times of D. hansenii in M9
medium at pH 7, 5 and 3. Each point represents the mean from four replicate samples.
Doubling Time of D. hansenii under Different Salinity in M9 Medium (Minutes) 0.1 0.4 1 1.5 2 pH 7 189 216 276 288 678 pH 5 180 240 282 296 660 pH 3 182 267 438 693 *
*: No growth was observed
Figure 5-15: Effect of different NaCl concentrations on the doubling times of D. hansenii in
M9 medium at pH 7, 5 and 3. Each point represents the mean from four replicate samples.
0
100
200
300
400
500
600
700
0.1 0.4 1 1.5 2
Tim
e (m
inut
es)
NaCl (M)
D. hansenii in M9
pH7
pH5
pH3
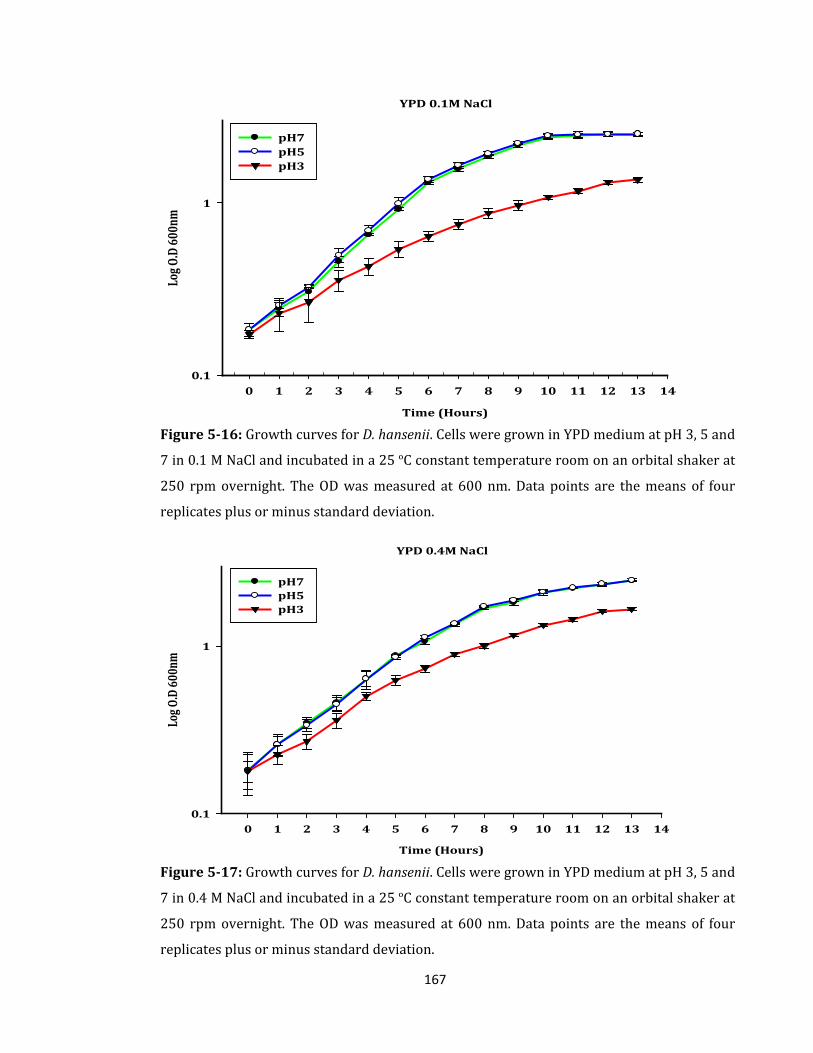
167
YPD 0.1M NaCl
Time (Hours)
0 1 2 3 4 5 6 7 8 9 10 11 12 13 14
Log
O.D
600n
m
0.1
1
pH7 pH5 pH3
Figure 5-16: Growth curves for D. hansenii. Cells were grown in YPD medium at pH 3, 5 and
7 in 0.1 M NaCl and incubated in a 25 ºC constant temperature room on an orbital shaker at
250 rpm overnight. The OD was measured at 600 nm. Data points are the means of four
replicates plus or minus standard deviation.
YPD 0.4M NaCl
Time (Hours)
0 1 2 3 4 5 6 7 8 9 10 11 12 13 14
Log O
.D 6
00nm
0.1
1
pH7 pH5pH3
Figure 5-17: Growth curves for D. hansenii. Cells were grown in YPD medium at pH 3, 5 and
7 in 0.4 M NaCl and incubated in a 25 ºC constant temperature room on an orbital shaker at
250 rpm overnight. The OD was measured at 600 nm. Data points are the means of four
replicates plus or minus standard deviation.
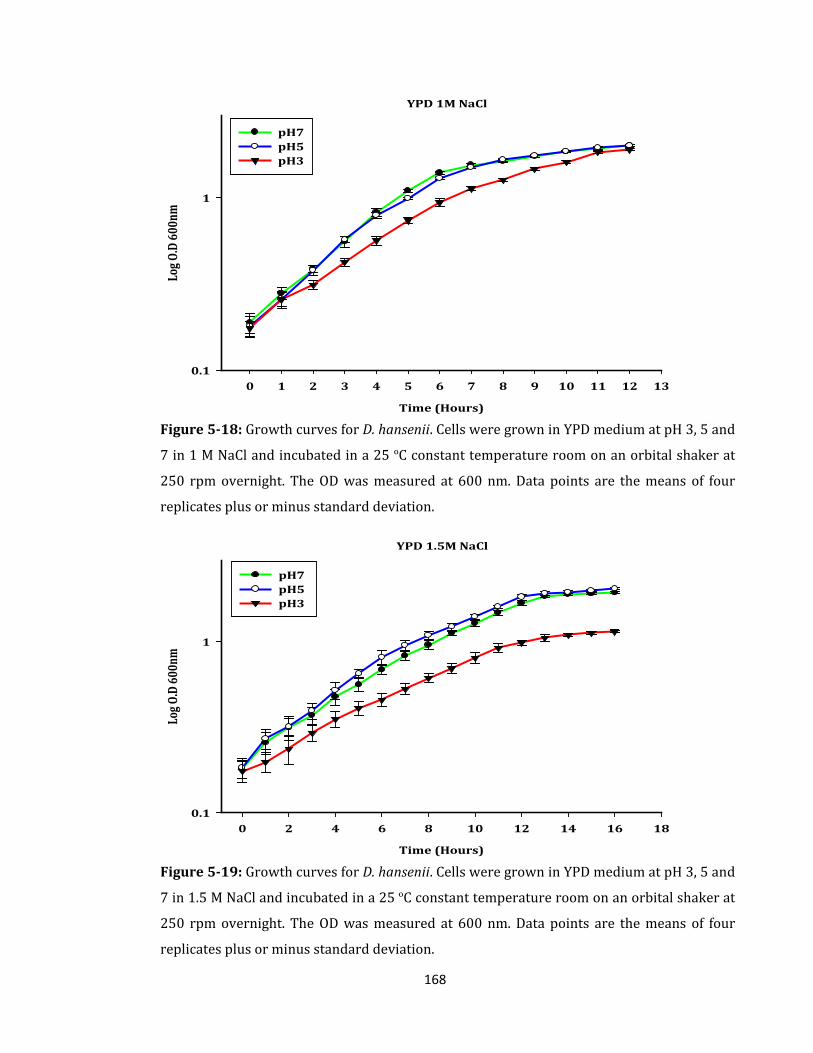
168
YPD 1M NaCl
Time (Hours)
0 1 2 3 4 5 6 7 8 9 10 11 12 13
Log
O.D
600n
m
0.1
1
pH7pH5pH3
Figure 5-18: Growth curves for D. hansenii. Cells were grown in YPD medium at pH 3, 5 and
7 in 1 M NaCl and incubated in a 25 ºC constant temperature room on an orbital shaker at
250 rpm overnight. The OD was measured at 600 nm. Data points are the means of four
replicates plus or minus standard deviation.
YPD 1.5M NaCl
Time (Hours)
0 2 4 6 8 10 12 14 16 18
Log
O.D
600n
m
0.1
1
pH7 pH5pH3
Figure 5-19: Growth curves for D. hansenii. Cells were grown in YPD medium at pH 3, 5 and
7 in 1.5 M NaCl and incubated in a 25 ºC constant temperature room on an orbital shaker at
250 rpm overnight. The OD was measured at 600 nm. Data points are the means of four
replicates plus or minus standard deviation.
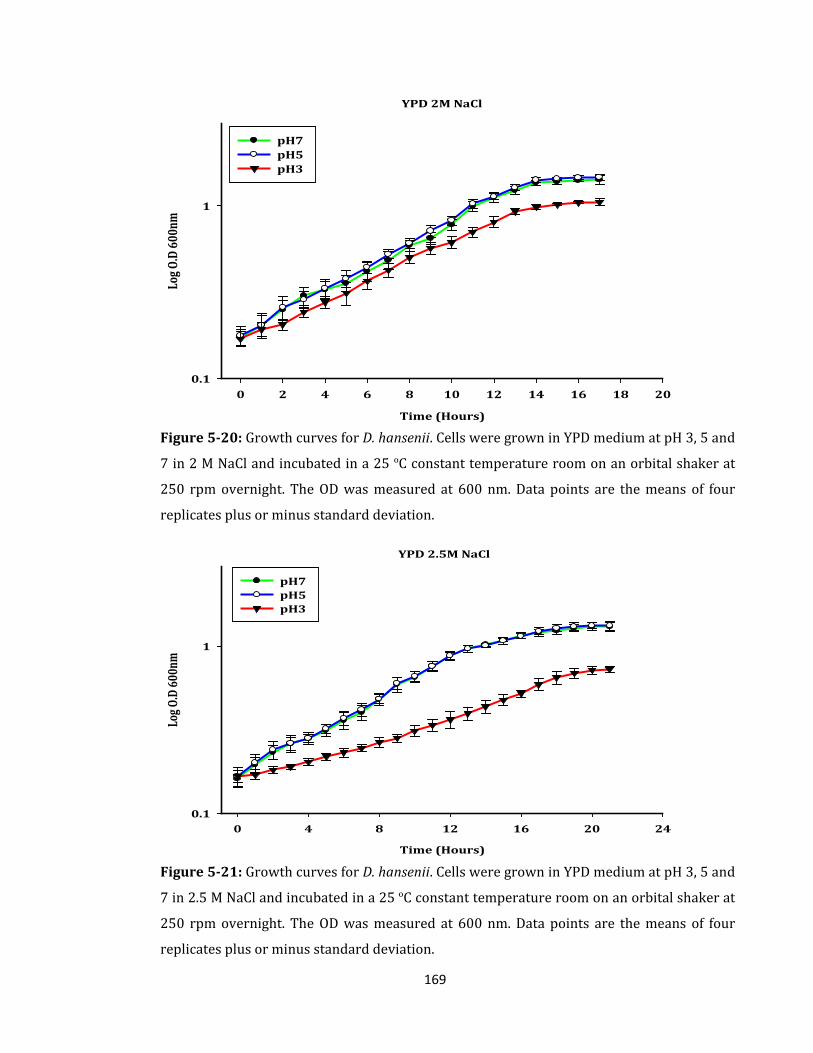
169
YPD 2M NaCl
Time (Hours)
0 2 4 6 8 10 12 14 16 18 20
Log
O.D
600n
m
0.1
1
pH7 pH5 pH3
Figure 5-20: Growth curves for D. hansenii. Cells were grown in YPD medium at pH 3, 5 and
7 in 2 M NaCl and incubated in a 25 ºC constant temperature room on an orbital shaker at
250 rpm overnight. The OD was measured at 600 nm. Data points are the means of four
replicates plus or minus standard deviation.
YPD 2.5M NaCl
Time (Hours)
0 4 8 12 16 20 24
Log O
.D 6
00nm
0.1
1
pH7 pH5 pH3
Figure 5-21: Growth curves for D. hansenii. Cells were grown in YPD medium at pH 3, 5 and
7 in 2.5 M NaCl and incubated in a 25 ºC constant temperature room on an orbital shaker at
250 rpm overnight. The OD was measured at 600 nm. Data points are the means of four
replicates plus or minus standard deviation.
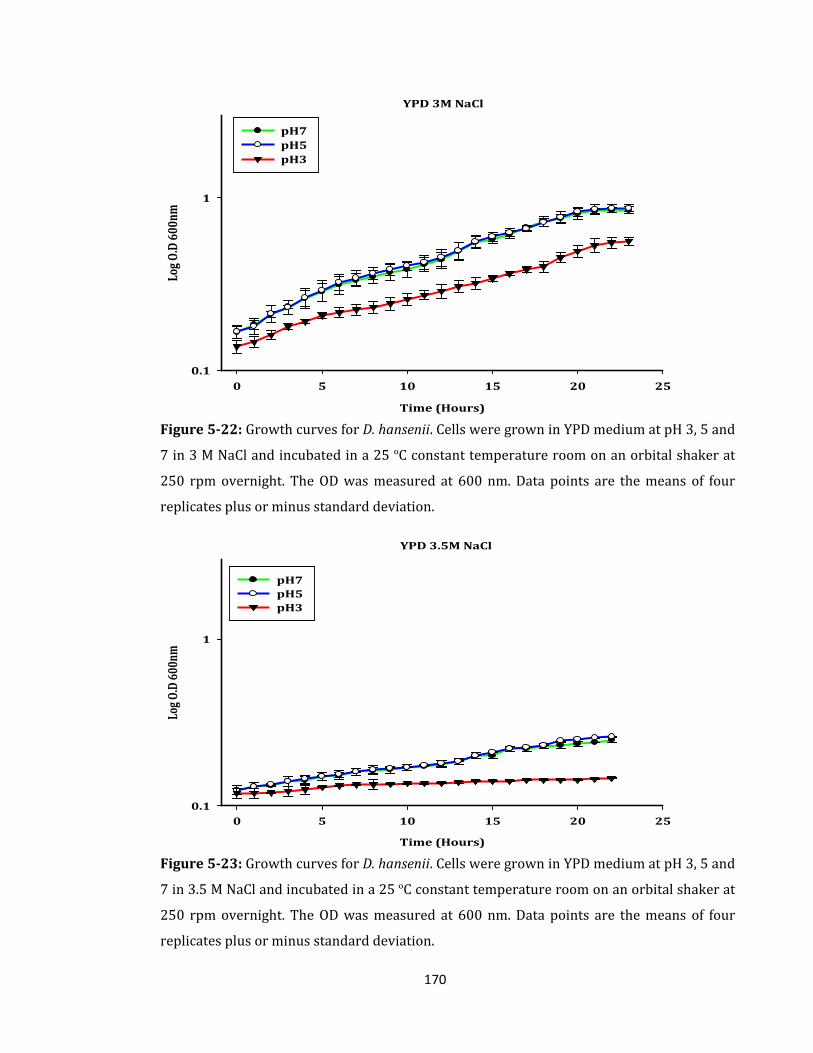
170
YPD 3M NaCl
Time (Hours)
0 5 10 15 20 25
Log
O.D
600n
m
0.1
1
pH7 pH5 pH3
Figure 5-22: Growth curves for D. hansenii. Cells were grown in YPD medium at pH 3, 5 and
7 in 3 M NaCl and incubated in a 25 ºC constant temperature room on an orbital shaker at
250 rpm overnight. The OD was measured at 600 nm. Data points are the means of four
replicates plus or minus standard deviation.
YPD 3.5M NaCl
Time (Hours)
0 5 10 15 20 25
Log O
.D 6
00nm
0.1
1
pH7 pH5 pH3
Figure 5-23: Growth curves for D. hansenii. Cells were grown in YPD medium at pH 3, 5 and
7 in 3.5 M NaCl and incubated in a 25 ºC constant temperature room on an orbital shaker at
250 rpm overnight. The OD was measured at 600 nm. Data points are the means of four
replicates plus or minus standard deviation.
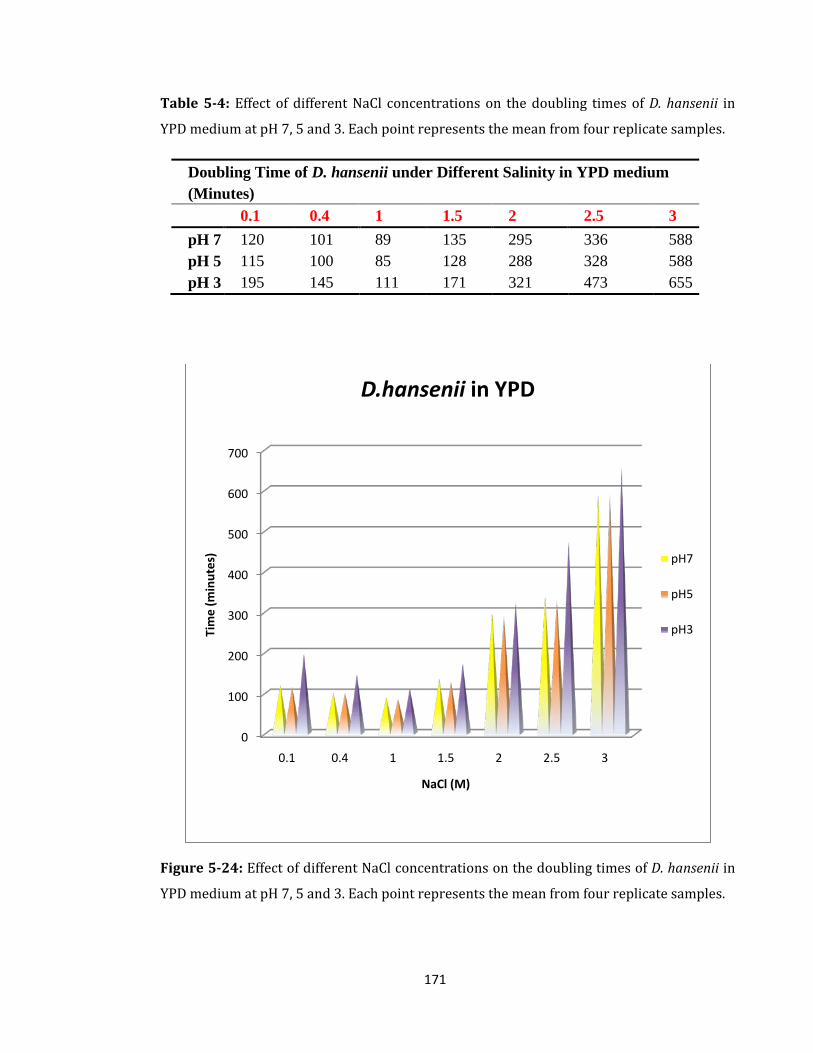
171
Table 5-4: Effect of different NaCl concentrations on the doubling times of D. hansenii in
YPD medium at pH 7, 5 and 3. Each point represents the mean from four replicate samples.
Doubling Time of D. hansenii under Different Salinity in YPD medium (Minutes) 0.1 0.4 1 1.5 2 2.5 3 pH 7 120 101 89 135 295 336 588 pH 5 115 100 85 128 288 328 588 pH 3 195 145 111 171 321 473 655
Figure 5-24: Effect of different NaCl concentrations on the doubling times of D. hansenii in
YPD medium at pH 7, 5 and 3. Each point represents the mean from four replicate samples.
0
100
200
300
400
500
600
700
0.1 0.4 1 1.5 2 2.5 3
Tim
e (m
inut
es)
NaCl (M)
D.hansenii in YPD
pH7
pH5
pH3
172
5.2.3.2 Micrococcus luteus
Generally, the growth curves for M. luteus in M9 medium in different pH values and at
various NaCl concentrations showed the limited ability of M. luteus to adapt and thrive in
low nutrient medium at low pH values. However, the bacterial cells were able to adapt
and grow at pH 3, 5 and 7 in 0.1 M NaCl (Figure 5-25). Figure 5-26 shows that
increasing the NaCl concentration to 0.4 M partially inhibited growth at all pH values. M.
luteus cells were unable to adapt when grown in the presence of 1 M NaCl at all pH
values in M9 medium (Figure 5-27). The doubling times show that the best growth of M.
luteus cells in M9 minimal medium was in 0.1 M NaCl at pH7 (Table 5-5 and Figure 5-
28).
Unlike in M9 medium, M. luteus cells showed good adaptation and higher growth in LB
medium at different pH values and different NaCl concentrations. The best growth for M.
luteus cells occurred at pH 3 in 0.1 M NaCl (Figure 5-29), while the highest growth at pH
7 and pH 5 occurred when cells were grown in 0.4 M NaCl (Figure 5-30). Figure 5-31
shows that M. luteus was still able to adapt and thrive in 1 M NaCl at pH 7, 5 and 3.
However, when M. luteus cells were grown in 1.5 M NaCl, the growth at pH 3 decreased
while the cells continue to adapt and grow at pH 7 and pH 5 (Figure 5-32). The same
happened in 2 and 2.5 M NaCl (Figure 5-33 and Figure 5-34). At 3 M NaCl, M. luteus
was unable to grow at all three pH values (Figure 5-35).
Table 5-6 and Figure 5-36 show the calculation of doubling times for M. luteus cells
grown in LB medium at pH 7, 5 and 3.
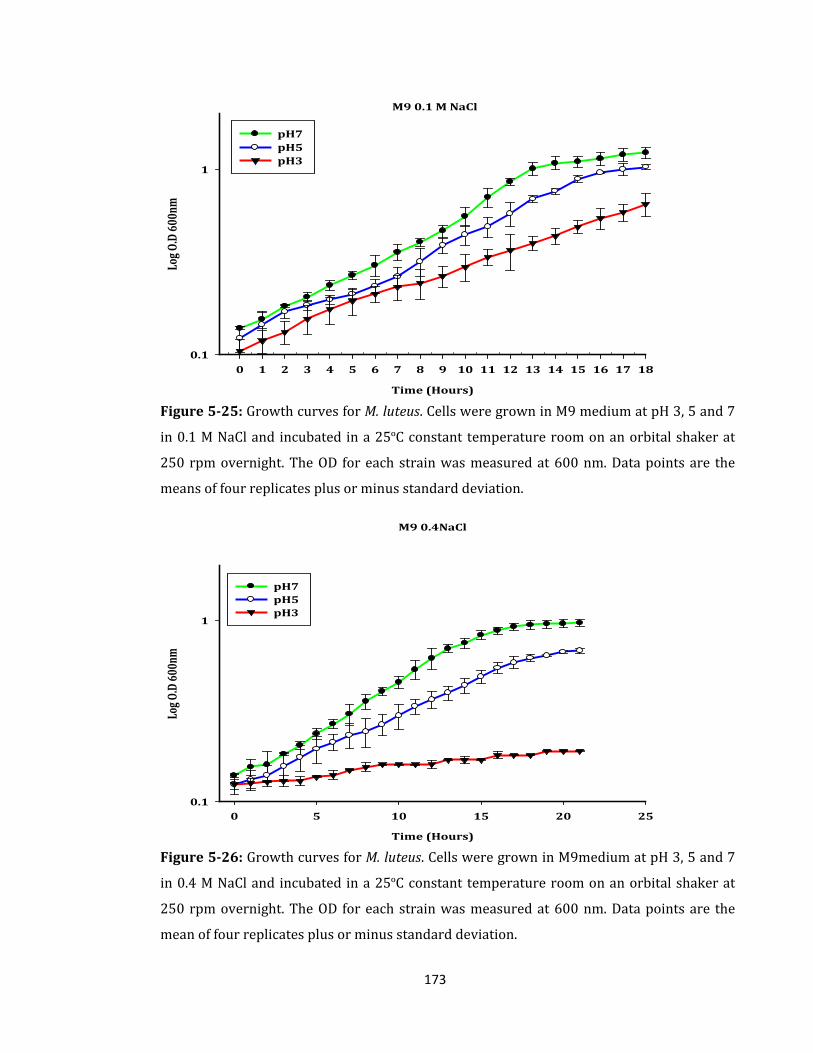
173
M9 0.1 M NaCl
Time (Hours)
0 1 2 3 4 5 6 7 8 9 10 11 12 13 14 15 16 17 18
Log O
.D 6
00nm
0.1
1
pH7 pH5 pH3
Figure 5-25: Growth curves for M. luteus. Cells were grown in M9 medium at pH 3, 5 and 7
in 0.1 M NaCl and incubated in a 25ºC constant temperature room on an orbital shaker at
250 rpm overnight. The OD for each strain was measured at 600 nm. Data points are the
means of four replicates plus or minus standard deviation.
M9 0.4NaCl
Time (Hours)
0 5 10 15 20 25
Log O
.D 6
00nm
0.1
1
pH7 pH5 pH3
Figure 5-26: Growth curves for M. luteus. Cells were grown in M9medium at pH 3, 5 and 7
in 0.4 M NaCl and incubated in a 25ºC constant temperature room on an orbital shaker at
250 rpm overnight. The OD for each strain was measured at 600 nm. Data points are the
mean of four replicates plus or minus standard deviation.
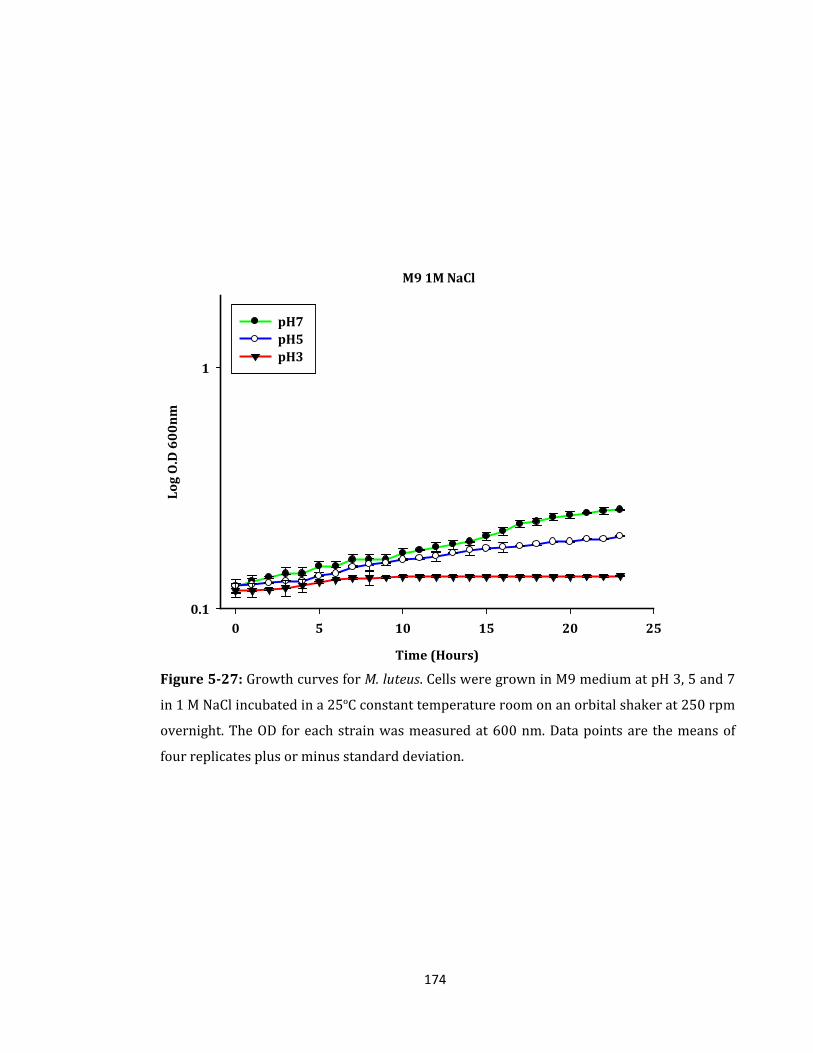
174
M9 1M NaCl
Time (Hours)
0 5 10 15 20 25
Log
O.D
60
0n
m
0.1
1
pH7 pH5 pH3
Figure 5-27: Growth curves for M. luteus. Cells were grown in M9 medium at pH 3, 5 and 7
in 1 M NaCl incubated in a 25ºC constant temperature room on an orbital shaker at 250 rpm
overnight. The OD for each strain was measured at 600 nm. Data points are the means of
four replicates plus or minus standard deviation.
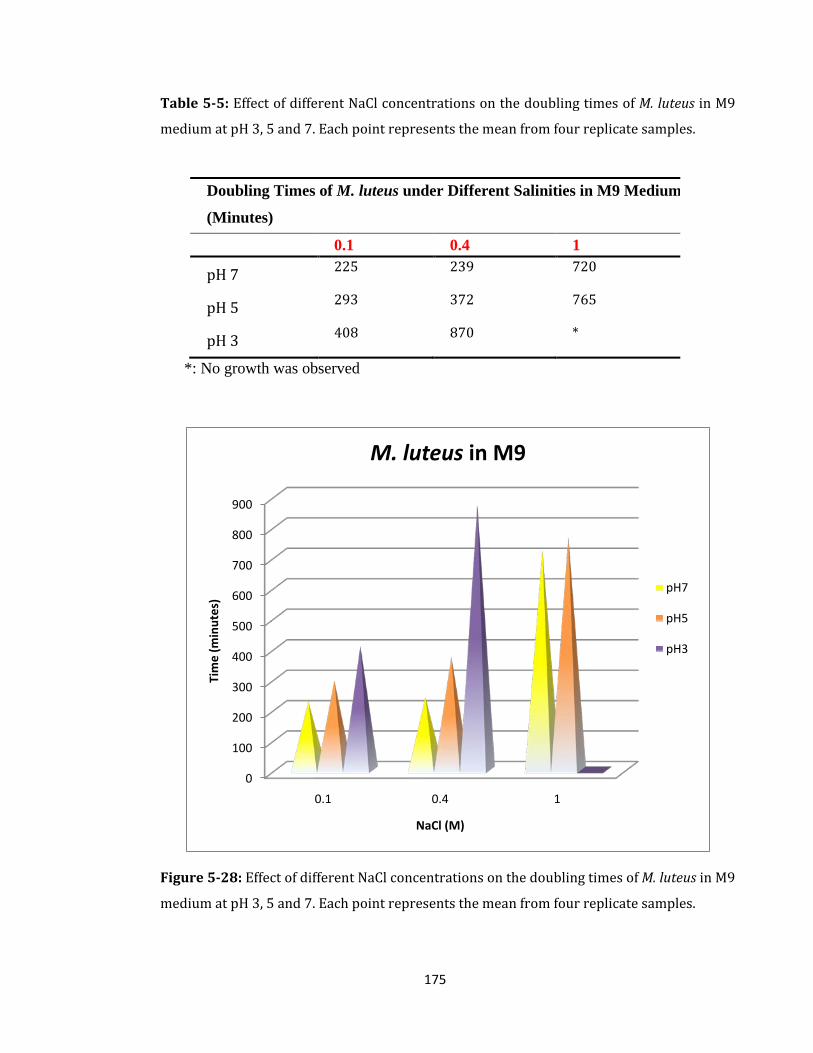
175
Table 5-5: Effect of different NaCl concentrations on the doubling times of M. luteus in M9
medium at pH 3, 5 and 7. Each point represents the mean from four replicate samples.
Doubling Times of M. luteus under Different Salinities in M9 Medium
(Minutes)
0.1 0.4 1
pH 7 225 239 720
pH 5 293 372 765
pH 3 408 870 *
*: No growth was observed
Figure 5-28: Effect of different NaCl concentrations on the doubling times of M. luteus in M9
medium at pH 3, 5 and 7. Each point represents the mean from four replicate samples.
0
100
200
300
400
500
600
700
800
900
0.1 0.4 1
Tim
e (m
inut
es)
NaCl (M)
M. luteus in M9
pH7
pH5
pH3
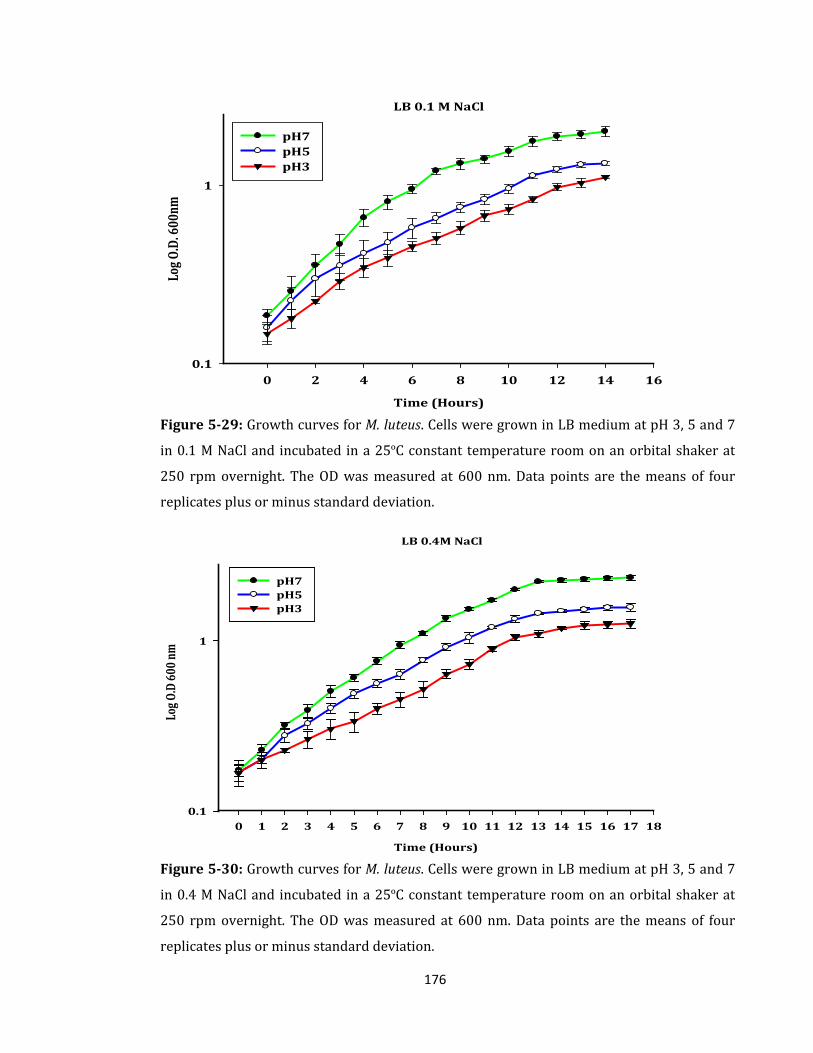
176
LB 0.1 M NaCl
Time (Hours)
0 2 4 6 8 10 12 14 16
Log
O.D.
600
nm
0.1
1
pH7 pH5 pH3
Figure 5-29: Growth curves for M. luteus. Cells were grown in LB medium at pH 3, 5 and 7
in 0.1 M NaCl and incubated in a 25ºC constant temperature room on an orbital shaker at
250 rpm overnight. The OD was measured at 600 nm. Data points are the means of four
replicates plus or minus standard deviation.
LB 0.4M NaCl
Time (Hours)
0 1 2 3 4 5 6 7 8 9 10 11 12 13 14 15 16 17 180.1
1
pH7 pH5 pH3
Log O
.D 6
00 n
m
Figure 5-30: Growth curves for M. luteus. Cells were grown in LB medium at pH 3, 5 and 7
in 0.4 M NaCl and incubated in a 25ºC constant temperature room on an orbital shaker at
250 rpm overnight. The OD was measured at 600 nm. Data points are the means of four
replicates plus or minus standard deviation.
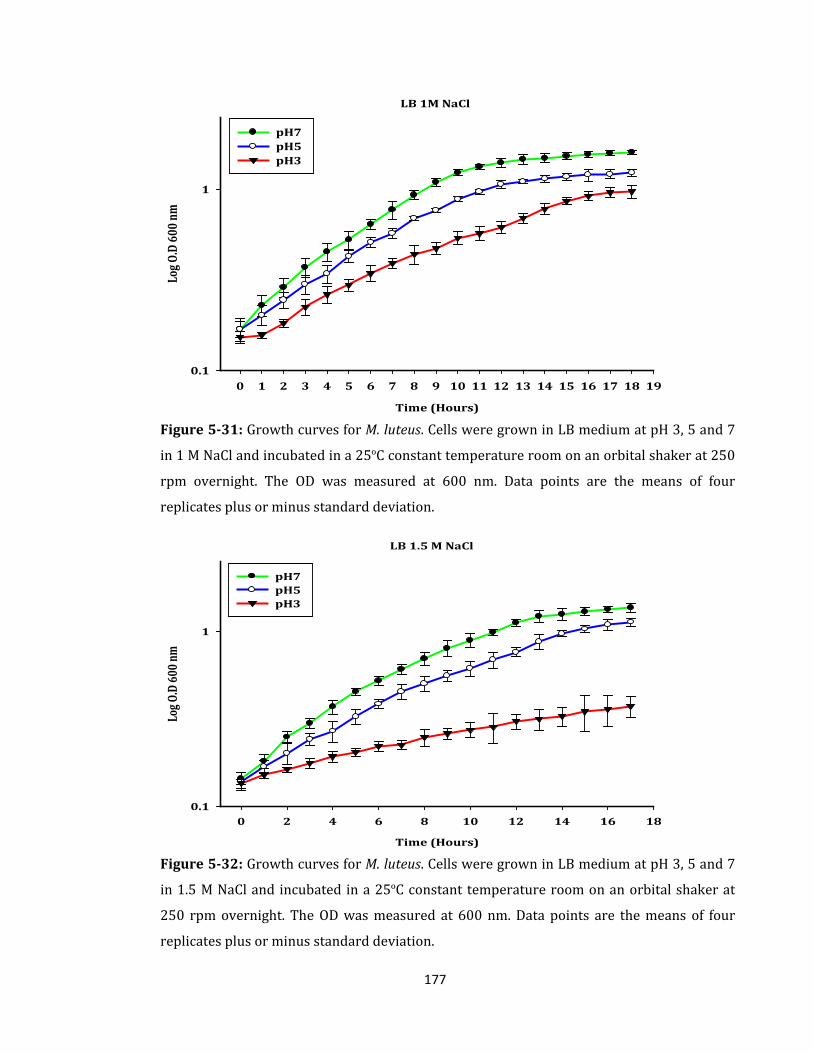
177
LB 1M NaCl
Time (Hours)
0 1 2 3 4 5 6 7 8 9 10 11 12 13 14 15 16 17 18 19
Log
O.D
600
nm
0.1
1
pH7 pH5 pH3
Figure 5-31: Growth curves for M. luteus. Cells were grown in LB medium at pH 3, 5 and 7
in 1 M NaCl and incubated in a 25ºC constant temperature room on an orbital shaker at 250
rpm overnight. The OD was measured at 600 nm. Data points are the means of four
replicates plus or minus standard deviation.
LB 1.5 M NaCl
Time (Hours)
0 2 4 6 8 10 12 14 16 18
Log O
.D 6
00 n
m
0.1
1
pH7 pH5 pH3
Figure 5-32: Growth curves for M. luteus. Cells were grown in LB medium at pH 3, 5 and 7
in 1.5 M NaCl and incubated in a 25ºC constant temperature room on an orbital shaker at
250 rpm overnight. The OD was measured at 600 nm. Data points are the means of four
replicates plus or minus standard deviation.
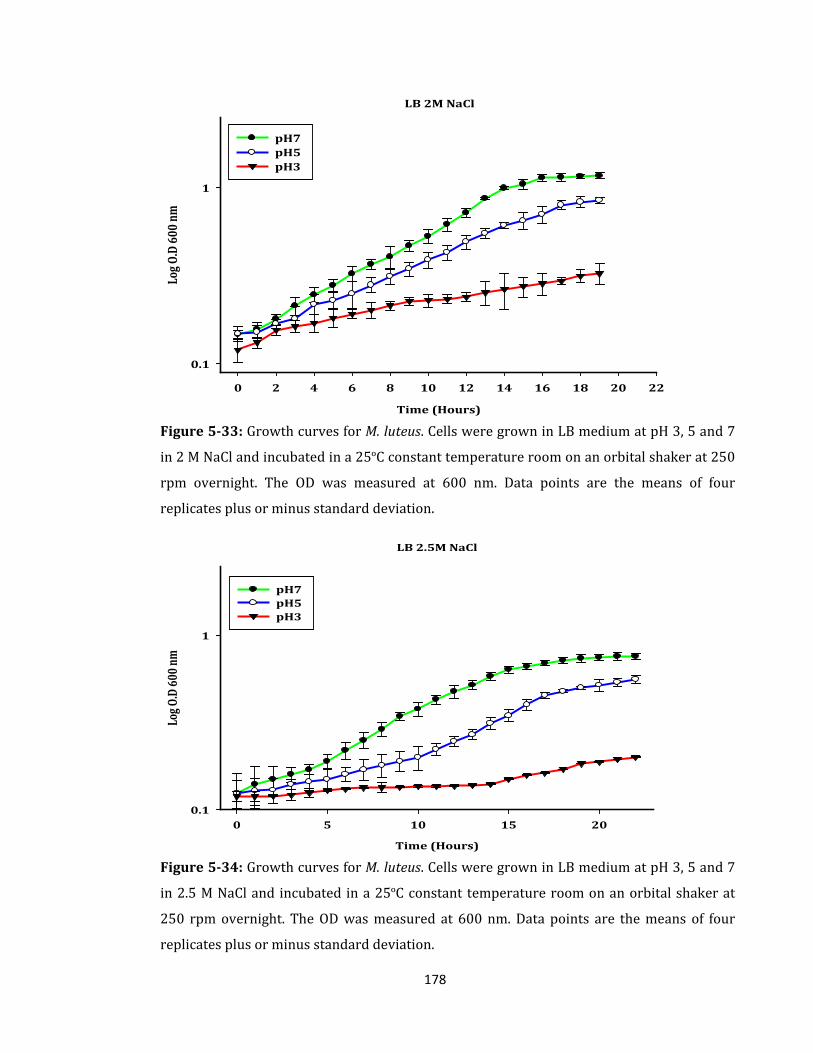
178
LB 2M NaCl
Time (Hours)
0 2 4 6 8 10 12 14 16 18 20 22
Log
O.D
600
nm
0.1
1
pH7 pH5 pH3
Figure 5-33: Growth curves for M. luteus. Cells were grown in LB medium at pH 3, 5 and 7
in 2 M NaCl and incubated in a 25ºC constant temperature room on an orbital shaker at 250
rpm overnight. The OD was measured at 600 nm. Data points are the means of four
replicates plus or minus standard deviation.
LB 2.5M NaCl
Time (Hours)
0 5 10 15 20
Log O
.D 6
00 n
m
0.1
1
pH7 pH5 pH3
Figure 5-34: Growth curves for M. luteus. Cells were grown in LB medium at pH 3, 5 and 7
in 2.5 M NaCl and incubated in a 25ºC constant temperature room on an orbital shaker at
250 rpm overnight. The OD was measured at 600 nm. Data points are the means of four
replicates plus or minus standard deviation.
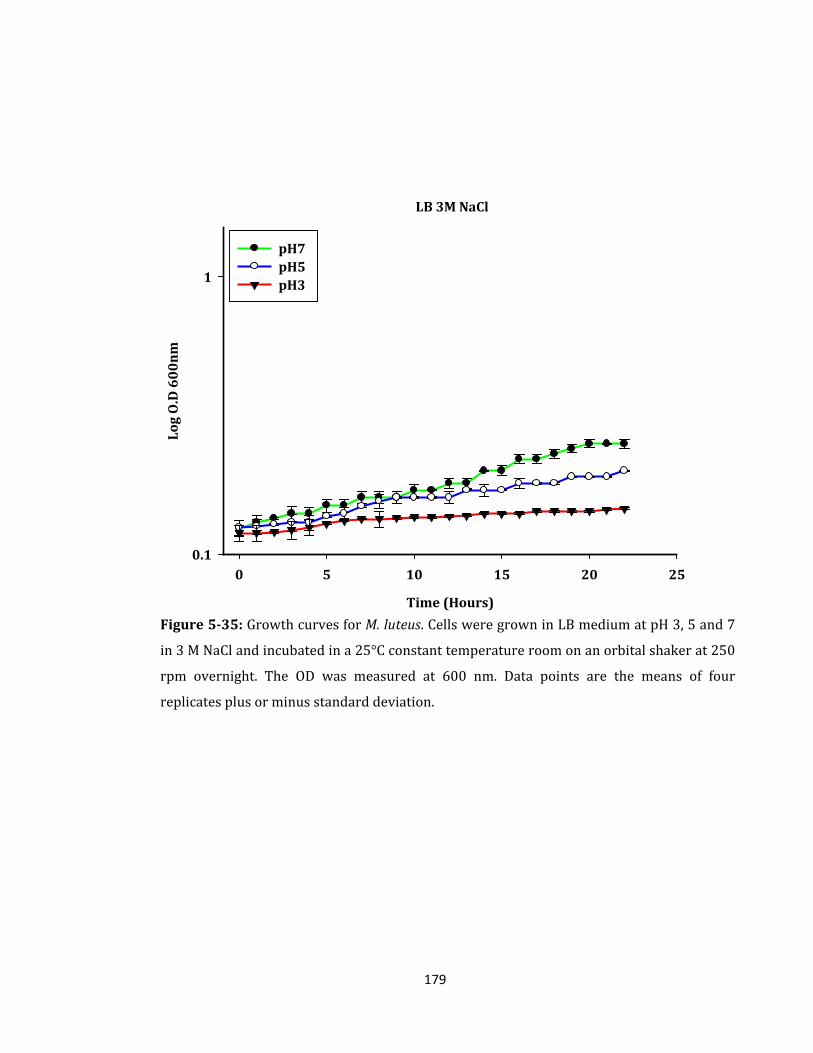
179
LB 3M NaCl
Time (Hours)
0 5 10 15 20 25
Log
O.D
60
0n
m
0.1
1
pH7 pH5 pH3
Figure 5-35: Growth curves for M. luteus. Cells were grown in LB medium at pH 3, 5 and 7
in 3 M NaCl and incubated in a 25°C constant temperature room on an orbital shaker at 250
rpm overnight. The OD was measured at 600 nm. Data points are the means of four
replicates plus or minus standard deviation.
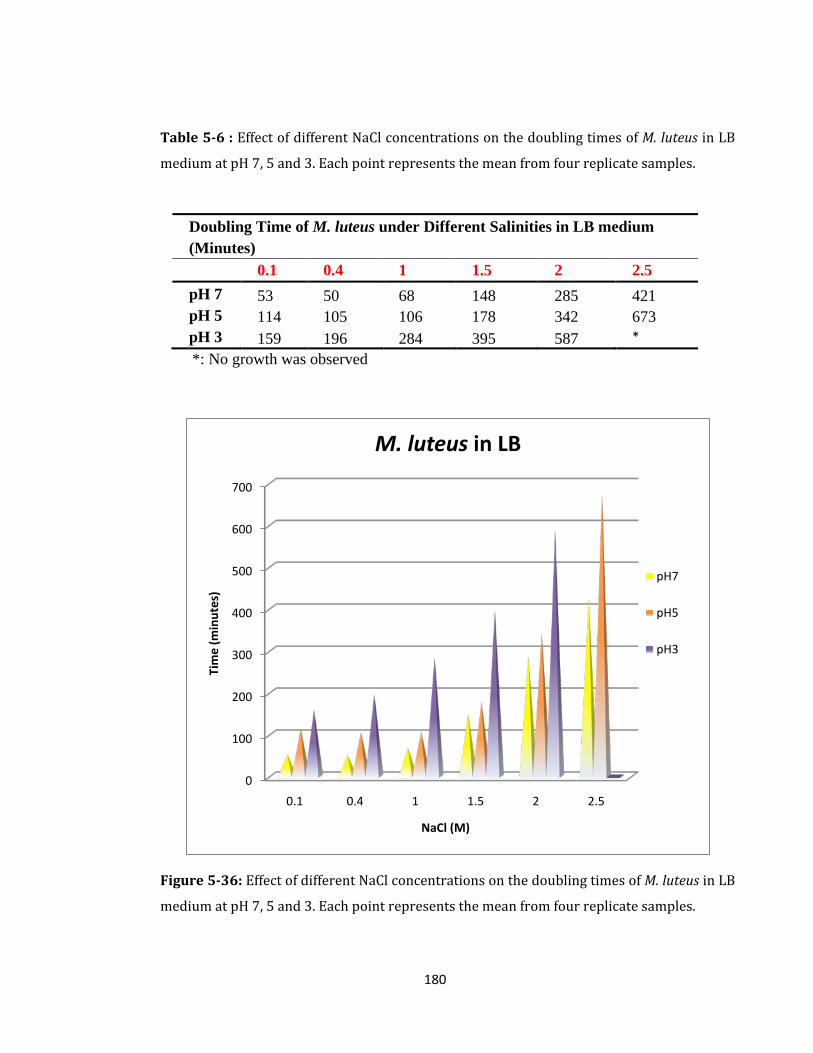
180
Table 5-6 : Effect of different NaCl concentrations on the doubling times of M. luteus in LB
medium at pH 7, 5 and 3. Each point represents the mean from four replicate samples.
*: No growth was observed
Figure 5-36: Effect of different NaCl concentrations on the doubling times of M. luteus in LB
medium at pH 7, 5 and 3. Each point represents the mean from four replicate samples.
0
100
200
300
400
500
600
700
0.1 0.4 1 1.5 2 2.5
Tim
e (m
inut
es)
NaCl (M)
M. luteus in LB
pH7
pH5
pH3
Doubling Time of M. luteus under Different Salinities in LB medium (Minutes) 0.1 0.4 1 1.5 2 2.5 pH 7 53 50 68 148 285 421 pH 5 114 105 106 178 342 673 pH 3 159 196 284 395 587 *
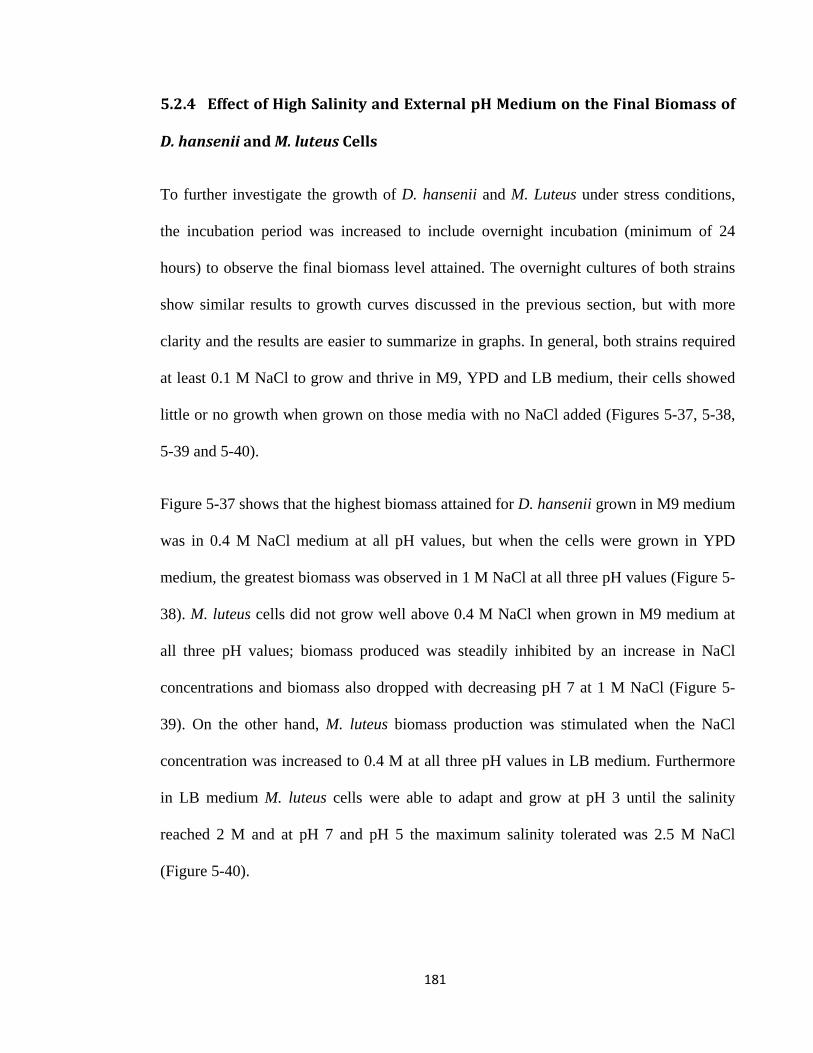
181
5.2.4 Effect of High Salinity and External pH Medium on the Final Biomass of
D. hansenii and M. luteus Cells
To further investigate the growth of D. hansenii and M. Luteus under stress conditions,
the incubation period was increased to include overnight incubation (minimum of 24
hours) to observe the final biomass level attained. The overnight cultures of both strains
show similar results to growth curves discussed in the previous section, but with more
clarity and the results are easier to summarize in graphs. In general, both strains required
at least 0.1 M NaCl to grow and thrive in M9, YPD and LB medium, their cells showed
little or no growth when grown on those media with no NaCl added (Figures 5-37, 5-38,
5-39 and 5-40).
Figure 5-37 shows that the highest biomass attained for D. hansenii grown in M9 medium
was in 0.4 M NaCl medium at all pH values, but when the cells were grown in YPD
medium, the greatest biomass was observed in 1 M NaCl at all three pH values (Figure 5-
38). M. luteus cells did not grow well above 0.4 M NaCl when grown in M9 medium at
all three pH values; biomass produced was steadily inhibited by an increase in NaCl
concentrations and biomass also dropped with decreasing pH 7 at 1 M NaCl (Figure 5-
39). On the other hand, M. luteus biomass production was stimulated when the NaCl
concentration was increased to 0.4 M at all three pH values in LB medium. Furthermore
in LB medium M. luteus cells were able to adapt and grow at pH 3 until the salinity
reached 2 M and at pH 7 and pH 5 the maximum salinity tolerated was 2.5 M NaCl
(Figure 5-40).
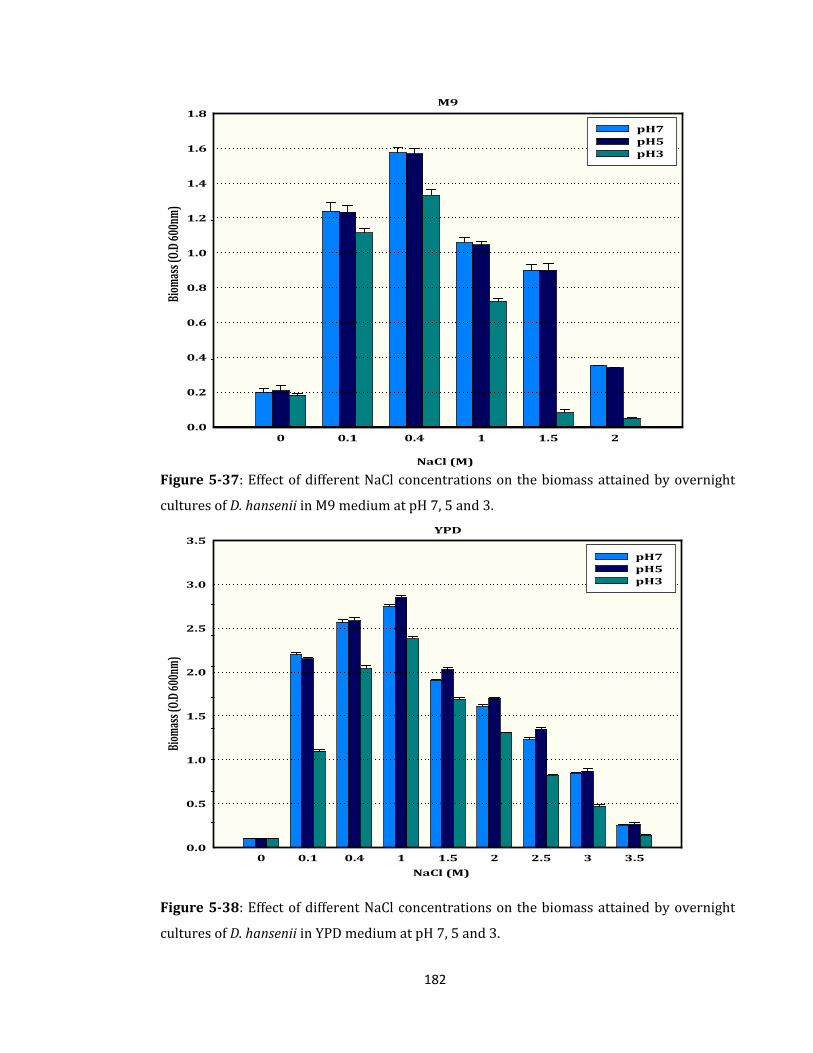
182
Salinity in M9
NaCl (M)
0 0.1 0.4 1 1.5 2
Biom
ass (
O.D
600n
m)
pH7 pH5 pH3
M9
0 0.1 0.4 1 1.5 20.0
0.2
0.4
0.6
0.8
1.0
1.2
1.4
1.6
1.8
pH7 pH5 pH3
Figure 5-37: Effect of different NaCl concentrations on the biomass attained by overnight
cultures of D. hansenii in M9 medium at pH 7, 5 and 3.
YPD medium
NaCl (M)
0 0.1 0.4 1 1.5 2 2.5 3 3.5
Biom
ass (
O.D
600n
m)
pH7 pH5 pH3
YPD
0 0.1 0.4 1 1.5 2 2.5 3 3.50.0
0.5
1.0
1.5
2.0
2.5
3.0
3.5
pH7 pH5 pH3
Figure 5-38: Effect of different NaCl concentrations on the biomass attained by overnight
cultures of D. hansenii in YPD medium at pH 7, 5 and 3.
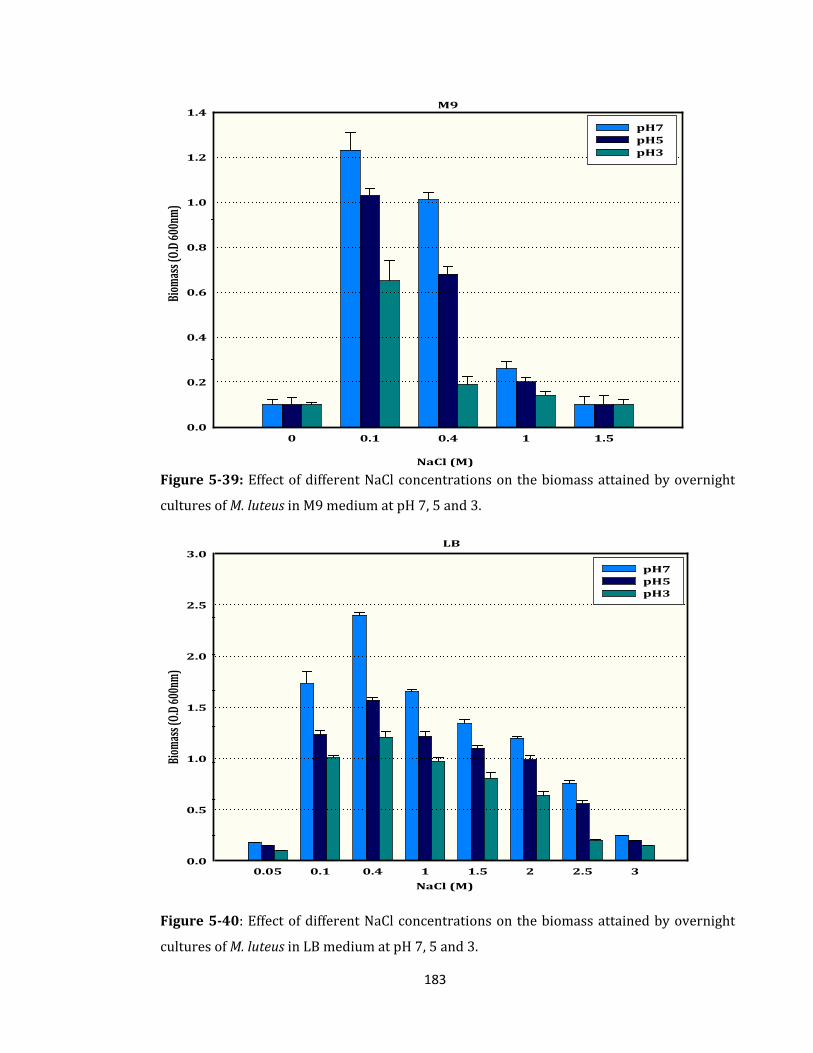
183
Salinity in M9
NaCl (M)
0 0.1 0.4 1 1.5
Biom
ass (
O.D
600n
m)
pH7 pH5 pH3
M9
0 0.1 0.4 1 1.50.0
0.2
0.4
0.6
0.8
1.0
1.2
1.4
pH7 pH5 pH3
Figure 5-39: Effect of different NaCl concentrations on the biomass attained by overnight
cultures of M. luteus in M9 medium at pH 7, 5 and 3.
YPD medium
NaCl (M)
0.05 0.1 0.4 1 1.5 2 2.5 3
Biom
ass (
O.D
600n
m)
pH7 pH5 pH3
LB
0.05 0.1 0.4 1 1.5 2 2.5 30.0
0.5
1.0
1.5
2.0
2.5
3.0
pH7 pH5 pH3
Figure 5-40: Effect of different NaCl concentrations on the biomass attained by overnight
cultures of M. luteus in LB medium at pH 7, 5 and 3.
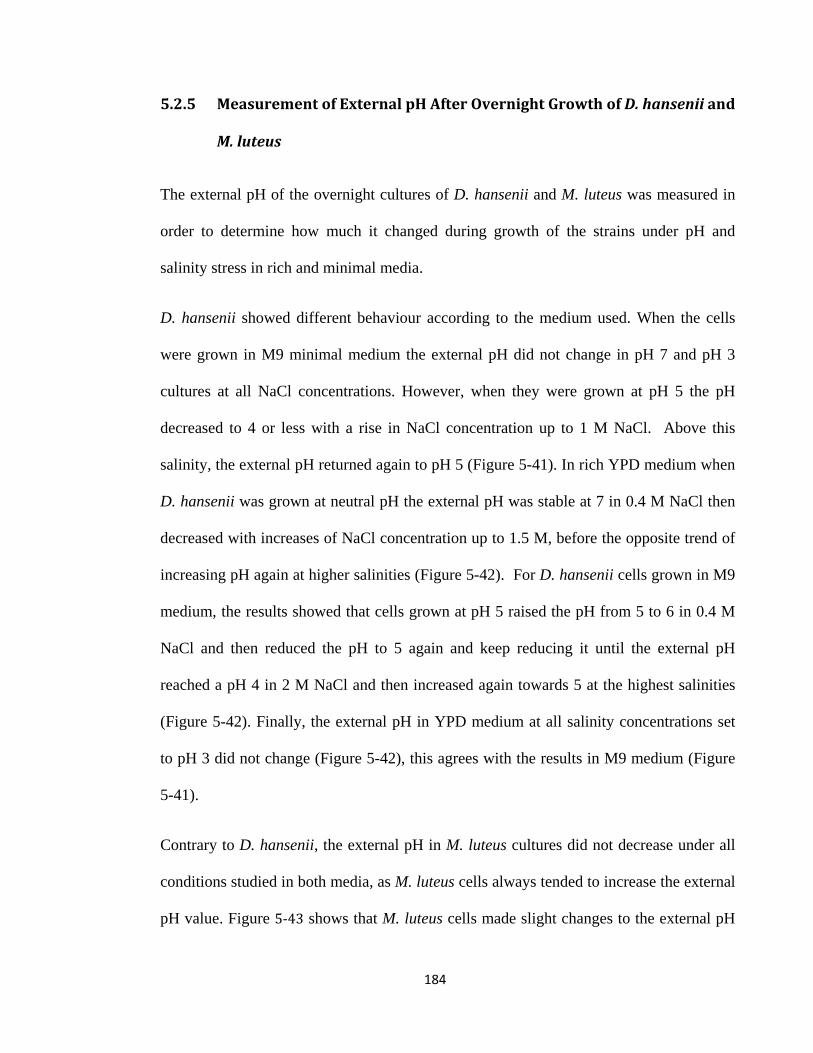
184
5.2.5 Measurement of External pH After Overnight Growth of D. hansenii and
M. luteus
The external pH of the overnight cultures of D. hansenii and M. luteus was measured in
order to determine how much it changed during growth of the strains under pH and
salinity stress in rich and minimal media.
D. hansenii showed different behaviour according to the medium used. When the cells
were grown in M9 minimal medium the external pH did not change in pH 7 and pH 3
cultures at all NaCl concentrations. However, when they were grown at pH 5 the pH
decreased to 4 or less with a rise in NaCl concentration up to 1 M NaCl. Above this
salinity, the external pH returned again to pH 5 (Figure 5-41). In rich YPD medium when
D. hansenii was grown at neutral pH the external pH was stable at 7 in 0.4 M NaCl then
decreased with increases of NaCl concentration up to 1.5 M, before the opposite trend of
increasing pH again at higher salinities (Figure 5-42). For D. hansenii cells grown in M9
medium, the results showed that cells grown at pH 5 raised the pH from 5 to 6 in 0.4 M
NaCl and then reduced the pH to 5 again and keep reducing it until the external pH
reached a pH 4 in 2 M NaCl and then increased again towards 5 at the highest salinities
(Figure 5-42). Finally, the external pH in YPD medium at all salinity concentrations set
to pH 3 did not change (Figure 5-42), this agrees with the results in M9 medium (Figure
5-41).
Contrary to D. hansenii, the external pH in M. luteus cultures did not decrease under all
conditions studied in both media, as M. luteus cells always tended to increase the external
pH value. Figure 5-43 shows that M. luteus cells made slight changes to the external pH
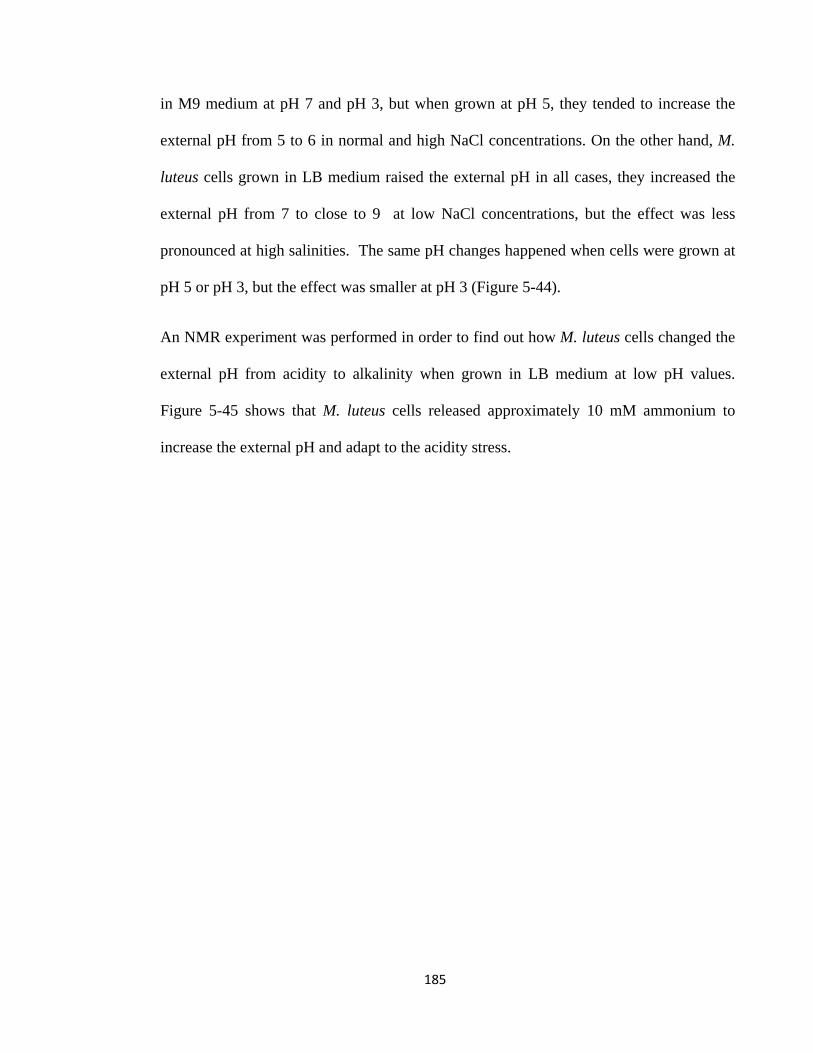
185
in M9 medium at pH 7 and pH 3, but when grown at pH 5, they tended to increase the
external pH from 5 to 6 in normal and high NaCl concentrations. On the other hand, M.
luteus cells grown in LB medium raised the external pH in all cases, they increased the
external pH from 7 to close to 9 at low NaCl concentrations, but the effect was less
pronounced at high salinities. The same pH changes happened when cells were grown at
pH 5 or pH 3, but the effect was smaller at pH 3 (Figure 5-44).
An NMR experiment was performed in order to find out how M. luteus cells changed the
external pH from acidity to alkalinity when grown in LB medium at low pH values.
Figure 5-45 shows that M. luteus cells released approximately 10 mM ammonium to
increase the external pH and adapt to the acidity stress.
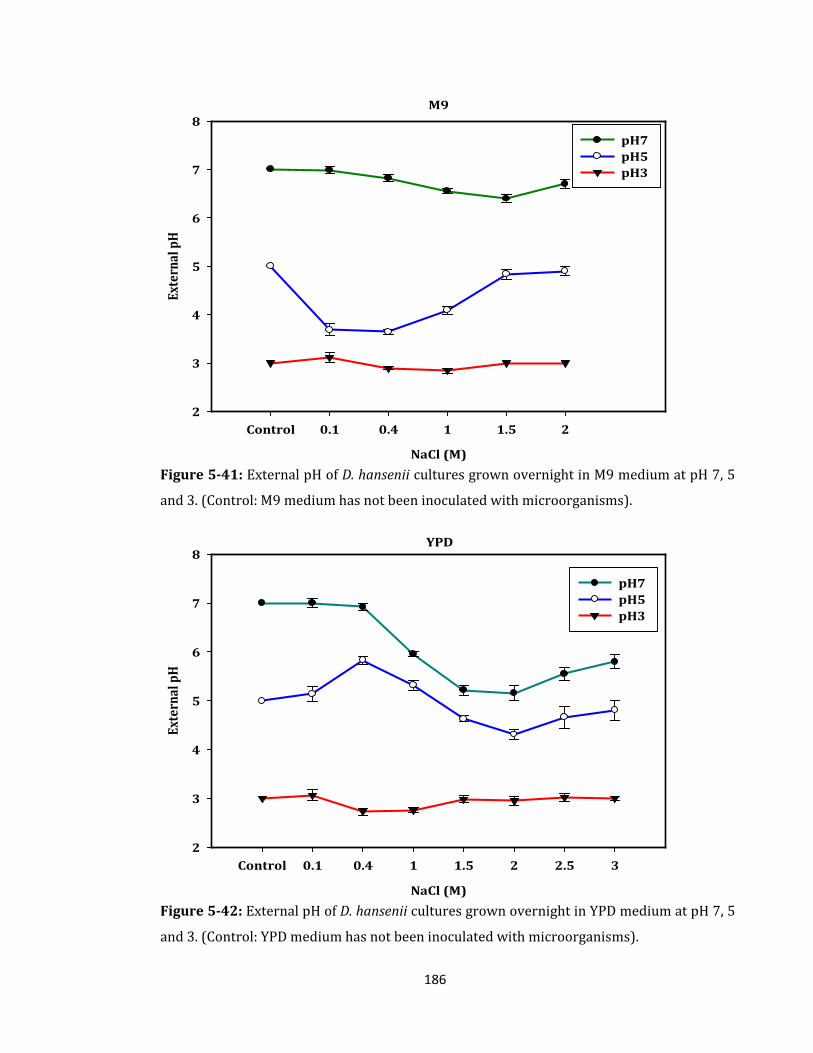
186
M9
NaCl (M)
Control 0.1 0.4 1 1.5 2
Exte
rnal
pH
2
3
4
5
6
7
8
pH7 pH5 pH3
Figure 5-41: External pH of D. hansenii cultures grown overnight in M9 medium at pH 7, 5
and 3. (Control: M9 medium has not been inoculated with microorganisms).
YPD
NaCl (M)
Control 0.1 0.4 1 1.5 2 2.5 3
Exte
rnal
pH
2
3
4
5
6
7
8
pH7 pH5 pH3
Figure 5-42: External pH of D. hansenii cultures grown overnight in YPD medium at pH 7, 5
and 3. (Control: YPD medium has not been inoculated with microorganisms).
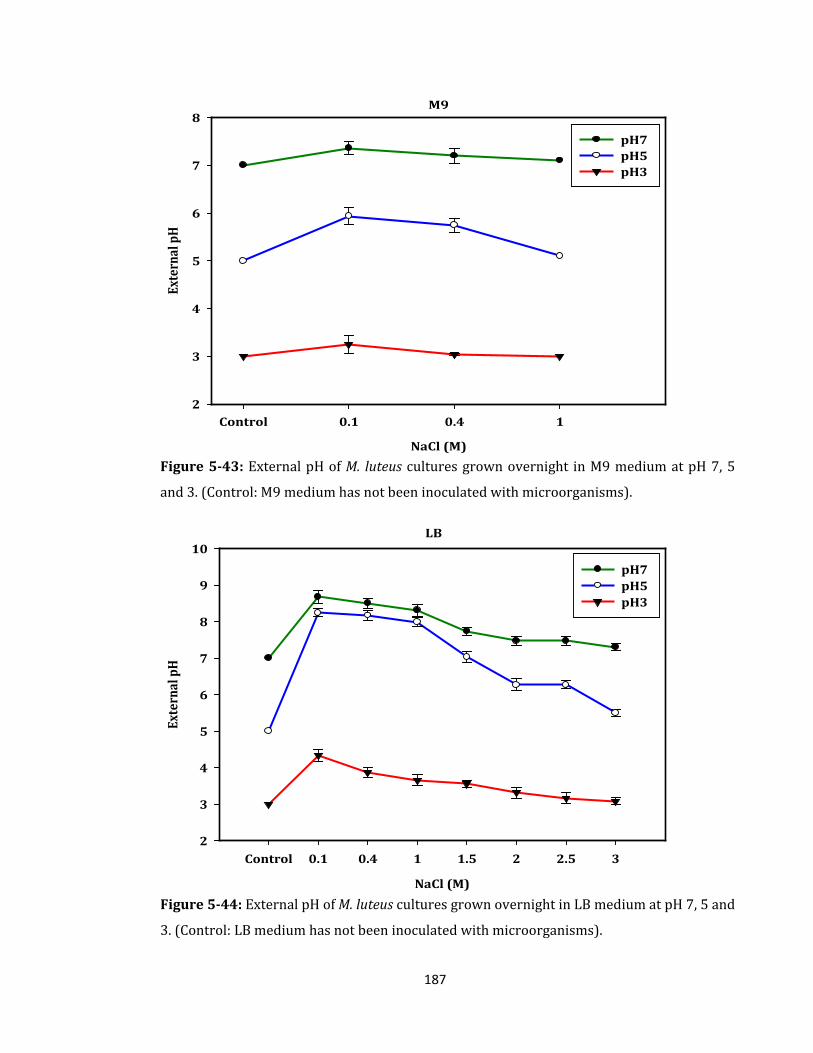
187
M9
NaCl (M)
Control 0.1 0.4 1
Exte
rnal
pH
2
3
4
5
6
7
8
pH7 pH5 pH3
Figure 5-43: External pH of M. luteus cultures grown overnight in M9 medium at pH 7, 5
and 3. (Control: M9 medium has not been inoculated with microorganisms).
LB
NaCl (M)
Control 0.1 0.4 1 1.5 2 2.5 3
Exte
rnal
pH
2
3
4
5
6
7
8
9
10
pH7 pH5 pH3
Figure 5-44: External pH of M. luteus cultures grown overnight in LB medium at pH 7, 5 and
3. (Control: LB medium has not been inoculated with microorganisms).
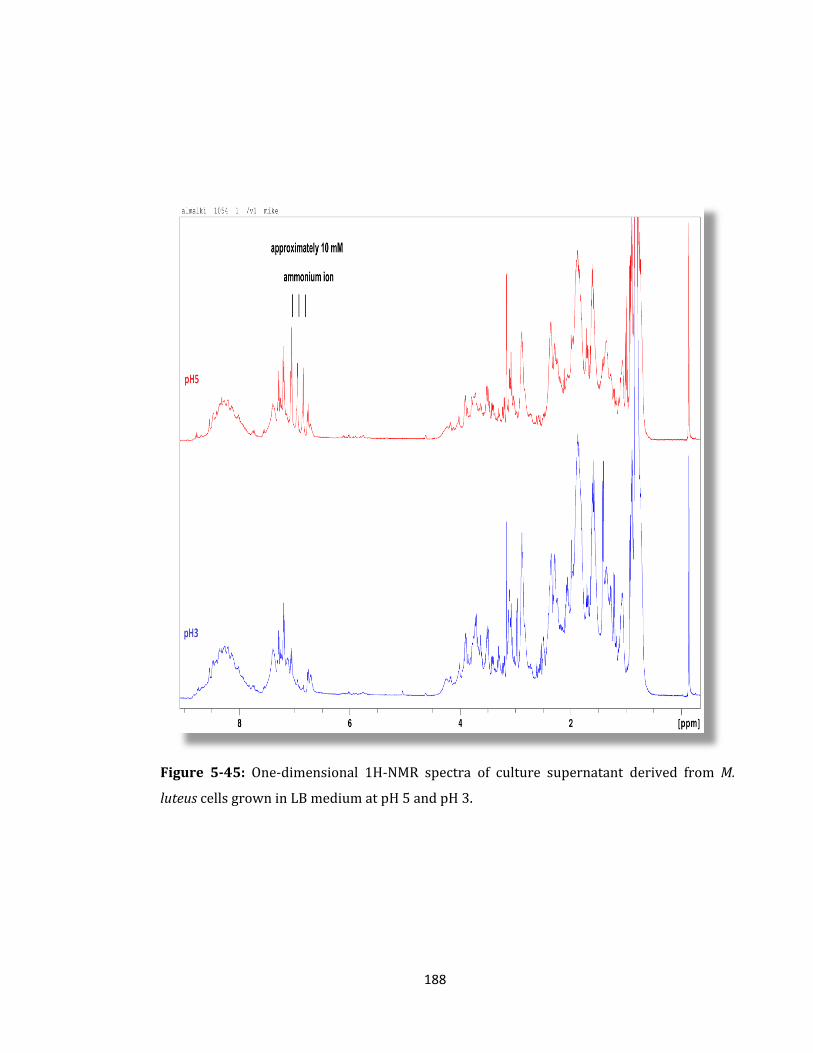
188
Figure 5-45: One-dimensional 1H-NMR spectra of culture supernatant derived from M.
luteus cells grown in LB medium at pH 5 and pH 3.
189
5.2.6 Effect of Salinity and pH on Respiration Rate of D. hansenii and M.
luteus
Cells of D. hansenii and M. luteus grown in YPD and LB medium, respectively, at
different salinity (0.1, 0.4, 1.0 1.5, 2.0 and 2.5 M NaCl) and pH (3, 5 and 7), were
harvested by centrifugation then the pellets re-suspended in YPD and LB media of the
same salinity and pH. Then oxygen uptake of bacterial strains was immediately
determined by the oxygen electrode as described in section 2.11.
Figure 5-46 shows that the respiration rate of D. hansenii at pH 3 was the highest
while the lowest rate occurred at pH 7. Furthermore, respiration rate in all cases
increased when salinity is increased from 0.1 to 0.4 M NaCl, and then decreased
again at higher salinities for all pH values. The decrease in respiration rate at high
salinities was particularly pronounced at pH 3.
On the other hand, the effect of pH on respiration rates in M. luteus was quite
different from that in D. hansenii; the respiration rate was higher at pH 7 while the
lowest rates occurred at pH 3 in M. luteus (Figure 5-47). Respiration rate at pH 7
increased slightly when NaCl concentration was increased from 0.1 to 0.4 M, and
then decreased with any increase of NaCl concentrations (Figure 5-47). However, at
pH 5 and pH 3 when NaCl concentrations increased from 0.1 to 1 M through 0.4 M
NaCl, the respiration rates increased. When salinity was increased beyond 1 M
NaCl, the respiration rates decrease again at both pH values (Figure 5-47).
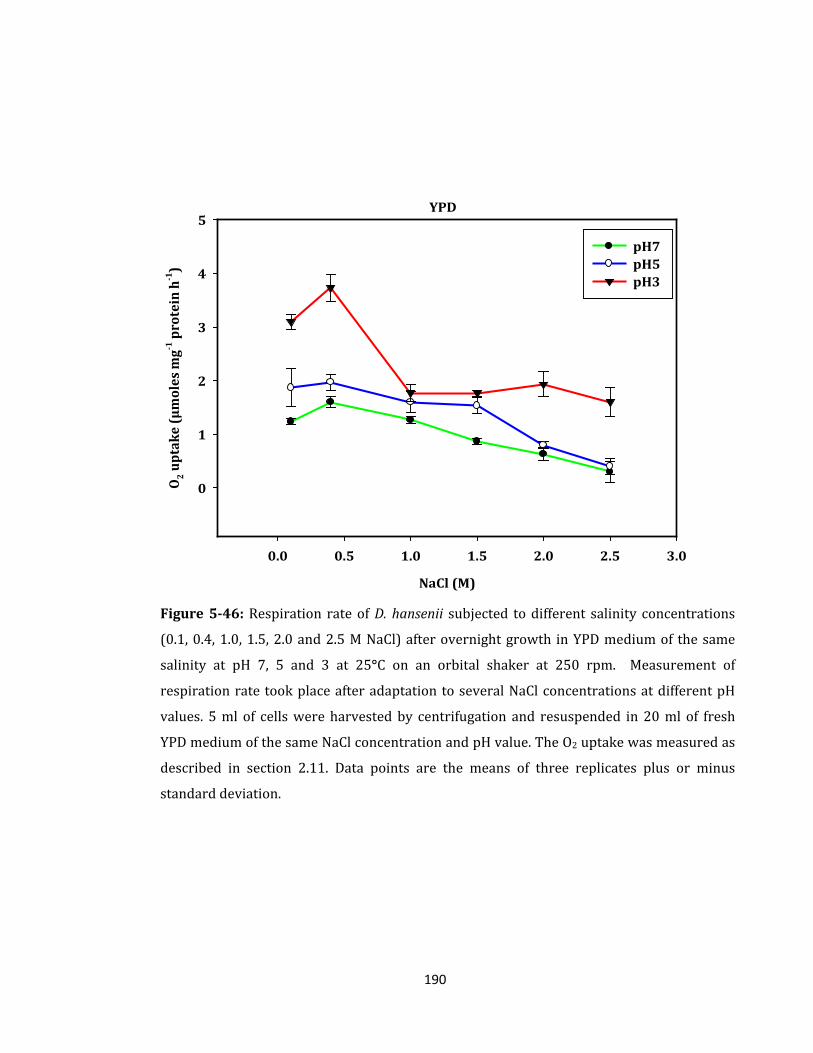
190
YPD
NaCl (M)
0.0 0.5 1.0 1.5 2.0 2.5 3.0
O2 u
ptak
e (µ
mol
es m
g-1 p
rote
in h
-1)
0
1
2
3
4
5
pH7 pH5 pH3
Figure 5-46: Respiration rate of D. hansenii subjected to different salinity concentrations
(0.1, 0.4, 1.0, 1.5, 2.0 and 2.5 M NaCl) after overnight growth in YPD medium of the same
salinity at pH 7, 5 and 3 at 25°C on an orbital shaker at 250 rpm. Measurement of
respiration rate took place after adaptation to several NaCl concentrations at different pH
values. 5 ml of cells were harvested by centrifugation and resuspended in 20 ml of fresh
YPD medium of the same NaCl concentration and pH value. The O2 uptake was measured as
described in section 2.11. Data points are the means of three replicates plus or minus
standard deviation.
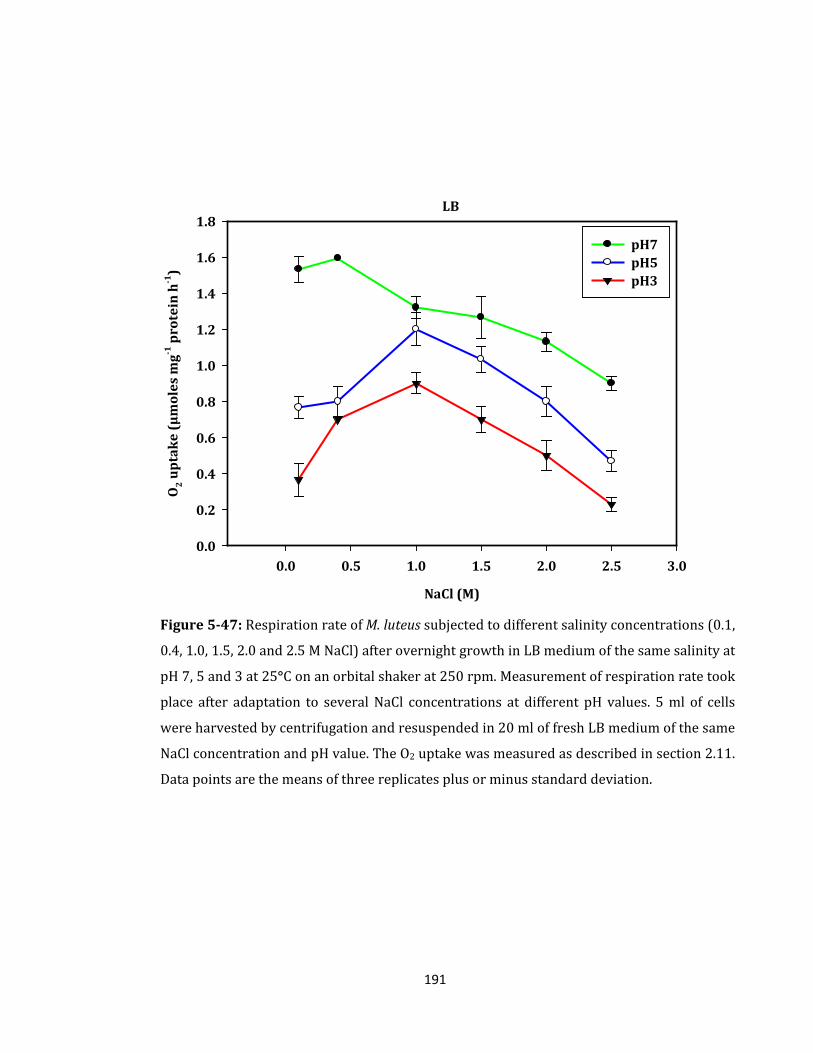
191
LB
NaCl (M)
0.0 0.5 1.0 1.5 2.0 2.5 3.0
O2 u
pta
ke
(µm
oles
mg-1
pro
tein
h-1
)
0.0
0.2
0.4
0.6
0.8
1.0
1.2
1.4
1.6
1.8
pH7 pH5 pH3
Figure 5-47: Respiration rate of M. luteus subjected to different salinity concentrations (0.1,
0.4, 1.0, 1.5, 2.0 and 2.5 M NaCl) after overnight growth in LB medium of the same salinity at
pH 7, 5 and 3 at 25°C on an orbital shaker at 250 rpm. Measurement of respiration rate took
place after adaptation to several NaCl concentrations at different pH values. 5 ml of cells
were harvested by centrifugation and resuspended in 20 ml of fresh LB medium of the same
NaCl concentration and pH value. The O2 uptake was measured as described in section 2.11.
Data points are the means of three replicates plus or minus standard deviation.
192
5.2.7 Determination of Compatible Solutes (Osmolytes) by NMR Spectroscopy
In order to identify the compatible solutes accumulated by D. hansenii and M. luteus
when exposed to different salinity concentrations and different external pH values,
NMR was used as described in section 2.18. The importance of the medium used
was investigated by comparing rich LB medium (M. luteus) and rich YPD medium
(D. hansenii) with M9 minimal salts medium.
Figure 5-48, Figure 5-49 and Figure 5-50 show the variety of compatible solutes
accumulated by D. hansenii when yeast cells were grown in M9 minimal medium at
pH 7, 5 and 3 in different salinities (0.1, 0.4, 1 M NaCl). From the spectra it is clear
that glycerol, arabitol, glycine betaine (betaine) and alanine were found under all
conditions but at varying concentrations depending on NaCl concentration and pH
value, for example, alanine was quite low at all pH values in 0.1 and 0.4 M NaCl
(Figure 5-48 and Figure 5-49). Moreover, all compatible solutes increased with
increasing salinity from 0.1 - 1 M NaCl (Figure 5-48 and Figure 5-50). However,
glycerol was the compatible solute accumulated to the highest amount in all spectra
and in particular at pH 3, 1 M NaCl there was more glycerol (Figure 5-50).
Similar results occurred when D. hansenii cells were grown in YPD medium
(Figures 5-51, 5-52, 5-53 and 5-54). In YPD medium the highest amount of glycerol
was found when yeast cells were grown in 0.4 M NaCl at pH 3 (Figure 5-52). So, it
is very clear that glycerol is the main compatible solute accumulated by D. hansenii
cells when they were grown under different stresses.
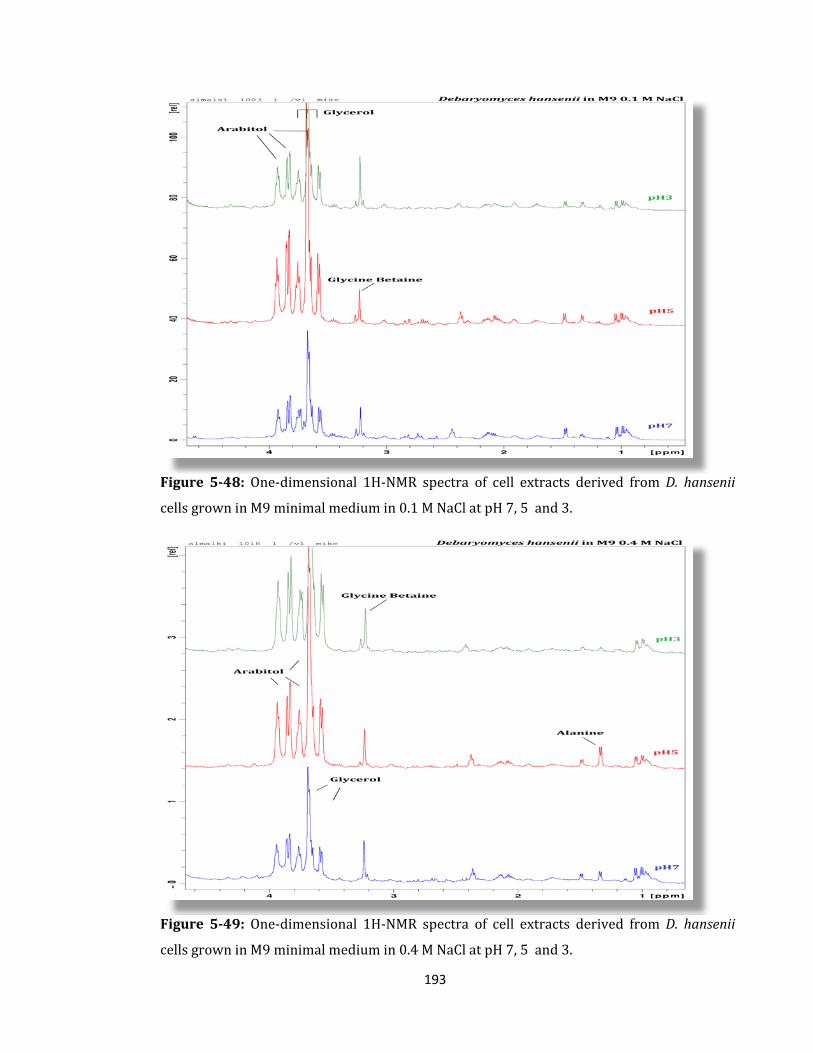
193
Figure 5-48: One-dimensional 1H-NMR spectra of cell extracts derived from D. hansenii
cells grown in M9 minimal medium in 0.1 M NaCl at pH 7, 5 and 3.
Figure 5-49: One-dimensional 1H-NMR spectra of cell extracts derived from D. hansenii
cells grown in M9 minimal medium in 0.4 M NaCl at pH 7, 5 and 3.
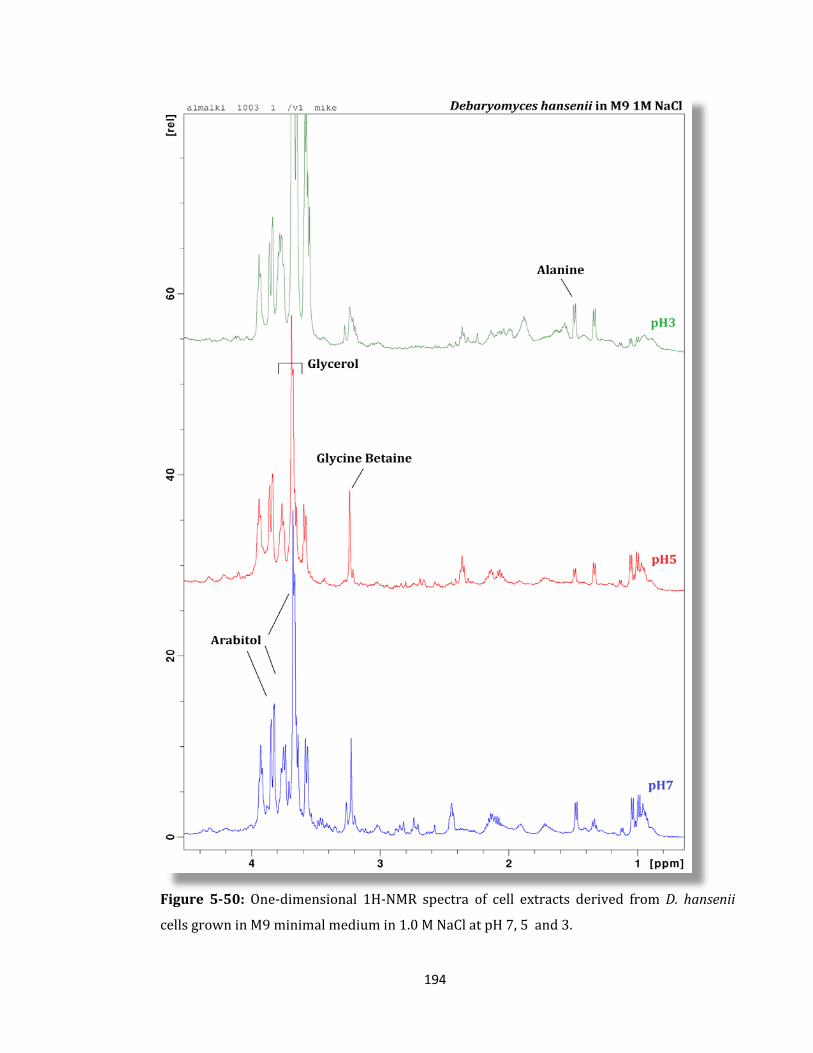
194
Figure 5-50: One-dimensional 1H-NMR spectra of cell extracts derived from D. hansenii
cells grown in M9 minimal medium in 1.0 M NaCl at pH 7, 5 and 3.
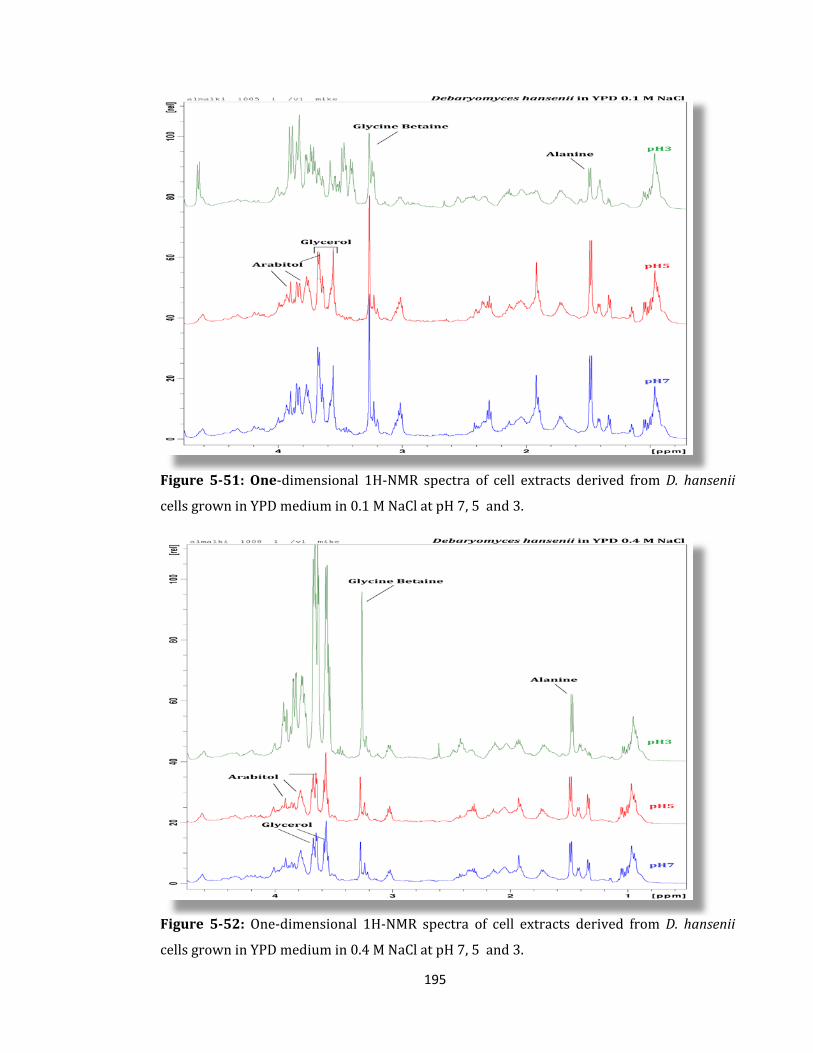
195
Figure 5-51: One-dimensional 1H-NMR spectra of cell extracts derived from D. hansenii
cells grown in YPD medium in 0.1 M NaCl at pH 7, 5 and 3.
Figure 5-52: One-dimensional 1H-NMR spectra of cell extracts derived from D. hansenii
cells grown in YPD medium in 0.4 M NaCl at pH 7, 5 and 3.
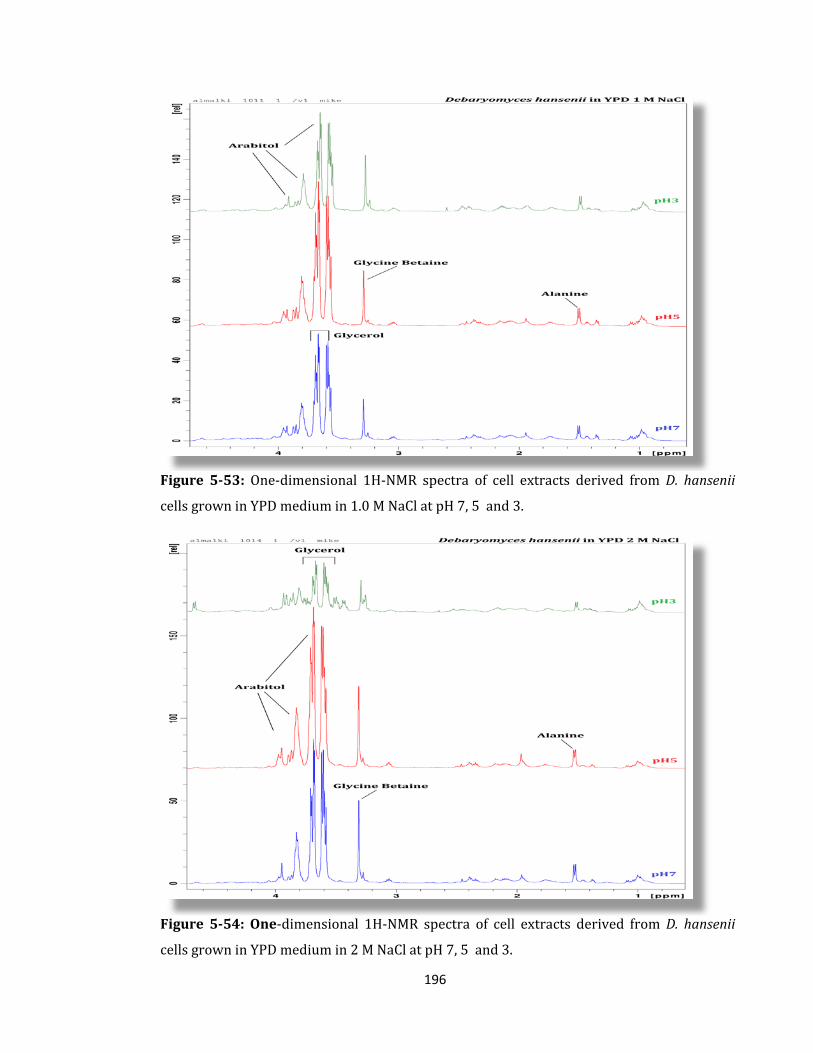
196
Figure 5-53: One-dimensional 1H-NMR spectra of cell extracts derived from D. hansenii
cells grown in YPD medium in 1.0 M NaCl at pH 7, 5 and 3.
Figure 5-54: One-dimensional 1H-NMR spectra of cell extracts derived from D. hansenii
cells grown in YPD medium in 2 M NaCl at pH 7, 5 and 3.
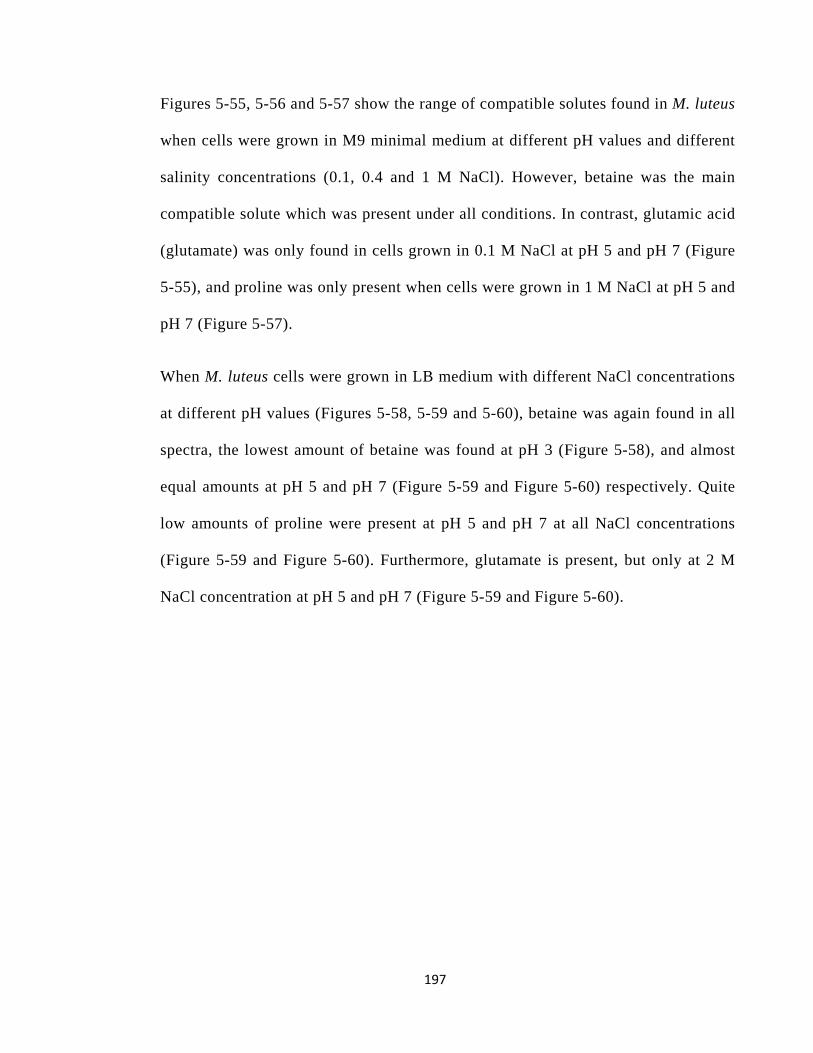
197
Figures 5-55, 5-56 and 5-57 show the range of compatible solutes found in M. luteus
when cells were grown in M9 minimal medium at different pH values and different
salinity concentrations (0.1, 0.4 and 1 M NaCl). However, betaine was the main
compatible solute which was present under all conditions. In contrast, glutamic acid
(glutamate) was only found in cells grown in 0.1 M NaCl at pH 5 and pH 7 (Figure
5-55), and proline was only present when cells were grown in 1 M NaCl at pH 5 and
pH 7 (Figure 5-57).
When M. luteus cells were grown in LB medium with different NaCl concentrations
at different pH values (Figures 5-58, 5-59 and 5-60), betaine was again found in all
spectra, the lowest amount of betaine was found at pH 3 (Figure 5-58), and almost
equal amounts at pH 5 and pH 7 (Figure 5-59 and Figure 5-60) respectively. Quite
low amounts of proline were present at pH 5 and pH 7 at all NaCl concentrations
(Figure 5-59 and Figure 5-60). Furthermore, glutamate is present, but only at 2 M
NaCl concentration at pH 5 and pH 7 (Figure 5-59 and Figure 5-60).
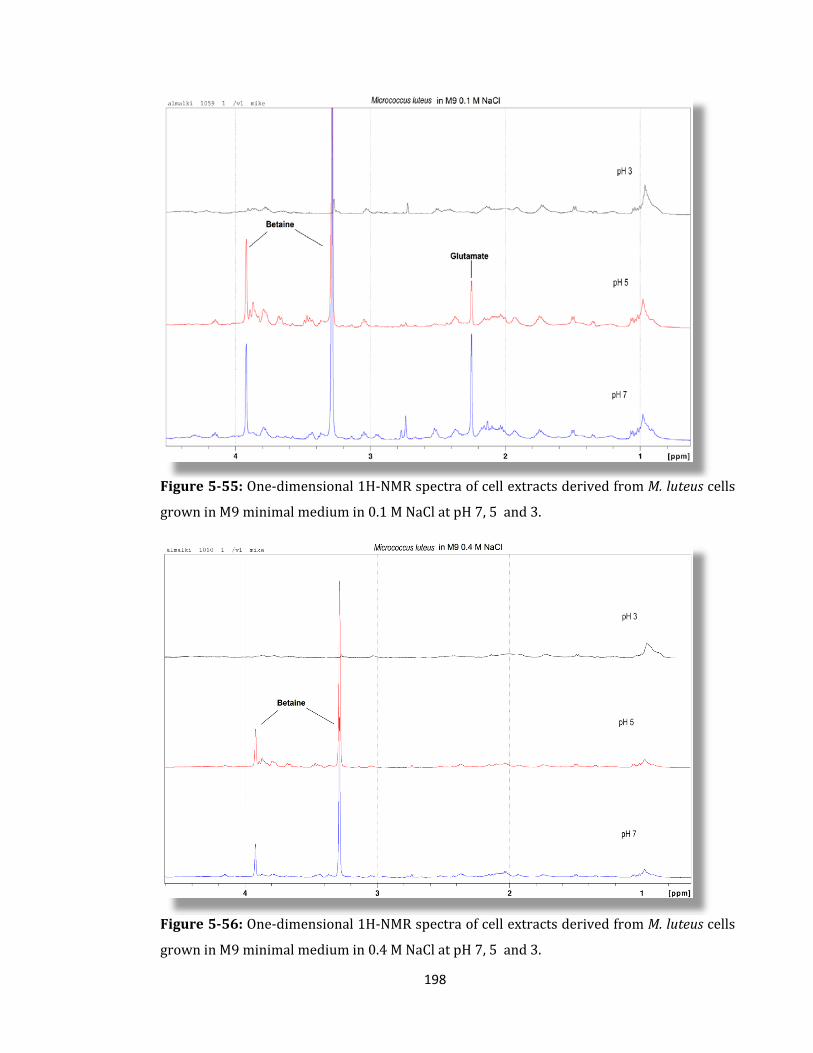
198
Figure 5-55: One-dimensional 1H-NMR spectra of cell extracts derived from M. luteus cells
grown in M9 minimal medium in 0.1 M NaCl at pH 7, 5 and 3.
Figure 5-56: One-dimensional 1H-NMR spectra of cell extracts derived from M. luteus cells
grown in M9 minimal medium in 0.4 M NaCl at pH 7, 5 and 3.
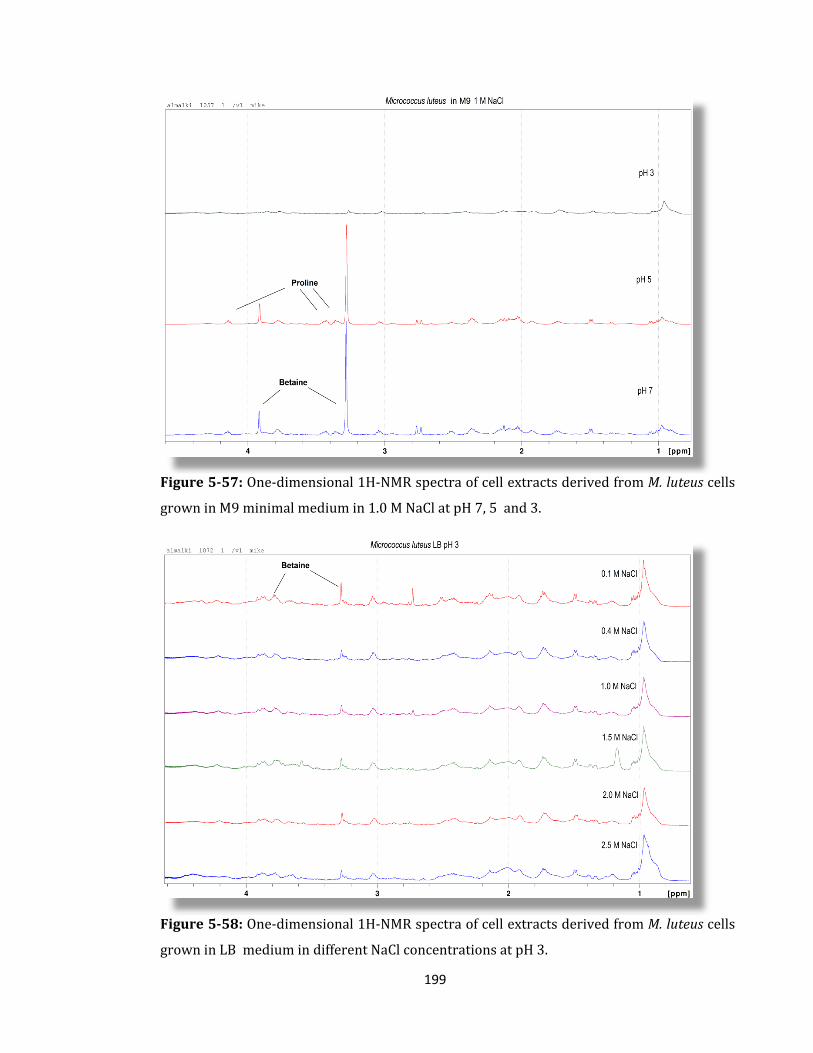
199
Figure 5-57: One-dimensional 1H-NMR spectra of cell extracts derived from M. luteus cells
grown in M9 minimal medium in 1.0 M NaCl at pH 7, 5 and 3.
Figure 5-58: One-dimensional 1H-NMR spectra of cell extracts derived from M. luteus cells
grown in LB medium in different NaCl concentrations at pH 3.
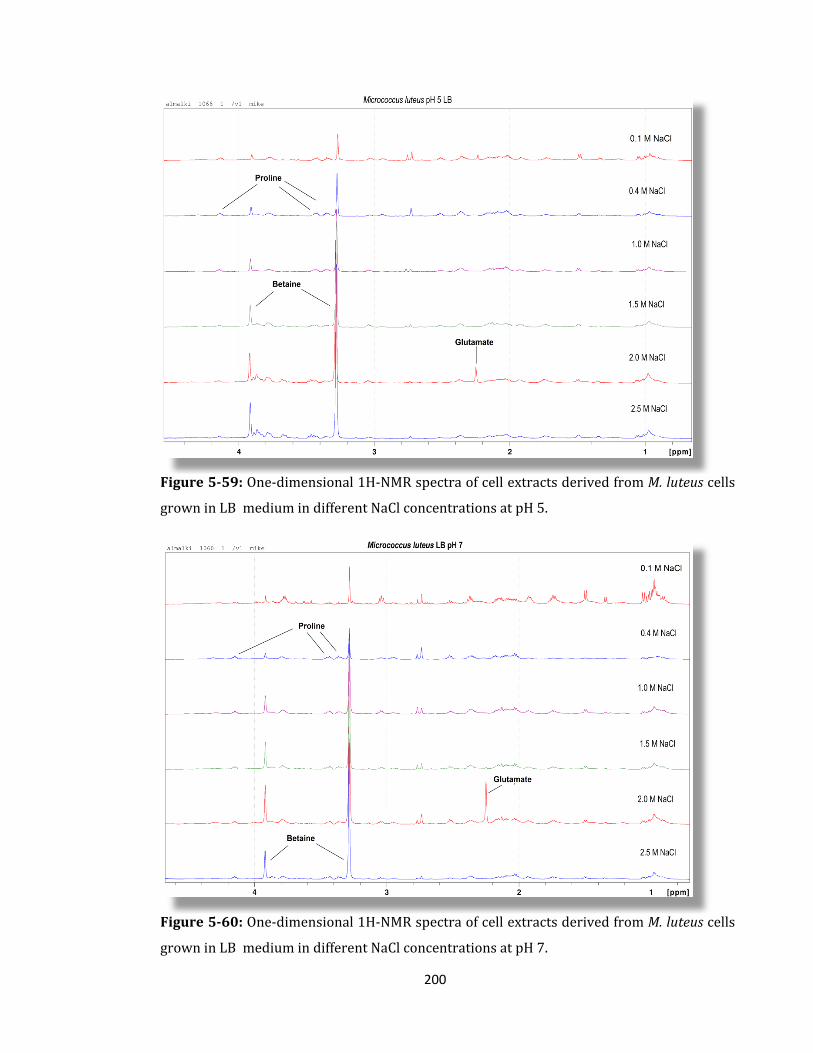
200
Figure 5-59: One-dimensional 1H-NMR spectra of cell extracts derived from M. luteus cells
grown in LB medium in different NaCl concentrations at pH 5.
Figure 5-60: One-dimensional 1H-NMR spectra of cell extracts derived from M. luteus cells
grown in LB medium in different NaCl concentrations at pH 7.
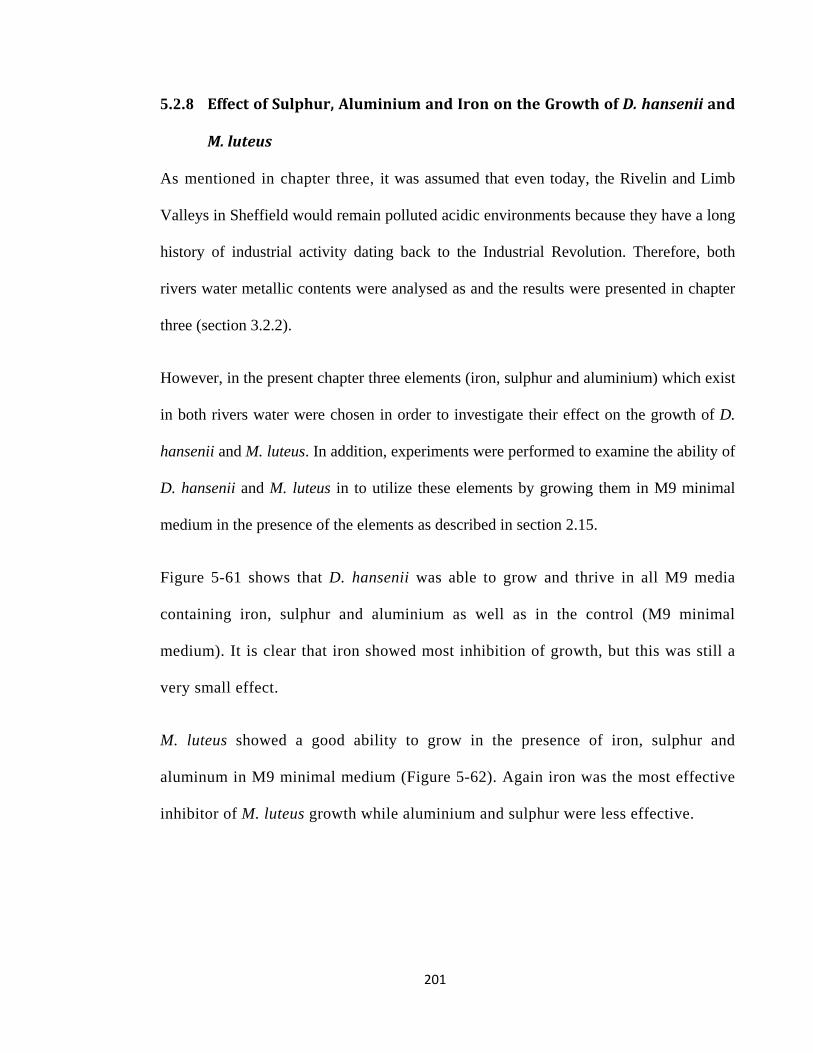
201
5.2.8 Effect of Sulphur, Aluminium and Iron on the Growth of D. hansenii and
M. luteus
As mentioned in chapter three, it was assumed that even today, the Rivelin and Limb
Valleys in Sheffield would remain polluted acidic environments because they have a long
history of industrial activity dating back to the Industrial Revolution. Therefore, both
rivers water metallic contents were analysed as and the results were presented in chapter
three (section 3.2.2).
However, in the present chapter three elements (iron, sulphur and aluminium) which exist
in both rivers water were chosen in order to investigate their effect on the growth of D.
hansenii and M. luteus. In addition, experiments were performed to examine the ability of
D. hansenii and M. luteus in to utilize these elements by growing them in M9 minimal
medium in the presence of the elements as described in section 2.15.
Figure 5-61 shows that D. hansenii was able to grow and thrive in all M9 media
containing iron, sulphur and aluminium as well as in the control (M9 minimal
medium). It is clear that iron showed most inhibition of growth, but this was still a
very small effect.
M. luteus showed a good ability to grow in the presence of iron, sulphur and
aluminum in M9 minimal medium (Figure 5-62). Again iron was the most effective
inhibitor of M. luteus growth while aluminium and sulphur were less effective.
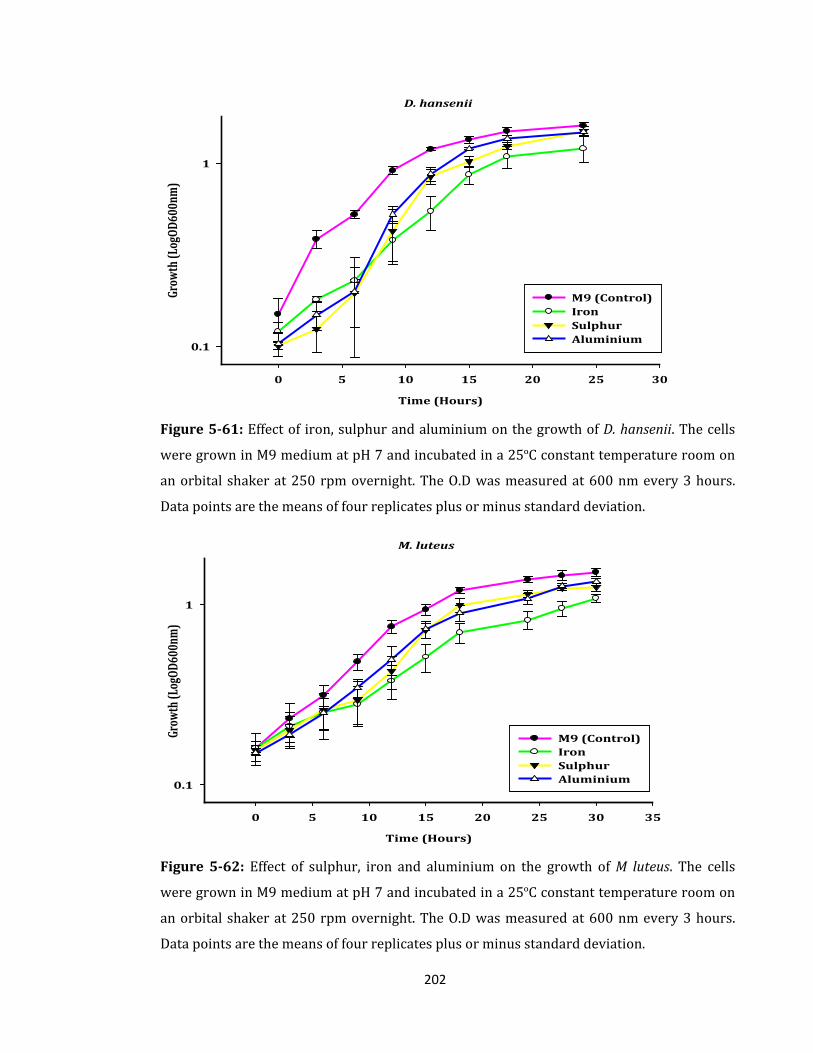
202
D. hansenii
Time (Hours)
0 5 10 15 20 25 30
Grow
th (L
ogOD
600n
m)
0.1
1
M9 (Control)Iron Sulphur Aluminium
Figure 5-61: Effect of iron, sulphur and aluminium on the growth of D. hansenii. The cells
were grown in M9 medium at pH 7 and incubated in a 25ºC constant temperature room on
an orbital shaker at 250 rpm overnight. The O.D was measured at 600 nm every 3 hours.
Data points are the means of four replicates plus or minus standard deviation.
M. luteus
Time (Hours)
0 5 10 15 20 25 30 35
Grow
th (L
ogOD
600n
m)
0.1
1
M9 (Control)Iron Sulphur Aluminium
Figure 5-62: Effect of sulphur, iron and aluminium on the growth of M luteus. The cells
were grown in M9 medium at pH 7 and incubated in a 25ºC constant temperature room on
an orbital shaker at 250 rpm overnight. The O.D was measured at 600 nm every 3 hours.
Data points are the means of four replicates plus or minus standard deviation.
203
5.3 Conclusions
In the current chapter, low nutrient and rich nutrient media with different pH values
(pH 7, 5 and 3) and different NaCl concentrations (0.1, 0.4, 1.0, 1.5, 2.0, 2.5, 3 M)
were used to determine the ability of eukaryotic yeast strain (Debaryomyces
hansenii) and prokaryotic bacterial strain (Micrococcus luteus) to grow under
different extreme conditions. Furthermore, generation (doubling) times, respiration
rates and the presence of compatible solutes were all determined. Finally, the effects
of three elements (iron, sulphur and aluminium) on growth were also investigated.
D. hansenii and M. luteus were grown in low nutrient (M9 minimal medium) under
acid stress, and then electron microscopy (SEM and TEM) was used in order to
investigate any changes that may have occurred to the cells structure. It was a good
achievement as recorded in the beginning of the current chapter to obtain many high
resolution microscope images of D. hansenii (Figure 5-1 and Figure 5-2) and M.
luteus (Figure 5-3 and Figure 5-4) which confirm and support the phenotypic and
phylogenic identification in chapters three and four. Also, SEM images showed that
D. hansenii cells grown at pH 7 were larger than cells grown at pH 3 in low nutrient
medium (Figure 5-1). While TEM images showed that the cell walls of M. luteus
cells grown at pH 3 were thicker than the cell walls of cells grown at pH 7, and that
the M. luteus cells grown at pH 3 tended to clump together more than in cells grown
at pH 7 (Figure 5-4).
Despite the changes which were observed by the use of SEM and TEM, it was quite
hard to investigate more significant changes using these types of electron
microscope. Using Environmental Scanning Electron Microscope (ESEM) may lead
204
to the discovery of more significant changes happening to microbial cells when
grown under stress. ESEM can examine microbial cells directly while they are still
subject to the environmental stresses while in SEM and TEM the cells must be re-
suspended in a phosphate buffer then followed by many other fixation steps as
described in section 2.19. These additional steps may obscure the effects of
environmental stresses on the microbial cells.
In growth curves experiments, D. hansenii shows a good ability to grow and thrive
under many extreme conditions such as low nutrients, high salinity and low pH. For
example, D. hansenii was able to grow in M9 minimal medium containing 1 M NaCl
at pH 7, 5 and 3 (Figure 5-11), and tolerate 1.5 M NaCl at pH 7 and pH 5 in the
same medium (Figure 5-12). In addition, D. hansenii shows a greater ability to grow
at high acidity and high salinity when grown in YPD medium. For example, D.
hansenii was able to thrive in YPD containing 2 M NaCl at pH 7, 5 and 3 (Figure 5-
20), and tolerate 3 M of NaCl at pH 7 and pH5 in YPD medium (Figure 5-22).
On the other hand, M .luteus shows poor capability to thrive under many stresses
when grown in low nutrient medium (M9 minimal medium) in particular at high
acidity. M. luteus just thrives at all pH values (7, 5 and 3) when grown in normal
M9 at 0.1 M NaCl (Figure 5-25), and barely grows in 0.4 M NaCl at pH 7 and pH 5
and no growth at pH 3 was observed (Figure 5-26). However, M. luteus showed a
significantly greater ability to tolerate high acidity and high salinity when grown in
LB medium. For example, M. luteus cells were able to tolerate 1 M NaCl at all pH
values (7, 5 and 3) (Figure 5-31), tolerate 2 M NaCl at pH 5 and pH 7 (Figure 5-33),
and tolerate 2.5 M NaCl at pH 7 (Figure 5-34).
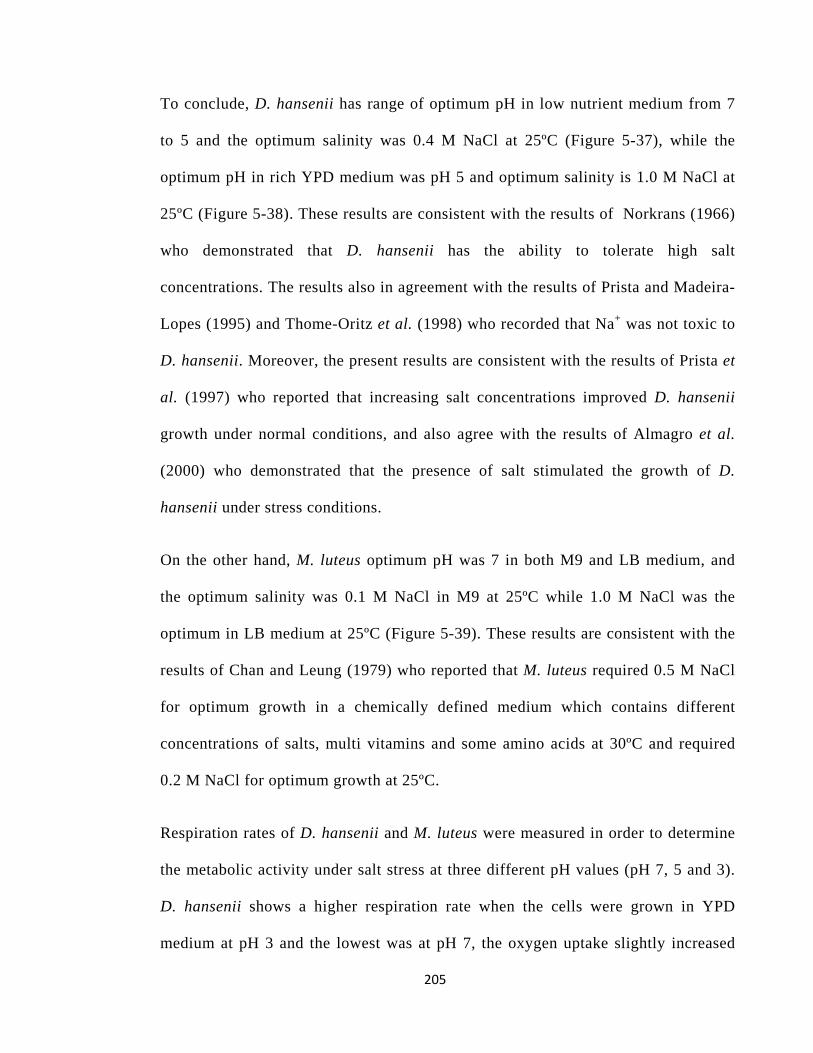
205
To conclude, D. hansenii has range of optimum pH in low nutrient medium from 7
to 5 and the optimum salinity was 0.4 M NaCl at 25ºC (Figure 5-37), while the
optimum pH in rich YPD medium was pH 5 and optimum salinity is 1.0 M NaCl at
25ºC (Figure 5-38). These results are consistent with the results of Norkrans (1966)
who demonstrated that D. hansenii has the ability to tolerate high salt
concentrations. The results also in agreement with the results of Prista and Madeira-
Lopes (1995) and Thome-Oritz et al. (1998) who recorded that Na+ was not toxic to
D. hansenii. Moreover, the present results are consistent with the results of Prista et
al. (1997) who reported that increasing salt concentrations improved D. hansenii
growth under normal conditions, and also agree with the results of Almagro et al.
(2000) who demonstrated that the presence of salt stimulated the growth of D.
hansenii under stress conditions.
On the other hand, M. luteus optimum pH was 7 in both M9 and LB medium, and
the optimum salinity was 0.1 M NaCl in M9 at 25ºC while 1.0 M NaCl was the
optimum in LB medium at 25ºC (Figure 5-39). These results are consistent with the
results of Chan and Leung (1979) who reported that M. luteus required 0.5 M NaCl
for optimum growth in a chemically defined medium which contains different
concentrations of salts, multi vitamins and some amino acids at 30ºC and required
0.2 M NaCl for optimum growth at 25ºC.
Respiration rates of D. hansenii and M. luteus were measured in order to determine
the metabolic activity under salt stress at three different pH values (pH 7, 5 and 3).
D. hansenii shows a higher respiration rate when the cells were grown in YPD
medium at pH 3 and the lowest was at pH 7, the oxygen uptake slightly increased
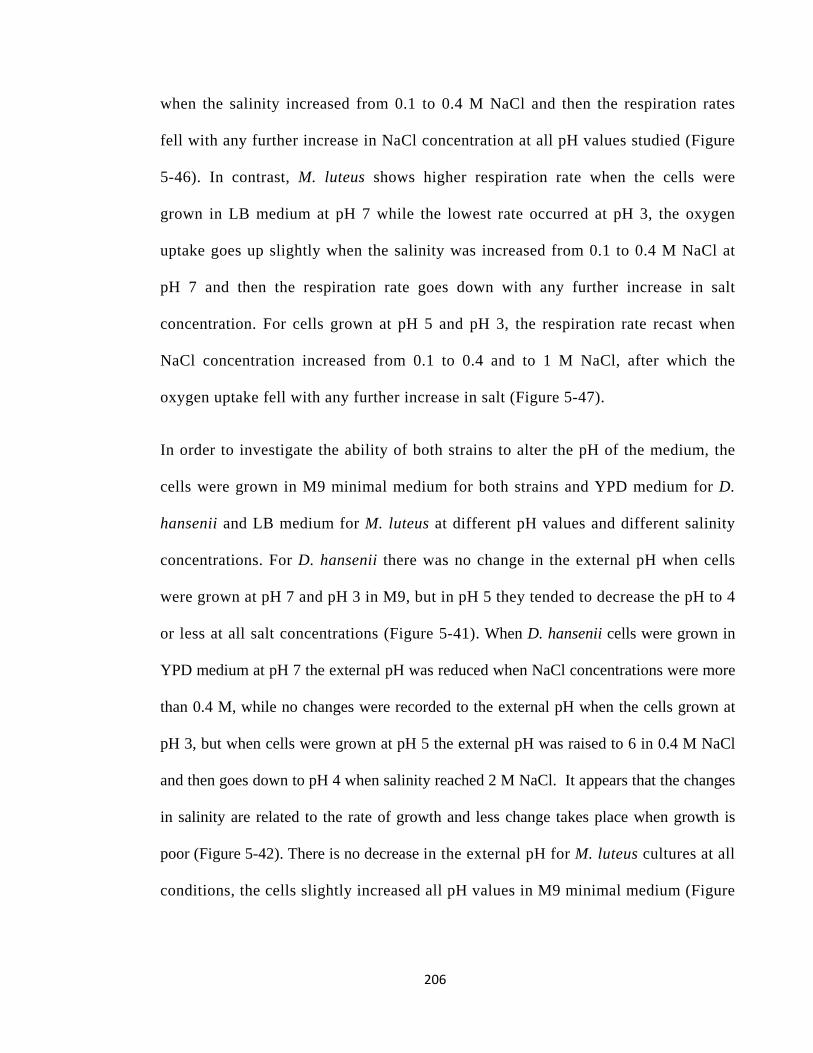
206
when the salinity increased from 0.1 to 0.4 M NaCl and then the respiration rates
fell with any further increase in NaCl concentration at all pH values studied (Figure
5-46). In contrast, M. luteus shows higher respiration rate when the cells were
grown in LB medium at pH 7 while the lowest rate occurred at pH 3, the oxygen
uptake goes up slightly when the salinity was increased from 0.1 to 0.4 M NaCl at
pH 7 and then the respiration rate goes down with any further increase in salt
concentration. For cells grown at pH 5 and pH 3, the respiration rate recast when
NaCl concentration increased from 0.1 to 0.4 and to 1 M NaCl, after which the
oxygen uptake fell with any further increase in salt (Figure 5-47).
In order to investigate the ability of both strains to alter the pH of the medium, the
cells were grown in M9 minimal medium for both strains and YPD medium for D.
hansenii and LB medium for M. luteus at different pH values and different salinity
concentrations. For D. hansenii there was no change in the external pH when cells
were grown at pH 7 and pH 3 in M9, but in pH 5 they tended to decrease the pH to 4
or less at all salt concentrations (Figure 5-41). When D. hansenii cells were grown in
YPD medium at pH 7 the external pH was reduced when NaCl concentrations were more
than 0.4 M, while no changes were recorded to the external pH when the cells grown at
pH 3, but when cells were grown at pH 5 the external pH was raised to 6 in 0.4 M NaCl
and then goes down to pH 4 when salinity reached 2 M NaCl. It appears that the changes
in salinity are related to the rate of growth and less change takes place when growth is
poor (Figure 5-42). There is no decrease in the external pH for M. luteus cultures at all
conditions, the cells slightly increased all pH values in M9 minimal medium (Figure
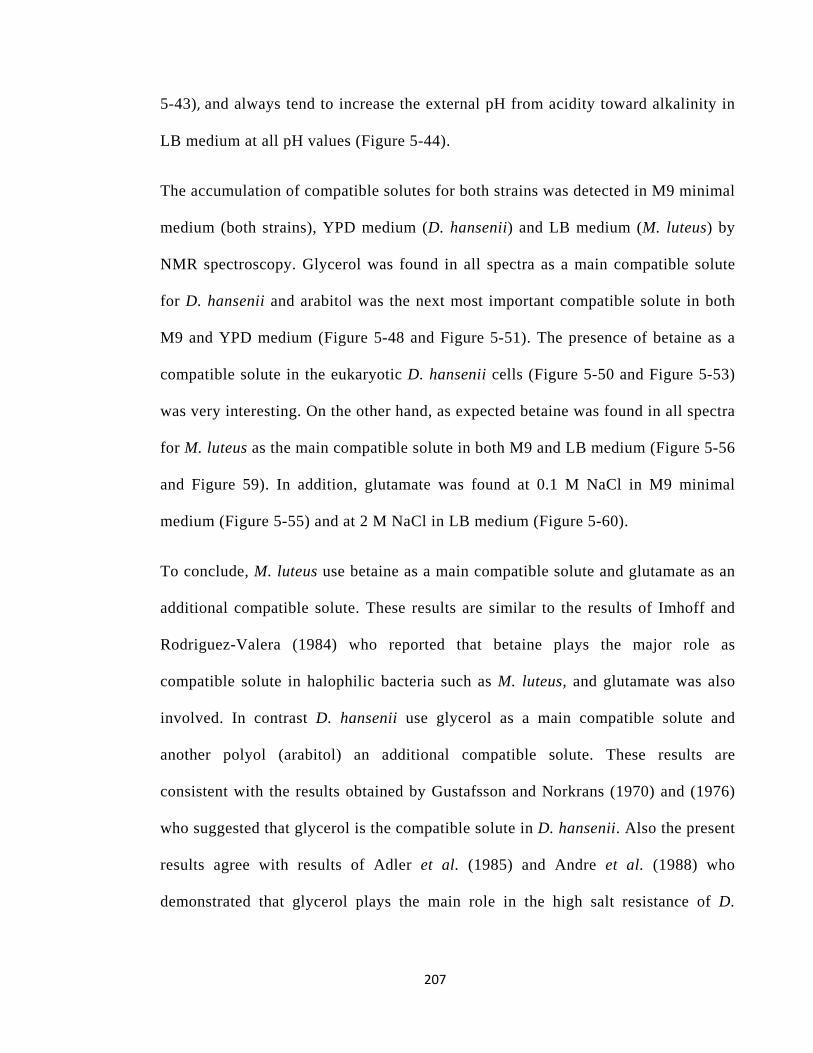
207
5-43), and always tend to increase the external pH from acidity toward alkalinity in
LB medium at all pH values (Figure 5-44).
The accumulation of compatible solutes for both strains was detected in M9 minimal
medium (both strains), YPD medium (D. hansenii) and LB medium (M. luteus) by
NMR spectroscopy. Glycerol was found in all spectra as a main compatible solute
for D. hansenii and arabitol was the next most important compatible solute in both
M9 and YPD medium (Figure 5-48 and Figure 5-51). The presence of betaine as a
compatible solute in the eukaryotic D. hansenii cells (Figure 5-50 and Figure 5-53)
was very interesting. On the other hand, as expected betaine was found in all spectra
for M. luteus as the main compatible solute in both M9 and LB medium (Figure 5-56
and Figure 59). In addition, glutamate was found at 0.1 M NaCl in M9 minimal
medium (Figure 5-55) and at 2 M NaCl in LB medium (Figure 5-60).
To conclude, M. luteus use betaine as a main compatible solute and glutamate as an
additional compatible solute. These results are similar to the results of Imhoff and
Rodriguez-Valera (1984) who reported that betaine plays the major role as
compatible solute in halophilic bacteria such as M. luteus, and glutamate was also
involved. In contrast D. hansenii use glycerol as a main compatible solute and
another polyol (arabitol) an additional compatible solute. These results are
consistent with the results obtained by Gustafsson and Norkrans (1970) and (1976)
who suggested that glycerol is the compatible solute in D. hansenii. Also the present
results agree with results of Adler et al. (1985) and Andre et al. (1988) who
demonstrated that glycerol plays the main role in the high salt resistance of D.
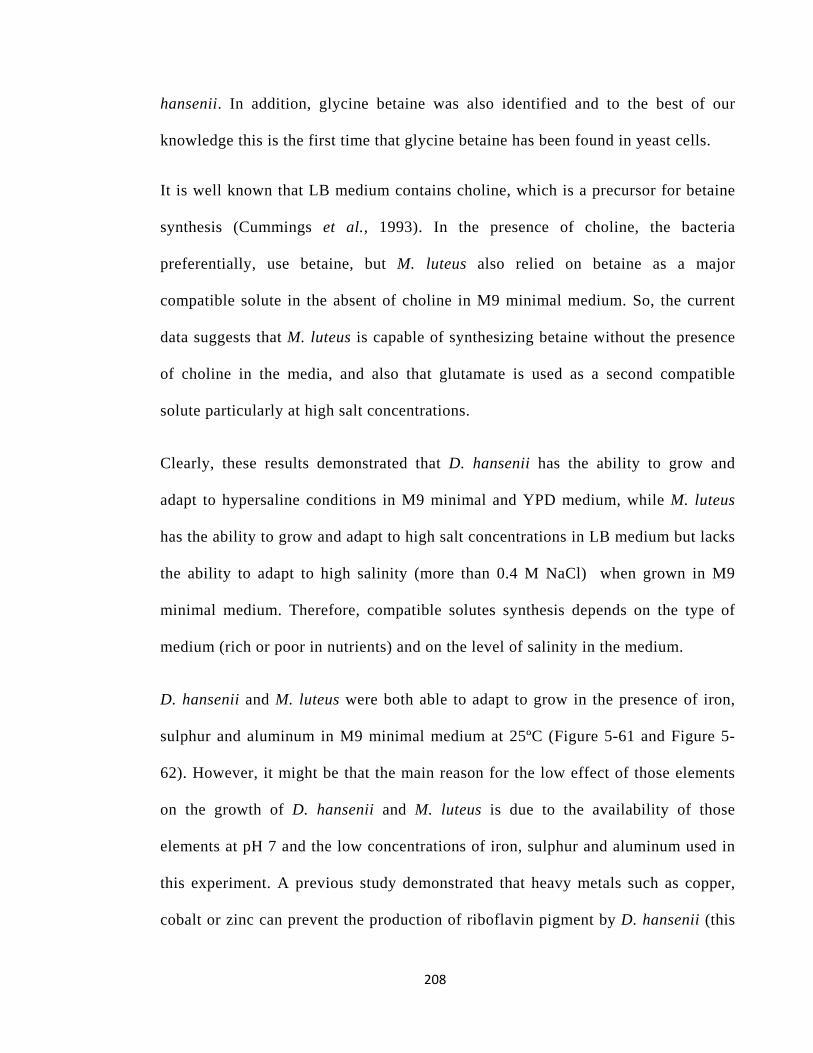
208
hansenii. In addition, glycine betaine was also identified and to the best of our
knowledge this is the first time that glycine betaine has been found in yeast cells.
It is well known that LB medium contains choline, which is a precursor for betaine
synthesis (Cummings et al., 1993). In the presence of choline, the bacteria
preferentially, use betaine, but M. luteus also relied on betaine as a major
compatible solute in the absent of choline in M9 minimal medium. So, the current
data suggests that M. luteus is capable of synthesizing betaine without the presence
of choline in the media, and also that glutamate is used as a second compatible
solute particularly at high salt concentrations.
Clearly, these results demonstrated that D. hansenii has the ability to grow and
adapt to hypersaline conditions in M9 minimal and YPD medium, while M. luteus
has the ability to grow and adapt to high salt concentrations in LB medium but lacks
the ability to adapt to high salinity (more than 0.4 M NaCl) when grown in M9
minimal medium. Therefore, compatible solutes synthesis depends on the type of
medium (rich or poor in nutrients) and on the level of salinity in the medium.
D. hansenii and M. luteus were both able to adapt to grow in the presence of iron,
sulphur and aluminum in M9 minimal medium at 25ºC (Figure 5-61 and Figure 5-
62). However, it might be that the main reason for the low effect of those elements
on the growth of D. hansenii and M. luteus is due to the availability of those
elements at pH 7 and the low concentrations of iron, sulphur and aluminum used in
this experiment. A previous study demonstrated that heavy metals such as copper,
cobalt or zinc can prevent the production of riboflavin pigment by D. hansenii (this
209
pigment is produced by yeast cells when grown in the presence of iron-depletion or
heavy metals) if extra iron was added to the growth medium (Gadd and Edwards,
1986). A previous study reported that M. luteus has the ability to grow on pyridine
(Sims et al., 1986). Leung et al. (2000) demonstrated that M. luteus also has the
ability to remove significant amounts of heavy metals such as Pb and Cu when
grown at pH 5.

210
CCHHAAPPTTEERR SSIIXX
211
6 Bioenergetics of Growth of Debaryomyces hansenii
6.1 Introduction
Microorganisms generate a great variety of lifestyles and can adapt to a wide range of
physical and chemical factors to allow growth in extreme environments. Therefore,
microorganisms are widely distributed in nature, each organism being defined and
characterized according to specific parameters which are essential for its development
(e.g. thermophiles, halophiles, acidophiles and alkaliphiles) (Cook, 2000, Goto et al.,
2005).
Microorganisms which grow in environments of extreme pH (low or high) have to
maintain a relatively constant cytoplasmic pH that is compatible with the best function
and structural integrity of their intracellular proteins, and which supports growth during
fluctuations in external pH (Albers et al., 2001, Sydow et al., 2002, Padan et al., 2005).
The range of cytoplasmic pH is strongly dependent on the external pH (Padan et al.,
2005). For example, neutrophilic bacteria that grow optimally at neutral pH have
intracellular pH (pHi) values from 7.5 to 8.0 (Booth, 1985). Alkaliphilic bacteria must
maintain their intracellular pH up to approximately 2 pH units more acidic than the
external pH (i.e. inverted pH gradient) (Krulwich et al., 1998, Olsson et al., 2003,
Satyanarayana et al., 2005, Liu et al., 2008). Furthermore, acidophiles which grow
optimally under acidic conditions exhibit intracellular pH values in the range of 6.5 to 7.0
(Cook, 2000).
Mitchell (1961) described the chemiosmotic theory which explains the key role that
membranes play in the generation of metabolic energy in the form of ATP (Albers et al.,
212
2001). Electron transport in the cytoplasmic membrane of bacteria induces a difference in
electrochemical potential of H+ across the membrane (proton motive force, PMF, Δp),
which is the sum of both membrane potential (transmembrane electrical potential, ΔΨ)
and transmembrane pH gradient (ΔpH), and is required for production of ATP by H+-
ATPase. The proton motive force is calculated using following equation:
PMF or Δp = ΔΨ- ZΔpH
ΔpH = pHi − pHo
Z = 2.3 RT/F = 58.5 ≅ 59 mV
ΔΨ (mV) is the membrane potential (electrical potential of membrane is outside positive
and inside negative), while ΔpH is the transmembrane pH gradient (outside acidic in
neutrophiles and outside alkaline in alkaliphiles), pHi is the internal pH, pHo is the pH
outside, R is the gas constant, T is absolute temperature and F is the Faraday constant
(Albers et al., 2001, Yumoto, 2002, Olsson et al., 2003, Goto et al., 2005).
The respiratory chain pumps out H+ from the inside to the outside of the membrane
associated with the flow of electrons from NADH to O2. ATPase produces ATP by
translocating H+ from the outside to the inside of the cell membrane of bacteria.
Moreover, the cell membrane of bacteria possesses a number of transporter systems for
obtaining substrates from the outside of the membrane, which work by using the
electrochemical potential of H+ across the cell membrane (Δp) as their driving force.
In fact, the survival of eukaryotic acidophiles microorganism in acidic environments is a
complex process and differs from the mechanisms used by prokaryotes. For example,
eukaryotes must cope with acid conditions on the surface of the plasma membrane, but
213
their internal organelle membranes are not in direct contact with the external acidity. Ion
channels and transporters are in contact with the low pH of the external environment,
which would minimally require molecular modifications compared to the equivalent
proteins of neutralophilic organisms (Messerli et al., 2005). Nevertheless, several yeast,
multicellular fungal and algal species thrive in acidic environments, often playing key
roles in the microbial communities present in these environments, particularly when
biofilms are present (Aguilera et al., 2007, Baker et al., 2009).
In the present chapter, the bioenergetics of the yeast Debaryomyces hansenii cells
adapted to grow at different pH values in M9 minimal medium were examined using the
silicone oil technique. Intracellular volumes of D. hansenii were investigated at pH 7 and
pH 3 (section 6.2.1). Furthermore, in section 6.2.2 membrane potentials (ΔΨ) were also
measured at pH 7 and pH 3. Internal pH (pHi) of D. hansenii was also determined at pH 7
and pH 3 in M9 minimal medium (section 6.2.3).
6.2 Results and Discussion
6.2.1 Determination of Intracellular Volume of D. hansenii at pH 3 and pH 7
In order to calculate the concentration ratios of probes across the cytoplasmic membrane
and hence membrane potential (ΔΨ) and internal pH (pHi) the intracellular volume (ICV)
was determined. The intracellular volume of D. hansenii cells was investigated by
centrifugation through silicone oil as described in section 2.20 following the protocol
described by Gimmler et al. (1978). Determination of both pellet volume (PV) using
tritiated water (3H2O) and extracellular volume (ECV) using 14C-dextran for all cells
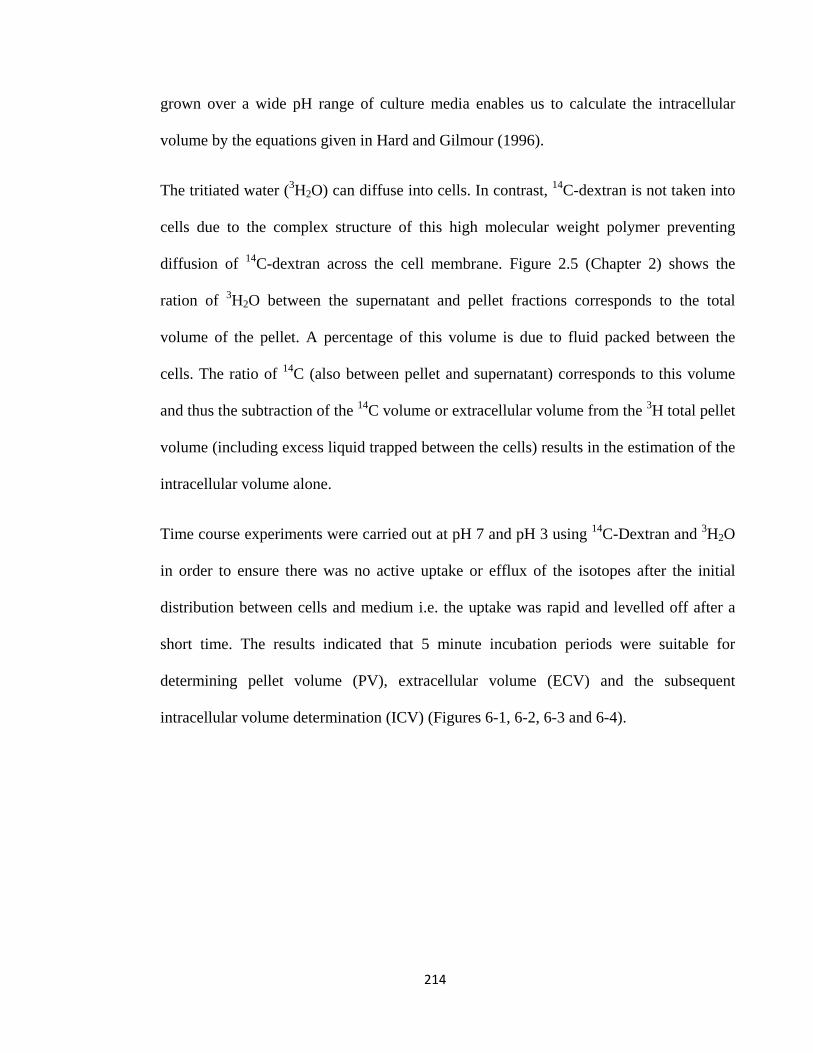
214
grown over a wide pH range of culture media enables us to calculate the intracellular
volume by the equations given in Hard and Gilmour (1996).
The tritiated water (3H2O) can diffuse into cells. In contrast, 14C-dextran is not taken into
cells due to the complex structure of this high molecular weight polymer preventing
diffusion of 14C-dextran across the cell membrane. Figure 2.5 (Chapter 2) shows the
ration of 3H2O between the supernatant and pellet fractions corresponds to the total
volume of the pellet. A percentage of this volume is due to fluid packed between the
cells. The ratio of 14C (also between pellet and supernatant) corresponds to this volume
and thus the subtraction of the 14C volume or extracellular volume from the 3H total pellet
volume (including excess liquid trapped between the cells) results in the estimation of the
intracellular volume alone.
Time course experiments were carried out at pH 7 and pH 3 using 14C-Dextran and 3H2O
in order to ensure there was no active uptake or efflux of the isotopes after the initial
distribution between cells and medium i.e. the uptake was rapid and levelled off after a
short time. The results indicated that 5 minute incubation periods were suitable for
determining pellet volume (PV), extracellular volume (ECV) and the subsequent
intracellular volume determination (ICV) (Figures 6-1, 6-2, 6-3 and 6-4).
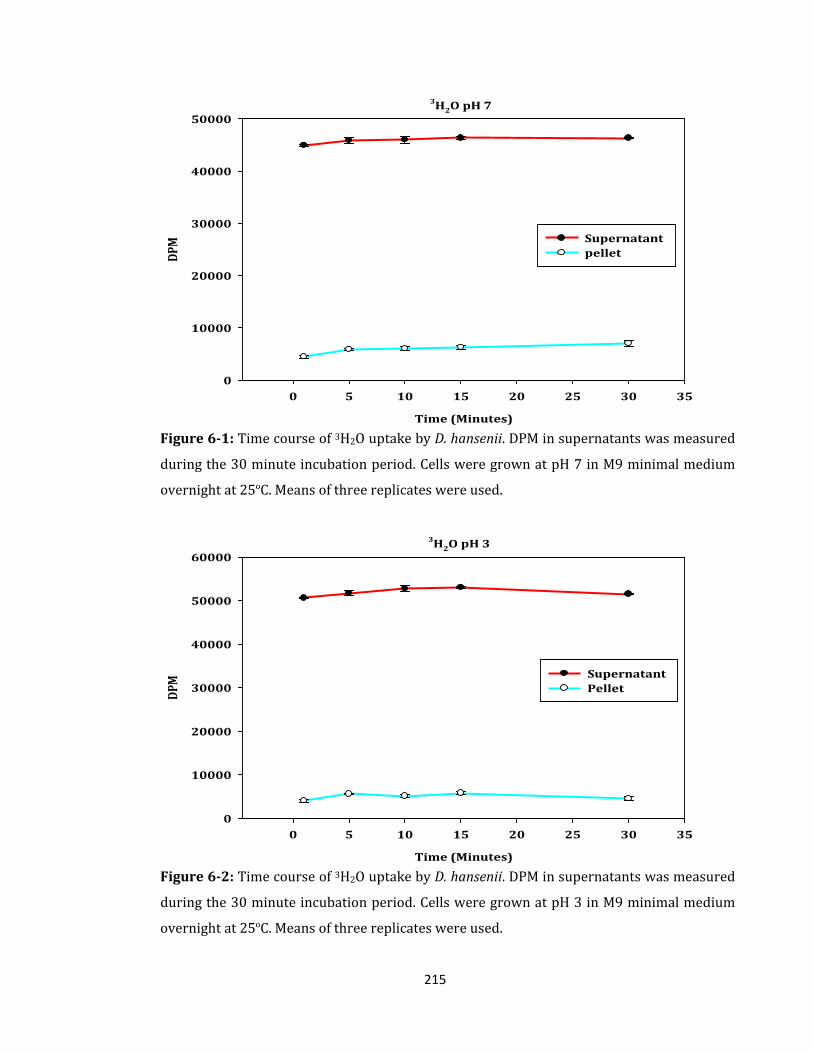
215
3H2O pH 7
Time (Minutes)
0 5 10 15 20 25 30 35
DPM
0
10000
20000
30000
40000
50000
Supernatant pellet
Figure 6-1: Time course of 3H2O uptake by D. hansenii. DPM in supernatants was measured
during the 30 minute incubation period. Cells were grown at pH 7 in M9 minimal medium
overnight at 25ºC. Means of three replicates were used.
3H2O pH 3
Time (Minutes)
0 5 10 15 20 25 30 35
DPM
0
10000
20000
30000
40000
50000
60000
Supernatant Pellet
Figure 6-2: Time course of 3H2O uptake by D. hansenii. DPM in supernatants was measured
during the 30 minute incubation period. Cells were grown at pH 3 in M9 minimal medium
overnight at 25ºC. Means of three replicates were used.
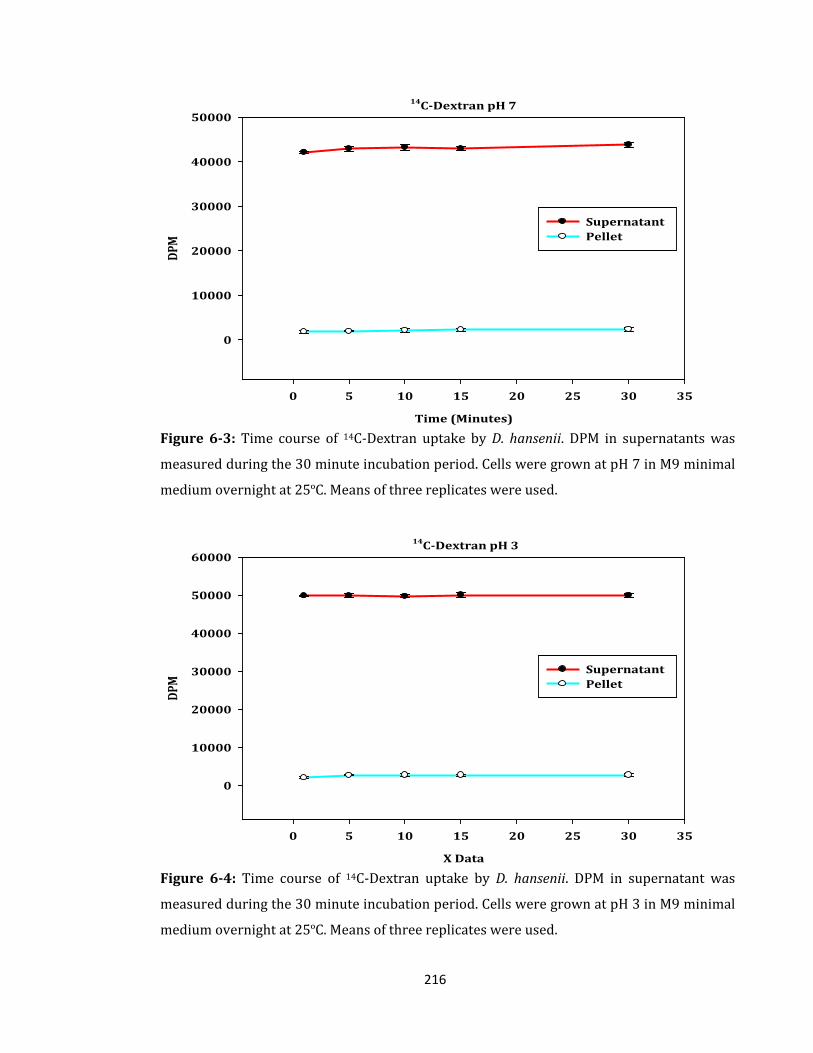
216
14C-Dextran pH 7
Time (Minutes)
0 5 10 15 20 25 30 35
DPM
0
10000
20000
30000
40000
50000
Supernatant Pellet
Figure 6-3: Time course of 14C-Dextran uptake by D. hansenii. DPM in supernatants was
measured during the 30 minute incubation period. Cells were grown at pH 7 in M9 minimal
medium overnight at 25ºC. Means of three replicates were used.
14C-Dextran pH 3
X Data
0 5 10 15 20 25 30 35
DPM
0
10000
20000
30000
40000
50000
60000
Supernatant Pellet
Figure 6-4: Time course of 14C-Dextran uptake by D. hansenii. DPM in supernatant was
measured during the 30 minute incubation period. Cells were grown at pH 3 in M9 minimal
medium overnight at 25ºC. Means of three replicates were used.
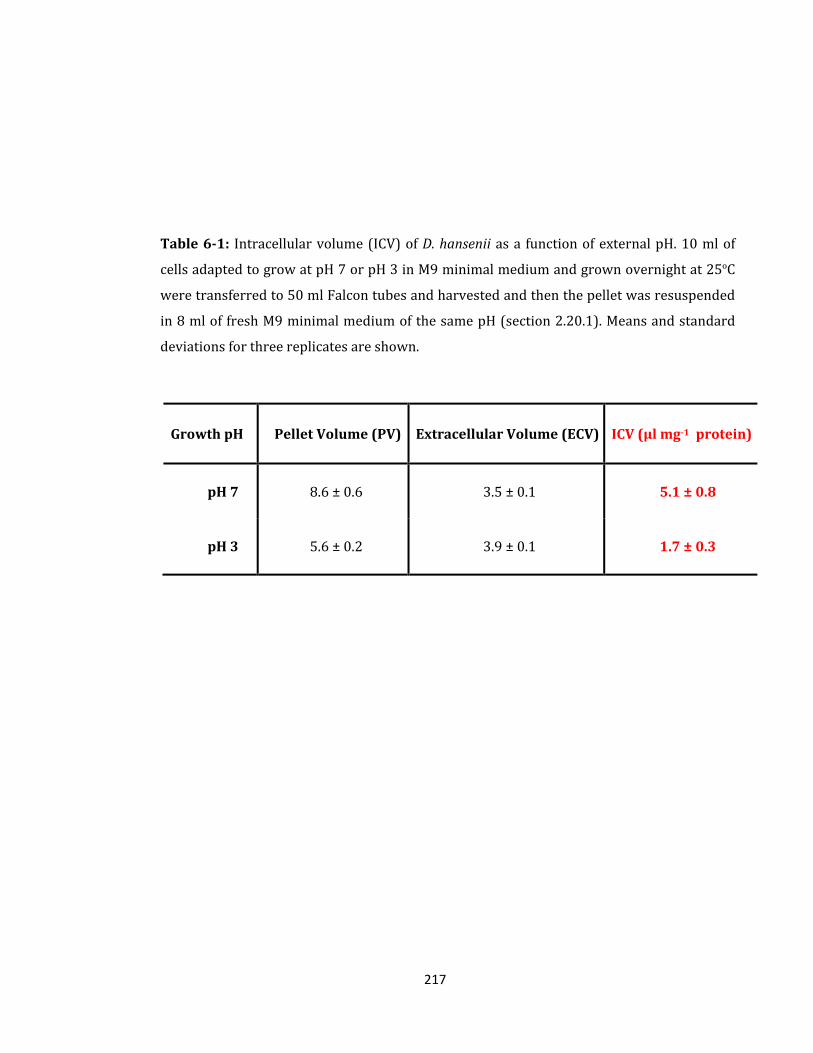
217
Table 6-1: Intracellular volume (ICV) of D. hansenii as a function of external pH. 10 ml of
cells adapted to grow at pH 7 or pH 3 in M9 minimal medium and grown overnight at 25ºC
were transferred to 50 ml Falcon tubes and harvested and then the pellet was resuspended
in 8 ml of fresh M9 minimal medium of the same pH (section 2.20.1). Means and standard
deviations for three replicates are shown.
Growth pH Pellet Volume (PV) Extracellular Volume (ECV) ICV (µl mg-1 protein)
pH 7 8.6 ± 0.6 3.5 ± 0.1 5.1 ± 0.8
pH 3 5.6 ± 0.2 3.9 ± 0.1 1.7 ± 0.3
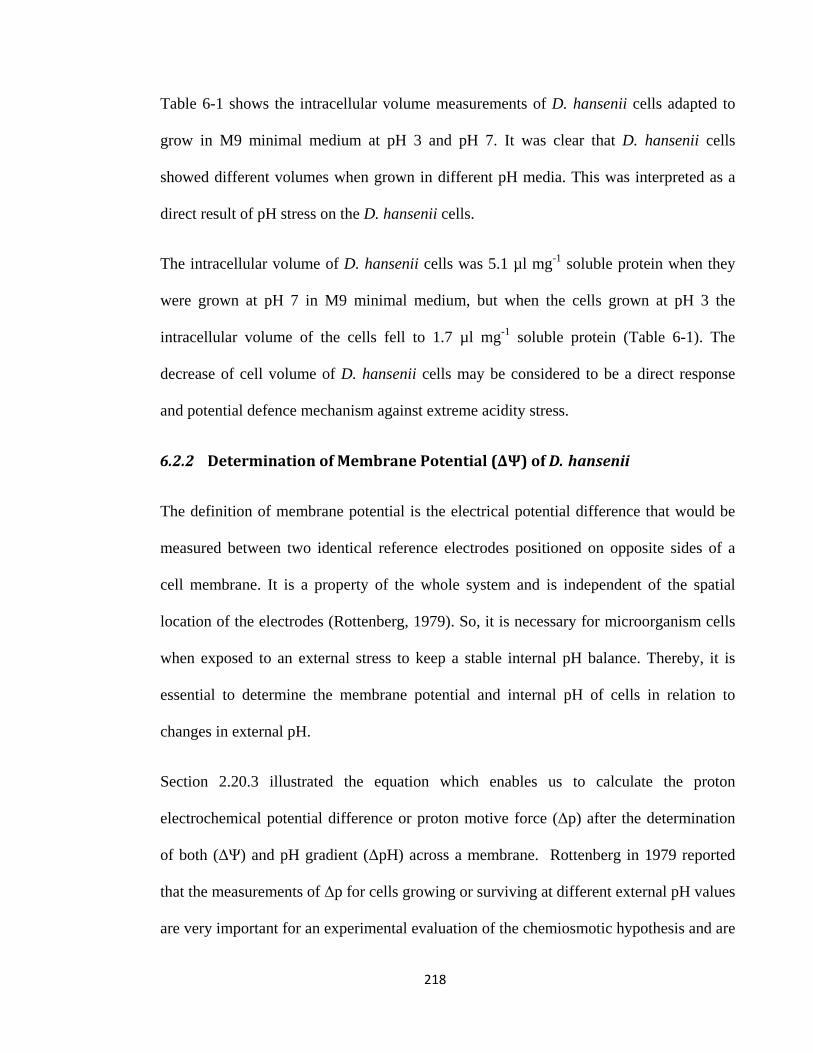
218
Table 6-1 shows the intracellular volume measurements of D. hansenii cells adapted to
grow in M9 minimal medium at pH 3 and pH 7. It was clear that D. hansenii cells
showed different volumes when grown in different pH media. This was interpreted as a
direct result of pH stress on the D. hansenii cells.
The intracellular volume of D. hansenii cells was 5.1 µl mg-1 soluble protein when they
were grown at pH 7 in M9 minimal medium, but when the cells grown at pH 3 the
intracellular volume of the cells fell to 1.7 µl mg-1 soluble protein (Table 6-1). The
decrease of cell volume of D. hansenii cells may be considered to be a direct response
and potential defence mechanism against extreme acidity stress.
6.2.2 Determination of Membrane Potential (ΔΨ) of D. hansenii
The definition of membrane potential is the electrical potential difference that would be
measured between two identical reference electrodes positioned on opposite sides of a
cell membrane. It is a property of the whole system and is independent of the spatial
location of the electrodes (Rottenberg, 1979). So, it is necessary for microorganism cells
when exposed to an external stress to keep a stable internal pH balance. Thereby, it is
essential to determine the membrane potential and internal pH of cells in relation to
changes in external pH.
Section 2.20.3 illustrated the equation which enables us to calculate the proton
electrochemical potential difference or proton motive force (Δp) after the determination
of both (ΔΨ) and pH gradient (ΔpH) across a membrane. Rottenberg in 1979 reported
that the measurements of Δp for cells growing or surviving at different external pH values
are very important for an experimental evaluation of the chemiosmotic hypothesis and are
219
also an indicator of the coupling in energy conversion membrane systems (Rottenberg,
1979).
In the present study 14C-TPP+ (tetraphenylphosphonium) was used as a probe for ΔΨ
determination, using the silicone oil centrifugation technique as described by Rottenberg
(1979 and 1989). TPP+ a positively charged ion is distributed across the membrane
according to the membrane potential.
In order to measure membrane potential based on the distribution of isotopes, the time
course of uptake for 14C-TPP+ probe was carried out using of D. hansenii cells to ensure
there was no active uptake or efflux of the isotope after the initial distribution between
cells and medium, and that the uptake was rapid and levelled off after a short time. This
indicated that 14C-TPP+ probe was suitable for membrane potential determination, if 5
minutes were used as an incubation period (Figure 6-5 and Figure 6-6).
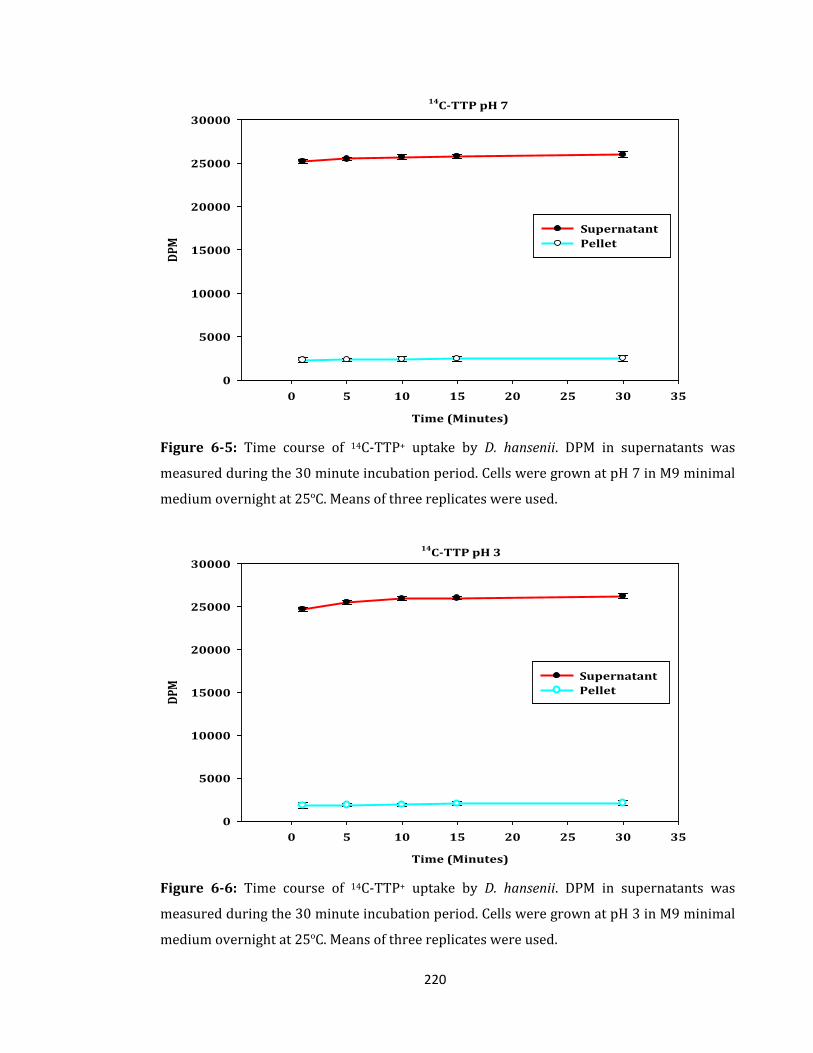
220
14C-TTP pH 7
Time (Minutes)
0 5 10 15 20 25 30 35
DPM
0
5000
10000
15000
20000
25000
30000
Supernatant Pellet
Figure 6-5: Time course of 14C-TTP+ uptake by D. hansenii. DPM in supernatants was
measured during the 30 minute incubation period. Cells were grown at pH 7 in M9 minimal
medium overnight at 25ºC. Means of three replicates were used.
14C-TTP pH 3
Time (Minutes)
0 5 10 15 20 25 30 35
DPM
0
5000
10000
15000
20000
25000
30000
Supernatant Pellet
Figure 6-6: Time course of 14C-TTP+ uptake by D. hansenii. DPM in supernatants was
measured during the 30 minute incubation period. Cells were grown at pH 3 in M9 minimal
medium overnight at 25ºC. Means of three replicates were used.
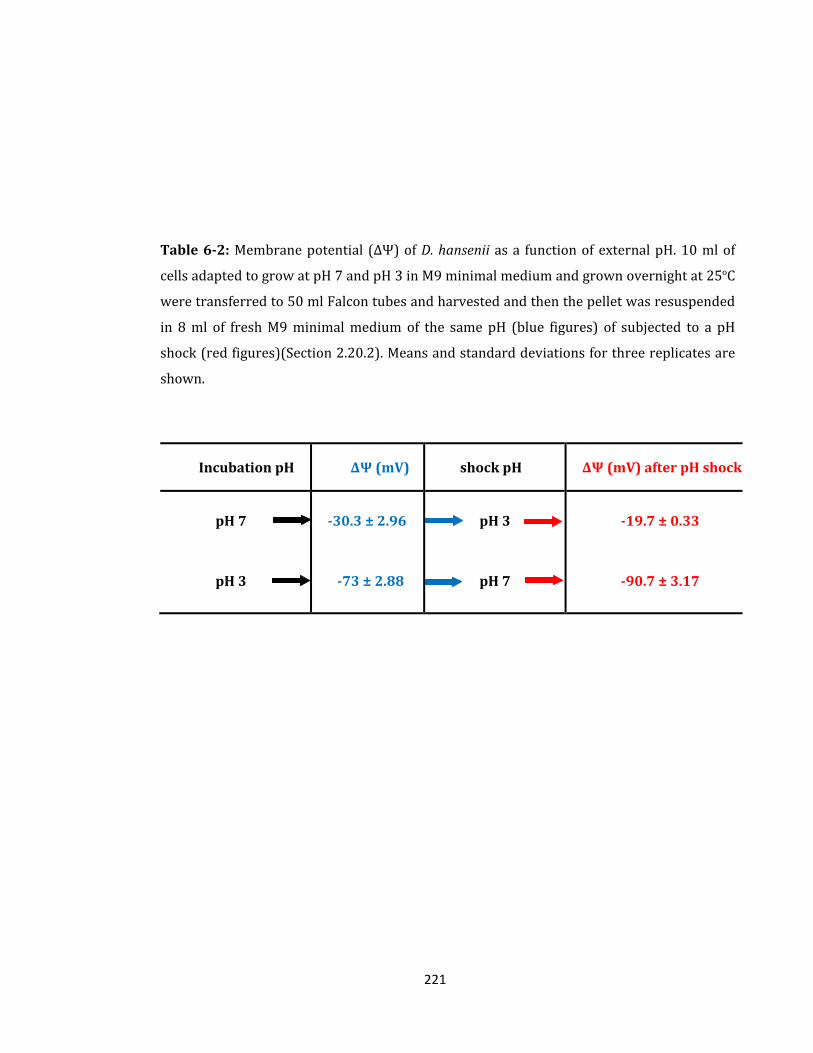
221
Table 6-2: Membrane potential (ΔΨ) of D. hansenii as a function of external pH. 10 ml of
cells adapted to grow at pH 7 and pH 3 in M9 minimal medium and grown overnight at 25ºC
were transferred to 50 ml Falcon tubes and harvested and then the pellet was resuspended
in 8 ml of fresh M9 minimal medium of the same pH (blue figures) of subjected to a pH
shock (red figures)(Section 2.20.2). Means and standard deviations for three replicates are
shown.
Incubation pH ΔΨ (mV) shock pH ΔΨ (mV) after pH shock
pH 7 -30.3 ± 2.96 pH 3 -19.7 ± 0.33
pH 3 -73 ± 2.88 pH 7 -90.7 ± 3.17
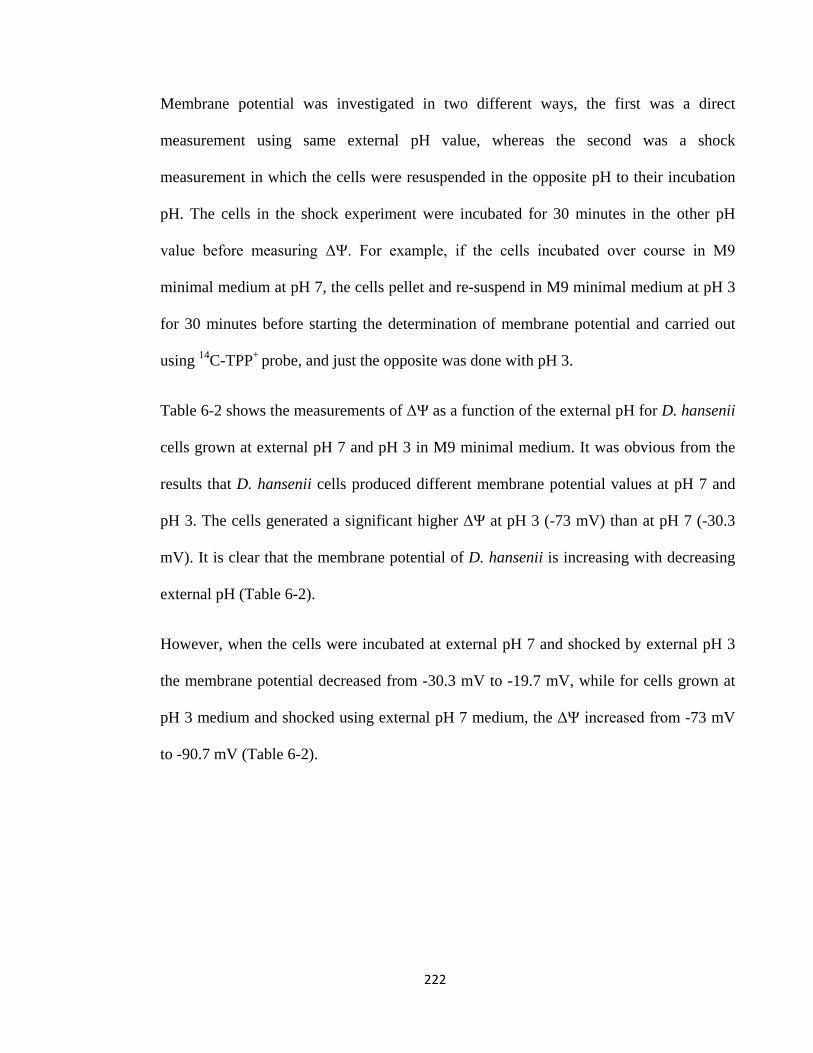
222
Membrane potential was investigated in two different ways, the first was a direct
measurement using same external pH value, whereas the second was a shock
measurement in which the cells were resuspended in the opposite pH to their incubation
pH. The cells in the shock experiment were incubated for 30 minutes in the other pH
value before measuring ΔΨ. For example, if the cells incubated over course in M9
minimal medium at pH 7, the cells pellet and re-suspend in M9 minimal medium at pH 3
for 30 minutes before starting the determination of membrane potential and carried out
using 14C-TPP+ probe, and just the opposite was done with pH 3.
Table 6-2 shows the measurements of ΔΨ as a function of the external pH for D. hansenii
cells grown at external pH 7 and pH 3 in M9 minimal medium. It was obvious from the
results that D. hansenii cells produced different membrane potential values at pH 7 and
pH 3. The cells generated a significant higher ΔΨ at pH 3 (-73 mV) than at pH 7 (-30.3
mV). It is clear that the membrane potential of D. hansenii is increasing with decreasing
external pH (Table 6-2).
However, when the cells were incubated at external pH 7 and shocked by external pH 3
the membrane potential decreased from -30.3 mV to -19.7 mV, while for cells grown at
pH 3 medium and shocked using external pH 7 medium, the ΔΨ increased from -73 mV
to -90.7 mV (Table 6-2).
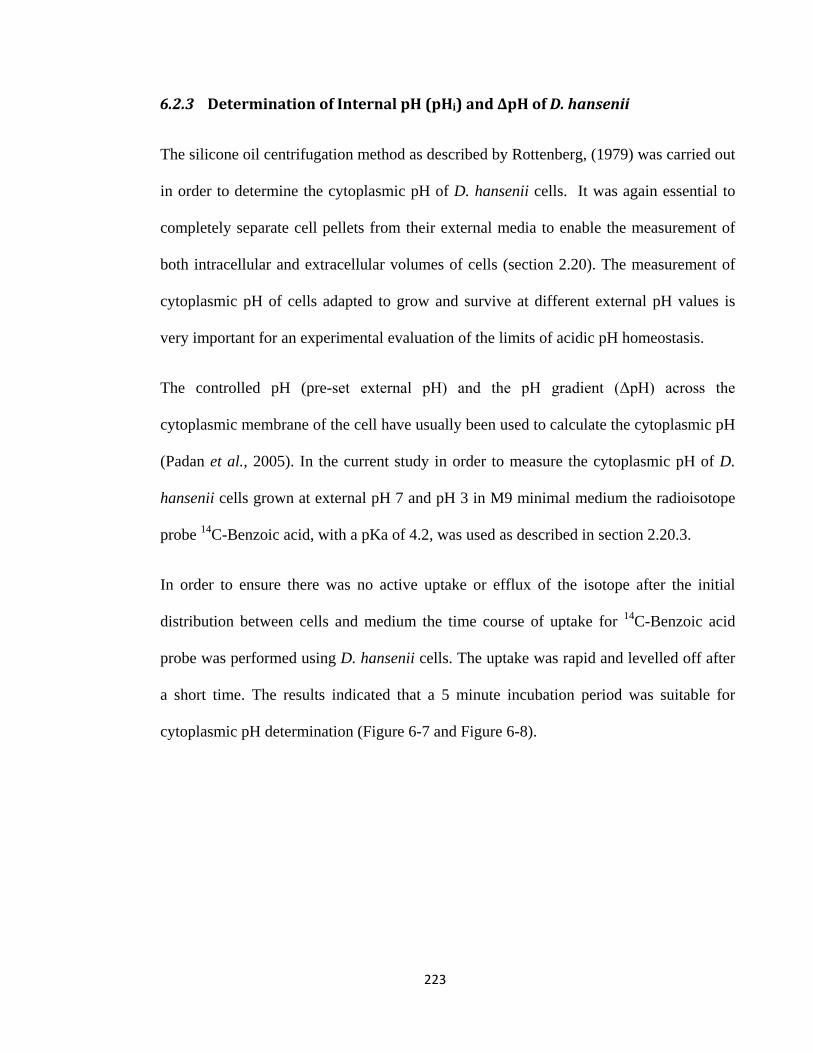
223
6.2.3 Determination of Internal pH (pHi) and ΔpH of D. hansenii
The silicone oil centrifugation method as described by Rottenberg, (1979) was carried out
in order to determine the cytoplasmic pH of D. hansenii cells. It was again essential to
completely separate cell pellets from their external media to enable the measurement of
both intracellular and extracellular volumes of cells (section 2.20). The measurement of
cytoplasmic pH of cells adapted to grow and survive at different external pH values is
very important for an experimental evaluation of the limits of acidic pH homeostasis.
The controlled pH (pre-set external pH) and the pH gradient (ΔpH) across the
cytoplasmic membrane of the cell have usually been used to calculate the cytoplasmic pH
(Padan et al., 2005). In the current study in order to measure the cytoplasmic pH of D.
hansenii cells grown at external pH 7 and pH 3 in M9 minimal medium the radioisotope
probe 14C-Benzoic acid, with a pKa of 4.2, was used as described in section 2.20.3.
In order to ensure there was no active uptake or efflux of the isotope after the initial
distribution between cells and medium the time course of uptake for 14C-Benzoic acid
probe was performed using D. hansenii cells. The uptake was rapid and levelled off after
a short time. The results indicated that a 5 minute incubation period was suitable for
cytoplasmic pH determination (Figure 6-7 and Figure 6-8).
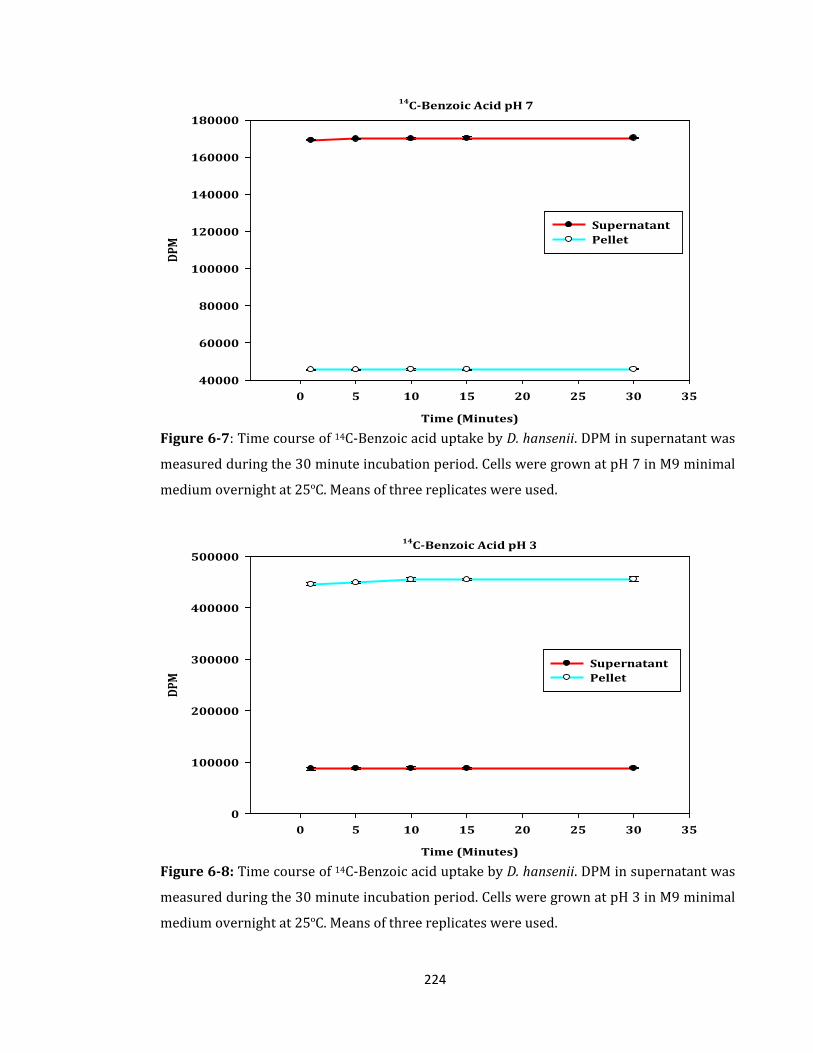
224
14C-Benzoic Acid pH 7
Time (Minutes)
0 5 10 15 20 25 30 35
DPM
40000
60000
80000
100000
120000
140000
160000
180000
Supernatant Pellet
Figure 6-7: Time course of 14C-Benzoic acid uptake by D. hansenii. DPM in supernatant was
measured during the 30 minute incubation period. Cells were grown at pH 7 in M9 minimal
medium overnight at 25ºC. Means of three replicates were used.
14C-Benzoic Acid pH 3
Time (Minutes)
0 5 10 15 20 25 30 35
DPM
0
100000
200000
300000
400000
500000
Supernatant Pellet
Figure 6-8: Time course of 14C-Benzoic acid uptake by D. hansenii. DPM in supernatant was
measured during the 30 minute incubation period. Cells were grown at pH 3 in M9 minimal
medium overnight at 25ºC. Means of three replicates were used.
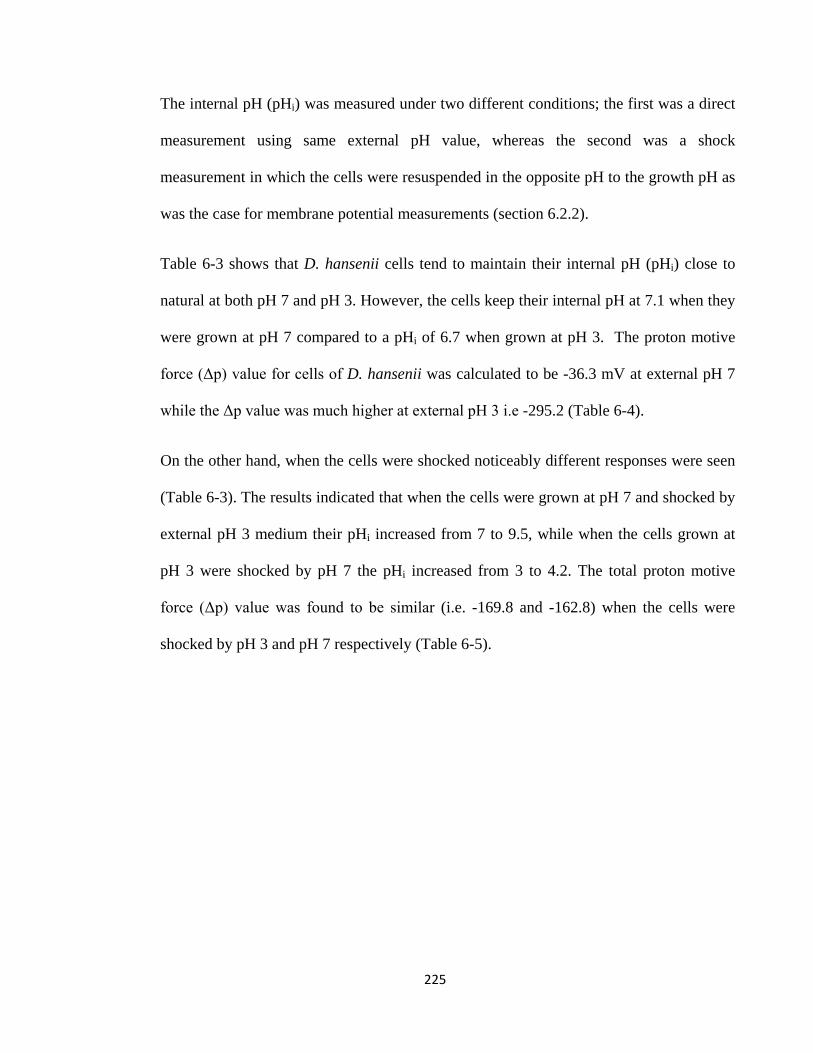
225
The internal pH (pHi) was measured under two different conditions; the first was a direct
measurement using same external pH value, whereas the second was a shock
measurement in which the cells were resuspended in the opposite pH to the growth pH as
was the case for membrane potential measurements (section 6.2.2).
Table 6-3 shows that D. hansenii cells tend to maintain their internal pH (pHi) close to
natural at both pH 7 and pH 3. However, the cells keep their internal pH at 7.1 when they
were grown at pH 7 compared to a pHi of 6.7 when grown at pH 3. The proton motive
force (Δp) value for cells of D. hansenii was calculated to be -36.3 mV at external pH 7
while the Δp value was much higher at external pH 3 i.e -295.2 (Table 6-4).
On the other hand, when the cells were shocked noticeably different responses were seen
(Table 6-3). The results indicated that when the cells were grown at pH 7 and shocked by
external pH 3 medium their pHi increased from 7 to 9.5, while when the cells grown at
pH 3 were shocked by pH 7 the pHi increased from 3 to 4.2. The total proton motive
force (Δp) value was found to be similar (i.e. -169.8 and -162.8) when the cells were
shocked by pH 3 and pH 7 respectively (Table 6-5).
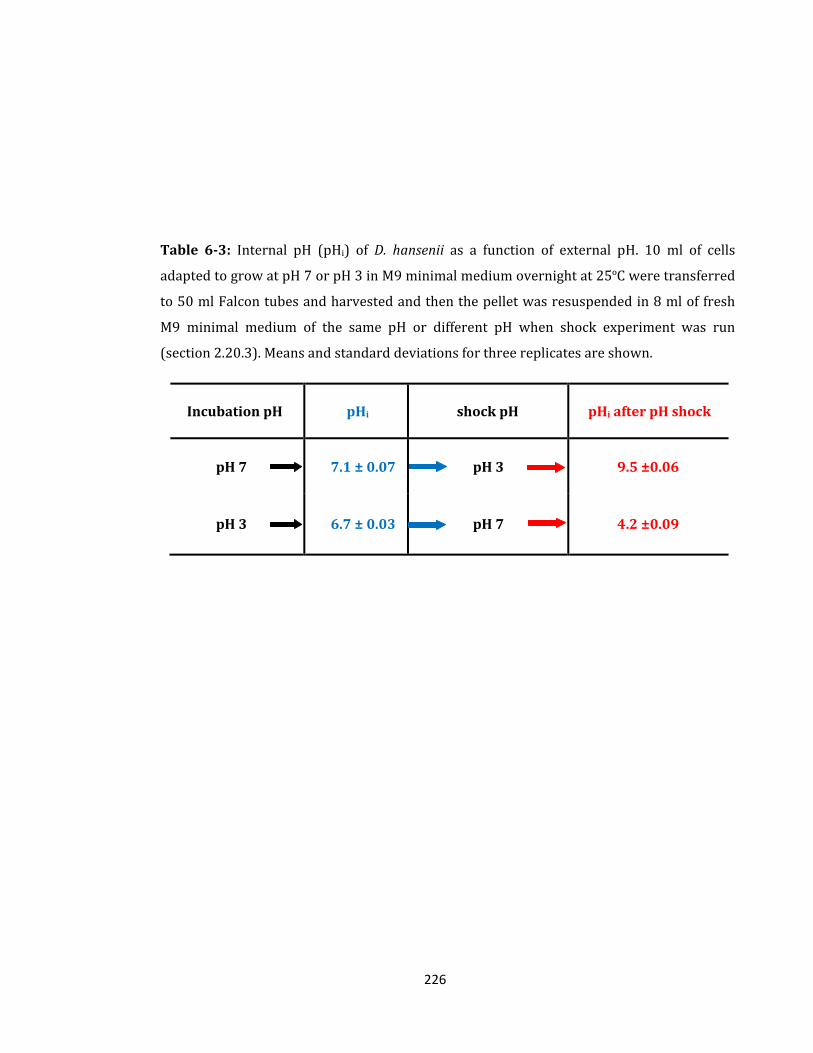
226
Table 6-3: Internal pH (pHi) of D. hansenii as a function of external pH. 10 ml of cells
adapted to grow at pH 7 or pH 3 in M9 minimal medium overnight at 25ºC were transferred
to 50 ml Falcon tubes and harvested and then the pellet was resuspended in 8 ml of fresh
M9 minimal medium of the same pH or different pH when shock experiment was run
(section 2.20.3). Means and standard deviations for three replicates are shown.
Incubation pH pHi shock pH pHi after pH shock
pH 7 7.1 ± 0.07 pH 3 9.5 ±0.06
pH 3 6.7 ± 0.03 pH 7 4.2 ±0.09
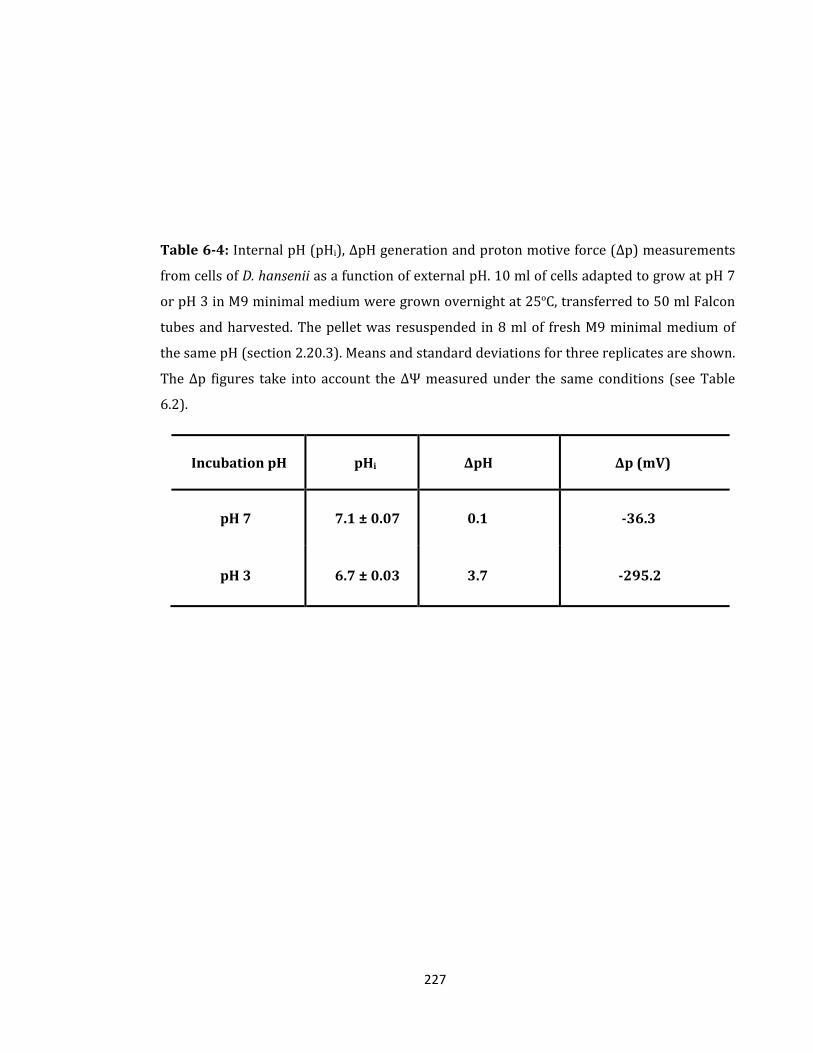
227
Table 6-4: Internal pH (pHi), ΔpH generation and proton motive force (Δp) measurements
from cells of D. hansenii as a function of external pH. 10 ml of cells adapted to grow at pH 7
or pH 3 in M9 minimal medium were grown overnight at 25ºC, transferred to 50 ml Falcon
tubes and harvested. The pellet was resuspended in 8 ml of fresh M9 minimal medium of
the same pH (section 2.20.3). Means and standard deviations for three replicates are shown.
The Δp figures take into account the ΔΨ measured under the same conditions (see Table
6.2).
Incubation pH pHi ΔpH Δp (mV)
pH 7 7.1 ± 0.07 0.1 -36.3
pH 3 6.7 ± 0.03 3.7 -295.2
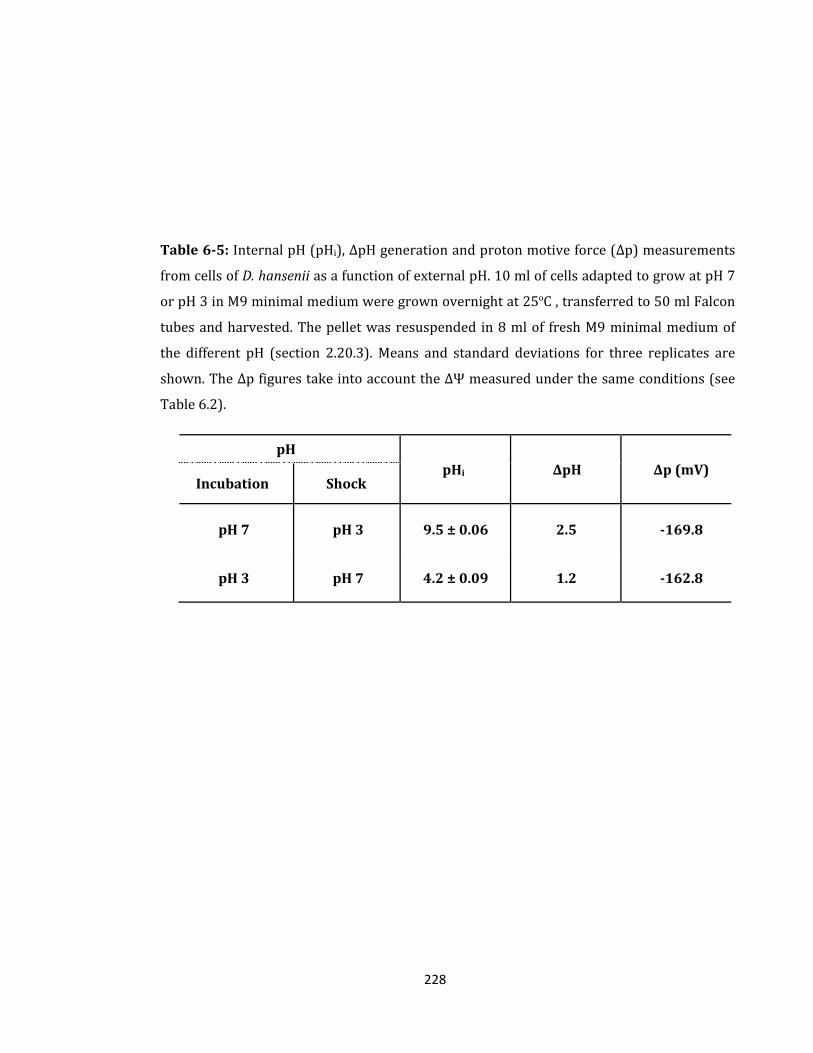
228
Table 6-5: Internal pH (pHi), ΔpH generation and proton motive force (Δp) measurements
from cells of D. hansenii as a function of external pH. 10 ml of cells adapted to grow at pH 7
or pH 3 in M9 minimal medium were grown overnight at 25ºC , transferred to 50 ml Falcon
tubes and harvested. The pellet was resuspended in 8 ml of fresh M9 minimal medium of
the different pH (section 2.20.3). Means and standard deviations for three replicates are
shown. The Δp figures take into account the ΔΨ measured under the same conditions (see
Table 6.2).
pH pHi ΔpH Δp (mV)
Incubation Shock
pH 7 pH 3 9.5 ± 0.06 2.5 -169.8
pH 3 pH 7 4.2 ± 0.09 1.2 -162.8
229
To conclude, D. hansenii cells maintained their pHi close to neutral when grown at pH 7
(pHi was maintained to 7.1) and pH 3 (pHi was maintained to 6.7), but the cells showed
an inability to balance their pHi 30 minutes after being resuspended in a different pH. The
cells increased their pHi to 9.5 when they shocked by external pH 3 medium, and but they
only slightly increased pHi to 4.2 when cells grown at pH 3 were shocked by external pH
7 medium.
The results suggest that D. hansenii was able to grow at low external pH levels despite
their pHi becoming more acidic or more alkaline. Nevertheless, the pHi levels are always
higher (more alkaline) than the external pH under all conditions tested.
230
6.3 Conclusions
To study the effect of the pH of the culture medium on the bioenergetics of growth of D.
hansenii, the intracellular volume (ICV), membrane potential (ΔΨ) and cytoplasmic pH
(pHi) of cells were all examined. The use of radiolabelled isotopes in the silicone oil
experiments described in the present study produced consistent results. This method
allows the calculation of a volume for a pellet of cells through the ratio of two isotope
species; tritiated water (3H2O) and 14C-dextran.
The cell volume of D. hansenii was determined in cells adapted to grow at different
external pH values of 7 and 3. It can be seen from the current chapter that there was a
change in the ICV of D. hansenii cells when they were grown at different pH values. The
ICV decreased with decreasing external pH, it was 5.7 µl mg-1 soluble protein when the
cells were grown at pH 7 but fell to 1.7 µl mg-1 soluble protein when the external pH
decreased to 3. This decrease in cell volume may be considered to be a self defence
mechanism of this yeast to the extreme pH of the culture medium. Berner and Gervais in
1994 demonstrated that the cell volume of yeast decreased to a minimum with increasing
salt concentrations (Berner and Gervais, 1994). In 2006 Mortensen et al., recorded cell
shrinkages of D. hansenii cells of approximately 30% to 35% under NaCl stress
(Mortensen et al., 2006).
14C -TPP+ (tetraphenylphosphonium) was used for membrane potential determination
using the silicone oil centrifugation technique at a range of external pH values.
Membrane potential (ΔΨ) of D. hansenii cells was found to be highest (most negative) at
low external pH, the ΔΨ was increased from -30.3 mV at external pH 7 to -73 mV at
231
external pH 3. The difference in membrane potential was more pronounced when they
were subjected to pH shocks. The ΔΨ was about -19.7 mV when the cells grown at pH 7
were shocked by external pH 3 and it was -90.7 mV when cells grown at external pH 3
were shocked by external pH 7. In 1998 Thome-Ortiz et al., reported that K+ stimulated
proton pumping decreased the ΔΨ of D. hansenii and they also found evidence for a
K+/H+ exchange system that can control pH (Thome-Oritz et al., 1998).
Additionally, the internal pH (pHi) of D. hansenii cells was measured by the distribution
of 14C-Benzoic acid between the cell and the surrounding medium at different external
pH values. The results show that D. hansenii cells are able to maintain their cytoplasmic
pH close to neutral when they are grown in M9 minimal medium at pH 3 (pHi was 6.7)
and pH 7 (pHi was 7.1). Moreover, shock experiment was designed to investigate D.
hansenii cells behaviour under rapid changes of external pH values. However, when the
cells were grown at pH 7 and shocked by external pH 3 the pHi increased to 9.5
(alkaline), while when the cells were grown at pH 3 and shocked by external pH 7
medium the pHi was maintained at 4.2 (acidic).
These results suggest that D. hansenii cells have a problem in maintaining their internal
pH against external pH stress in M9 minimal medium when they face rapid change in the
external pH value (measurements made 30 minutes after pH shock). Previous study of
two D. hansenii strains showed that a more NaCl-tolerant strain was able to maintain pHi
homeostasis, whereas intracellular acidification occurred in the less NaCl-tolerant strain
(Mortensen et al., 2006). This suggests that the NaCl tolerant D. hansenii strain had a
greater intracellular buffering capacity. Another study done by (Mortensen et al., 2008)
showed that the intracellular acidification of D. hansenii cells was induced by 200 µg/ml
232
of nitrite at external pH 4.5, while the cells show a good homeostasis maintenance of pHi
in the presence of nitrite at external pH 5.5. Parallel studies with Candida zeylanoides
showed that this yeast was acidified at external pH 5.5 in the presence of nitrite. This
suggests that D. hansenii is better able to control pHi than less acid tolerant yeast species.

233
CCHHAAPPTTEERR SSEEVVEENN
234
7 General Conclusions and Future Work
7.1 Conclusions
The major initial aim of this research project was to isolate acidophilic or
acidotolerant microorganisms from sites in Sheffield (Rivelin and Limb valleys),
which were known to have been polluted by industrial activity dating back several
hundred years. In the event, four microorganisms (Bacillus cereus, Micrococcus
luteus, Aureobasidium pullulans and Debaryomyces hansenii) were isolated as pure
cultures and shown to be capable of growth over the pH range from 3 to 7 (Chapters
3 and 4). After initial characterisation and identification by 16S or 18S rDNA
sequencing, it was decided to concentrate work on one bacterial species (M. luteus)
and one eukaryotic species (D. hansenii). The major reason for selecting M. luteus
and D. hansenii for further characterisation was the ability of these two strains to
grow well at high salinities (up to 2.5 M NaCl) at pH 3 (Figure 3.17) (i.e. they show
potential to be polyextremophiles) (Gomes and Steiner, 2004).
This potential was realised for D. hansenii, which was able to grow well at high salt
concentrations and low pH values in minimal M9 medium. D. hansensii showed a
greater ability to grow at high acidity and high salinity when grown in rich YPD
medium. The optimum pH for D. hansenii in M9 medium was from 7 to 5 and the
optimum salinity was 0.4 M NaCl at 25ºC. In YPD medium, the optimum pH was 5
and optimum salinity was 1.0 M NaCl at 25ºC. This clearly illustrates the
235
importance of rich medium in extending the range for optimal growth under stress
conditions (Cummings et al., 1993).
On the other hand, M .luteus shows poor ability to thrive under salt and acid stresses
when grown in low nutrient M9 medium. However, M. luteus showed a significantly
greater ability to tolerate high acidity and high salinity when grown in rich LB
medium. It was found that pH 7 was the optimum pH for M. luteus in both M9 and
LB medium, and 0.1 M NaCl was the optimum salinity in M9 at 25ºC while 1.0 M
NaCl was the optimum in LB medium at 25ºC. Therefore, in general M. luteus
favours non-extreme conditions, but it can be classified as a slight halophile when
grown in rich medium (Gilmour, 1990).
The ability of microorganisms to adapt to high external salt concentrations depends
on their efficiency at accumulating osmotically active compounds intracellularly.
These compounds are known as compatible solutes to denote their compatibility
with cell function (Brown, 1976). D. hansenii cells accumulate glycerol as the main
compatible solute and another polyol (arabitol) as an additional compatible solute.
The presence of polyols in D. hansenii has been found previously (Norkrans, 1966),
but the identification of glycine betaine as a compatible solute in D. hansenii
(Figures 5-48 to 5-54) is a new observation to the best of our knowledge. Even more
surprising is the presence of glycine betaine in M9 minimal medium cultures, which
suggests that D. hansenii is synthesising this compatible solute de novo and not just
taking it up (or its precursor choline) from rich YPD medium (Cummings et al.,
1993). The presence of glycine betaine in cell extracts of M. luteus was to be
expected based on previous work with related bacteria (Ventosa et al., 1998) and M.
236
luteus was shown to use betaine as the main compatible solute and glutamate as an
additional compatible solute (Figures 5-55 to 5-60).
D. hansenii and M. luteus were both able to adapt to grow in M9 minimal medium
containing iron, sulphur and aluminum at 25ºC. However, it might be that the main
reason for the low effect of those elements on the growth of D. hansenii and M.
luteus is due to the availability of those elements at pH 7 and the relatively low
concentrations of iron, sulphur and aluminum used in this experiment.
The intracellular volume (ICV), membrane potential (ΔΨ) and cytoplasmic pH (pHi) of
D. hansenii cells were measured in M9 minimal medium at pH 7 and pH 3. The ICV of
D. hansenii decreased with decreasing external pH from 5.7 µl mg-1 soluble protein when
the cells were grown at pH 7 to 1.7 µl mg-1 soluble protein at pH 3. This indicates that
cells grown at pH 3 were significantly smaller than cells grown at neutral pH, a finding
that was confirmed by electron micrographs of D. hansenii (Figure 5.1). The ΔΨ of D.
hansenii cells was found to be highest (most negative) at pH 3 (-73 mV) compared with -
30.3 mV at pH 7. Furthermore, the difference in membrane potential was more obvious
when they were subjected to pH shocks, the ΔΨ was -90.7 mV when cells were grown at
pH 3 and shocked by resuspension in pH 7. The ΔΨ was -19.7 mV when the cells grown
at pH 7 were shocked by resuspension in pH 3.
D. hansenii cells are able to maintain their cytoplasmic pH close to neutral when they are
grown in M9 minimal medium at pH 7 (pHi was 7.1) or pH 3 (pHi was 6.7). This means
that the pH gradient between the inside and outside of the cells is extremely large in cells
grown at pH 3. In bacterial cells, where the ΔpH is very large, the ΔΨ is reversed (inside
237
positive), but as noted in the paragraph above this does not happen with D. hansenii cells.
The most likely explanation is that the eukaryotic yeast cell does not use its cytoplasmic
membrane as the site of ATP generation and therefore controlling the overall level of Δp
may not be crucial.
When D. hansenii cells were grown at pH 7 and shocked by resuspension in pH 3 the pHi
jumped to 9.5 (alkaline), while when the cells were grown at pH 3 and shocked by
resuspension in pH 7 the pHi decreased to 4.2 (became more acidic). These results
suggest that D. hansenii cells have a problem in maintaining their internal pH against
external pH stress in M9 minimal medium when they face a rapid change in the external
pH value (measurements made 30 minutes after pH shock).
7.2 Future Work
Despite the success of isolating four microorganisms (two bacteria and two yeasts)
in the present work from Rivelin and Limb Valleys in Sheffield, UK using
traditional culturing methods, it was perhaps surprisingly not to isolate more novel
strains or at least a greater number than just four microorganisms. As noted in
Chapter 3, several different culture media were used, but future work could include
the use of a larger variety of selective media to try to isolate additional
microorganisms from these natural habitats.
The use of electron microscopy (SEM and TEM) allowed the observation of some
stress-induced changes in the cell structure of D. hansenii and M. luteus cells
(Figures 5-1 to 5-4). However, it is highly recommended to use Environmental
238
Scanning Electron Microscope (ESEM) in future work which may lead to the
discovery of further significant changes happening to microbial cells when grown
under stress.
The present experiments on the bioenergetics of growth of D. hansenii gave
promising results, but it would be very interesting to carry out further research
looking at the uptake of compatible solutes (or their precursors) from rich media. In
addition, extending the pH shock experiments to times beyond 30 minutes after the
pH change would allow the determination of the time taken for the cells to recover
and return their ΔpH and ΔΨ to normal values.

239
RREEFFEERREENNCCEESS
240
ADDY, S. O. (1888) A glossary of words used in the neighbourhood of Sheffield, Pub. for
the English dialect society by Trubner & co.
ADLER, L., BLOMBERG, A. & NILSSON, A. (1985) Glycerol metabolism and osmoregulation
in the salt-tolerant yeast Debaryomyces hansenii. Journal of bacteriology, 162,
300.
AGUILERA, A., SOUZA-EGIPSY, V., GOMEZ, F. & AMILS, R. (2007) Development and
structure of eukaryotic biofilms in an extreme acidic environment, RÃo Tinto (SW,
Spain). Microbial ecology, 53, 294-305.
AHMED, S. & BOOTH, I. R. (1983) The effect of-galactosides on the protonmotive force
and growth of Escherichia coli. Journal of general microbiology, 129, 2521.
ALBERS, S. V., VOSSENBERG, J. L., DRIESSEN, A. J. & KONINGS, W. N. (2001)
Bioenergetics and solute uptake under extreme conditions. Extremophiles, 5, 285-
294.
ALLEN, R. D. & BAUMANN, P. (1971) Structure and arrangement of flagella in species of
the genus Beneckea and Photobacterium fischeri. Journal of bacteriology, 107,
295.
ALMAGRO, A., PRISTA, C., CASTRO, S., QUINTAS, C., MADEIRA-LOPES, A., RAMOS, J. &
LOUREIRO-DIAS, M. C. (2000) Effects of salts on Debaryomyces hansenii and
Saccharomyces cerevisiae under stress conditions. International journal of food
microbiology, 56, 191-197.
AMANN, R., GLOCKNER, F. O. & NEEF, A. (1997) Modern methods in subsurface
microbiology: in situ identification of microorganisms with nucleic acid probes.
FEMS microbiology reviews, 20, 191-200.
ANDRE, L., NILSSON, A. & ADLER, L. (1988) The role of glycerol in osmotolerance of the
yeast Debaryomyces hansenii. Journal of general microbiology, 134, 669.
ARNESEN, L. P. S., FAGERLUND, A. & GRANUM, P. E. (2008) From soil to gut: Bacillus
cereus and its food poisoning toxins. FEMS microbiology reviews, 32, 579-606.
BAIRD-PARKER, A. C. (1965) The classification of staphylococci and micrococci from
world-wide sources. Journal of general microbiology, 38, 363.
241
BAKER-AUSTIN, C. & DOPSON, M. (2007) Life in acid: pH homeostasis in acidophiles.
Trends in microbiology, 15, 165-171.
BAKER, B. J., TYSON, G. W., GOOSHERST, L. & BANFIELD, J. F. (2009) Insights into the
diversity of eukaryotes in acid mine drainage biofilm communities. Applied and
environmental microbiology, 75, 2192-2199.
BARNETT, J. A., PAYNE, R. W., YARROW, D. & BARNETT, L. (2000) Yeasts: characteristics
and identification, Cambridge University Press Cambridge.
BARONOFSKY, J. J., SCHREURS, W. J. A. & KASHKET, E. R. (1984) Uncoupling by acetic
acid limits growth of and acetogenesis by Clostridium thermoaceticum. Applied
and environmental microbiology, 48, 1134.
BEN-AMOTZ, A. & AVRON, M. (1983) On the factors which determine massive β-carotene
accumulation in the halotolerant alga Dunaliella bardawil. Plant physiology, 72,
593.
BERGEY, D. H. & BOONE, D. R. (2009) Bergey's manual of systematic bacteriology,
Springer Verlag.
BERNER, J. L. & GERVAIS, P. (1994) A new visualization chamber to study the transient
volumetric response of yeast cells submitted to osmotic shifts. Biotechnology and
bioengineering, 43, 165-170.
BERTHELOT, D., LEDUC, L. G. & FERRONI, G. D. (1994) The absence of psychrophilic
Thiobacillus ferrooxidans and acidophilic heterotrophic bacteria in cold, tailings
effluents from a uranium mine. Canadian journal of microbiology, 40, 60-63.
BLOCK, E., RICHARD, S., JACOBSEN, N. E., JOHNSON, S., KAHAKACHCHI, C., KAMINSKI, R.,
SKOWRONSKA, A., BOAKYE, H. T., TYSON, J. F. & UDEN, P. C. (2004) Identification
and synthesis of a novel selenium-sulfur amino acid found in selenized yeast:
Rapid indirect detection NMR methods for characterizing low-level
organoselenium compounds in complex matrices. Journal of agricultural and food
chemistry, 52, 3761-3771.
BOCKELMANN, U., MANZ, W., NEU, T. R. & SZEWZYK, U. (2000) Characterization of the
microbial community of lotic organic aggregates (river snow) in the Elbe River of
242
Germany by cultivation and molecular methods. FEMS microbiology ecology, 33,
157-170.
BOOTH, I. R. (1985) Regulation of cytoplasmic pH in bacteria. Microbiology and molecular
biology reviews, 49, 359.
BRADFORD, M. M. (1976) A rapid and sensitive method for the quantitation of
microgram quantities of protein utilizing the principle of protein-dye binding.
Analytical biochemistry, 72, 248-254.
BREMER, E. & KRÃMER, R. (2000) Coping with osmotic challenges: osmoregulation
through accumulation and release of compatible solutes in bacteria. Bacterial
stress responses. ASM Press, Washington, DC, 79-97.
BREUER, U. & HARMS, H. (2006) Debaryomyces hansenii-an extremophilic yeast with
biotechnological potential. Yeast, 23, 415-437.
BROCK, T. D. (1978) Thermophilic microorganisms and life at high temperatures.
Springer-verlag, New York, NY., 465 pp.
BROWN, A. D. (1976) Microbial water stress. Microbiology and molecular biology reviews,
40, 803.
CAI, H., ARCHAMBAULT, M. & PRESCOTT, J. F. (2003) 16S Ribosomal RNA Sequence-
Based Identification of Veterinary Clinical Bacteria. Journal of veterinary diagnostic
investigation, 15, 465.
CASES, I. & DE LORENZO, V. (2002) The grammar of (micro) biological diversity.
Environmental microbiology, 4, 623-627.
CHAN, K. & LEUNG, O. C. (1979) Nutrition and growth of the moderately halophilic
bacteria Micrococcus morrhuae K-17 and Micrococcus luteus K-15. Microbios, 25,
71.
CHEN, Y., WANG, Y., SUN, Y., ZHANG, L. & LI, W. (2001) Highly efficient expression of
rabbit neutrophil peptide-1 gene in Chlorella ellipsoidea cells. Current genetics, 39,
365-370.
243
CHI, Z., WANG, F., CHI, Z., YUE, L., LIU, G. & ZHANG, T. (2009) Bioproducts from
Aureobasidium pullulans, a biotechnologically important yeast. Applied
microbiology and biotechnology, 82, 793-804.
CIARAMELLA, M., NAPOLI, A. & ROSSI, M. (2005) Another extreme genome: how to live
at pH 0. Trends in microbiology, 13, 49-51.
CLARRIDGE, J. E. (2004) Impact of 16S rRNA gene sequence analysis for identification of
bacteria on clinical microbiology and infectious diseases. Clinical microbiology
reviews, 17, 840.
CLAVEL, T., CARLIN, F., DARGAIGNARATZ, C., LAIRON, D. & SCHMITT, P. (2007) Effects of
porcine bile on survival of Bacillus cereus vegetative cells and Haemolysin BL
enterotoxin production in reconstituted human small intestine media. Journal of
applied microbiology, 103, 1568-1575.
COOK, G. M. (2000) The intracellular pH of the thermophilic bacterium
Thermoanaerobacter wiegelii during growth and production of fermentation acids.
Extremophiles, 4, 279-284.
COOKE, W. B. (1959) An ecological life history of Aureobasidium pullulans (de Bary)
Arnaud. Mycopathologia, 12, 1-45.
CRUMP, B. C., ARMBRUST, E. & BAROSS, J. A. (1999) Phylogenetic analysis of particle-
attached and free-living bacterial communities in the Columbia River, its estuary,
and the adjacent coastal ocean. Applied and environmental microbiology, 65,
3192.
CUMMINGS, S. P., WILLIAMSON, M. P. & GILMOUR, D. J. (1993) Turgor regulation in a
novel Halomonas species. Archives of microbiology, 160, 319-323.
DA COSTA, M., SANTOS, H. & GALINSKI, E. (1998) An overview of the role and diversity of
compatible solutes in Bacteria and Archaea. Biotechnology of extremophiles, 117-
153.
DASSARMA, S. (2006) Extreme halophiles are models for astrobiology. MIicrobe-american
society for microbiology, 1, 120.
244
DELIEU, T. & WALKER, D. A. (1972) An improved cathode for the measurement of
photosynthetic oxygen evolution by isolated chloroplasts. New phytologist, 201-
225.
DEMIRJIAN, D. C., MORIS-VARAS, F. & CASSIDY, C. S. (2001) Enzymes from
extremophiles. Current opinion in chemical biology, 5, 144-151.
DESHPANDE, M. S., RALE, V. B. & LYNCH, J. M. (1992) Aureobasidium pullulans in applied
microbiology: a status report. Enzyme and microbial technology, 14, 514-527.
DOMSCH, K. H., GAMS, W. & ANDERSON, T. H. (1980) Compendium of soil fungi,
Academic Press, London, United Kingdom.
DONNAN, F. G. (1924) The theory of membrane equilibria. Chemical reviews, 1, 73-90.
DRANCOURT, M., BOLLET, C., CARLIOZ, A., MARTELIN, R., GAYRAL, J. P. & RAOULT, D.
(2000) 16S ribosomal DNA sequence analysis of a large collection of
environmental and clinical unidentifiable bacterial isolates. Journal of clinical
microbiology, 38, 3623.
DRANCOURT, M. & RAOULT, D. (2005) Sequence-based identification of new bacteria: a
proposition for creation of an orphan bacterium repository. Journal of clinical
microbiology, 43, 4311-4315.
DUFRESNE, S., BOUSQUET, J., BOISSINOT, M. & GUAY, R. (1996) Sulfobacillus
disulfidooxidans sp. nov., a new acidophilic, disulfide-oxidizing, gram-positive,
spore-forming bacterium. International journal of systematic bacteriology, 46,
1056-1064.
ECHIGO, A., HINO, M., FUKUSHIMA, T., MIZUKI, T., KAMEKURA, M. & USAMI, R. (2005)
Endospores of halophilic bacteria of the family Bacillaceae isolated from non-
saline Japanese soil may be transported by Kosa event (Asian dust storm). Saline
Systems, 1, 8.
EDWARDS, C. (1990) Thermophiles. Microbiology of extreme environments. Alden Press,
Oxford, 1-32.
245
EHLING-SCHULZ, M., FRICKER, M. & SCHERER, S. (2004) Identification of emetic toxin
producing Bacillus cereus strains by a novel molecular assay. FEMS microbiology
letters, 232, 189-195.
ENGLE, M., LI, Y., WOESE, C. & WIEGEL, J. (1995) Isolation and Characterization of a Novel
Alkalitolerant Thermophile, Anaerobranca horikoshii gen. nov., sp. nov.
International journal of systematic bacteriology, 45, 454-461.
EVANGELOU, V. P. (1995) Pyrite oxidation and its control: solution chemistry, surface
chemistry, acid mine draingae (AMD), molecular oxidation mechanisms, microbial
role, kinetics, control, ameliorates and limitations, microencapsulation, CRC.
FALLET, C., ROHE, P. & FRANCO-LARA, E. (2010) Process optimization of the integrated
synthesis and secretion of ectoine and hydroxyectoine under hyper/hypo-osmotic
stress. Biotechnology and bioengineering, 107, 124-133.
FENOLLAR, F., ROUX, V., STEIN, A., DRANCOURT, M. & RAOULT, D. (2006) Analysis of 525
samples to determine the usefulness of PCR amplification and sequencing of the
16S rRNA gene for diagnosis of bone and joint infections. Journal of clinical
microbiology, 44, 1018.
FINLAY, W. J. J., LOGAN, N. A. & SUTHERLAND, A. D. (2002a) Bacillus cereus emetic toxin
production in relation to dissolved oxygen tension and sporulation. Food
microbiology, 19, 423-430.
FINLAY, W. J. J., LOGAN, N. A. & SUTHERLAND, A. D. (2002b) Bacillus cereus emetic toxin
production in cooked rice. Food microbiology, 19, 431.
FRINGS, E., KUNTE, H. J. & GALINSKI, E. A. (1993) Compatible solutes in representatives
of the genera Brevibacterium and Corynebacterium: occurrence of
tetrahydropyrimidines and glutamine. FEMS microbiology letters, 109, 25-32.
FUTTERER, O., ANGELOV, A., LIESEGANG, H., GOTTSCHALK, G., SCHLEPER, C., SCHEPERS,
B., DOCK, C., ANTRANIKIAN, G. & LIEBL, W. (2004) Genome sequence of
Picrophilus torridus and its implications for life around pH 0. Proceedings of the
national academy of sciences of the united states of america, 101, 9091.
246
GADD, G. M. & EDWARDS, S. W. (1986) Heavy-metal-induced flavin production by
Debaryomyces hansenii and possible connexions with iron metabolism.
Transactions of the British Mycological Society, 87, 533-542.
GEZELIUS, K. & NORKRANS, B. (1970) Ultrastructure ofDebaryomyces hansenii. Archives
of Microbiology, 70, 14-25.
GILMOUR, D. (1990) Halotolerant and halophilic microorganisms. Microbiology of
extreme environments, 147-177.
GIMMLER, H., SCHIRLING, R. & TOBLER, U. (1978) Cation permeability of the
plasmalemma of the halotolerant alga Dunaliella parva. II. Cation content and
glycerol concentration of the cells as dependent upon external NaCI
concentration. Z Pflanzenphysiol87, 435-444.
GOLYSHINA, O. V. & TIMMIS, K. N. (2005) Ferroplasma and relatives, recently discovered
cell wall-lacking archaea making a living in extremely acid, heavy metal-rich
environments. Environmental microbiology, 7, 1277-1288.
GOMES, J. & STEINER, W. (2004) The biocatalytic potential of extremophiles and
extremozymes. Food technology and biotechnology, 42, 223-235.
GONZALEZ-TORIL, E., LLOBET-BROSSA, E., CASAMAYOR, E., AMANN, R. & AMILS, R.
(2003) Microbial ecology of an extreme acidic environment, the Tinto River.
Applied and environmental microbiology, 69, 4853.
GOTO, T., MATSUNO, T., HISHINUMA-NARISAWA, M., YAMAZAKI, K., MATSUYAMA, H.,
INOUE, N. & YUMOTO, I. (2005) Cytochrome c and bioenergetic hypothetical
model for alkaliphilic Bacillus spp. Journal of bioscience and bioengineering, 100,
365-379.
GREENBLATT, C. L., BAUM, J., KLEIN, B. Y., NACHSHON, S., KOLTUNOV, V. & CANO, R. J.
(2004) Micrococcus luteus-survival in amber. Microbial ecology, 48, 120-127.
GUNDE-CIMERMAN, N., RAMOS, J. & PLEMENITAS, A. (2009) Halotolerant and halophilic
fungi. Mycological research, 113, 1231-1241.
247
GUSTAFSSON, L. & NORKRANS, B. (1976) On the mechanism of salt tolerance. Production
of Glycerol and Heat during Growth of Debaryomyces hansenii. Archives of
microbiology, 110, 177-183.
GYURE, R. A., KONOPKA, A., BROOKS, A. & DOEMEL, W. (1987) Algal and bacterial
activities in acidic (pH 3) strip mine lakes. Applied and environmental microbiology,
53, 2069.
HARD, B. C. & GILMOUR, D. J. (1996) The uptake of organic compounds by Dunaliella
parva CCAP 19/9. European journal of phycology, 31, 217-224.
HILL, G. T., MITKOWSKI, N. A., ALDRICH-WOLFE, L., EMELE, L. R., JURKONIE, D. D., FICKE,
A., MALDONADO-RAMIREZ, S., LYNCH, S. T. & NELSON, E. B. (2000) Methods for
assessing the composition and diversity of soil microbial communities. Applied soil
ecology, 15, 25-36.
HOOG, G. S. (1993) Evolution of black yeasts: possible adaptation to the human host.
Antonie van leeuwenhoek, 63, 105-109.
HORIKOSHI, K. & GRANT, W. D. (1991) Superbugs: microorganisms in extreme
environments, Japan Scientific Societies Press.
HOUGH, D. W. & DANSON, M. J. (1999) Extremozymes. Current opinion in chemical
biology, 3, 39-46.
HTTP://WWW.RANKBROTHERS.CO.UK/PROD1EXP.HTM.
HUGENHOLTZ, P. & PACE, N. R. (1996) Identifying microbial diversity in the natural
environment: a molecular phylogenetic approach. Trends in biotechnology, 14,
190-197.
IMHOFF, J. F. & RODRIGUEZ-VALERA, F. (1984) Betaine is the main compatible solute of
halophilic eubacteria. Journal of bacteriology, 160, 478.
INAGAKI, F., SAKIHAMA, Y., INOUE, A., KATO, C. & HORIKOSHI, K. (2002) Molecular
phylogenetic analyses of reverse-transcribed bacterial rRNA obtained from deep-
sea cold seep sediments. Environmental microbiology, 4, 277-286.
IRWIN, J. A. & BAIRD, A. W. (2004) Extremophiles and their application to veterinary
medicine. Irish veterinary journal, 57, 348.
248
JENNINGS, D. (1990) Osmophiles. Microbiology of extreme environments. McGraw-Hill
Publishing Company, New York, 117-146.
JOHNSON, D. B. (1995) The role of 'iron bacteria'in the biodegradation of minerals.
Biodeterior., Abstr. 9, 1-7.
JOHNSON, D. B. (1998) Biodiversity and ecology of acidophilic microorganisms. FEMS
microbiology ecology, 27, 307-317.
JOHNSON, D. B. (2006) Biohydrometallurgy and the environment: intimate and important
interplay. Hydrometallurgy, 83, 153-166.
JOHNSON, D. B. & HALLBERG, K. B. (2003) The microbiology of acidic mine waters.
Research in microbiology, 154, 466-473.
JOHNSON, D. B. & HALLBERG, K. B. (2008) Carbon, Iron and Sulfur Metabolism in
Acidophilic Micro-Organisms. Advances in microbial physiology, 54, 201-255.
JOHNSON, D. B., MACVICAR, J. H. M. & ROLFE, S. (1987) A new solid medium for the
isolation and enumeration of Thiobacillus ferrooxidans and acidophilic
heterotrophic bacteria. Journal of microbiological methods, 7, 9-18.
JOHNSON, D. B. & RANG, L. (1993) Effects of acidophilic protozoa on populations of
metal-mobilizing bacteria during the leaching of pyritic coal. Journal of general
microbiology, 139, 1417.
JOHNSON, D. B., ROLFE, S., HALLBERG, K. B. & IVERSEN, E. (2001) Isolation and
phylogenetic characterization of acidophilic microorganisms indigenous to acidic
drainage waters at an abandoned Norwegian copper mine. Environmental
microbiology, 3, 630-637.
JOVALL, P. A., TUNBLAD-JOHANSSON, I. & ADLER, L. (1990) 13 C NMR analysis of
production and accumulation of osmoregulatory metabolites in the salt-tolerant
yeast Debaryomyces hansenii. Archives of microbiology, 154, 209-214.
KASHKET, E. R. (1985) The proton motive force in bacteria: a critical assessment of
methods. Annual reviews in microbiology, 39, 219-242.
KIMURA, S., HALLBERG, K. B. & JOHNSON, D. B. (2006) Sulfidogenesis in low pH (3.8–4.2)
media by a mixed population of acidophilic bacteria. Biodegradation, 17, 57-65.
249
KIRKPATRICK, M. B., MIDDLETON, R. M. & BASS, J. B. (1993) Comparison of gram stain
results from directly smeared protected specimen brush samples to culture results
a retrospective analysis. American review of respiratory disease, 147, A39.
KLOOS, W. E., TORNABENE, T. G. & SCHLEIFER, K. H. (1974) Isolation and characterization
of micrococci from human skin, including two new species: Micrococcus lylae and
Micrococcus kristinae. International journal of systematic bacteriology, 24, 79-101.
KONINGS, W. N., ALBERS, S. V., KONING, S. & DRIESSEN, A. J. M. (2002) The cell
membrane plays a crucial role in survival of bacteria and archaea in extreme
environments. Antonie van Leeuwenhoek, 81, 61-72.
KONRAD, Z. & BAR-ZVI, D. (2008) Synergism between the chaperone-like activity of the
stress regulated ASR1 protein and the osmolyte glycine-betaine. Planta, 227,
1213-1219.
KREGER-VAN RIJ & W., N. J. (1984) The yeasts: a taxonomic study, 3rd ed.,, Amsterdam,
The Netherlands, Elsevier Science Publisher.
KRISTJANSSON, J. K. & HREGGVIDSSON, G. O. (1995) Ecology and habitats of
extremophiles. World journal of microbiology and biotechnology, 11, 17-25.
KRULWICH, T. A. & GUFFANTI, A. A. (1983) Physiology of acidophilic and alkalophilic
bacteria. Advances in microbial physiology, 24, 173-214.
KRULWICH, T. A., ITO, M., HICKS, D. B., GILMOUR, R. & GUFFANTI, A. A. (1998) pH
homeostasis and ATP synthesis: studies of two processes that necessitate inward
proton translocation in extremely alkaliphilic Bacillus species. Extremophiles, 2,
217-222.
KURTZMAN, C. P. & FELL, J. W. (1998) The yeasts, a taxonomic study, Elsevier Science.
KURTZMAN, C. P. & FELL, J. W. (2000) The yeasts, a taxonomic study, Amsterdam,
Elsevier Science.
KURTZMAN, C. P. & ROBNETT, C. J. (1998) Identification and phylogeny of ascomycetous
yeasts from analysis of nuclear large subunit (26S) ribosomal DNA partial
sequences. Antonie van Leeuwenhoek, 73, 331-371.
250
LANDFALD, B. & STROM, A. R. (1986) Choline-glycine betaine pathway confers a high
level of osmotic tolerance in Escherichia coli. Journal of bacteriology, 165, 849.
LANE, D. J. (1991) 16S/23S rRNA sequencing, p. 115–175. In E. Stackebrandt and M.
Goodfellow (ed.), Nucleic acid techniques in bacterial systematics. J. Wiley & Sons,
Chichester, United Kingdom., 115-175.
LANGDAHL, B. R. & INGVORSEN, K. (1997) Temperature characteristics of bacterial iron
solubilisation and 14C assimilation in naturally exposed sulfide ore material at
Citronen Fjord, North Greenland (83 N). FEMS microbiology ecology, 23, 275-283.
LANYI, J. K. (1974) Salt-dependent properties of proteins from extremely halophilic
bacteria. Microbiology and molecular biology reviews, 38, 272.
LEDUC, L. G. & FERRONI, G. D. (1994) The chemolithotrophic bacterium Thiobacillus
ferrooxidans. FEMS microbiology reviews, 14, 103-119.
LEUNG, W. C., WONG, M. F., CHUA, H., LO, W., YU, P. H. F. & LEUNG, C. K. (2000)
Removal and recovery of heavy metals by bacteria isolated from activated sludge
treating industrial effluents and municipal wastewater. Water science and
technology, 233-240.
LEXA, M., HORAK, J. & BRZOBOHATY, B. (2001) Virtual PCR. Bioinformatics, 17, 192-193.
LIN, S. K. & REYSENBACH, A. L. (2003) Biodiversity of Microbial Life: Foundation of Earth's
Biosphere. Molecules, 8, 223-225.
LIU, J., KRULWICH, T. A. & HICKS, D. B. (2008) Purification of two putative type II NADH
dehydrogenases with different substrate specificities from alkaliphilic Bacillus
pseudofirmus OF4. Biochimica et biophysica acta (BBA)-bioenergetics, 1777, 453-
461.
LOPEZ-ARCHILLA, A. I., MARIN, I. & AMILS, R. (1995) Microbial ecology of an acidic river:
biotechnological applications. Biohydrometallurgical processing, 2, 63-73.
LUKSIENE, Z., BUCHOVEC, I. & PASKEVICIUTE, E. (2009) Inactivation of food pathogen
Bacillus cereus by photosensitization in vitro and on the surface of packaging
material. Journal of applied microbiology, 107, 2037-2046.
251
MA, Y., GALINSKI, E. A., GRANT, W. D., OREN, A. & VENTOSA, A. (2010) Halophiles 2010:
life in saline environments. Applied and environmental microbiology, 76, 6971-
6981.
MA, Y., ZHANG, W., XUE, Y., ZHOU, P., VENTOSA, A. & GRANT, W. D. (2004) Bacterial
diversity of the Inner Mongolian Baer Soda Lake as revealed by 16S rRNA gene
sequence analyses. Extremophiles, 8, 45-51.
MACELROY, R. (1974) Some comments on the evolution of extremophiles. Biosystems, 6,
74-75.
MADIGAN, M. T., MARTINKO, J. M., DUNLAP, P. V. & CLARK, D. P. (2009) Brock biology
of microorganisms, Pearson/Benjamin Cummings.
MADSHUS, I. H. (1988) Regulation of intracellular pH in eukaryotic cells. Biochemical
journal, 250, 1.
MARILLEY, L., VOGT, G., BLANC, M. & ARAGNO, M. (1998) Bacterial diversity in the bulk
soil and rhizosphere fractions of Lolium perenne and Trifolium repens as revealed
by PCR restriction analysis of 16S rDNA. Plant and soil, 198, 219-224.
MARTIN, R. R., JAMES, D. & LEVESQUE, C. A. (2000) Impacts of molecular diagnostic
technologies on plant disease management. Annual review of Phytopathology, 38,
207-239.
MATIN, A. (1990) Keeping a neutral cytoplasm; the bioenergetics of obligate acidophiles.
FEMS Microbiology letters, 75, 307-318.
MENDUM, M. L. & SMITH, L. T. (2002) Characterization of glycine betaine porter I from
Listeria monocytogenes and its roles in salt and chill tolerance. Applied and
environmental microbiology, 68, 813-819.
MESSERLI, M. A., AMARAL-ZETTLER, L. A., ZETTLER, E., JUNG, S. K., SMITH, P. J. S. &
SOGIN, M. L. (2005) Life at acidic pH imposes an increased energetic cost for a
eukaryotic acidophile. Journal of experimental biology, 208, 2569.
MICHELS, M. & BAKKER, E. P. (1985) Generation of a large, protonophore-sensitive
proton motive force and pH difference in the acidophilic bacteria Thermoplasma
acidophilum and Bacillus acidocaldarius. Journal of bacteriology, 161, 231.
252
MIGNARD, S. & FLANDROIS, J. P. (2006) 16S rRNA sequencing in routine bacterial
identification: a 30-month experiment. Journal of microbiological methods, 67,
574-581.
MITCHELL, P. (1973) Performance and conservation of osmotic work by proton-coupled
solute porter systems. Journal of bioenergetics and biomembranes, 4, 63-91.
MORIGUCHI, M., SAKAI, K., TATEYAMA, R., FURUTA, Y. & WAKAYAMA, M. (1994)
Isolation and characterization of salt-tolerant glutaminases from marine
Micrococcus luteus K-3. Journal of fermentation and bioengineering, 77, 621-625.
MORTENSEN, H. D., GORI, K., SIEGUMFELDT, H., NISSEN, P., JESPERSEN, L. & ARNEBORG,
N. (2006) Intracellular pH homeostasis plays a role in the NaCl tolerance of
Debaryomyces hansenii strains. Applied microbiology and biotechnology, 71, 713-
719.
MORTENSEN, H. D., JACOBSEN, T., KOCH, A. G. & ARNEBORG, N. (2008) Intracellular pH
homeostasis plays a role in the tolerance of Debaryomyces hansenii and Candida
zeylanoides to acidified nitrite. Applied and environmental microbiology, 74, 4835-
4840.
NORKRANS, B. (1966) Studies on marine occurring yeasts: growth related to pH, NaCl
concentration and temperature. Archives of microbiology, 54, 374-392.
NORRIS, P. R., INGLEDEW, W. J., HERBERT, R. A. & SHARP, R. J. (1992) Acidophilic
bacteria: adaptations and applications. Molecular biology and biotechnology of
extremophiles., 115-142.
NORRIS, P. R. & JOHNSON, D. B. (1998) Acidophilic microorganisms. Extremophiles:
microbial life in extreme environments., 133-153.
OLSEN, G. J., LANE, D. J., GIOVANNONI, S. J., PACE, N. R. & STAHL, D. A. (1986) Microbial
ecology and evolution: a ribosomal RNA approach. Annual reviews in microbiology,
40, 337-365.
OLSSON, K., KEIS, S., MORGAN, H. W., DIMROTH, P. & COOK, G. M. (2003) Bioenergetic
properties of the thermoalkaliphilic Bacillus sp. strain TA2. A1. Journal of
bacteriology, 185, 461.
253
OREN, A. (2008) Microbial life at high salt concentrations: phylogenetic and metabolic
diversity. Saline systems, 4, 2.
PACE, N. R. (1997) A molecular view of microbial diversity and the biosphere. Science,
276, 734.
PADAN, E., BIBI, E., ITO, M. & KRULWICH, T. A. (2005) Alkaline pH homeostasis in
bacteria: new insights. Biochimica et biophysica acta (BBA)-biomembranes, 1717,
67-88.
PADAN, E., VENTURI, M., GERCHMAN, Y. & DOVER, N. (2001) Na+/H+ antiporters.
Biochimica et biophysica acta (BBA)-bioenergetics, 1505, 144-157.
PATEL, J. B. (2001) 16S rRNA gene sequencing for bacterial pathogen identification in the
clinical laboratory. Molecular diagnosis, 6, 313-321.
PERNTHALER, J. & AMANN, R. (2005) Fate of heterotrophic microbes in pelagic habitats:
focus on populations. Microbiology and molecular biology reviews, 69, 440.
PRISTA, C., ALMAGRO, A., LOUREIRO-DIAS, M. C. & RAMOS, J. (1997) Physiological basis
for the high salt tolerance of Debaryomyces hansenii. Applied and environmental
microbiology, 63, 4005.
PRISTA, C. & MADEIRA-LOPES, A. (1995) Thermokinetic and energetic profiles of the
yeast Debaryomyces hansenii in the presence of sodium chloride. Biotechnology
letters, 17, 1233-1236.
PRONK, J. T. & JOHNSON, D. B. (1992) Oxidation and reduction of iron by acidophilic
bacteria. Geomicrobiology journal, 10, 153-171.
PRONK, J. T., MEIJER, W. M., HAZEU, W., VAN DIJKEN, J. P., BOS, P. & KUENEN, J. G.
(1991) Growth of Thiobacillus ferrooxidans on formic acid. Applied and
environmental microbiology, 57, 2057.
PURDY, K. J., CRESSWELL-MAYNARD, T. D., NEDWELL, D. B., MCGENITY, T. J., GRANT, W.
D., TIMMIS, K. N. & EMBLEY, T. M. (2004) Isolation of haloarchaea that grow at
low salinities. Environmental microbiology, 6, 591-595.
RAINEY, F. A. & OREN, A. (2006) 1 Extremophile Microorganisms and the Methods to
Handle Them. Methods in microbiology, 35, 1-25.
254
RAJAN, L. A., JOSEPH, T. C., THAMPURAN, N. & JAMES, R. (2010) Functional
characterization, secondary structure prediction and analysis of ectoine
biosynthesis genes from Bacillus halodurans: an osmolyte involved in stress
tolerance. World journal of microbiology and biotechnology, 26, 2093-2098.
RATLEDGE, C. & TAN, K. H. (1990) Oils and fats: production, degradation and utilization
by yeasts, Marcel Dekker, New York.
RAVEN, J. A. & SMITH, F. A. (1973) The regulation of intracellular pH as a fundamental
biological process. Academic Press, Inc., London., 271-8.
RAWLINGS, D. E. & JOHNSON, D. B. (2002) Ecology and biodiversity of extremely
acidophilic microorganisms. Collection Title: Extremophiles (Gerday, C., ed.) in
Encyclopedia of Life Support Systems (EOLSS), developed under the auspices of the
United Nations Educational, Scientific and Cultural Organisation.
RENGPIPAT, S., LOWE, S. E. & ZEIKUS, J. G. (1988) Effect of extreme salt concentrations
on the physiology and biochemistry of Halobacteroides acetoethylicus. Journal of
bacteriology, 170, 3065.
REYES, J. E., BASTIAS, J. M., GUTIERREZ, M. R. & RODRIGUEZ, M. O. (2007) Prevalence of
Bacillus cereus in dried milk products used by Chilean School Feeding Program.
Food microbiology, 24, 1-6.
ROBERTSON, D. E., ROBERTS, M. F., BELAY, N., STETTER, K. O. & BOONE, D. R. (1990)
Occurrence of beta-glutamate, a novel osmolyte, in marine methanogenic
bacteria. Applied and environmental microbiology, 56, 1504-1508.
ROHWERDER, T., GEHRKE, T., KINZLER, K. & SAND, W. (2003) Bioleaching review (part A):
Progress in bioleaching: fundamentals and mechanisms of bacterial metal sulfide
oxidation [J]. Applied microbiology and biotechnology, 63, 239-248.
ROSYPAL, S., ROSYPALOVA, A. & HOREJS , J. (1966) The classification of micrococci and
staphylococci based on their DNA base composition and adansonian analysis.
Journal of general microbiology, 44, 281.
ROTTENBERG, H. (1979) [64] The measurement of membrane potential and [Delta] pH in
cells, organelles, and vesicles. Methods in enzymology, 55, 547-569.
255
ROTTENBERG, H. (1989) [5] Proton electrochemical potential gradient in vesicles,
organelles, and prokaryotic cells. Methods in enzymology, 172, 63-84.
RUSSELL, N. J. (2000) Toward a molecular understanding of cold activity of enzymes from
psychrophiles. Extremophiles, 4, 83-90.
SAHA, B. C. & BOTHAST, R. J. (1996) Glucose tolerant and thermophilic β-glucosidases
from yeasts. Biotechnology letters, 18, 155-158.
SALDANHA-DA-GAMA, A., MALFEITO-FERREIRA, M. & LOUREIRO, V. (1997)
Characterization of yeasts associated with Portuguese pork-based products.
International journal of food microbiology, 37, 201-207.
SALHANY, J. M., YAMANE, T., SHULMAN, R. G. & OGAWA, S. (1975) High resolution 31P
nuclear magnetic resonance studies of intact yeast cells. Proceedings of the
national academy of sciences, 72, 4966.
SAND, W., GERKE, T., HALLMANN, R. & SCHIPPERS, A. (1995) Sulfur chemistry, biofilm,
and the (in) direct attack mechanism-a critical evaluation of bacterial leaching.
Applied microbiology and biotechnology, 43, 961-966.
SATYANARAYANA, T., RAGHUKUMAR, C. & SHIVAJI, S. (2005) Extremophilic microbes:
Diversity and perspectives. Current science, 89, 78-90.
SCHLEPER, C., HOLBEN, W. & KLENK, H. P. (1997) Recovery of crenarchaeotal ribosomal
DNA sequences from freshwater-lake sediments. Applied and environmental
microbiology, 63, 321.
SCHLEPER, C., PUEHLER, G., KUHLMORGEN, B. & ZILLIG, W. (1995) Life at extremely low
pH. Nature, 375, 741.
SCHUBERT, T., MASKOW, T., BENNDORF, D., HARMS, H. & BREUER, U. (2007) Continuous
synthesis and excretion of the compatible solute ectoine by a transgenic,
nonhalophilic bacterium. Applied and environmental microbiology, 73, 3343.
SCOW, K. M., SCHWARTZ, E., JOHNSON, M. J. & MACALADY, J. L. (2001) Microbial
biodiversity, measurement of. Levin, SA, Editor, 177-190.
SEILER, H. & BUSSE, M. (1990) The yeasts of cheese brines. International journal of food
microbiology, 11, 289-303.
256
SENSES-ERGUL, S., AGOSTON, R., BELAK, A. & DEAK, T. (2006) Characterization of some
yeasts isolated from foods by traditional and molecular tests. International journal
of food microbiology, 108, 120-124.
SEVERIN, J., WOHLFARTH, A. & GALINSKI, E. A. (1992) The predominant role of recently
discovered tetrahydropyrimidines for the osmoadaptation of halophilic
eubacteria. Journal of general microbiology, 138, 1629.
SIMS, G. K., SOMMERS, L. E. & KONOPKA, A. (1986) Degradation of pyridine by
Micrococcus luteus isolated from soil. Applied and environmental microbiology,
51, 963.
STALEY, J. T. (2002) A microbiological perspective of biodiversity. Biodiversity of microbial
life. Wiley-Liss, New York, USA, 3–23.
STALEY, J. T. & GOSINK, J. J. (1999) Poles apart: biodiversity and biogeography of sea ice
bacteria. Annual reviews in microbiology, 53, 189-215.
SYDOW, U., WOHLAND, P., WOLKE, I. & CYPIONKA, H. (2002) Bioenergetics of the
alkaliphilic sulfate-reducing bacterium Desulfonatronovibrio hydrogenovorans.
Microbiology, 148, 853.
THOME-ORITZ, P. E., PENA, A. & RAMIREZ, J. (1998) Monovalent cation fluxes and
physiological changes of Debaryomyces hansenii grown at high concentrations of
KCl and NaCl. Yeast, 14, 1355-1371.
TOKUOKA, K. (1993) Sugar-and salt-tolerant yeasts. Journal of applied microbiology, 74,
101-110.
TORSVIK, V., ØVREÅS, L. & THINGSTAD, T. F. (2002) Prokaryotic diversity--magnitude,
dynamics, and controlling factors. Science, 296, 1064.
TYSON, G. W., CHAPMAN, J., HUGENHOLTZ, P., ALLEN, E. E., RAM, R. J., RICHARDSON, P.
M., SOLOVYEV, V. V., RUBIN, E. M., ROKHSAR, D. S. & BANFIELD, J. F. (2004)
Community structure and metabolism through reconstruction of microbial
genomes from the environment. Nature, 428, 37-43.
URZI, C., DE LEO, F., LO PASSO, C. & CRISEO, G. (1999) Intra-specific diversity of
Aureobasidium pullulans strains isolated from rocks and other habitats assessed
257
by physiological methods and by random amplified polymorphic DNA (RAPD).
Journal of microbiological methods, 36, 95-105.
VAN DE PEER, Y., CHAPELLE, S. & DE WACHTER, R. (1996) A quantitative map of
nucleotide substitution rates in bacterial rRNA. Nucleic acids research, 24, 3381-
3391.
VAN DE VOSSENBERG, J. L. C. M., DRIESSEN, A. J. M., ZILLIG, W. & KONINGS, W. N.
(1998) Bioenergetics and cytoplasmic membrane stability of the extremely
acidophilic, thermophilic archaeon Picrophilus oshimae. Extremophiles, 2, 67-74.
VAN DEN BURG, B. (2003) Extremophiles as a source for novel enzymes. Current opinion
in microbiology, 6, 213-218.
VE HABITATLAR, A. M. (2002) Alkaliphilic micro-organisms and habitats. Turkey journal of
biology, 26, 181-191.
VENTOSA, A., MáRQUEZ, M. C., GARABITO, M. J. & ARAHAL, D. R. (1998) Moderately
halophilic gram-positive bacterial diversity in hypersaline environments.
Extremophiles, 2, 297-304.
VIERSTRAETE, A. (1999) Principle of the PCR. University of Ghent, Belgium. .
WADDELL, W. J. & BUTLER, T. C. (1959) Calculation of intracellular pH from the
distribution of 5, 5-dimethyl-2, 4-oxazolidinedione (DMO). Application to skeletal
muscle of the dog. Journal of clinical investigation, 38, 720.
WEISBURG, W. G., BARNS, S. M., PELLETIER, D. A. & LANE, D. J. (1991) 16S ribosomal
DNA amplification for phylogenetic study. Journal of bacteriology, 173, 697.
WHITMAN, W. B., COLEMAN, D. C. & WIEBE, W. J. (1998) Prokaryotes: the unseen
majority. Proceedings of the National Academy of Sciences of the United States of
America, 95, 6578.
WOESE, C. R. (1987) Bacterial evolution. Microbiology and molecular biology reviews, 51,
221.
WOESE, C. R., KANDLER, O. & WHEELIS, M. L. (1990) Towards a natural system of
organisms: proposal for the domains Archaea, Bacteria, and Eucarya. Proceedings
of the national academy of sciences, 87, 4576.
258
WOO, P. C. Y., LEUNG, P. K. L., LEUNG, K. W. & YUEN, K. Y. (2000) Identification by 16S
ribosomal RNA gene sequencing of an Enterobacteriaceae species from a bone
marrow transplant recipient. Molecular pathology, 53, 211-215.
WWW.LSBU.AC.UK/BIOLOGY/ENZYME/OXELECTRODE.HTML, H.
YANCEY, P. H. (2005) Organic osmolytes as compatible, metabolic and counteracting
cytoprotectants in high osmolarity and other stresses. Journal of experimental
biology, 208, 2819.
YEUNG, S. N., BUTLER, A. & MACKENZIE, P. J. (2009) Applications of the polymerase
chain reaction in clinical ophthalmology. Canadian journal of ophthalmology, 44,
23-30.
YOON, J. H., KANG, K. H., OH, T. K. & PARK, Y. H. (2004) Halobacillus locisalis sp. nov., a
halophilic bacterium isolated from a marine solar saltern of the Yellow Sea in
Korea. Extremophiles, 8, 23-28.
YUMOTO, I. (2002) Bioenergetics of alkaliphilic Bacillus spp. Journal of bioscience and
bioengineering, 93, 342-353.
YURLOVA, N. A. & DE HOOG, G. S. (1997) A new variety of Aureobasidium pullulans
characterized by exopolysaccharide structure, nutritional physiology and
molecular features. Antonie van leeuwenhoek, 72, 141-147.
ZYCHLINSKY, E. & MATIN, A. (1983) Cytoplasmic pH homeostasis in an acidophilic
bacterium, Thiobacillus acidophilus. Journal of bacteriology, 156, 1352.

259
AAPPPPEENNDDIICCEESS
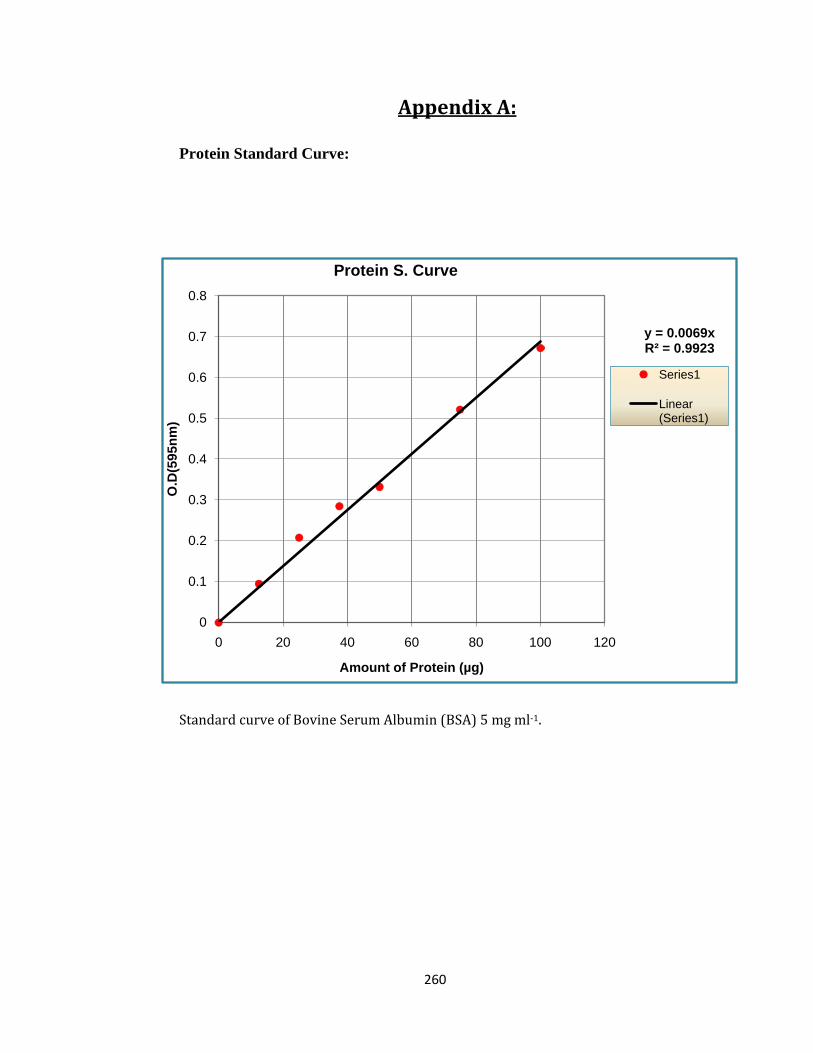
260
Appendix A:
Protein Standard Curve:
Standard curve of Bovine Serum Albumin (BSA) 5 mg ml-1.
y = 0.0069xR² = 0.9923
0
0.1
0.2
0.3
0.4
0.5
0.6
0.7
0.8
0 20 40 60 80 100 120
O.D
(595
nm)
Amount of Protein (µg)
Protein S. Curve
Series1
Linear (Series1)
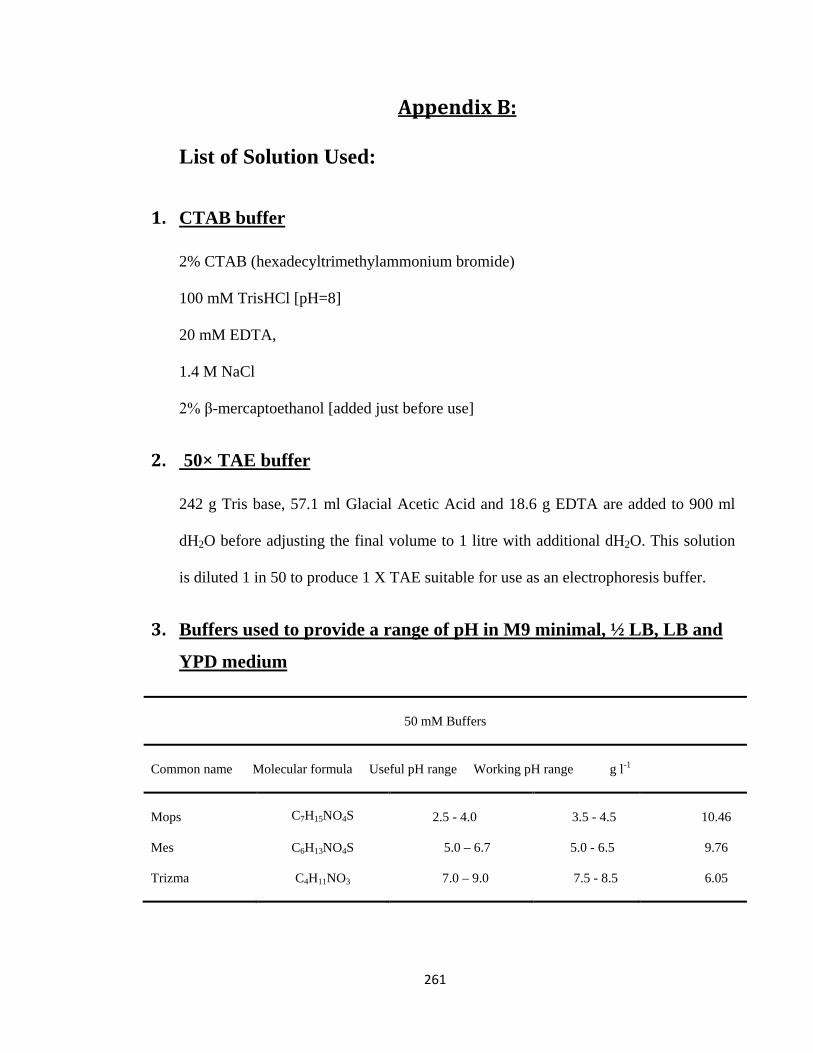
261
Appendix B:
List of Solution Used:
1. CTAB buffer
2% CTAB (hexadecyltrimethylammonium bromide)
100 mM TrisHCl [pH=8]
20 mM EDTA,
1.4 M NaCl
2% β-mercaptoethanol [added just before use]
2. 50× TAE buffer
242 g Tris base, 57.1 ml Glacial Acetic Acid and 18.6 g EDTA are added to 900 ml
dH2O before adjusting the final volume to 1 litre with additional dH2O. This solution
is diluted 1 in 50 to produce 1 X TAE suitable for use as an electrophoresis buffer.
3. Buffers used to provide a range of pH in M9 minimal, ½ LB, LB and
YPD medium
50 mM Buffers
Common name Molecular formula Useful pH range Working pH range g l-1
Mops
C7H15NO4S
2.5 - 4.0
3.5 - 4.5
10.46
Mes C6H13NO4S 5.0 – 6.7 5.0 - 6.5 9.76
Trizma C4H11NO3 7.0 – 9.0 7.5 - 8.5 6.05

262
4. SOC medium
The following reagents are added to 900 ml dH2O:
20 g Bacto Tryptone, 5 g Bacto Yeast Extract, 2 ml of 5 M NaCl, 2.5 ml of 1 M KCl,
10 ml of 1 M MgCl2, 10 ml of 1 M MgSO4 and 20 ml of 1 M glucose before adjusting
the final volume to 1 litre prior to autoclaving at 121 oC and 15 psi for 15 minutes.
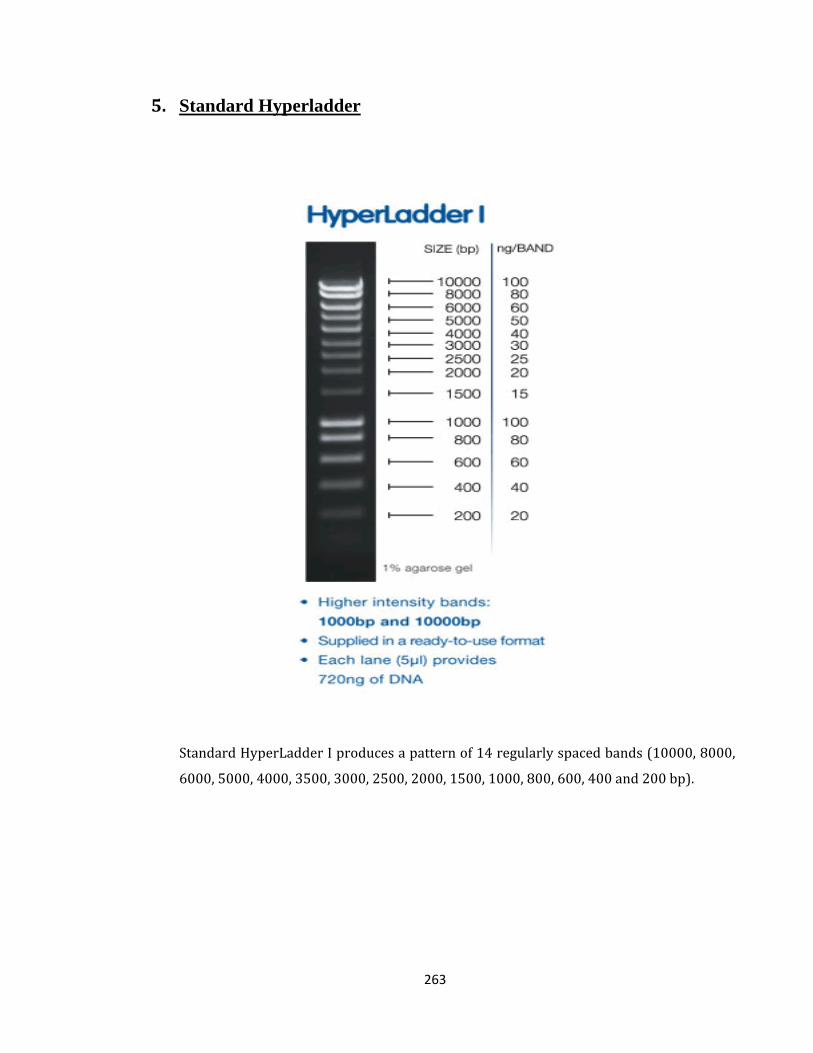
263
5. Standard Hyperladder
Standard HyperLadder I produces a pattern of 14 regularly spaced bands (10000, 8000,
6000, 5000, 4000, 3500, 3000, 2500, 2000, 1500, 1000, 800, 600, 400 and 200 bp).
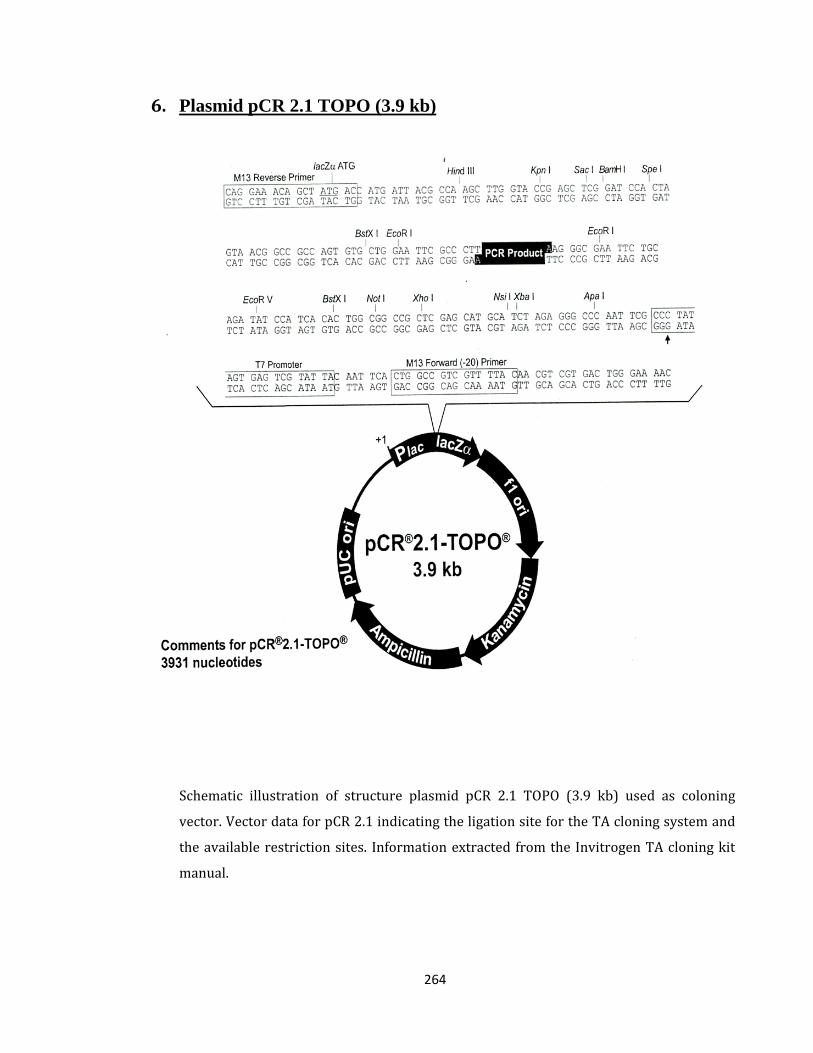
264
6. Plasmid pCR 2.1 TOPO (3.9 kb)
Schematic illustration of structure plasmid pCR 2.1 TOPO (3.9 kb) used as coloning
vector. Vector data for pCR 2.1 indicating the ligation site for the TA cloning system and
the available restriction sites. Information extracted from the Invitrogen TA cloning kit
manual.
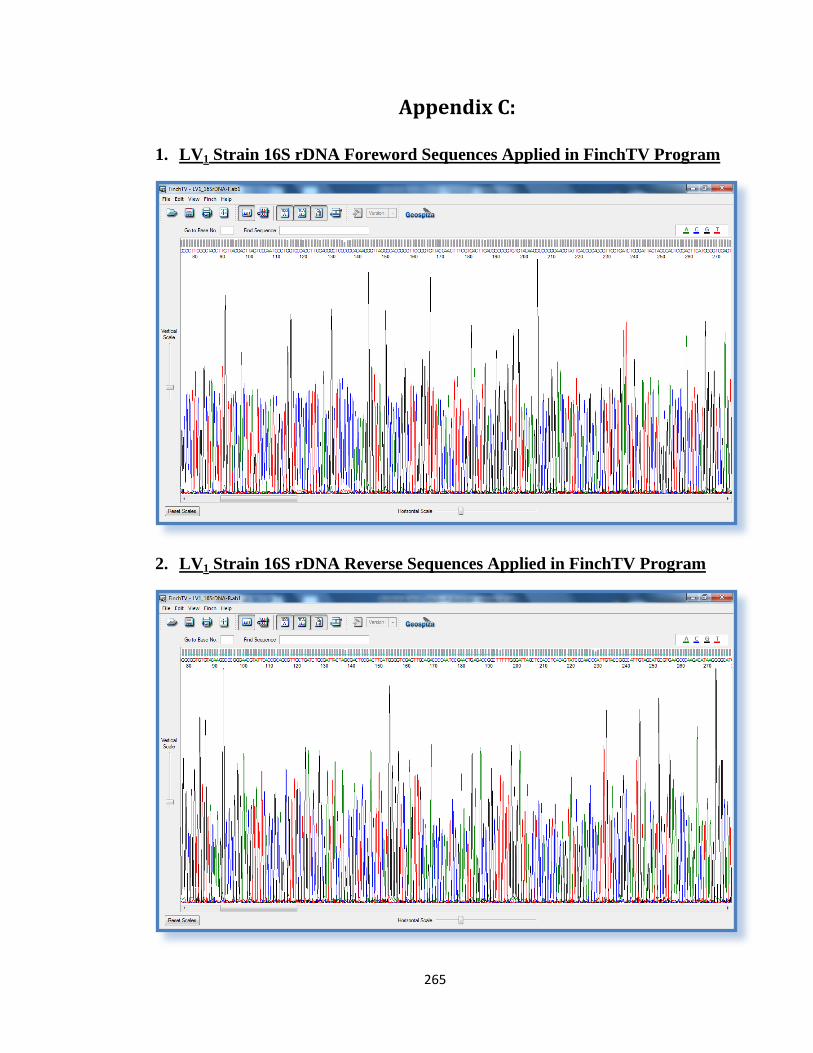
265
Appendix C:
1. LV1 Strain 16S rDNA Foreword Sequences Applied in FinchTV Program
2. LV1 Strain 16S rDNA Reverse Sequences Applied in FinchTV Program
266
3. RV3 Strain 16S rDNA Foreword Sequences Applied in FinchTV Program
4. RV3 Strain 16S rDNA Foreword Sequences Applied in FinchTV Program
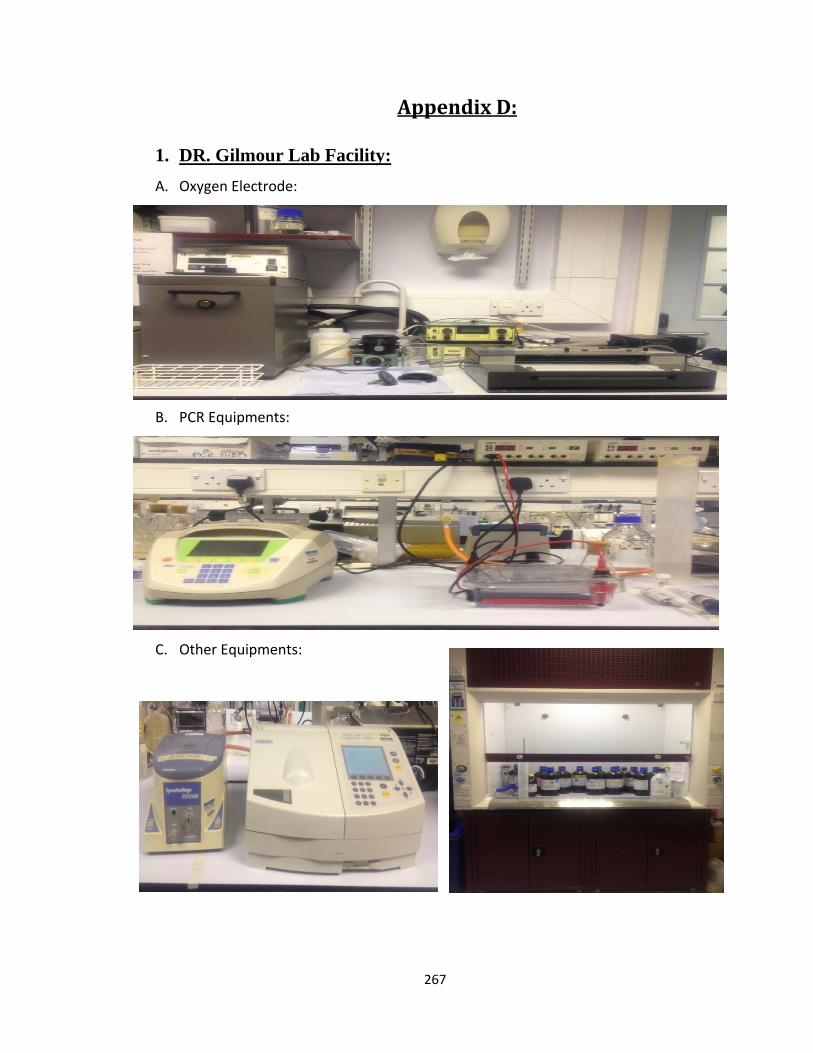
267
Appendix D:
1. DR. Gilmour Lab Facility: A. Oxygen Electrode:
B. PCR Equipments:
C. Other Equipments:
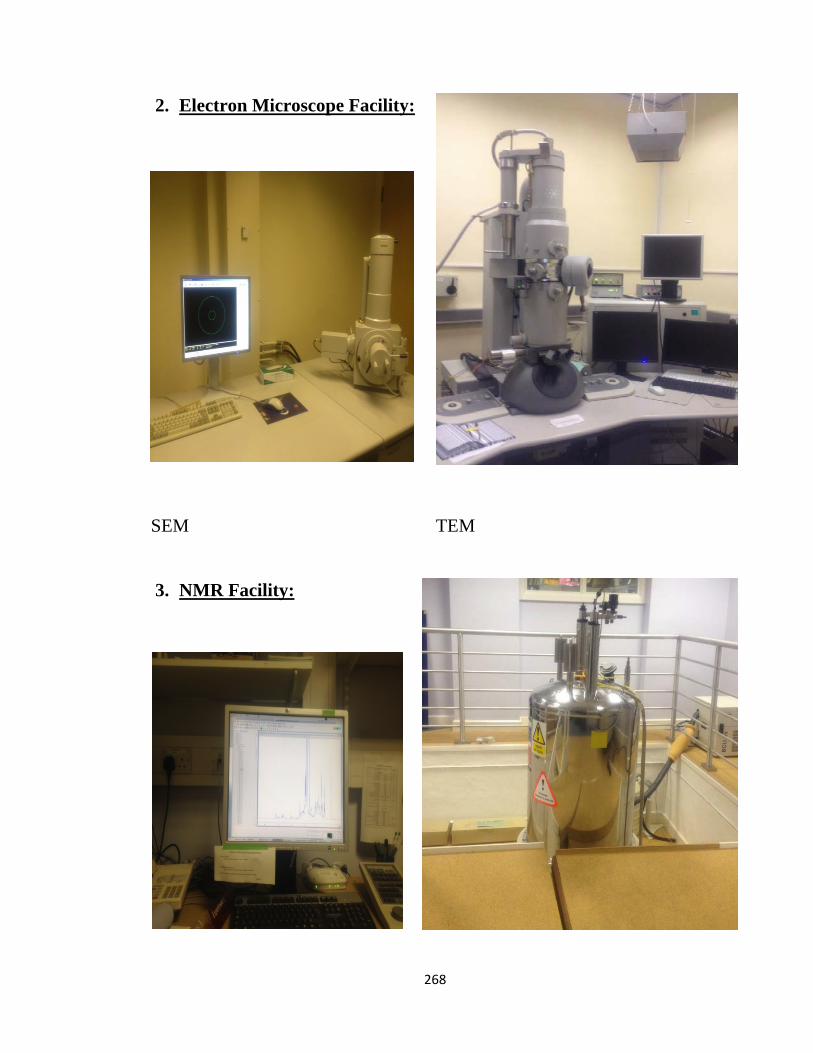
268
2. Electron Microscope Facility:
SEM TEM
3. NMR Facility:


![Berkshire Functional Economic Market Area Study [9Mb]](https://img.pdfslide.net/doc/110x75/589edc811a28abb84a8c01d9/berkshire-functional-economic-market-area-study-9mb.jpg)