Embed Size (px)
Citation preview
MONTENEGRIN JOURNAL OF ECONOMICS
Volume 9 Number 4
December 2013
UDC 33 (51) Print edition ISSN 1800-5845 Web edition ISSN 1800-6698
COBISS.CG-ID 9275920
Publishers
ELIT - Economic Laboratory for Transition Research Dz. Vashington 4/5, Podgorica, Montenegro
Fakulty of Economics, Podgorica, Montenegro
Indexing
Papers published in journal Montenegrin Journal of Economics since September 2006 are abstracted in the Journal of Economics Literature, Pittsburgh, the AEA (American Economic Association) electronic index, involved in JEL CD, e-JEL, http://www.EconLit.org and WWW.AEAweb.org http://www.aeaweb.org/econlit/journal_list.php?full=true#M
Since April 2011 Papers are abstracted in the EBSCO Publishing, Inc. http://www.ebscohost.com
Since December 2011 Montenegrin Journal of Economics has been included in Index Copernicus International S.A. database http://journals.indexcopernicus.com/karta.php?action=masterlist&id=7325
Since February 2012 Montenegrin Journal of Economics has been included in databases: Ulrich's Periodicals Directory http://ulrichsweb.serialssolutions.com/ RePEc http://repec.org/ World-Wide Web Virtual Library http://www.e-journals.org/ Genamics JournalSeek http://journalseek.net Since April 2012 Journal has been included in databases: Cabell's http://www.cabells.com ECONIS Datenbank http://www.econis.eu NewJour http://old.library.georgetown.edu/newjour//nj2/msg29741.html Since September 2012 Journal has been included in databases: DOAJ Directory of Open Access Journals http://www.doaj.org ProQuest ( ABI/Inform, Research Library, Social Sciences ) http://www.proquest.co.uk Scirus http://www.scirus.com/srsapp/search?q=%22montenegrin+journal+of+economics%22+&t=all&sort=0&g=s
2
Editor in Chief Professor Veselin Draskovic University of Montenegro, Faculty of Maritime Studies Kotor, Montenegro Associate Editors Professor Yochanan Shachmurove The City College of the City University of New York, Department of Economics and Business, USA
Professor Lloyd Blenman University of North Carolina-Charlotte, President at Midwest Finance Education Foundation, USA
Professor Radislav Jovovic University Mediterranean, Faculty of Business Studies, Montenegro
Associate Editor and Journal Administrator Associate Professor Oleksandr Dorokhov Kharkiv National University of Economics, Faculty of Economic Informatics, Ukraine Advisory Board Professor Markowitz Harry M.
Nobel Laureate Rady School of Management at the University of California, USA
Professor Shachmurove Yochanan City University of New York, Department of Economics, USA
Professor Polterovich Victor Central Economics and Mathematics Institute, Russian Academy of Science and Moscow School of Economics / Lomonosov's Moskow State University, Russia
International Editorial Board Professor Serguei Aivazian Central Economics and Mathematics Institute of the Russian Academy of Sciences /
Lomonosov's Moscow State University, Russia
Associate Professor István Benczes Corvinus University of Budapest, Faculty of Economics, Hungary
Professor Bolesław Borkowski SGGW Warsaw, Faculty of Applied Informatics and Mathematics, Department of Econometrics and Statistics, Poland
Professor Laszlo Csaba Central European University, Department of International Relations and European Studies, Budapest / Budapest University of Economic Sciences and Public Administration, Hungary
Professor Antony Dnes Business School University of Hull, UK
Professor Michael Doubrovsky Odessa National Maritime University, Ukraine
Assistant Professor Eric Doviak Brooklyn College, City University of New York, USA
Professor Fan Gang Graduate School of Chinese Academy of Social Sciences (CASS) /Director of China's National Economic Research Institute (NERI), China
Professor Yuriy Gavrilec Central Economics and Mathematics Institute of the Russian Academy of Sciences, Russia
Professor Wei Ge Bucknell University, Department of Economics, Lewisburg, USA
Professor Svetlana Glinkina Institute of Economy Russian Academy of Sciences, Russia
Professor Balazs Hamori Corvinus University of Budapest, Hungary
Professor Yu Hsing Southeastern Louisiana University, College of Business, Hammond, LA, USA
Professor Wen-jen Hsieh University Road, Tainan / Director General of the Art Center National Cheng Kung University, Taiwan
Professor Svetlana Kirdina Institute of Economics Russian Academy of Sciences, Russia
Professor George Kleiner Central Economics and Mathematics Institute of the Russian Academy of Sciences, Russia
Professor Grzegorz Kolodko Kozminski University in Warsaw (ALK) / Director of Transformation, Integration and Globalization Economic Research (TIGER), Poland
Professor Valeriy Makarov Central Economics and Mathematics Institute of the Russian Academy of Sciences/ Lomonosov's Moscow State University / New Economic School, Rusaia
Professor Vladimir Matveenko National Research University Higher School of Economics, St. Petersburg, Russia Professor Alojzy Nowak University of Warsaw, Faculty of Management, Poland
Professor Yuriy Osipov Lomonosov's Moscow State University, Faculty of Economics, Russia
Professor Nikolai Petrakov Russian Academy of Sciences, Director of the RAS Market Economy Institute, Russia
Professor Jiancai Pi School of Business, Nanjing University, China
Professor Evgeniy Popov Institute of Economics, Urals Branch of Russian Academy of Sciences, Ekaterinburg, Russia
Professor Xavier Richet Université Sorbonne nouvelle, France
Professor Valdas Samonis Royal Roads University, Canada
Professor Marcello Signorelli University of Perugia, Department of Economics, Finance and Statistics, Faculty of Political Sciences, Italy
Professor Uriel Spiegel Bar-Ilan University, Faculty of Social Sciences, Ramat-Gan, Israel
Dr Edward Sweeney National Institute for Transports & Logistics, Ireland
Associate Professor Bob Travica University of Manitoba, Asper School of Business, Canada
MONTENEGRIN JOURNAL OF ECONOMICS, Vol. 9, No. 4 (December 2013)
MONTENEGRIN JOURNAL OF ECONOMICS, Vol. 9, No. 4 (December 2013)
3
Professor Theodore Tsekeris Centre of Planning and Economic Research (KEPE), Athens, Greece
Professor Merih Uctum The Graduate Center City University of New York, USA
Professor Milica Uvalic Faculty of Political Sciences, University of Perugia, Italy
Professor Giurca Laura Vasilescu University of Craiova, Faculty of Economy and Business Administration, Romania
Professor João Paulo Vieito Polytechnic Institute of Viana do Castelo, Portugal
Assistant Professor Milos Vulanovic Western New England University Springfield, USA
Professor Anatolii Zadoia Alfred Nobel University of Economics and Law, Dnipropetrovs’k, Ukraine
Professor Bagrat Yerznkyan Central Economics and Mathematics Institute, Russian Academy of Science / State University of Management Moscow, Russia
Regional Editorial Board
Professor Slobodan Acimovic University of Belgrade, Faculty of Economics, Serbia
Professor Marko Backovic University of Belgrade, Faculty of Economics, Serbia
Assistant Professor Mimo Draskovic University of Montenegro, Faculty of Maritime Studies Kotor, Montenegro
Professor Veselin Draskovic University of Montenegro, Faculty of Maritime Studies Kotor, Montenegro
Professor Gordan Druzic Croatian Academy of Sciences and Arts, Croatia
Associate Professor Nikola Fabris University of Belgrade, Faculty of Economics, Serbia
Professor Miomir Jaksic University of Belgrade, Faculty of Economics, Serbia
Assistant Professor Borut Jereb University of Maribor, Faculty of Logistics Celje, Slovenia
Associate Professor Milorad Jovovic University of Montenegro, Faculty of Economics, Montenegro
Associate Professor Radislav Jovovic University Mediterranean, Faculty of Business Studies, Montenegro
Professor Ibrahim Jusufranić International University Travnik, Bosnia and Herzegovina
Professor Vesna Karadzic University of Montenegro, Faculty of Economics, Podgorica, Montenegro
Professor Dejan Kruzic University of Split, Faculty of Economics, Split, Croatia
Associate Professor Slobodan Lakic University of Montenegro, Faculty of Economics, Montenegro
Associate Professor Milan Lakicevic University of Montenegro, Faculty of Economics, Montenegro
Professor Vujica Lazović University of Montenegro, Faculty of Economics, Montenegro
Professor Andjelko Lojpur University of Montenegro, Faculty of Economics, Montenegro
Professor Tihomir Lukovic University of Dubrovnik, Croatia
Professor Emeritus Ljubomir Madzar Institute of strategic studies and development „Petar Karić“ of the Alfa University in Novi Beograd, Serbia
Professor Joze Mencinger University of Ljubljana, Law School, Slovenia
Professor Bozo Mihailovic University of Montenegro, Faculty of Economics, Montenegro
Professor Dragan Mikerevic University of Banja Luka, Faculty of Economics, Bosnia and Herzegovina
Associate Professor Mislav Ante Omazic University of Zagreb, Faculty of Economics, Croatia
Professor Mirjana Pejic Bach University of Zagreb, Faculty of Economics, Zagreb, Croatia
Assistant Professor Sanja Pekovic University of Montenegro, Faculty of Tourism and Hotel Management, Montenegro
Professor Milenko Popovic University Mediterranean, Faculty of Business Studies, Montenegro
Professor Janez Prasnikar University of Ljubljana, Faculty of Economics, Slovenia
Associate Professor Milivoje Radovic University of Montenegro, Faculty of Economics, Montenegro
Professor Ivan Ribnikar University of Ljubljana, Faculty of Economics, Slovenia
Professor Guste Santini University of Zagreb, Croatia
Assistant Professor Ivo Speranda University of Dubrovnik – Department of Economics and Business Economics, Croatia
Professor Dragoljub Stojanov University of Rijeka, Faculty of Economics, Croatia
Professor Azis Sunje University of Sarajevo, School of Economics and Business, Bosnia and Herzegovina
Professor Darko Tipuric University of Zagreb, Faculty of Economics, Zagreb, Croatia
Professor Zdravko Todorovic University of Banja Luka, Faculty of Economics, Bosnia and Herzegovina
Associate Professor Aleksa Vucetic University of Montenegro, Faculty of Tourism and Hotel Management, Montenegro Secretary of Editorial Boards Associate professor Mimo Draskovic University of Montenegro, Faculty of Maritime Studies Kotor, Montenegro
Mr.S. Anja Lojpur Central Bank of Montenegro, Podgorica, Montenegro Technical editor Milojko Pusica, B. Sc. ing. electrotecnics „Tangenta“ Niksic, Montenegro
MONTENEGRIN JOURNAL OF ECONOMICS, Vol. 9, No. 4 (December 2013)
4
The journal is published two times a year
Price for single copy: 30 € Printing: 500 copy
Journal customer service:
Tel: + 382 69 636 669; + 382 68 583 622; E-mail: [email protected]
Web address: http://www.mnje.com
Account: 510-21341-37 (Crnogorska komercijalna banka, Podgorica, Montenegro)
Printed by : „3M Makarije“ - Podgorica
Rješenjem Ministarstva kulture i medija br. 05-962/2 od 23. maja 2005. godine Montenegrin Journal of Economics je upisan u evidenciju medija pod rednim brojem 560.
CIP – Каталогизација у публикацији Централна народна библиотека Црне Горе 33 (051)
MONTENEGRIN Journal of Economics / glavni i odgovorni urednik, Editor in Chief -Veselin Drašković. – God. 1. br. 1 (2005) . – Nikšić (Novaka Ramova 12) : “ELIT – ekonomska laboratorija za istraživanje tranzicije”, 2005 (Podgorica: 3M Makarije) . – 30 cm
Dva puta godišnje. ISSN 1800-5845 = Montenegrin Journal of Economics COBISS.CG-ID 9275920
9 7 7 1 8 0 0 5 8 4 0 0 7
ISSN 1800-5845
MONTENEGRIN JOURNAL OF ECONOMICS, Vol. 9, No. 4 (December 2013)
5
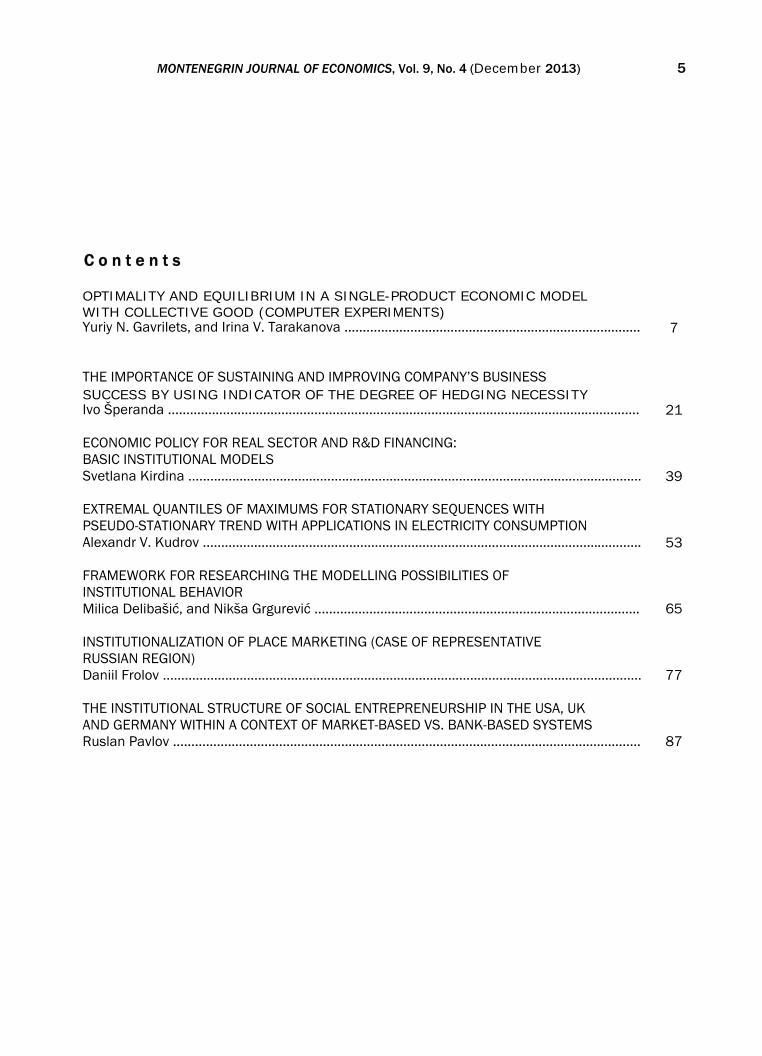
C o n t e n t s OPTIMALITY AND EQUILIBRIUM IN A SINGLE-PRODUCT ECONOMIC MODEL WITH COLLECTIVE GOOD (COMPUTER EXPERIMENTS) Yuriy N. Gavrilets, and Irina V. Tarakanova .................................................................................
7
THE IMPORTANCE OF SUSTAINING AND IMPROVING COMPANY’S BUSINESS SUCCESS BY USING INDICATOR OF THE DEGREE OF HEDGING NECESSITY Ivo Šperanda ................................................................................................................................. ECONOMIC POLICY FOR REAL SECTOR AND R&D FINANCING: BASIC INSTITUTIONAL MODELS Svetlana Kirdina ............................................................................................................................ EXTREMAL QUANTILES OF MAXIMUMS FOR STATIONARY SEQUENCES WITH PSEUDO-STATIONARY TREND WITH APPLICATIONS IN ELECTRICITY CONSUMPTION Alexandr V. Kudrov ........................................................................................................................
21
39
53
FRAMEWORK FOR RESEARCHING THE MODELLING POSSIBILITIES OF INSTITUTIONAL BEHAVIOR Milica Delibašić, and Nikša Grgurević .........................................................................................
65 INSTITUTIONALIZATION OF PLACE MARKETING (CASE OF REPRESENTATIVE RUSSIAN REGION) Daniil Frolov ...................................................................................................................................
77 THE INSTITUTIONAL STRUCTURE OF SOCIAL ENTREPRENEURSHIP IN THE USA, UK AND GERMANY WITHIN A CONTEXT OF MARKET-BASED VS. BANK-BASED SYSTEMS Ruslan Pavlov ................................................................................................................................
87
MONTENEGRIN JOURNAL OF ECONOMICS, Vol. 9, No. 4 (December 2013)

OPTIMALITY AND EQUILIBRIUM IN A SINGLE-PRODUCT ECONOMIC MODEL WITH COLLECTIVE GOOD (COMPUTER EXPERIMENTS) 7
OPTIMALITY AND EQUILIBRIUM IN A SINGLE-PRODUCT ECONOMIC MODEL
WITH COLLECTIVE GOOD (COMPUTER EXPERIMENTS)
YURIY N. GAVRILETS1, and IRINA V. TARAKANOVA2
ABSTRACT
This paper considers some of the simplest models of the economy with the collective good. Used computer simulations illustrate the relationship between equilibrium and the optimum. We propose a heuristic met-hod for finding the economic equilibrium with the collective goods, which is a variant of the tâtonnement process.
KEY WORDS: computer simulations, collective good, equilibrium, optimum, tâtonnement process.
JEL classification: C61, C62, C63, C72 Received: May 12, 2013 / Accepted: October 15, 2013
1. INTRODUCTION
Models of using collective goods initially emerged to describe simple situations where the same goods are consumed simultaneously by different individuals who have different preferences (joint purchase of the TV, smoking in a public place, gatecrasher in public transport, etc.) [2;7]. Gener-alization of these models to the case of models of economic equilibrium, and others has borne to the present time numerous publications. The situations with several kinds of collective goods have been considered, these goods can include the production function, can be measured by dis-crete values, can consider the role of the state, etc. etc. [8;3]. Much attention is paid to the analy-sis of game-theoretic features of models, Pareto optimal equilibrium and the process of equilib-rium tâtonnement. [3]. In the context of experimental economics studies the behavior of people living in situations similar to the process of formation on private manner social benefits. [1]
Our work does not deal with complex mathematical structures and abstract schemes. It built and analyzed a simple mathematical economics equilibrium model, in which along with the pri-vate consumption of the product produced in the system, is created and consumed the public (collective) product. Important lever of regulation of economic relations is the tax policy of the state, and this effect on the equilibrium should be considered in the economic and mathematical models [4]. The paper discusses several ways of forming the rules of formation of taxes (see also [5]). The main goal - to show with some simple computer models, how an economic system can behave, seeking for equilibrium, and how it deviates from the Pareto-optimal state.
Process of simulation will represent the interaction of the market with a certain Center, with specification certain corrective parameters (taxes, government subsidies, and sometimes part of the collective good, etc.) and fixing total "burden" (defense, balance of exports and imports, etc.). Modeling of this process is based on two ideas. The first is that taxes on the participants can be given not only to fixed shares total planned budget, but under a special rule that (in some cases) provides a "social justice".[6] The second idea is that each participant performing their invest-ment to the collective goods assumes that others will do as they did before. Center behaves simi-larly, predicting some general characteristics of the market process. This is explained in detail.
1 Central Economics and Mathematics Institute, RAS, Moskow, Russia 2 Central Economics and Mathematics Institute, RAS, Moskow Russia
MONTENEGRIN JOURNAL OF ECONOMICS, Vol. 9, No. 4 (December 2013), 7-19

Yuriy N. Gavrilets and Irina V. Tarakanova
8
2. BASIC MODEL RELATIONS.
Main relation of equilibrium:
∑ ∑ ≥−−−k k
kk aZFxy , (1)
where y = y (l) - production volume depending on the amount of labor l, k - numbers of partici-pants (groups) , and consuming the product involved in the production (k = 1,2, ... n). Where: xk - consumption of private goods to k-th participant, lk - labor costs to k-th participant, Fk - investments in the collective good to k-th participant, Z - government investment in the public good, ak - factor of comparing the usefulness of collective good and usefulness labor consumption, a - fixed burden on the economy.
The utility function (concave) k-th participant
)(),( ∑+Φ⋅+=k
kkkkkk FZalxvu (2)
As can be seen from the formula (2), the usefulness of collective goods for participants is
comparable with usefulness labor-consumption, but with different coefficients. Equilibrium is defined as the set of behavior variables of all participants lk*, xk*, Fk*, Z*), the
price p*, wages q* and tax requirements prescribed by Center Dk*, satisfying the four conditions. I. Natural Balance:
* * * *k k
k k
y x F Z a− − − =∑ ∑ ,
II. Maximizing profit by producer
* * * * * maxkk
p y q lΠ = ⋅ − ⋅ =∑ , y=f(l) , l<=Σ lk.
III. Maximizing utility function by consumer
* * * * * *( , , ) ( , , )k k k k k k k k ik i k
u x l F u x l F F≠
≥ +∑ ∑ , i ≠ k,
under the budget constraint
***kkkk DFplqxp −⋅−⋅≤⋅ ,
IV value balance (Walras law), Π * - profit:
* * * 0kk
D p a+ Π − ⋅ =∑ .

OPTIMALITY AND EQUILIBRIUM IN A SINGLE-PRODUCT ECONOMIC MODEL WITH COLLECTIVE GOOD (COMPUTER EXPERIMENTS) 9
Note that the equilibrium I-IV is a typical point of the corresponding Nash game, as his utility function depends on the choice of the other participants. Further, several variant of models will be discussed.
Model 1. Equilibrium, when the Center is not involved in the creation of the collective good (Z
= 0) by determining only the tax requirements. Model 2. In the constraint (1) and in the argument of the utility function (2) Fj = 0 for all j ≠ k.
Taxes to k-th user defined as a fixed percentage of the total budget, and the collective good is formed by the participants in the market and the Centre, so that each participant has a collective good, consisting of his own contribution and the same for all the Centre's contribution.
Model 3. Center forms a general tax on the basis of the behavior of market participants in
previous time (by value balance) .Taxes on the participants in the first and third variant are for-med in a manner that ensures compliance with the principle of justice in the form of a utilitarian social welfare function with constant coefficients of comparing interest when there are no social benefits [7, 8] . This method consisted in the fact that the Centre, specifying the proportion of taxation, continuously determines by some standard λ k the amount of taxes, providing equality
)()( iiikkk DD βλβλ ⋅=⋅ , for all j ≠ k, (3)
where Dk, Di - the amount of taxes, βk - the marginal utility of household income, λ k - coefficients of utility comparison of public welfare (w). This ensures that system enters in equilibrium, maximizing w (without collective goods).
( , , )k k k kk
w u x l Fλ= ⋅∑ (3а)
with (1) - (5).
3. ANALYSIS OF THE MODELS
Model 1. Center is not involved in the creation of a collective good. The utility function of par-ticipants has the form
)(),( ∑Φ⋅+=k
kkkkkk Falxvu
Value balance and natural one (without Z) - similar to the former. Let us to analyze the situa-tion at the equilibrium point obtained with the fulfillment of the condition (3) in the general case and compares it with the optimal solution. Optimization to k-th user its utility function, at the equilibrium point, leads to the equations:
* *=kk k
k k
dv da pdx dF
βΦ= ⋅ ⋅
(4)
where β*k - the marginal utility of income. For any equilibrium can choose coefficients λk so that β*k λk = H =const.
We now show that the solution (xk*,lk*,Fk*) is optimal for W c coefficients λk, only when akλk =
ai λi. for all i, k. Indeed, the optimum point must be satisfied:
Yuriy N. Gavrilets and Irina V. Tarakanova
10
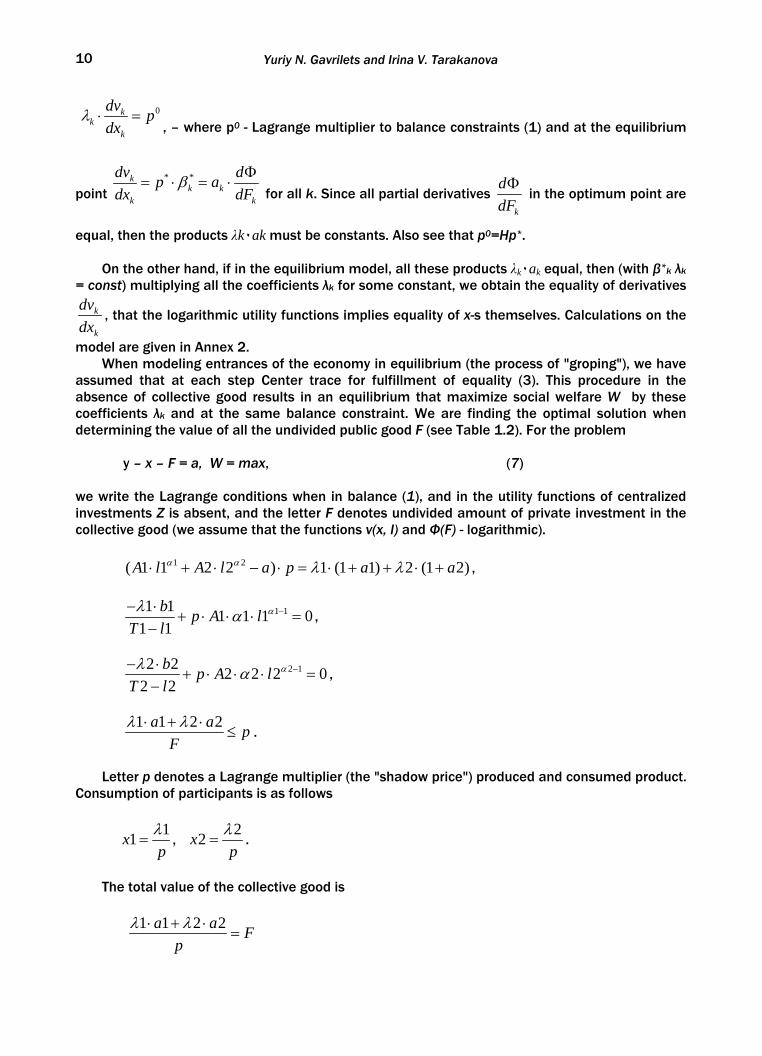
0k
kk
dv pdx
λ ⋅ =, – where p0 - Lagrange multiplier to balance constraints (1) and at the equilibrium
point * *k
k kk k
dv dp adx dF
β Φ= ⋅ = ⋅
for all k. Since all partial derivatives k
ddF
Φ in the optimum point are
equal, then the products λk٠ak must be constants. Also see that p0=Hp*. On the other hand, if in the equilibrium model, all these products λk٠ak equal, then (with β*k λk
= const) multiplying all the coefficients λk for some constant, we obtain the equality of derivatives
k
k
dvdx
, that the logarithmic utility functions implies equality of x-s themselves. Calculations on the
model are given in Annex 2. When modeling entrances of the economy in equilibrium (the process of "groping"), we have
assumed that at each step Center trace for fulfillment of equality (3). This procedure in the absence of collective good results in an equilibrium that maximize social welfare W by these coefficients λk and at the same balance constraint. We are finding the optimal solution when determining the value of all the undivided public good F (see Table 1.2). For the problem y – x – F = a, W = max, (7) we write the Lagrange conditions when in balance (1), and in the utility functions of centralized investments Z is absent, and the letter F denotes undivided amount of private investment in the collective good (we assume that the functions v(x, l) and Ф(F) - logarithmic).
1 2( 1 1 2 2 ) 1 (1 1) 2 (1 2)A l A l a p a aα α λ λ⋅ + ⋅ − ⋅ = ⋅ + + ⋅ + ,
1 11 1 1 1 1 01 1
b p A lT l
αλ α −− ⋅+ ⋅ ⋅ ⋅ =
−,
2 12 2 2 2 2 02 2
b p A lT l
αλ α −− ⋅+ ⋅ ⋅ ⋅ =
−,
1 1 2 2a a p
Fλ λ⋅ + ⋅
≤ .
Letter p denotes a Lagrange multiplier (the "shadow price") produced and consumed product.
Consumption of participants is as follows
11x
pλ
= , 22x
pλ
= .
The total value of the collective good is
1 1 2 2a a F
pλ λ⋅ + ⋅
=
OPTIMALITY AND EQUILIBRIUM IN A SINGLE-PRODUCT ECONOMIC MODEL WITH COLLECTIVE GOOD (COMPUTER EXPERIMENTS) 11
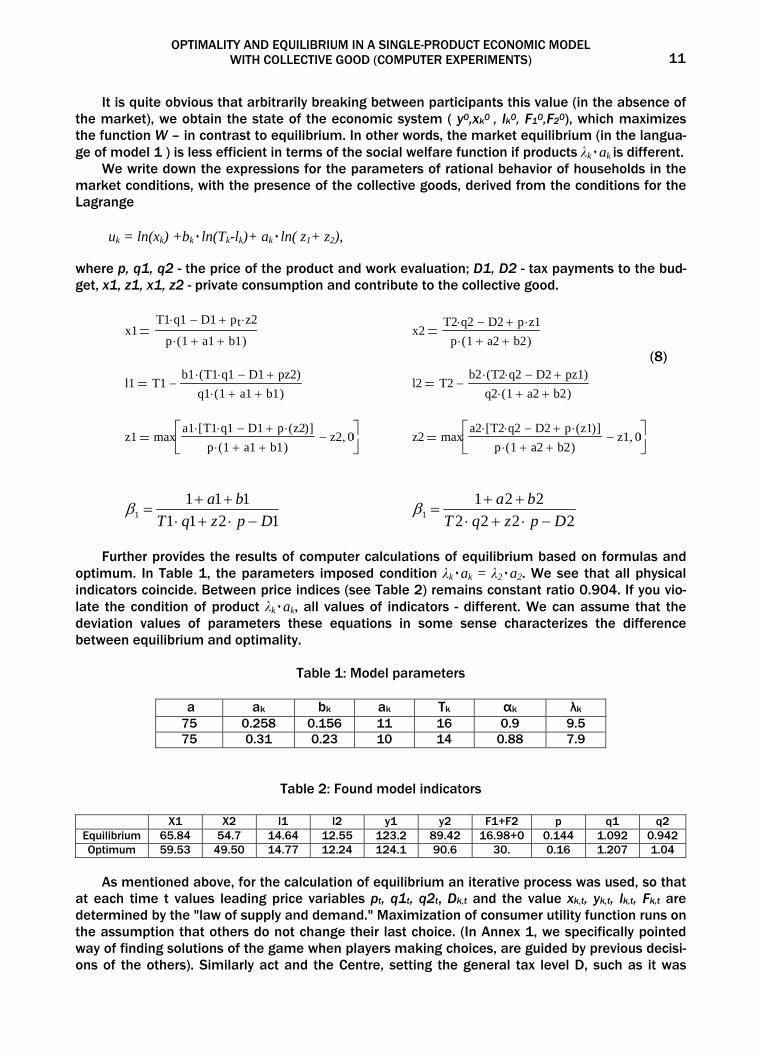
It is quite obvious that arbitrarily breaking between participants this value (in the absence of the market), we obtain the state of the economic system ( y0,xk0 , lk0, F10,F20), which maximizes the function W – in contrast to equilibrium. In other words, the market equilibrium (in the langua-ge of model 1 ) is less efficient in terms of the social welfare function if products λk٠ak is different.
We write down the expressions for the parameters of rational behavior of households in the market conditions, with the presence of the collective goods, derived from the conditions for the Lagrange uk = ln(xk) +bk٠ln(Tk-lk)+ ak٠ln( z1+ z2), where p, q1, q2 - the price of the product and work evaluation; D1, D2 - tax payments to the bud-get, x1, z1, x1, z2 - private consumption and contribute to the collective good.
x1T1 q1⋅ D1− pt z2⋅+
p 1 a1+ b1+( )⋅ x2
T2 q2⋅ D2− p z1⋅+p 1 a2+ b2+( )⋅
(8)
l1 T1b1 T1 q1⋅ D1− pz2+( )⋅
q1 1 a1+ b1+( )⋅−
l2 T2
b2 T2 q2⋅ D2− pz1+( )⋅q2 1 a2+ b2+( )⋅
−
z1 maxa1 T1 q1⋅ D1− p z2( )⋅+[ ]⋅
p 1 a1+ b1+( )⋅z2− 0, ⎡⎢
⎣⎤⎥⎦
z2 maxa2 T2 q2⋅ D2− p z1( )⋅+[ ]⋅
p 1 a2+ b2+( )⋅z1− 0, ⎡⎢
⎣⎤⎥⎦
1211111
1 DpzqTba
−⋅+⋅++
=β 2222
2211 DpzqT
ba−⋅+⋅
++=β
Further provides the results of computer calculations of equilibrium based on formulas and optimum. In Table 1, the parameters imposed condition λk٠ak = λ2٠a2. We see that all physical indicators coincide. Between price indices (see Table 2) remains constant ratio 0.904. If you vio-late the condition of product λk٠ak, all values of indicators - different. We can assume that the deviation values of parameters these equations in some sense characterizes the difference between equilibrium and optimality.
Table 1: Model parameters
a ak bk ak Tk αk λk
75 0.258 0.156 11 16 0.9 9.5 75 0.31 0.23 10 14 0.88 7.9
Table 2: Found model indicators
X1 X2 l1 l2 y1 y2 F1+F2 p q1 q2 Equilibrium 65.84 54.7 14.64 12.55 123.2 89.42 16.98+0 0.144 1.092 0.942 Optimum 59.53 49.50 14.77 12.24 124.1 90.6 30. 0.16 1.207 1.04
As mentioned above, for the calculation of equilibrium an iterative process was used, so that
at each time t values leading price variables pt, q1t, q2t, Dk,t and the value xk,t, yk,t, lk,t, Fk,t are determined by the "law of supply and demand." Maximization of consumer utility function runs on the assumption that others do not change their last choice. (In Annex 1, we specifically pointed way of finding solutions of the game when players making choices, are guided by previous decisi-ons of the others). Similarly act and the Centre, setting the general tax level D, such as it was
Yuriy N. Gavrilets and Irina V. Tarakanova
12
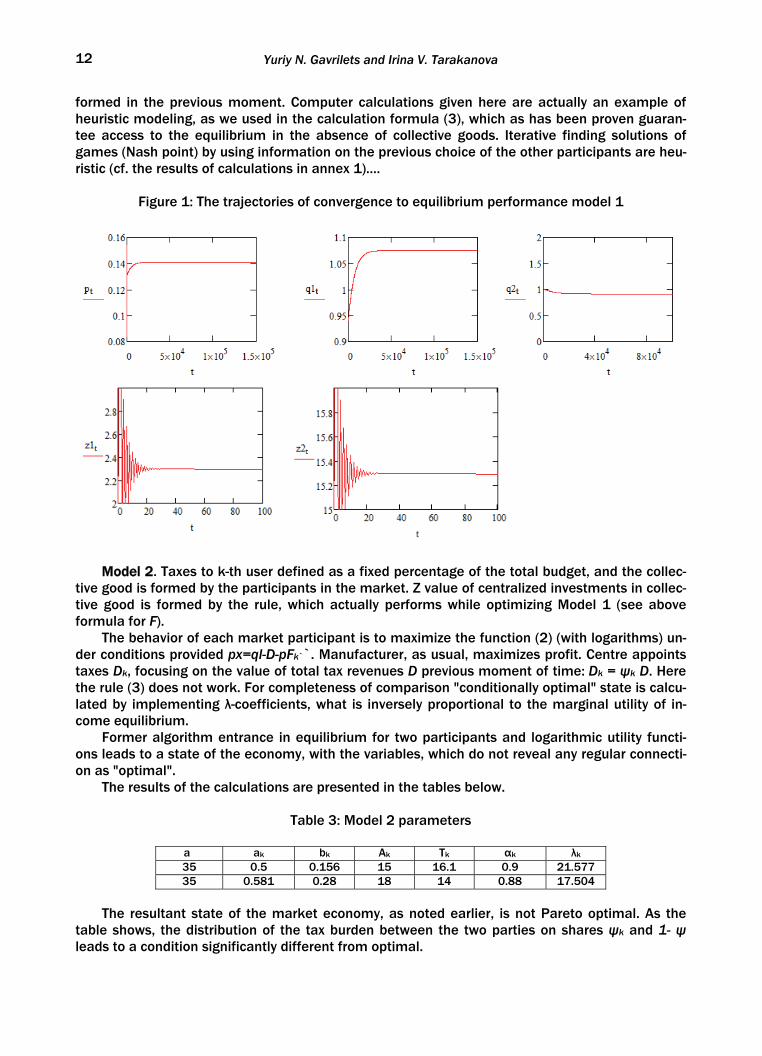
formed in the previous moment. Computer calculations given here are actually an example of heuristic modeling, as we used in the calculation formula (3), which as has been proven guaran-tee access to the equilibrium in the absence of collective goods. Iterative finding solutions of games (Nash point) by using information on the previous choice of the other participants are heu-ristic (cf. the results of calculations in annex 1)....
Figure 1: The trajectories of convergence to equilibrium performance model 1
Model 2. Taxes to k-th user defined as a fixed percentage of the total budget, and the collec-tive good is formed by the participants in the market. Z value of centralized investments in collec-tive good is formed by the rule, which actually performs while optimizing Model 1 (see above formula for F).
The behavior of each market participant is to maximize the function (2) (with logarithms) un-der conditions provided px=ql-D-pFk``. Manufacturer, as usual, maximizes profit. Centre appoints taxes Dk, focusing on the value of total tax revenues D previous moment of time: Dk = ψk D. Here the rule (3) does not work. For completeness of comparison "conditionally optimal" state is calcu-lated by implementing λ-coefficients, what is inversely proportional to the marginal utility of in-come equilibrium.
Former algorithm entrance in equilibrium for two participants and logarithmic utility functi-ons leads to a state of the economy, with the variables, which do not reveal any regular connecti-on as "optimal".
The results of the calculations are presented in the tables below.
Table 3: Model 2 parameters
a ak bk Ak Tk αk λk
35 0.5 0.156 15 16.1 0.9 21.577 35 0.581 0.28 18 14 0.88 17.504
The resultant state of the market economy, as noted earlier, is not Pareto optimal. As the
table shows, the distribution of the tax burden between the two parties on shares ψk and 1- ψ leads to a condition significantly different from optimal.
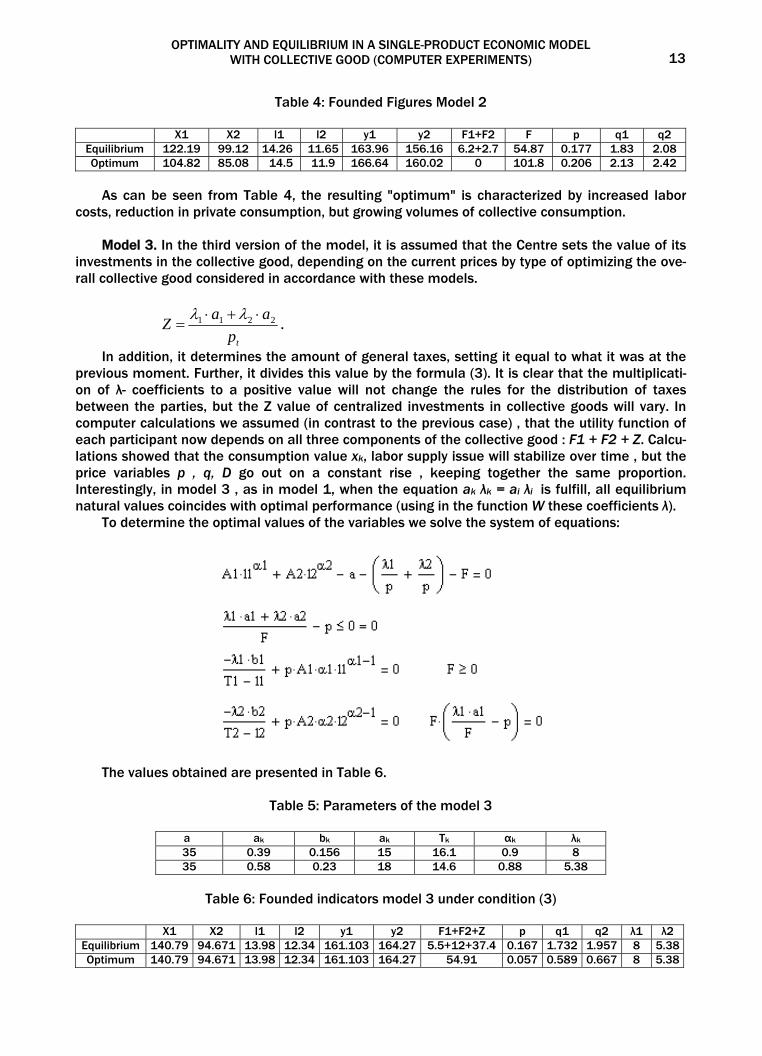
OPTIMALITY AND EQUILIBRIUM IN A SINGLE-PRODUCT ECONOMIC MODEL WITH COLLECTIVE GOOD (COMPUTER EXPERIMENTS) 13
Table 4: Founded Figures Model 2
X1 X2 l1 l2 y1 y2 F1+F2 F p q1 q2 Equilibrium 122.19 99.12 14.26 11.65 163.96 156.16 6.2+2.7 54.87 0.177 1.83 2.08 Optimum 104.82 85.08 14.5 11.9 166.64 160.02 0 101.8 0.206 2.13 2.42
As can be seen from Table 4, the resulting "optimum" is characterized by increased labor
costs, reduction in private consumption, but growing volumes of collective consumption. Model 3. In the third version of the model, it is assumed that the Centre sets the value of its
investments in the collective good, depending on the current prices by type of optimizing the ove-rall collective good considered in accordance with these models.
tp
aaZ 2211 ⋅+⋅=
λλ.
In addition, it determines the amount of general taxes, setting it equal to what it was at the previous moment. Further, it divides this value by the formula (3). It is clear that the multiplicati-on of λ- coefficients to a positive value will not change the rules for the distribution of taxes between the parties, but the Z value of centralized investments in collective goods will vary. In computer calculations we assumed (in contrast to the previous case) , that the utility function of each participant now depends on all three components of the collective good : F1 + F2 + Z. Calcu-lations showed that the consumption value xk, labor supply issue will stabilize over time , but the price variables p , q, D go out on a constant rise , keeping together the same proportion. Interestingly, in model 3 , as in model 1, when the equation ak λk = ai λi is fulfill, all equilibrium natural values coincides with optimal performance (using in the function W these coefficients λ).
To determine the optimal values of the variables we solve the system of equations:
The values obtained are presented in Table 6.
Table 5: Parameters of the model 3
a ak bk ak Tk αk λk
35 0.39 0.156 15 16.1 0.9 8 35 0.58 0.23 18 14.6 0.88 5.38
Table 6: Founded indicators model 3 under condition (3)
X1 X2 l1 l2 y1 y2 F1+F2+Z p q1 q2 λ1 λ2
Equilibrium 140.79 94.671 13.98 12.34 161.103 164.27 5.5+12+37.4 0.167 1.732 1.957 8 5.38 Optimum 140.79 94.671 13.98 12.34 161.103 164.27 54.91 0.057 0.589 0.667 8 5.38
Yuriy N. Gavrilets and Irina V. Tarakanova
14
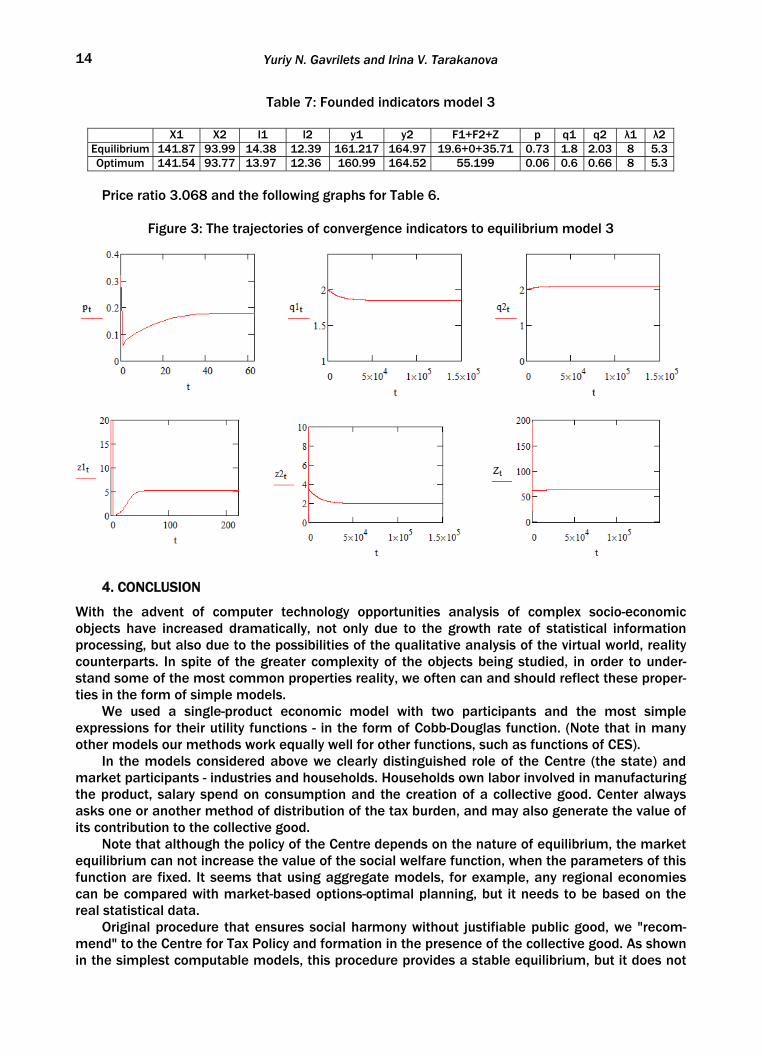
Table 7: Founded indicators model 3
X1 X2 l1 l2 y1 y2 F1+F2+Z p q1 q2 λ1 λ2 Equilibrium 141.87 93.99 14.38 12.39 161.217 164.97 19.6+0+35.71 0.73 1.8 2.03 8 5.3 Optimum 141.54 93.77 13.97 12.36 160.99 164.52 55.199 0.06 0.6 0.66 8 5.3
Price ratio 3.068 and the following graphs for Table 6.
Figure 3: The trajectories of convergence indicators to equilibrium model 3
4. CONCLUSION
With the advent of computer technology opportunities analysis of complex socio-economic objects have increased dramatically, not only due to the growth rate of statistical information processing, but also due to the possibilities of the qualitative analysis of the virtual world, reality counterparts. In spite of the greater complexity of the objects being studied, in order to under-stand some of the most common properties reality, we often can and should reflect these proper-ties in the form of simple models.
We used a single-product economic model with two participants and the most simple expressions for their utility functions - in the form of Cobb-Douglas function. (Note that in many other models our methods work equally well for other functions, such as functions of CES).
In the models considered above we clearly distinguished role of the Centre (the state) and market participants - industries and households. Households own labor involved in manufacturing the product, salary spend on consumption and the creation of a collective good. Center always asks one or another method of distribution of the tax burden, and may also generate the value of its contribution to the collective good.
Note that although the policy of the Centre depends on the nature of equilibrium, the market equilibrium can not increase the value of the social welfare function, when the parameters of this function are fixed. It seems that using aggregate models, for example, any regional economies can be compared with market-based options-optimal planning, but it needs to be based on the real statistical data.
Original procedure that ensures social harmony without justifiable public good, we "recom-mend" to the Centre for Tax Policy and formation in the presence of the collective good. As shown in the simplest computable models, this procedure provides a stable equilibrium, but it does not

OPTIMALITY AND EQUILIBRIUM IN A SINGLE-PRODUCT ECONOMIC MODEL WITH COLLECTIVE GOOD (COMPUTER EXPERIMENTS) 15
guarantee optimality. And although there are publications [3], in which presents theorems on Pareto optimality of equilibrium with public goods, yet they belong rather to other variants of models which consider additional conditions. Therefore, in our opinion, in the formulation of soci-al and economic policy must always be considered and consolidated options and optimal equilibrium models.
We add that the scheme given in Annexes for finding equilibrium and simple program for calculating and constructing trajectories (here - in a package MATHCAD) can easily reproduce by any reader to view the dynamics of processes for different values.
Appendix 1.
Consider the classical problem for using collective good for the two parties. Let the utility function of both players are expressed as follows:
)ln(ln 21 FFaxu kkk +⋅+= , (a) with constraints: xk+Fk≤w, ,wFx kk ≤+ xk, Fk≥0, k=1,2… (b)
If a Nash point exists, it satisfies the conditions maximizing uk under the above restrictions. Lagrange conditions of equality implies:
1
2111 1 a
FawF+
−⋅= ,
2
2222 1 a
FawF+
−⋅=
from where it is easy to find its values.
Equilibrium point of this game can be computed (in our case) using the sequential procedure
to improve their condition by each participant (xk*, Fk*), if he knows the aggregate remaining steps in the previous time t-1.
That is at every step t +1 decides the conditions of utility maximization:
∑≠
+ −=ki
tikkk
tk FFwuF ),(maxarg)( 1 , 0≤Fk≤wk.
For logarithmic utility functions and for given values of the parameters of the game we get a
convergent sequence of solutions shown in Figure. Let the parameters of game set
w1=12, w2=15, a1=1.2, a2=0.93
111)11()1( waFaFy ⋅+⋅+−= , 21221
211)1(
awaF
aFyy
+⋅
+⋅+−
=
Yuriy N. Gavrilets and Irina V. Tarakanova
16
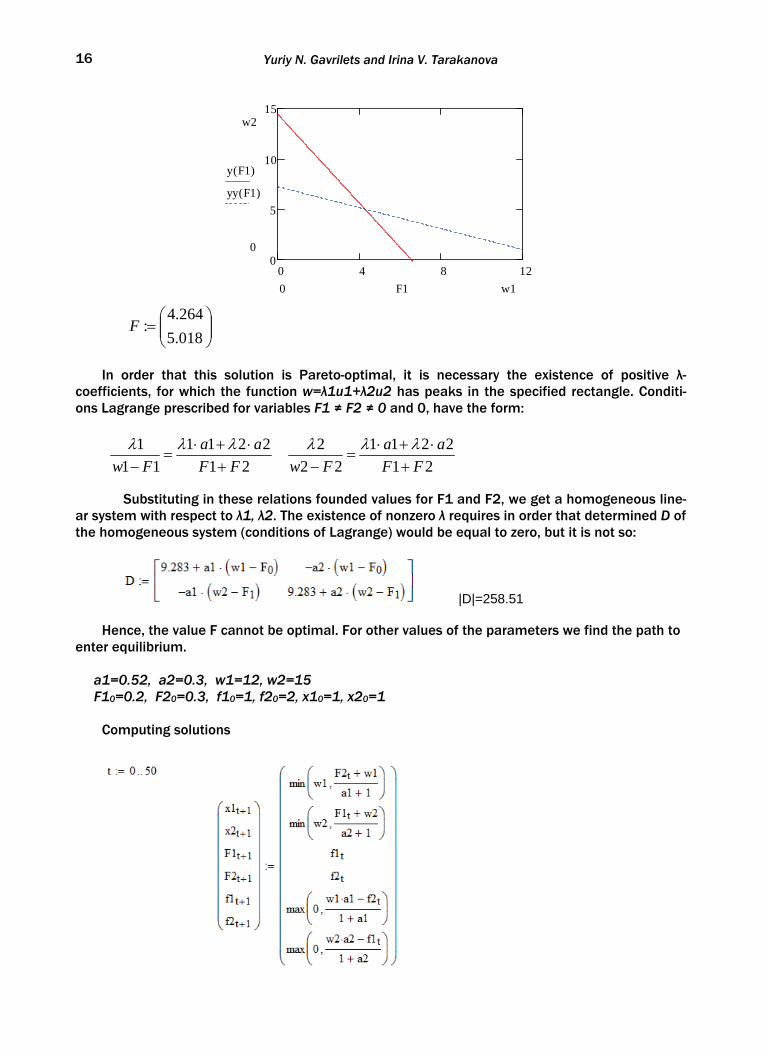
0 4 8 120
5
10
15w2
0
y F1( )
yy F1( )
w10 F1
⎟⎟⎠
⎞⎜⎜⎝
⎛=
018.5264.4
:F
In order that this solution is Pareto-optimal, it is necessary the existence of positive λ-
coefficients, for which the function w=λ1u1+λ2u2 has peaks in the specified rectangle. Conditi-ons Lagrange prescribed for variables F1 ≠ F2 ≠ 0 and 0, have the form:
21
221111
1FF
aaFw +
⋅+⋅=
−λλλ
21
221122
2FF
aaFw +
⋅+⋅=
−λλλ
Substituting in these relations founded values for F1 and F2, we get a homogeneous line-ar system with respect to λ1, λ2. The existence of nonzero λ requires in order that determined D of the homogeneous system (conditions of Lagrange) would be equal to zero, but it is not so:
|D|=258.51
Hence, the value F cannot be optimal. For other values of the parameters we find the path to enter equilibrium. а1=0.52, а2=0.3, w1=12, w2=15 F10=0.2, F20=0.3, f10=1, f20=2, x10=1, x20=1
Computing solutions
OPTIMALITY AND EQUILIBRIUM IN A SINGLE-PRODUCT ECONOMIC MODEL WITH COLLECTIVE GOOD (COMPUTER EXPERIMENTS) 17
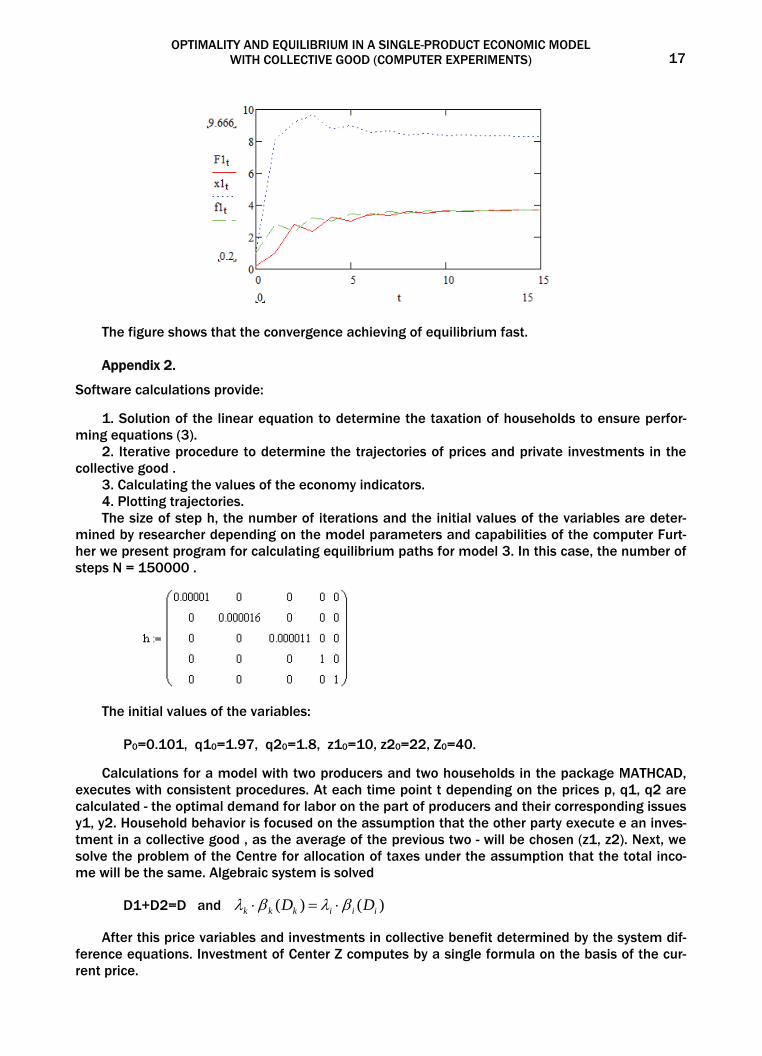
The figure shows that the convergence achieving of equilibrium fast.
Appendix 2.
Software calculations provide:
1. Solution of the linear equation to determine the taxation of households to ensure perfor-ming equations (3).
2. Iterative procedure to determine the trajectories of prices and private investments in the collective good .
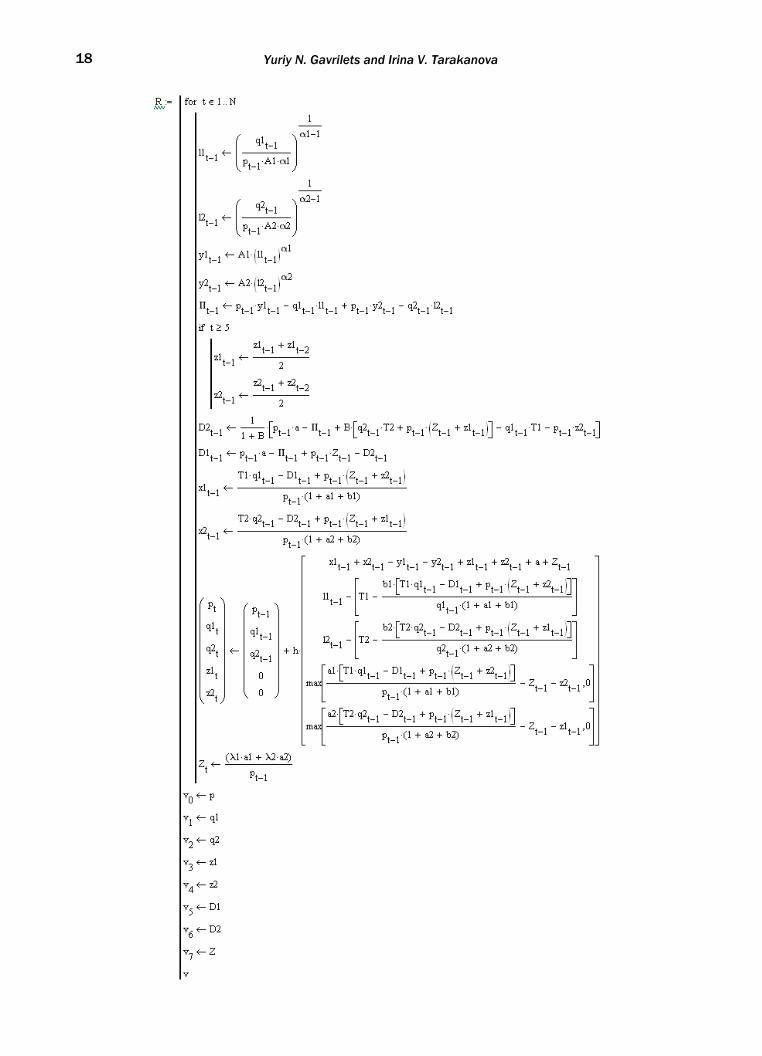
3. Calculating the values of the economy indicators. 4. Plotting trajectories. The size of step h, the number of iterations and the initial values of the variables are deter-
mined by researcher depending on the model parameters and capabilities of the computer Furt-her we present program for calculating equilibrium paths for model 3. In this case, the number of steps N = 150000 .
The initial values of the variables: P0=0.101, q10=1.97, q20=1.8, z10=10, z20=22, Z0=40.
Calculations for a model with two producers and two households in the package MATHCAD, executes with consistent procedures. At each time point t depending on the prices p, q1, q2 are calculated - the optimal demand for labor on the part of producers and their corresponding issues y1, y2. Household behavior is focused on the assumption that the other party execute e an inves-tment in a collective good , as the average of the previous two - will be chosen (z1, z2). Next, we solve the problem of the Centre for allocation of taxes under the assumption that the total inco-me will be the same. Algebraic system is solved
D1+D2=D and )()( iiikkk DD βλβλ ⋅=⋅
After this price variables and investments in collective benefit determined by the system dif-ference equations. Investment of Center Z computes by a single formula on the basis of the cur-rent price.
Yuriy N. Gavrilets and Irina V. Tarakanova
18
OPTIMALITY AND EQUILIBRIUM IN A SINGLE-PRODUCT ECONOMIC MODEL WITH COLLECTIVE GOOD (COMPUTER EXPERIMENTS) 19
REFERENCES
[1] Chen, Y. (1983), Incentive-Compatible Mechanisms for Pure Public Goods: A Survey of Experimen-tal Research, School of Information The University of Michigan.
[2] Dergstrom, T., Blume, L. and Varian, H. (1986), “On The Private Provision Of Public Goods”, Journal of Public Economics, No. 29, 25-49.
[3] Dreze, J. H. and Poussin, V. (1971), “A Tâtonnement Process for Public Goods”, The Review of Eco-nomic Studies, Vol. 38, No. 2, 133-150.
[4] Fourgeaud, C., Lenclud, B. and Pierre Michel, P. (1983), “Taux d'actualisation et prix de l'énergie”, Revue économique, Vol. 34, No. 2, 253-276.
[5] Gavrilets, Yu. N., and Steblyuk, A. S. (2012), „Odnoproduktovaya model' ekonomicheskogo ravno-vesiya s filantropiyey“, EMM, No. 3, 30-39.
[6] Gavrilets, Yu. N. (2009), „Komp'yuternaya model' dostizheniya sotsial'no - opravdannogo ekonomi-cheskogo ravnovesiya“, Sbornik Matematicheskoye modelirovaniye sotsial'nykh protsessov, Vyp. 9, MGU, Moskva.
[7] Nitzan, S., Romano, R. E. (1990), "Private Provision of a Discrete Public Good with Uncertain Cost", Journal of Public Economics, Vol. 42, No. 3, 357-370.
[8] Pirttilä, J. and Tuomala Source, M. (2002), “Publicly Provided Private Goods and Redistribution: A General Equilibrium Analysis”, The Scandinavian Journal of Economics, Vol. 104, No. 1, 173-188.

THE IMPORTANCE OF SUSTAINING AND IMPROVING COMPANY’S BUSINESS SUCCESS BY USING INDICATOR OF THE DEGREE OF HEDGING NECESSITY 21
THE IMPORTANCE OF SUSTAINING AND IMPROVING COMPANY’S BUSINESS SUCCESS
BY USING INDICATOR OF THE DEGREE OF HEDGING NECESSITY
IVO ŠPERANDA1 ABSTRACT
This paper considers influence of hedging regarded as a technique for protecting companies against un-foreseeable events which might seriously influence company’s business, primarily its financial stability and its business results The econometric model is thus created to test the impact of hedging on companies’ EBIT and to determine the necessity of hedging usage. Regression method and model were used to assess the impact of change in dollar and kunai exchange rates in relation to EBIT measure in 10 year period. Ad-ditionally the completely new analytic tool named Indicator of the degree of hedging necessity IZI has been introduced This paper shows huge efficacy of hedging as a protection tool, firstly evident through positive effects on EBIT and therefore on the company and the entire economy’s improved competitiveness degree. In this paper the completely new indicator has been introduced and explained in order to assess the neces-sity of cash flow protection. Finally, it's obvious that hedging as a tool of protection, contributes a lot in achieving better operational and financial goals which leads to a higher degree of the company's competi-tiveness on the international market.
KEY WORDS: hedging, necessity, model, EBIT, protecting
JEL Classification: F37; G32; G17; C51 Received: May 17, 2013 / Accepted: November 21, 2013
1. INTRODUCTION
Companies having business activities abroad, and most of the modern ones have, are exposed to risk in different ways. Besides the political ones, there is a risk in foreign currencies exchange and in commodities and services price change.
Basically it is all about differences in spot and futures prices, i.e. current market prices and the prices in certain future. Bearing that in mind there are three basic and characteristic types of risk exposures: translation exposure, transaction exposure and finally economic exposure. Tran-slation exposure relates to the change in accounting income in balance sheet as a result of exchange rate changes.
Transaction exposure relates to execution of certain transactions, while economic risk exposure includes changes (the negative ones) in expected and in projected future cash flows of a certain company, and therefore, most importantly in its economic value.
There are numerous ways to more or less manage the risk exposures in a company: classic insurance, swap businesses, diversification of business and investment portfolio, futures con-tracts and forward contracts.
This paper intends to demonstrate the possibilities of econometric modeling, i.e. measuring hedging necessity and its impact in companies.
It is important to mention that there is no, nor can there be, a unique and general hedging model and law for all companies. Every company, taking into account its own specificities creates its own hedging strategy and pursuantly its own model which pay respect to type of business, market share, market position and similar.
1 University of Dubrovnik – Department of Economics and Business Economics, Lapadska obala 7, 20000 Dubrovnik, Croatia mail: [email protected]
MONTENEGRIN JOURNAL OF ECONOMICS, Vol. 9, No. 4 (December 2013), 21-37
Ivo Šperanda 22
Just as every company needs to determine its optimal hedging strategy which depends on numerous specific and variable parameters, the measuring, that is defining the impact of protec-tion or hedging is also specific for every company and it depends on current conditions under which the company operates.
The most common and the most widely used method of hedging impact assessment is regression method including its variations (linear, exponential).
Relation between hedging and company’s competitiveness is well demonstrated in the paper of American scientists Christine Parlour (University of California) and Tingjun Liu-a (Arizona State University) under symptomatic title: „Hedging and Competition“ (Parlour and Liu, 2008; 148-161) in which authors question the possibilities of direct hedging of company’s cash flow and assume that it is being done in order to reduce the degree of risk in business, but simultaneously it incre-ases the company’s risk on financial markets as a result of using protection instruments, that is hedging (of options of different types and categories). The purpose of this paper is, first of all, to analyze specific factors what might impact compa-nies’ business results i.e. cash flow, and to point out at the new analytical indicators of risk analy-sis of cash flow and the methods of protection in order to sustain and improve company's suc-cess by using mentioned |Z| indicator. The goal of this paper is in performing and promoting hedging in general business operations by explaining and affirming the indicator of the degree of hedging necessity as an analytical tool. And finally,the hypothesis, brought out in this paper,runs like this: usage of the indicator of the degree of hedging necessity i.e. |Z| indicator will contribute to the adequate use of hedging as a protecting tool against risk significantly and thus the entire company’s business success will be improved considerably.
2. ASSESSMENT OF MODEL PARAMETERS
The term assessment of parameters of linear regression denotes calculation of value of parame-ter in a way that given direction represents approximation or relationship of phenomena in question.
In order to assess the parameters of regression model, one should firstly define the desirable model and its elements and assumptions.
Simple linear regression should be used to build a model which shows impact and necessity of hedging on forward markets for protection against sudden and unpredictable price movements on global market.
Data of the Atlantska plovidba Ltdii from Dubrovnik, a respectable and successful company whose main activity is maritime transport, but also deals with tourism (hotel industry and charter air transportiii) are taken for the entry data.
The company obviously operates on international market and is thus exposed to currency risk, mostly to the risk related to the movements of the U.S. dollar as the most part of company’s income is realized in that currency.
On the other hand, we can witness a high degree of dollar volatility which endangers the business success of the shipping company.
EBIT (Earnings Before Interest & Tax), representing business success of a company and its earning potential is taken here as a measure of business success.
3. MODEL ELEMENTS
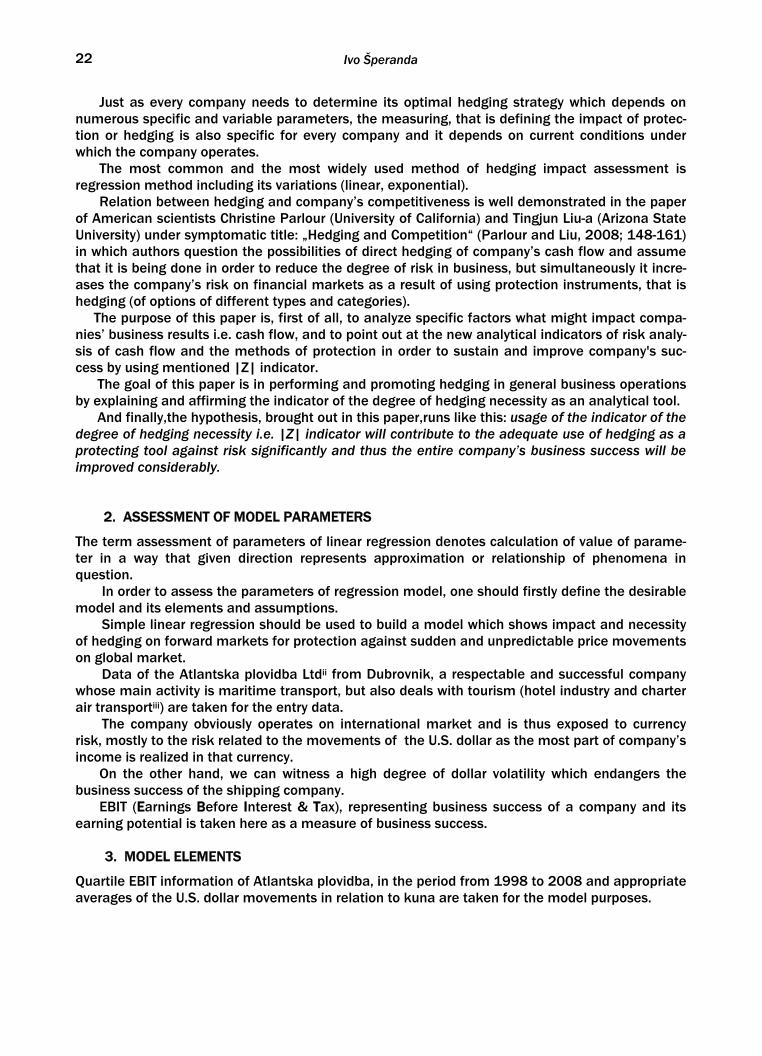
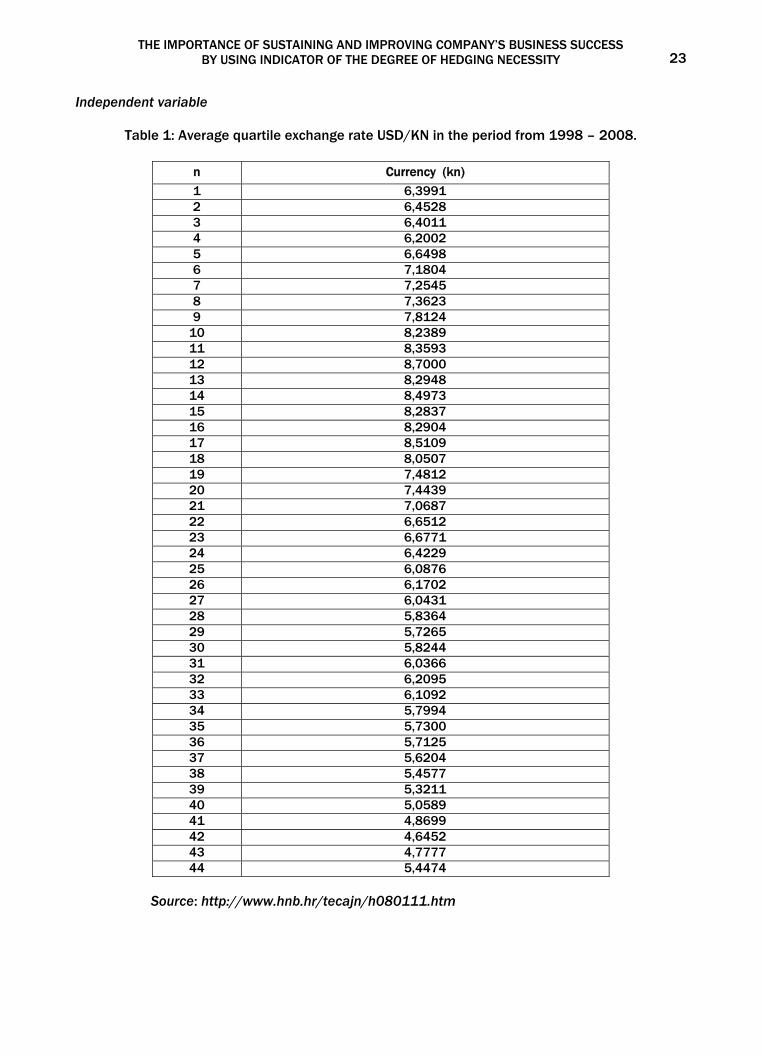
Quartile EBIT information of Atlantska plovidba, in the period from 1998 to 2008 and appropriate averages of the U.S. dollar movements in relation to kuna are taken for the model purposes.
THE IMPORTANCE OF SUSTAINING AND IMPROVING COMPANY’S BUSINESS SUCCESS BY USING INDICATOR OF THE DEGREE OF HEDGING NECESSITY 23
Independent variable
Table 1: Average quartile exchange rate USD/KN in the period from 1998 – 2008.
n Currency (kn)
1 6,3991 2 6,4528 3 6,4011 4 6,2002 5 6,6498 6 7,1804 7 7,2545 8 7,3623 9 7,8124
10 8,2389 11 8,3593 12 8,7000 13 8,2948 14 8,4973 15 8,2837 16 8,2904 17 8,5109 18 8,0507 19 7,4812 20 7,4439 21 7,0687 22 6,6512 23 6,6771 24 6,4229 25 6,0876 26 6,1702 27 6,0431 28 5,8364 29 5,7265 30 5,8244 31 6,0366 32 6,2095 33 6,1092 34 5,7994 35 5,7300 36 5,7125 37 5,6204 38 5,4577 39 5,3211 40 5,0589 41 4,8699 42 4,6452 43 4,7777 44 5,4474
Source: http://www.hnb.hr/tecajn/h080111.htm
Ivo Šperanda 24
Dependent variable
Table 2: Quartile amounts of EBIT for the period of 1998 – 2008. (in 000 kn).
EBIT (000 kn) n
-18.552 1 -21.501 2 -7.600 3 -9.023 4
-14.540 5 -11.818 6 -9.009 7
-15.619 8 -8.742 9
-11.250 10 -9.308 11 -1.066 12 -4.796 13 -7.502 14 -8.835 15
-20.587 16 -16.374 17 -11.601 18 -18.025 19 -8.186 20 -6.789 21 3.358 22 6.106 23 21.98 24
15.346 25 39.937 26 24.164 27 47.541 28 56.128 29
224.222 30 217.062 31 58.563 32 26.858 33 33.254 34
185.200 35 187.542 36 98.752 37
102.587 38 101.258 39 99.771 40
279.749 41 156.863 42 344.325 43 -20.569 44
Source: financial archives of Atlantska plovidba Ltd Dubrovnik
Basic assumption is that changes in exchange rate significantly affect the size of realized EBIT. For this model purposes, other influences on EBIT are neglected in order to be able to
THE IMPORTANCE OF SUSTAINING AND IMPROVING COMPANY’S BUSINESS SUCCESS BY USING INDICATOR OF THE DEGREE OF HEDGING NECESSITY 25
observe and measure only the effects of changes in exchange rate. Thus, the exchange rate is marked as independent variable (X) and the measure of EBIT as dependent one (Y).
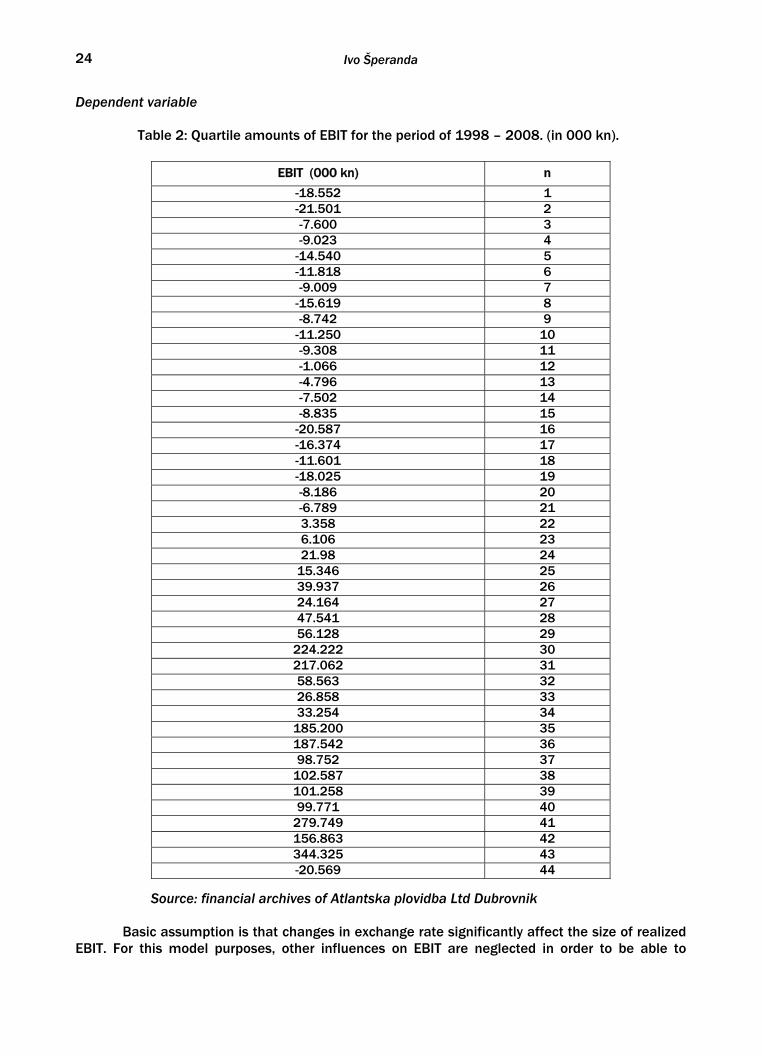
Table 3: Movements of USD/KN exchange rates and amounts of quartile EBIT
in the period of 1998–2008.
KN/$ EXCHANGE RATE AND EBIT FOR THE PERIOD OF 1998-2008. (quarterly)
n The exchange rate (X) – exchange rate is arithmetic mean of monthly averages for each quarter
EBIT (Y) u 000 kn
1 6,3991 -18.552 2 6,4528 -21.501 3 6,4011 -7.600 4 6,2002 -9.023 5 6,6498 -14.540 6 7,1804 -11.818 7 7,2545 -9.009 8 7,3623 -15.619 9 7,8124 -8.742
100 8,2389 -11.250 11 8,3593 -9.308 12 8,7000 -1.066 13 8,2948 -4.796 14 8,4973 -7.502 15 8,2837 -8.835 16 8,2904 -20.587 17 8,5109 -16.374 18 8,0507 -11.601 19 7,4812 -18.025 20 7,4439 -8.186 21 7,0687 -6.789 22 6,6512 3.358 23 6,6771 6.106 24 6,4229 21.981 25 6,0876 15.346 26 6,1702 39.937 27 6,0431 24.164 28 5,8364 47.541 29 5,7265 56.128 30 5,8244 224.222 31 6,0366 217.062 32 6,2095 58.563 33 6,1092 26.858 34 5,7994 33.254 35 5,7300 185.200 36 5,7125 187.542 37 5,6204 98.752 38 5,4577 102.587 39 5,3211 101.258 40 5,0589 99.771 41 4,8699 279.749 42 4,6452 156.863 43 4,7777 344.325 44 5,4474 -20.569
Source: http://www.hnb.hr/tecajn/h080111.htm and financial archives of AP Ltd.-Dubrovnik
Ivo Šperanda 26
Given data point out two things: firstly, changes in exchange rate affect the realized EBIT and therefore the financial business results, and secondly the business results are better if the dollar exchange rate is lower, which could have been concluded from the nature of the business activi-ties of the observed company. By using statistic package within Microsoft Office the results are as follow:
- Correlation coefficient (r) = -0,665 - Coefficient of determination (R2 ) = 0,443
Given coefficients point out the following:
- Correlation coefficient (r) is negative in range from 0,5 to 0,8 which, according to Chaddock’s scale (Chaddock,1925; 248;303) demonstrates significant, but negative correlation of observed phenomena, meaning that the increase of one variable (x) benefits from the linear fall of the other variable (y).
- Coefficient of determination (R2) shows the existence of approximately 44 % of mutual factors among the observed sizes, or in other words: around 44 % of variation (chan-ges) of EBIT is explained by the changes in the observed exchange rate. Moreover, this coefficient proves that hedging is the appropriate protection measure. Namely, if hed-ging is used and thus negative influences of exchange rate variation to the EBIT mea-sure is annulled, such a protection would be efficient in the very size of coefficient of determination, as the risk is decreased for that size (44 %), i.e. its variant.
3.1 Basic Model or Model A
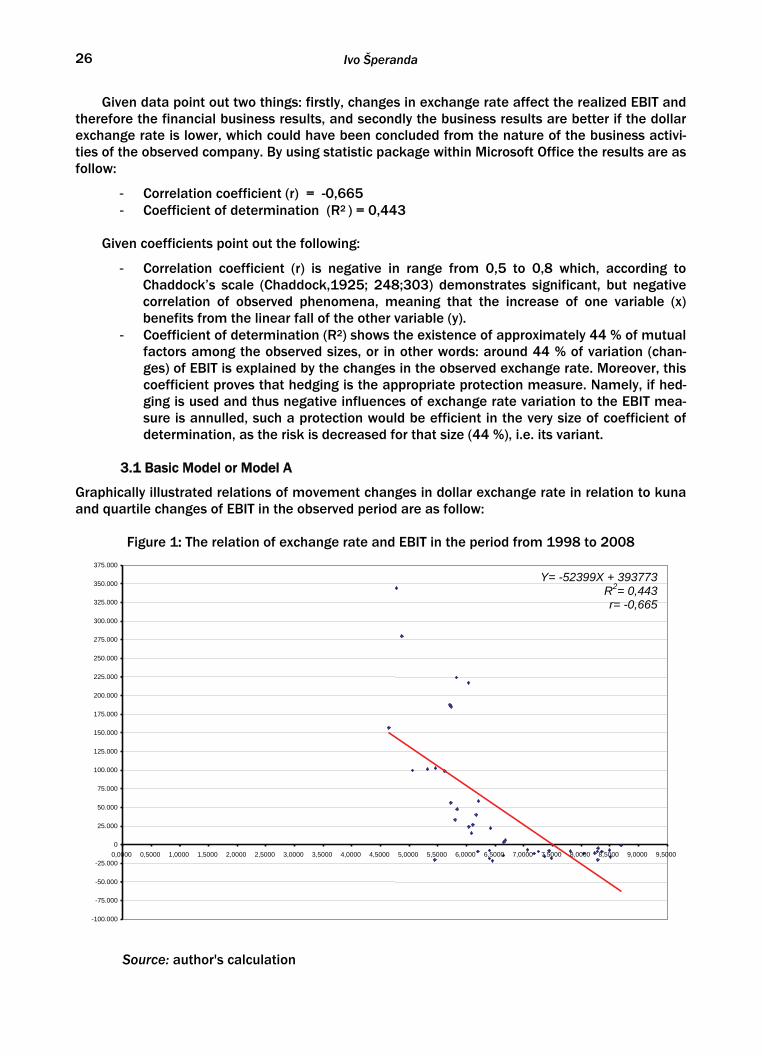
Graphically illustrated relations of movement changes in dollar exchange rate in relation to kuna and quartile changes of EBIT in the observed period are as follow:
Figure 1: The relation of exchange rate and EBIT in the period from 1998 to 2008
Source: author's calculation
Y= -52399X + 393773 R2= 0,443 r= -0,665
-100.000
-75.000
-50.000
-25.000
0
25.000
50.000
75.000
100.000
125.000
150.000
175.000
200.000
225.000
250.000
275.000
300.000
325.000
350.000
375.000
0,0000
0,5000
1,0000
1,5000
2,0000
2,5000
3,0000
3,5000
4,0000
4,5000
5,0000
5,5000
6,0000 6,5000 7,0000 7,5000 8,0000 8,5000 9,0000 9,5000
THE IMPORTANCE OF SUSTAINING AND IMPROVING COMPANY’S BUSINESS SUCCESS BY USING INDICATOR OF THE DEGREE OF HEDGING NECESSITY 27
On the grounds of one decade’s historical data, the estimated regression model has the following form:
Y = - 52.399 X + 393.773 (MODEL A) (1)
The size Y represents the dependent variable, i.e. value of EBIT that we want to protect against negative effects of changes of dollar exchange rate in relation to kuna. The size X repre-sents the future changes of dollar and kuna exchange rates. Model A is obviously not good eno-ugh as there are relatively significant deviations of original data in relation to estimated direction (Fig. 1). In order for model to improve, it is necessary to arrange original data in a way that the relations among them are not changed.
3.2 Improved Model or Model B
Since the previous model does not entirely satisfy the original data, in the following model we will try to find the form of estimated curve, i.e. the model which, in satisfactory degree of deviation follows the scatter of original data. In order to comply with that condition, the adequate exponential function of the general form: Y = a x b' should be found and the original data should be adequately arranged.
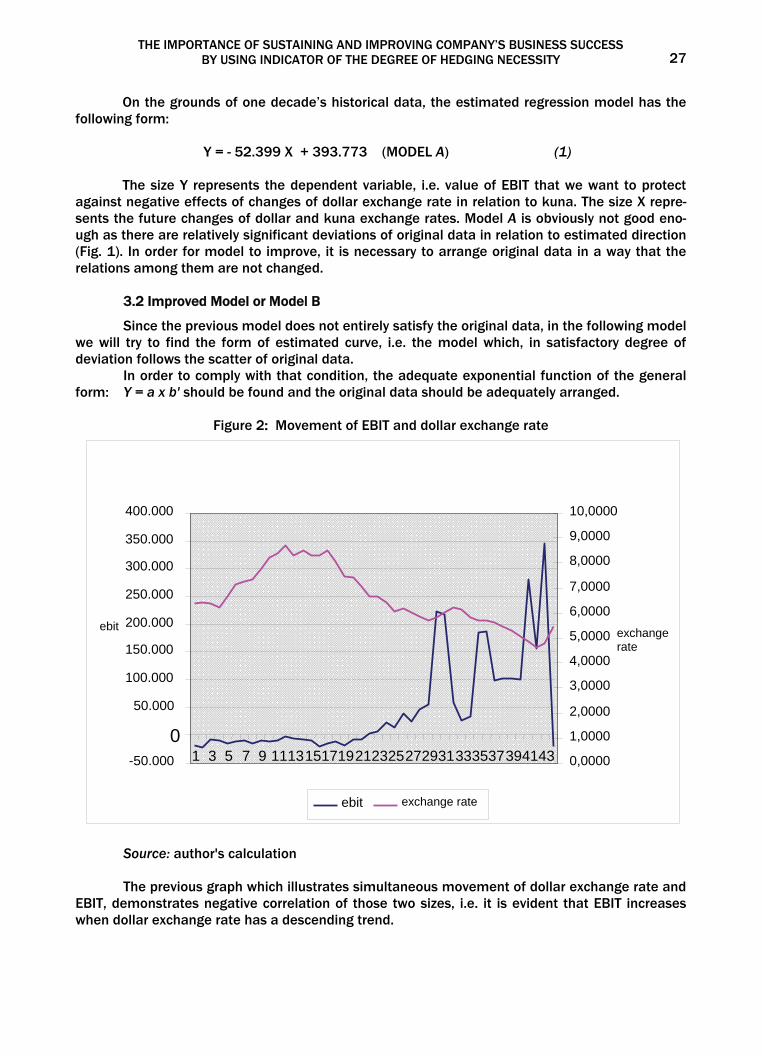
Figure 2: Movement of EBIT and dollar exchange rate
Source: author's calculation The previous graph which illustrates simultaneous movement of dollar exchange rate and EBIT, demonstrates negative correlation of those two sizes, i.e. it is evident that EBIT increases when dollar exchange rate has a descending trend.
-50.000
0
50.000
100.000
150.000
200.000
250.000
300.000
350.000
400.000
1 3 5 7 9 11 13 1517 19 21232527 29 31333537 394143
ebit
0,0000
1,0000
2,0000
3,0000
4,0000
5,0000
6,0000
7,0000
8,0000
9,0000
10,0000
ebit exchange rate
exchange rate
Ivo Šperanda 28
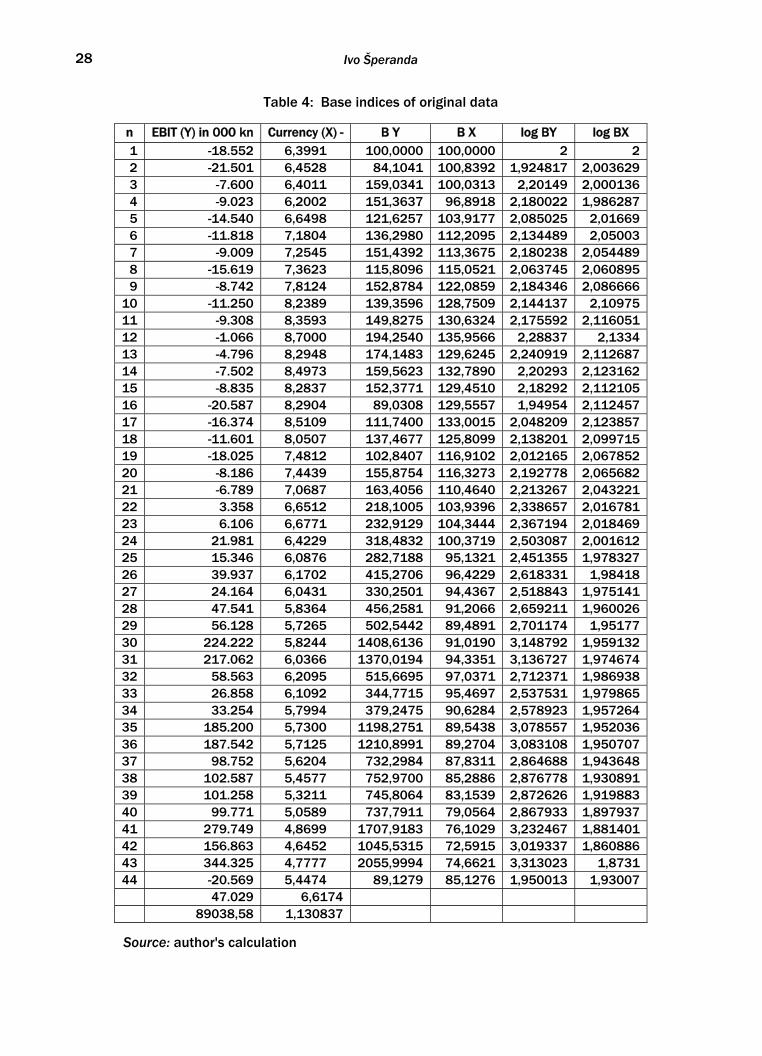
Table 4: Base indices of original data
n EBIT (Y) in 000 kn Currency (X) - B Y B X log BY log BX 1 -18.552 6,3991 100,0000 100,0000 2 2 2 -21.501 6,4528 84,1041 100,8392 1,924817 2,003629 3 -7.600 6,4011 159,0341 100,0313 2,20149 2,000136 4 -9.023 6,2002 151,3637 96,8918 2,180022 1,986287 5 -14.540 6,6498 121,6257 103,9177 2,085025 2,01669 6 -11.818 7,1804 136,2980 112,2095 2,134489 2,05003 7 -9.009 7,2545 151,4392 113,3675 2,180238 2,054489 8 -15.619 7,3623 115,8096 115,0521 2,063745 2,060895 9 -8.742 7,8124 152,8784 122,0859 2,184346 2,086666
10 -11.250 8,2389 139,3596 128,7509 2,144137 2,10975 11 -9.308 8,3593 149,8275 130,6324 2,175592 2,116051 12 -1.066 8,7000 194,2540 135,9566 2,28837 2,1334 13 -4.796 8,2948 174,1483 129,6245 2,240919 2,112687 14 -7.502 8,4973 159,5623 132,7890 2,20293 2,123162 15 -8.835 8,2837 152,3771 129,4510 2,18292 2,112105 16 -20.587 8,2904 89,0308 129,5557 1,94954 2,112457 17 -16.374 8,5109 111,7400 133,0015 2,048209 2,123857 18 -11.601 8,0507 137,4677 125,8099 2,138201 2,099715 19 -18.025 7,4812 102,8407 116,9102 2,012165 2,067852 20 -8.186 7,4439 155,8754 116,3273 2,192778 2,065682 21 -6.789 7,0687 163,4056 110,4640 2,213267 2,043221 22 3.358 6,6512 218,1005 103,9396 2,338657 2,016781 23 6.106 6,6771 232,9129 104,3444 2,367194 2,018469 24 21.981 6,4229 318,4832 100,3719 2,503087 2,001612 25 15.346 6,0876 282,7188 95,1321 2,451355 1,978327 26 39.937 6,1702 415,2706 96,4229 2,618331 1,98418 27 24.164 6,0431 330,2501 94,4367 2,518843 1,975141 28 47.541 5,8364 456,2581 91,2066 2,659211 1,960026 29 56.128 5,7265 502,5442 89,4891 2,701174 1,95177 30 224.222 5,8244 1408,6136 91,0190 3,148792 1,959132 31 217.062 6,0366 1370,0194 94,3351 3,136727 1,974674 32 58.563 6,2095 515,6695 97,0371 2,712371 1,986938 33 26.858 6,1092 344,7715 95,4697 2,537531 1,979865 34 33.254 5,7994 379,2475 90,6284 2,578923 1,957264 35 185.200 5,7300 1198,2751 89,5438 3,078557 1,952036 36 187.542 5,7125 1210,8991 89,2704 3,083108 1,950707 37 98.752 5,6204 732,2984 87,8311 2,864688 1,943648 38 102.587 5,4577 752,9700 85,2886 2,876778 1,930891 39 101.258 5,3211 745,8064 83,1539 2,872626 1,919883 40 99.771 5,0589 737,7911 79,0564 2,867933 1,897937 41 279.749 4,8699 1707,9183 76,1029 3,232467 1,881401 42 156.863 4,6452 1045,5315 72,5915 3,019337 1,860886 43 344.325 4,7777 2055,9994 74,6621 3,313023 1,8731 44 -20.569 5,4474 89,1279 85,1276 1,950013 1,93007 47.029 6,6174 89038,58 1,130837
Source: author's calculation
THE IMPORTANCE OF SUSTAINING AND IMPROVING COMPANY’S BUSINESS SUCCESS BY USING INDICATOR OF THE DEGREE OF HEDGING NECESSITY 29
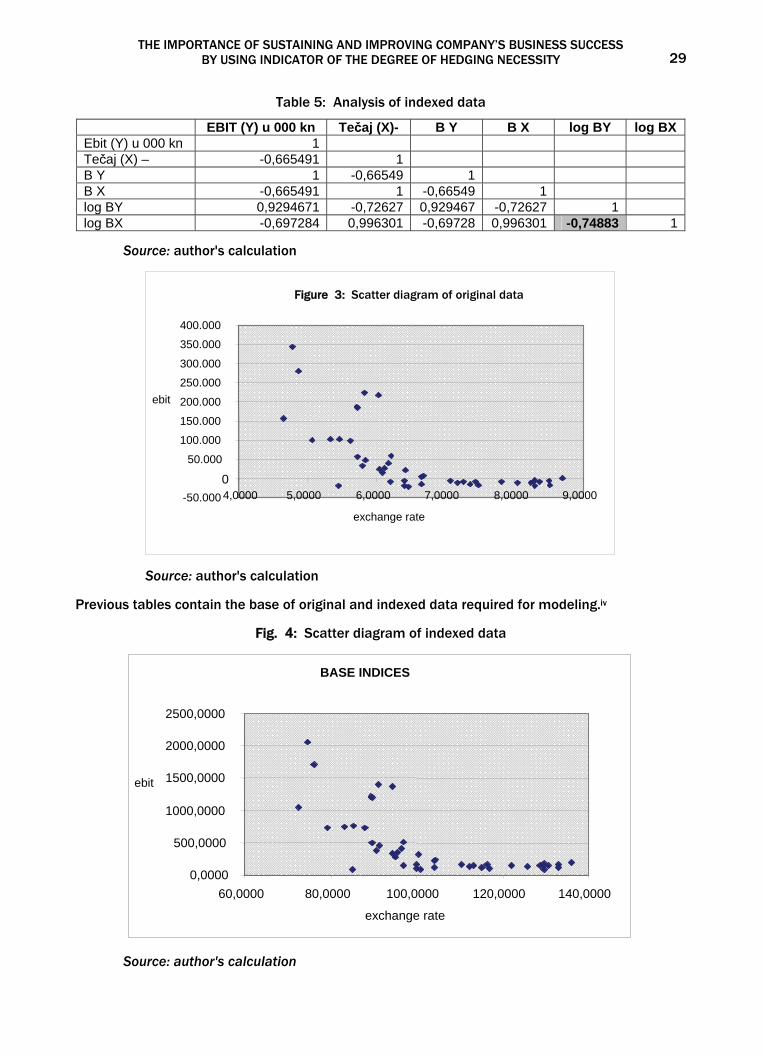
Table 5: Analysis of indexed data
EBIT (Y) u 000 kn Tečaj (X)- B Y B X log BY log BX Ebit (Y) u 000 kn 1 Tečaj (X) – -0,665491 1 B Y 1 -0,66549 1 B X -0,665491 1 -0,66549 1 log BY 0,9294671 -0,72627 0,929467 -0,72627 1 log BX -0,697284 0,996301 -0,69728 0,996301 -0,74883 1
Source: author's calculation
Source: author's calculation Previous tables contain the base of original and indexed data required for modeling.iv
Fig. 4: Scatter diagram of indexed data
Source: author's calculation
BASE INDICES
0,0000
500,0000
1000,0000
1500,0000
2000,0000
2500,0000
60,0000 80,0000 100,0000 120,0000 140,0000
exchange rate
ebit
Figure 3: Scatter diagram of original data
-50.000
0
50.000
100.000
150.000
200.000
250.000
300.000
350.000
400.000
4,0000 5,0000 6,0000 7,0000 8,0000 9,0000
exchange rate
ebit
Ivo Šperanda 30
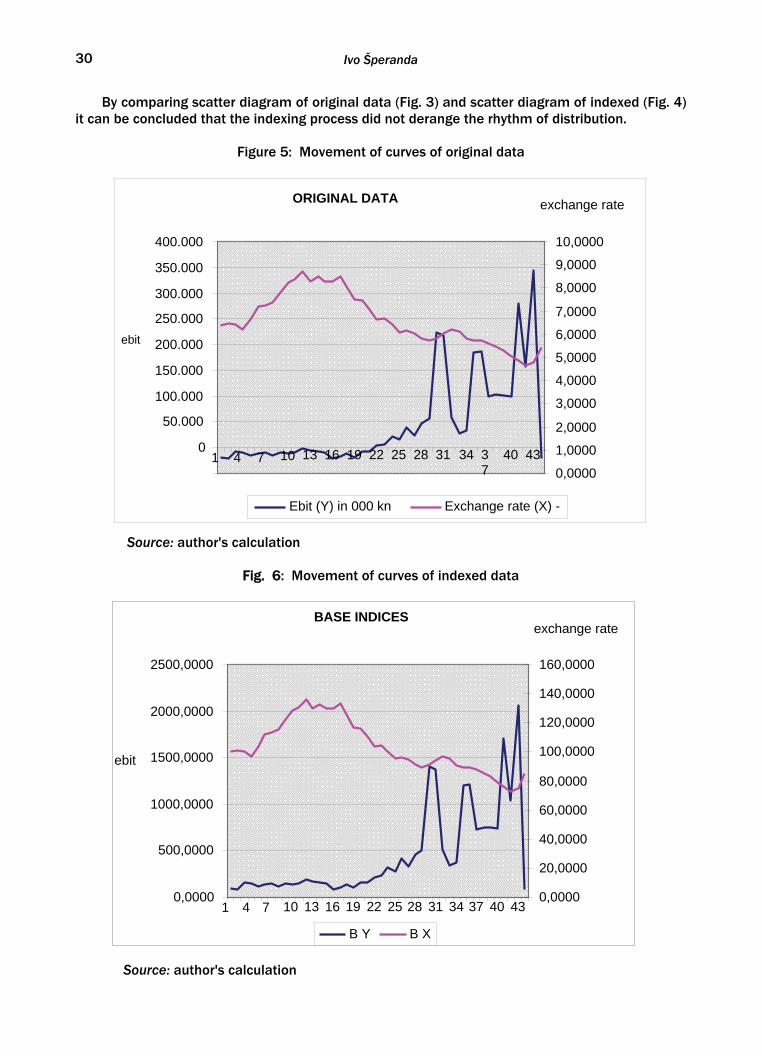
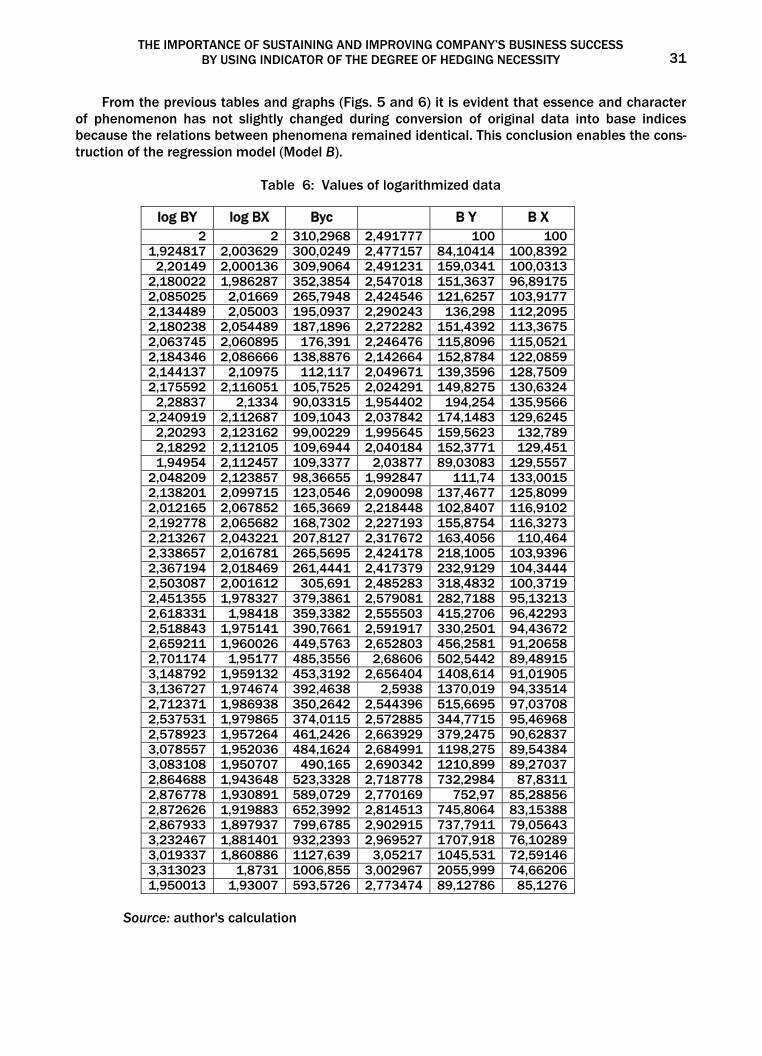
By comparing scatter diagram of original data (Fig. 3) and scatter diagram of indexed (Fig. 4) it can be concluded that the indexing process did not derange the rhythm of distribution.
Figure 5: Movement of curves of original data
Source: author's calculation
Fig. 6: Movement of curves of indexed data
Source: author's calculation
ORIGINAL DATA
0
50.000
100.000
150.000
200.000
250.000
300.000
350.000
400.000
1 4 7 10 13 16 19 22 25 28 31 34 37
40 43
ebit
0,0000
1,0000
2,0000
3,0000
4,0000
5,0000
6,0000
7,0000
8,0000
9,0000
10,0000
exchange rate
Ebit (Y) in 000 kn Exchange rate (X) -
BASE INDICES
0,0000
500,0000
1000,0000
1500,0000
2000,0000
2500,0000
1 4 7 10 13 16 19 22 25 28 31 34 37 40 43
ebit
0,0000
20,0000
40,0000
60,0000
80,0000
100,0000
120,0000
140,0000
160,0000
exchange rate
B Y B X
THE IMPORTANCE OF SUSTAINING AND IMPROVING COMPANY’S BUSINESS SUCCESS BY USING INDICATOR OF THE DEGREE OF HEDGING NECESSITY 31
From the previous tables and graphs (Figs. 5 and 6) it is evident that essence and character of phenomenon has not slightly changed during conversion of original data into base indices because the relations between phenomena remained identical. This conclusion enables the cons-truction of the regression model (Model B).
Table 6: Values of logarithmized data
log BY log BX Byc B Y B X 2 2 310,2968 2,491777 100 100
1,924817 2,003629 300,0249 2,477157 84,10414 100,8392 2,20149 2,000136 309,9064 2,491231 159,0341 100,0313
2,180022 1,986287 352,3854 2,547018 151,3637 96,89175 2,085025 2,01669 265,7948 2,424546 121,6257 103,9177 2,134489 2,05003 195,0937 2,290243 136,298 112,2095 2,180238 2,054489 187,1896 2,272282 151,4392 113,3675 2,063745 2,060895 176,391 2,246476 115,8096 115,0521 2,184346 2,086666 138,8876 2,142664 152,8784 122,0859 2,144137 2,10975 112,117 2,049671 139,3596 128,7509 2,175592 2,116051 105,7525 2,024291 149,8275 130,6324
2,28837 2,1334 90,03315 1,954402 194,254 135,9566 2,240919 2,112687 109,1043 2,037842 174,1483 129,6245
2,20293 2,123162 99,00229 1,995645 159,5623 132,789 2,18292 2,112105 109,6944 2,040184 152,3771 129,451 1,94954 2,112457 109,3377 2,03877 89,03083 129,5557
2,048209 2,123857 98,36655 1,992847 111,74 133,0015 2,138201 2,099715 123,0546 2,090098 137,4677 125,8099 2,012165 2,067852 165,3669 2,218448 102,8407 116,9102 2,192778 2,065682 168,7302 2,227193 155,8754 116,3273 2,213267 2,043221 207,8127 2,317672 163,4056 110,464 2,338657 2,016781 265,5695 2,424178 218,1005 103,9396 2,367194 2,018469 261,4441 2,417379 232,9129 104,3444 2,503087 2,001612 305,691 2,485283 318,4832 100,3719 2,451355 1,978327 379,3861 2,579081 282,7188 95,13213 2,618331 1,98418 359,3382 2,555503 415,2706 96,42293 2,518843 1,975141 390,7661 2,591917 330,2501 94,43672 2,659211 1,960026 449,5763 2,652803 456,2581 91,20658 2,701174 1,95177 485,3556 2,68606 502,5442 89,48915 3,148792 1,959132 453,3192 2,656404 1408,614 91,01905 3,136727 1,974674 392,4638 2,5938 1370,019 94,33514 2,712371 1,986938 350,2642 2,544396 515,6695 97,03708 2,537531 1,979865 374,0115 2,572885 344,7715 95,46968 2,578923 1,957264 461,2426 2,663929 379,2475 90,62837 3,078557 1,952036 484,1624 2,684991 1198,275 89,54384 3,083108 1,950707 490,165 2,690342 1210,899 89,27037 2,864688 1,943648 523,3328 2,718778 732,2984 87,8311 2,876778 1,930891 589,0729 2,770169 752,97 85,28856 2,872626 1,919883 652,3992 2,814513 745,8064 83,15388 2,867933 1,897937 799,6785 2,902915 737,7911 79,05643 3,232467 1,881401 932,2393 2,969527 1707,918 76,10289 3,019337 1,860886 1127,639 3,05217 1045,531 72,59146 3,313023 1,8731 1006,855 3,002967 2055,999 74,66206 1,950013 1,93007 593,5726 2,773474 89,12786 85,1276
Source: author's calculation
THE
IMP
OR
TAN
CE
OF
SUST
AIN
ING
AN
D IM
PR
OVI
NG
CO
MP
AN
Y’S
BU
SIN
ESS
SUC
CES
S
BY
USI
NG
IND
ICA
TOR
OF
THE
DEG
REE
OF
HED
GIN
G N
ECES
SITY
1
Ta
ble
7:
Reg
ress
ion
anal
ysis
indi
ces
Sum
mar
y O
utpu
t - R
egre
ssio
n S
tati
stic
s
Mul
tiple
R
0,7
48
83
27
99
R
Squ
are
0,5
60
75
05
61
A
djus
ted
R S
quar
e 0
,55
02
92
24
1
Stan
dard
Err
or
0,2
70
15
79
28
O
bser
vatio
ns
44
S
ourc
e: a
utho
r's c
alcu
latio
n
Tabl
e 8
: S
tatis
tical
ana
lysi
s of
mod
el d
ata
/A
NO
VA/
AN
OVA
df
S
S
MS
F
Sig
nific
ance
F
R
egre
ssio
n 1
3
,91
33
00
75
3
,91
33
01
5
3,6
17
7
5,0
44
9E-
09
Res
idua
l 4
2
3,0
65
38
28
6
0,0
72
98
5
To
tal
43
6
,97
86
83
6
Co
effic
ient
s St
anda
rd E
rror
t S
tat
P-va
lue
Low
er 9
5%
Uppe
r 95%
Lo
wer
95,
0%
Uppe
r 95,
0%
Inte
rcep
t 1
0,5
48
35
1
,10
55
58
05
9
,54
11
99
4
,5E-
12
8
,31
72
43
35
3
12
,77
94
56
2
8,3
17
24
33
5
12
,77
94
56
lo
g B
X -4
,02
82
86
0
,55
01
31
39
-7
,32
24
1
5E-
09
-5
,13
84
96
35
-2
,91
80
76
2
-5,1
38
49
63
5
-2,9
18
07
6
Sour
ce: a
utho
r's c
alcu
lati
on
The
valu
e of
est
imat
ed p
aram
eter
s ca
n be
det
erm
ined
upo
n pr
evio
us a
naly
sis.
Reg
ress
ion
(
MO
DEL
B)
(2)
Whe
re:
Y=va
lues
of E
BIT
x=
US
D/K
N e
xcha
nge
rate
α
= p
aram
eter
β=
par
amet
er
xY
xY
log
log
log
⋅+
=⋅=
βα
αβ
THE IMPORTANCE OF SUSTAINING AND IMPROVING COMPANY’S BUSINESS SUCCESS BY USING INDICATOR OF THE DEGREE OF HEDGING NECESSITY 33
Value of parameters is expressed as follows:
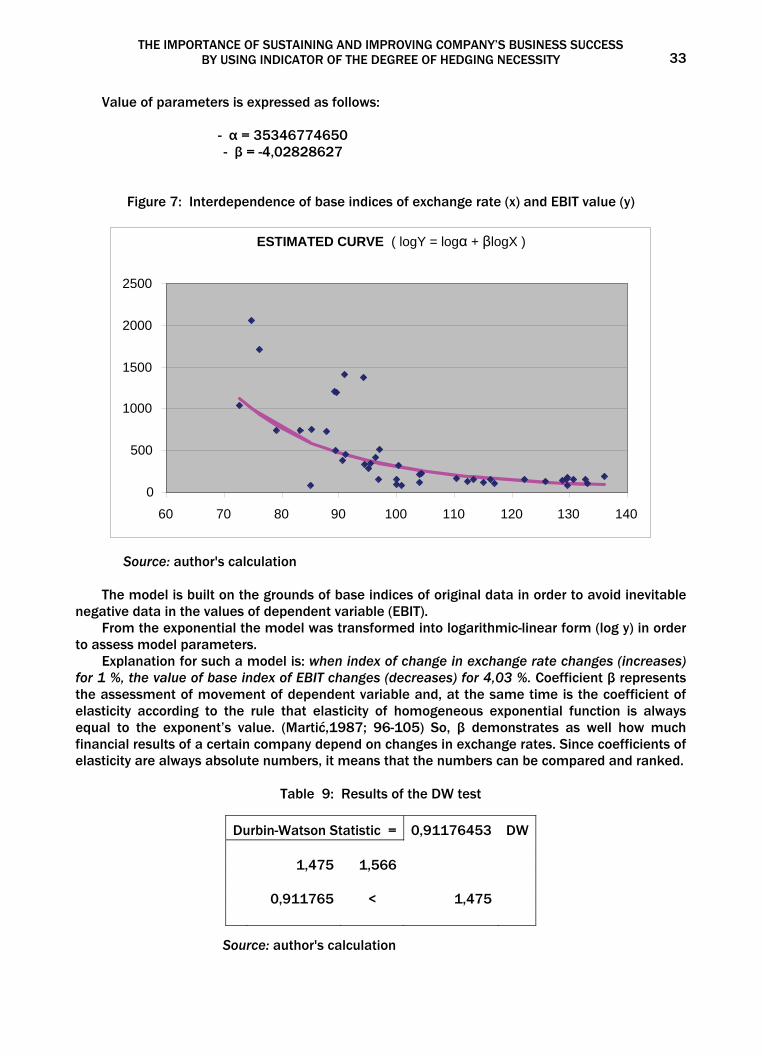
- α = 35346774650 - β = -4,02828627
Figure 7: Interdependence of base indices of exchange rate (x) and EBIT value (y)
Source: author's calculation
The model is built on the grounds of base indices of original data in order to avoid inevitable negative data in the values of dependent variable (EBIT).
From the exponential the model was transformed into logarithmic-linear form (log y) in order to assess model parameters.
Explanation for such a model is: when index of change in exchange rate changes (increases) for 1 %, the value of base index of EBIT changes (decreases) for 4,03 %. Coefficient β represents the assessment of movement of dependent variable and, at the same time is the coefficient of elasticity according to the rule that elasticity of homogeneous exponential function is always equal to the exponent’s value. (Martić,1987; 96-105) So, β demonstrates as well how much financial results of a certain company depend on changes in exchange rates. Since coefficients of elasticity are always absolute numbers, it means that the numbers can be compared and ranked.
Table 9: Results of the DW test
Durbin-Watson Statistic = 0,91176453 DW 1,475 1,566 0,911765 < 1,475
Source: author's calculation
ESTIMATED CURVE ( logY = logα + βlogX )
0
500
1000
1500
2000
2500
60 70 80 90 100 110 120 130 140
Ivo Šperanda 34
Since there is a time sequence in this model, the apparition of autocorrelation, which in this case is around 0,91176 was expected. Since the values of DW test are in the range of 0 to 4, and the size of indicator is less than 2 (DW≤2), the presence of autocorrelation is obvious, but can be tolerated.
Coefficient of determination is 0,5608, which point to the fact that more than 56 % of varia-tions of dependent variable is explained by the changes of independent variable. In other words, the changes in exchange rate caused the 56 % of changes in the EBIT values.
It can be concluded that the changes in exchange rate affect the financial results (Cash-Flow), i.e. EBIT. How and how much? It is the indicator β that answers those questions, while coef-ficient of determination answers the question about the size of protection, i.e. whether hedging is successful.
General form of the model expressed as: βα xy ⋅= (3)
answers the above questions, but each company needs to do its own calculation in order to get quality parameters and reliable answers.
Coefficient of determination (R2) is squared coefficient of correlation (r) and it indicates model quality. In this concrete case we are dealing with the profit and loss account, i.e. cash flow and analysis of the way one size ($/Kn) affects the other (EBIT). Since EBIT is composite measure influenced by large number of factors (price policy, investment policy, company’s size, activities, market share, human resources, technical equipment, tax policy etc.) value of coefficient of determination R2 ≥ 0,33 can be acceptable, i.e. that r ≥ 0,57 which denotes the relationship between variables is at least of middle strength.v
This individual model is used to determine the value of base parameters R2 and β which demonstrate strength and quality of protection, i.e. hedging.
Mathematical form of parameters is: β is both exponent in model function and coefficient of elasticityvi, i.e. Ey,x = β
Mathematically, β is expressed as: log/βα xy ⋅= (4)
xy logloglog ⋅+= βα
αβ logloglog +−=⋅− yx
αβ logloglog −=⋅ yx
x
ylog
loglog αβ −= (5)
R2 is in fact the squared coefficient of correlation, i.e. ratio of the sum of the square of deviation explained by regression and sum of squared of total deviationsvii, or in mathematical formula:
( )( )
120
1
1ˆ
2 ,2
2
≤≤∑=
−
∑=
−= Rn
iyiy
n
iyiy
R (6)
4. INDICATOR OF THE DEGREE OF HEDGING NECESSITY |Z|
Previous example showed the meaning of coefficient of determination and coefficient of elasticity. Both indicators demonstrate the relationship between the observed variables and the way and to which extent the independent variable affects the dependent one.
Product of those two coefficients demonstrates how important it is to protect (to hedge) the dependent variable against the changes in independent variable, in this concrete case to protect the EBIT against changes in exchange rate.
THE IMPORTANCE OF SUSTAINING AND IMPROVING COMPANY’S BUSINESS SUCCESS BY USING INDICATOR OF THE DEGREE OF HEDGING NECESSITY 35
Consequently: β×= 2RZ (7)
The meaning of symbols in the above relation is: IZI relates to the degree of hedging necessity; R2 is the coefficient of determination or the ratio of explained and total deviations; β is coefficient of elasticity. Detailed mathematical explanation of the above relation, by using the relations number (5)and (6) is:
Zx
y
yy
yy
n
ii
n
ii
=−
⋅−
−
∑
∑
=
=
log)log(log
)(
)ˆ(
1
2
1
2
α (8)
Indicator IZI is synthetic absolute indicator representing the product of quotient of sum of
squares of deviations of estimated values in relation to arithmetic mean and sum of squares of deviation of original results in relation to arithmetic mean of regression model and coefficient of elasticity of homogeneous function, as it is obvious that Y increases / decreases when X increa-ses / decreases, even more intensively when β is bigger.
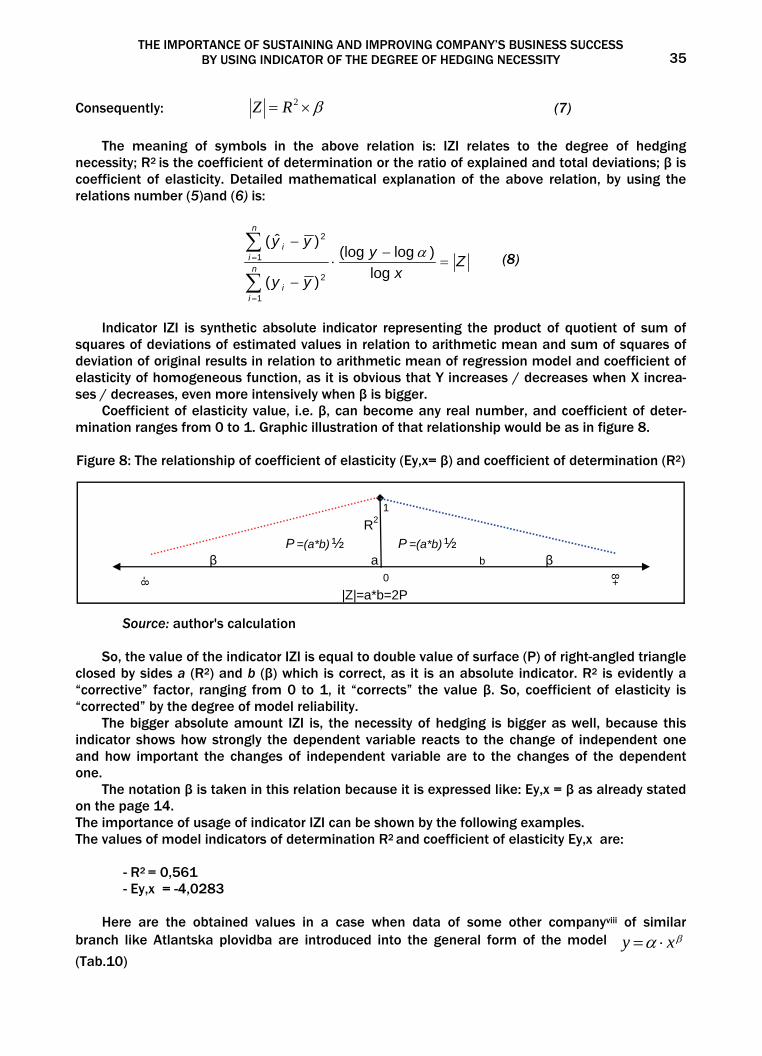
Coefficient of elasticity value, i.e. β, can become any real number, and coefficient of deter-mination ranges from 0 to 1. Graphic illustration of that relationship would be as in figure 8. Figure 8: The relationship of coefficient of elasticity (Ey,x= β) and coefficient of determination (R2)
1
R2
P =(a*b) ½ P =(a*b) ½β a b β
-8 0
8+
|Z|=a*b=2P
Source: author's calculation
So, the value of the indicator IZI is equal to double value of surface (P) of right-angled triangle closed by sides a (R2) and b (β) which is correct, as it is an absolute indicator. R2 is evidently a “corrective” factor, ranging from 0 to 1, it “corrects” the value β. So, coefficient of elasticity is “corrected” by the degree of model reliability.
The bigger absolute amount IZI is, the necessity of hedging is bigger as well, because this indicator shows how strongly the dependent variable reacts to the change of independent one and how important the changes of independent variable are to the changes of the dependent one.
The notation β is taken in this relation because it is expressed like: Ey,x = β as already stated on the page 14. The importance of usage of indicator IZI can be shown by the following examples. The values of model indicators of determination R2 and coefficient of elasticity Ey,x are:
- R2 = 0,561 - Ey,x = -4,0283
Here are the obtained values in a case when data of some other companyviii of similar branch like Atlantska plovidba are introduced into the general form of the model βα xy ⋅=
(Tab.10)
Ivo Šperanda 36
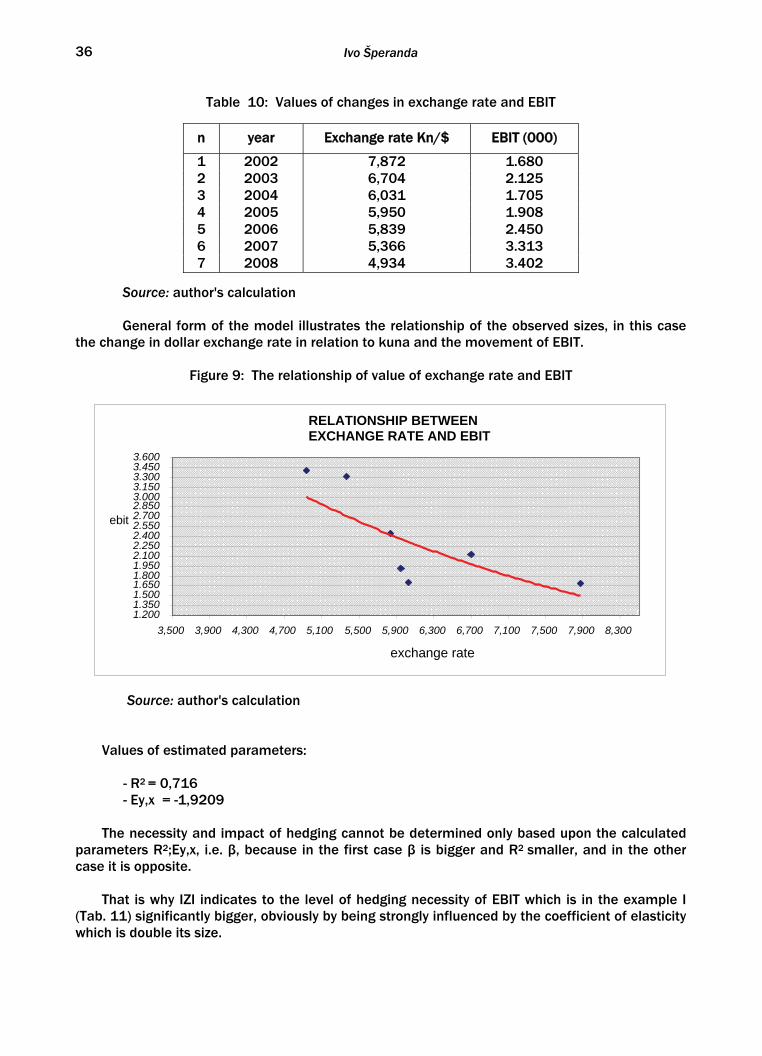
Table 10: Values of changes in exchange rate and EBIT
n year Exchange rate Kn/$ EBIT (000)
1 2002 7,872 1.680 2 2003 6,704 2.125 3 2004 6,031 1.705 4 2005 5,950 1.908 5 2006 5,839 2.450 6 2007 5,366 3.313 7 2008 4,934 3.402
Source: author's calculation
General form of the model illustrates the relationship of the observed sizes, in this case
the change in dollar exchange rate in relation to kuna and the movement of EBIT.
Figure 9: The relationship of value of exchange rate and EBIT
Source: author's calculation
Values of estimated parameters:
- R2 = 0,716 - Ey,x = -1,9209
The necessity and impact of hedging cannot be determined only based upon the calculated
parameters R2;Ey,x, i.e. β, because in the first case β is bigger and R2 smaller, and in the other case it is opposite.
That is why IZI indicates to the level of hedging necessity of EBIT which is in the example I
(Tab. 11) significantly bigger, obviously by being strongly influenced by the coefficient of elasticity which is double its size.
RELATIONSHIP BETWEEN EXCHANGE RATE AND EBIT
1.200 1.350 1.500 1.650 1.800 1.950 2.100 2.250 2.400 2.550 2.700 2.850 3.000 3.150 3.300 3.450 3.600
3,500 3,900 4,300 4,700 5,100 5,500 5,900 6,300 6,700 7,100 7,500 7,900 8,300
exchange rate
ebit
THE IMPORTANCE OF SUSTAINING AND IMPROVING COMPANY’S BUSINESS SUCCESS BY USING INDICATOR OF THE DEGREE OF HEDGING NECESSITY 37
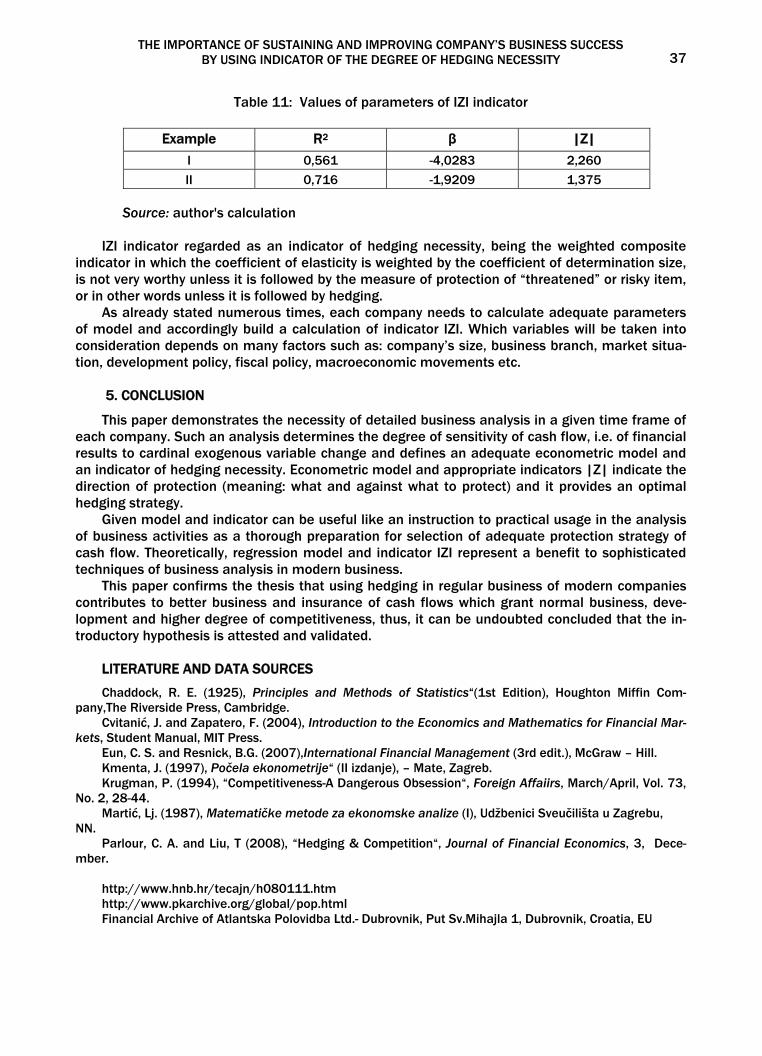
Table 11: Values of parameters of IZI indicator
Example R2 β |Z|
I 0,561 -4,0283 2,260
II 0,716 -1,9209 1,375
Source: author's calculation
IZI indicator regarded as an indicator of hedging necessity, being the weighted composite indicator in which the coefficient of elasticity is weighted by the coefficient of determination size, is not very worthy unless it is followed by the measure of protection of “threatened” or risky item, or in other words unless it is followed by hedging.
As already stated numerous times, each company needs to calculate adequate parameters of model and accordingly build a calculation of indicator IZI. Which variables will be taken into consideration depends on many factors such as: company’s size, business branch, market situa-tion, development policy, fiscal policy, macroeconomic movements etc.
5. CONCLUSION
This paper demonstrates the necessity of detailed business analysis in a given time frame of each company. Such an analysis determines the degree of sensitivity of cash flow, i.e. of financial results to cardinal exogenous variable change and defines an adequate econometric model and an indicator of hedging necessity. Econometric model and appropriate indicators |Z| indicate the direction of protection (meaning: what and against what to protect) and it provides an optimal hedging strategy.
Given model and indicator can be useful like an instruction to practical usage in the analysis of business activities as a thorough preparation for selection of adequate protection strategy of cash flow. Theoretically, regression model and indicator IZI represent a benefit to sophisticated techniques of business analysis in modern business.
This paper confirms the thesis that using hedging in regular business of modern companies contributes to better business and insurance of cash flows which grant normal business, deve-lopment and higher degree of competitiveness, thus, it can be undoubted concluded that the in-troductory hypothesis is attested and validated.
LITERATURE AND DATA SOURCES
Chaddock, R. E. (1925), Principles and Methods of Statistics“(1st Edition), Houghton Miffin Com-pany,The Riverside Press, Cambridge.
Cvitanić, J. and Zapatero, F. (2004), Introduction to the Economics and Mathematics for Financial Mar-kets, Student Manual, MIT Press.
Eun, C. S. and Resnick, B.G. (2007),International Financial Management (3rd edit.), McGraw – Hill. Kmenta, J. (1997), Počela ekonometrije“ (II izdanje), – Mate, Zagreb. Krugman, P. (1994), “Competitiveness-A Dangerous Obsession“, Foreign Affaiirs, March/April, Vol. 73,
No. 2, 28-44. Martić, Lj. (1987), Matematičke metode za ekonomske analize (I), Udžbenici Sveučilišta u Zagrebu,
NN. Parlour, C. A. and Liu, T (2008), “Hedging & Competition“, Journal of Financial Economics, 3, Dece-
mber. http://www.hnb.hr/tecajn/h080111.htm http://www.pkarchive.org/global/pop.html Financial Archive of Atlantska Polovidba Ltd.- Dubrovnik, Put Sv.Mihajla 1, Dubrovnik, Croatia, EU

Ivo Šperanda 38
Notes
i Kuna (HRK) is Croatian currency ii By courtesy of the authorized in Atlantska plovidba Ltd – Dubrovnik, the author got plenty of valuable informa-
tion and the approval for their publishing. iii Atlantska plovidba Ltd. no longer owns a company for air transport since October 2011. iv Available tools of Microsoft Office package are used in this paper for the statistical analysis. v See: Chaddock R.E.: „Principles and Methods of Statistics“ (1st Edition)- Houghton Miffin Company,The Riverside
Press Cambridge, 1925. p.248; p.303 vi Proof can be found by looking at: Martić Lj.: “Matematičke metode za ekonomske analize (I)“- Udžbenici Sveu-
čilišta u Zagrebu, NN,1987. p.100. vii See, for an exemple: Kmenta J.: “Počela ekonometrije“ (II izdanje)-Mate d.o.o., Zagreb, 1997.p.240-242. viii In this case the author did not get the company’s approval to publish its name along the data
ECONOMIC POLICY FOR REAL SECTOR AND R&D FINANCING: BASIC INSTITUTIONAL MODELS1
SVETLANA KIRDINA2
ABSTRACT
The paper considers institutional models that define the macroeconomic policies for real sector financing as well as the R&D financing serving further as a technological base for real sector development in various nation-states. The hypothesis is tested that two institutional models in these spheres could be singled out, so called “a state as the main investor” and “a state as the regulator”. To check this hypothesis, data about the 20-year dynamics of financing in Russia (and China) and in the USA are used. Institutional matrices theory, or X- and Y-theory (Kirdina, 2012) is used to explain the differences. In this regard, a reflection of the investment characteristics in national statistics of the two countries due to institutional differences is also discussed.
KEY WORDS: real sector financing, R&D financing, finance institutions, Russia, China, the US
JEL Classification: B52, O43, P43, P52 Received: May 17, 2013 / Accepted: November 21, 2013
1. INTRODUCTION
It is impossible to reproduce the real sector of economy and the sphere of R&D, ensuring the eco-nomic growth, without mobilization of the relevant financial resources. Economic entities are pro-vided with the necessary financial funds through the activity of set of institutions that form vari-ous institutional models of financing of the real economy and R&D sector. To the greatest extent the differences between these models are determined by the ratio of the market and the gov-ernment institutions.
Generally, the study of economic growth in mainstream economics explicitly or implicitly as-sumes the domain of neoclassical market model where the growth is the product of innovation activity of competing companies. This assumption is deemed to be a fundamental truth. This ap-proach assumes that the government shall just search for the optimal level of interfering in the economy, which allows the whole economy to overcome all sorts of obstacles and traps for the stable economic growth.
At the same time, there is another point of view on the problem of the government, markets and economic growth. It is based on the fact that we need to examine carefully the empirical data in order to understand where and when government economic intervention is good, and where and when it is bad, as well as the way it affects the overall economic growth (Fligstein 2005).
The paper is aimed at identification of alternative institutional models of financing of the real sector and the R&D sector, ensuring economic growth and economic reproduction on the basis of empirical-statistical investigation, as well as analyzing the reasons of their operation. Two coun-tries, the Russian Federation (Russia) and the United States of America (the US), with traditionally
1 Thanks to Vladimir Mayevsky, Vitaly Manevich, and Mikhail Sokolov for valuable advice as well as Tatiana Shatalova, Elena Kamko, and Andrey Volynsky for help in the collection of statistical data and making calculations. Thanks to Julia Zimina (Dialect City Co, Moscow, Russia) and Dr. Gregory Sandstrom (the Social and Political Sciences Department of the European Humanities University, Lithuania) for careful work translating and editing this text. The reported study was supported by the Russian Foundation for Humanities, research project № 14-02-00422. 2 Department for Evolution of Social and Economic Systems, Institute of Economics of Russian Academy of Sciences, Moscow, Russia, E-mail: [email protected]
MONTENEGRIN JOURNAL OF ECONOMICS, Vol. 9, No. 4 (December 2013), 39-52
Svetlana Kirdina
40
opposed to each other ways of organizing of economic life have been chosen a priori for the analysis.
The paper is organized as follows: Section 2 provides an overview of the statistical data analysis. The results of the statistical comparison of the composition of investments made in the real sector of Russia and the US with view of sources and the property structure are given. In this case some features of the national statistical accounting systems of each country, affecting the results of the comparative analysis, are also considered. The result of this comparison is the con-clusion on the action of two different institutional models of financing of economic reproduction processes in the economies of Russia and the US - "state as an investor" and "state as a regula-tor", respectively, which are given in section 3. In order to explain the reason why in the analyzed countries prevail the identified models, the author uses the concept of X-and Y-institutional ma-trices. Its main provisions, the most significant in the present context, are given in section 4. The paper ends with the conclusions given in section 5.
2. STATISTICAL COMPARISON RESULTS
The term “institutional model” used in the article is understood as the structure of key institutions providing finance for a real sector as well as R&D sphere. They nominate the structure of major sources that invest in them. Fixed-asset investment is a main focus of the analysis. The data on fixed investment sources in the corporate sector of the US and Russian economies over the past 20 and 15 years respectively are used in the overview.
It is known that the comparison of fixed investment source structures in Russia and the US is made difficult by the different structure of data obtained by the Federal State Statistics Service of the Russian Federation (Rosstat) and the US Census Bureau.
The first difference concerns the composition of the enterprises examined. Thus there are data on fixed investment sources for companies of all forms of ownership (excluding small business entities) including profit and non-profit organizations in Russia. State and non-state property entities (private, state-owned, mixed, joint property, etc) are fused here. They include enterprises of all branches among them financial and agricultural enterprises (Мetodologicheskie polozheniya … , 2009).
As such the US statistic data has the investment sources structure represented for corporate, non-financial, non-agricultural sector (excluding individual businessmen and small enterprises), i.e. for a lesser range of economic entities as compared to the Russian data. However, the statis-tics used in Russia and the USA covers the bulk of the economic entities and therefore can be used for a comparative analysis of the major trends.
The second difference is related to the structure of sources and uses of financial funds. So, for the Russian enterprises analyzed statistics distinguishes accounting for fixed capital expendi-tures, highlighting internal and external sources. Internal sources structure includes profits after tax and dividends, capital consumption allowance and other equity capital. External sources in-clude bank loans, net new equity issues, high-level organizations’ assets, government (of all lev-els) budget funds, non-budgetary funds and foreign investments (Ibid.).
In turn, the structure of financial funds for the US corporate sector, the resources for the eco-nomic reproduction of the real sector clearly do not singled out. Internal (with the same structure) and external sources are singled out here as well. But in this case corporation investment includes fixed investment as well as financial investment. In our overview we took into consideration net increase in liabilities to evaluate “raised funds”. This “net increase” includes, on the one hand, net funds raised in markets with net new equity issues and credit market instruments, i.e. corporate bonds, bank loans, other loans and advances, trade payables, and on the other hand, “other issues” i.e. trade payables, miscellaneous liabilities, and foreign direct investment in the US etc.
As such, there are no such sources outlined (apparently due to being non-characteristic and insignificant) as high-level organizations’ assets and governments budget funds in the US statistic data for the corporate sector. However there are industrial revenue bonds (IRB) included in
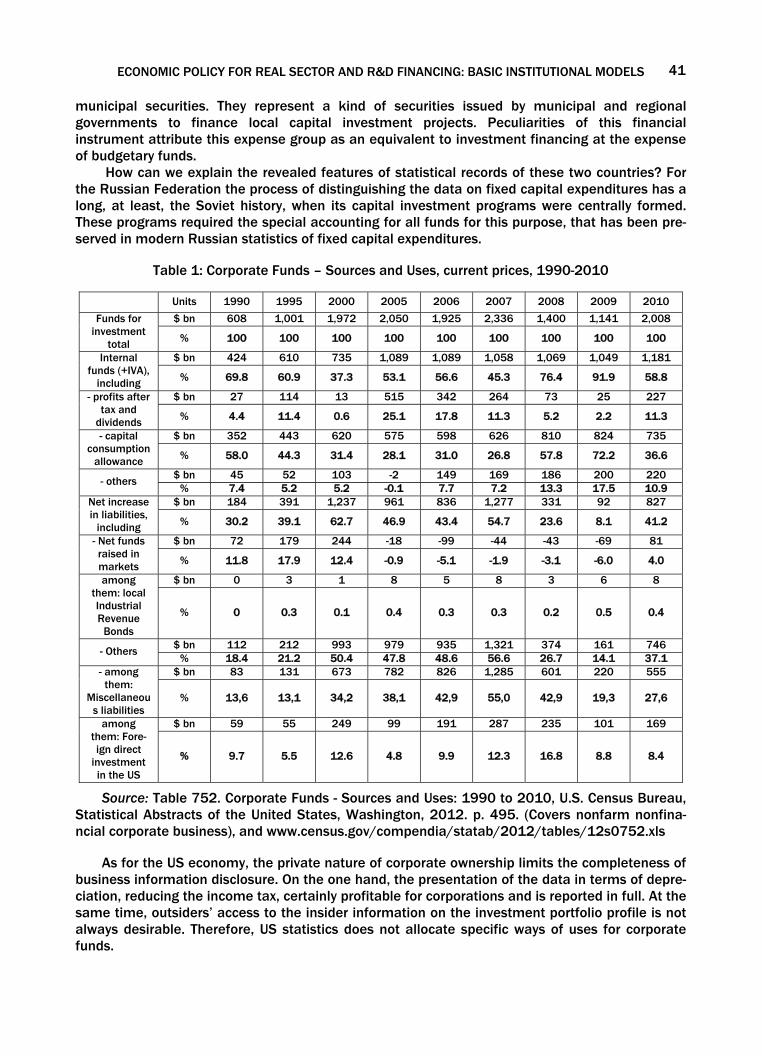
ECONOMIC POLICY FOR REAL SECTOR AND R&D FINANCING: BASIC INSTITUTIONAL MODELS
41
municipal securities. They represent a kind of securities issued by municipal and regional governments to finance local capital investment projects. Peculiarities of this financial instrument attribute this expense group as an equivalent to investment financing at the expense of budgetary funds.
How can we explain the revealed features of statistical records of these two countries? For the Russian Federation the process of distinguishing the data on fixed capital expenditures has a long, at least, the Soviet history, when its capital investment programs were centrally formed. These programs required the special accounting for all funds for this purpose, that has been pre-served in modern Russian statistics of fixed capital expenditures.
Table 1: Corporate Funds – Sources and Uses, current prices, 1990-2010
Source: Table 752. Corporate Funds - Sources and Uses: 1990 to 2010, U.S. Census Bureau, Statistical Abstracts of the United States, Washington, 2012. p. 495. (Covers nonfarm nonfina-ncial corporate business), and www.census.gov/compendia/statab/2012/tables/12s0752.xls
As for the US economy, the private nature of corporate ownership limits the completeness of
business information disclosure. On the one hand, the presentation of the data in terms of depre-ciation, reducing the income tax, certainly profitable for corporations and is reported in full. At the same time, outsiders’ access to the insider information on the investment portfolio profile is not always desirable. Therefore, US statistics does not allocate specific ways of uses for corporate funds.
Units 1990 1995 2000 2005 2006 2007 2008 2009 2010
$ bn 608 1,001 1,972 2,050 1,925 2,336 1,400 1,141 2,008 Funds for investment
total % 100 100 100 100 100 100 100 100 100
$ bn 424 610 735 1,089 1,089 1,058 1,069 1,049 1,181 Internal funds (+IVA),
including % 69.8 60.9 37.3 53.1 56.6 45.3 76.4 91.9 58.8
$ bn 27 114 13 515 342 264 73 25 227 - profits after tax and
dividends % 4.4 11.4 0.6 25.1 17.8 11.3 5.2 2.2 11.3
$ bn 352 443 620 575 598 626 810 824 735 - capital consumption
allowance % 58.0 44.3 31.4 28.1 31.0 26.8 57.8 72.2 36.6
$ bn 45 52 103 -2 149 169 186 200 220 - others % 7.4 5.2 5.2 -0.1 7.7 7.2 13.3 17.5 10.9
$ bn 184 391 1,237 961 836 1,277 331 92 827 Net increase in liabilities,
including % 30.2 39.1 62.7 46.9 43.4 54.7 23.6 8.1 41.2
$ bn 72 179 244 -18 -99 -44 -43 -69 81 - Net funds raised in markets % 11.8 17.9 12.4 -0.9 -5.1 -1.9 -3.1 -6.0 4.0
$ bn 0 3 1 8 5 8 3 6 8 among them: local Industrial Revenue
Bonds
% 0 0.3 0.1 0.4 0.3 0.3 0.2 0.5 0.4
$ bn 112 212 993 979 935 1,321 374 161 746 - Others % 18.4 21.2 50.4 47.8 48.6 56.6 26.7 14.1 37.1
$ bn 83 131 673 782 826 1,285 601 220 555 - among them:
Miscellaneous liabilities
% 13,6 13,1 34,2 38,1 42,9 55,0 42,9 19,3 27,6
$ bn 59 55 249 99 191 287 235 101 169 among them: Fore-ign direct
investment in the US
% 9.7 5.5 12.6 4.8 9.9 12.3 16.8 8.8 8.4
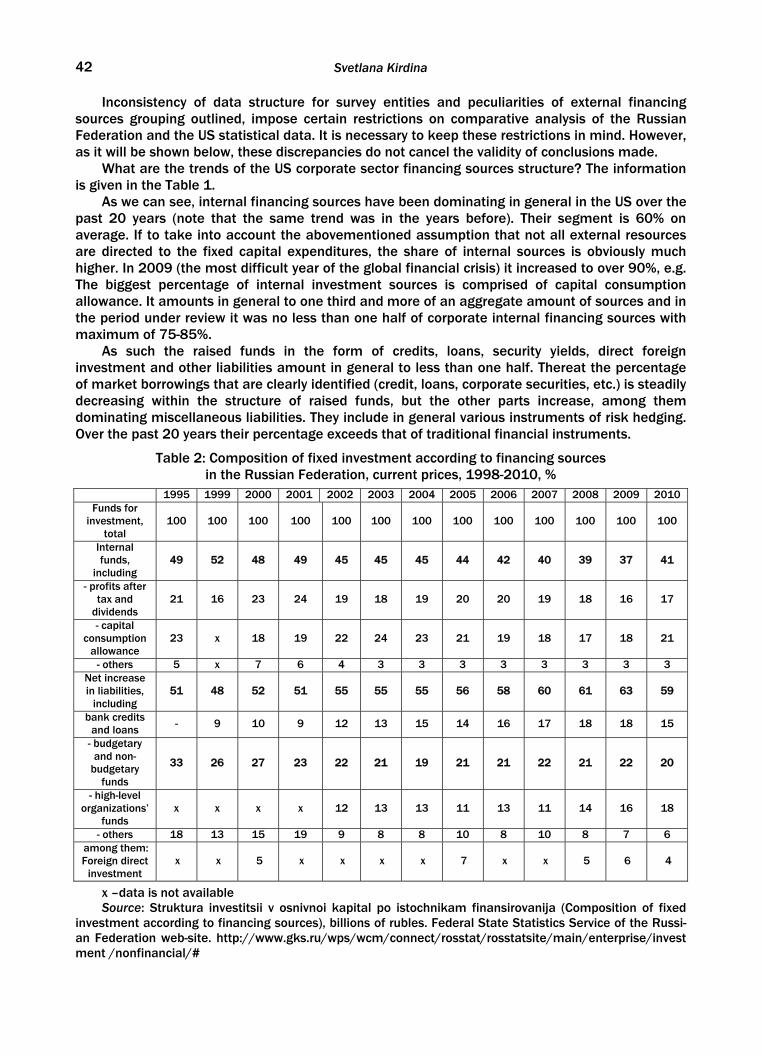
Svetlana Kirdina
42
Inconsistency of data structure for survey entities and peculiarities of external financing sources grouping outlined, impose certain restrictions on comparative analysis of the Russian Federation and the US statistical data. It is necessary to keep these restrictions in mind. However, as it will be shown below, these discrepancies do not cancel the validity of conclusions made.
What are the trends of the US corporate sector financing sources structure? The information is given in the Table 1.
As we can see, internal financing sources have been dominating in general in the US over the past 20 years (note that the same trend was in the years before). Their segment is 60% on average. If to take into account the abovementioned assumption that not all external resources are directed to the fixed capital expenditures, the share of internal sources is obviously much higher. In 2009 (the most difficult year of the global financial crisis) it increased to over 90%, e.g. The biggest percentage of internal investment sources is comprised of capital consumption allowance. It amounts in general to one third and more of an aggregate amount of sources and in the period under review it was no less than one half of corporate internal financing sources with maximum of 75-85%.
As such the raised funds in the form of credits, loans, security yields, direct foreign investment and other liabilities amount in general to less than one half. Thereat the percentage of market borrowings that are clearly identified (credit, loans, corporate securities, etc.) is steadily decreasing within the structure of raised funds, but the other parts increase, among them dominating miscellaneous liabilities. They include in general various instruments of risk hedging. Over the past 20 years their percentage exceeds that of traditional financial instruments.
Table 2: Composition of fixed investment according to financing sources in the Russian Federation, current prices, 1998-2010, %
1995 1999 2000 2001 2002 2003 2004 2005 2006 2007 2008 2009 2010 Funds for
investment, total
100 100 100 100 100 100 100 100 100 100 100 100 100
Internal funds,
including 49 52 48 49 45 45 45 44 42 40 39 37 41
- profits after tax and
dividends 21 16 23 24 19 18 19 20 20 19 18 16 17
- capital consumption
allowance 23 x 18 19 22 24 23 21 19 18 17 18 21
- others 5 x 7 6 4 3 3 3 3 3 3 3 3 Net increase in liabilities,
including 51 48 52 51 55 55 55 56 58 60 61 63 59
bank credits and loans - 9 10 9 12 13 15 14 16 17 18 18 15
- budgetary and non-
budgetary funds
33 26 27 23 22 21 19 21 21 22 21 22 20
- high-level organizations’
funds x х х х 12 13 13 11 13 11 14 16 18
- others 18 13 15 19 9 8 8 10 8 10 8 7 6 among them: Foreign direct
investment x х 5 х х х х 7 х х 5 6 4
x –data is not available Source: Struktura investitsii v osnivnoi kapital po istochnikam finansirovanija (Composition of fixed
investment according to financing sources), billions of rubles. Federal State Statistics Service of the Russi-an Federation web-site. http://www.gks.ru/wps/wcm/connect/rosstat/rosstatsite/main/enterprise/invest ment /nonfinancial/#
ECONOMIC POLICY FOR REAL SECTOR AND R&D FINANCING: BASIC INSTITUTIONAL MODELS
43
The level of foreign investment in the US corporate sector is at 10% on average. The per-centage of a budgetary fund counterpart such as industrial revenue bonds amounts to less than 1%.
The data on composition of fixed investment in the Russian Federation demonstrate to a certain degree the opposite (Table 2).
“Foreign direct investment” criterion, see: Investitsi v Rossiiskoi Federazii v 2011, (Invest-ment in the Russian Federation in 2011) The table: Struktura investizii v osnovnoi capital po is-tochnikam finansirovanija (Composition of fixed investment according to financing sources.)
First, there is a different ratio of internal and external fixed investment in Russia: it is on average 45% vs. 55%. In other words if the most part of real sector investment in the US is comprised of equity capital, the situation in Russia is completely reversed, that is more than a half of investment comes from external sources.
The second difference is a weak role of capital consumption allowance: while it is the biggest part of corporate equity capital used for real sector financing in the US, in the Russian Federation it amounts to less than a half. As a result capital consumption allowance in the whole fixed investment structure of Russian economic entities does not amount to 50% as in the US but in fact amounts to barely one fifth of assets used for these purposes.
The third difference deals with the external investment sources composition and quantitative difference in their structure. There is a predominant source in Russia; it involves central distribution from state budgets of different levels and non-budgetary state funds. It steadily surpasses the market raised funds. Thereat the percentage of credits and similar instruments is at the same time gradually increasing, and the percentage of government subsidies is slightly decreasing.
Peculiar to the Russian Federation is such source of investment as high-level organizations’ funds. Their percentage is gradually increasing that makes them as significant in investment as capital consumption allowance, profit, budget funds and credit market instruments.
The final difference is the percentage of direct foreign investment that is twice as low in the Russian Federation as in the US and amounts to more than 5%.
To better understand the outlined differences let’s compare the investment of the Russian Federation and of the US in terms of property forms although statistical views for property forms in the Russian Federation and in the US are not completely identical. First, let’s see the US related statistics.
The proprietary structure in the US includes two principal forms: state, or government property (federal, regional and local governments) and private property. Fixed investment data are represented in this very structure.
As it can be seen in the Table 3 the percentage of the state, or government sector in gross fixed investment was between 16% and 23% over the years.
Table 3: Gross fixed investment in the US, 2003-2010, %
2003 2004 2005 2006 2007 2008 2009 2010
Private sector 82.8 83.7 84.4 84.2 82.9 81.0 77.2 77.4 Government
sector 1 7.2 16.3 15.6 15.8 17.1 19.0 22.8 22.6
Source: Table 5.9. Changes in Net Stock of Produced Assets (Fixed Assets and Inventories)
taken from Bureau of Economic Analysis, U.S. Department of Commerce web-site. http://www. bea.gov/iTable/iTable.cfm?reqid=9&step=3&isuri=1&903=177
Fixed investment structure of the two sectors reflects the percentage of state and private
sectors in joint fixed assets of a country. Persistent data show that main state sector funds
Svetlana Kirdina
44
percentage after the Great Depression (when the percentage amounted to 14-15%) was not more than 23%. As the state sector is represented only by governments of all levels (federal, state and local governments), it is clearly seen that the USA corporate sector is represented mainly by private enterprises. It is one of the reasons for practical absence of government subsidies in the USA corporate funds, we suppose.
As for the Russian Federation peculiarities it has a far more complex structure of property. There are 26 basic forms of property within the country according to the All-Russian Classifier of Property Forms introduced on the 1st of January 2000. One more form has been distinguished among federal property forms starting from 2010 – it is state corporation property. Fixed investment data based on property types in Russia is shown in the Table 4.
Table 4: Fixed investment in the Russian Federation, based on property types*, % 2000 2001 2002 2003 2004 2005 2006 2007 2008 2009 2010 2011
Funds for investment,
total 100 100 100 100 100 100 100 100 100 100 100 100
- state property 27 25 22 24 19 21 21 20 20 21 18 17
- municipal property 6 6 5 6 4 4 4 4 4 4 3 3
- private property 34 42 47 47 52 51 53 56 56 60 62 61
- mixed property (no
foreign participation)
32 25 21 19 18 15 13 12 11 8 9 12
- state cor-poration property
- - - - - - - - - - 1 2
- joint pro-perty (with foreign par-ticipation)
1 2 5 4 7 9 9 8 9 7 7 5
* Foreign property percentage between 12% in the beginning of 2000’s and 6-8% in 2009 – 2011 was excluded from the overview.
Source: Investitsii v osnovnoii kapital v Rossiiskoi Federatsii po formam sobstvennosti (Fixed investment in the Russian Federation based on property types, current prices), billions of rubles. Federal State Statistics Service of the Russian Federation web-site. http://www.gks.ru/wps/ wcm/connect/rosstat/rosstatsite/main/enterprise/investment/nonfinancial/#
First, it is obvious that the percentage of fixed investment in state property enterprises (20% average) is almost equal to budgetary funds and non-budgetary state funds percentage in investment over the same period as shown in the table 2. Moreover, the trend is similar as well. That is why it is quite reasonable to assume that state funds are invested predominantly in state enterprises.
Second, the presence of property types other than state and private property stands out. First of all it is mixed and joint enterprise property types with fixed investment over the years from one fourth to one fifth of the total investment amount. What is the reason for them being singled out? Is the only reason the transitional character of the Russian economy? But there is no such struc-ture nowadays in the Eastern Europe countries that moved over as Russia from «socialism to capitalism» – their statistics on the matters discussed strictly reproduce that of the US3. 3 It is characteristic that unlike western neighboring countries of the Russian Federation, the statistics of the People’s Republic of China points out the same property types. The large-sized grouping includes state, municipal, private, mixed Chinese, joint Chinese and foreign property (Chung 2010, p. 13).
ECONOMIC POLICY FOR REAL SECTOR AND R&D FINANCING: BASIC INSTITUTIONAL MODELS
45
Ambiguity of property types in the Russian Federation has a long history and reflects one of the major civil law problems, still not solved, that is based on the understanding of a legal entity meaning. The modern Russian textbooks on the civil law theory state that in the Russian Federa-tion “the question of a legal entity meaning is still open” (Status juriducheskikh lits, 2006, p. 6). Moreover the authors point that there is no significant advancement in the Russian civil law sci-ence (Tolstoy 2000, p. 103).
We think that the main difficulties are linked with a persistent inability to isolate economic and proprietary rights of any entity from state participation. There are theories prevailing in the global practice that compare legal entity with separate estate. If estate owners of any legal form are private individuals then these legal entities make up private proprietors. If the owners are government bodies of different levels (from the upper, federal, to the lower, municipal) then such kind of property is governmental. However, it has not been possible to separate property in such an obvious way over the whole period of the Russian history due to the fact that “the state prop-erty even with some legal entity based on it remained the state property anyway” (Status ju-riducheskikh lits, 2006, p. 4). In the USSR the way out of this juridical dead end was the theory of two-level state property proposed by Anatolii V. Venediktov (Venediktov 1940; 1948, p. 657-672) and supported by Sergei N. Bratus’ (1947), Olympiad S. Ioffe (1958) and many other civilists (Grazhdanskoe pravo 1998, p. 176). According to this theory “the juridical personality of a legal entity is based not only on the unity of state property but on operative administration of its parts as well” (Legal Entity Status (Status juriducheskikh lits 2006, p. 4). In other words at the upper level the unity of the state property was preserved that is belonging to the Soviet state and all the Soviet people was fixed. At the second level the right of operative administration was given to different legal entities that were able to enter legal relationship with each other.
During market-based reforms in Russia at the end of the 20th century and in the beginning of the 21st century as shown in the statistics the property types could not be fully segregated onto private and state (government) types due to, as we can see, a number of intermediate types. Moreover we think that the statistics have become complicated and inconsistent probably due to being oriented at the set political priorities.
According to official statistics, the share of investments in privately owned enterprises in the Russian Federation now makes 61%, compared to 77% in the US. In this case, if the US economy share of the latter is decreased in the last decade, then the Russian share, on the contrary, is growing. Does this mean that there is a corresponding decrease in the share and the impact of the government institutions in the investment process? Detailed analysis of the organization of statistical accounting in modern Russian Federation forces to put this statement in doubt.
Firstly, the structure of the property with the government participation becomes more repre-senting: it includes the share of state-owned corporations.
Secondly, pursuant to the overview of the rules of Property type code assignment being in ef-fect on the territory of the Russian Federation (Instruktsija o porjadke ucheta juridicheskikh lits… 2001), sometimes private property is not always private in every sense of this word. For example, mixed property types include those founded by parties with governmental (federal, regional, municipal) and other structures, according to these rules. But if legal entities with any type of mixed property found other economic entities, the latter are considered as private property enterprises (Ibidem, Part 1, cl. 4.6.24). It is obvious that in such cases the function of the first-order founders (governmental structures) is preserved though officially this organization is recognized in statistics as private property.
The third example is the property codification of joint stock companies established in the course of privatization with a golden share in state property. According to the rules mentioned, such companies are identified as one of mixed property types (Ibidem), though it is more correct to identify it as modified state property.
Fourthly, the joint (with foreign participation) property includes enterprises established not only by private but also public institutions with foreign capital.
Taking into consideration the foregoing it is possible to assume that the official statistics on
Svetlana Kirdina
46
the actual role of state funds in real sector financing are underrated in Russia. The differences revealed in the financing channels of the real sector in the US and the Rus-
sian Federation allow to single out the two institutional models of the economic reproduction, which can be called "state as a regulator" in the first case and "state as an investor" - in the sec-ond. In the first model, the investment resources are concentrated in the business community, and the main task of government is to create conditions encouraging investment and economic growth. The second model involves the concentration of investment resources and its centralized management by government institutions.
It is typical that in times of crisis, accompanied by the general decline in investments the identified models appear to be more vivid. If in the US in times of crisis, the share of internal sources increases. In the Russian Federation in the same period of crisis the situation is vice versa. The share of internal sources decreases, while the typical for the "state as an investor" model the share of raised funds increases.
3. INSTITUTIONAL MODELS ”STATE AS AN INVESTOR” AND ”STATE AS A REGULATOR”
Financing of the real sector is part of the process of economic reproduction, which also in-cludes funding for Research and Development (R&D) sector and the provision by the banking sys-tem of "long-term money" necessary for economic growth. The difference in specified institu-tional models is observed in these spheres of the Russian and US economies too.
In addition to the above mentioned statistics for the Russian Federation we can add finan-cing information of R&D – a necessary pre-phase for securing the growth of economy real sector. State (governmental entities) dominates in R&D activities in the Russian Federation and in the R&D financing structure serving further as a technological base for real sector development. Herewith the analysis of the dynamics of the Russian index in recent years shows that the state share of financing is gradually increased from 63.4% in 2007 to 70.7% in 2010 (Nauka, techno-logii i innovatsii Rossii 2011, p. 31). Apparently, in the Russian Federation the state is a major investor in R&D sector, in contrast to the US economy, where corporate (businesses) investment prevail. In the US economy, the share of public expenditures in the cost structure for R&D, provid-ing the technological basis for the development of the real sector in 2009 made only 27.1% (Rossiiskii innovatsionnyi indeks 2011, p. 31).
The same situation is observed in the banking sector of these two countries compared. In the USA, as is known, there are practically no state-owned banks. Thus, the loans required for the de-velopment of the real sector issued by banks are the funds of private (by ownership) credit and banking system. The Russian economy in 1980-1990s in the early transformation period also attempted to replace the state banking system, historically prevailing in our country, by private one. For this purpose the state-owned banks were privatized, the organization of new private banks were allowed, foreign credit institutions with private capital entered on the territory of the country. However, the analysis of the dynamics of the Russian banking sector shows that there is a return of the state into the banking sector (Figure 1).
Already by 2000, the proportion of state-controlled banks has increased to one-third, and since 2010 to more than half, and continues to grow (Vernikov 2012). The reasons of such the banking system evolution have been shown in our studies (Kirdina and Vernikov, 2013). Thus, in the credit and banking system of the Russian Federation the state, in contrast to the US economy, plays more important role in the financing of the real sector compared to the private entities.
The model “state as an investor” domination does not cancel the state’s role as an invest-ment process regulator. Even more the harmony between these two models is a necessary condi-tion for a successful development of any country. However for the countries with economic insti-tutions of an X-matrix domination (besides the Russian Federation we also place China and a number of other countries in this group – it will be discussed in the next paragraph) such harmo-ny is based on the frame character of the institutional model “state as an investor”.
ECONOMIC POLICY FOR REAL SECTOR AND R&D FINANCING: BASIC INSTITUTIONAL MODELS
47
Figure 1: Combined market shares of Russian banks by form of ownership, end of respective yea
Source: Kirdina and Vernikov 2013.
China showing progress in its economy modification over the last decades, can fully demonstrate this statement nowadays. As the specialists note the state plays a major role in China investment process (L’vova 2011, p. 10-11). First, we refer to the direct and indirect investment support of large-sized state companies. It is they who play the key role in and outside the Chinese economy. Moreover, as noted by worried observers from the western countries “the state- owned enterprises in China are potentially poised to alter the rules of global economic competition” (Schuman 2012). The state-owned companies receive financial support in the form of state subsidies, regulatory privileges and various benefits. Despite the ideological rejection of the following policy the western experts are nevertheless forced to acknowledge that such companies are “a potentially powerful mix that can reshape the global competitive environment” (Ibid.) and it contributes to the extension of influence of China over the international markets.
Second, in China with the domination of the “state as an investor” model the state banking system role is great as such the State development bank provides up to 80% of all loan portfolio (Zhifeng 2011). As a result there is a multistep investment system established in China. It includes state and private investment. Thereat the state acts as the main investor but at the same time attracts by all means private (including foreign) investment. The system includes development of long-term investment plans, activities to improve investment climate, and a scientific approach to price formation. Within investment area free pricing is coupled with measures of strict control over expenditures and prices. Auditions on price formation for infrastructure facilities are conducted as well as strategies and plans are openly developed. It of-ten helps to avoid substantial errors.
The advantages of the institutional model “state as an investor” are central resource support of the branches with the highest priority and evasion from cyclical changes. At the same time its main problems are insufficient motivation of would-be innovators, risk of corruption and investment thieving at the local levels. It is noted in the expert’s publications (see for example, Yanrui Wu, Zhengxu Wang and Dan Luo 2009). Struggling with such risks implies the improvement of the model “state as an investor” itself as well as the necessary compensating action of the alternative model “state as a regulator”.
The institutional model “state as a regulator” that is characteristic to the USA is described in numerous publications on the state investment activity regulationl. That is why we will give here only some examples.
So, such regulation results in the above-mentioned investment structure data (table 1) sho-wing a high percentage of capital consumption allowance in the US corporations’ real sector
Svetlana Kirdina
48
investment. It refers to the state policy of so called “accelerated capital allowance”. In the Russi-an academic literature this phenomenon is described in details by Michail M. Sokolov (2010) in his reviews of the US and the Russian Federation economic strategy concerning capital consump-tion allowance. The US took this strategy before the rest consistently improving the rate of fixed assets replacement and indirectly financing investment activities using state budget funds (Fedorovich and Patron 2007). Capital consumption allowance in this context is deemed to be the most important element of tax policy as it represents a share of corporate tax-exempt profit. Therefore in a short-term period an increase of allowance leads to tax revenues reduction in the budget (Mal’tseva 2012). At the same time in the context of development prospects this strategy proves to be effective.
The choice in favor of the “state as a regulator” model over the “state as an investor” model is described by the investment companies program for small business aimed to support venture capital financing in the US. If at first the US considered venture capital investment support as direct participation in the capital of companies formed then later restricted itself to providing state guarantee for bonds issued by venture capital companies. As the researchers note that “the US abandoned venture investment support with participation in the equity capital of the venture capital companies due to heavy losses” (Spitsyn 2010, p. 9) in favor of indirect supportive ac-tions.
The advantages of the “state as a regulator” model are high investment activity of market entities and in this respect a higher rate of technological progress. It is the decentralization in some experts’ opinion that provides permanent innovation flow for market economies (Kornai 2012). The problems of this model are cyclicality and ‘financial bubbles’ risks (Perez 2002), that emerge in the stock markets as a result of profit pursuit by isolated market entities. The institutional model “state as a regulator” risk reduction is achieved by its improvement as well as by incorporation of the alternative “state as an investor” model complementing the general practice of real sector financing in the countries with market based economy.
4. INSTITUTIONAL MATRICES THEORY (IMT), OR X- AND Y-THEORY
We shall try to explain the reason for the domination of the “state as regulator” model with real sector financing in some countries and the domination of the “state as an investor” model in the other countries based on the institutional matrices theory (Kirdina 2001; 2010).
This theory represents human society as a social system structured in three spheres: eco-nomy, politics and ideology:
- economic sphere with interrelations that involve resources used for the production and reproduction of work and business-related activities; - political sphere with interrelations for regular and organized public and civil society actions that aim to achieve defined local, regional or national objectives; and - ideological sphere with interrelations that embody important social and cultural ideas and values of a nation’s people.
These main spheres are strongly interrelated morphologically as parts, sides or components
of an indivisible whole. Each sphere is regulated by a corresponding set of basic institutions. Institutions permanently reproduce the staples of social relations in different civilizations and historical periods. Basic institutions integrate a society into one whole that develops sometimes with conflicts and at other times with harmony, sometimes with competition and at other times with cooperation.
Institutions have a dual character: they are objectively determined and also at the same time ‘human–made,’ which involves subjective and teleological features. On the one hand, institutions manifest self-organizational principles in a society as a co-extensive political-economic-ideo-logical system. On the other hand, institutions are the result of purposeful human reflection with regard to relevant laws and rules; they emerge, extend and are shaped as human-made entities.
ECONOMIC POLICY FOR REAL SECTOR AND R&D FINANCING: BASIC INSTITUTIONAL MODELS
49
As Thorstein Veblen wrote, “Social institutions are not only the result of selection and adapta-tion processes, shaping the prevailing and dominant types of relationships and spiritual position, at the same time they are special modes of the existence of a society, forming a special system of social relations and, hence, in turn, are an effective selective factor” (Veblen 1899, p. 188). Aggregations of interrelated basic economic, political and ideological institutions are defined by IMT as institutional matrices. Historical observations and empirical research as well as mathematical modelling and a broad philosophical approach constitute the ground for our hypothesis about two particular interdependent types of institutional matrices existing around the world. Namely, we call the two types X-matrices and Y-matrices and compare the unique identities of each one in relation to the other. These matrices differ in function according to the set of basic institutions forming them.
The X-matrix is characterized by the following basic institutions:
- in the economic sphere: institutions of a redistributive economy (a term introduced by Karl Polanyi (Polanyi 1977). Redistribution-oriented economies are characterized by a situation where the center (at the top) regulates the movement of goods and services, as well as the rights to their production, reproduction and use; - in the political sphere: institutions of a unitary (centralized) political order; - in the ideological sphere: institutions of communitarian ideology, the essence of which is expressed by the idea of collective, shared, public values and rights governing over individual, sovereign, private values and rights, i.e. the priority of We over I.
The Y-matrix is characterized by the following basic institutions:
- in the economic sphere: institutions of a market economy. Market-oriented economies are characterized by a situation where horizontal exchange relations between economic agents exist; - in the political sphere: institutions of a federative (federative-subsidiary) political order; - in the ideological sphere: institutions of an individualistic ideology, which proclaims the dominance of individual values and rights over the values and rights of larger communities, where groups are subordinate to personalities, i.e. the priority of I over We.
In real-life societies and nations, X- and Y-matrices interact, with one of them permanently
prevailing and governing. Nevertheless, the matrices are not and cannot be entirely exclusive of each other, iven that both X- and Y-matrices co-exist concurrently in any given case. This is what distinguishes IMT as an approach based not on conflict, but rather on cooperation and collaboration.
In other words, the social structure of any society can be singled out as a dynamic binary-conjugate structure of these two dialectically interacting, yet alternative complementary institu-tional complexes. The governance of one of the matrices over the other is usually constant in the course of history. The dominant institutions of the prevailing matrix therefore serve as a perfor-mance framework for harmonizing complementary institutions from the other matrix.
We contend that X-matrix institutions predominate in Russia, China, and India, along with most Asian and Latin American countries. In these cases Y-matrix institutions are also “a must,” but they have a complementary and additional character instead of a governing voice in society. And conversely, Y-matrix institutions prevail in most European countries and in North America as well as Australia and New Zealand, whereas X-matrix institutions also exist but at a smaller ratio.
All economic, political and ideological X- and Y-institutions coexist in different combinations and are embodied in many institutional forms. Thus, though we are outlining the general features of X- and Y-matrix institutions, in real-life situations the extreme cases are never fully demon-strated. The most efficient and effective functioning of X- and Y-matrices in each society requires an appropriate institutional balance with all morphologically interconnected institutions.
Why do X- or Y-institutions following historically determined institutional forms dominate in the structures of societies? The material and technological environment is seen as a key
Svetlana Kirdina
50
historical determinant of whether either an X-matrix or a Y-matrix prevails, along with culture and social actions4. The national environment can stress an indivisible communal system, wherein removal of some elements can lead to disintegration of the whole system or it can amplify a non-communal system with possibilities of functional and technological division (Bessonova et al. 1996, p.17-18). The institutional content of a nation developing within a communally-oriented environment is achieved by the tasks of coordinating joint efforts towards efficient and effective usage. In this way, X-matrices are formed under communal conditions.
A non-communal environment, on the other hand, is divisible into separate, disconnected elements; it is more easily able to disperse and can exist as an aggregate of dissociated, independent technological objects. In this case, an individual or group of people (e.g. families) can participate using parts of the non-communal environment in their economy, can maintain their effectiveness, and use the obtained results themselves, without cooperating with other members of the society. When this is the case, the main function of the surrounding social institutional structures is to assure interaction between the atomized economic, political and social agents. Y-matrix institutions are shaped in such a non-communal environment.
To make a summary, in communal environments X-matrix institutions are dominant and Y-matrix institutions are complementary, while in non-communal environments the institutional balance is reversed.
The ratio of dominant and complementary institutions is defined by the changing conditions of political-economic-ideological development. At one extreme, there is an outright dominance of one type of institutional matrices, yet without conscious implementation of complementary ‘other matrix’ institutions. This tends to result in a general systematic collapse (e.g. USSR’s breakdown in the 1980s and ‘90s) or in a social and economic crisis (e.g. the US’s recent 2007-‘09 recession).
The opposite extreme implies an attempt to replace historically dominant institutions with complementary ones. This move leads to revolutions through reconstructing dominant institu-tions into new forms (e.g. the French Revolution as a reaction to economic and political centra-lization and, alternatively, the Russian October Revolution (1917) as the outcome of an attempt at “building capitalism”) or unsustainable socio-economic development (e.g. some Latin Ameri-can countries). The main task of social and economic policy making in each country is thus to support the optimal combination (cf. proportional balance) of predominant and complementary institutions. For example, economic policy aims to find the best proportion between market and planned redistributive institutions as well as means to their modernization (Kirdina 2001). People and authorities can actively help to achieve this balance faster and more efficiently with con-centrated “teleological” efforts, rather than just letting “unguided” evolutionary history (cf. “the invisible hand”) take its course.
The institutional model described as “state as an investor” is typical for countries where X-matrix with the redistributive economy, the unitary (centralized) political order and the communi-tarian ideology prevails. The institutional model “state as a regulator” is characteristic for coun-tries where Y-matrix with the market-oriented economy, the federative (federative-subsidiary) po-litical order and individualistic ideology dominates.
5. CONCLUSION
Comparative statistical data and analytical surveys show that it is possible to distinguish two basic institutional models – “state as an investor” and “state as a regulator” in real sector and R&D financing. Even though they do not exist separately but rather coexist, one of the models strongly dominates over the other one. The dominating position of any of the models is related to social, economic and political processes and the type of a predominant institutional matrix. It is
4 The role of cultural factors for economic development is investigated in work of the so-called civilization approach (see e.g. Rosefielde, 2008). In IMT these factors are not investigated.
ECONOMIC POLICY FOR REAL SECTOR AND R&D FINANCING: BASIC INSTITUTIONAL MODELS
51
reasonable to keep in mind the mentioned differences during the institutional overview of eco-nomic growth problems and mechanisms. We hope to continue a comparative institutional analy-sis to test the hypothesis about the relationship and interaction between two abovementioned models in a context of other nation-states.
REFERENCES
Bessonova, O., Kirdina, S., O'Sullivan, R. (1996), Market Experiment in the Housing Economy of Russia, NSU, Novosibirsk.
Bratus’, S.N. (1947), Juridicheskie litsa v sovetskom grazhdanskom prave (Legal entities in the soviet civil law), Juridicheskoe iztatel’stvo, Мoscow, In Russian.
Bureau of Economic Analysis, U.S. Department of Commerce, http://www.bea.gov/iTable/iTable.cfm? reqid=9&step=3&isuri=1&903=177
Chung, J. (2010), Investitsionnoe obespechenie razvitija legkoi promyshlennosti: na materialakh RF and PRC (Light industry investment: based on materials of the Russian Federation and the People’s Republic of China), GUTiD, Sent-Petersburg, In Russian.
Fedorovich, V. A., Patron, A. P. (2007), SSHA: gosudarstvo i economika (The USA: state and economy), IUC RAS, Мoscow, In Russian.
Fligstein, N. (2005),. "States, Markets and Economic Growth", in V. Nee & R. Swedberg (Eds.), The Economic Sociology of Capitalism, 119-143), Princeton University Press, Princeton.
Grazhdanskoe pravo. Uchebnik. (Civil law. Textbook) (1998), E.A. Sukhanov (Ed.), 1, BEK, Moscow, In Russian.
Instruktsija o porjadke ucheta juridicheskikh lits, ikh obosoblennykh podrazdelenii v Edinom gosudar-stvennom registre predprijatii i organizatsii, 1 (The procedure of a legal entities and their standalone subdivisions registration in the Uniform state register of enterprises and organizations, Part 1). (2001), http://zakonprost.ru/content/base/part/292586, In Russian.
Investitsii v osnovnoii kapital v Rossiiskoi Federatsii po formam sobstvennosti (Fixed investment in the Russian Federation based on property types) (2012), Retrieved from the Federal State Statistics Service of the Russian Federation website. http://www.gks.ru/wps/wcm/connect/rosstat/rosstatsite/main/enterpri se/investment/nonfinancial/#
Investitsii v Rossii v 2011 (Investment in the Russian Federation in 2011) (2011), Federal’naya sluz-hba gosudarstvennoi statistiki (Federal State Statistics Service), Мoscow, In Russian.
Ioffe, O.S. (1958), Sovetskoe grazhdanskoe pravo: Kurs lektsii (Course on Soviet civil law), Leningrad State University press. In Russian, Leningrad.
Kirdina, S. (2001), "Fundamental Difference in the Transformation Process between Russia and East European Countries", Berliner Osteuropa Info, No 16, 14-16.
Kirdina, S. (2010), "Prospects of Liberalization for S&T Policies in Russia: Institutional Analysis", So-ciology of Science and Technology, 1(2), 10-28.
Kirdina, S., Vernikov, A. (2013), "Evolution of the Banking System in the Russian Context: An Insti-tutional Analysis", Journal of Economic Issues. Vol. 47, No. 2, 475-484.
Kornai, Y. (2012), Innovatsii i dinamizm: vzaimosvyaz’ system i technicheskogo progressa (Innovation and dynamism: interconnection of systems and technical progress), Voprosy economiki, No. 4, 4-31, In Russian.
L’vova, E.K. (2011), Territorial’naya struktura investitsii kak factor ekonomicheskogo razvitiya Kitaya. (Territorial investment structure as an economic growth factor of China), Lomonosov MSU, Мoscow, In Russian.
Mal’tseva, A. V. (2011), Sovershenstvovanie amortizatsionnoi politiki kak sposob nalogovogo stimuli-rovania investitsionnoi deyatel’nosti organizatsii real’nogo sektora economiki (Allowance strategy im-provement as a tax incentives method of investment activities for the real sector economy organizations), Retrieved from Institute of business and law, http://www.ibl.ru/konf/151211/sovershenstvovanie-amortizacionnoy-politiki.html, In Russian.
Metodologicheskie polozheniya po sisteme statisticheskikh pokazatelei, razrabatyvaemykh v statistike stroitel'stva i investitsii v osnovnoi kapital (Methodological provisions on statistical indicators system de-veloped in construction statistics and fixed investment) (2009), Federal’naya sluzhba gosudarstvennoi sta-tistiki (Federal State Statistics Service), Мoscow, In Russian.
Nauka, tekhnologii i innovatsii Rossii (Science, technology and innovation of Russia) (2011), IPRAN RAN, Мoscow.
Svetlana Kirdina
52
Perez, C. (2002), Technological Revolutions and Financial Capital: The Dynamics of Bubbles and Golden Ages, Edward Elgar Publishing, Cheltenham, UK and Northampton, MA.
Polanyi, K. (1977). The Livelihood of Man, Academic Press, Inc., New-York. Rosefielde, S. ( 2008/2005/2002), Comparative Economic Systems: Culture, Wealth, and Power in
the 21st Century, Wiley: Blackwell. Rossiiskii innovatsionnyi indeks (Russian Innovation Index). (2011), Ministry of Science and Education,
Moscow. Schuman, M. (2012), "Are China’s Big State Companies a Big Problem for the Global Economy?", Time,
17.02.12, Retrieved from http://pda.warandpeace.ru/ru/commentaries/view/66879/ Sokolov, M. M. (2010), "Evolyuzionnye izmeneniya v amortizatsionnoi politike kak osoboy forme
nalogovogo vozdeystviya na razvitie ekonomiki (Allowance strategy development as a special form of tax impact on economy development)", Vse o nalogakh (Complete guide to taxes), 10, 11, In Russian.
Spitsyn, D. A. (2010),Organizatsionnye formy i modeli venchurnogo finansirovaniya v SSHA (Organiza-tional forms and models of venture capital financing in the USA), IUC RAS, Мoscow, In Russian.
Status yuridicheskihk lits (Legal entity status) (2006), Yustitsinform. In Russian, Moscow. Struktura investitsii v osnivnoi kapital po istochnikam finansirovanija (Composition of fixed investment
according to financing sources). (2012). Retrieved from the Federal State Statistics Service of the Russian Federation, http://www.gks.ru/wps/wcm/connect/rosstat/rosstatsite/main/enterprise/investment/nonfinancial/#
Tolstoi, Yu. K. (2000), "K razrabotke teorii yuridicheskogo litsa na sovremtnnom etape (Legal entity theory development at the present stage)" in V.N. Litovkin and V. A. Rakhmolovich (Eds.) Problemy sovre-mennogo grazhdanskogo prava (Problems of contemporary civil law), 81-112, Gorodets, Мoscow, In Russian.
U.S. Census Bureau, Statistical Abstracts of the United States (2012), U.S. Census Bureau, Washington. Veblen, T. (1898), "Why is economics not an evolutionary science?", Quarterly Journal of Economics,
Vol. 12 No. 3, 373-397 . Venediktov, A. V. (1948), Gosudarstvennaja sotsialisticheskaja sobstvennost’, (State socialist prop-
erty), USSR Academy of Sciences press, Moscow-Leningrad, In Russian. Venediktov, A. V. (1940), Organy upravlenija gosudarstvennoi socialisticheskoi sobstvennost’yu (State
socialist property governing bodies), Sovetskoe gosudarstvo i pravo (Soviet state and law), Moskow 5-6; 24-51. In Russian.
Vernikov, A. V. (2012). The impact of state-controlled banks on the Russian banking sector. Eurasian Geography and Economics, Vol. 53, No. 2, 250-266.
Wu, Y., Wang Z., and Luo D. (2009), "China’s investment record and its fiscal stimulus package", The University of Nottingham, China Policy Institute. Briefing Series, Issue 50, March.
Zhifeng, U. (2011), Slovo i delo: infrastrukturnyi proryv (Words and facts: Infrastructure breakthrough). Vedomosti, 2.06.2011, 99 (2865). In Russian.
EXTREMAL QUANTILES OF MAXIMUMS FOR STATIONARY SEQUENCES WITH PSEUDO- STATIONARY TREND WITH APPLICATIONS IN ELECTRICITY CONSUMPTION 53
EXTREMAL QUANTILES OF MAXIMUMS FOR STATIONARY SEQUENCES WITH PSEUDO-STATIONARY TREND WITH APPLICATIONS IN ELECTRICITY CONSUMPTION
ALEXANDR V. KUDROV1
ABSTRACT
We propose a method for estimation of the distribution function of the maximums for time series with pseudo-stationarytrend on the basis of the earlier proved by the author theorems. The results are applied for estimation of the distribution function for the extremal values of electrical energy consumption.
KEY WORDS: Stationary sequences with periodic trend, estimation of the distribution function, foreca-sting, energy consumption.
JEL Classification: C61, C62, C63, C72 Received: May 21, 2013 / Accepted: November 28, 2013
1. INTRODUCTION
The problem of estimation the distribution function for the maxima of time series with pseudo-trend plays an important role when calculating reserves, forecasting consumption peaks (e.g., energy consumption), predicting extremes in weather events (e.g., temperatures), forecasting extremal price-levels. These challenges can be approached from the perspective of the classical results from Extreme Values Theory (EVT) (see Suveges 2008), and from a position of the results which, to some extent, are extensions of the classical EVT, seasonally adjusted data. We study the behaviour of maximums of electrical energy consumption in Russia from the point of both methods. But it should be stresses that the second extanded method allow us to use more data and get robust results. For empirical illustrations we use hourly electricity consumptionin Russia from the period from 1-th of July till 10-th of September 2005, taken from the site of the System Operator of the Unified Energy System of Russia (see 1).
The rest of the paper proceeds as follows. Section 1 provides formulations of the theorems for approximation the distribution function of maximum for time series with pseudo-stationary trend. In theoretical background section, we presented Fisher, Tippett and Gnedenko theorem together with the extended limit theorem for normalized maxima for stationary sequences with pseudo-stationary trend. Section 2 consists of empirical illustrations where is presented the procedures for high quantiles approximation. Section 3 concludes.
2. THEORETICAL BACKGROUND
The classical Extreme Value Theory studies asymptotic distribution of maxima of independent and identically distributed random variables with the function with distribution function .The basis of this theory is Fisher-Tippett-Gnedenkotheorem (Theorem on extremal types, see (De Haan and Ferreira 2006), (Fisher and Tippet 1928), (Gnedenko 1943), (Leadbetter and Lingren et al. 1983). Theorem Fisher-Tippet-Gnedenko, states:
Theorem 1.n (Gnedenkon 1943); Fisher and Tippet 1928) If for the distribution functions and there are such 0 and , that
→∞
,
1 Central Economics and Mathematics Institute, RAS, Moskow, Russia; e-mail: [email protected]
MONTENEGRIN JOURNAL OF ECONOMICS, Vol. 9, No. 4 (December 2013), 53-63
Alexandr V. Kudrov
54
at any continuity point of , then must coincide up to linear transformation of the argument (with a positive coefficient of scale) with one of the three distribution functions,
: (Gumbel distribution), : , 0, (Frechet distribution with 0) and : , 0 (Weibull distribution with 0.) . Note, that represents the distribution function of the normalized maximum for
identically independently random variables with distribution function . Denote , 1,2,3, as the disjoint domains of attraction, that is ∈ if and only if the limit of the sequence belongs to type , 1,2,3, respectively. Details and proofs can be found in the monograph LeadbetterM. R. etal. 1983 . It turns out, that this approximation is suitable in the case of weak dependance for the large values of the far away from each other, see Leadbetteretal. 1983, Leadbetter1974 Relevant mixing conditions are known as Leadbetter’s mixing conditions.
In this paper we consider the extanded problem of approximation for distribution of the maximum values of the time series: , 1,2, . . .,(1) where , 1,2, . . . – strictly stationary random sequence, , 1,2, . . . – trend, which behaves in the below defined stationary manner (for example, seasonal component), и – small parameter. It is assumed, that the distribution function of the random variable belongs to the maximum-domain of attraction. It means, that there are some positive sequence , some and nondegenerate distribution function such that at any continuity point of the function
the sequence converges to when → ∞.
We introduce some initial conditions which are needed for our main result.
Condition 1. The sequence 1,2, . . . is above-bounded: : , ,... ∞.
Onwards the small parameter is taken equal to , where – normalizing sequence from Fisher-Tippet-Gnedenko theorem, which corresponds to the distribution function , that is,
≡ . In the next section, we recall a specific type of normalization , , depending on the attraction domains, , or for distribution function . More details see, for example, in 7 .
Denote .Introduce Leadbetter’s type mixing condition for large values of the (1).
Condition 2. (Condition , , ,..., ) There exists a family of numbers , ,
, 1,2, . .. and sequence of positive integer numbers such that , , → 0, and for any , and arbitrary sets of positive integer numbers , . . . , , , . . . , such that
1 . . . . . . , ,
holds the following inequality:
| ⋂ ∈ ⋃
⋂ ∈ ⋂ ∈ | , .
Condition ensures the mixing (weak dependence) far away separated large values of the
time series (1).

EXTREMAL QUANTILES OF MAXIMUMS FOR STATIONARY SEQUENCES WITH PSEUDO- STATIONARY TREND WITH APPLICATIONS IN ELECTRICITY CONSUMPTION 55
Condition 3. (Condition ′ ) The following equality holds:
→∞ →∞∑ / ; 0.
We introduce " empirical distribution functions" of the trend values for :
# : ,
, where the sign # denotes the number of elements of the set.
Let – nondecreasing nonnegative left-continuous bounded function, denote :max , 0 , and define the functions:
, ∞∞ ;
, ∞∞ , 0;
, ∞∞ , 0.
Now we formulate the pseudostationarity condition for the sequence , 1,2, . . . . Condition 4. There exists G x such that the convergence in probability holds:
→∞(2)
at any continuity points x of the function G x . Besides, for any ν 1,2,3, if F ∈ D , then for any x and η 0,1 there exists finite limits:
→∞
, , ∞.
Functions , are involved in formulas for limit distribution of the maxima. Note, that if 2 is satisfied, then , isn’t necessarily finite.
The main result of the article concerns the limiting joint distribution of the random variables: max ; 1, . . . ,
with infinitely growing .
Theorem 2. Let in model (1) ∈ , where 1, 2 or 3. Assume, that conditions 1 4 are
satisfied. Then, if 1 or 3, then for any , ,
lim→∞
, ,(3)
if 2, then for any , ,
lim→∞
, .(4)
Proof of Theorem :Proof of this theorem is similar to (Kudrov 2008).
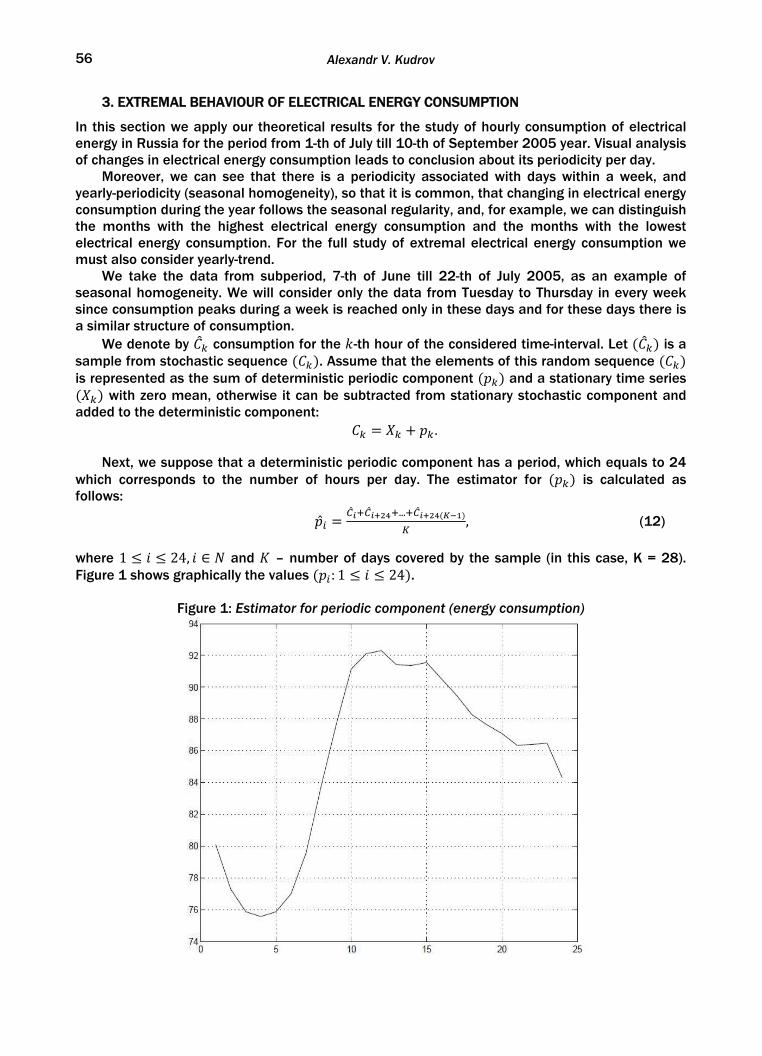
Alexandr V. Kudrov
56
3. EXTREMAL BEHAVIOUR OF ELECTRICAL ENERGY CONSUMPTION
In this section we apply our theoretical results for the study of hourly consumption of electrical energy in Russia for the period from 1-th of July till 10-th of September 2005 year. Visual analysis of changes in electrical energy consumption leads to conclusion about its periodicity per day.
Moreover, we can see that there is a periodicity associated with days within a week, and yearly-periodicity (seasonal homogeneity), so that it is common, that changing in electrical energy consumption during the year follows the seasonal regularity, and, for example, we can distinguish the months with the highest electrical energy consumption and the months with the lowest electrical energy consumption. For the full study of extremal electrical energy consumption we must also consider yearly-trend.
We take the data from subperiod, 7-th of June till 22-th of July 2005, as an example of seasonal homogeneity. We will consider only the data from Tuesday to Thursday in every week since consumption peaks during a week is reached only in these days and for these days there is a similar structure of consumption.
We denote by consumption for the -th hour of the considered time-interval. Let is a sample from stochastic sequence . Assume that the elements of this random sequence is represented as the sum of deterministic periodic component and a stationary time series
with zero mean, otherwise it can be subtracted from stationary stochastic component and added to the deterministic component:
.
Next, we suppose that a deterministic periodic component has a period, which equals to 24 which corresponds to the number of hours per day. The estimator for is calculated as follows:
...
,(12) where 1 24, ∈ and – number of days covered by the sample (in this case, K = 28). Figure 1 shows graphically the values : 1 24 .
Figure 1: Estimator for periodic component (energy consumption)
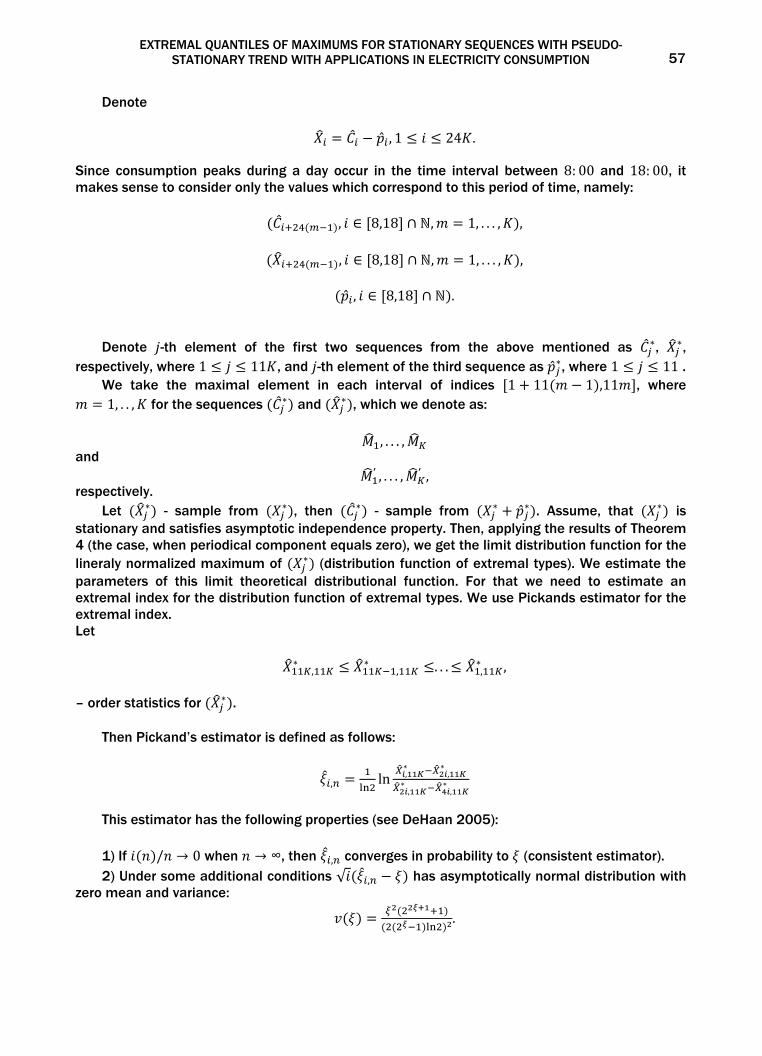
EXTREMAL QUANTILES OF MAXIMUMS FOR STATIONARY SEQUENCES WITH PSEUDO- STATIONARY TREND WITH APPLICATIONS IN ELECTRICITY CONSUMPTION 57
Denote
, 1 24 . Since consumption peaks during a day occur in the time interval between 8: 00 and 18: 00, it makes sense to consider only the values which correspond to this period of time, namely:
, ∈ 8,18 ∩ , 1, . . . , ,
, ∈ 8,18 ∩ , 1, . . . , ,
, ∈ 8,18 ∩ .
Denote -th element of the first two sequences from the above mentioned as ∗, ∗, respectively, where 1 11 , and -th element of the third sequence as ∗, where 1 11 .
We take the maximal element in each interval of indices 1 11 1 ,11 , where 1, . . , for the sequences ∗ and ∗ , which we denote as:
, . . . ,
and ′ , . . . , ′ ,
respectively. Let ∗ - sample from ∗ , then ∗ - sample from ∗ ∗ . Assume, that ∗ is
stationary and satisfies asymptotic independence property. Then, applying the results of Theorem 4 (the case, when periodical component equals zero), we get the limit distribution function for the lineraly normalized maximum of ∗ (distribution function of extremal types). We estimate the parameters of this limit theoretical distributional function. For that we need to estimate an extremal index for the distribution function of extremal types. We use Pickands estimator for the extremal index. Let
,∗
,∗ . . . ,
∗ , – order statistics for ∗ .
Then Pickand’s estimator is defined as follows:
, ln ,∗
,∗
,∗
,∗
This estimator has the following properties (see DeHaan 2005):
1) If / → 0 when → ∞, then , converges in probability to (consistent estimator). 2) Under some additional conditions √ , has asymptotically normal distribution with
zero mean and variance:
.
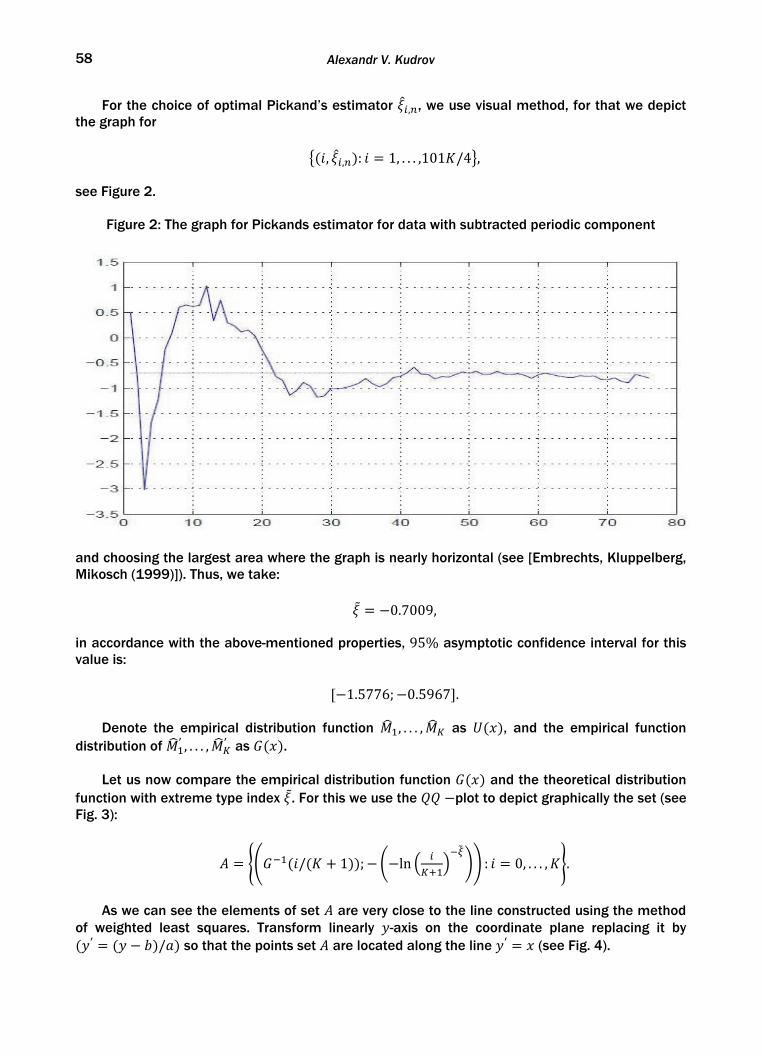
Alexandr V. Kudrov
58
For the choice of optimal Pickand’s estimator , , we use visual method, for that we depict the graph for
, , : 1, . . . ,101 /4 ,
see Figure 2.
Figure 2: The graph for Pickands estimator for data with subtracted periodic component
and choosing the largest area where the graph is nearly horizontal (see [Embrechts, Kluppelberg, Mikosch (1999)]). Thus, we take:
0.7009, in accordance with the above-mentioned properties, 95% asymptotic confidence interval for this value is:
1.5776; 0.5967 .
Denote the empirical distribution function , . . . , as , and the empirical function distribution of ′ , . . . , ′ as .
Let us now compare the empirical distribution function and the theoretical distribution
function with extreme type index . For this we use the plot to depict graphically the set (see Fig. 3):
/ 1 ; ln : 0, . . . , .
As we can see the elements of set are very close to the line constructed using the method
of weighted least squares. Transform linearly -axis on the coordinate plane replacing it by ′ / so that the points set are located along the line ′ (see Fig. 4).
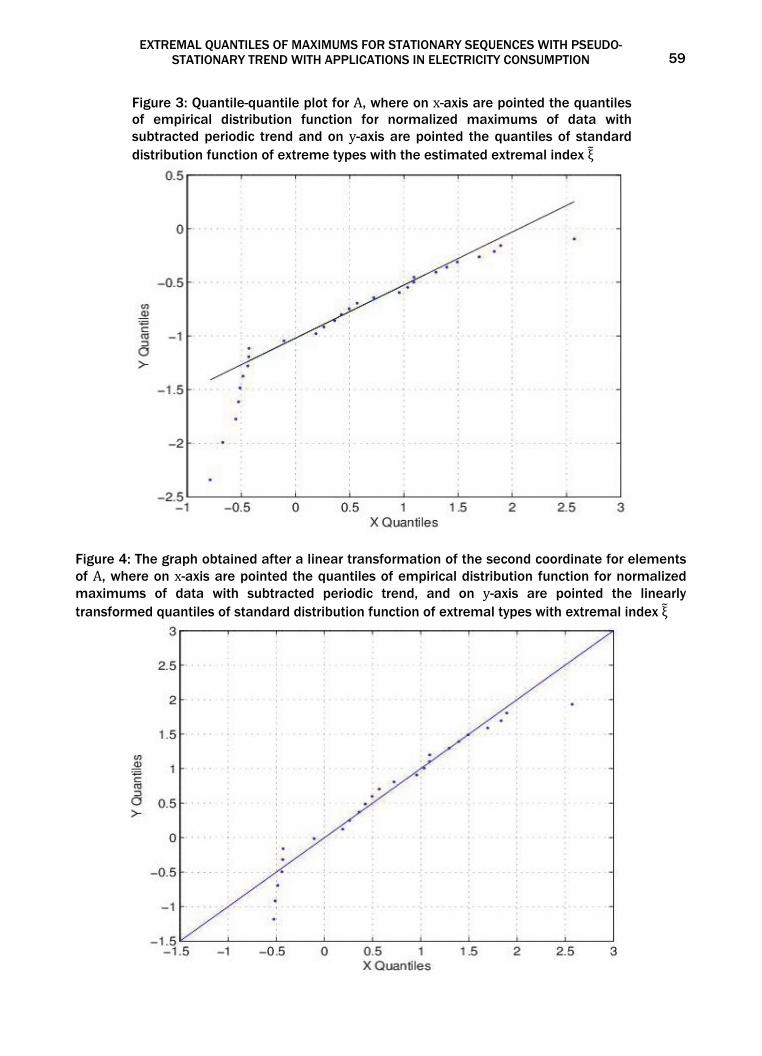
EXTREMAL QUANTILES OF MAXIMUMS FOR STATIONARY SEQUENCES WITH PSEUDO- STATIONARY TREND WITH APPLICATIONS IN ELECTRICITY CONSUMPTION 59
Figure 3: Quantile-quantile plot for A, where on x-axis are pointed the quantiles of empirical distribution function for normalized maximums of data with subtracted periodic trend and on y-axis are pointed the quantiles of standard distribution function of extreme types with the estimated extremal index ξ
Figure 4: The graph obtained after a linear transformation of the second coordinate for elements of A, where on x-axis are pointed the quantiles of empirical distribution function for normalized maximums of data with subtracted periodic trend, and on y-axis are pointed the linearly transformed quantiles of standard distribution function of extremal types with extremal index ξ
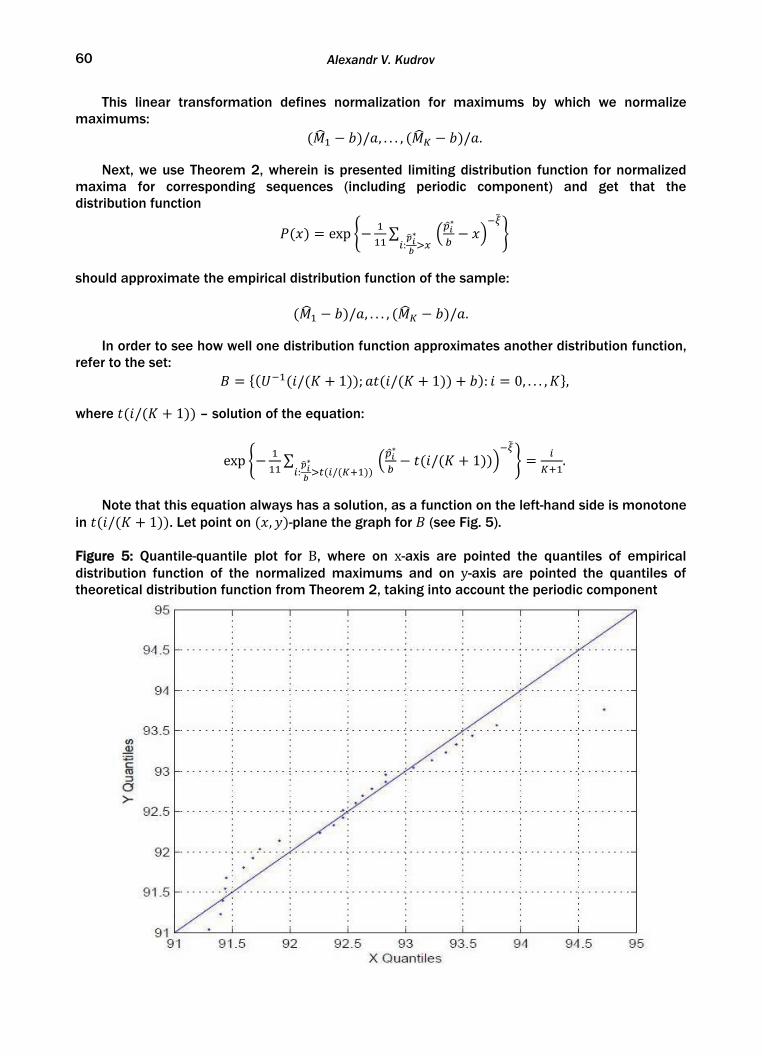
Alexandr V. Kudrov
60
This linear transformation defines normalization for maximums by which we normalize maximums:
/ , . . . , / .
Next, we use Theorem 2, wherein is presented limiting distribution function for normalized maxima for corresponding sequences (including periodic component) and get that the distribution function
exp ∑ :∗
∗
should approximate the empirical distribution function of the sample:
/ , . . . , / .
In order to see how well one distribution function approximates another distribution function,
refer to the set: / 1 ; / 1 : 0, . . . , ,
where / 1 – solution of the equation:
exp ∑ :∗
/
∗
/ 1 .
Note that this equation always has a solution, as a function on the left-hand side is monotone
in / 1 . Let point on , -plane the graph for (see Fig. 5). Figure 5: Quantile-quantile plot for B, where on x-axis are pointed the quantiles of empirical distribution function of the normalized maximums and on y-axis are pointed the quantiles of theoretical distribution function from Theorem 2, taking into account the periodic component
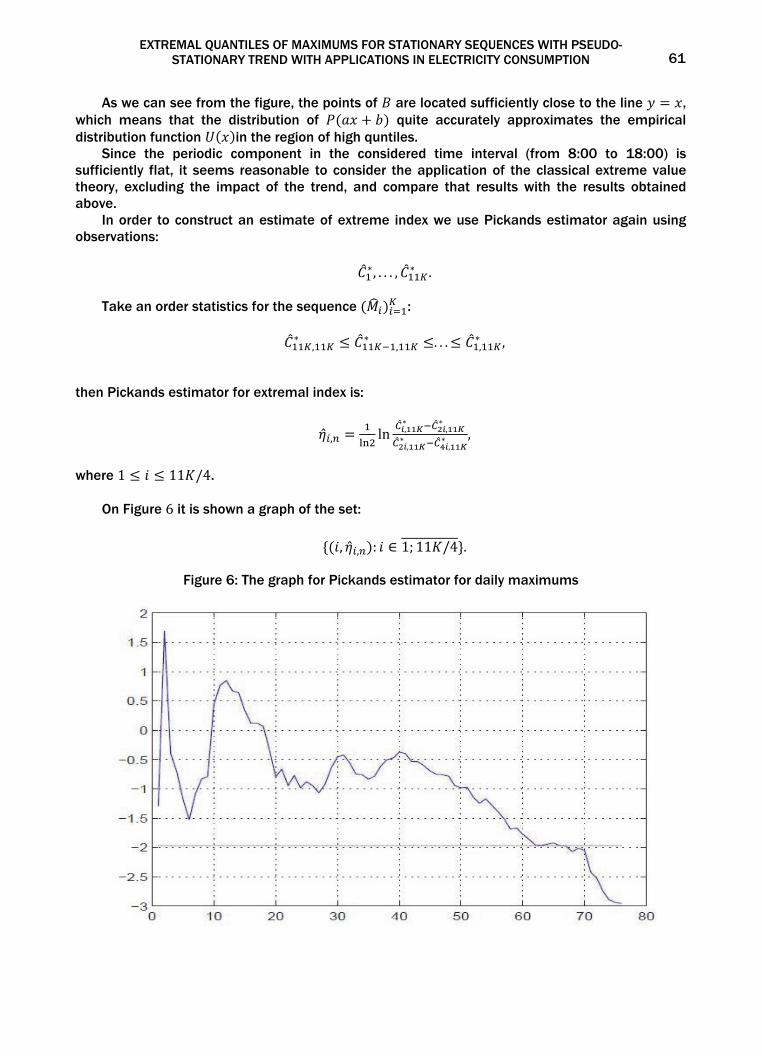
EXTREMAL QUANTILES OF MAXIMUMS FOR STATIONARY SEQUENCES WITH PSEUDO- STATIONARY TREND WITH APPLICATIONS IN ELECTRICITY CONSUMPTION 61
As we can see from the figure, the points of are located sufficiently close to the line , which means that the distribution of quite accurately approximates the empirical distribution function in the region of high quntiles.
Since the periodic component in the considered time interval (from 8:00 to 18:00) is sufficiently flat, it seems reasonable to consider the application of the classical extreme value theory, excluding the impact of the trend, and compare that results with the results obtained above.
In order to construct an estimate of extreme index we use Pickands estimator again using observations:
∗, . . . , ∗ .
Take an order statistics for the sequence :
,∗
,∗ . . . ,
∗ ,
then Pickands estimator for extremal index is:
, ln ,∗
,∗
,∗
,∗ ,
where 1 11 /4.
On Figure 6 it is shown a graph of the set:
, , : ∈ 1; 11 /4 .
Figure 6: The graph for Pickands estimator for daily maximums
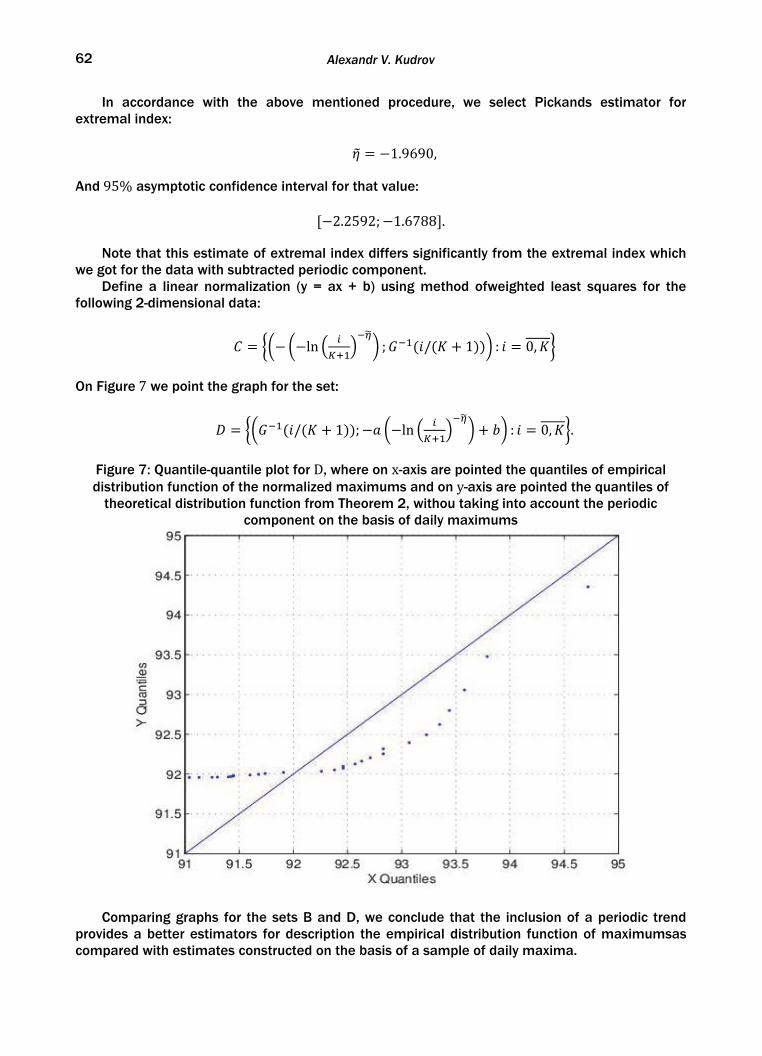
Alexandr V. Kudrov
62
In accordance with the above mentioned procedure, we select Pickands estimator for extremal index:
1.9690,
And95% asymptotic confidence interval for that value:
2.2592; 1.6788 .
Note that this estimate of extremal index differs significantly from the extremal index which we got for the data with subtracted periodic component.
Define a linear normalization (y = ax + b) using method ofweighted least squares for the following 2-dimensional data:
ln ; / 1 : 0,
On Figure7 we point the graph for the set:
/ 1 ; ln : 0, .
Figure 7: Quantile-quantile plot for D, where on x-axis are pointed the quantiles of empirical distribution function of the normalized maximums and on y-axis are pointed the quantiles of
theoretical distribution function from Theorem 2, withou taking into account the periodic component on the basis of daily maximums
Comparing graphs for the sets B and D, we conclude that the inclusion of a periodic trend provides a better estimators for description the empirical distribution function of maximumsas compared with estimates constructed on the basis of a sample of daily maxima.
EXTREMAL QUANTILES OF MAXIMUMS FOR STATIONARY SEQUENCES WITH PSEUDO- STATIONARY TREND WITH APPLICATIONS IN ELECTRICITY CONSUMPTION 63
4. CONCLUSIONS
To the problem of estimating the distribution function for maxima of stationary sequence with periodic trend can be approached using two approaches . The first approach is based on the results of classical extreme value theory, the second approach is based on the result proved by the author which concerns limit theorem for normalized maximums of stationary sequence with periodic trend.
Significant limitation of the first approach is small number of data (maximums) to be processed. The second approach allows us to overcome this limitation, because it takes into account the presence of a periodic trend. The second approach allows us to consider more data, and therefore using it possible to obtain a more robust estimates.
For data with a periodic trend accounting for periodic component allows to obtain more accurate estimates for distribution function of maxima. In this paper it is shown as an example electricity consumption in Russia .
REFERENCES
1. http://www.so-cdu.ru 2. Kudrov, A. (2008), "On the Maxima of Partial Samples of Stationary Random Sequences", Statistical
Methods of Estimation and Hypothesis Testing, No. 28, 121–135, (in Russian). 3. Kuznetsov, D. S. (2005), "Limit theorems for maxima of random variables", Vestnik MGU, Math.
Series, No. 3, 6-9 (in Russian). 4. Olshanskiy, K. (2004), "About extremal index for the subsampled autoregressive process", Vestnik
MGU, Math. Series, No. 3, 17 – 23 (in Russian). 5. De Haan, L. and Ferreira, A. (2006), "Extreme value theory. An introduction", Springer Series in
Operations Research and Financial Engineering. 6. Fisher, R. A. and Tippet, L.H.C. (1928), "Limiting forms of the frequency distribution of the largest or
smallest member of a sample", Proc. Cambridge Phil. Soc., No. 24, 180-190. 7. Gnedenko, B. V. (1943), Sur la distribution limite du terme maximum d’une s′erie aléatoire, Ann.
Math., No. 44, 423-453. 8. Kudrov A.V. and Piterbarg V.I. (2007), "On maxima of partial samples in gaussian sequences with
pseudo-stationary trends", Liet. matem. rink., , Vol. 47, No. 1, 1-10. 9. Leadbetter, М.R. (1947), "On extreme values in stationary sequences", Z. Wahrscheinlichkeits-
theorie verw. Gebiete, No. 28, 289-303. 10. Leadbetter, M. R., Lingren, G. and Rootzén, H. (1983), "Extreme and related properties of random
sequences and precesses", Springer Statistics Series, Berlin-Heidelberg-New York: Springer. 11. Mladenovic, P. and Piterbarg V.I. (2006), "On asymptotic distribution of maxima of complete and
incomplete samples from stationary sequences", Stochastic Processes and their Applications, No. 116, 1977-1991.
12. Suveges, M. (2007), "Likelihood estimation of the extremal index", Extremes, No. 10, 41-55.

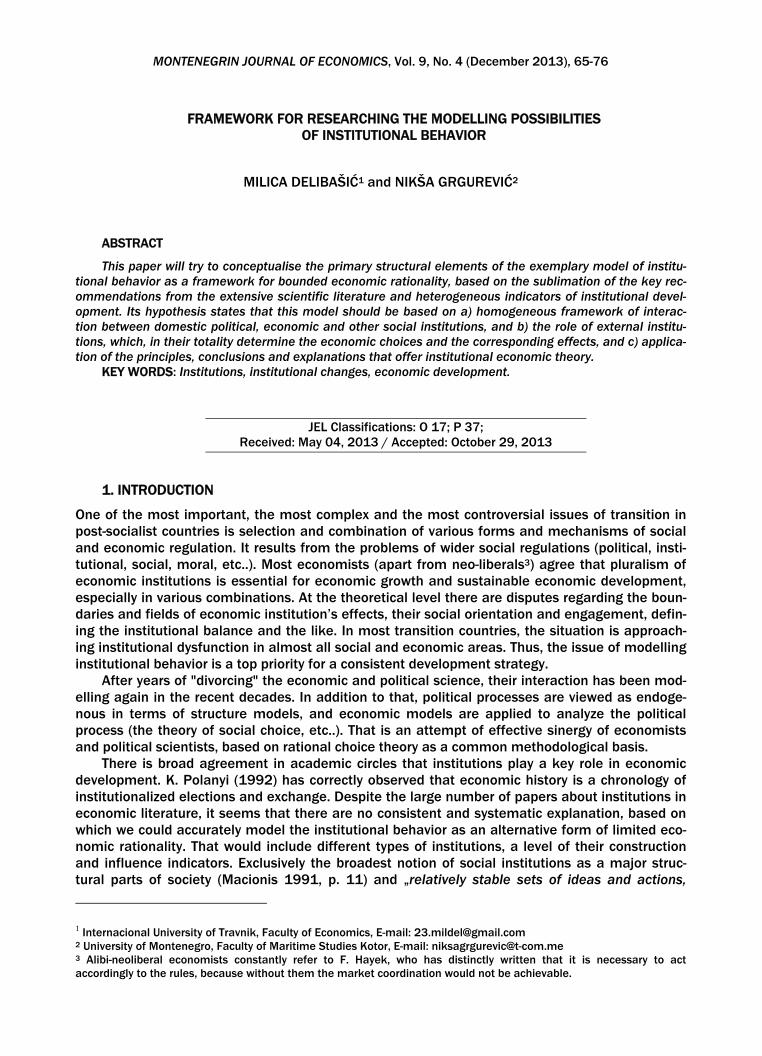
FRAMEWORK FOR RESEARCHING THE MODELLING POSSIBILITIES OF INSTITUTIONAL BEHAVIOR
65
FRAMEWORK FOR RESEARCHING THE MODELLING POSSIBILITIES
OF INSTITUTIONAL BEHAVIOR
MILICA DELIBAŠIĆ1 and NIKŠA GRGUREVIĆ2
ABSTRACT
This paper will try to conceptualise the primary structural elements of the exemplary model of institu-tional behavior as a framework for bounded economic rationality, based on the sublimation of the key rec-ommendations from the extensive scientific literature and heterogeneous indicators of institutional devel-opment. Its hypothesis states that this model should be based on a) homogeneous framework of interac-tion between domestic political, economic and other social institutions, and b) the role of external institu-tions, which, in their totality determine the economic choices and the corresponding effects, and c) applica-tion of the principles, conclusions and explanations that offer institutional economic theory.
KEY WORDS: Institutions, institutional changes, economic development.
JEL Classifications: O 17; P 37; Received: May 04, 2013 / Accepted: October 29, 2013
1. INTRODUCTION
One of the most important, the most complex and the most controversial issues of transition in post-socialist countries is selection and combination of various forms and mechanisms of social and economic regulation. It results from the problems of wider social regulations (political, insti-tutional, social, moral, etc..). Most economists (apart from neo-liberals3) agree that pluralism of economic institutions is essential for economic growth and sustainable economic development, especially in various combinations. At the theoretical level there are disputes regarding the boun-daries and fields of economic institution’s effects, their social orientation and engagement, defin-ing the institutional balance and the like. In most transition countries, the situation is approach-ing institutional dysfunction in almost all social and economic areas. Thus, the issue of modelling institutional behavior is a top priority for a consistent development strategy.
After years of "divorcing" the economic and political science, their interaction has been mod-elling again in the recent decades. In addition to that, political processes are viewed as endoge-nous in terms of structure models, and economic models are applied to analyze the political process (the theory of social choice, etc..). That is an attempt of effective sinergy of economists and political scientists, based on rational choice theory as a common methodological basis.
There is broad agreement in academic circles that institutions play a key role in economic development. K. Polanyi (1992) has correctly observed that economic history is a chronology of institutionalized elections and exchange. Despite the large number of papers about institutions in economic literature, it seems that there are no consistent and systematic explanation, based on which we could accurately model the institutional behavior as an alternative form of limited eco-nomic rationality. That would include different types of institutions, a level of their construction and influence indicators. Exclusively the broadest notion of social institutions as a major struc-tural parts of society (Macionis 1991, p. 11) and „relatively stable sets of ideas and actions,
1 Internacional University of Travnik, Faculty of Economics, E-mail: [email protected] 2 University of Montenegro, Faculty of Maritime Studies Kotor, E-mail: [email protected] 3 Alibi-neoliberal economists constantly refer to F. Hayek, who has distinctly written that it is necessary to act accordingly to the rules, because without them the market coordination would not be achievable.
MONTENEGRIN JOURNAL OF ECONOMICS, Vol. 9, No. 4 (December 2013), 65-76
Milica Delibašić and Nikša Grgurević
66
aimed at carrying out important social tasks“ (Coleman & Cressey 1984, p. 9) branches in various types: economic, political, ideological, legal, cultural and other.
Despite all the theoretical propositions, definitions and empirical evidence, seems that a strong conclusion as to why the institutions are important for economic growth still does not ex-ist. One of the reasons is the lack of operational framework and possibility of accurate institution measurement. In this regard, Acemoglu (2009) points out that the term „institution“ is very broadly used and defined in literature, a wide variety of institutional forms that can be relevant to economic outcomes. Baron and Hannan (1994, pp. 1141-1142) suggest the ways through which historical, cultural, political, social, and psychological and other factors of influence can make some ecquilibrium (a state of balance) more sustainable than others, and indicate the need for learning and introducing the source of resistance to changes in the societal systems. In this way, they suggest the need for analyzing the distance traveled (path-dependent) of development that is very important for the prediction of events and various comparative assessment of institutional levels.
2. THEORETHICAL APPROACH
Institutional changes and economic growth are probably the most important components and assumptions for economic development. High and sustainable growth rates are often the major drive for improving the general well-being. Representatives of neo-institutional economic theory (D.North and others) proved that long term economic growth could not be achieved without a progressive, pluralistic, politically desirable and legally protected institutional environment. In other words, high and sustained rates of economic growth are clearly not the cause but the con-sequence.
Rapid changes in economic reality of the past 20 years, caused by exponential technological and related organizational changes, as well as global processes, have resulted in paradigmatic modifications of economic growth model. Neoclassical growth model by R.Solow (1956) has em-phasized the key role of technical progress in relation to the previous emphasis on the role of physical capital accumulation and the growth of a labor force. Solow has calculated that four fifths of U.S. growth per employee comes from technical progress. Lucas (1988) has pointed out the role of human capital, Barro and Sala-i-Martin (1997) have underlined the role of technologi-cal diffusion, Barro (1990) has emphasized the role of public infrastructure, Romer (1990) the incentive for innovation, and so on.
Modern theories of economic growth as the main cause consider: institutions, innovation, in-formation (and other) technologies and intellectual (human) capital. Conditionally, it is possible that "model 4i" explains the causes of economic growth (Figure 1).
Figure 1: Conditional model of "4i" sample of economic growth
Source: Author’s creation.
FRAMEWORK FOR RESEARCHING THE MODELLING POSSIBILITIES OF INSTITUTIONAL BEHAVIOR
67
One of the major global problems is a wide gap between rich and poor countries, and certain layers of society, and individuals within them4. This raises interest for researching the role of na-tional institutions, which are believed to represent the main cause of this "big gap". In addition to the many well-known economist, IMF (2005) has advised the neessity for economic development to improve and constantly strenghten the quality of national institutional framework. The main reason is that bad institutions inevitably distort rational use of production inputs such as labor and capital, degenerate the adoption and the use of ideas by leadership states, and demotivate their own population. This means that understanding a consistent institutional system, institu-tional arrangements and channels, neccessary for real and well functioning of the institutions, are essential for creating the appropriate policies that would facilitate achieving the economic growth and sustainable development.
For better understanding of this discussion, one must understand the meaning of institutions. D. North (1981) defines them as „rules of the game in a society or, more formally, the restrictions that are human, made by humans to shape their own interactions.“ As a result, institutions struc-ture incentives are in human exchange, whether it is political, social, economic or other (North 1990). In other words, the choice of individuals is defined and limited by institutions. Social (po-litical, traditional, moral, cultural, etc.), and economic institutions directly and indirectly affect the structure of economic motives in society. North (Ibid., pp. 36-37.) points out that institutions can be interpreted as an informal constraints and formal rules. Informal institutions are "codes of conduct, norms of behavior and conventions, derived from socially transmitted information and are part of the heritage that is called culture."
Inherited culture in different societies shows why formal institutions lead to different results in different circumstances. Formal institutions include political (and judicial) rules, economic rules and contracts. Their hierarchy, according to North (1990, p. 47), from the constitution, thro-ugh statute, common law, to specific bylaws, and individual contracts, defines limitations, from general rules to their particular specifications. Acemoglu, Johnson and Robinson (2004) have proved that the company will prosper from the economic institutions that facilitate the accumula-tion of factors of innovation and the efficient allocation of resources, and vice versa.
IMF (2005) has broadened the North's definition of institutions, emphasizing the relationship between economic and political institutions. The term „political institutions“ refers to the institu-tions that shape the incentives of political executives and distribution of political power, including the ability to create economic institutions and to distribute resources in society. By determining relative abundance of different social groups, economic institution can have a feedback effect on the formation of political institutions. Quality economic institutions are most likely to thrive in the "rent-free" environment, where small groups have not been able to seize a monopoly in a particu-lar "industry" (meaning service industries) or economic activities , ie. they will not be able to gain privileged access to natural and other resources. Also, there is a great possibility that good eco-nomic institutions will be accompanied by good political institutions. Further, if political power is generally accepted, subject to review and recallable, and when used in terms of refraining from monopolizing and balancing the interests of society, it is much less likely that those who have the political power will use their position to acquire their personal profit.
3. CONDITIONAL INSTITUTIONAL MODELLING
To explain the questions above, it is necessary to model institutions as socio-economic technolo-gies and their relation to politics and economics, freedom and violence (as basic forms and mani-festations of certain framework), reforms, and crisis. In this regard, it is useful to accept the views of Acemoglu et al. (2004) on the role of institutions in society and economy, which we under-stand as follows: reduction, relativization and control over political domination over economy re-
2 While most of the population barely survives, the "Bloomberg" agency has announced that 300 world richest people in 2013. increased their assets by a total of 524 billion. U.S. dollars.
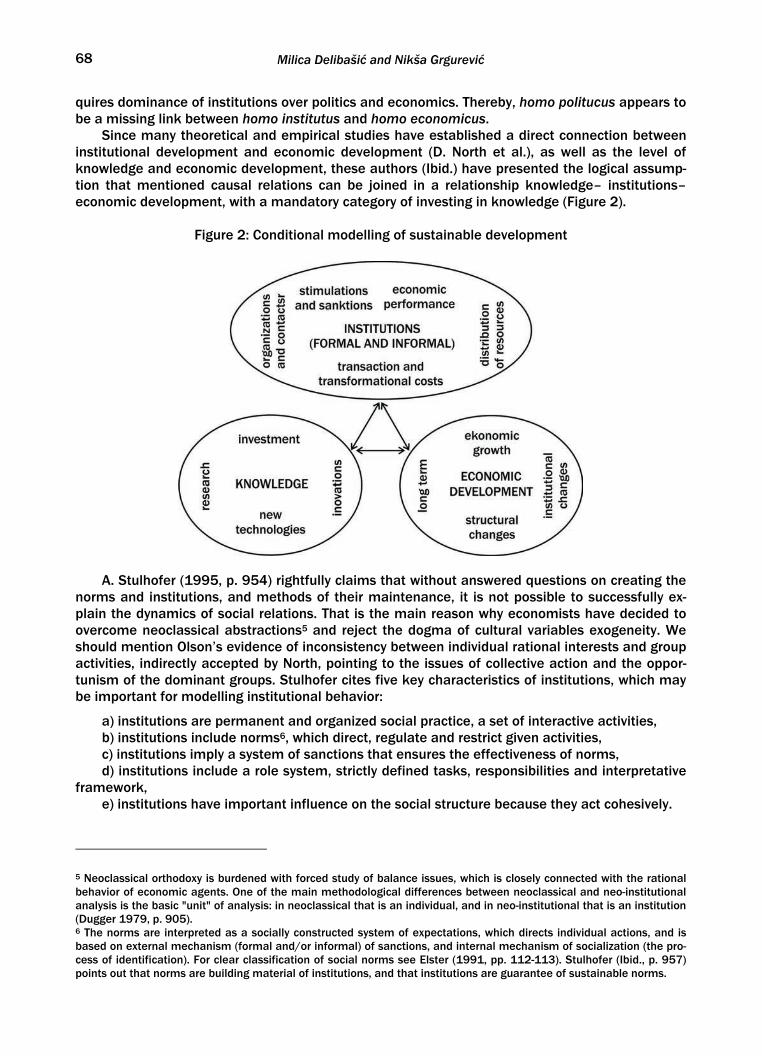
Milica Delibašić and Nikša Grgurević
68
quires dominance of institutions over politics and economics. Thereby, homo politucus appears to be a missing link between homo institutus and homo economicus.
Since many theoretical and empirical studies have established a direct connection between institutional development and economic development (D. North et al.), as well as the level of knowledge and economic development, these authors (Ibid.) have presented the logical assump-tion that mentioned causal relations can be joined in a relationship knowledge– institutions–economic development, with a mandatory category of investing in knowledge (Figure 2).
Figure 2: Conditional modelling of sustainable development
A. Stulhofer (1995, p. 954) rightfully claims that without answered questions on creating the
norms and institutions, and methods of their maintenance, it is not possible to successfully ex-plain the dynamics of social relations. That is the main reason why economists have decided to overcome neoclassical abstractions5 and reject the dogma of cultural variables exogeneity. We should mention Olson’s evidence of inconsistency between individual rational interests and group activities, indirectly accepted by North, pointing to the issues of collective action and the oppor-tunism of the dominant groups. Stulhofer cites five key characteristics of institutions, which may be important for modelling institutional behavior:
a) institutions are permanent and organized social practice, a set of interactive activities, b) institutions include norms6, which direct, regulate and restrict given activities, c) institutions imply a system of sanctions that ensures the effectiveness of norms, d) institutions include a role system, strictly defined tasks, responsibilities and interpretative
framework, e) institutions have important influence on the social structure because they act cohesively.
5 Neoclassical orthodoxy is burdened with forced study of balance issues, which is closely connected with the rational behavior of economic agents. One of the main methodological differences between neoclassical and neo-institutional analysis is the basic "unit" of analysis: in neoclassical that is an individual, and in neo-institutional that is an institution (Dugger 1979, p. 905). 6 The norms are interpreted as a socially constructed system of expectations, which directs individual actions, and is based on external mechanism (formal and/or informal) of sanctions, and internal mechanism of socialization (the pro-cess of identification). For clear classification of social norms see Elster (1991, pp. 112-113). Stulhofer (Ibid., p. 957) points out that norms are building material of institutions, and that institutions are guarantee of sustainable norms.
FRAMEWORK FOR RESEARCHING THE MODELLING POSSIBILITIES OF INSTITUTIONAL BEHAVIOR
69
For our research, an interpretation of the social capital concept is very important. Stulhofer (p. 956) argues that relationship actors/institutions can be characterized by autonomy, coercion, authority and historical continuity of institutional change, and that behavior of actors is deter-mined by the strength of institutional influence. Institutions affect the individual rationality through external constrains (laws, regulations, etc..) and internal constraints (socialization). Ac-cording to Stulhofer, rationality is rooted in the value system, called the socio-cultural capital7, which represents the "fabric of informal institutions," and consists of the adopted norms, ideo-logical beliefs, values, beliefs and other social structures. The relationship between social capital and formal institutions is a very complex, especially in terms of the strong relationship (path de-pendency – interpreted by North 1990, p. 112) between past and present institutional structure.
In accordance with Stulhofer’s reasoning and scheme (Ibid., p. 961) and schematic system that is essential for Nureev’s economic growth (2007, p. 350), we have constructed a customized, simplified scheme (Figure 3), which can serve as a starting point for modelling institutional be-havior.
Figure 3: Socio-cultural capital as an element of institutional behavior
4. INSTITUTIONAL FUNCTIONS AND RATIONAL ECONOMIC BEHAVIOR
In all areas of society should be active and continuous operation of unique (constitutive) rules, which apply equally to all and make indiscriminate and unprivileged regulation, coordination, or-ganization and limitation of the human behavior. These institutions are the best manifested by its functions. The role of institutions in society and economy is a necessity and a priority, as a kind of meta-foundation and meta-mechanism. All "development" models that had ignored the institu-tions have proven to be unsustainable. The rules are to be followed. This is the basic objective function of effective institutions, which in their totality constitute the infrastructure of rules in the society and economy. Contrary to the effective, the infrastructure quasi-rules have emerged in some transition countries ("foisted nonsense" - T. Veblen), which tolerate imitation-interest and dysfunctional (vertical) institutional order, metaphorically called "institutional nihilism" by V. Dra-šković and M. Drašković (2013, pp. 11-24), Rodrik et al. (2004) "institutional fundamentalism."
Institutions perform several basic tasks8:
7 We do not agree with the author's theory that the socio-cultural capital is the broader concept than the social capital, which he has explained by appropriate images (Ibid., p. 958). The issue has a discussion character, but in any context, in our view, the social system is a broader concept than socio-cultural, because in addition to intangible (including insti-tutionalized: power, influence, etc.) it contains a material resources. 8 It is difficult to classify all theoretical modification tasks, performed by institutions. Thus, for example A. Greif (2006) argues that institutions create behaviors (actions of individuals and organizations), which in practice must harmonize with beliefs; W. Neale (1987, p. 1183) states that institutions determine relationships as rules, in a way that regulate
Milica Delibašić and Nikša Grgurević
70
a) increase of the transaction efficiency and thus reduce transaction costs (Williamson, 1981) through the coordination of economic activity, ensured by harmonization of interests be-tween economic entities (horizontal) or on the property rights basis (vertical),
b) enable the realization, networking and coordination of economic relations, resources, sub-jects and activities; increase the communication efficiency between community entities (trade, etc.); economize time and efforts in making decisions; contribute adapting the changes, minimiz-ing the uncertainty and entropy; provide reliable protection of opportunistic behavior,
c) limit the choice possibility (behavior) of economic entities and reduce the likelihood of col-lectively irrational outcome of individual irrationality, and
d ) maintain the hierarchical structure of authority (which in principle allows the imposition of asymmetric conditions of trade and access to resources ie, the possibility to abuse through organ-izational), monopolization of decision making (Michels 1967). This means that institutions, in their quasi-manifestations, may represent particularism as the promotion of political, economic and other interests of privileged social classes.
Figure 4: Characteristics of institutional action
Source: V. Drašković, M. Drašković 2013, p. 41.
Figure 5: The role of institutions as continuous intermediaries between collective pattern and individual behavior
Source: Ibid., p. 42
Depending on the orientation of institutions towards the above mentioned tasks, according
to research by North (1990, p. 9), Putnam (1993, 1994) and other authors, institutions can be (according to Stulhofer Ibid., p. 977): what can and can not be done, as a public view they provide information necessary for meaningful participation in social life, and the sanctions are applicable in the case of non-compliance with given code of conduct;
FRAMEWORK FOR RESEARCHING THE MODELLING POSSIBILITIES OF INSTITUTIONAL BEHAVIOR
71
- horizontal (universally oriented towards objectives a, b, and c), characterized by universal reciprocity, limited solidarity and developed forms of trust, numerosity and connectivity of infor-mal and formal associations and their members (propulsive and affirmative institutional envi-ronment that Putnam calls civil society), and
- vertical, aimed at fourth objective (d) and dedicated to the issues of power and redistribu-tion, characterized by closeness, nepotism, opportunism, suspicion, familial cooperation, the pri-ority of loyalty and the lack of organizational forms (demotivation, civil uncooperative and dis-criminatory institutional environment with major or minor elements of violence, that E. Banfield calls "amoral familism"). It is the inefficient and irrational monistic institutional order, formed by reduced system of management, collapse, amorphousness and ambivalence of economic sys-tem, inadequacy of the rule of law, creating a large gap between reality of crisis and rhetoric of "reform" and forcing privileged interests.
Stulhofer (Ibid., p.p. 972-976) lists three basic steps in creating a rational or irrational institu-
tional behavior (such as limited framework for economic rationality):
- first step is a rational response of actors ("rooted rationality") on the internal and external constraints of a specific social context, which is historically given,
- second step , which can be channeled into two diametrically opposite evolutionary direction, namely: a) positive structuring and improvement of social capital towards the continuous and of-fensive development of informal institutions (through the building and rebuilding of the internal and external constraints), which favor the formation of a broad cooperative horizontal institu-tional order and dynamic reform of institutions and their adaptation to the developmental needs of society, and b) negative structuring of social capital towards discontinuous, defensive, narrowly cooperative, imitative and vertical institutional order, with existing discrimination, monopolization and the rigidity of institutions, causing distrust, opportunistic behavior, erosion of social values, obstructing institutional changes, having elements of coercion, instability, clan and authoritarian monopolizing of institutional power, all of which consequently leads to a lack of socio-economic development, and
- third step, which involves parallel, multilevel and relatively stable existence of horizontal and vertical evolutive institutional order, where the first is characterized by the reproduction effi-ciency, and other is reproductively inefficient.
The above elaboration suggests that modelling of institutional dynamics a) must take into
account the creation, evolution and maintenance of two different types of institutional structures (horizontal and vertical), b) that it is largely compatible with North's (1990) modelling, which con-siders the change of institutional framework (as a set of informal institutions) as a consequence of the organization impact (as formal institutions), where existing configuration (positive or nega-tive) of institutional framework (as a set of values and rules) causes certain transaction costs of functioning the political and economic markets (Ibid, pp. 8-9, 135-40 ), which restrictively influ-ence the institutional change, and c) that elimination of the forced (repressive) institutional order can be achieved only through discontinuous change, which implies a radical normative and insti-tutional reforms, applying the consistent and fair sanctions, establishing the critical mass of civil society values (Tullock 1995).
5. QUASI-NEOLIBERAL MODEL OF "INSTITUTIONAL" BEHAVIOR IN TRANSITION
A successful transition in post-socialist countries assumes radical changes in the attitude and forms of business, ownership, mechanism regulations, and political and legislative regimes. Ac-tual and radical institutional changes are the general framework and precondition for all other changes. They enable and enhance economic stability, growth and development. Economic inef-ficiency in transition is defined, among other things, by institutional vacuum and increased trans-action costs of adaptation on the market conditions of economy and creating new institutions.
Milica Delibašić and Nikša Grgurević
72
In theory and practice, there have been great doubts and different interpretations of objec-tives, methods, time, results and the costs of transition. They are the result of uncoordinated de-sires and interests with actual possibilities, one-sided ideological formation of prejudice from civi-lization needs, relationship issues and limits of state and market institutional regulation and dis-senting opinions of the gradualism supporters and shock therapy. Causes of the aforementioned dilemmas are more visible than the consequences. In a way, they discredit the idea and practice of transition and indicate the reality – that they could be implemented only to the extent enabled by existing social, economic, political and institutional conditions and constraints.
Ignoring the essence of neo-institutional economic theories and institutionalization as a prac-tical process and specific socio-economic development "technology", using its potential weak-nesses of a systemic nature (possibilities for manipulation), quasi-reformers have imposed the individual "efficiency" on the social efficiency. Using various non-market methods and proce-dures9, they have transfered a significant part of the social (state) property into private property. In this 25 years long process, many social institutions have failed, primarily management, control and property origin. Consequently, economic institutions have failed too.
Neither the practice nor references of neo-institutional economic theory, nor many other the-oretical studies were not sufficient enough to accepting orderly social (state) action "from the top" towards the massive delusion about transition process through dominantly profitable, privi-leged methodology of thievery. "Shock therapy" and strategies of alleged institutional "transplan-tation" of western role models have failed in most cases. Even if there were good intentions (and there were not, only profitable), the realization of any rules of conduct can be multivariate, de-pending on institutional and cultural environmental factors, but primarily on interests of the dominant political party (or coalition) in power. Strategy of "growing institution" (Stiglitz) and "transplanting the institutions" (Polterovich) does not fit in here. The causes are always the same - social, political and interest, but also methodology of reproducing institutional dysfunctionality (paternalism, nepotism, passivity, tradition of violating the legal norms, possibilities for unpun-ished manipulations, abuse and compensation, log rolling, lobbying , annuity-oriented behavior, etc.).
L. Polishchuk (2008, p. 28) explains that institutions does not get the desired results in vari-ous environments, and that is usually explained as "inadequate" local conditions. Good institu-tions should reflect the local specifics and have the character of a social good, because institu-tions reduce transaction costs and support the production and exchange. According to Polish-chuk, the reason for this "incongruity" is that institutions may be used in aimless fashion, when the motives and character of its applications are in contradiction with their essence. Untargeted ways of implementing the institutions are: their unpunished abuse and exploitation, asymmetric information, institutional manipulation, institutional submission by some interest groups and their use for covering up certain operations.
D. Rodrik (2005) has proposed a conceptual framework of "good institutions ", providing a primary economic principles: protection of property rights, contract enforcement, market compe-tition , appropriate incentives, reliable money, debt sustainability and economic efficiency. Mu-tual influence of political and economic institutions must establish "the right balance between disorder and dictatorship", and therefore they should be together considered. Starting from here, Rodrik has proposed the classification of "market viable institutions" (Table 1). It is a synergy of economic and political institutions. His taxonomy can be understood in four dimensions, namely "market-creating", "market-regulating", "market-stabilizing" and "market-legitimising" institu-tions. Rodrik believes that the market requires extensive regulations to minimize abuse of mar-ket power, internalization of externalities, information asymmetry, and to establish standardiza-tion and safety products etc.
9 Getting favorable inflation and other loans, quotas, licenses, using trade and natural monopolies, inflationary profits, creating quick and big lobbying, earning on annuity and social security, with low risk and avoiding commitments, as well as making money on some of the speculative ways (financial pyramids, money "laundering", currency smuggling, gray economy and war profiteering)
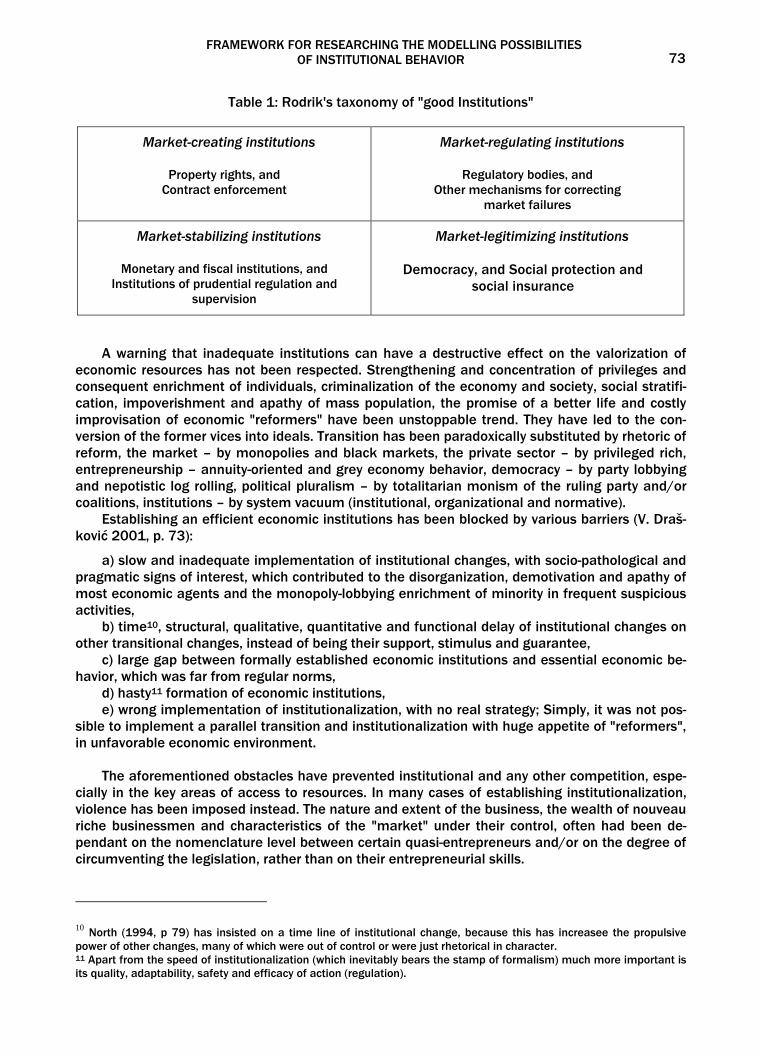
FRAMEWORK FOR RESEARCHING THE MODELLING POSSIBILITIES OF INSTITUTIONAL BEHAVIOR
73
Table 1: Rodrik's taxonomy of "good Institutions"
Market-creating institutions
Property rights, and Contract enforcement
Market-regulating institutions
Regulatory bodies, and Other mechanisms for correcting
market failures
Market-stabilizing institutions
Monetary and fiscal institutions, and Institutions of prudential regulation and
supervision
Market-legitimizing institutions
Democracy, and Social protection and social insurance
A warning that inadequate institutions can have a destructive effect on the valorization of economic resources has not been respected. Strengthening and concentration of privileges and consequent enrichment of individuals, criminalization of the economy and society, social stratifi-cation, impoverishment and apathy of mass population, the promise of a better life and costly improvisation of economic "reformers" have been unstoppable trend. They have led to the con-version of the former vices into ideals. Transition has been paradoxically substituted by rhetoric of reform, the market – by monopolies and black markets, the private sector – by privileged rich, entrepreneurship – annuity-oriented and grey economy behavior, democracy – by party lobbying and nepotistic log rolling, political pluralism – by totalitarian monism of the ruling party and/or coalitions, institutions – by system vacuum (institutional, organizational and normative).
Establishing an efficient economic institutions has been blocked by various barriers (V. Draš-ković 2001, p. 73):
a) slow and inadequate implementation of institutional changes, with socio-pathological and pragmatic signs of interest, which contributed to the disorganization, demotivation and apathy of most economic agents and the monopoly-lobbying enrichment of minority in frequent suspicious activities,
b) time10, structural, qualitative, quantitative and functional delay of institutional changes on other transitional changes, instead of being their support, stimulus and guarantee,
c) large gap between formally established economic institutions and essential economic be-havior, which was far from regular norms,
d) hasty11 formation of economic institutions, e) wrong implementation of institutionalization, with no real strategy; Simply, it was not pos-
sible to implement a parallel transition and institutionalization with huge appetite of "reformers", in unfavorable economic environment.
The aforementioned obstacles have prevented institutional and any other competition, espe-
cially in the key areas of access to resources. In many cases of establishing institutionalization, violence has been imposed instead. The nature and extent of the business, the wealth of nouveau riche businessmen and characteristics of the "market" under their control, often had been de-pendant on the nomenclature level between certain quasi-entrepreneurs and/or on the degree of circumventing the legislation, rather than on their entrepreneurial skills.
10 North (1994, p 79) has insisted on a time line of institutional change, because this has increasee the propulsive power of other changes, many of which were out of control or were just rhetorical in character. 11 Apart from the speed of institutionalization (which inevitably bears the stamp of formalism) much more important is its quality, adaptability, safety and efficacy of action (regulation).
Milica Delibašić and Nikša Grgurević
74
The application of quasi-neoliberal model of institutionalization in transition countries has led to a large polarization: freedom and enrichment of minorities, and the consequently reduction of economic choice and impoverishment of the majority. Rather than enabling the development and institutional innovation, it has led to the imitation of crisis and improvisations, which has gener-ated a long list of the obstructing mechanisms. State dictate was replaced by dictate of a "new entrepreneurs" (nouveau riche rich). A retrograde request of time was in power – enrichment at any cost. From the previous times were taken slogans, promises, political parties’ dominance, reproduction of crisis, reform apologetics and palliate, negative selection of personnel, etc. This led to further social disintegration and collapse of the middle class, years of reproduction crisis, boom of speculative trade, the development of social pathology, neglect of production, employ-ment and investment, degradation of science, education and morality. A system of alternative institutions was created. There were a variety of socio-pathological phenomena, gray economy, long-term application of wrong monistic recipes of neoliberal "shock therapy", compensating strictness of formal rules by their violation, corruption, violation (deprivation) of property rights, establishing various stereotypes of behavior, influence of informal norms of behavior (escalating institutional conflicts), etc.
6. CONCLUSION
Institutional pluralism as a development principle is an organic and integral feature of devel-oped societies and economies. It has proved to be a form of motion and solving many contradic-tions between public and private interests. It is based on a dynamic equality and mutual har-monization between variety of rival institutional forms of regulation and coordination of human activities (social and economic). Aforementioned suggests that institutional pluralism is an ele-mentary principle which must be assumed in modelling process of institutionalized behavior.
Defining and analyzing the problems of mutual relation and interdependence of the social environment and economy, especially the perennial problem of political influence on the econ-omy, is not possible without institutional analysis. Pluralistic modelling of institutional behavior and its selective and flexible application in practice can help understanding the transition from totalitarianism to democracy, from crisis to progress, from monopolistic dictates to the coopera-tion of interests and freedom of private initiative in the mass proportions, from non-economic subordination to economic motivation, from privileged economy to the knowledge economy, and from quasi-neoliberal monism to the horizontal institutional pluralism.
The practice of developed and developing societies and economies shows that the most im-portant condition for ensuring economic freedom and property forms – a strong and pluralistic institutional constraints of executive power in the field of property relations, ie. material and sta-tus value, as well as the political power.
LITERATURE
Acemoglu, D. (2009), Introduction to Modern Economic Growth, Princeton University Press, Cam-bridge, M.A.
Acemoglu, D., Johnson, S. and Robinson, J. (2004), "Institutions as the Fundamental Cause of Long-Run Growth", NBER Working Paper, No. 10481, Cambridge, MA, http://www.nber.org/papers/w10481, 385-472.
Baron, J. N. and Hannan, M. T. (1994), "The Impactof Economics on Contemporary Sociology", Journal of Economic Literature, Vol. 32, No. 3, 1111-1146.
Barro, R. J. (1990), "Government Spending in a Simple Model of Endogenous Growth", The Journal of Political Economy, Vol. 98, No. 5(2), S103-25.
Barro, R. J. and X. Sala-i-Martin (1997), Economic Growth, MIT, Cambridge, Mass. Coleman, J. and Cressey, D. (1984), Social Problems, Harper & Row, New York. Drašković, V. (2001), “Institucionalizacija i kvaziinstitucionalizacija u SRJ”, in Tržišna reforma privrede,
Ekonomist, 3, 35(3), 71–78. Drašković, V. i Drašković, M. (2013), Institucije, poredak i tranzicija, ELIT - Rifin, Podgorica - Zagreb.
FRAMEWORK FOR RESEARCHING THE MODELLING POSSIBILITIES OF INSTITUTIONAL BEHAVIOR
75
Dugger, W. M. (1979), "Methodological Differences between Institutional and Neoclassical Econom-ics", Journal of Economic Issues, Vol. 13, No. 4, 899-909.
Elster, J. (1991), "Rationality and Social Norms", European Journal of Sociology, Vol. 32, No. 1, 109-129.
Greif, A. (2006), Institutions and the Path to the Modern Economy, Cambridge University Press, Cam-bridge.
IMF (2005), "Chapter 3: Building Institutions", in World Economic Outlook, IMF, Washington D.C. Lucas, R. E., Jr. (1988), "On the Mechanics of Economic Development", Journal of Monetary Econom-
ics, Vol. 22, No. 1, 3-42. Macionis, J. (1991), Sociology, Englewood Cliffs, Prentice-Hall, New York. Michels, R. (1967), Political Parties, Free Press, New York. Neale, W. (1987), “Institutions”, Journal of Economic Issues, Vol. 21, No. 3, 1177-1206. North, D. C. (1981), Structure and Change in Economic History, W. W. Norton & Co, New York. North, D. C. (1990), Institutions, Institutional Change and Economic Performance, Cambridge Univer-
sity Press, Cambridge. North, D. C. (1994), “Economic Performance Through Time”, The American Economic Review, Vol. 84, No.
3, 359- 368. Nureyev, R. M. (2007), "Osnovnye institutsional'nye modeli stanovleniya i razvitiya kapitalizma", Insti-
tutsional'naya ekonomika, red. A. Oleynik, Infra-M Moskva. Polišćuk, (2008), „Necelevoe ispol’zovanie institutov: pričini i sledstvija“, Voporosi ekonomiki, No. 8,
29-44. Putnam, R. D. (199, Making Democracy Work, Princeton University Press, Princeton. Putnam, R. D. (1994), "Democracy, Development, and the Civic Community", in I. Serageldin & Ta-
boroff, J. (eds), I Culture and Development in Africa. Environmentally Sustainable Development Proceed-ings, Series No. 1, Washington, D. C.
Rodrik, D. (2005), "Growth Strategies," in Handbook of Economic Growth, Ph. Aghion and S. Durlauf eds. Elsevier, Amsterdam, 967-1014.
Rodrik, D. et al. (2004), „Institution Rule: The Primacy of Institutions over Geography and Integration in Economic Development“, Journal of Economic Growth, Vol. 9, No. 2, 131-165.
Romer, P. M. (1990), "Endogenous Technological Change", Journal of Political Economy, Vol. 98, No. 5, S71-102, Part 2.
Solow, R. M. (1956), "A Contribution to the Theory of Economic Growth", The Quarterly Journal of Economics, Vol. 70, No. 1, 65-94.
Štulhofer, A. (1995), "O racionalnosti, normama i institucijama: evolucija sociokulturnog kapitala kao model institucionalne promjene", Društvena istraživanja, Vol. 4, No. 6 (20), 953-981.
Tullock, G. (1995), "Comment: Rationality and Revolution", Rationality and Society, Vol. 7, No. 1, 116-119.
Williamson, O. E. (1981), "The Economics of Organization: The Transaction Cost Approach", American Journal of Sociology, Vol. 87, No. 3, 548-77.
World Economic Forum (2013), The Global Competitiveness Report 2012-2013, Geneva.

INSTITUTIONALIZATION OF PLACE MARKETING (CASE OF REPRESENTATIVE RUSSIAN REGION) 77
INSTITUTIONALIZATION OF PLACE MARKETING (CASE OF REPRESENTATIVE RUSSIAN REGION)1
DANIIL FROLOV2
ABSTRACT
In recent years the special attention is paid to territorial marketing, it is defined by one of instruments of social and economic development and increase in capacity of the territory, and the marketing paradigm gains more and more wide circulation. However there aren't many examples of the strategic oriented and complete approach in this area, the special programs and marketing strategies. The experience of any sub-ject which generalization promotes an increment of knowledge and promotes search of new perspective ways of development is of great importance for researchers and practitioners. The Volgograd region is rather developed and, at the same time, quite representative region from the point of view of the marketing strategy which analysis of experience allows to allocate the typical mistakes and widespread problems of integration of the principles of territorial marketing to the system of regional strategic management. De-veloping the marketing strategy of the Volgograd region and its implementation it is necessary to consider the existing experience of other territories. The analysis and reconsideration of the work done in recent years, in the field of territorial marketing in the Volgograd region, will allow to avoid the mistakes and to adapt the positive experience. For this purpose, was organized and analyzed the experience of the imple-mentation of territorial marketing, highlighted stages and forms of this process, detailed the typical for Russian regions problems of strategic marketing planning. Besides, the practical based on off-site experi-ence recommendation about development of regional marketing strategy are offered.
KEY WORDS: Place marketing, Marketing strategy, Rebranding, Stakeholders, Identity.
JEL Classification: M3, R1 Received: May 29, 2013 / Accepted: November 23, 2013
Prospects of regions of Russia are caused basic natural and geographical and the socio-economic factors defining advantages or barriers of spatial development. Set of territories possess limited resources, thus they are involved in essentially new dynamic political, social and economic situa-tion which features are defined by global processes, changes at the level of the region and the country as a whole. Besides, recently negative tendencies considerably became aggravated: mov-ing of the population to the large regional centers, compression of manned economic space, de-population of peripheral territories, backwardness of infrastructure, shortage of investments and budgetary financing. At this conjuncture search of the internal reserves which are based on con-crete advantages of their territories is necessary for municipalities for further social and eco-nomic development. Thus the increasing attention is paid to the new concepts, one of which is territorial marketing. This concept is based on interpretation of territories (regions and the cities) as the corporations socially responsible the multi-stakeholders, developing on the principles of customer-oriented management. The marketing paradigm gains more and more wide circulation and is in the long term capable to become dominating approach to management of development of territories, bringing to qualitatively new level the concept of "new public management".
Place marketing's institutionalization - difficult, multi-stage process of integration of market-ing vision of identity of city or region and the concept of a brand of the territory in system of inter-ests and shared beliefs of key territorial actors. 1 The research was supported by Russian Foundation for Basic Research (project 13-06-97094). 2 Volgograd State University, Volgograd, Russia, e-mail: [email protected]
MONTENEGRIN JOURNAL OF ECONOMICS, Vol. 9, No. 4 (December 2013), 77-86
Daniil Frolov
78
Marketing of territories can't have unambiguous, universal interpretation as its specifics are defined by "depth" of integration of a marketing paradigm in a control system of territorial devel-opment:
1. Marketing of territories in narrow sense – separate function of system of the strategic ter-ritorial management, connected with formation of a brand of the city or the region and creation of positive image for activization of advance of local production on foreign markets, involvement of tourists and investors and achievement of other strategic objectives. In essence marketing of territories is identified thus with territorial branding (Anholt, 2005; Kavaratzis, 2009).
2. Marketing of territories in expanded sense – the integrating through mechanism of market orientation of system of the strategic territorial management, including special methods, tools, forms and influence channels. Marketing is regarded thus "as of paramount importance", it "penetrates" and "sews" all management of territory development, focusing administrations on perception of the population, local business and nonresidents as peculiar consumers of services provided by the territory. Actually marketing of territories acts as customer-oriented territorial management (Mant, 2008).
3. Marketing of territories in a broad sense – the corporate ideology which was formed on the basis of territorial identity of interaction of the power, business and the civil society which refer-ence point is wide popularity and recognition of a brand, a priority – requirements, interests and values of stakeholders, an imperative – loyalty degree to a brand and the saved-up reputation capital. In an ideal marketing of territories is a market mentality of residents of the territory as coauthors of changes (Go, 2009).
We will allocate key ideas of territorial marketing:
− territories (the cities, regions, the countries, etc.) make specific goods (including services) which consumers are the population of these jurisdictions, local and extra-regional business, ex-ternal investors, tourists and potential new inhabitants who form sales markets of "place goods" (Kotler, Rein, Haider, 1993; Dinnie, 2008);
− the main task of territorial marketing is identification and satisfaction of requirements of the target markets and their segments that demands continuous feedback with consumers and a clear understanding of identity of the territory (Anholt, 2007);
− specifics of marketing of territories consist in its orientation not only on target groups of consumers, but also on a wide range of stakeholders (Maheshwari, Vandewalle, Bamber, 2011);
− advance of territories includes at least four directions connected with development of their image, investment, tourist and social appeal;
− management of appeal of territories demands purposeful information and advertizing ac-tions, forming of long-term communications and the relations, diplomacy and lobbying of inter-ests;
− "kernel" of territorial marketing is place branding (Kavaratzis, 2004; Zenker, 2011); − marketing has to be "through" ideology of work of all divisions of administration of this or
that territory, but specialized divisions (departments, teams, the working groups, etc.) on market-ing policy and competitive identity are necessary at the leaders of the countries, regions and the cities.
The marketing paradigm is becoming more widespread and in the future it will be able
to become the dominant approach to the management of territorial development, bringing the concept of new public management to the new level. The Volgograd region is a rather developed and, at the same time, quite representative region from the point of view of the marketing strat-egy development, analysis of which allows to allocate typical errors and widespread problems of integration of the marketing principles of territories in system of regional strategic government.
The implementation process of place marketing in the Volgograd region has passed through three stages:
INSTITUTIONALIZATION OF PLACE MARKETING (CASE OF REPRESENTATIVE RUSSIAN REGION) 79
1. 2010: the development of the marketing strategy of the territories’ development of the ur-ban district of Volgograd city-hero till 2020.
2. 2010-2011: the attempt to rebrand the Volgograd region based on the creation of mega-project of the federal center of patriotic education (National center “Victory”) in the region.
3. 2012-2013: reduced marketing of the region within modernization of Strategy of social and economic development of the Volgograd region till 2020.
Volgograd’s marketing development strategy was written in 2010 by the group of scientists
from the Volgograd State University. The research work had been done during a year in the close cooperation with the city administration. The key factors of competitiveness and sustainable positive reputation of Volgograd were determined by analysis: logistically advantageous location in a zone of the international transport corridors; agglomerative composition of moving; multi-functional structure of the industry; unique natural potential; rich cultural and historical heritage (primarily War Memorial complex associated with the Stalingrad battle); strong domestic market; powerful scientific and educational complex; stable crime situation.
Along with it is revealed the ambiguity (asymmetry) of the city’s image. The very negative ecological image (Volgograd is consistently ranks among 35 most polluted cities in the world and in the top ten environmentally unfriendly cities of Russia) combined with high sports (first of all, due to the outstanding Olympic achievements of Volgograd’s athletes), positive economic image, leading positions in Russia for the development of territorial self-government. The analysis of Volgograd’s marketing potential in image aspect led to draw the conclusion about the need to focus on the marketing city’s strategy on advantages for business and social activity, unique po-tential of sports and outdoor activities whereas the ecological image needs a radical improve-ment.
The main aim of the Marketing strategy of Volgograd till 2020 was determined by the promo-tion of unique city’s advantages taking into account all available and potential resources and sus-tained growth of its competitiveness in the territorial division of labor through quality improve-ment business, investment, innovation, cultural, scientific, sport and recreation image of Volgo-grad at municipal, regional, national and international levels. The realization of this system goal requires achieving the following fundamental objectives:
1. In the short term (1-2 years) – positive change and formation of new image of Volgograd, increasing the frequency of positive mentions in the media and Internet.
2. In the medium term (3-5 years) – creation and active promotion of Volgograd’s brand, formation of stable positive associations with city activity at all segments of target consumers, support of loyal community of a city brand.
3. In the long term (6-10 years) – radical positive change of the city's investment climate, strengthening the reputation of the municipal authorities, the improvement of internal social cli-mate, the creation of a competitive framework for sustainable development.
In functional-structural aspect the Marketing strategy of Volgograd is the system of special
marketing strategies (on key areas of activity), integrated strategy of the city’s image. The Strat-egy has three levels of formation and promotion of umbrella brand and the complex of sub-brands of Volgograd: municipal (local), national, global. For each level of strategic marketing were developed perspective brands, focused on specific target groups of stakeholders, were identified the areas of marketing actions, grounded the tools in each direction and necessary resources; revealed the composition and the time range of positive effects, develop the indicators and calcu-lated their predicted values.
For a large city with a complex territorial and social and economic structure such as Volgo-grad, focusing on separate, let and large-scale thematic idea or the project is pernicious in long-term prospect. The main advantage of the Marketing Strategy of Volgograd’s development is a lack of obsession with a single period in the history of the city or of any historical person. How-ever, at the initial stage of the work was revealed the specific of understanding of the place mar-
Daniil Frolov
80
keting functions by the city administration: as evident from the terms of reference, marketing strategy was seen as a way to improve implementation of the Strategic plan for sustainable de-velopment of Volgograd till 2025, i.e. it hadn’t independent significance and occupied a subordi-nate position in the system of territorial management. In this strategy involves focusing on pro-moting the existing strengths and achievements, while the weaknesses and problems from the framework of its competence.
The idea of the responsible entities of the Strategy was different: the scientists believe that the marketing approach has been implemented by all departments of the city administration for the associated functions and with the active participation of civil society; the authorities believe that special structural unit in structure of the city’s administration should deal with formation and maintenance issues of the city’s image, the main task of the unit is the development of recom-mendations for local government and for the private companies. Moreover, the requirements specification doesn’t provide for the development of the concept and identity of the city’s brand that violated the integrity of the strategic marketing.
The additional problem was created by the political instability caused by the protracted con-flict of the regional and city administrations. As a result, marketing strategy development of Vol-gograd only formally based on the provisions of Strategy of social and economic development of the Volgograd region till 2025. In reality, the degree of coherence of marketing activity was ex-tremely low that certainly, negatively affected both the content of Strategy and the potential of its realization.
Attempts to fix the marketing strategy of the territory in the format of the strategic docu-ment, despite their usefulness and importance, causing three negative trends that complicate the transition to the paradigm of territorial marketing:
- responsibility for the strategy’s implementation is shifted to official structures of the re-gional and municipal authorities, with insignificant participation of civil society;
- promotion of a range of facilities has steadily increased as no division of the administration is not ready to recognize them Supervised activity minor or de minimis;
- formalization involves the preparation of the document and its adoption in final form, which does not meet the basic principle of strategic marketing - openness to change, fast adaptation to the new trends and operational testing of creative ideas.
Almost parallel to the development of a marketing strategy of Volgograd was announced
about the initiative of governor of Volgograd region Alexander Brovko to create the region's Na-tional Center “Victory” - the federal center of patriotic education, preservation of the spiritual and cultural heritage. The main idea of the project was to create an umbrella brand of the region on the basis of “heritage resources” and the idea of “progressive patriotism”. It was supposed that the region does not need a lot of investment and time to create a bright and recognizable brand; its main socio-cultural resource is the Battle for Stalingrad, which should be used as a “locomo-tive” for the “acceleration” of sub-brands.
NC “Victory” as “innovative multicenter” was founded to provide “mirror” change of the re-gion’s perception giving its image such accents as “dynamic”, “various”, “creative”, “electronic”, “modern”. In the main building of the National Center, that planned to create by reconstruction of the Central department store, should accommodate the Museum of Russian successes and victo-ries, archive of the Second World War, Congress and exhibition center, Institute of Regional Stud-ies, Children's educational and cultural center and other structures forming a multi-function sci-entific and educational, cultural and museum complex of modern type. The list of key projects of NC “Victory” oriented to multi-channel promotion of the ideology “progressive patriotism”, in-cluded a gallery of modern art, Institute of memory Victory Train, interactive museums (including the one at the entrance to the city on the road “Moscow – Volgograd” and at the borders of Tsa-ritsyn watch line), ethnic village, new historical and ethnographic tourist routes on the territory of Zavolzhye, etc.
INSTITUTIONALIZATION OF PLACE MARKETING (CASE OF REPRESENTATIVE RUSSIAN REGION) 81
The basis of the planned rebranding of the Volgograd region was the idea of the global posi-tioning of the region as a cultural capital of the new Russian patriotism, international center of multiculturalism and tolerance. With the apparent superficiality of the main strategic idea, this project should recognize innovative for the region and quite complex, combining history of Tsarit-syn-Stalingrad-Volgograd and focused on the future. The main marketing problem of the project of creation of NC “Victory” became the vulnerability for criticism the ideology of “progressive pa-triotism”. The Great Patriotic War is one of the most highly taboo topics for the Russian society. Its history needs of demythologizing, but it could be a very painful process. Revealed also a lack of readiness of the local expert community and the public, especially veterans organizations, even the terminology used - commercialization memory and national values, post-industrial busi-ness on the military heritage, conversion of the history into a competitive advantage, etc. After the sensational presentation of NC “Victory” during the investment forum in Sochi with the sculp-ture “Motherland” dressed up with a floral sundress (September 2010) the project was criticized by the national media and trolling in the Internet. The attempts to position the regions as the cen-ters of any particular activity gives insufficient effect due to excessive narrowing of regional iden-tity. NC “Victory” got a stable association with the corruption. The numerous scandals in the ad-ministration of the region contributed to it. The attempts “to restart” the project were interrupted with resignation of the governor Brovko at the beginning 2012.
Let’s single out specific challenges and risks of the marketing promotion of the Volgograd re-gion:
– the absence of a clear positioning and the blurring the umbrella brand: desire to focus all the advantages and benefits of the region regardless of their coherence among themselves and their significance for consumers;
– the uncertainty of the target audiences: the aspiration to capture all categories of potential consumers of “product areas” leads to defocusing of marketing and cardinally reduces its effi-ciency;
– “cannibalism” of regional and capital brands: almost all well-known and recognizable ob-jects are concentrated in Volgograd and have the military-patriotic character that increases the cost of an expanded definition identity of the region as a whole;
– underdeveloped of subterritory’s brands: Urjupinsk designed the registration of the trade-mark “The capital of the Russian province” only at the end 2012, positioning of Volzhsky suffers from high abstraction (“the city where you want to live”), other municipal districts in the region even haven’t started branding.
– absence (due to mergers and acquisitions) rallied local big business as the initiator of the development of marketing strategy and rebranding.
Сrowdsourcing project of development of Strategy of social and economic development of
the Volgograd region till 2020 was implemented at the end of 2012 in the Volgograd region. It is possible to say, that the governor Sукпун Bozhenov and the regional government take into ac-count the negative experience of place marketing (as an attempt to develop a comprehensive and essentially unrealizable in full marketing strategy, and attempt drastic, radical re-branding in the absence of a loyal social base), therefore the marketing techniques were relegated to the background and are considered as an auxiliary tool of territorial management. In Strategy the following directions which can be carried to the sphere of competences of the place marketing were offered: the development of the Volgograd region’s brand was in the list of the priority pro-jects (top-15); realization of actions of investment marketing at the all-Russian and international levels; carrying out market researches of a situation in the tourism; implementation of PR-projects, aimed at promoting of tourism product of the region; the formation of harmonious modern tourism brand of Volgograd region and its popularization through information technology and advertising campaign; developing proposals for regional clusters and networks in the field of marketing and relationships between buyers and suppliers.
Daniil Frolov
82
Despite its importance these strategic directions actually reduce marketing of the Volgograd region to the region’s branding and marketing of tourism. Perhaps it is the best solution in this situation, but it should not acquire a sustained inefficient equilibrium. At the same time, we must admit non-standard format of using of crowdsourcing for the formation of the social base of the strategy, as well as for the definition of “anchors” of the region's identity in the public mind.
It is planned that in the medium term the strategic management of development of the Vol-gograd region should accept system character that assumes development on the basis the up-dated Strategy of social and economic development of the Volgograd regional marketing strategy for the same period, the modernization of the Strategic Plan for Sustainable Development of Vol-gograd and Marketing strategy of the city’s development till 2020. The marketing strategy of the Volgograd region’s development is a key missing link in the logical chain of strategic place man-agement.
We will present the practical recommendations for the development of the regional market-ing strategies that are relevant for the modernization of the city’s marketing strategy:
1. The development of the strategy should be carried out by the working group at the gover-nor of the Volgograd region, consisting of experts of local marketing, branding experts and iden-tity, a wide range of scientists and representatives of the main stakeholder categories. It is possi-ble the establishment of expanded Public council with advisory functions. For example, the Public Council for the strategic development of Lublin (Poland) includes about 1000 members (leaders in various fields) with a population less than 360 thousand people. It is important to provide pres-tigiousness of membership in Council, to attract active and motivated participants.
As a “managing director” the authority of the territory should be able to analyze the situation, set goals and develop strategies, optimal use of resources taking into account the specific fea-tures of the region, constantly look for and adapt new tools and models. There are the examples of “administrative model” of the city’s marketing, when the initiator and the main contractor is the administration in Russia. One of them is, public office “Urals’ capital” created in Yekaterin-burg, aimed to act as a marketing agency. The main tasks of PO are research, analytical work with arrays of information, development of concept programs aimed at developing an objective image of the city, development of strategies and methodical recommendations and organization of interaction of divisions, interested parties.
In the Vologda region a subject performing the monitoring, collection and updating of infor-mation, area advance at the Russian and international level, consolidation of promotional and performs the specially organized in 2008 state-financed organization “Regional center of tourism marketing and promotion programs of the Vologda region”. The most significant achievements of PO has in the tourism sector (approved the strategy of tourism development till 2020) however, experience and technology can extend the work of the center in all directions of place marketing.
2. The period of strategies’ development should match the level of complexity of the tasks and assume adequate funding for analytical and design work, as well as the possibility of outside consultants.
The question of financing of such projects always generates a lot of disagreements. Thus, the ambiguous attitude has caused the adoption of the “Marketing promotion Novosibirsk Region in 2013–2015”. Within its framework, the government announced that within 3 years (2012–2015) it will spend for these purposes 600 ml n rub (considering that all budget of Novosibirsk’s devel-opment is some billion rubles). However, these funds will hold a large-scale communications campaign at the federal and international level using the integrated approach, involving highly skilled professionals. Another issue is that the funds must be used correctly. Moreover such costs are fully justified if expected increase in investment would happen.
3. The terms of reference should not impose undue restrictions on the imagination of policy-makers. Thus, the company Pentagram Design, developing the concept of re-branding of south art of Pittsburgh found that on their way home people had to go through the underpass disgust-ing. As a result, terms of reference was ignored and developed a plan for the reconstruction of the transition with the purpose to make it pleasant space with installations which implementa-tion led to growth the loyalty of inhabitants.
INSTITUTIONALIZATION OF PLACE MARKETING (CASE OF REPRESENTATIVE RUSSIAN REGION) 83
4. The presentation and discussion of the strategic ideas and concepts of strategy should have the widest character, detailed coverage of regional media, and the implemented in the online broadcast.
The adoption of the city’s strategy development till 2022 “Cherepovets - a city of opportuni-ties” accompanied by a series of strategy sessions, conference “Cherepovets – territory of devel-opment”, which attended more than 250 guests from Moscow, St. Petersburg, Russian regions and foreign cities; 5 round tables took place within the conference, known experts were involved.
5. Indispensable condition is testing of loyalty of the population to a new brand and a con-cept of marketing strategy. During the analysis of public opinion it is advisable to use crowdsourc-ing and online surveys with moderation in addition to sociological researches.
Yaroslavl is the example of high research activity in the field of branding and positioning on the stage of development of the brand. Yaroslavl State Pedagogical University organized and hosted a thematic cycle, consisting of web sessions and conferences, revealing the idea of “Yaroslavl – the third capital of Russia” and developing it in an integrated theme of “capital and the provinces” that test its viability. On the other hand, the lack of coordination brand Perm, in-ability to deliver its benefits, value and substance to the city’s residents caused a considerable response to the public that generated hearings about the city’s rejection of the offered concept and lack of internal marketing.
6. The list of strategic activities must be fundamentally open. Many regions are actively trying to attract the public at all stages from design to implementation of policies, programs, concepts and brand identity. The authorities have reached a new level of openness and transparency in their activities, including the use of social control mechanisms, through interaction with experts.
7. Development of brand identity should be implemented in the format of an open competi-tion, suggesting Internet voting and examination by specialists of marketing and branding.
Development of the visual component of a brand of the city “Cherepovets - a city of opportu-nities” started in June 2012 as an open competition for the urban development of a logo, a slo-gan and audio logo of the city. The vote on the different communication platforms for the pro-posed options was organized. For the legitimacy of the process of visual component’s selecting of a brand were collected about 300 creative works. The brand-book will be developed on the basis of the work - the winner of working group on creation of system of visual communications.
8. The special emphasis is needed to stimulate the initiative, including non-profit projects that require mainly information support, but are able to give immediate effect as the PR-cause. For example, to create the interactive book of records of the Volgograd region is much easier and cheaper than “to promote” the former capital of the Golden Horde Sarai-Berke. Thus, in the Uly-anovsk region in the framework of the concept of identity formation are realized the starting pro-jects: “The name of Simbirsk-Ulyanovsk region” allowed to reveal the most famous countrymen, the contest “Seven Wonders of the Ulyanovsk region”, defined the most interesting man-made and natural sites in the region; the project “Ulyanovsk region - the birthplace of Kolobok” in the nationwide project “Fairytale map of Russia”, caused a wide resonance in Russia and Ukraine.
9. The policy documents should be very compact and reflect the specific findings and rec-ommendations of the research.
10. The number of priorities of the Strategy should be limited: ideally three “anchor” for ex-ample, District Friendship (historical “intersection”, multinational people, tolerance, multicultural-ism, Sarmatians and Sauromates, Cossacks, etc.), Homeland of Victory (veterans, tourism, archi-tectural monuments, etc.), the portal of the Future (neoindustrialization, youth, workers, entre-preneurs, and creative class, modern forms of business, etc.).
11. The Undeveloped of subterritory’s brands forming the submission about the Volgograd region as a whole must be eliminated. Targeted programs should address city neighborhoods, defining a logical continuation of the development and promotion of the area.
For example, the program “Cultural Capital” in Ulyanovsk is aimed at the Ulyanovsk region as a whole, including the town of Dimitrovgrad, which is a “city - the partner of the Capital of Cul-ture”. One of the aims was to increase the visibility and attractiveness to investors, the city's competitiveness in priority sectors. As a result Dimitrovgrad was chosen as the site for the im-
Daniil Frolov
84
plementation of a major federal project - the creation of nuclear-innovation cluster and providing a number of measures to revive the production of automotive components. The target Program “Formation and control of image of the city of Dimitrovgrad, Ulyanovsk region in 2012-2014” was developed.
12. The absolutization of a role of image and branding techniques is not permitted. In par-ticular, the development of tourism in the region primarily involves active work with extra-regional operators, creating preferences for them in exchange for the active promotion of Volgograd tour-ism product, and the next step is already the formation of attractive image and presentation of attractions. The preliminary step of creating of Uglich’s image and the promotion of the brand “soul of Russian province” was the restoration of monuments and landscaping (the first phase was carried out on the money from the local and regional budget). There will be enough work on the creation and promotion of the brand, but the city became attractive for many tourists and strategically important big business.
13. The system of the priorities and actions has to have the echeloned character depending on the investment capacity of projects, terms of their realization, the importance for a regional brand, etc.
14. It is necessary to maximize the opportunities of inter-regional cooperation in the field of marketing: for example, in a format of advance of the joint tourist brands (“Gates of Russia to the Great Steppe” etc.).
The consolidations of the local community, the revitalization of small and medium-sized businesses become the most significant, a burst of activity and the revival of Uglich, due to the development of tourism. The city’s example was a lesson for many, and in 2007 was based the Association of small tourist towns of Russia, united Uglich, Suzdal, Dmitrov, Yelabuga, Myshkin, Tobolsk, Valdai, Ples. One of the priorities of the association is the development of the federal program “Tourism as a way to revive the Russian provinces”, attracting investment and economic recovery.
15. System introduction of a paradigm of marketing of territories in all municipalities of the region seems essentially important. Certainly, creation of the information field is necessary for investors for decision-making, in particular, formation of investment passports of municipalities, etc. can become the first step. But are necessary more original, creative steps to attract the at-tention of investors and nonresidents to the region subterritories.
For example, in Vologda took place the presentation of the project “Guest Card”. The card of-fers the opportunity to use the public transport without any limit. To visit museums and galleries without pay and queues. Tourist with a guest card can take a free tour of the city. Other tours of this card will cost less. The tourist will have special discounts in hotels, restaurants, cafes, beauty salons, theaters and shops, entertainment and sports complexes. St. Petersburg offers its guests such guest card. A joint project of business and public authorities – “Angel Eyes” also finalized. During preparation is developed a unique search engine providing possibility of fast arrival of groups of reaction to a person who find themselves in an emergency situation. The city mobile tourist and information service “Service of Angels” is unique. “Angels” speak foreign languages, work in pairs and are competent, concise, professional and absolutely free of charge for guests of the city to provide a wide range of information about St. Petersburg.
16. The formation of interactive content created by the user, especially the residents and visi-tors to the area is crucial to the success of the marketing strategy of the region. Possible options include multilingual regional information and entertainment portal (including official news, a poster of events, news from users, forum, local blogs etc.); ratings of the best places in Google Maps and social networks, social media (networks, blogs and forums); mobile sites and applica-tions, high-quality multimedia content (3D-maps, transport schemes, hiking trails, videos, photo galleries etc.); accumulation of reviews and recommendations.
If recognize that the logo is the first step on the path to a new territory’s identity, the major
problems in the area of identity for the Volgograd region are the powerful brake for its branding.
INSTITUTIONALIZATION OF PLACE MARKETING (CASE OF REPRESENTATIVE RUSSIAN REGION) 85
The creation of brand book “Ulyanovsk. Ready for takeoff” became the starting project of identity formation of the Ulyanovsk region. One of the primary tasks of Smolensk in the prepara-tion for its 1150th anniversary was also the development of brand-book. The main element of the visual identity of the brand was chosen the image of the heart. The feature of a sign is that it is possible to find outlines of territorial borders of the Smolensk region in it. More or less recogniz-able have the brands of St. Petersburg, Kaluga, Omsk, Magnitogorsk, Perm, Yaroslavl, Cherdyn, Dobryanka, Nizhny Novgorod, Molebka and other cities.
The discussions about the emblem and the symbol of our region are clearly delayed, al-though the territorial heraldry has a very indirect relationship with the brand. The problems con-nected with the identity development for the large cities and regions always appear and they mainly related: а) the high costs of coordinating projects with the ideas and beliefs of many stakeholders, b) with problematic narrowing all the measurements of the image area. It is impor-tant to recognize that official symbols and brand of the region - a fundamentally different phe-nomena. Therefore, maintaining the Motherland and Mamaev Kurgan as the images and symbols of the heroic past, as the basis of Volgograd patriotism, should refuse to overfish in identity of a regional brand and sub-brands, as well as the use of explicit connotations of the Battle of Stalin-grad. This is indicated by the results of the poll by the Levada Center of the relation to the return of Volgograd its old name “Stalingrad”: in October 2012 for only 18% of respondents spoke that they agree with it, against were 60%, undecided – 23%. Nevertheless, the deputies of the Volgo-grad City Duma in January 2013 took the decision to use the name “hero city Stalingrad” six times a year, in anniversaries of the Great Patriotic War. Volgograd and the Volgograd region could not have the one brand: it is necessary the division of official and informal brands with dif-ferent tasks and target audiences. Attempts of their combination are initially doomed to public criticism and rejection. Probably, it will be better to combine in identity of the region not simply last, real and future, and the remote past, the near past and the expected future. In particular, it is possible to use the symbolism of the Golden Horde, ornaments of Uryupinsk down products, the images of high-tech industries (chemical formula, model nanotubes and fullerene molecules, etc.), and elements of the military-patriotic theme. It is necessary to provide systemacity of iden-tity as visual identity of a brand of the region: it should reflected in the design of business docu-ments, the style of outdoor advertising (billboards, banners, etc.), the design of the urban envi-ronment (street steles, sculptures, etc.) and transport (tram, trolley-buses, taxis, airport, river port, bus and train station, public transport), as well as souvenirs demanded by the inhabitants of the region.
Perm is a striking example of the Russian city-branding. There are sculptures of bears and unusual monuments, men on the roof, a special place has a red letter “P”, Pasternak looking thoughtfully with posters at the bus stops. Although these accents are scattered and controversial they have the rational as the city got fame and federal attention. A good example of the use of its “abnormal” location is the village of Molebka, the most part of its budget is the souvenirs with symbols of UFOs and the income from “expeditions” and UFO conferences.
Volgograd is the only million-plus city in Russia that has marketing strategy as separate, sci-entifically reasonable document. All more or less large Russian cities include block of marketing activities into the overall strategy of social and economic development or private strategies. The important the condition of the realization of Strategy of social and economic development of the Novosibirsk region till 2025 is the creation, the strengthening and promotion of a competitive brand of the Novosibirsk region at the inter-regional and international level as the region of inno-vative development providing a high quality of the citizens’ life. The long-term target program “Marketing promotion of the Novosibirsk region in 2013-2015” and the program “Formation of image of Novosibirsk till 2020” have been taken to achieve this goal.
The place marketing of St. Petersburg is focused on the development of the tourism industry. That is why the main positions are in the Development programme of St. Petersburg as the tour-ist center in 2011-2016: the formation of a positive image, launch events, placement of image information, attraction of investments, infrastructure’s reconstruction and economic recovery. The sections devoted to the image of the city, its promotion and its communication strategy are
Daniil Frolov
86
in the City development strategy till 2022 “Cherepovets - a city of opportunities”. The block of marketing activities included in the target program “Development of domestic and inbound tour-ism” in the Volgograd region, developed for the period from 2009 till 2012 and Strategy for tour-ism development in the region till 2020. And later in the Strategy of development of tourism in the municipality “City of Vologda” till 2020 “Vologda - the cultural capital of the Russian North” the marketing focuses on the development of unique historical and cultural resources of the re-gion. The presentation of Vologda as one of the biggest cultural center of North - West of Russia is possible by the creation of conditions for the development of cultural and historical heritage, secondary and higher education institutions, the organization of public events, concerts - exhibi-tion, festival events, tourist gatherings, celebrations giving the reasons for the coverage in the media the recreational opportunities of the city. The cultural heritage could help the development of the city and its infrastructure thanks to a good advertising and attracting of media.
It is important to overcome the widespread notion that the marketing strategy is a special-ized subsystem of social and economic development of the area and the higher jurisdictions (macro-region, the country, the international association), its parameters (orientation, the impera-tives and priorities) are mainly given “from above”, it is a special way of their realization, and its conceptual framework and horizons are also formed by higher-level strategies. The marketing strategy of the region - not a subsystem, and meta-strategy for social and economic develop-ment, it should not only contribute to the achievement of the main objectives of the strategy, but also to define them, and to provide the integration of all areas of the strategic regulation from industrial policy to the development of science, culture and sports.
REFERENCES
Anholt, S. (2005). “Brand New Justice: How Branding Places and Products Can Help the Developing World”. Butterworth-Heinemann. 192 pp.
Anholt, S. (2007). “Competitive Identity: The New Brand Management for Nations, Cities and Regions”. Palgrave Macmillan. 134 pp.
Dinnie, K. (2008). “Nation Branding: Concepts, Issues, Practice”. Elsevier Butterworth-Heinemann. 288 pp.
Go, F. (2009). “Place Branding: Glocal, Virtual and Physical Identities, Constructed, Imagined and Ex-perienced” / F. Go, R. Govers. Palgrave Macmillan. 256 pp.
Kavaratzis, M. (2009). “Cities and their brands: lessons from corporate branding”. Place Branding and Public Diplomacy. 5(1): 26-37.
Kavaratzis, M. (2004). “From city marketing to city branding: towards a theoretical framework for de-veloping city brands”. Place Branding and Public Diplomacy. 1(1): 58-73.
Kotler, Ph. (1993). “Attracting investment industry and tourism to cities, states and nations” / Ph. Kot-ler, I. Rein, D. Haider. N.Y.: The Free Press. 326 pp.
Maheshwari, V. (2011). “Place branding's role in sustainable development” / V. Maheshwari, I. Vande-walle, D. Bamber. Journal of Place Management and Development. 4(2): 198–213.
Mant, J. (2008). “Place management as a core role in government”. Journal of Place Management and Development. 1(1): 100-108.
Zenker, S. (2011). “How to catch a city? The concept and measurement of place brands”. Journal of Place Management and Development. 4(1): 40–52.
THE INSTITUTIONAL STRUCTURE OF SOCIAL ENTREPRENEURSHIP IN THE USA, UK AND GERMANY WITHIN A CONTEXT OF MARKET-BASED VS. BANK-BASED SYSTEMS 87
THE INSTITUTIONAL STRUCTURE OF SOCIAL ENTREPRENEURSHIP IN THE USA, UK
AND GERMANY WITHIN A CONTEXT OF MARKET-BASED VS. BANK-BASED SYSTEMS
RUSLAN PAVLOV1
ABSTRACT
Since the beginning of the world economic crisis the level of unemployment across different countries increased significantly and so did social and welfare polarization of people. Under these conditions the emergence of social entrepreneurship could be viewed as an additional opportunity for the disadvantaged people to enhance their welfare and improve their living quality. As all the phenomena of such kind its ac-tivity should be coordinated by some special institutions in order to develop successfully, thus enhancing its aggregate performance. The paper reviews different kinds of economic systems inherent to certain types of integration between financial and industrial resources. So, the system of industrial development of the USA relies in most part on the stock market, while that of several European countries, such as the United King-dom and Germany prefer to use credit resources, or the loan capital. The main purpose of the paper is to find out whether such trends hold true for the institutional structures of social entrepreneurship in these countries and whether that is the case for Russia as a country with a transitional economy. The paper con-tains some implications for such countries suggesting them to consider some opportunities of evolving their market-based institutions and bank sector to create a more suitable institutional system to support the development of social entrepreneurship.
KEY WORDS: social entrepreneurship, institutions, market-based systems, ethical markets.
JEL Classification: M13, M14, O17 Received: May 04, 2013 / Accepted: November 16, 2013
1. INTRODUCTION
Social entrepreneurship has become a very popular phenomenon among different scholars now-adays. It presents a great interest not only because of its extraordinary nature, but also due to the paradigm crisis of the neo-liberal economic model, whose features are becoming increasingly evident for the recent times. The events which happened on 17 September 2011, when the pro-test movement ‘Occupy Wall Street’ began in Zuccotti Park, were impressionable by their scale and impact. The wave of protest movements all over the world that followed this action showed that the social discontent with economic inequality of people has been growing. According to the U.S. Census Bureau data, the proportion of overall wealth-a measure that includes home equity, stocks and bonds and the value of jewelry, furniture and other possessions-held by the top 10% of the population increased from 49% in 2005 to 56% in 2009 (Morin, 2012). At the same time the share of economically excluded people is growing steadily, which is evidenced by the recent data on the high rates of unemployment in Portugal and Spain.
As A. Badulescu points out, “social entrepreneurship aims at being an effective approach, even if it does not follow the personal profit of the entrepreneur but the fulfillment of social objec-tives with broader community impact; maximizing money invested for the good of the community or for solving social problems remains a priority”. Some examples of social entrepreneurship emerged in the first half of the 19th century, though they were unique and not a mass phenome-non. For the recent decades, this sector has flourished greatly penetrating to the developed as well as developing countries. 1 Central Economics and Mathematics Institute, Russian Academy of Sciences, Moscow, Russia [email protected]
MONTENEGRIN JOURNAL OF ECONOMICS, Vol. 9, No. 4 (December 2013), 87-97
Ruslan Pavlov 88
It’s interesting to note that the left movement ideology has attracted lots of new followers which reflects, in particular, in the Marxism revival. ‘Why Marx was right?’ by T. Eagleton proved to be a bestseller since lots of problems, connected with the system peculiarities of the paradigm being criticized by the contemporary scholars, were efficiently elaborated in the Marxist’ terms and some disturbances in the social and economic system resulted from the current trends of the mainstream policy were emphasized against the same disturbances the world economy faced more than a century ago (Eagleton, 2011). Such analogies have become of a great importance allowing for the crisis of methodological tools in the modern economics. Besides, the legitimacy of the left political movement in Europe is increasing, which is evidenced by the victory of the so-cial-democrats at the last parliamentary elections in Italy and the presidential in France. These are, in turn, the signs of poverty growth, labor migration, social exclusion and the failure to solve such problems by means of traditional ways of applying market mechanisms. Such challenge suggests to think about social entrepreneurship as a possible way to mitigate the distortions stated above. It can be viewed not only as an economic or social phenomenon, but also as a po-litical movement, as it challenges the dominating paradigm at all the levels of its pervasion, forc-ing the governments to introduce some important radical measures aimed at supporting its de-velopment.
2. HIERARCHY OF SOCIAL ENTREPRENEURSHIP INSTITUTIONS
The available literature on social entrepreneurship allows us to argue that there were several at-tempts to classify this phenomenon, though they were based upon a certain criterion, regardless of the fact that it might have different scales of development. In this context the classification provided by A.Nicholls (2007) seems to be successful, as it challenges the dominant paradigm at different dimensions. According to it, social enterprises challenge the dominant paradigm at three levels, micro (the enterprises), meso (new markets; intermediaries) and macro (socio-economic impact; policy implications). These refer to social enterprises that (1) respond to mar-ket failure and/or “institutional void” by developing new products and services, (2) contribute to the reconfiguration of markets to generate new or increased social value and (3) challenge insti-tutional arrangements through political action. From Nicholls' point of view, the third level of insti-tutions should be presented by social enterprises. Though it is rather an excessive assumption, as in addition to social enterprises they should also involve the ways of mitigating social problems at the micro-level, which become embedded into an original institutional form. Thus, in order to en-able an adequate reflection at micro-level, different ways of eliminating social cataclysms within a given micro-environment should be included into this concept, which don’t necessarily have the form of social enterprises.
So, if we imagine the hierarchy of social entrepreneurship institutions, we’ll get the picture as that presented in Figure 1. It’s an improved version of Nicholls’ classification as a pyramid with three levels, the first of which should present the macro-level institutions, the second deals with the activities of intermediaries and markets, e.g. social capital markets, and the third one pre-sents the myriad of the local country- and region-specific institutions which are inherent to the particular place shaping its origins and nature, while contributing in some way to forming the relative institutions at the meso-level. The intermediaries presenting a nexus of some financial institutions designed to support social enterprises can be viewed as meso-level structures coordi-nating the activities of those from the bottom level. So, Community Development Financial Insti-tutions (CDFIs) in the United States can exemplify this kind of institutions, as they present a net-work of special innovative financial mechanisms embedded in the current institutional structure surrounding communities. The macro-level institutions are those which influence much the dy-namics of social entrepreneurship as a socio-economic phenomenon in the given country or worldwide. They can be embedded in certain regulations, laws, policies or some original institu-tions, which are capable to change the existing status quo at the level of a given country, not within certain communities or districts.
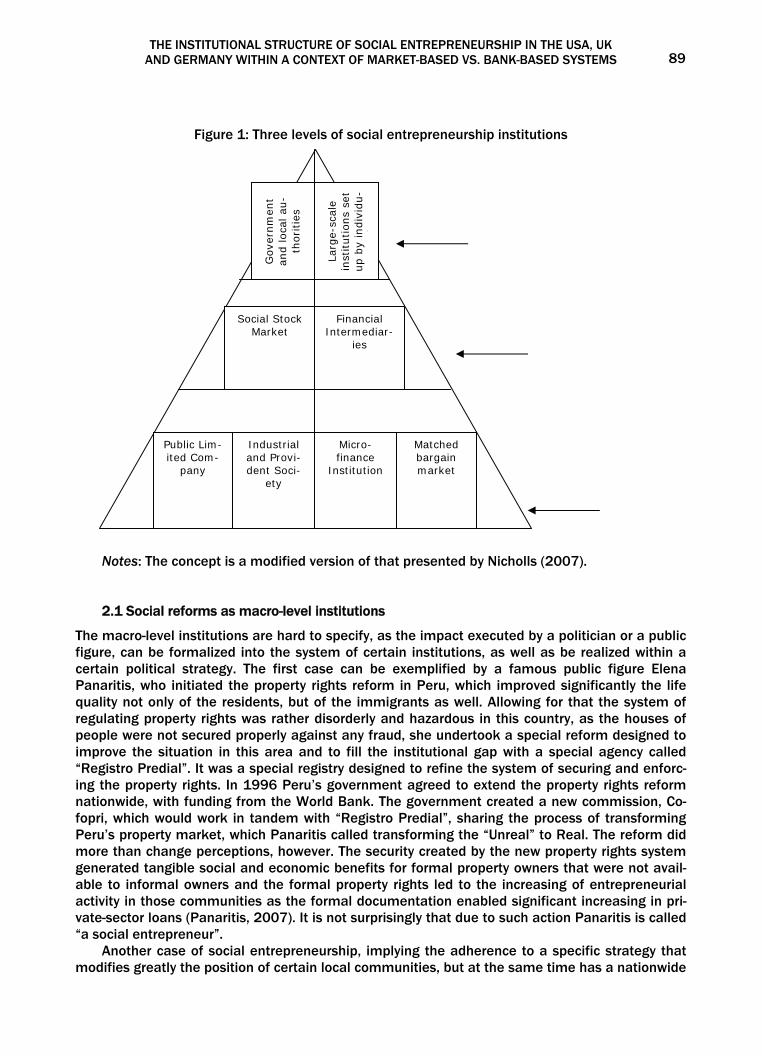
THE INSTITUTIONAL STRUCTURE OF SOCIAL ENTREPRENEURSHIP IN THE USA, UK AND GERMANY WITHIN A CONTEXT OF MARKET-BASED VS. BANK-BASED SYSTEMS 89
Figure 1: Three levels of social entrepreneurship institutions
Macro-level
Meso-level
Micro-level
Notes: The concept is a modified version of that presented by Nicholls (2007).
2.1 Social reforms as macro-level institutions
The macro-level institutions are hard to specify, as the impact executed by a politician or a public figure, can be formalized into the system of certain institutions, as well as be realized within a certain political strategy. The first case can be exemplified by a famous public figure Elena Panaritis, who initiated the property rights reform in Peru, which improved significantly the life quality not only of the residents, but of the immigrants as well. Allowing for that the system of regulating property rights was rather disorderly and hazardous in this country, as the houses of people were not secured properly against any fraud, she undertook a special reform designed to improve the situation in this area and to fill the institutional gap with a special agency called “Registro Predial”. It was a special registry designed to refine the system of securing and enforc-ing the property rights. In 1996 Peru’s government agreed to extend the property rights reform nationwide, with funding from the World Bank. The government created a new commission, Co-fopri, which would work in tandem with “Registro Predial”, sharing the process of transforming Peru’s property market, which Panaritis called transforming the “Unreal” to Real. The reform did more than change perceptions, however. The security created by the new property rights system generated tangible social and economic benefits for formal property owners that were not avail-able to informal owners and the formal property rights led to the increasing of entrepreneurial activity in those communities as the formal documentation enabled significant increasing in pri-vate-sector loans (Panaritis, 2007). It is not surprisingly that due to such action Panaritis is called “a social entrepreneur”.
Another case of social entrepreneurship, implying the adherence to a specific strategy that modifies greatly the position of certain local communities, but at the same time has a nationwide
Public Lim-ited Com-
pany
Industrial and Provi-dent Soci-
ety
Micro-finance
Institution
Matched bargain market
Financial Intermediar-
ies
Social Stock Market
La
rge-
scal
e in
stitutions
set
up b
y in
div
idu-
l
Gove
rnm
ent
and loca
l au
-th
ori
ties
Ruslan Pavlov 90
effect, is connected with some political measures introduced by the former US president Bill Clin-ton. As Figure 2 shows, the rank of early stage social entrepreneurial activity (SEA) in the United States is the highest, as compared with those of other countries, according to the data provided by the Global Entrepreneurship Monitor (2009). SEA is the social equivalent of the total early-stage entrepreneurial activity index (TEA) which is measured as the percentage of a country’s working-age population who are actively trying to start a new business (nascent entrepreneurs) and those who at least partially own and manage a business less than 3.5 years old (a baby busi-ness). Its highest rate in most part can be explained by the longevity of charity traditions in the United States which would be of the same force as the entrepreneurship ones. Numerous exam-ples mentioned by Clinton (2009) in his book “Giving/How Each of Us Can Change the World” suggest that. Besides, he is known as a person launching several charity initiatives, but that is not why he should be called “a social entrepreneur”. He managed to force the financial institutions to provide loans for the low-income communities, while most of them refused to do that before. Ac-cording to the amendment of 1995 to the Community Reinvestment Act of 1933, they might be closed in the case of refusal. Such measure can be treated not only as social, but also as entre-preneurial, as it had the same effect as that implemented by Panaritis. The highest rate of early stage entrepreneurial development can be explained in part by the environment encouraging people to engage in business of such kind, that was formed under the period of Clinton’s presi-dency. We can’t help but mention emergence of the Community Development Financial Institu-tions which shaped greatly the institutional structure to support social entrepreneurship at that time.
Figure 2: Early-stage social entrepreneurial activity (SEA) rate in different countries, 2009
0.00%0.50%1.00%1.50%2.00%2.50%3.00%3.50%4.00%4.50%
UKFranc
e
German
yita
lyUSA
Brazil
Russia
China
Source: GEM (2009) “United Kingdom 2009 Monitoring Report”, [online] Global Entrepreneurship Monitor, http://strath.ac.uk/media/departments/huntercentre/research/gem/GEM_UK_2009.pdf.
2.2 Social stock market and loan stock institutions at the meso-level
The meso-level institutions present the intermediary level in this structure. Marking this group of institutions as a specific category is of great importance because it is not only a superstucture over that beneath, but is also a factor which shapes ant determines the behavior and perform-ance of the micro-level institutions. So, for instance, the social capital market which is coordi-nated by a network of international financial organizations, such as the International Association of Investors in the Social Economy which was thoroughly investigated by Mendell and Nogales (2009), can be viewed as a cluster which originated from the bottom of this pyramid, but it can influence significantly the subsequent trends of development of micro-institutions worldwide. In this context the emergence of a social stock market should be mentioned.
THE INSTITUTIONAL STRUCTURE OF SOCIAL ENTREPRENEURSHIP IN THE USA, UK AND GERMANY WITHIN A CONTEXT OF MARKET-BASED VS. BANK-BASED SYSTEMS 91
For the recent decade there were several attempts in the world aimed at constructing some mechanisms to enable social enterprises to act as conventional business enterprises – that is to provide them with the opportunity to issue shares, but allowing for the high-level risk con-nected with their trading at an ordinary stock exchange, it should be advisable to let them trade at a special stock exchange designed for that. So, the United Kingdom and Germany can play a pivotal role in installation and deployment of such mechanisms. Whereas the former belongs to the market-based countries range, the latter belongs to another group, consisting of bank-based countries, but it didn’t miss the chance of adopting such mechanisms which seem to be effective. A special meso-institution, such as the Social Stock Exchange Association (SSEA), has been oper-ating in Germany for the recent 5 years. It is designed not only to ensure forming the social stock market within this country, but also expands its influence abroad to help other countries which are engaging in such difficult and controversial process.
Though this institution is implementing a pilot project in Germany, it is also engaged in similar activities in Portugal, where the processes of launching a social stock exchange are well underway. Moreover, it organizes different events for similar initiatives to get involved, collabo-rate and learn from each other’s experience (SSEA, 2013). The initiators of such project are deemed to be aware of the financial risk connected with the assets of social enterprises, implying the low return rate on the capital invested. The main task of SSEA project in Germany is to create a platform that will offer investors some clear comparability on the social and technological im-pact on their investments, which will yield a slightly lower (single digit) financial return. Though this platform is not launched yet, it has a preliminary stage which expressed in the meeting which was held on 25 March 2011. At this meeting five social ventures were pitching to a dozen inves-tors for a financing volume of roughly € 20 million (Kuhlemann, 2011). We should think that taken such event as the first indicator characterizing the activity of social stock market in Ger-many nowadays, we can make a conclusion that in any case Germany leaves behind the UK where the total sum raised from the ethical issue shares amounted £ 50.1 million by 2005 (Hartzell, 2007) that equals € 58.6 million which is about three times as many as this value.
Table 1: Number of Ethical Share Issues and Total Raised and the turnover at
LSE in the UK in the period 1984-2005
Period Number of issues Total raised (£ million) Total turnover at LSE (£ million)
1984-1990 6 3.35 1,899,136.4 1991-1995 8 4.17 2,610,621,9 1996-2000 13 10.55 6,097,414.2 2001-2005 16 32.03 7,931,012,52
Total 43 50.1 18,538,185.02 Sources: Hartzell J. (2007) “Creating an ethical stock exchange”, [online] Skoll Centre for Social Entrepreneurship, www.sbs.ox.ac.uk/Skoll/Ethical_Stock_Exchange.pdf. and the data de-rived from the website: http://www.londonstockexchange.com .
Though this table suggests that the kink between these variables is evident, we should seek to find out it more accurately. So, if we try to calculate the link between the time series of all these variables for the period from 1984 to 2005, we’ll get the values as those presented in table 2. These findings suggest that the strongest link exists between the total turnover at LSE and the number of issues. As for others, they are less, but it doesn’t mean that we should neglect them.
The process of launching the social stock exchange in the United Kingdom is also still ongo-ing, as well as in Germany. Nevertheless there are several ways of executing such operations be-yond such exchange. Such operations are possible due to a three-step system of ethical share investment in the UK which presents a way for social enterprises to adopt their abilities within a less stringent environment than that for the existing business enterprises. So, these steps are: the Off-Exchange (OFEX), the Alternative Investment Market (AIM) and the London Stock Exchange
Ruslan Pavlov 92
(LSE). All of them can be considered as a hierarchical tree, in which companies graduate from one level to the next as they grow in size. Indeed, AIM was established by the LSE for companies being at their earlier stages of development. The markets which are higher up the tree offer greater liquidity, but are more expensive to list on and the listing requirements are more stringent in terms of disclosure of the price sensitive information.
Table 2: Pearson correlation matrix of the variables featuring the linkages between the activity of the social stock market and that of the mainstream stock market in the UK
Total turnover at LSE (£ million)
Total raised (£ million) Number of issues
Total turnover at LSE (£ million) 1.000 Total raised (£ million) 0.899 1.000 Number of issues 0.997 0.895 1.000
Notes: The correlation indices are calculated by the author using the figures stated above.
Thus a company might first choose to list on OFEX, where the cost of listing is only around £ 10,000 a year or less, but trading there can be deceptive, as some OFEX shares are not traded at all for long periods. The share price then remains static and may not reflect the value that a share might achieve in a more liquid market. The lack of competition and the absence of due confi-dence among investors cause the fall in the share price. Although many companies go straight to AIM, a listing on OFEX is often a first step towards an AIM listing. But AIM is a very important step for social enterprises, as it is a chance for them to attract some major institutional investors. However, fees for listing on AIM are likely to be between £ 300,000 and £ 500,000 even exclud-ing marketing costs (Hartzell, 2007). For a social enterprises, where a high profit level is not to be expected, share issues therefore need to be in the range between £ 10 to £ 20 million to stand a chance of covering the costs of fees. Raising this level of investment is often unrealistic, allowing for the financial condition of social enterprises. The larger of the AIM companies move to the London Stock Exchange. Some of them have a balance sheet as small as £ 10 million, but most are much larger. However there is a threat of a hostile takeover for the enterprises seeking to at-tract large amounts from the institutional investors or venture capitalists. That is also the reason which prevents social businesses from being the actors on the mainstream market.
While the UK demonstrates an example of enhanced activity in the field of social stock op-erations, Germany appears to be one of the leaders on the development rate of microfinance in-stitutions (see Table 2) and in this sense matches its position as a bank-based country absolutely. In most part Germany’s successes in the development of microcredit system can be explained by the effective performance of such meso-institution as the German Microfinance Institute, as it provides a wide range of different services, in particular, counseling and training for MFIs (e.g. their loan officers), designing electronic loan processing tools and accrediting MFIs for the risk capital fund which is called “Microfinanzfonds Deutschland” (El-Zoghby, Gähwiler, Lauer, 2011).
Table 3: Main microfinance indicators in selected European countries
Microfinance Indicators
Country Number of loans disbursed
Total value of loans disbursed (EUR M)
Average Loan Size (EUR)
Average Inter-est Rate (%)
Germany 4,625 52,276,375 11,303 6.92 Italy 3,223 22,451,418 6,966 5.80 Spain 8,773 97,800,000 9,943 5.00 UK 1,252 13,420,000 10,718 13.40 Romania 2,496 18,847,296 7,551 - Bulgaria 68,348 432,890 6,334 - Czech Republic - - 4,500 - Slovakia 982 155,000,000 157,841 6.50
THE INSTITUTIONAL STRUCTURE OF SOCIAL ENTREPRENEURSHIP IN THE USA, UK AND GERMANY WITHIN A CONTEXT OF MARKET-BASED VS. BANK-BASED SYSTEMS 93
France 121,000 852,500,500 7,045 0.5 Poland 130,888 - 2,024 11.00 Netherlands 43,508 739,636,000 17,000 - Hungary 104,754 371,876,700 3,550 -
Source: Kraemer-Eis H., Conforti A. (2009) Microfinance in Europe. A market overview, [on-line], European Investment Fund, http://www.eif.org/news_centre/publications/EIF_WP_2009 _001_ Microfinance.pdf.
As for the situation in the microfinance industry, let’s investigate the positions of German mi-crofinance sector to find out whether the environment of banking sector shapes the microfinance development in this country. As we can see, according to the data presented in table 4, the trends of development of both variables are not so parallel as those for the social stock market and London stock exchange in the UK, but the link is also positive: the correlation index is 0,725. it is weaker because of the relative stability of the microfinance industry in the beginning of its devel-opment, while the total banking sector experienced a short decline caused by the worsening of the macroeconomic situation in the country. Nevertheless we can conclude that the linkages be-tween the financial mechanisms of social entrepreneurship and the environment they evolve in exist. So it would be advisable for different countries to consider the opportunities of developing those institutions which match the type of their financial systems. That means that path depend-ence is a very important thing for the development of financial mechanisms of social enterprises.
Table 4: The dynamics of profits of commercial banks and the average-weighted growth of assets of microfinance institutions in Germany in the period 2004-2009
Year Profits of commercial banks (Billions of Euros)
Average-weighted growth of assets of MFIs (%)
2004 5 38 2005 20 31 2006 10 35 2007 18 45 2008 -5 15 2009 5 22
Sources: Germany. Banking Sector Structure. Technical Note, July 2011, International Monetary Fund /
http://www.imf.org/external/pubs/ft/scr/2011/cr11370.pdf; Microfinance in evolution. An industry be-tween crisis and advancement / Current Issues. Global financial markets. Deutsche Bank (DB Research), September 13, 2012 / http://www.dbresearch.com/PROD/DBR_INTERNET_EN-PROD/PROD0000000000 294314.pdf?kid=dbr.inter_ghpen.headline.
2.3 Matched bargain market in the UK as an example of micro-level institutions
As in the United States and Germany the social capital market is only at the stage of installation, while in the United Kingdom it is at the stage of deployment yet, we’ll focus only on the English institutions as having settled fundamentally and providing a very valuable experience on this point. In this country a company a company not listed on the mainstream markets can usually only trade its shares through a matched bargain market. This is usually run by a broker or a rec-ognized financial institution, and involves holding a list of buyers and sellers of the shares and matching them at the price they both wish to pay. So the matched bargain market for a certain enterprise can be viewed as a micro-level institution. Matched bargain markets usually operate for one company in isolation rather than for several companies. Moreover, the Financial Services and Markets Act limits the extent to which the investment can be marketed. Price-setting on a matched bargain market is usually a haphazard affair. Quite often it is left to buyer and seller to agree, but if any price at all is recommended, it is usually the broker running the market who would recommend a price, based on information provided by the company. Thus in a matched
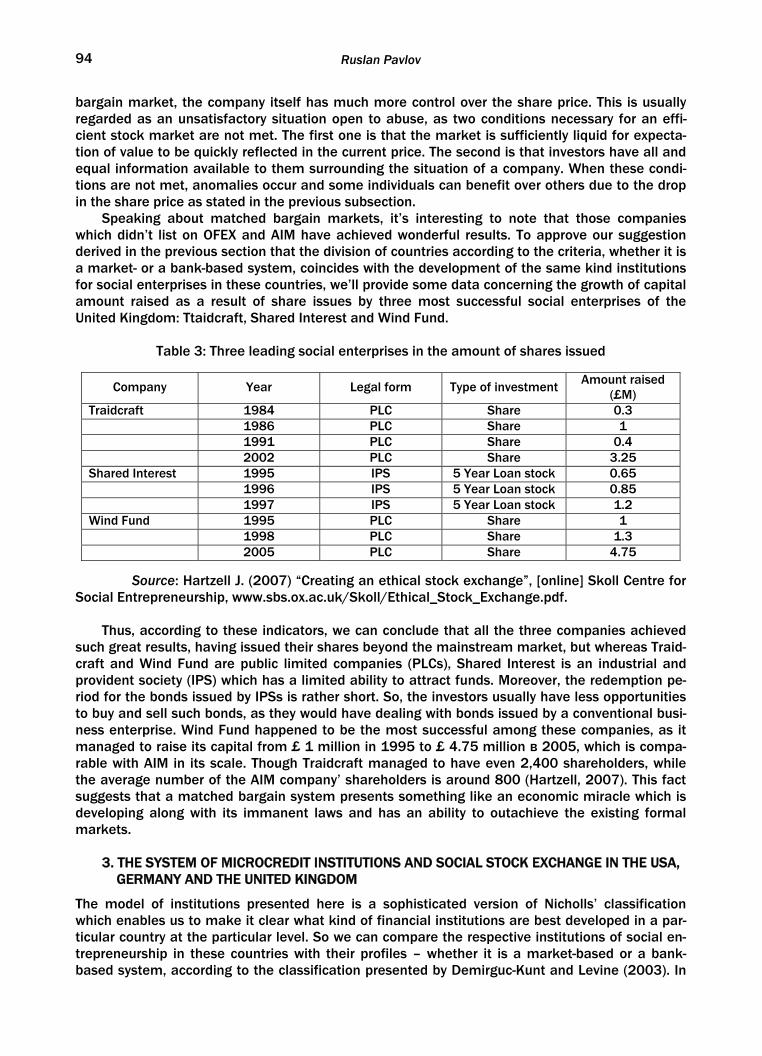
Ruslan Pavlov 94
bargain market, the company itself has much more control over the share price. This is usually regarded as an unsatisfactory situation open to abuse, as two conditions necessary for an effi-cient stock market are not met. The first one is that the market is sufficiently liquid for expecta-tion of value to be quickly reflected in the current price. The second is that investors have all and equal information available to them surrounding the situation of a company. When these condi-tions are not met, anomalies occur and some individuals can benefit over others due to the drop in the share price as stated in the previous subsection.
Speaking about matched bargain markets, it’s interesting to note that those companies which didn’t list on OFEX and AIM have achieved wonderful results. To approve our suggestion derived in the previous section that the division of countries according to the criteria, whether it is a market- or a bank-based system, coincides with the development of the same kind institutions for social enterprises in these countries, we’ll provide some data concerning the growth of capital amount raised as a result of share issues by three most successful social enterprises of the United Kingdom: Ttaidcraft, Shared Interest and Wind Fund.
Table 3: Three leading social enterprises in the amount of shares issued
Company Year Legal form Type of investment Amount raised (£M)
Traidcraft 1984 PLC Share 0.3 1986 PLC Share 1 1991 PLC Share 0.4 2002 PLC Share 3.25 Shared Interest 1995 IPS 5 Year Loan stock 0.65 1996 IPS 5 Year Loan stock 0.85 1997 IPS 5 Year Loan stock 1.2 Wind Fund 1995 PLC Share 1 1998 PLC Share 1.3 2005 PLC Share 4.75
Source: Hartzell J. (2007) “Creating an ethical stock exchange”, [online] Skoll Centre for Social Entrepreneurship, www.sbs.ox.ac.uk/Skoll/Ethical_Stock_Exchange.pdf.
Thus, according to these indicators, we can conclude that all the three companies achieved such great results, having issued their shares beyond the mainstream market, but whereas Traid-craft and Wind Fund are public limited companies (PLCs), Shared Interest is an industrial and provident society (IPS) which has a limited ability to attract funds. Moreover, the redemption pe-riod for the bonds issued by IPSs is rather short. So, the investors usually have less opportunities to buy and sell such bonds, as they would have dealing with bonds issued by a conventional busi-ness enterprise. Wind Fund happened to be the most successful among these companies, as it managed to raise its capital from £ 1 million in 1995 to £ 4.75 million в 2005, which is compa-rable with AIM in its scale. Though Traidcraft managed to have even 2,400 shareholders, while the average number of the AIM company’ shareholders is around 800 (Hartzell, 2007). This fact suggests that a matched bargain system presents something like an economic miracle which is developing along with its immanent laws and has an ability to outachieve the existing formal markets.
3. THE SYSTEM OF MICROCREDIT INSTITUTIONS AND SOCIAL STOCK EXCHANGE IN THE USA, GERMANY AND THE UNITED KINGDOM
The model of institutions presented here is a sophisticated version of Nicholls’ classification which enables us to make it clear what kind of financial institutions are best developed in a par-ticular country at the particular level. So we can compare the respective institutions of social en-trepreneurship in these countries with their profiles – whether it is a market-based or a bank-based system, according to the classification presented by Demirguc-Kunt and Levine (2003). In
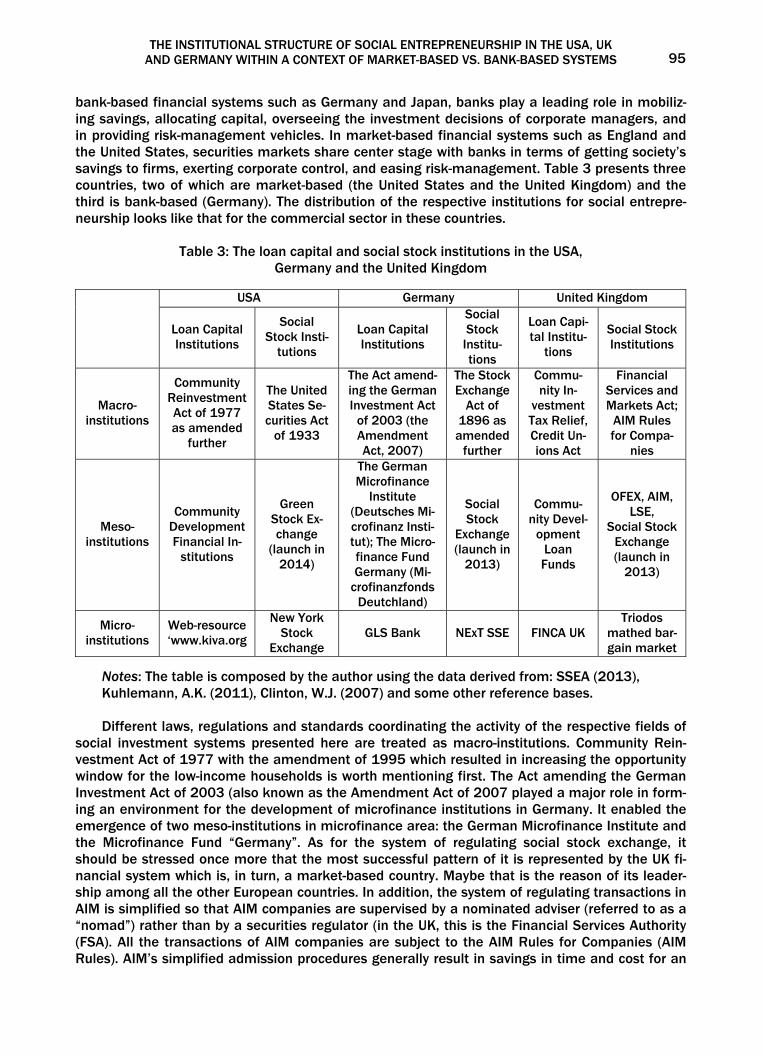
THE INSTITUTIONAL STRUCTURE OF SOCIAL ENTREPRENEURSHIP IN THE USA, UK AND GERMANY WITHIN A CONTEXT OF MARKET-BASED VS. BANK-BASED SYSTEMS 95
bank-based financial systems such as Germany and Japan, banks play a leading role in mobiliz-ing savings, allocating capital, overseeing the investment decisions of corporate managers, and in providing risk-management vehicles. In market-based financial systems such as England and the United States, securities markets share center stage with banks in terms of getting society’s savings to firms, exerting corporate control, and easing risk-management. Table 3 presents three countries, two of which are market-based (the United States and the United Kingdom) and the third is bank-based (Germany). The distribution of the respective institutions for social entrepre-neurship looks like that for the commercial sector in these countries.
Table 3: The loan capital and social stock institutions in the USA, Germany and the United Kingdom
USA Germany United Kingdom
Loan Capital Institutions
Social Stock Insti-
tutions
Loan Capital Institutions
Social Stock
Institu-tions
Loan Capi-tal Institu-
tions
Social Stock Institutions
Macro-institutions
Community Reinvestment Act of 1977 as amended
further
The United States Se-curities Act
of 1933
The Act amend-ing the German Investment Act
of 2003 (the Amendment Act, 2007)
The Stock Exchange
Act of 1896 as amended
further
Commu-nity In-
vestment Tax Relief, Credit Un-ions Act
Financial Services and Markets Act;
AIM Rules for Compa-
nies
Meso-institutions
Community Development Financial In-
stitutions
Green Stock Ex-change
(launch in 2014)
The German Microfinance
Institute (Deutsches Mi-crofinanz Insti-tut); The Micro-finance Fund Germany (Mi-
crofinanzfonds Deutchland)
Social Stock
Exchange (launch in
2013)
Commu-nity Devel-
opment Loan Funds
OFEX, AIM, LSE,
Social Stock Exchange (launch in
2013)
Micro-institutions
Web-resource ‘www.kiva.org
New York Stock
Exchange GLS Bank NExT SSE FINCA UK
Triodos mathed bar-gain market
Notes: The table is composed by the author using the data derived from: SSEA (2013), Kuhlemann, A.K. (2011), Clinton, W.J. (2007) and some other reference bases.
Different laws, regulations and standards coordinating the activity of the respective fields of
social investment systems presented here are treated as macro-institutions. Community Rein-vestment Act of 1977 with the amendment of 1995 which resulted in increasing the opportunity window for the low-income households is worth mentioning first. The Act amending the German Investment Act of 2003 (also known as the Amendment Act of 2007 played a major role in form-ing an environment for the development of microfinance institutions in Germany. It enabled the emergence of two meso-institutions in microfinance area: the German Microfinance Institute and the Microfinance Fund “Germany”. As for the system of regulating social stock exchange, it should be stressed once more that the most successful pattern of it is represented by the UK fi-nancial system which is, in turn, a market-based country. Maybe that is the reason of its leader-ship among all the other European countries. In addition, the system of regulating transactions in AIM is simplified so that AIM companies are supervised by a nominated adviser (referred to as a “nomad”) rather than by a securities regulator (in the UK, this is the Financial Services Authority (FSA). All the transactions of AIM companies are subject to the AIM Rules for Companies (AIM Rules). AIM’s simplified admission procedures generally result in savings in time and cost for an
Ruslan Pavlov 96
AIM admission as compared to a main market or other listing. In most part the creation of such institution was predetermined by the increased activity of matched bargains, which was, in turn, caused by the traditions of using stock exchange as a leading mechanism to support industrial development in this country.
4. IN CONCLUSION
The main result of the paper is a modified version of Nicholls’ classification of challenges against the dominant neo-liberal paradigm. It is modified so that it might include the main institutions orienting the activities of social enterprises which proved to be effective. Such model would help us to assess the completeness of coverage of the relevant aspects in the system of institutional regulation of the subject in issue. Its application allowed us to answer the question, what institu-tions are more developed in the countries observed and whether it matches the widespread opin-ion on the separation of countries between market-based and bank-based. The result is that such trends hold rather true for the financial streams of social enterprises in the UK and Germany. Consequently, it should be advisable to recommend those countries having strong traditions of stock market development to put a special emphasis on the development of relative financial institutions to support social enterprises, whereas those relying upon a strong system of bank institutions would be reasonable to develop the microfinance sector to achieve the competitive advantage for their social enterprises. As E. Panaritis argues, to build an “enabling environment’ seems better than to adopt paternalistic policies by the government, as it “would create the con-ditions for economic growth” (Panaritis, 2007, p. 91). So, it’s difficult to disagree with such sug-gestion.
Besides, one should say some words about the way of attributing these implications to the analysis of the situation in developing countries. For instance, Russia might be subsumed under the group of bank-based, rather that market-based countries because of its path dependence connected with long traditions of bank monitoring system which originated in the Soviet Union and was performed by the State Bank. To speak about Russia as a market-based country pre-sents a great difficulty, because it lacks the established class of social investors which is well rep-resented in such countries as USA and UK thereby contributing to their image as market-based countries. Moreover, Russia has one of the lowest positions in the ranking of social responsibility of business across different countries, occupying the 37th place (Belova, 2011). Only Turkey has a worse position being at the bottom of the list. The implications derived in the paper could be valuable when planning the strategy of development for different countries. The link between the kind of economic system and the respective institutions of supporting social entrepreneurship should be taken into account when projecting the strategy of development of financial mecha-nisms for social enterprises in the respective countries. As the amount of the paper is rather lim-ited we hadn’t the opportunity to reinforce our implications by an empirical research. This task faces a problem of collecting data on the development rates of bank and market institutions in the respective countries, but it seems rather realistic to perform. So, maybe further it would be possible to construct a regression model showing the link between the level of development of market- and bank-based economies and the respective rates of social entrepreneurship’ institu-tions in those countries.
REFERENCES
Badulescu, A., Sipos-Gug, S. & Borza A. (2013), “Environmental Obstacles and Support Factors of So-cial Entrepreneurship” in Proceedings of the 8th European Conference on Innovation and Entrepreneurship. Ed. P. Teirlinck and F. de Beule, ACPI, Reading.
Belova, T. (2011), “The most socially responsible countries”, [online] RBK Rating, http://rating.rbc.ru/ article.shtml?2011/06/09/33318359
Clinton, W.J. (2007), Giving: How Each of Us Can Change the World, Alfred A. Knopf, New York. Demirguc-Kunt, A. & Levine, R. (2003), “Bank-based and market-based financial systems: cross-
country comparisons”, [online] World Bank, www-wds.worldbank.org/external/default/WDSContentServer /WDSP/IB/1999/09/14/000094946_99072307505320/additional/126526322_200411172106.pdf.
THE INSTITUTIONAL STRUCTURE OF SOCIAL ENTREPRENEURSHIP IN THE USA, UK AND GERMANY WITHIN A CONTEXT OF MARKET-BASED VS. BANK-BASED SYSTEMS 97
Eagleton, T. (2011), Why Marx was right, Yale University Press, London. El-Zoghby, M., Gähwiler, B., Lauer, K. (2011) Cross-border funding of microfinance, Focus Note, No. 70, April, 1-3.
GEM (2009), “United Kingdom 2009 Monitoring Report”, [online] Global Entrepreneurship Monitor, http://strath.ac.uk/media/departments/huntercentre/research/gem/GEM_UK_2009.pdf.
Hartzell, J. (2007), “Creating an ethical stock exchange”, [online] Skoll Centre for Social Entrepreneur-ship, www.sbs.ox.ac.uk/Skoll/Ethical_Stock_Exchange.pdf.
Kuhlemann, A.-K. (2011), “NExT SSE to promote ‘crowd investing’ in Germany”, Alliance, Vol. 16, No. 2, 2 June.
Mendell, M. & Nogales, R. (2009) “Social entrepreneurs in OECD member countries: what are the fi-nancial streams?” in The changing boundaries of social enterprises. Ed. A. Noya, Work Together Founda-tion, Seoul.
Morin, R. (2012), “Rising share of Americans see conflict between rich and poor”, [online], Pew Social & Demographic Trends, www.pewsocialtrends.org/2012/01/11/rising-share-of-americans-see-conflict-between-rich-and-poor/.
Nicholls, A. (2007), What is the Future of Social Enterprise in Ethical Markets?, Office of The Third Sec-tor, London.
Panaritis, E. (2007) Prosperity Unbound. Building Property Markets with Trust, Palgrave Macmillan, New York.
SSEA (2013), “Two major lines of SSEA work”, [online], Social Stock Exchange Association, www.so-cialstock.eu/what/

99
Author Guidelines
Submit to the journal Submissions should be sent via email to: Professor Veselin Draskovic [email protected]
Review process Each paper is reviewed by the editor and, if it is judged suitable for this publication, it is then
sent to two referees for double blind peer review. The authors’ names are anonymous to the re-viewers. Based on their recommendations, the editor then decides whether the paper should be accepted as is, revised or rejected.
The Editorial Board retains the right to methodologically adjust the article to the journal propositions and standards of the English language, as well as not to consider articles which do not meet the requirements of these guidelines.
Copyright Articles submitted to the journal should not have been published before in their current or
substantially similar form, or be under consideration for publication with another journal. Use this in conjunction with the points below about references, before submission i.e. always attribute clearly using either indented text or quote marks as well as making use of the preferred Harvard style of formatting. Authors submitting articles for publication warrant that the work is not an infringement of any existing copyright and will indemnify the publisher against any breach of such warranty.
The author is responsible for ensuring the authenticity of data, facts, quotations and other in-formation. The Editorial Boards may publish articles for discussion, without necessarily sharing the author’s views.
Manuscript requirements Please prepare your manuscript before submission, using the following guidelines: Format All files should be submitted as a Word document, A4 format, Garamond, font size 11 pt.
Article Length Articles should be between 3000 and 10000 words in length. For long articles, compliance of
editor-in-chief is required. Pictures, graphics and other attachments should be marked and sent as separate files, or in text, and must not exceed the journal format with margins.
Article Language It is strongly recommended to send articles in the English language. However, upon the com-
pliance of the Editorial Board, it is possible to publish articles in some of the other world lan-guages. Authors from Montenegro and surrounding countries should submit articles both in Eng-lish and mother tongue due to the bilingual nature of the website.
Article Title Page - An Article Title Page should be submitted alongside each individual article. This should include:
Article Title - A title of not more six eight words should be provided. Author Details - Details should be supplied on the Article Title Page including: Full name
of each author, Affiliation of each author, E-mail address of the corresponding author Structured Abstract - Authors must supply a structured abstract: Purpose, Metho-dology,
Approach, and Findings. Maximum is 250 words in total. Keywords - Immediately after the abstract, provide a maximum of 6 keywords. Article Classification - The articles are classified in the following categories: original scien-
tific paper, preliminary communication, review, professional paper, and book review. Classification codes - Please provide up to 6 standard JEL codes. The available codes may
be accessed at JEL: http://www.aeaweb.org/journal/jel_class_system.html
100
Article structure - The structure of article should comprise: the title, abstract, key words, introduction, subtitles, conclusion and bibliography. Articles can also be structured in the follow-ing way: introduction, starting hypotheses, solutions, discussion, conclusion and bibliography. Divide your article into clearly defined and numbered sections (1, 2,3, ...). Subsections should be numbered 1.1 (then 1.1.1, 1.1.2 ...), 1.2, etc. (the abstract is not included in section numbering).
Footnotes - Footnotes should be used as least as possible, and only for the necessary ex-planations, with the continuous use of Arabic numbers.
References Literature is not to be numerated. It is to be arranged in alphabetic order of authors and
chronologically for the articles of the same author. Literature is to be quoted according to the ex-amples for books, magazines and other sources.
References to other publications must be in Harvard style and carefully checked for completeness, accuracy and consistency. You should cite publications in the text: (Ilic, 2009) using the first named author's name or (Ilic and Tot, 2009) citing both names of two, or (Tot et al., 2009), when there are three or more authors. At the end of the paper a reference list in alphabetical order should be supplied:
For books Surname, Initials (year), Title of Book, Publisher, Place of publication. e.g. Bagdikian, B. H. (1983), The Media Monopoly, Beacon Press, Boston.
For book chapters Surname, Initials (year), "Chapter title", Editor's Surname, Initials, Title of Book, Publisher, Place of publication, pages.
e.g. Picard, R. G. (2005), “Money, Media, and the Public Interest”, in Overholster, G., Jamieson, K. H. (Ed.), The Press, Oxford University Press, Oxford, pp. 337-350.
For journals Surname, Initials (year), "Title of article", Journal Name, volume, number, pages.
e.g. Thacher, D. and Rein, M. (2004), „Managing Value Conflict in Public Policy”, Governance Vol. 17 No 4, pp. 457-486.
For published conference proceedings Surname, Initials (year of publication), "Title of paper", in Surname, Initials (Ed.), Title of published proceeding which may include place and date(s) held, Publisher, Place of publication, Page numbers.
e.g. Draskovic, V., Grego, Z., Draskovic, M. (2011), "Media Concentration, Neoliberal Paradoxes and Increase in Virtuality", in Media Concentration proceedings of the international conference in Podgorica, Montenegro 2011, Elit, Podgorica pp. 33-45.
For working papers Surname, Initials (year), "Title of article", working paper [number if available], Institution or organization, Place of organization, date.
e.g. Drašković, V. (2007), "Specificities and problems of Montenegrin transition", working paper, Leeds University Business School, TIGER, Warsaw, September.
For newspaper articles (authored) Surname, Initials (year), "Article title", Newspaper, date, pages.
e.g. Miller, M. C. (1997), "The Crushing Power of Big Publishing", The Nation, 17 March, p. 10. For newspaper articles (non-authored) Newspaper (year), "Article title", date, pages.
e.g. Vijesti (2011), „The New Media“ 2 December, p. 5. For electronic sources If available online, the full URL should be supplied at the end of the
reference, as well as a date that the resource was accessed. e.g. Compaine, B. M. (2005), „The Media Monopoly Myth: How New Competition is Expanding
our Sources of Information and Entertainment”, available at: http://www.NewMillennium Rese-arch.org//archive/ final_Compaine_Paper_050205. pdf (accessed 10 december 2011).