Embed Size (px)
Citation preview
ISSN 1561-2422
THE INFLUENCE OF SERVICES TRADE LIBERALIZATION ON SERVICE FLOWS AND INDUSTRY PRODUCTIVITY IN CIS
COUNTRIES AND RUSSIA
Knobel Alexander
Working paper No E12/05E
This project (No 10–148) was supported by the Economics Education and Research Consortium
and funded by the World Bank
All opinions expressed here are those of the authors
and not those of the Economics Education and Research Consortium
Research dissemination by the EERC may include views on policy, but the EERC itself takes no institutional policy positions
2
Abstract
This paper estimates the influence of the service sector’s liberalization on service flows in
transition economies and on productivity of the Russian industry that uses these services as
intermediate consumption. Empirical analysis of the international statistics shows that service
trade between CIS countries and OECD countries is strongly underestimated and could grow
2.5–3 times larger due to liberalization. Modeling of the international service trade shows that
services imports into Russia are strongly limited by existing trade barriers. For Russia,
according to the estimates, the most liberalized service sector is communication services, and
the least liberalized sector is information technology. This paper demonstrates that services
are actively used by Russian industry as intermediate consumption. On the basis of the inter-
industry empirical analysis, one can conclude that service sector liberalization may have a
positive impact on the productivity of various sectors of the Russian manufacturing industry.
Keywords: import volumes, services, trade liberalization, gravity model, panel data, labor
productivity
JEL: C23, F12, F14, O14
Alexander Knobel, Gaidar Institute for Economic Policy. Head of International Trade
Department. office 544, build. 1, 3–5, Gazetny lane, Moscow, 125993 Russia. Tel: +7 (495)
629–92–66. EMail: [email protected]. I would like to thank David Tarr, Oleksandr Shepotylo,
and Volodymyr Vakhitov for valuable comments.
February 2012
3
CONTENT
1. INTRODUCTION ............................................................................................................................. 4
2. LITERATURE REVIEW ................................................................................................................. 5
3. MODELS SPECIFICATION AND ESTIMATION RESULTS ................................................... 8
3.1. SERVICE TRADE FLOWS ESTIMATION ........................................................................................... 8
3.1.1. Service trade between the CIS and OECD .......................................................................... 8
3.1.2. International service trade ................................................................................................ 13
3.2. INDUSTRY PRODUCTIVITY AND SERVICE LIBERALIZATION ....................................................... 20
4. CONCLUSION ................................................................................................................................ 29
5. REFERENCES ................................................................................................................................ 30
6. APPENDIX ...................................................................................................................................... 34
4
1. Introduction
During the Soviet era, external trade in services was extremely limited. Given the
modern growth of the international trade in goods, trade in services demands separate
consideration for transition economies in general; for Russia in particular, this issue has been
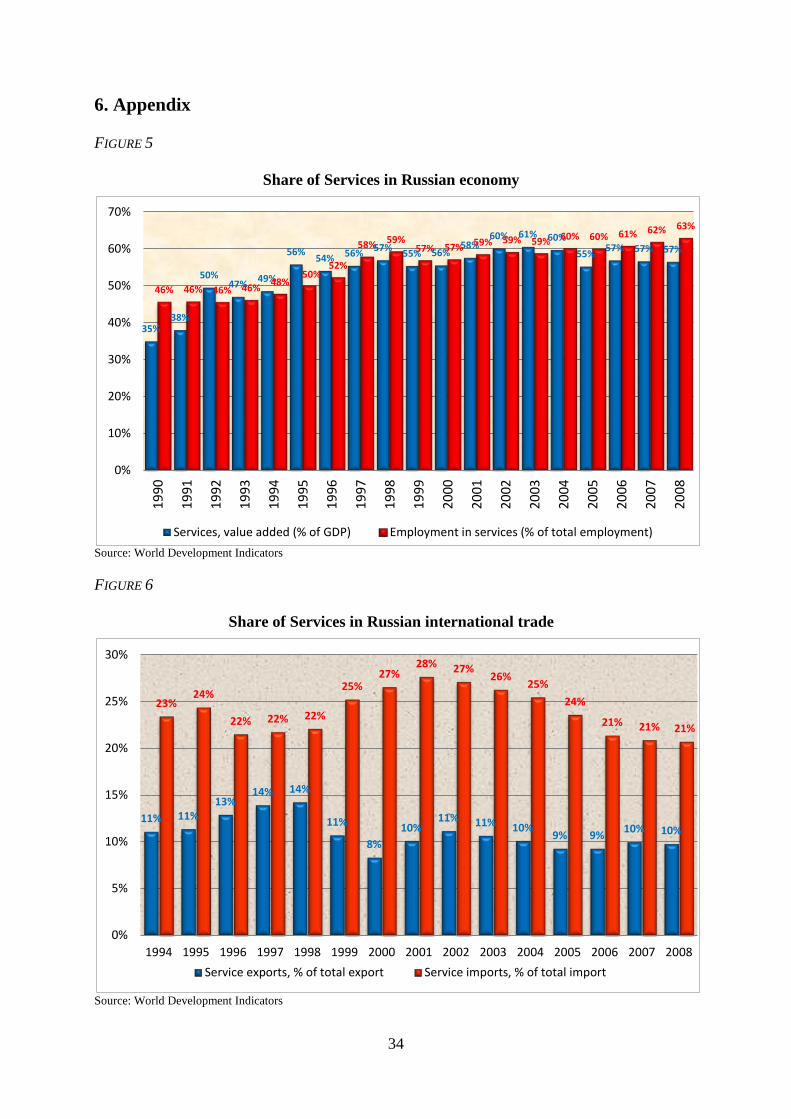
poorly investigated. Throughout the transition period, the services sector share of the
economy grew, though in recent years this growth has slowed: from 1990 to 2008, the share
of services in value added rose from 35% to 57%. At the same time, the share of trade in
services of total trade did not increase: service imports as a share of total Russian imports
were 23% in 1994 and 21% in 2008. Thus, it is quite probable that the international trade
turnover of the Russian Federation in the services sphere strongly underestimates the potential
level. One possible explanation that will be investigated in this paper is that there are
restrictions on services trade that affect both domestic and foreign suppliers of trade in
services, including discrimination against foreign suppliers.
All manufacturing industries use services as inputs. Thus, service liberalization may
lead to reduced input prices and increased industry productivity of the manufacturing sector.
In recent years, considerable liberalization of the service sector in Eastern European countries
has taken place. Many researchers conclude that service liberalization has had a positive
impact on productivity in the industry, and this result proves to be true of firm-level and
industry-level data. On the other hand, many believe that the Russian service sector remains
underdeveloped, making it is impossible to open completely to foreign companies.
The first hypothesis of this paper is that Russia’s and CIS trade in services with their
major partners is at an artificially low level, with potential trade hampered by the presence of
service trade restrictions. The second is that liberalization of the services sector in Russia has
a strictly positive impact on industrial productivity.
5
In this paper I investigate whether Russia’s trade in services with its major partners
remains below what would be predicted for countries with similar conditions as Russia. We
also investigate whether liberalization of the services sector would have a positive impact on
Russian industrial productivity.
2. Literature review
This paper focuses on the role of the services sector liberalization in international service
trade and its impacts on downstream manufacturing industry productivity. The literature
suggests that transition countries can benefit from service sector liberalization significantly.
In the modern economic literature, it is possible to emphasize two approaches to
estimating the size and influence of various barriers to service trade. The first approach
consists in obtaining information concerning the regulatory regimes in services, converting
this information into quantity indicators, and using these indicators as the variables explaining
various observable characteristics of the prices and costs (see Findlay and Warren, 2000). The
second approach is based on the gravity model to estimate what the predicted service flows in
the absence of trading restrictions. Such an approach has a number of drawbacks — for
example, it does not consider the difference between prices and costs (the price-cost margin)
(Francois and Hoekman, 2010) — but due to the absence of data on regulatory barriers in
services over time, it is more easily applied and used in this research.
In the absence of good data, the estimation of gravitational models of the service trade
has developed rather recently. For the first time (Sapir, Lutz, 1980), the aggregated data on
trade included not only trade in the goods but also total trade in services. Among early papers
on use of the gravitational equation for an estimation of bilateral trade in services, some
works (Francois, 1993) used data for the United States. Other researchers used, basically, the
data for developed countries, though in last decade new data has been available, allowing
6
estimations for a wider set of countries (see Kimura and Lee, 2006; Mizra and Nicoletti, 2004;
Francois, Hoekman, and Woerz, 2007; Francois and Wignarajan, 2008).
Theory suggests that service sector liberalization can have two positive effects on
social welfare: through the competition effect through which prices decline and increased
efficiency, as foreign firms introduce global best practices to the domestic market (Konan,
Maskus, 2006). Thus, the influence of service sector liberalization on service trade and on
changes in productivity in industries that uses these services as inputs are inseparably linked
with each other. The first effect is due to service sector liberalization in general and the
second stems from service trade liberalization.
Thus, service sector liberalization results both in growth of the service trade and
declines in the costs of services used as industrial inputs. Growth in service trade (that is, the
attraction of new foreign suppliers) provokes decreases in such costs to the domestic market.
Hence, questions regarding the influence of service sector liberalization on service trade and
on changes in productivity in industries that uses these services as inputs are inseparably
linked with each other.
There is a limited literature on the influence of liberalization of the services sector on
productivity in this sector and the downstream industries. The existing research can be
divided into two groups: studies at the sector level and those that use firm-level data. Among
studies of the first group, Echenbach and Hoekman (2005), in transition economies over the
period 1990–2004, found a positive correlation between rates of economic growth and
liberalization of the services sector. Earlier, Nikoletti and Scarpetta (2003) using industry
level data found a positive influence of the liberalization of the services sector on rates of
industrial production growth. Conway, Guiseppe, Steiner (2006) have also used sector level
data to conclude that in those countries in which the services sector is more open, a larger
degree of convergence (that is, higher rates of economic growth) takes place. Fernandes
7
(2007) has carried out a comparative analysis of the liberalization of various subsectors of
services and concluded that liberalization connected with an industry subsector leads to labor
productivity growth in that industry.
Regarding studies that use firm level data, Javorcik (2004) has shown, using
Lithuanian data, that foreign investment positively influences growth in the services sector but
does not influence the productivity of downstream sectors. She does find, however, that firms
that are linked upstream to services sectors benefit from improved services sectors. Arnold,
Javorcik, Matto (2011) have shown, using firm level data, a positive influence of services
sector liberalization on the industrial sector productivity. Arnold, Matto, and Narciso (2006)
have carried out the analysis of firms from sub-Saharan Africa over the period 2001–2005 and
have shown that total factorial productivity is influenced positively by the quality of services,
including telecommunications, electric power and the financial sector. Fernandes and Paunov
(2012) estimated the influence of foreign investment in the services sector on industry total
factor productivity growth and found that 1% growth in foreign investment explains 0.1–0.2%
of TFP growth. Furthermore, authors have shown that the basic result (the positive influence
of service FDI on growth of the industrial enterprises productivity) is true for various
industries. These authors also find that the productivity impact of additional foreign
investment is stronger for those industries in which products are more differentiated, and they
find no difference between the effects on large versus small enterprises.
In research at the micro level, as a rule, the production function of firm-level data is
estimated first. These estimations are used to find the total factor productivity (TFP), after that
the hypothesis of dependence of this TFP (or growth in TFP) on foreign investment or on the
liberalization of services sector are checked. Getting estimations of TFP at the aggregated
level is much more difficult (in the absence of data on sectors’ capital intensity), but it is
possible to use labor productivity.
8
3. Models specification and estimation results
3.1. Service trade flows estimation
In relations between countries, there are some circumstances that interfere with trade between
them, including trade barriers and its distortions and also some difficult-to-formalize
parameters, such as fundamental cultural distinctions and historically developed trading
traditions, e.g., unwillingness to trade with certain states due to an ethnic animosity, which
cannot vary in the course of time even if their change will lead to more favorable economic
results. Though it may be possible to say with confidence that trade barriers reduce the natural
level of service turnover that would take a place in their absence, such parameters can lead to
both under- and overestimates of the trade level that would be reached in market balance. For
example, during the existence of the USSR, there were certain economic relationships
between union republics that remain to this day.
3.1.1. Service trade between the CIS and OECD
One of this paper’s aims is the estimation of possible consequences of services trade
liberalization on international service flows. To this end, it is necessary to use the data on the
international service trade; therefore, I used the United Nations data on trade in services1.
The data and estimation model include the following properties:
1) This database include only BOP service trade, i.e. only mode 1 (cross-border
supply), partially mode 2 (consumption abroad). There are no data about
commercial presence (mode 3), FDI.
2) This database includes service trade flows during 2000–2009 and covers the
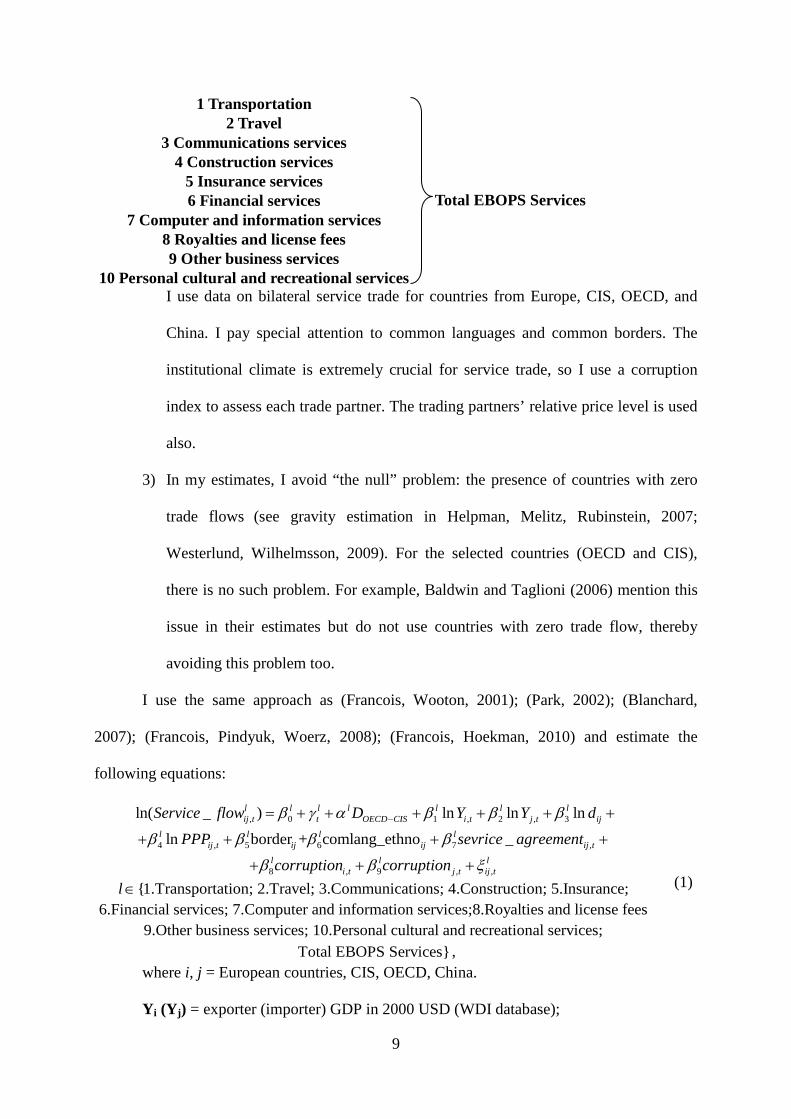
following fields of services:
1 http://unstats.un.org/unsd/ServiceTrade/default.aspx
9
1 Transportation
Total EBOPS Services
2 Travel 3 Communications services
4 Construction services 5 Insurance services 6 Financial services
7 Computer and information services 8 Royalties and license fees 9 Other business services
10 Personal cultural and recreational services I use data on bilateral service trade for countries from Europe, CIS, OECD, and
China. I pay special attention to common languages and common borders. The
institutional climate is extremely crucial for service trade, so I use a corruption
index to assess each trade partner. The trading partners’ relative price level is used
also.
3) In my estimates, I avoid “the null” problem: the presence of countries with zero
trade flows (see gravity estimation in Helpman, Melitz, Rubinstein, 2007;
Westerlund, Wilhelmsson, 2009). For the selected countries (OECD and CIS),
there is no such problem. For example, Baldwin and Taglioni (2006) mention this
issue in their estimates but do not use countries with zero trade flow, thereby
avoiding this problem too.
I use the same approach as (Francois, Wooton, 2001); (Park, 2002); (Blanchard,
2007); (Francois, Pindyuk, Woerz, 2008); (Francois, Hoekman, 2010) and estimate the
following equations:
, 0 1 , 2 , 3ln( _ ) ln ln lnl l l l l l lij t t OECD CIS i t j t ijService flow D Y Y dβ γ α β β β−= + + + + + +
4 , 5 6 7 ,ln border + comlang_ethno _l l l lij t ij ij ij tPPP sevrice agreementβ β β β+ + + +
8 , 9 , ,l l l
i t j t ij tcorruption corruptionβ β ξ+ + + {1.Transportation; 2.Travel; 3.Communications; 4.Construction; 5.Insurance;l∈
6.Financial services; 7.Computer and information services;8.Royalties and license fees9.Other business services; 10.Personal cultural and recreational services;
Total EBOPS Services} ,
(1)
where i, j = European countries, CIS, OECD, China.
Yi (Yj) = exporter (importer) GDP in 2000 USD (WDI database);
10
dij = distance between capitals (CEPII database)2;
PPPij = relative price level (price level of destination country relative to price level of
origin country), computed as ratio of PPP conversion factors of market exchange rate ratio
(WDI database)3;
border=1 if i and j have a common border; comlang_ethno=1 if a language is spoken
by at least 9% of the population in both countries (CEPII database);
service_agreement=1 if i and j have preferential service trade agreement4;
corruption = index of freedom from corruption: the higher the index value, the more
freedom from corruption (Heritage Foundation)5;
DOECD-CIS=1 if services flow from an OECD country to CIS country.
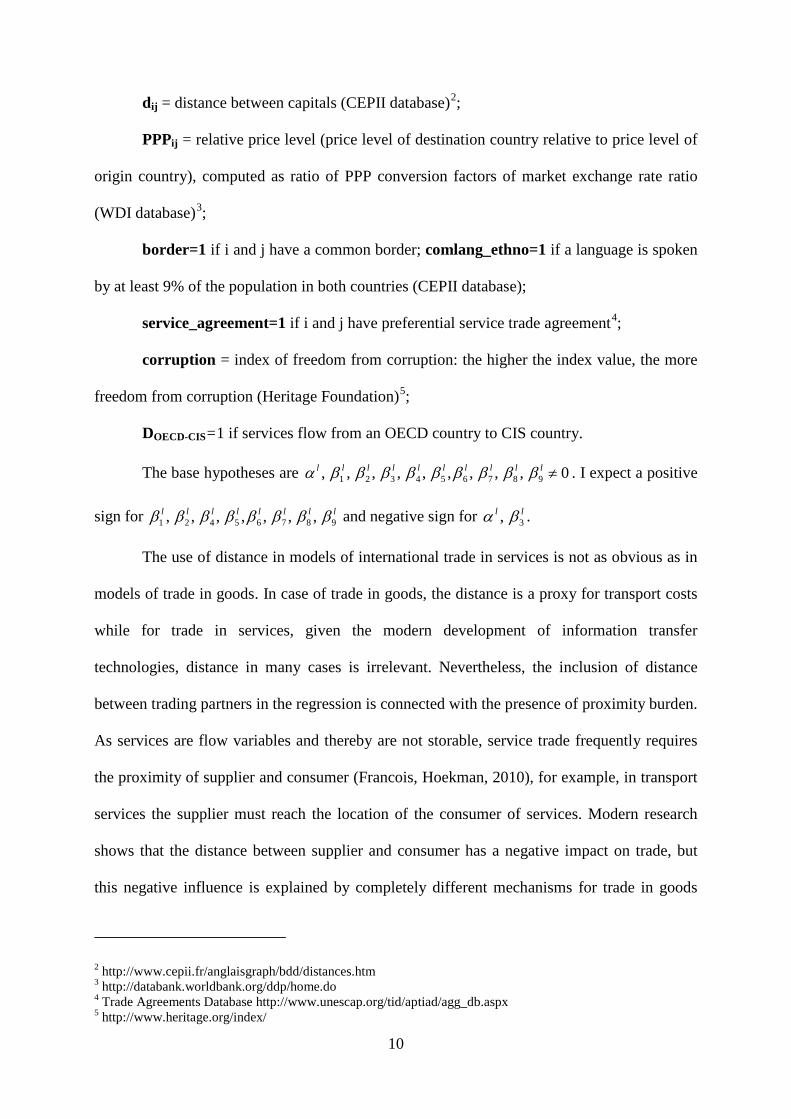
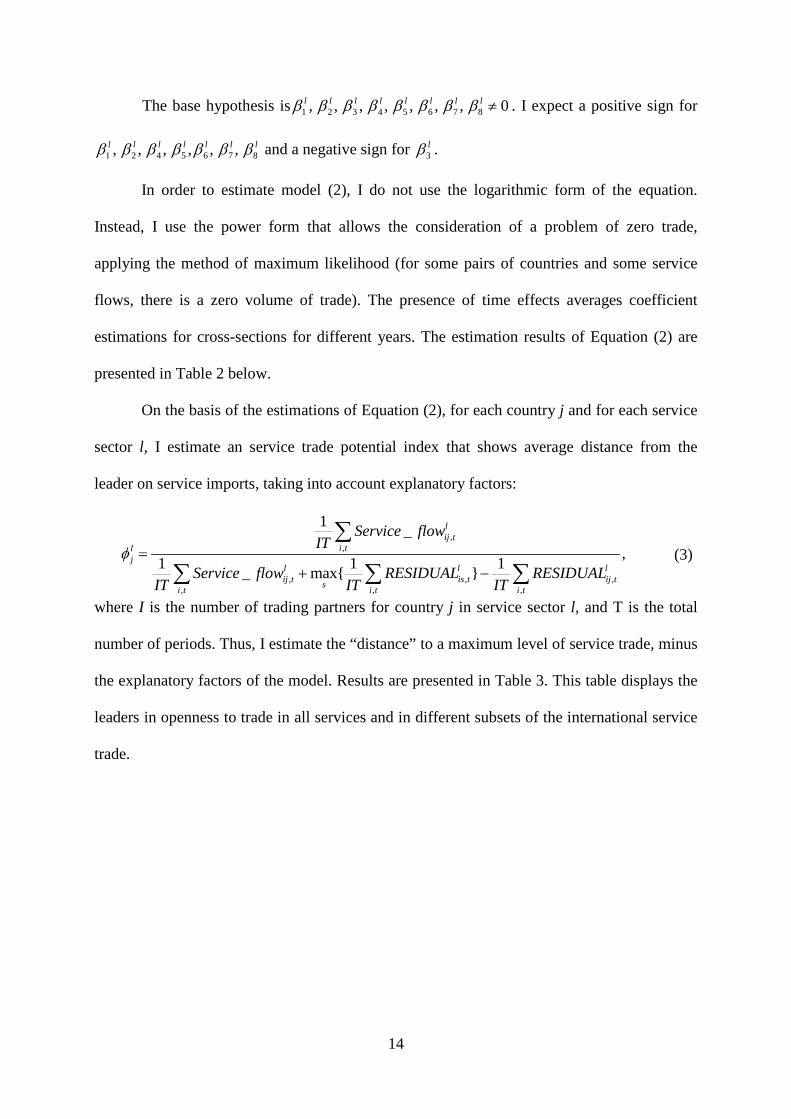
The base hypotheses are 1 2 3 4 5 6 7 8 9, , , , , , , , , 0l l l l l l l l l lα β β β β β β β β β ≠ . I expect a positive
sign for 1 2 4 5 6 7 8 9, , , , , , , l l l l l l l lβ β β β β β β β and negative sign for 3, l lα β .
The use of distance in models of international trade in services is not as obvious as in
models of trade in goods. In case of trade in goods, the distance is a proxy for transport costs
while for trade in services, given the modern development of information transfer
technologies, distance in many cases is irrelevant. Nevertheless, the inclusion of distance
between trading partners in the regression is connected with the presence of proximity burden.
As services are flow variables and thereby are not storable, service trade frequently requires
the proximity of supplier and consumer (Francois, Hoekman, 2010), for example, in transport
services the supplier must reach the location of the consumer of services. Modern research
shows that the distance between supplier and consumer has a negative impact on trade, but
this negative influence is explained by completely different mechanisms for trade in goods
2 http://www.cepii.fr/anglaisgraph/bdd/distances.htm 3 http://databank.worldbank.org/ddp/home.do 4 Trade Agreements Database http://www.unescap.org/tid/aptiad/agg_db.aspx 5 http://www.heritage.org/index/
11
and trade in services (see Francois, Hoekman, 2010). For services, frequently there are no
physical transport costs, which depend on the distance between the trading countries. The
costs of distance in the case of trade in services can be connected with coordination problems
between service supplier and consumer rather than the cost of physically loading and shipping
goods.
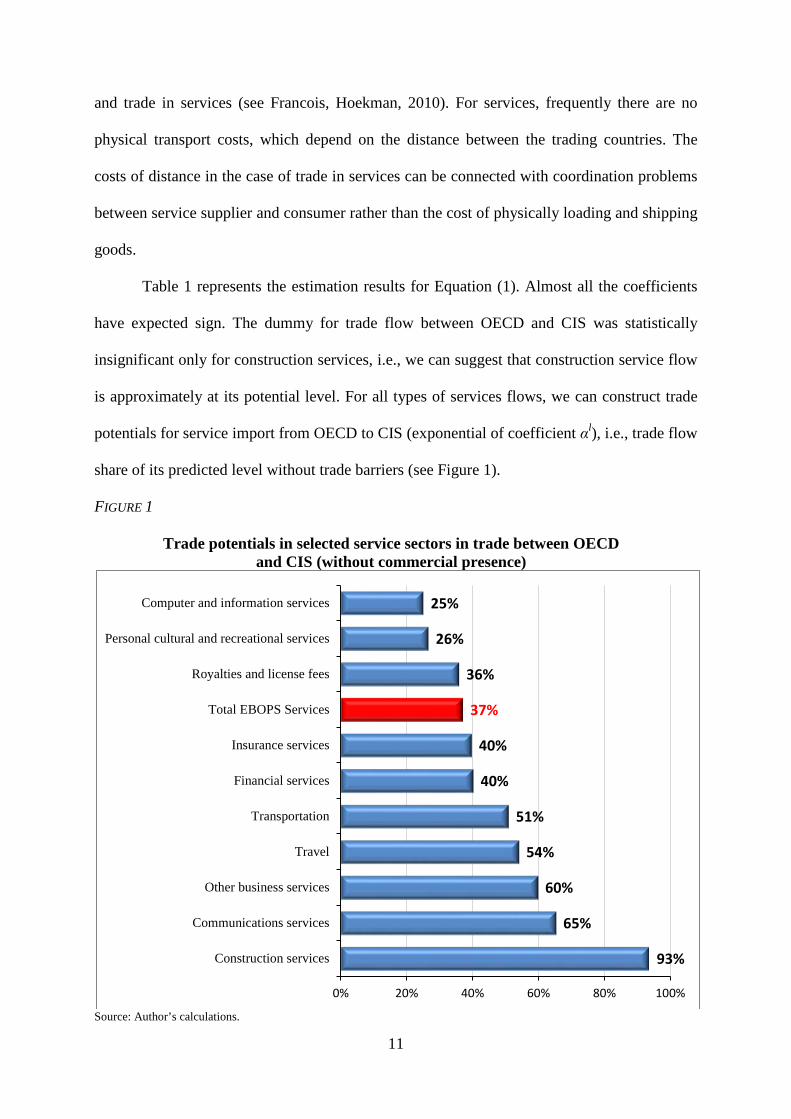
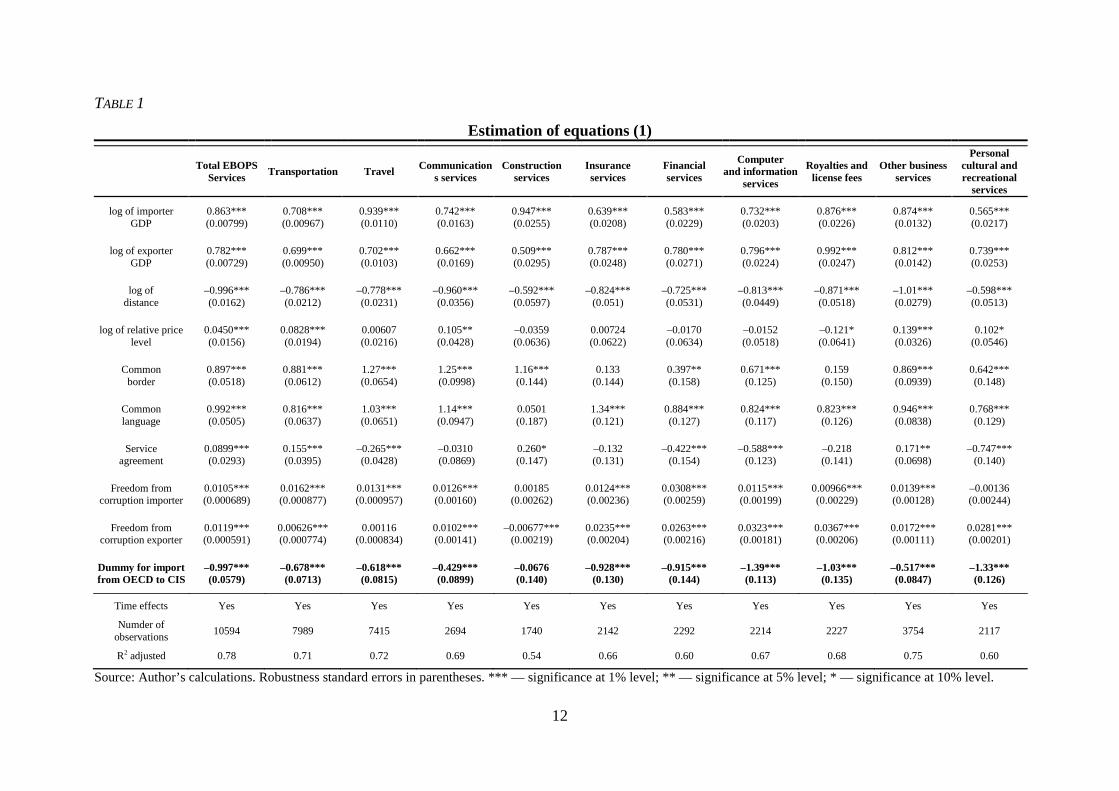
Table 1 represents the estimation results for Equation (1). Almost all the coefficients
have expected sign. The dummy for trade flow between OECD and CIS was statistically
insignificant only for construction services, i.e., we can suggest that construction service flow
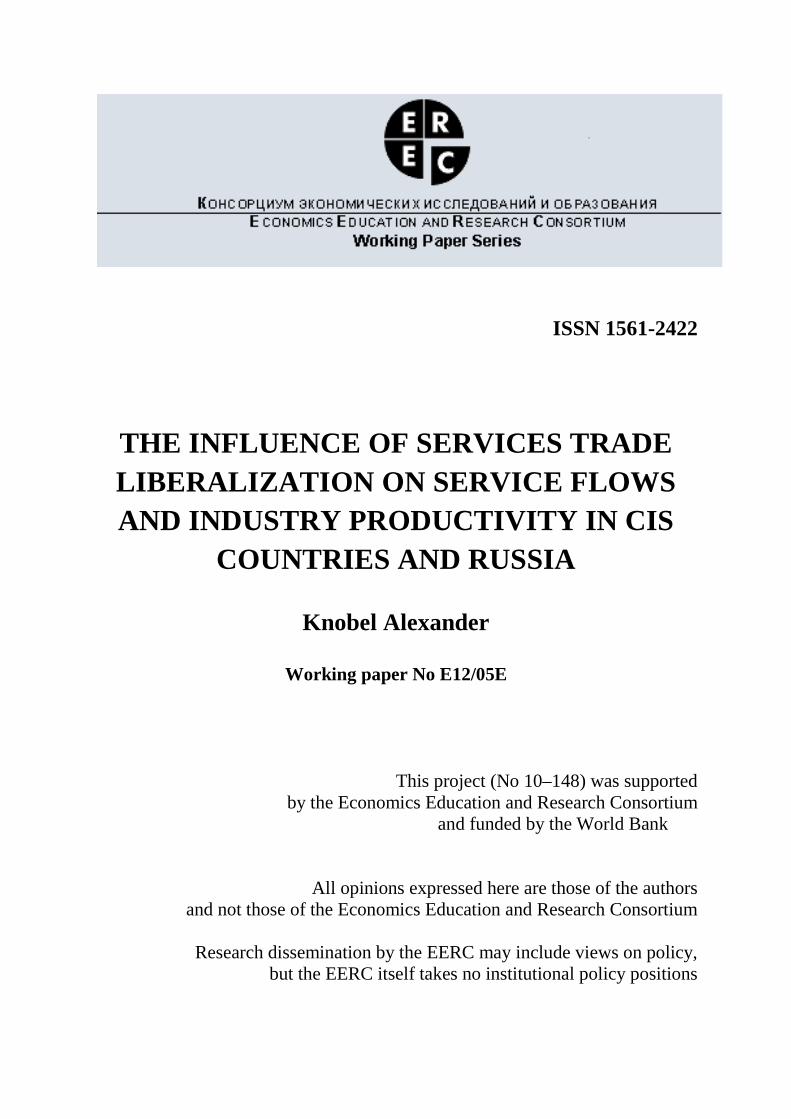
is approximately at its potential level. For all types of services flows, we can construct trade
potentials for service import from OECD to CIS (exponential of coefficient αl), i.e., trade flow
share of its predicted level without trade barriers (see Figure 1).
FIGURE 1
Trade potentials in selected service sectors in trade between OECD and CIS (without commercial presence)
Source: Author’s calculations.
93%
65%
60%
54%
51%
40%
40%
37%
36%
26%
25%
0% 20% 40% 60% 80% 100%
Construction services
Communications services
Other business services
Travel
Transportation
Financial services
Insurance services
Total EBOPS Services
Royalties and license fees
Personal cultural and recreational services
Computer and information services
12
TABLE 1
Estimation of equations (1)
Total EBOPS
Services Transportation Travel Communications services
Construction services
Insurance services
Financial services
Computer and information
services
Royalties and license fees
Other business services
Personal cultural and recreational
services
log of importer GDP
0.863*** (0.00799)
0.708*** (0.00967)
0.939*** (0.0110)
0.742*** (0.0163)
0.947*** (0.0255)
0.639*** (0.0208)
0.583*** (0.0229)
0.732*** (0.0203)
0.876*** (0.0226)
0.874*** (0.0132)
0.565*** (0.0217)
log of exporter GDP
0.782*** (0.00729)
0.699*** (0.00950)
0.702*** (0.0103)
0.662*** (0.0169)
0.509*** (0.0295)
0.787*** (0.0248)
0.780*** (0.0271)
0.796*** (0.0224)
0.992*** (0.0247)
0.812*** (0.0142)
0.739*** (0.0253)
log of distance
–0.996*** (0.0162)
–0.786*** (0.0212)
–0.778*** (0.0231)
–0.960*** (0.0356)
–0.592*** (0.0597)
–0.824*** (0.051)
–0.725*** (0.0531)
–0.813*** (0.0449)
–0.871*** (0.0518)
–1.01*** (0.0279)
–0.598*** (0.0513)
log of relative price level
0.0450*** (0.0156)
0.0828*** (0.0194)
0.00607 (0.0216)
0.105** (0.0428)
–0.0359 (0.0636)
0.00724 (0.0622)
–0.0170 (0.0634)
–0.0152 (0.0518)
–0.121* (0.0641)
0.139*** (0.0326)
0.102* (0.0546)
Common border
0.897*** (0.0518)
0.881*** (0.0612)
1.27*** (0.0654)
1.25*** (0.0998)
1.16*** (0.144)
0.133 (0.144)
0.397** (0.158)
0.671*** (0.125)
0.159 (0.150)
0.869*** (0.0939)
0.642*** (0.148)
Common language
0.992*** (0.0505)
0.816*** (0.0637)
1.03*** (0.0651)
1.14*** (0.0947)
0.0501 (0.187)
1.34*** (0.121)
0.884*** (0.127)
0.824*** (0.117)
0.823*** (0.126)
0.946*** (0.0838)
0.768*** (0.129)
Service agreement
0.0899*** (0.0293)
0.155*** (0.0395)
–0.265*** (0.0428)
–0.0310 (0.0869)
0.260* (0.147)
–0.132 (0.131)
–0.422*** (0.154)
–0.588*** (0.123)
–0.218 (0.141)
0.171** (0.0698)
–0.747*** (0.140)
Freedom from corruption importer
0.0105*** (0.000689)
0.0162*** (0.000877)
0.0131*** (0.000957)
0.0126*** (0.00160)
0.00185 (0.00262)
0.0124*** (0.00236)
0.0308*** (0.00259)
0.0115*** (0.00199)
0.00966*** (0.00229)
0.0139*** (0.00128)
–0.00136 (0.00244)
Freedom from corruption exporter
0.0119*** (0.000591)
0.00626*** (0.000774)
0.00116 (0.000834)
0.0102*** (0.00141)
–0.00677*** (0.00219)
0.0235*** (0.00204)
0.0263*** (0.00216)
0.0323*** (0.00181)
0.0367*** (0.00206)
0.0172*** (0.00111)
0.0281*** (0.00201)
Dummy for import from OECD to CIS
–0.997*** (0.0579)
–0.678*** (0.0713)
–0.618*** (0.0815)
–0.429*** (0.0899)
–0.0676 (0.140)
–0.928*** (0.130)
–0.915*** (0.144)
–1.39*** (0.113)
–1.03*** (0.135)
–0.517*** (0.0847)
–1.33*** (0.126)
Time effects Yes Yes Yes Yes Yes Yes Yes Yes Yes Yes Yes
Numder of observations 10594 7989 7415 2694 1740 2142 2292 2214 2227 3754 2117
R2 adjusted 0.78 0.71 0.72 0.69 0.54 0.66 0.60 0.67 0.68 0.75 0.60
Source: Author’s calculations. Robustness standard errors in parentheses. *** — significance at 1% level; ** — significance at 5% level; * — significance at 10% level.
13
These results do not contradict the first hypothesis of my research, according to which
trade in services of the CIS with OECD countries is at a level lower than potentially possible:
service liberalization could substantially increase service trade flows. According to the
estimations, total EBOPS services could be 1/0.37=2.7 times larger given service
liberalization; computer and information services and personal cultural and recreational
services could be 4 times larger; royalties and license fees, insurance services, financial
services, travel, transportation, communications and other business services could be 1.5–2.8
times larger.
3.1.2. International service trade
The previous analysis considered the average effect for OECD and CIS countries of
service trade liberalization on service flows size. For an estimation of inter-country
distinctions in openness to trade in services, I use the data on every possible service flow
between countries6 and I estimate the following equations for each type of trade in services:
, 0 1 , 2 , 3_ exp{ ln ln lnl l l l l lij t t i t j t ijService flow Y Y dβ γ β β β= + + + + +
4 , 5 , 6 ,ln ln _l l li t j t j tGDPpc GDPpc PRORERTY RIGHTβ β β+ + + +
7 8 ,border + comlang_ethno }l l lij ij ij tβ β ξ+ +
{1.Transportation; 2.Travel; 3.Communications; 4.Construction; 5.Insurance;l∈6.Financial services; 7.Computer and information services;8.Royalties and license fees
9.Other business services; 10.Personal cultural and recreational services;Total EBOPS Services} ,
(2)
there Yi (Yj) = exporter (importer) GDP in 2005 USD (WDI database); GDPpci (GDPpcj) =
exporter (importer) GDP per capita in 2005 USD, PPP (WDI database); dij = distance
between capitals (CEPII database); PROPERTY RIGHT = index of property right
institution development: the greater the index value, the better developed this institution
(Heritage Foundation); border=1 if i and j have a common border; comlang_ethno=1 if a
language is spoken by at least 9% of the population in both countries (CEPII database).
6 http://unstats.un.org/unsd/ServiceTrade/default.aspx
14
The base hypothesis is 1 2 3 4 5 6 7 8, , , , , , , 0l l l l l l l lβ β β β β β β β ≠ . I expect a positive sign for
1 2 4 5 6 7 8, , , , , , l l l l l l lβ β β β β β β and a negative sign for 3lβ .
In order to estimate model (2), I do not use the logarithmic form of the equation.
Instead, I use the power form that allows the consideration of a problem of zero trade,
applying the method of maximum likelihood (for some pairs of countries and some service
flows, there is a zero volume of trade). The presence of time effects averages coefficient
estimations for cross-sections for different years. The estimation results of Equation (2) are
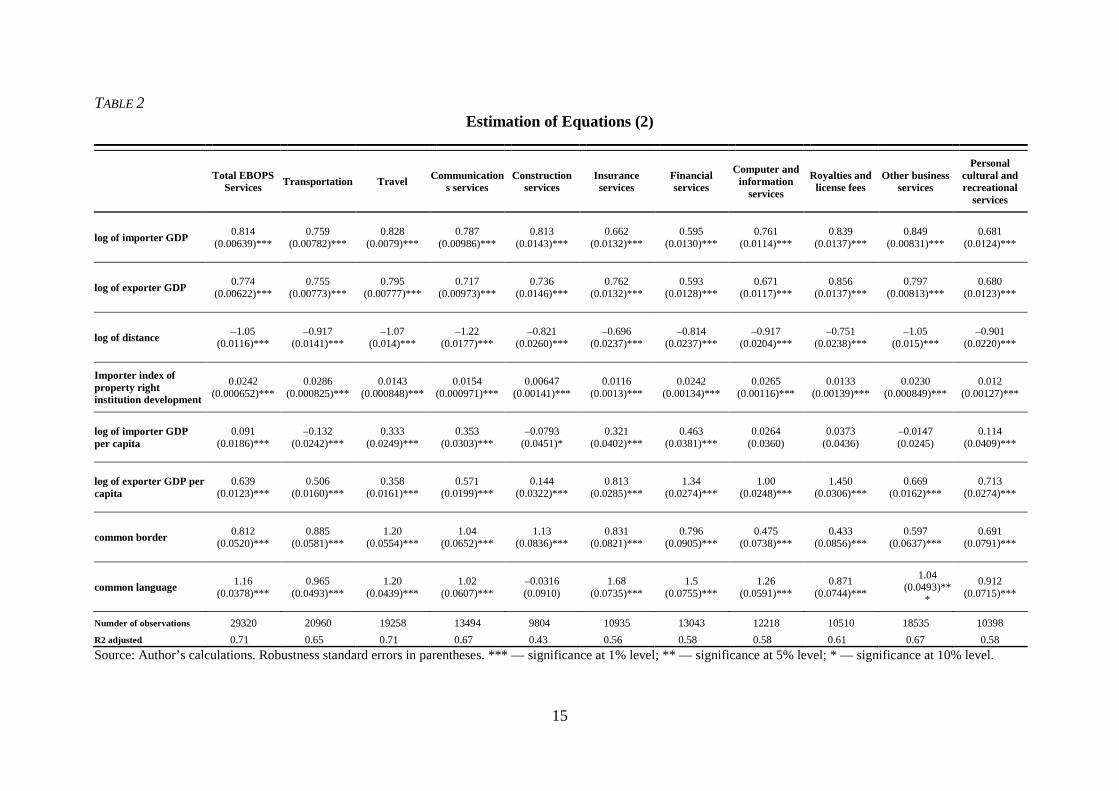
presented in Table 2 below.
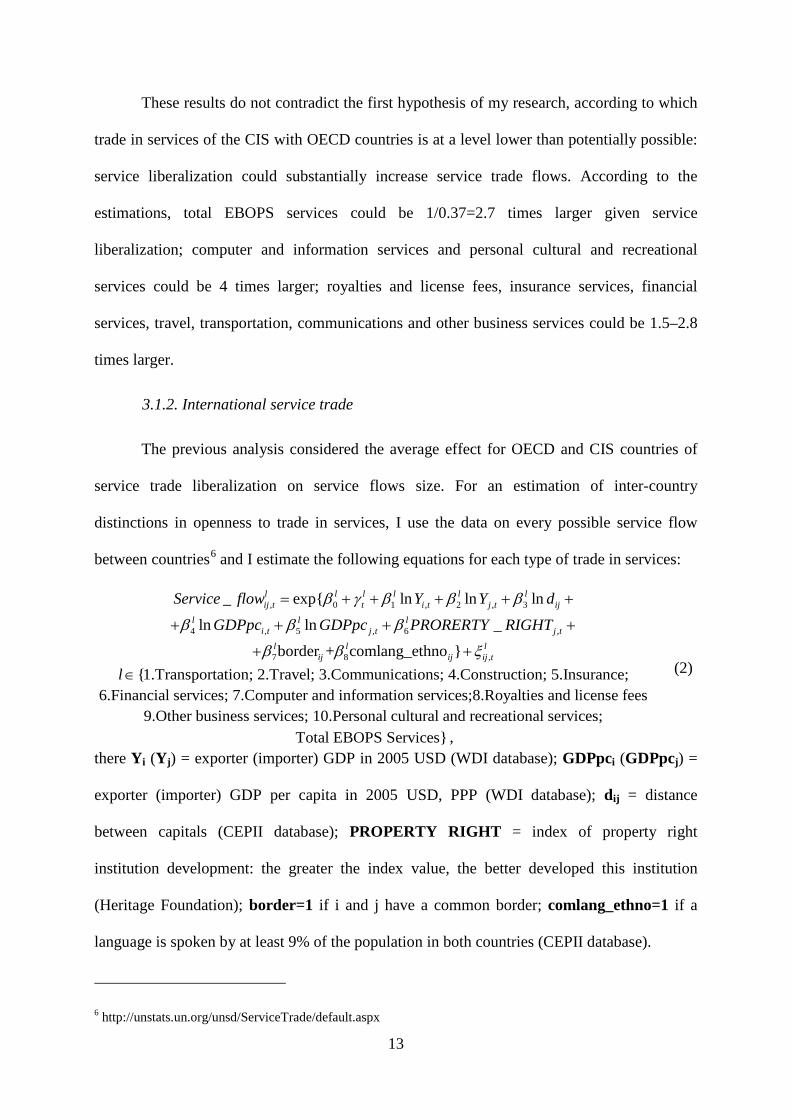
On the basis of the estimations of Equation (2), for each country j and for each service
sector l, I estimate an service trade potential index that shows average distance from the
leader on service imports, taking into account explanatory factors:
,,
, , ,, , ,
1 _,1 1 1_ max{ }
lij t
i tlj
l l lij t is t ij tsi t i t i t
Service flowIT
Service flow RESIDUAL RESIDUALIT IT IT
φ =+ −
∑
∑ ∑ ∑ (3)
where I is the number of trading partners for country j in service sector l, and T is the total
number of periods. Thus, I estimate the “distance” to a maximum level of service trade, minus
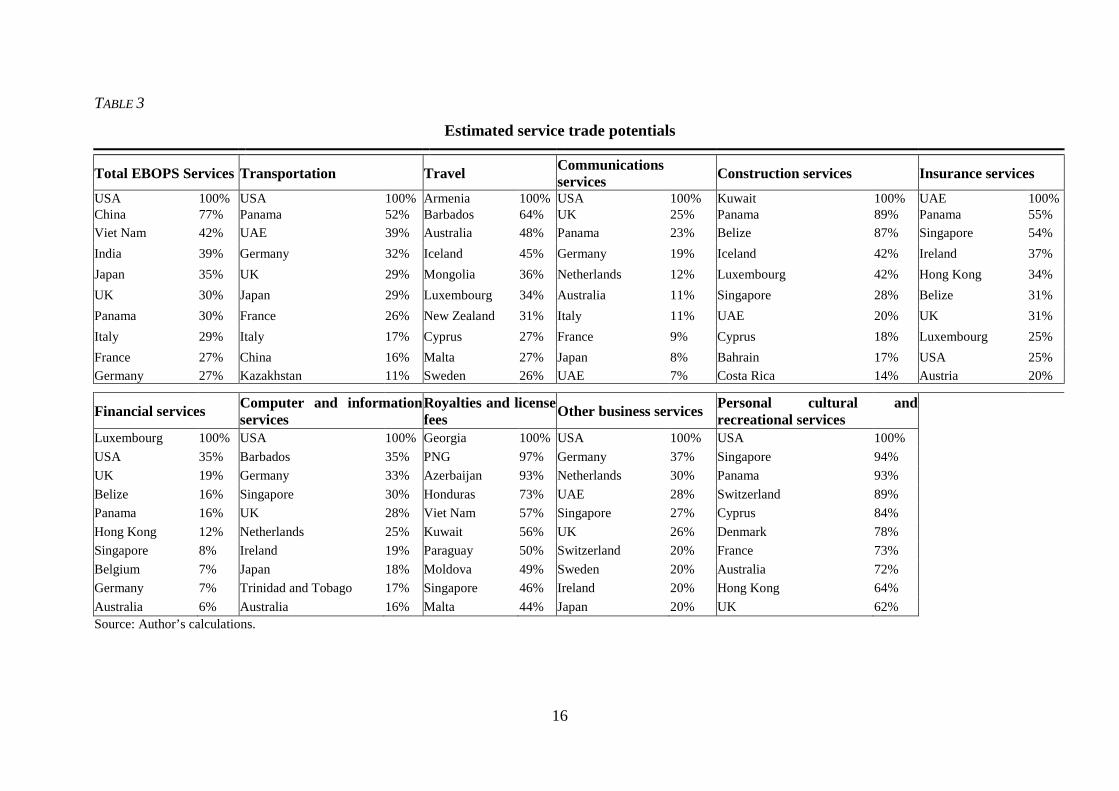
the explanatory factors of the model. Results are presented in Table 3. This table displays the
leaders in openness to trade in all services and in different subsets of the international service
trade.
15
TABLE 2 Estimation of Equations (2)
Source: Author’s calculations. Robustness standard errors in parentheses. *** — significance at 1% level; ** — significance at 5% level; * — significance at 10% level.
Total EBOPS Services Transportation Travel Communication
s services Construction services Insurance
services Financial services
Computer and information
services Royalties and
license fees Other business services
Personal cultural and recreational
services log of importer GDP 0.814
(0.00639)*** 0.759 (0.00782)*** 0.828
(0.0079)*** 0.787 (0.00986)*** 0.813
(0.0143)*** 0.662 (0.0132)*** 0.595
(0.0130)*** 0.761 (0.0114)*** 0.839
(0.0137)*** 0.849 (0.00831)*** 0.681
(0.0124)***
log of exporter GDP 0.774 (0.00622)*** 0.755
(0.00773)*** 0.795 (0.00777)*** 0.717
(0.00973)*** 0.736 (0.0146)*** 0.762
(0.0132)*** 0.593 (0.0128)*** 0.671
(0.0117)*** 0.856 (0.0137)*** 0.797
(0.00813)*** 0.680 (0.0123)***
log of distance –1.05 (0.0116)*** –0.917
(0.0141)*** –1.07 (0.014)*** –1.22
(0.0177)*** –0.821 (0.0260)*** –0.696
(0.0237)*** –0.814 (0.0237)*** –0.917
(0.0204)*** –0.751 (0.0238)*** –1.05
(0.015)*** –0.901 (0.0220)***
Importer index of property right institution development
0.0242 (0.000652)*** 0.0286
(0.000825)*** 0.0143 (0.000848)*** 0.0154
(0.000971)*** 0.00647 (0.00141)*** 0.0116
(0.0013)*** 0.0242 (0.00134)*** 0.0265
(0.00116)*** 0.0133 (0.00139)*** 0.0230
(0.000849)*** 0.012 (0.00127)***
log of importer GDP per capita
0.091 (0.0186)*** –0.132
(0.0242)*** 0.333 (0.0249)*** 0.353
(0.0303)*** –0.0793 (0.0451)* 0.321
(0.0402)*** 0.463 (0.0381)*** 0.0264
(0.0360) 0.0373 (0.0436) –0.0147
(0.0245) 0.114 (0.0409)***
log of exporter GDP per capita
0.639 (0.0123)*** 0.506
(0.0160)*** 0.358 (0.0161)*** 0.571
(0.0199)*** 0.144 (0.0322)*** 0.813
(0.0285)*** 1.34 (0.0274)*** 1.00
(0.0248)*** 1.450 (0.0306)*** 0.669
(0.0162)*** 0.713 (0.0274)***
common border 0.812 (0.0520)*** 0.885
(0.0581)*** 1.20 (0.0554)*** 1.04
(0.0652)*** 1.13 (0.0836)*** 0.831
(0.0821)*** 0.796 (0.0905)*** 0.475
(0.0738)*** 0.433 (0.0856)*** 0.597
(0.0637)*** 0.691 (0.0791)***
common language 1.16 (0.0378)*** 0.965
(0.0493)*** 1.20 (0.0439)*** 1.02
(0.0607)*** –0.0316 (0.0910) 1.68
(0.0735)*** 1.5 (0.0755)*** 1.26
(0.0591)*** 0.871 (0.0744)***
1.04 (0.0493)**
* 0.912
(0.0715)*** Numder of observations 29320 20960 19258 13494 9804 10935 13043 12218 10510 18535 10398 R2 adjusted 0.71 0.65 0.71 0.67 0.43 0.56 0.58 0.58 0.61 0.67 0.58
16
TABLE 3
Estimated service trade potentials
Source: Author’s calculations.
Total EBOPS Services Transportation Travel Communications services Construction services Insurance services
USA 100% USA 100% Armenia 100% USA 100% Kuwait 100% UAE 100% China 77% Panama 52% Barbados 64% UK 25% Panama 89% Panama 55% Viet Nam 42% UAE 39% Australia 48% Panama 23% Belize 87% Singapore 54% India 39% Germany 32% Iceland 45% Germany 19% Iceland 42% Ireland 37% Japan 35% UK 29% Mongolia 36% Netherlands 12% Luxembourg 42% Hong Kong 34% UK 30% Japan 29% Luxembourg 34% Australia 11% Singapore 28% Belize 31% Panama 30% France 26% New Zealand 31% Italy 11% UAE 20% UK 31% Italy 29% Italy 17% Cyprus 27% France 9% Cyprus 18% Luxembourg 25% France 27% China 16% Malta 27% Japan 8% Bahrain 17% USA 25% Germany 27% Kazakhstan 11% Sweden 26% UAE 7% Costa Rica 14% Austria 20%
Financial services Computer and information services
Royalties and license fees Other business services Personal cultural and
recreational services Luxembourg 100% USA 100% Georgia 100% USA 100% USA 100% USA 35% Barbados 35% PNG 97% Germany 37% Singapore 94% UK 19% Germany 33% Azerbaijan 93% Netherlands 30% Panama 93% Belize 16% Singapore 30% Honduras 73% UAE 28% Switzerland 89% Panama 16% UK 28% Viet Nam 57% Singapore 27% Cyprus 84% Hong Kong 12% Netherlands 25% Kuwait 56% UK 26% Denmark 78% Singapore 8% Ireland 19% Paraguay 50% Switzerland 20% France 73% Belgium 7% Japan 18% Moldova 49% Sweden 20% Australia 72% Germany 7% Trinidad and Tobago 17% Singapore 46% Ireland 20% Hong Kong 64% Australia 6% Australia 16% Malta 44% Japan 20% UK 62%
17
TABLE 4
Estimated service trade potentials for CIS countries
Total EBOPS Services Transportation Travel Communications services
Country Trade potential World rank Country Trade
potential World rank Country Trade potential World rank Country Trade
potential World rank
Uzbekistan 13.0% 19 Kazakhstan 10.7% 15 Armenia 100.0% 1 Russia 4.5% 15 Russia 11.8% 20 Uzbekistan 3.0% 34 Tajikistan 22.2% 14 Ukraine 2.6% 23
Kazakhstan 8.6% 25 Russia 3.0% 35 Moldova 13.6% 25 Kazakhstan 1.7% 34 Turkmenia 5.3% 39 Ukraine 2.6% 38 Uzbekistan 10.6% 31 Tajikistan 1.6% 36 Tajikistan 4.3% 45 Azerbaijan 2.2% 43 Turkmenia 9.9% 32 Uzbekistan 0.7% 50 Ukraine 3.5% 51 Armenia 1.6% 51 Kazakhstan 8.9% 34 Moldova 0.5% 56
Kyrgyzstan 3.3% 53 Georgia 1.3% 59 Russia 6.4% 46 Turkmenia 0.5% 58 Georgia 3.2% 54 Tajikistan 1.3% 61 Ukraine 4.9% 58 Armenia 0.4% 61 Moldova 2.7% 64 Turkmenia 0.9% 68 Georgia 4.0% 63 Georgia 0.4% 65
Azerbaijan 2.0% 76 Moldova 0.4% 83 Belarus 2.0% 78 Belarus 0.3% 70 Armenia 1.7% 84 Kyrgyzstan 0.2% 96 Azerbaijan 1.7% 82 Azerbaijan 0.2% 76 Belarus 0.4% 125 Belarus 0.1% 103 Kyrgyzstan 0.3% 123 Kyrgyzstan 0.1% 92
Construction services Insurance services Financial services Computer and information services
Country Trade potential World rank Country Trade
potential World rank Country Trade potential World rank Country Trade
potential World rank
Tajikistan 8.1% 15 Tajikistan 1.5% 49 Tajikistan 2.3% 22 Kazakhstan 5.9% 32 Kazakhstan 6.7% 20 Russia 1.1% 55 Uzbekistan 1.5% 29 Ukraine 3.3% 44 Turkmenia 2.9% 34 Azerbaijan 1.0% 57 Ukraine 1.2% 33 Tajikistan 2.8% 49 Armenia 1.5% 54 Armenia 0.7% 64 Kazakhstan 1.0% 41 Uzbekistan 2.2% 56 Russia 1.3% 57 Georgia 0.4% 67 Russia 0.8% 54 Russia 2.2% 60
Uzbekistan 1.3% 58 Uzbekistan 0.4% 69 Armenia 0.7% 58 Georgia 1.4% 72 Georgia 1.2% 59 Ukraine 0.3% 76 Azerbaijan 0.5% 64 Armenia 1.2% 76
Kyrgyzstan 0.3% 77 Kazakhstan 0.2% 78 Georgia 0.4% 71 Azerbaijan 1.1% 79 Belarus 0.3% 78 Turkmenia 0.2% 80 Turkmenia 0.2% 83 Turkmenia 0.8% 86
Azerbaijan 0.3% 79 Moldova 0.2% 81 Moldova 0.2% 85 Moldova 0.5% 96 Ukraine 0.3% 80 Kyrgyzstan 0.1% 90 Kyrgyzstan 0.1% 99 Belarus 0.2% 104 Moldova 0.2% 84 Belarus 0.1% 95 Belarus 0.1% 102 Kyrgyzstan 0.2% 105
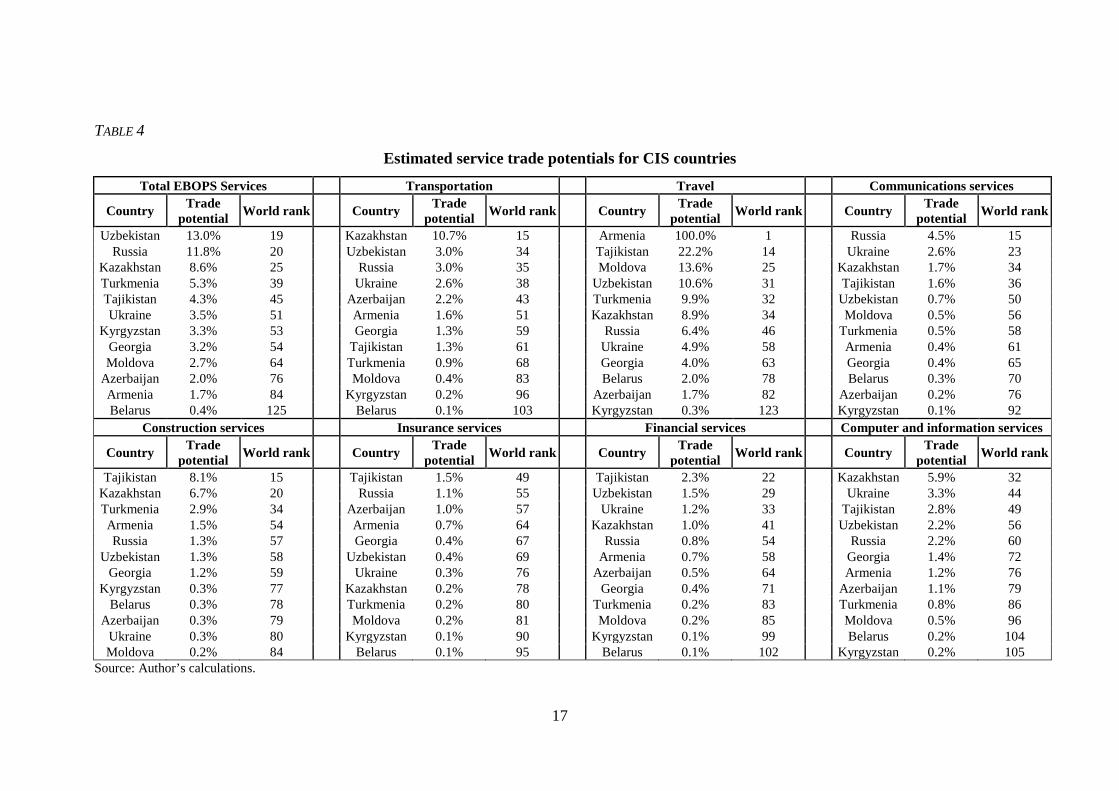
Source: Author’s calculations.
18
TABLE 5
Estimated service trade potentials for CIS countries
Royalties and license fees Other business services Personal cultural and recreational services
Country Trade potential
World rank Country Trade
potential World rank Country Trade
potential World rank
Georgia 100.0% 1
Russia 2.7% 30
Armenia 54.0% 12
Azerbaijan 92.9% 3
Uzbekistan 1.0% 54
Uzbekistan 37.6% 19
Moldova 49.3% 8
Kazakhstan 0.9% 56
Tajikistan 31.4% 27
Armenia 36.4% 12
Ukraine 0.6% 66
Azerbaijan 26.7% 30
Ukraine 36.0% 13
Tajikistan 0.5% 70
Kyrgyzstan 26.6% 31
Kyrgyzstan 35.6% 14
Azerbaijan 0.3% 78
Kazakhstan 14.5% 48
Kazakhstan 28.2% 16
Turkmenia 0.3% 79
Turkmenia 11.2% 53
Belarus 11.2% 46
Armenia 0.2% 87
Georgia 11.0% 54
Russia 7.2% 59
Georgia 0.1% 97
Ukraine 9.2% 57
Turkmenia 0.3% 92
Moldova 0.1% 98
Russia 8.2% 59
Tajikistan — —
Belarus 0.1% 103
Moldova 5.1% 68
Uzbekistan — —
Kyrgyzstan 0.0% 112
Belarus 1.4% 93
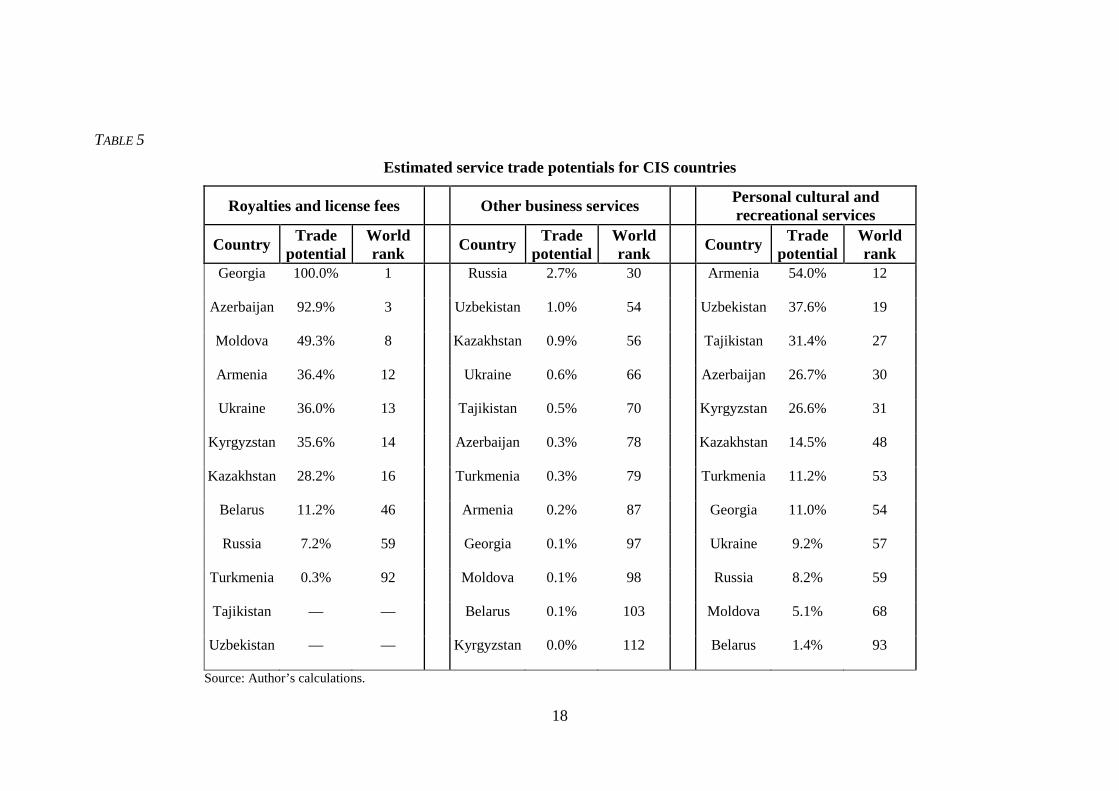
Source: Author’s calculations.
19
According to the results, the most opened service trade takes place in the U.S., China,
Vietnam, India, Japan, the U.K., Panama, Italy, France, and Germany. Service imports to the
these countries appears to be the greatest once one takes into account the size of these
countries and the size of their trade partners, the level of their economic and institutional
development, the distance to the trade partners, and the presence of common borders with the
trade partners and common language. Russia is not included among the leaders in service
trade liberalization.
It is necessary to notice that the used methodology of trade potentials definition is
sensitive to the data outliers. So, for example, Luxembourg has developed financial system,
therefore it financial services import is very high. Because of it the economy nearest to
Luxembourg (USA) has financial service trade potential only 35%. Hence, the given approach
is applicable, first of all, for definition of a rank of this or that country in a world rating of an
openness for service trade.
From tables 4 and 5 it is possible to see a place of all CIS countries in a rating of
service trade openness, constructed on the basis of estimations of the equations (2). The most
open Russian service import sector, given the economic conditions of Russia, is the
communication services. From these tables also it is visible that the most open CIS countries
for service import are Russia, Kazakhstan, and Uzbekistan, and the least open are Belarus,
Moldova, and Kyrgyzstan.
Thus, the estimation suggests that the first hypothesis of this paper is not rejected: we
can suggest that service liberalization may indeed increase international service trade between
CIS and OECD countries, for all modes of services. Russian trade in services is very low for
its level of economic development. If liberalization took place, service imports into Russia
would increase very significantly.
20
3.2. Industry productivity and service liberalization
As specified in (Arnold, Javorcik, Mattoo, 2011), industrial manufacturers benefit
from service liberalization through three possible channels.
First, after privatization or entry into the market of successful foreign service
suppliers, quality and reliability of supplied services can improve. For example, as a result of
investment in infrastructure by new internal or foreign owners, telecommunications and
electric energy supply become more reliable. In the financial sector, credit is granted more
quickly as a result of the increased competition. These improvements will reduce the
frequency of idle time in industrial production and, accordingly, will increase productivity.
Second, new types of services can be the brought into the market by foreign service
suppliers using new technologies. New financial tools or digital technologies in
telecommunications are examples of these new types of services. Availability of new services
can lead to changes in production and increased productivity. For example, with development
of telecommunications infrastructure, firms can start to accept orders through the Internet or
enter online auctions for supplies of raw materials.
Third, liberalization will lead to wider availability of services than those the small
circle of firms previously provided to consumers. For example, the Internet becomes
accessible in rural areas due to the development of telecommunications. The development of
consulting services will make these services accessible not only to large firms but also to
small ones. Such improvements can increase the productivity of firms that previously had no
access to these or other services.
As mentioned above, all industries use services as inputs. How much of the Russian
extracting and manufacturing industry uses services as intermediate consumption? In Table 6
below, I cite the data on the use of various services in the industry. Trading-intermediary
services compose the greatest shares of production and inputs (10.1% and 15.6%,
21
respectively). Russian industry also actively uses construction services and transport and
communication services (together they provide a 5.5% share of production and a 8.6% share
of inputs). Thus, the service sector plays very important role for the extracting and
manufacturing industries in Russia.
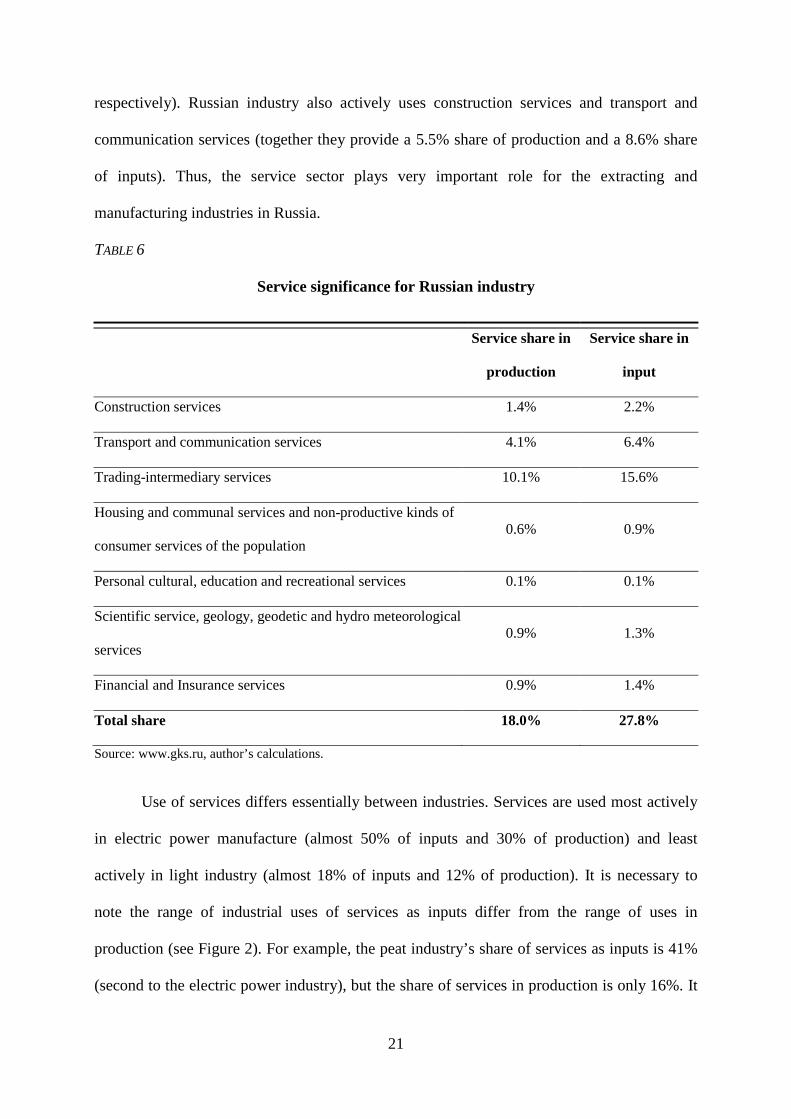
TABLE 6
Service significance for Russian industry
Service share in
production
Service share in
input
Construction services 1.4% 2.2%
Transport and communication services 4.1% 6.4%
Trading-intermediary services 10.1% 15.6%
Housing and communal services and non-productive kinds of
consumer services of the population 0.6% 0.9%
Personal cultural, education and recreational services 0.1% 0.1%
Scientific service, geology, geodetic and hydro meteorological
services 0.9% 1.3%
Financial and Insurance services 0.9% 1.4%
Total share 18.0% 27.8%
Source: www.gks.ru, author’s calculations.
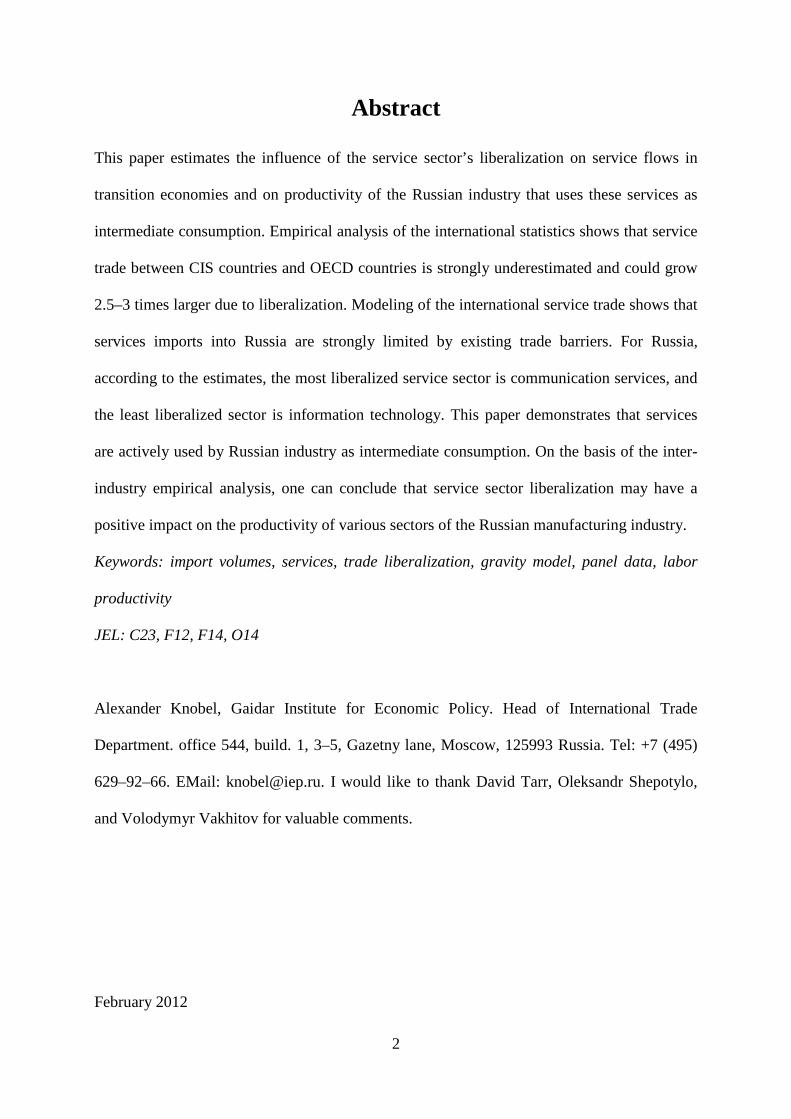
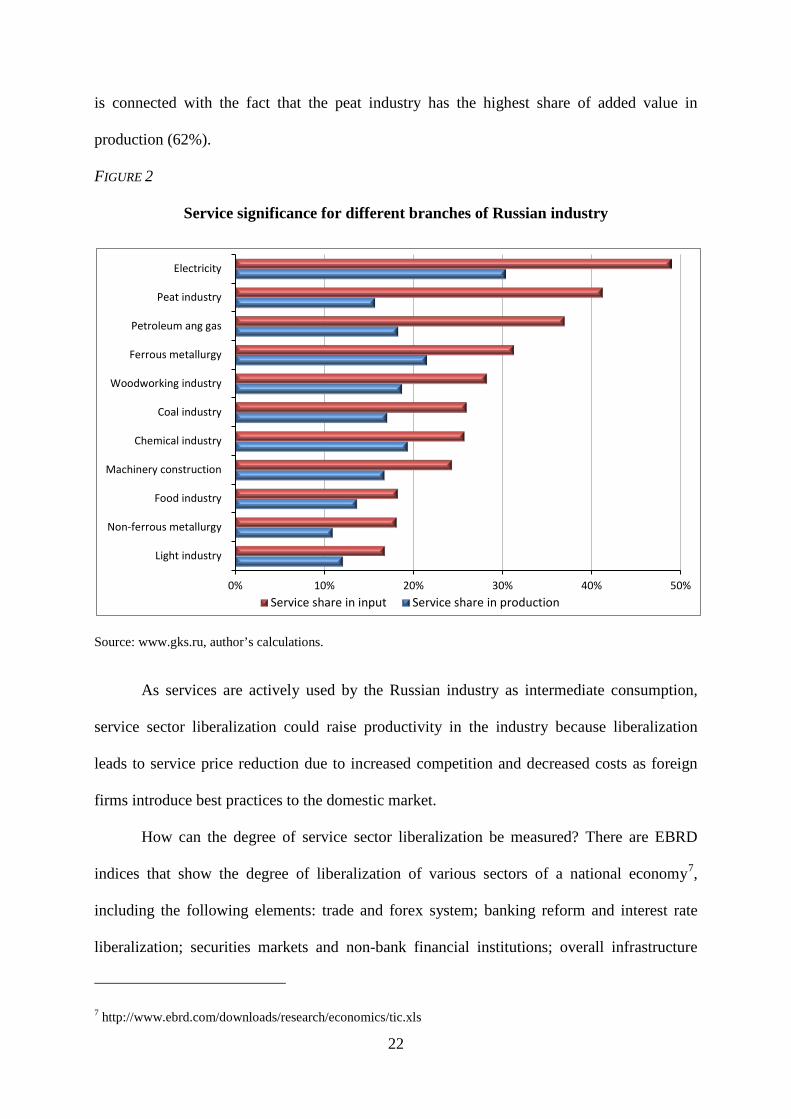
Use of services differs essentially between industries. Services are used most actively
in electric power manufacture (almost 50% of inputs and 30% of production) and least
actively in light industry (almost 18% of inputs and 12% of production). It is necessary to
note the range of industrial uses of services as inputs differ from the range of uses in
production (see Figure 2). For example, the peat industry’s share of services as inputs is 41%
(second to the electric power industry), but the share of services in production is only 16%. It
22
is connected with the fact that the peat industry has the highest share of added value in
production (62%).
FIGURE 2
Service significance for different branches of Russian industry
Source: www.gks.ru, author’s calculations.
As services are actively used by the Russian industry as intermediate consumption,
service sector liberalization could raise productivity in the industry because liberalization
leads to service price reduction due to increased competition and decreased costs as foreign
firms introduce best practices to the domestic market.
How can the degree of service sector liberalization be measured? There are EBRD
indices that show the degree of liberalization of various sectors of a national economy7,
including the following elements: trade and forex system; banking reform and interest rate
liberalization; securities markets and non-bank financial institutions; overall infrastructure
7 http://www.ebrd.com/downloads/research/economics/tic.xls
0% 10% 20% 30% 40% 50%
Light industry
Non-ferrous metallurgy
Food industry
Machinery construction
Chemical industry
Coal industry
Woodworking industry
Ferrous metallurgy
Petroleum ang gas
Peat industry
Electricity
Service share in input Service share in production
23
reform; telecommunications; railways; and roads. The minimum value of an index is 1 and the
maximum 4.3.
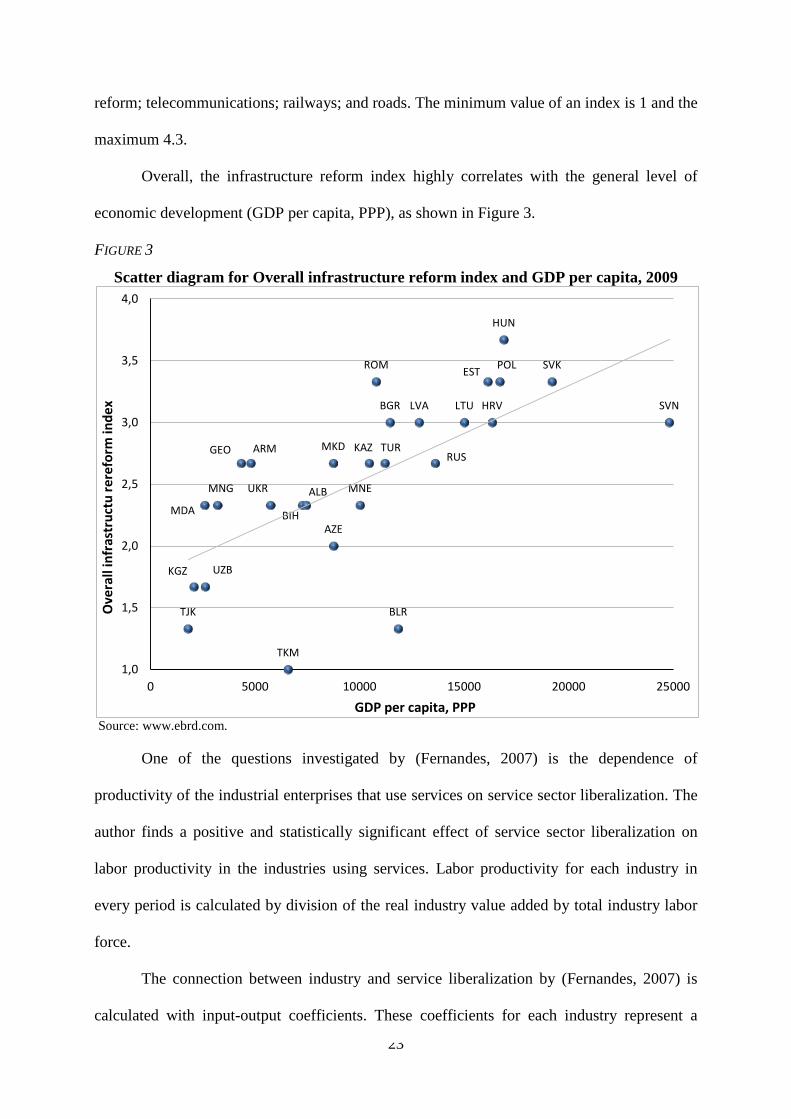
Overall, the infrastructure reform index highly correlates with the general level of
economic development (GDP per capita, PPP), as shown in Figure 3.
FIGURE 3
Scatter diagram for Overall infrastructure reform index and GDP per capita, 2009
Source: www.ebrd.com.
One of the questions investigated by (Fernandes, 2007) is the dependence of
productivity of the industrial enterprises that use services on service sector liberalization. The
author finds a positive and statistically significant effect of service sector liberalization on
labor productivity in the industries using services. Labor productivity for each industry in
every period is calculated by division of the real industry value added by total industry labor
force.
The connection between industry and service liberalization by (Fernandes, 2007) is
calculated with input-output coefficients. These coefficients for each industry represent a
TJK
KGZ
MDA
UZB
MNG
GEO ARM
UKR
TKM
BIH
ALB
MKD
AZE
MNE
KAZ
ROM
TUR
BGR
BLR
LVA
RUS
LTU
EST
HRV
POL
HUN
SVK
SVN
1,0
1,5
2,0
2,5
3,0
3,5
4,0
0 5000 10000 15000 20000 25000
Ove
rall
infr
astr
uctu
rere
form
inde
x
GDP per capita, PPP
24
share of the cost of services from each service sector of the total cost of production. For each
industry, corresponding factors are multiplied by the degree of service liberalization of each
sector. Fernandes uses EBRD indices of reforms progressiveness for the degree of
liberalization of each service sector and shows that there is a positive and statistically
significant influence of service liberalization on labor industry productivity for all Eastern
European countries in the study. In other words, industries that use services to a greater
degree from more liberalized service sectors exhibit, on average, higher productivity than
other industries.
Like (Fernandes, 2007), this paper uses the following formula to calculate the index of
service input liberalization for industry i in year t:
, , , ,i t i k k tkINDEX a INDEX=∑ (4)
where {Transport and communication; Trading-intermediary; Financial and Insurance}k∈ ,
ai,k is the input-output coefficient for industry i and service sector k, and INDEXk,t is the index
of liberalization for service sector k in year t. The index of liberalization for service sector k is
calculated as follows:
1(Transport and communication) (Telecommunications+Railways Roads)3
INDEX = + (5)
(Trading-intermediary) Trade & Forex systemINDEX = (6)
1(Financial and Insurance) (Banking reform Securities markets )2
INDEX = + (7)
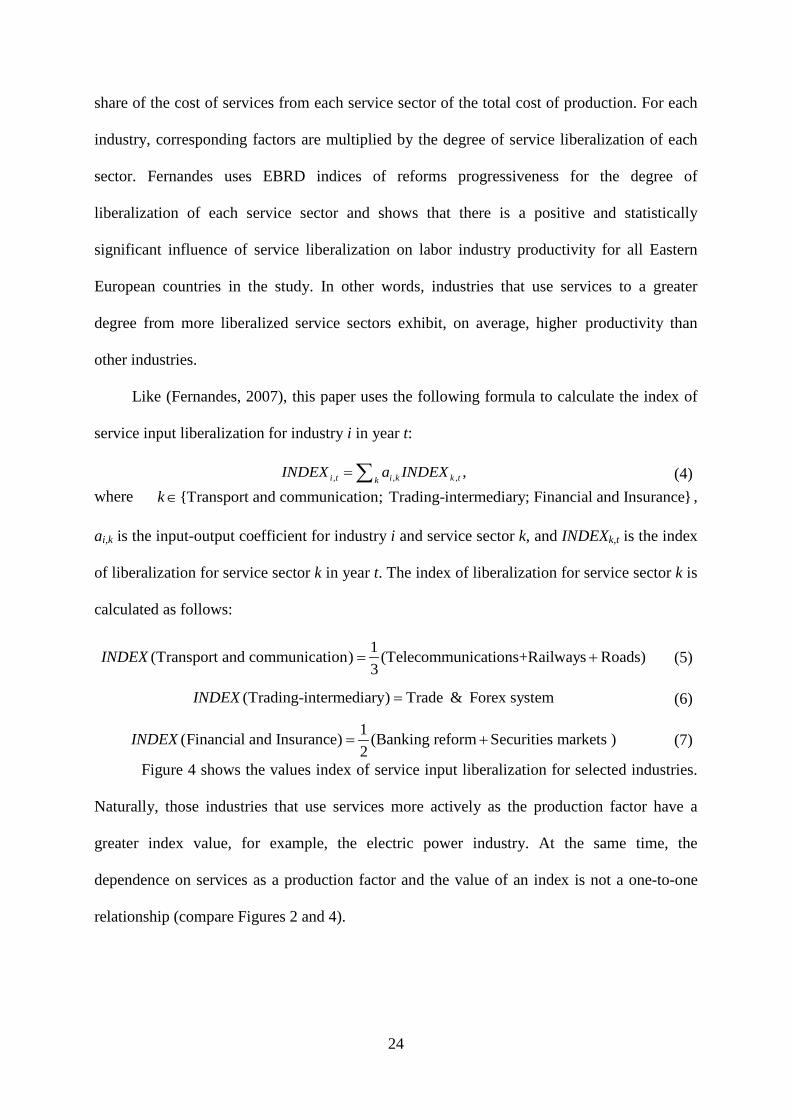
Figure 4 shows the values index of service input liberalization for selected industries.
Naturally, those industries that use services more actively as the production factor have a
greater index value, for example, the electric power industry. At the same time, the
dependence on services as a production factor and the value of an index is not a one-to-one
relationship (compare Figures 2 and 4).
25
Figure 4
Index of service input liberalization (2000–2008 average)
Source: author’s calculations.
To estimate the influence of service sector liberalization on productivity in the Russian
extracting and manufacturing industry, I estimate the following econometric specifications for
the period of 2000–2008:
(1) (1) (1) (1), 1 , 2 , 3 ,ln( ) ln ,i t i t i t i t
i
VALabor productivity INDEX VAPROD
α β β β ξ = + + + +
(8)
(2) (2) (2), 1 , 2 ,ln( ) lni t i t i tLabor productivity INDEX VAα β β= + + +
(2) (2)3 4 ,ln ,RUS
t i ti
VA GDPpcPROD
β β ε + + +
(9)
(3) (3) (3), 1 , 2 , 3 ,ln( ) ln ,i t i i t i t t i tLabor productivity INDEX VA NERα β β β η= + + + + (10)
(4) (4), 1 , 2 ,ln( ) lni t i i t i tLabor productivity INDEX VAα β β= + + +
(4) (4)3 4 ,ln ,RUS
t t i tNER GDPpcβ β ρ+ + +
(11)
where
Labor productivityi,t = labor productivity in 2005 prices in industry i in year t (ratio of
value added to labor, in real terms);
0 0,1 0,2 0,3 0,4 0,5 0,6 0,7 0,8
Non-ferrous metallurgy
Light industry
Machinery construction
Food industry
Peat industry
Coal industry
Petroleum and gas
Chemical industry
Woodworking industry
Ferrous metallurgy
Electricity
26
INDEXi,t = index of service input liberalization for industry i in year t;
VAi,t = value added in 2005 prices in industry i in year t;
i
VAPROD
= share of value added in production for industry i according to input-
output table;
NERi,t = nominal exchange rate (rubles per USD) in year t;
RUStGDPpc = GDP per capita in 2005 prices, PPP, in year t.
Unlike Fernandes (2007), in order to test the hypothesis about the positive influence of
service sector liberalization on manufacturing and extracting industry productivity, I control
for variables that can influence the productivity of every industry.
The regression uses variables for the value added into industries and the share of the
value added in production to control for industry-specific characteristics. Thus, the share of
value added in production used due to a condition in 2004 that prevents us from using the
specification with the fixed effects with this variable. Gross national product per capita is used
to control for the general level of economic development.
I add the nominal exchange rate in regressions with fixed effects because national
currency depreciation leads to greater competitiveness of domestic industries and to a larger
volume of production in dollar terms. Regressions with fixed effects show the influence of
explanatory factors on productivity over time, assuming that this influence is identical to all
objects; therefore, inclusion of a nominal exchange rate shows the average influence of ruble
depreciation on industry productivity.
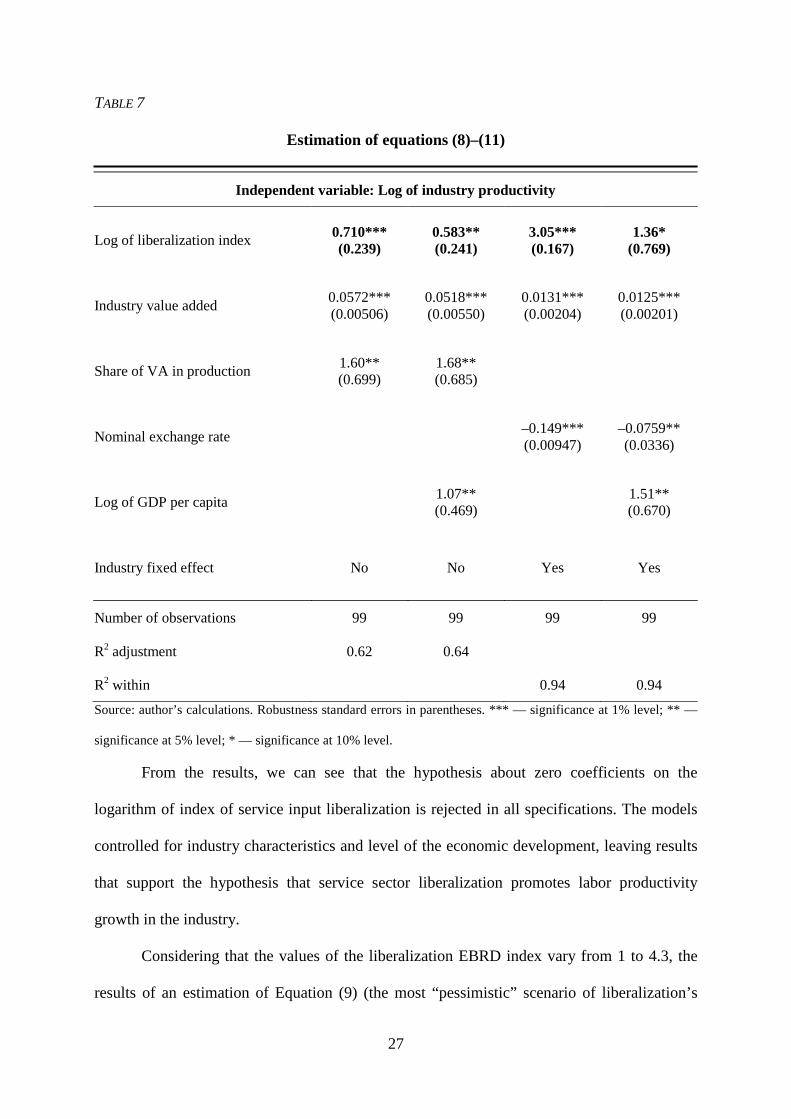
The estimation results of Equations (8)–(11) are shown in Table 7.
27
TABLE 7
Estimation of equations (8)–(11)
Independent variable: Log of industry productivity
Log of liberalization index 0.710*** (0.239)
0.583** (0.241)
3.05*** (0.167)
1.36* (0.769)
Industry value added 0.0572*** (0.00506)
0.0518*** (0.00550)
0.0131*** (0.00204)
0.0125*** (0.00201)
Share of VA in production 1.60** (0.699)
1.68** (0.685)
Nominal exchange rate –0.149*** (0.00947)
–0.0759** (0.0336)
Log of GDP per capita 1.07** (0.469) 1.51**
(0.670)
Industry fixed effect No No Yes Yes
Number of observations 99 99 99 99
R2 adjustment 0.62 0.64
R2 within 0.94 0.94
Source: author’s calculations. Robustness standard errors in parentheses. *** — significance at 1% level; ** —
significance at 5% level; * — significance at 10% level.
From the results, we can see that the hypothesis about zero coefficients on the
logarithm of index of service input liberalization is rejected in all specifications. The models
controlled for industry characteristics and level of the economic development, leaving results
that support the hypothesis that service sector liberalization promotes labor productivity
growth in the industry.
Considering that the values of the liberalization EBRD index vary from 1 to 4.3, the
results of an estimation of Equation (9) (the most “pessimistic” scenario of liberalization’s
28
influence on industry productivity) make it possible to calculate the degree to which only one
service sector liberalization will affect labor productivity in the industry, holding constant the
value added in industries, the share of value added in production, and the general level of
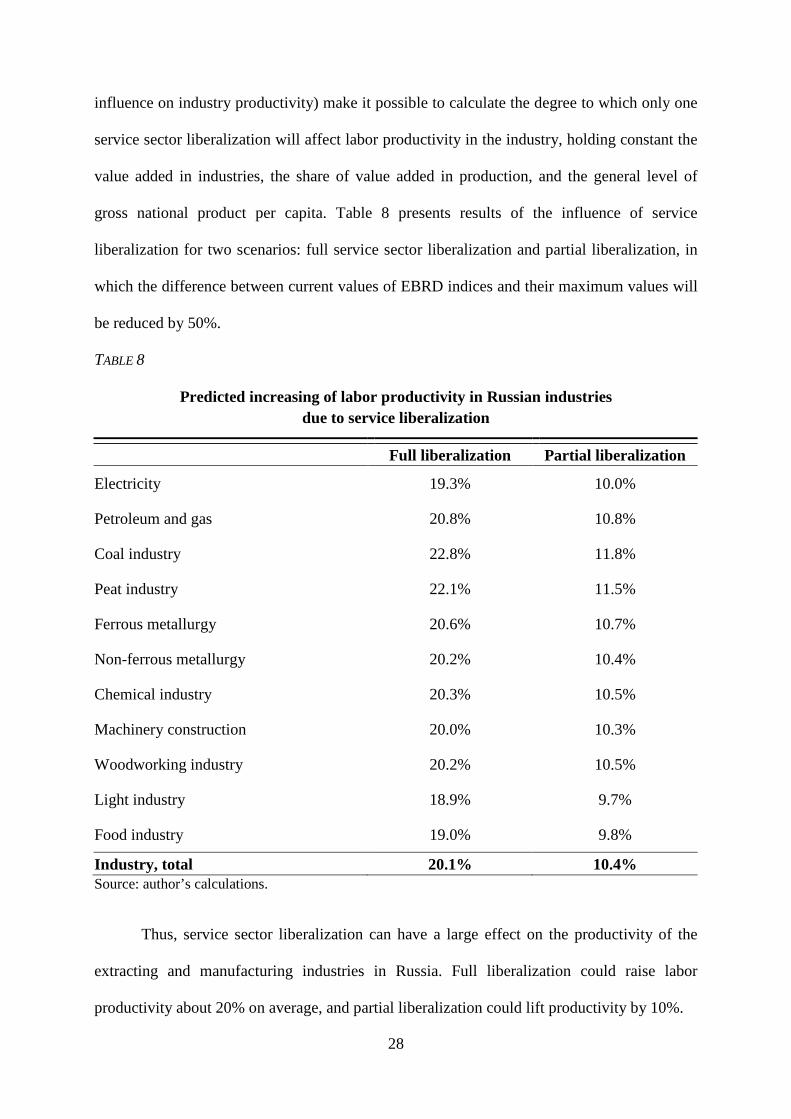
gross national product per capita. Table 8 presents results of the influence of service
liberalization for two scenarios: full service sector liberalization and partial liberalization, in
which the difference between current values of EBRD indices and their maximum values will
be reduced by 50%.
TABLE 8
Predicted increasing of labor productivity in Russian industries due to service liberalization
Full liberalization Partial liberalization
Electricity 19.3% 10.0%
Petroleum and gas 20.8% 10.8%
Coal industry 22.8% 11.8%
Peat industry 22.1% 11.5%
Ferrous metallurgy 20.6% 10.7%
Non-ferrous metallurgy 20.2% 10.4%
Chemical industry 20.3% 10.5%
Machinery construction 20.0% 10.3%
Woodworking industry 20.2% 10.5%
Light industry 18.9% 9.7%
Food industry 19.0% 9.8%
Industry, total 20.1% 10.4% Source: author’s calculations.
Thus, service sector liberalization can have a large effect on the productivity of the
extracting and manufacturing industries in Russia. Full liberalization could raise labor
productivity about 20% on average, and partial liberalization could lift productivity by 10%.
29
4. Conclusion
Services play an increasingly important role in modern economies. Services are not
only an end product but also used as intermediate consumption for the manufacturing and
mining industry. This paper analyzes the influence of service sector liberalization on the level
of trade of these services and on productivity of the industries that use these services as
inputs.
The results indicate that trade in services in the CIS and OECD countries is lower than
predicted for countries with similar characteristics. Trade in services between the CIS
countries and the OECD countries could be, on average, 2.7 times larger if trade were at its
predicted level. It is very likely that services trade between these regions would be much large
if barriers to services trade were smaller.
Our results also indicate that service imports into Russia are well below predicted
levels for countries with similar characteristics. Again, it is highly likely that the lower level
of services trade is due to existing trade barriers. We find that the country most open to
service imports is the U.S. Openness leaders in different service sectors are following
countries: transportation services, communication, computer and information services,
personal cultural and recreational services, other business services — USA; travel —
Armenia; construction — Kuwait; insurance — UAE; financial services — Luxembourg;
Royalties and license fees — Georgia. In Russia, the most liberalized service sector is
communication services, and the least liberalized sector is information technology. In this
sector with low services trade relative to predicted level, we would expect the greatest growth
in imports due to liberalization, and, as a consequence, the greatest increase in competition
and an introduction of foreign best practices to the Russian market. The most open CIS
countries for service import are Russia, Kazakhstan, and Uzbekistan, and the least open are
Belarus, Moldova, and Kyrgyzstan.
30
The research reveals that services are significantly used by the Russian industry as an
input into production: about 20% of the value of production and about 30% of the value of
intermediate inputs. The inter-industry empirical analysis has shown that liberalization of the
service sector has a positive impact on productivity in manufacturing and mining sectors: full
services sector liberalization could raise labor productivity an average of 20%, and partial
liberalization — halfway to full liberalization — would raise labor productivity by 10%.
5. References
Arnold J.M., B. Javorcik, and A. Mattoo (2011): Does Services Liberalization Benefit
Manufacturing Firms? Evidence from the Czech Republic, Journal of International
Economics. Vol. 85. P. 136–146.
Arnold J.M., A. Mattoo, and Gaia Narciso (2006): Services Inputs and Firm Productivity in
Sub-Saharan Africa. Evidence from Firm-Level Data, World Bank Policy Research Working
Paper No. 4048.
Baldwin Richard and Daria Taglioni (2006): Gravity for Dummies and Dummies for Gravity
Equations, NBER Working Paper No. 12516
Bergstrand J.H. (1985): The Gravity Equation in International Trade: Some Microeconomic
Foundations and Empirical Evidence, The Review of Economics and Statistics. Vol. 67. P.
474–481.
Blanchard E. (2007): Foreign Direct Investment, Endogenous Tariffs, and Preferential Trade
Agreements, Advances in Economic Analysis and Policy, Berkeley Electronic Press, 7(1).
31
Conway Paul, Donato de Rosa, Giuseppe Nicoletti, and Faye Steiner (2006): Regulation,
Competition and Productivity Convergences, OECD Economics Department Working Papers
No. 509.
Eschenbach Felix and Bernard Hoekman (2005): Services Policy Reform and Economic
Growth in Transition Economies, 1990–2004, World Bank Policy Research Working Paper
No. 3663.
Fernandes Ana (2007): Structure and Performance of the Services Sector in Transition
Economies, Policy Research Working Paper No. 4357.
Fernandes Ana and Caroline Paunov (2012): Foreign Direct Investment in Services and
Manufacturing Productivity Growth: Evidence for Chile, Journal of Development Economics.
Vol. 97. P. 305–321.
Findlay, C. and Warren, T. (2000) Impediments to Trade in Services: Measurement and
Policy Implications. Routledge, London.
Francois Joseph (1993): Explaining the Pattern of Trade in Producer Services, International
Economic Journal. Vol. 7. P. 23–31.
Francois Joseph and Wooton (2001): Trade in International Transport Services: The Role of
Competition, Review of International Economics. Vol. 9. P. 249–61.
Francois Joseph, B. Hoekman, and J. Woerz (2007): Does Gravity Apply to Nontangibles?
Trade and FDI in services, https://www.gtap.agecon.purdue.edu/resources/download/3407.pdf
32
Francois Joseph and G. Wignarajan (2008): Economic Implication of Asian Integration,
Global Economy Journal. Vol. 8. P. 1–48.
Francois Joseph, O. Pindyuk, and J. Woerz (2009). International Transactions in Services:
Data on International Trade and FDI in the Service Sectors, University of Linz, Institute for
International and Development Economics discussion paper 20090802.
Francois Joseph and Bernard Hoekman (2010): Services Trade and Policy, Journal of
Economic Literature. Vol. 48. P. 642–692.
Helpman Elhanan, Marc Melitz, Yona Rubinstein (2007): Estimating Trade Flows: Trading
Partners and Trading Volumes, NBER Working Paper No. 12927.
Javorcik Beata S. (2004): Does Foreign Direct Investment Increase the Productivity of
Domestic Firms? In Search of Spillovers through Backward Linkages, American Economic
Review. Vol. 94. P. 605–627.
Kimura F. and H. Lee (2006): The Gravity Equation in International Trade in Services,
Review of World Economics. Vol. 142. P. 92–121.
Konan D. and K. Maskus (2006): Quantifying the Impact of Services Liberalization in a
Developing Country, Journal of Development Economics. Vol. 81. P. 142–62.
Mirza D. and G. Nicoletti (2004): What’s so special in international trade in services?
Research Paper 2004/02, Centre for Research on Globalisation and Economic Policy.
Nicoletti Giuseppe and Stefano Scarpetta (2003): Regulation, Productivity and Growth:
OECD Evidence, World Bank Policy Research Working Paper No. 2944.
33
Park S. (2002): How Far has Regional Integration Deepened? Evidence from Trade in
Services, KIEP Working Paper 02–17.
Sapir A. and E. Lutz (1980): Trade in Non-Factor Services: Past Trends and Current Issues,
World Bank Staff Working Paper No. 410.
Westerlund Joakim and Fredrik Wilhelmsson (2009): Estimating the gravity model without
gravity using panel data, Applied Economics. Vol. 43. P. 641–649.
34
6. Appendix
FIGURE 5
Share of Services in Russian economy
Source: World Development Indicators
FIGURE 6
Share of Services in Russian international trade
Source: World Development Indicators
35% 38%
50% 47% 49%
56% 54% 56% 57% 55% 56% 58%
60% 61% 60% 55% 57% 57% 57%
46% 46% 46% 46% 48% 50%
52%
58% 59% 57% 57% 59% 59% 59% 60% 60% 61% 62% 63%
0%
10%
20%
30%
40%
50%
60%
70%
1990
1991
1992
1993
1994
1995
1996
1997
1998
1999
2000
2001
2002
2003
2004
2005
2006
2007
2008
Services, value added (% of GDP) Employment in services (% of total employment)
11% 11% 13%
14% 14%
11%
8% 10%
11% 11% 10% 9% 9% 10% 10%
23% 24%
22% 22% 22%
25% 27%
28% 27% 26% 25%
24%
21% 21% 21%
0%
5%
10%
15%
20%
25%
30%
1994 1995 1996 1997 1998 1999 2000 2001 2002 2003 2004 2005 2006 2007 2008Service exports, % of total export Service imports, % of total import