Embed Size (px)
Citation preview
© CHS Alliance 2016 HR Metrics Dashboard: A Toolkit
HR METRICS DASHBOARD: A TOOLKIT
A toolkit for planning and designing a Human Resources (HR) metrics dashboard
July 2016
© CHS Alliance 2016 HR Metrics Dashboard: A Toolkit
Authors CHS Alliance and Ann Start (Start Development).
Disclaimer Considerable care has been taken to ensure this document is both accurate and relevant. However, the CHS Alliance is unable to provide any warranty concerning the accuracy, completeness or relevance to your organisation relating to any information contained herein. This publication may be quoted by not-for-profit organisations, in any form (written, visual, electronic, or audio) without the express permission of the CHS Alliance, provided any and all references are fully attributed to the CHS Alliance and this publication. All other requests for permission must be directed to and approved in writing by the CHS Alliance. You can contact the CHS Alliance by email on [email protected]. All rights reserved.
© CHS Alliance 2016 HR Metrics Dashboard: A Toolkit
Table of Contents 1. Introduction ............................................................................................................................ 1
Why adopt an HR metrics dashboard? ............................................................................................... 1 Steps in the process of adopting an HR metrics dashboard ............................................................... 2
2. Measures of HR impact ............................................................................................................ 3 Ten essential criteria for successfully adopting an HR dashboard ..................................................... 3 Core Humanitarian Standard and guidance on accountability for good HR practice ........................ 4
3. A dashboard for whom? .......................................................................................................... 5 Power-interest stakeholder matrix .................................................................................................... 5 Supporting the process to adopt an HR dashboard ........................................................................... 5
4. Identifying the metrics............................................................................................................. 7 Selecting appropriate metrics ............................................................................................................ 9 Understand the sources of data ......................................................................................................... 9 Sample tools ..................................................................................................................................... 10
5. Presenting the dashboard ....................................................................................................... 12 Dashboard example .......................................................................................................................... 13 Dashboard display elements ............................................................................................................ 14
6. Mechanisms for responding to what has been learned ............................................................ 15
7. Glossary of acronyms and abbreviations ................................................................................ 16
8. References ............................................................................................................................ 17
Table of Figures Figure 1: Process of adopting an HR metrics dashboard ........................................................................ 2 Figure 2: Power-interest stakeholder matrix .......................................................................................... 5 Figure 3: Planning your dashboard ......................................................................................................... 9 Figure 4: Kirkpatrick model to illustrate evidence of learning and learning impact ............................ 10 Figure 5: Staff turnover calculator ........................................................................................................ 11 Figure 6: ROI calculator ......................................................................................................................... 11 Figure 7: Data collection design table .................................................................................................. 11 Figure 8: Sample HR metrics dashboard ............................................................................................... 13 Figures 9 and 10: More sample HR metrics dashboards ...................................................................... 14 Figure 11: Pie chart ............................................................................................................................... 14 Figure 12: Two-variable plot chart........................................................................................................ 14 Figure 13: Sample template for documenting action plan ................................................................... 15
© CHS Alliance 2016 HR Metrics Dashboard: A Toolkit 1
1. Introduction This toolkit enables human resources (HR) managers in the humanitarian and development sector to use HR metrics to support programme and operational impact. An HR metrics dashboard identifies key human capital1 trends in an organisation which the chief executive officer (CEO) and leadership team need to understand and monitor closely. The toolkit also outlines why and how those trends should be reported. An organisation’s commitment to improving the quality and effectiveness of humanitarian action, as well as accountability to communities and people affected by crisis, as detailed in the Core Humanitarian Standard on Quality and Accountability (CHS), underpins this toolkit. This toolkit can be used alongside the CHS with its Guidance Notes and Indicators, the CHS Alliance HR Manual, CHS Alliance Handbook for Managing HR Effectiveness, and CHS Alliance Staff Survey Toolkit, all of which have been designed to help organisations assessing and improving their people management systems and practices. A 2015 CIPD research report, Human Capital Reporting: Investing for sustainable growth, notes that there is “a growing body of evidence which points to the value of human capital data as a means for leaders to assess the links between leadership, management and business performance’’. In the humanitarian sector, this includes programme performance, and overall organisational impact and effectiveness.
Why adopt an HR metrics dashboard? A dashboard is a visual presentation which communicates the key evidence for progress on the level of organisational effectiveness, in relation to achieving a set of strategic and operational objectives. The dashboard illustrates a number of data sets, often no more than six, in a summarised graphics format which enables analysis of key questions in support of management decision making. This toolkit maps how to develop and present an HR metrics dashboard. This basic toolkit is aimed at supporting non-governmental organisations (NGOs) who may have never used this approach before. For an advanced analysis, the CIPD toolkit2 will provide an additional range of more complex tools. Based on the principle that “what gets measured, gets managed”3, the dashboard can indicate at a glance that:
1. The adoption of the HR strategy ensures communities and people affected by crisis are receiving the assistance they require.
2. The current capacity and capability of staff and volunteers in the organisation are sufficient to deliver efficiently against objectives.
3. Appropriately skilled and supported employees can manage change and be innovative. 4. Resources are made available, and used cost effectively, to support the HR strategy. 5. Appropriate metrics illustrating organisational strategies/initiatives/measures (SIM) form an
objective, goals, strategies and measures framework (OGSM - Archpoint Consulting, 2014). An
1 CIPD (2015) Human capital describes the value of people at work and their collective knowledge, skills, abilities and capacity to develop and innovate. Human capital reporting aims to provide quantitative, as well as qualitative, data on a range of measures (such as labour turnover or employee engagement levels) to help identify which sort of HR or management interventions will drive business performance. http://www.cipd.co.uk/hr-resources/factsheets/human-capital.aspx 2 CIPD (2011) http://www.cipd.co.uk/hr-resources/practical-tools/using-hr-metrics-for-maximum-impact.aspx 3 Eidson, R. (2011) Metrics that matter to HR and how to find them in your systems. Deloitte LLP. Frequently attributed to Peter Drucker but actually, source unknown.
© CHS Alliance 2016 HR Metrics Dashboard: A Toolkit 2
OGSM provides a strategic planning framework for leaders to make decisions linked to tracking performance progress.
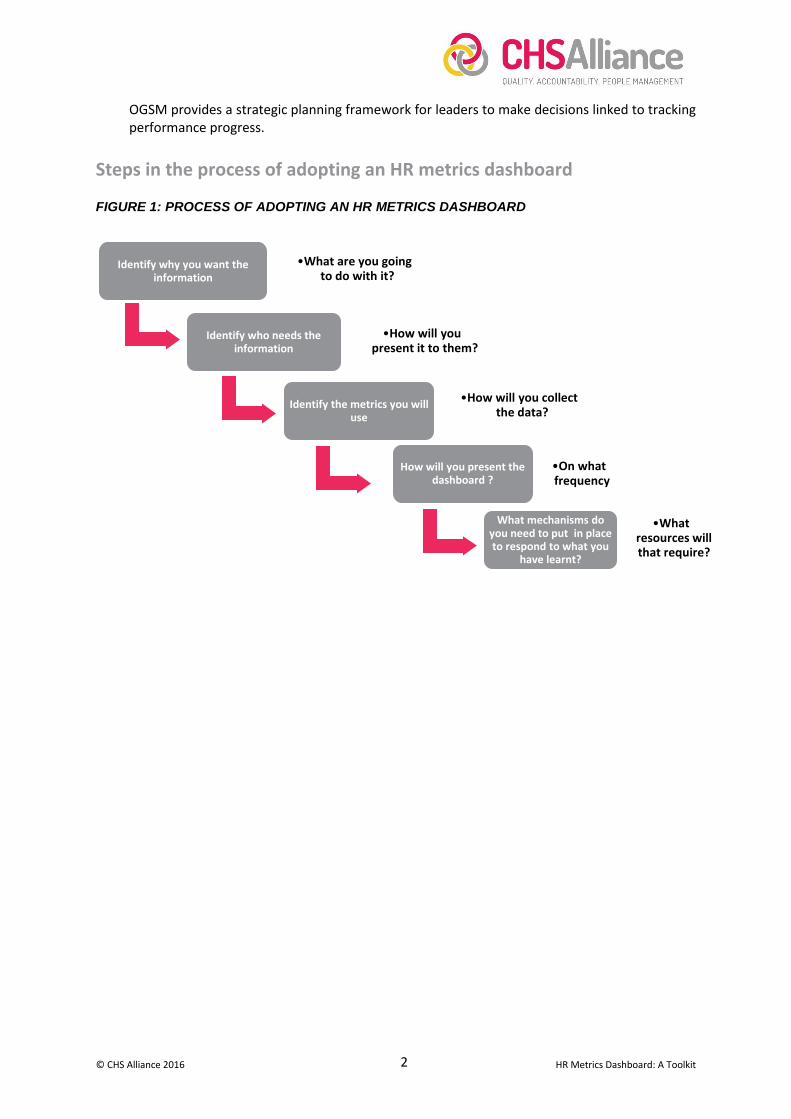
Steps in the process of adopting an HR metrics dashboard FIGURE 1: PROCESS OF ADOPTING AN HR METRICS DASHBOARD
Identify why you want the information
•What are you going to do with it?
Identify who needs the information
•How will you present it to them?
Identify the metrics you will use
•How will you collect the data?
How will you present the dashboard ?
•On what frequency
What mechanisms do you need to put in place to respond to what you
have learnt?
•What resources will that require?
© CHS Alliance 2016 HR Metrics Dashboard: A Toolkit 3
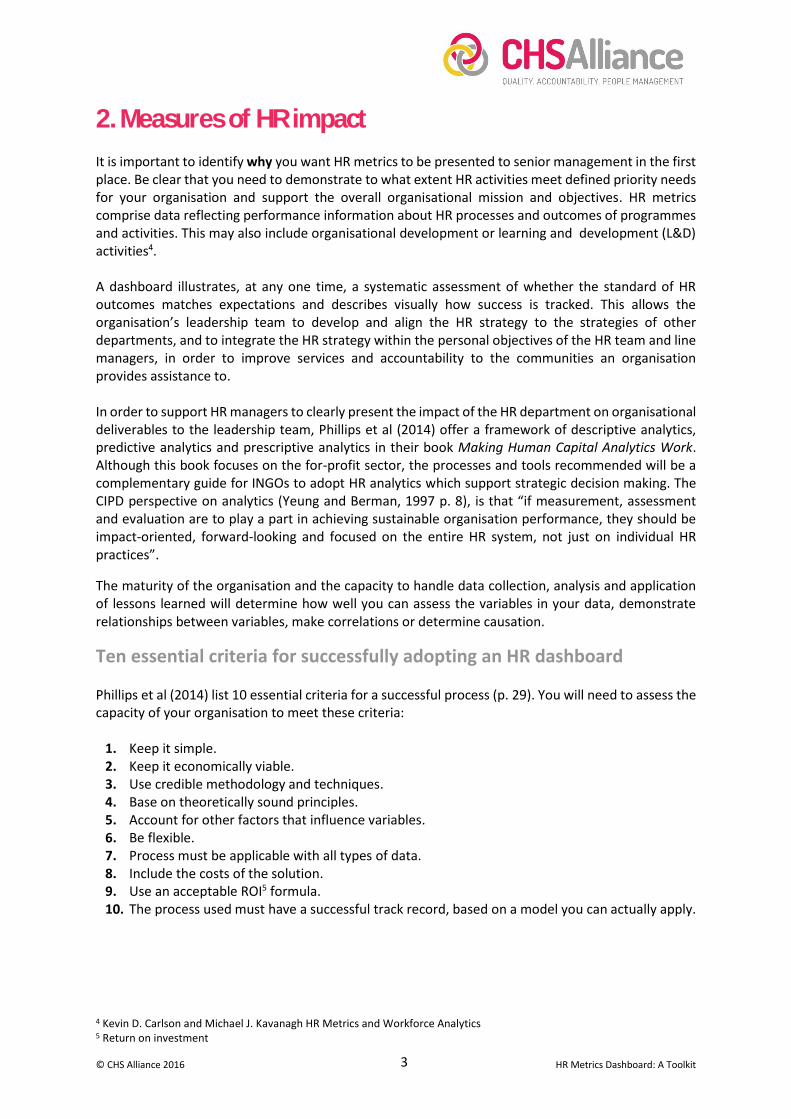
2. Measures of HR impact It is important to identify why you want HR metrics to be presented to senior management in the first place. Be clear that you need to demonstrate to what extent HR activities meet defined priority needs for your organisation and support the overall organisational mission and objectives. HR metrics comprise data reflecting performance information about HR processes and outcomes of programmes and activities. This may also include organisational development or learning and development (L&D) activities4. A dashboard illustrates, at any one time, a systematic assessment of whether the standard of HR outcomes matches expectations and describes visually how success is tracked. This allows the organisation’s leadership team to develop and align the HR strategy to the strategies of other departments, and to integrate the HR strategy within the personal objectives of the HR team and line managers, in order to improve services and accountability to the communities an organisation provides assistance to. In order to support HR managers to clearly present the impact of the HR department on organisational deliverables to the leadership team, Phillips et al (2014) offer a framework of descriptive analytics, predictive analytics and prescriptive analytics in their book Making Human Capital Analytics Work. Although this book focuses on the for-profit sector, the processes and tools recommended will be a complementary guide for INGOs to adopt HR analytics which support strategic decision making. The CIPD perspective on analytics (Yeung and Berman, 1997 p. 8), is that “if measurement, assessment and evaluation are to play a part in achieving sustainable organisation performance, they should be impact-oriented, forward-looking and focused on the entire HR system, not just on individual HR practices”.
The maturity of the organisation and the capacity to handle data collection, analysis and application of lessons learned will determine how well you can assess the variables in your data, demonstrate relationships between variables, make correlations or determine causation.
Ten essential criteria for successfully adopting an HR dashboard Phillips et al (2014) list 10 essential criteria for a successful process (p. 29). You will need to assess the capacity of your organisation to meet these criteria:
1. Keep it simple. 2. Keep it economically viable. 3. Use credible methodology and techniques. 4. Base on theoretically sound principles. 5. Account for other factors that influence variables. 6. Be flexible. 7. Process must be applicable with all types of data. 8. Include the costs of the solution. 9. Use an acceptable ROI5 formula. 10. The process used must have a successful track record, based on a model you can actually apply.
4 Kevin D. Carlson and Michael J. Kavanagh HR Metrics and Workforce Analytics 5 Return on investment
© CHS Alliance 2016 HR Metrics Dashboard: A Toolkit 4
Core Humanitarian Standard (CHS) and guidance on accountability for good HR practice Developing an HR metrics dashboard is part of an organisation being accountable for implementing an HR strategy that ensures communities and people affected by crisis are receiving the assistance they require. One of the key international standards which supports that accountability, is the Core Humanitarian Standard on Quality and Accountability (CHS) (2014). TheCHS provides, and illustrates, Nine Commitments which organisations and individuals involved in humanitarian action can follow to improve the quality and effectiveness of the assistance they provide. An HR metrics dashboard can contribute to evidencing progress against key aspects of the CHS which relate to HR strategy and outcomes relating to staff and volunteer resourcing and management. The accompanying CHS Guidance Notes and Indicators explain a number of actions and organisational responsibilities which an NGO should undertake in order to apply the Standard. Understanding why the CHS Commitments are important for the HR function, what the performance indicators are and answering some of the guiding questions for monitoring each Commitment’s Key Actions and Organisational Responsibilites, will help an organisation design a way to measure the impact of good HR and people management practices on programmes. For example CHS Commitment 8 states: “Communities and people affected by crisis receive the assistance they require from competent and well-managed staff and volunteers”. The quality criterion states: “Staff are supported to do their job effectively, and are treated fairly and equitably”. Some of the most relevant CHS Key Actions and Organisational Responsibilities for drafting a dashboard are given below:
7.3 Share learning and innovation internally, with communities and people affected by crisis, and with other stakeholders.
8.3 Staff develop and use the necessary personal, technical and management competencies to fulfil their role and understand how the organisation can support them to do this.
8.4 The organisation has the management and staff capacity and capability to deliver its programmes.
8.8 Policies are in place to support staff to improve their skills and competencies.
9.1 Design programmes and implement processes to ensure the efficient use of resources, balancing quality, cost and timeliness at each phase of the response.
9.2 Manage and use resources to achieve their intended purpose, minimising waste. The CHS Alliance Staff Survey is an additional tool to support analysis through an HR metrics dashboard by providing feedback to management on factors which contribute to individual and organsational performance. Results from such a survey will illustrate whether an NGO’s HR strategy produces such results as encouraging achievement of organisational objectives, improved organisational capability and an appropriate level of commitment to the workforce. Additional guidance, in prepararation for the design of your dashboard, can be found in the Agenda Consulting brief report on how to Maximise the Impact of your People Survey.
© CHS Alliance 2016 HR Metrics Dashboard: A Toolkit 5
3. A dashboard for whom? As part of most governance models, an organisation’s CEO and leadership team need to report regularly to the board. In order to provide evidence that the HR function is “doing the right things” and “doing them right”6 (CIPD p. 14), and to inform their own decision-making process, the leadership team need to be involved in deciding the reporting process and data presentation of the HR metrics dashboard so it speaks to them in ways that will resonate with and engage them.
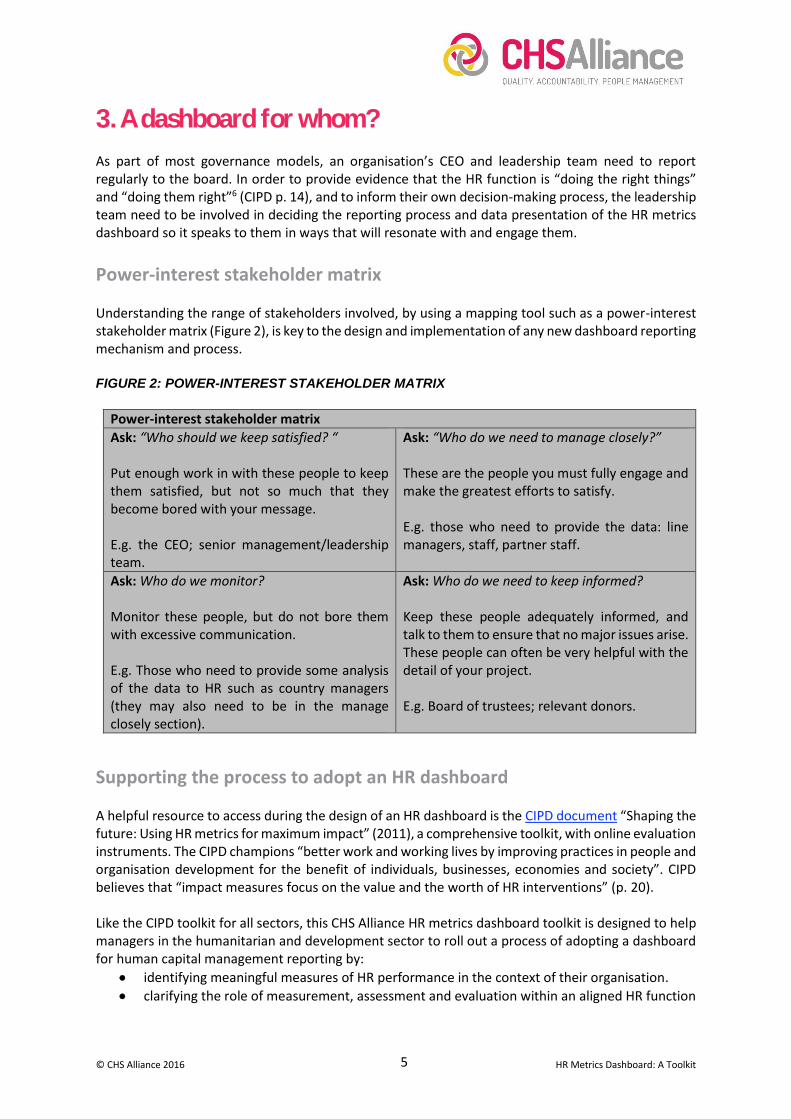
Power-interest stakeholder matrix Understanding the range of stakeholders involved, by using a mapping tool such as a power-interest stakeholder matrix (Figure 2), is key to the design and implementation of any new dashboard reporting mechanism and process. FIGURE 2: POWER-INTEREST STAKEHOLDER MATRIX
Power-interest stakeholder matrix
Ask: “Who should we keep satisfied? “ Put enough work in with these people to keep them satisfied, but not so much that they become bored with your message. E.g. the CEO; senior management/leadership team.
Ask: “Who do we need to manage closely?” These are the people you must fully engage and make the greatest efforts to satisfy. E.g. those who need to provide the data: line managers, staff, partner staff.
Ask: Who do we monitor? Monitor these people, but do not bore them with excessive communication. E.g. Those who need to provide some analysis of the data to HR such as country managers (they may also need to be in the manage closely section).
Ask: Who do we need to keep informed? Keep these people adequately informed, and talk to them to ensure that no major issues arise. These people can often be very helpful with the detail of your project. E.g. Board of trustees; relevant donors.
Supporting the process to adopt an HR dashboard
A helpful resource to access during the design of an HR dashboard is the CIPD document “Shaping the future: Using HR metrics for maximum impact” (2011), a comprehensive toolkit, with online evaluation instruments. The CIPD champions “better work and working lives by improving practices in people and organisation development for the benefit of individuals, businesses, economies and society”. CIPD believes that “impact measures focus on the value and the worth of HR interventions” (p. 20). Like the CIPD toolkit for all sectors, this CHS Alliance HR metrics dashboard toolkit is designed to help managers in the humanitarian and development sector to roll out a process of adopting a dashboard for human capital management reporting by:
identifying meaningful measures of HR performance in the context of their organisation.
clarifying the role of measurement, assessment and evaluation within an aligned HR function
© CHS Alliance 2016 HR Metrics Dashboard: A Toolkit 6
enhancing decision making and direction setting through effective use of measures, assessment and evaluation (CIPD 2011 p. 1).
Bearing each of these in mind will help in the preparation of a clear presentation of the data and its relevance.
© CHS Alliance 2016 HR Metrics Dashboard: A Toolkit 7
4. Identifying the metrics
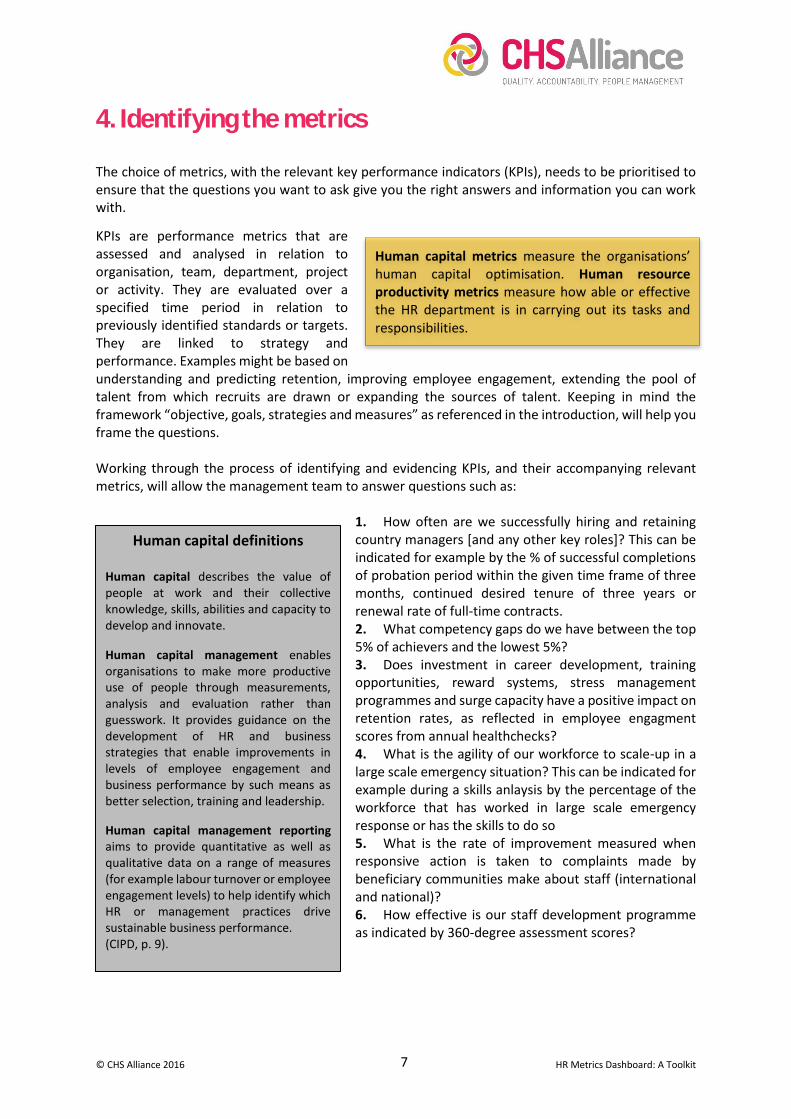
The choice of metrics, with the relevant key performance indicators (KPIs), needs to be prioritised to ensure that the questions you want to ask give you the right answers and information you can work with.
KPIs are performance metrics that are assessed and analysed in relation to organisation, team, department, project or activity. They are evaluated over a specified time period in relation to previously identified standards or targets. They are linked to strategy and performance. Examples might be based on understanding and predicting retention, improving employee engagement, extending the pool of talent from which recruits are drawn or expanding the sources of talent. Keeping in mind the framework “objective, goals, strategies and measures” as referenced in the introduction, will help you frame the questions. Working through the process of identifying and evidencing KPIs, and their accompanying relevant metrics, will allow the management team to answer questions such as:
1. How often are we successfully hiring and retaining country managers [and any other key roles]? This can be indicated for example by the % of successful completions of probation period within the given time frame of three months, continued desired tenure of three years or renewal rate of full-time contracts. 2. What competency gaps do we have between the top 5% of achievers and the lowest 5%? 3. Does investment in career development, training opportunities, reward systems, stress management programmes and surge capacity have a positive impact on retention rates, as reflected in employee engagment scores from annual healthchecks? 4. What is the agility of our workforce to scale-up in a large scale emergency situation? This can be indicated for example during a skills anlaysis by the percentage of the workforce that has worked in large scale emergency response or has the skills to do so 5. What is the rate of improvement measured when responsive action is taken to complaints made by beneficiary communities make about staff (international and national)? 6. How effective is our staff development programme as indicated by 360-degree assessment scores?
Human capital metrics measure the organisations’ human capital optimisation. Human resource productivity metrics measure how able or effective the HR department is in carrying out its tasks and responsibilities.
Human capital definitions Human capital describes the value of people at work and their collective knowledge, skills, abilities and capacity to develop and innovate.
Human capital management enables organisations to make more productive use of people through measurements, analysis and evaluation rather than guesswork. It provides guidance on the development of HR and business strategies that enable improvements in levels of employee engagement and business performance by such means as better selection, training and leadership.
Human capital management reporting aims to provide quantitative as well as qualitative data on a range of measures (for example labour turnover or employee engagement levels) to help identify which HR or management practices drive sustainable business performance. (CIPD, p. 9).
© CHS Alliance 2016 HR Metrics Dashboard: A Toolkit 8
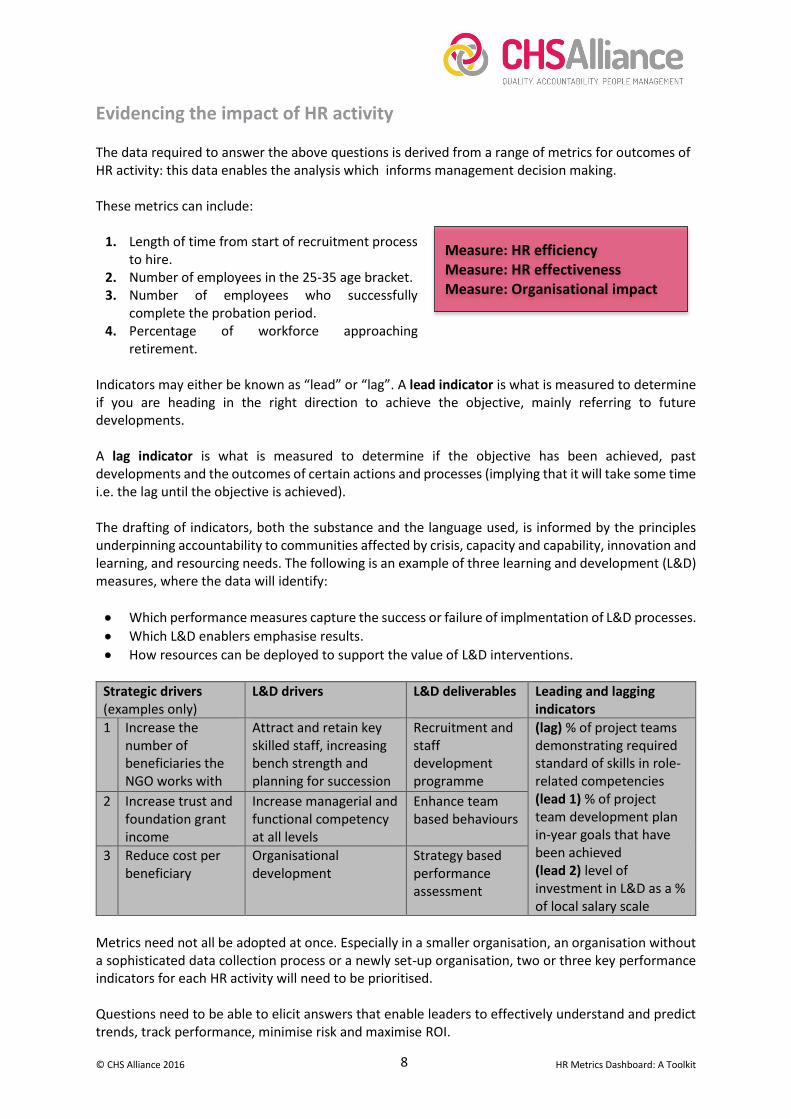
Evidencing the impact of HR activity The data required to answer the above questions is derived from a range of metrics for outcomes of HR activity: this data enables the analysis which informs management decision making. These metrics can include:
1. Length of time from start of recruitment process to hire.
2. Number of employees in the 25-35 age bracket. 3. Number of employees who successfully
complete the probation period. 4. Percentage of workforce approaching
retirement.
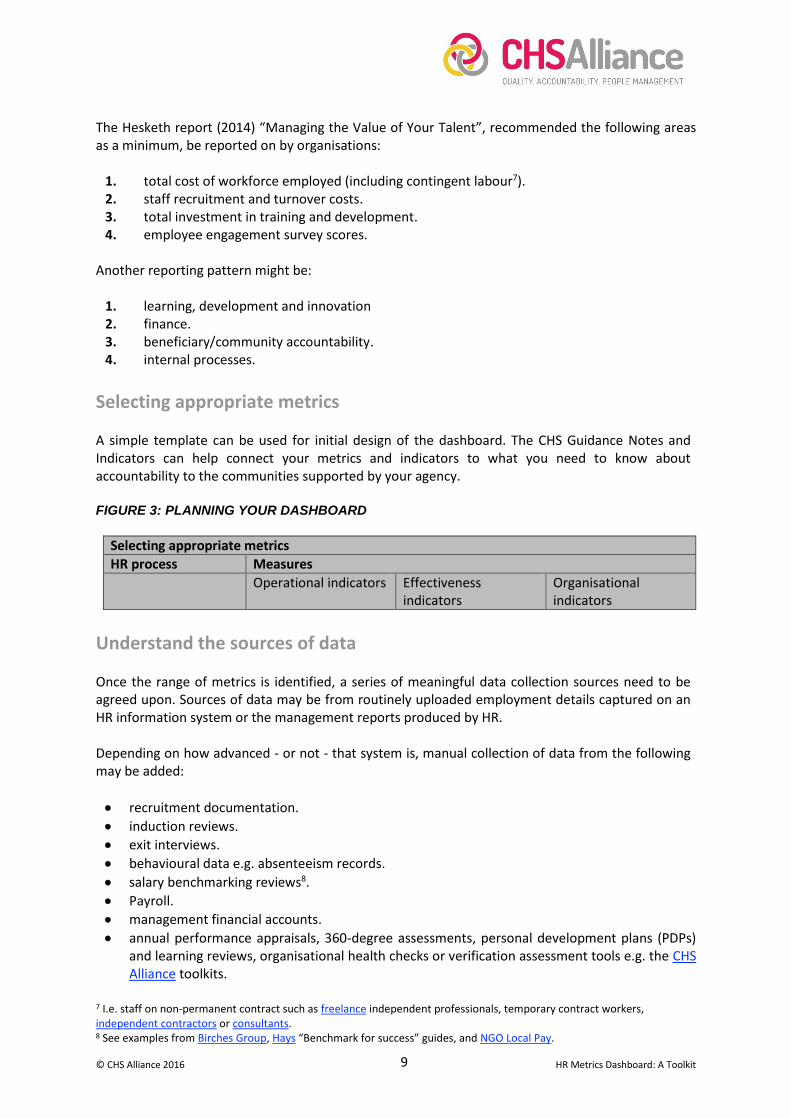
Indicators may either be known as “lead” or “lag”. A lead indicator is what is measured to determine if you are heading in the right direction to achieve the objective, mainly referring to future developments. A lag indicator is what is measured to determine if the objective has been achieved, past developments and the outcomes of certain actions and processes (implying that it will take some time i.e. the lag until the objective is achieved). The drafting of indicators, both the substance and the language used, is informed by the principles underpinning accountability to communities affected by crisis, capacity and capability, innovation and learning, and resourcing needs. The following is an example of three learning and development (L&D) measures, where the data will identify:
Which performance measures capture the success or failure of implmentation of L&D processes.
Which L&D enablers emphasise results.
How resources can be deployed to support the value of L&D interventions.
Strategic drivers (examples only)
L&D drivers L&D deliverables Leading and lagging indicators
1 Increase the number of beneficiaries the NGO works with
Attract and retain key skilled staff, increasing bench strength and planning for succession
Recruitment and staff development programme
(lag) % of project teams demonstrating required standard of skills in role- related competencies (lead 1) % of project team development plan in-year goals that have been achieved (lead 2) level of investment in L&D as a % of local salary scale
2 Increase trust and foundation grant income
Increase managerial and functional competency at all levels
Enhance team based behaviours
3 Reduce cost per beneficiary
Organisational development
Strategy based performance assessment
Metrics need not all be adopted at once. Especially in a smaller organisation, an organisation without a sophisticated data collection process or a newly set-up organisation, two or three key performance indicators for each HR activity will need to be prioritised. Questions need to be able to elicit answers that enable leaders to effectively understand and predict trends, track performance, minimise risk and maximise ROI.
Measure: HR efficiency Measure: HR effectiveness Measure: Organisational impact
© CHS Alliance 2016 HR Metrics Dashboard: A Toolkit 9
The Hesketh report (2014) “Managing the Value of Your Talent”, recommended the following areas as a minimum, be reported on by organisations:
1. total cost of workforce employed (including contingent labour7). 2. staff recruitment and turnover costs. 3. total investment in training and development. 4. employee engagement survey scores.
Another reporting pattern might be:
1. learning, development and innovation 2. finance. 3. beneficiary/community accountability. 4. internal processes.
Selecting appropriate metrics A simple template can be used for initial design of the dashboard. The CHS Guidance Notes and Indicators can help connect your metrics and indicators to what you need to know about accountability to the communities supported by your agency. FIGURE 3: PLANNING YOUR DASHBOARD
Selecting appropriate metrics
HR process Measures
Operational indicators Effectiveness indicators
Organisational indicators
Understand the sources of data Once the range of metrics is identified, a series of meaningful data collection sources need to be agreed upon. Sources of data may be from routinely uploaded employment details captured on an HR information system or the management reports produced by HR. Depending on how advanced - or not - that system is, manual collection of data from the following may be added:
recruitment documentation.
induction reviews.
exit interviews.
behavioural data e.g. absenteeism records.
salary benchmarking reviews8.
Payroll.
management financial accounts.
annual performance appraisals, 360-degree assessments, personal development plans (PDPs) and learning reviews, organisational health checks or verification assessment tools e.g. the CHS Alliance toolkits.
7 I.e. staff on non-permanent contract such as freelance independent professionals, temporary contract workers, independent contractors or consultants. 8 See examples from Birches Group, Hays “Benchmark for success” guides, and NGO Local Pay.
© CHS Alliance 2016 HR Metrics Dashboard: A Toolkit 10
In addition, surge capacity data may be collected by humanitarian emergency response agencies and displayed. Examples may be standing capacity9, internal recruitment timeframes, percent of each mission that has new recruits and beneficiary complaints feedback. The NGO Sightsavers, describes how it measures its progress using an internet-based dashboard and has a fully illustrated example of its use which can be accessed through its website. Using a balanced scorecard10 approach, Sightsavers publishes results on a six-monthly basis, using lead and lag indicators and a red/amber/green traffic light system to illustrate whether the organisation is on target, lagging behind or ahead of target on performance areas. Another useful reference is ActionAid’s reporting and people management scorecard, available to CHS Alliance members logged in to the CHS Alliance website.
For small organisations, it is important to first look at what systems are already in place which can then be effectively harnessed to produce relevant HR reports. In addition, there are many online resources11 available for HR metrics calculations and “big data” collection, Microsoft Excel tools, as well as the option to purchase more complex human capital management platforms.
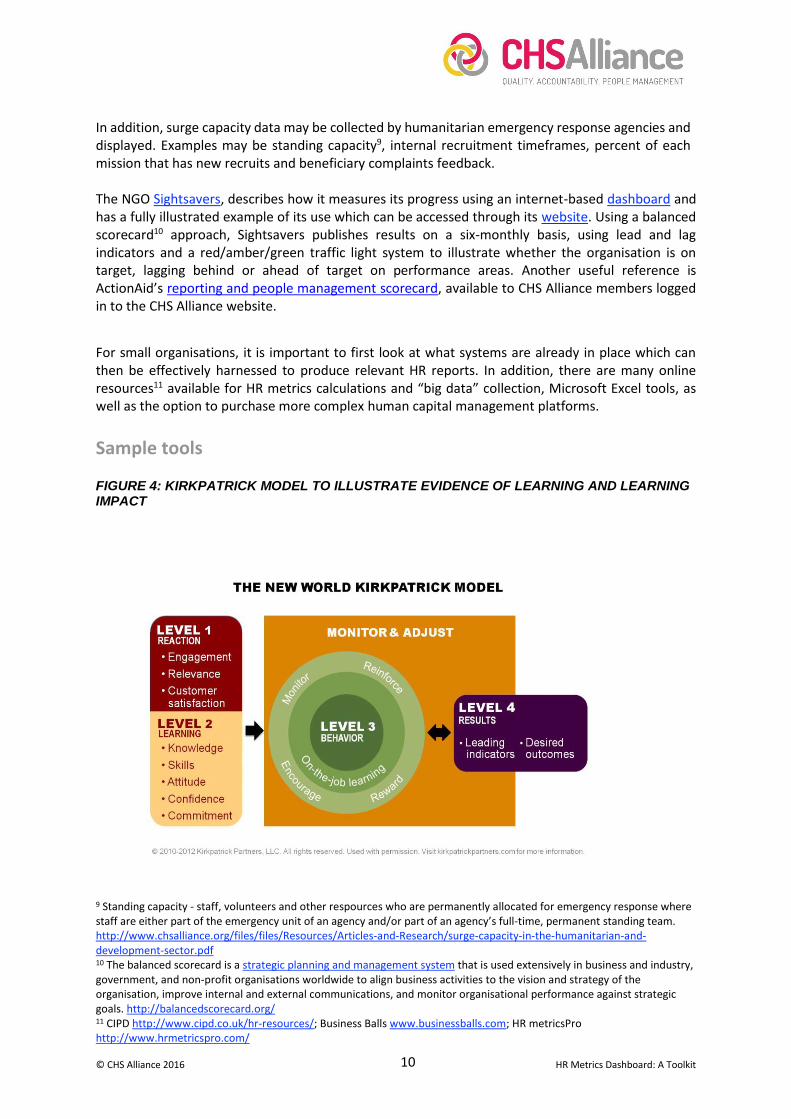
Sample tools FIGURE 4: KIRKPATRICK MODEL TO ILLUSTRATE EVIDENCE OF LEARNING AND LEARNING IMPACT
9 Standing capacity - staff, volunteers and other respources who are permanently allocated for emergency response where staff are either part of the emergency unit of an agency and/or part of an agency’s full-time, permanent standing team. http://www.chsalliance.org/files/files/Resources/Articles-and-Research/surge-capacity-in-the-humanitarian-and-development-sector.pdf 10 The balanced scorecard is a strategic planning and management system that is used extensively in business and industry, government, and non-profit organisations worldwide to align business activities to the vision and strategy of the organisation, improve internal and external communications, and monitor organisational performance against strategic goals. http://balancedscorecard.org/ 11 CIPD http://www.cipd.co.uk/hr-resources/; Business Balls www.businessballs.com; HR metricsPro http://www.hrmetricspro.com/
© CHS Alliance 2016 HR Metrics Dashboard: A Toolkit 11
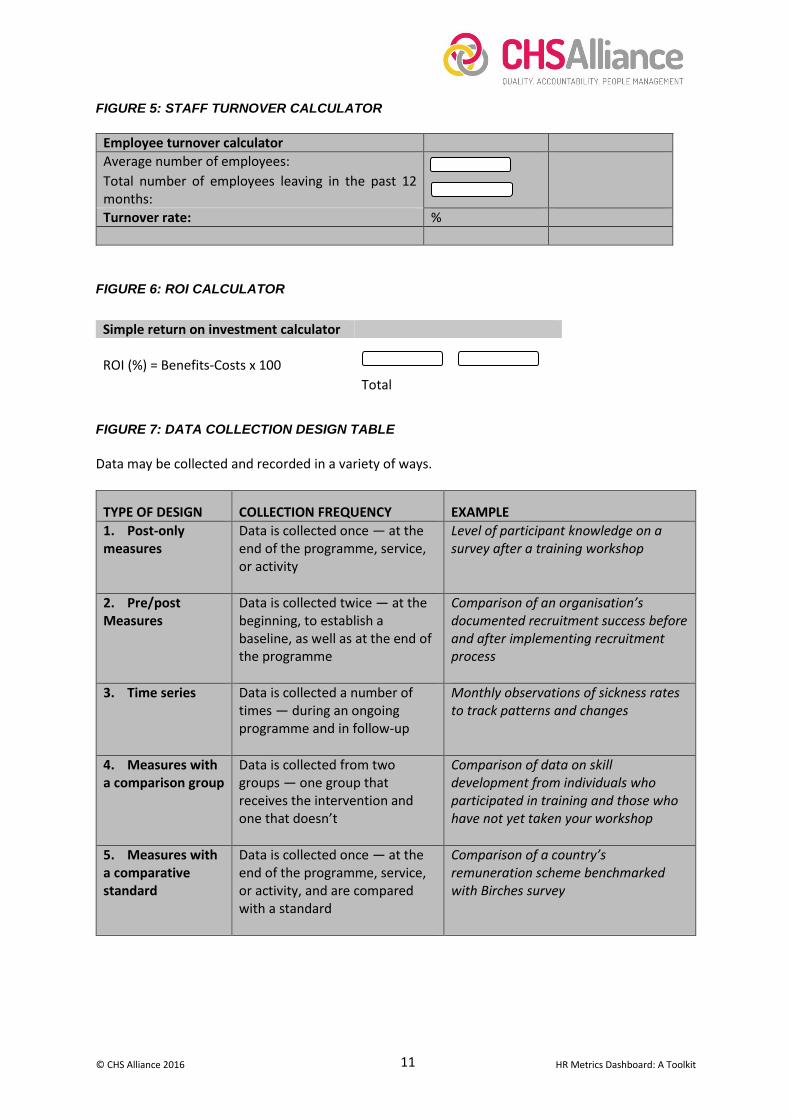
FIGURE 5: STAFF TURNOVER CALCULATOR
FIGURE 6: ROI CALCULATOR
FIGURE 7: DATA COLLECTION DESIGN TABLE
Data may be collected and recorded in a variety of ways.
TYPE OF DESIGN COLLECTION FREQUENCY EXAMPLE
1. Post-only measures
Data is collected once — at the end of the programme, service, or activity
Level of participant knowledge on a survey after a training workshop
2. Pre/post Measures
Data is collected twice — at the beginning, to establish a baseline, as well as at the end of the programme
Comparison of an organisation’s documented recruitment success before and after implementing recruitment process
3. Time series Data is collected a number of times — during an ongoing programme and in follow-up
Monthly observations of sickness rates to track patterns and changes
4. Measures with a comparison group
Data is collected from two groups — one group that receives the intervention and one that doesn’t
Comparison of data on skill development from individuals who participated in training and those who have not yet taken your workshop
5. Measures with a comparative standard
Data is collected once — at the end of the programme, service, or activity, and are compared with a standard
Comparison of a country’s remuneration scheme benchmarked with Birches survey
Employee turnover calculator
Average number of employees:
Total number of employees leaving in the past 12 months:
Turnover rate: %
Simple return on investment calculator ROI (%) = Benefits-Costs x 100
Total
© CHS Alliance 2016 HR Metrics Dashboard: A Toolkit 12
5. Presenting the dashboard The KPIs chosen will lend themselves to a range of presentation features. You may choose from bar charts (including stacked or side-by side), histograms, scatter plots, line graphs (can be combined with bar charts), pie charts or bubble charts with a colour key or a simple table of raw data. Charts can be time-based, categorised, represent current values, previous values for comparison and can display percentage changes in trend. Factors to consider when designing your dashboard:
The question you are trying to answer and what story you want to tell with the chart.
Where and how the dashboard, and any accompanying reports, will be accesssed: for example printed reports only, laptop/desktop, tablet, smartphone, or via an intranet password protected site.
Reliability, consistency and speed of internet access and bandwidth, as well as familiarity with platforms such as Dropbox. A dashboard should fit onto one screen sized format, providing an “at a glance” visual.
Level of detail you need – for further analysis to support actionable steps, depending on the capacity of the organsiation to handle this, the dashboard may be interactive. This allows you to drill-down to a deeper level of detail for example more predictive data, trends, raw data.
How it will be viewed – it is important to note that reports designed to be printed need to be presented in a different way to those being viewed only on a screen.
© CHS Alliance 2016 HR Metrics Dashboard: A Toolkit 13
4.3
2.53.5
4.5
2.4
4.4
1.82.8
2 23
5
0
2
4
6
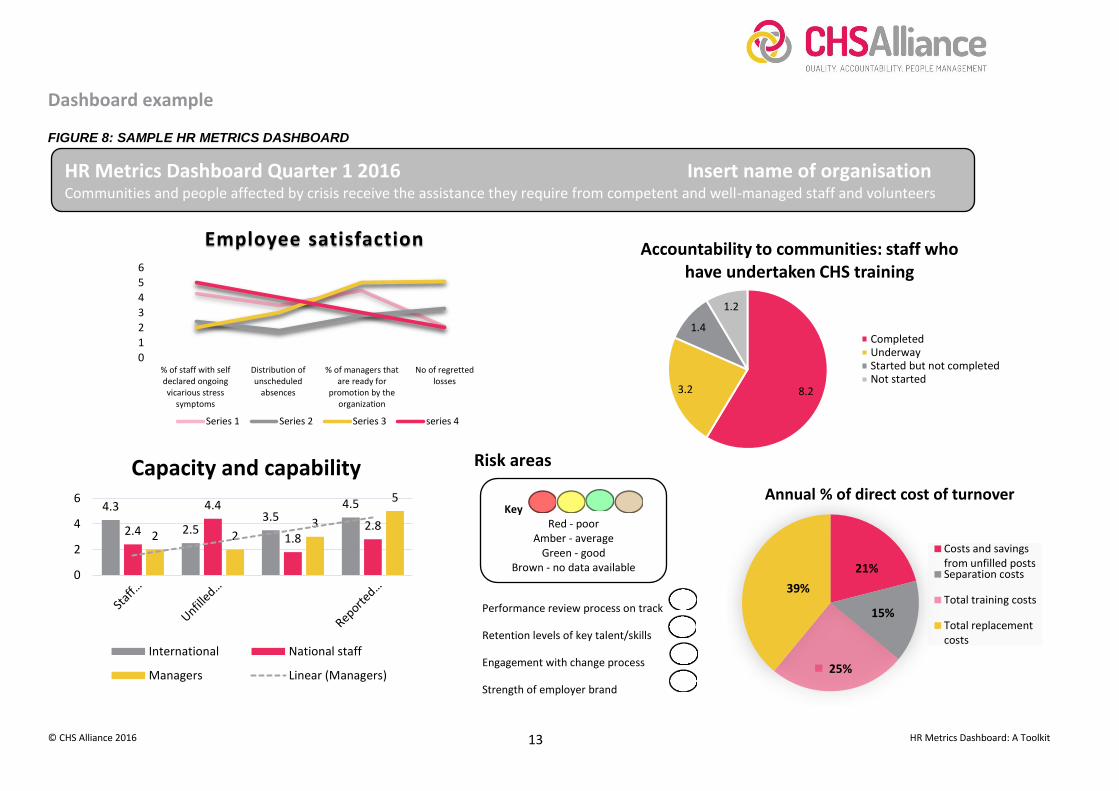
Capacity and capability
International National staff
Managers Linear (Managers)
21%
15%
25%
39%
Annual % of direct cost of turnover
Costs and savingsfrom unfilled postsSeparation costs
Total training costs
Total replacementcosts
Risk areas
Performance review process on track
Retention levels of key talent/skills
Engagement with change process
Strength of employer brand
Key Red - poor
Amber - average Green - good
Brown - no data available
Dashboard example FIGURE 8: SAMPLE HR METRICS DASHBOARD
HR Metrics Dashboard Quarter 1 2016 Insert name of organisation Communities and people affected by crisis receive the assistance they require from competent and well-managed staff and volunteers
0
1
2
3
4
56
% of staff with selfdeclared ongoingvicarious stress
symptoms
Distribution ofunscheduled
absences
% of managers thatare ready for
promotion by theorganization
No of regrettedlosses
Employee satisfaction
Series 1 Series 2 Series 3 series 4
8.23.2
1.4
1.2
Accountability to communities: staff who have undertaken CHS training
CompletedUnderwayStarted but not completedNot started
© CHS Alliance 2016 HR Metrics Dashboard: A Toolkit 14
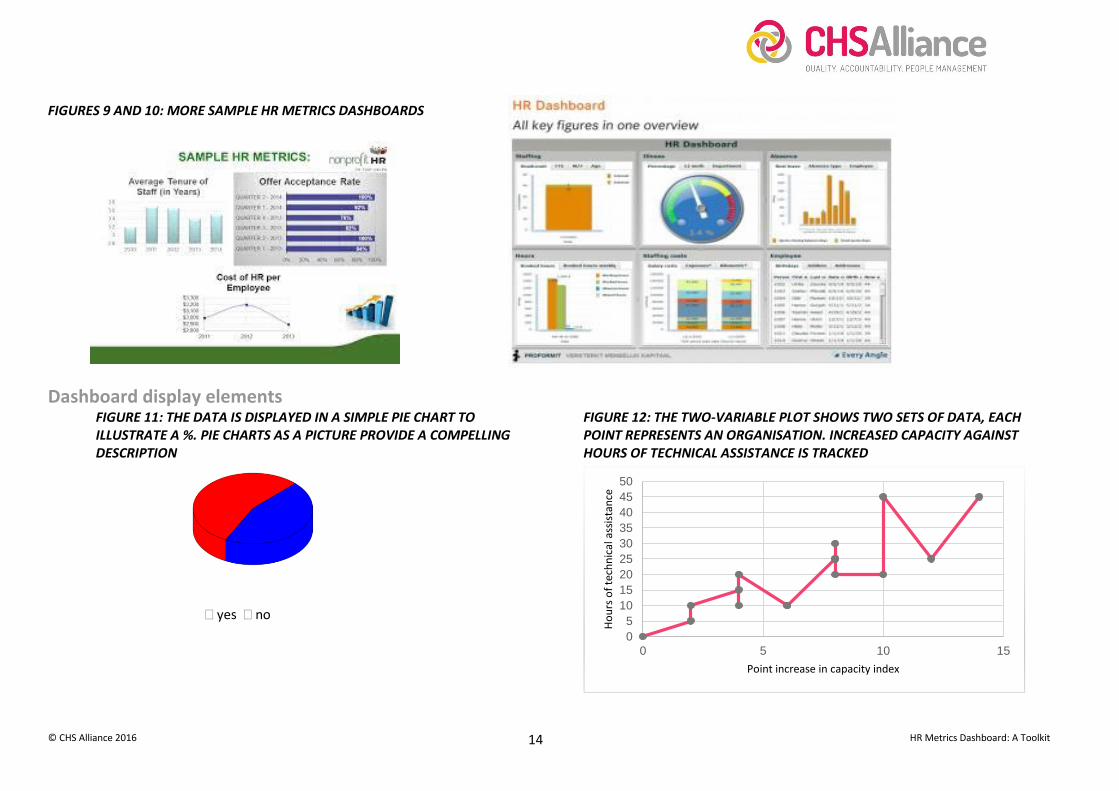
FIGURES 9 AND 10: MORE SAMPLE HR METRICS DASHBOARDS
Dashboard display elements FIGURE 11: THE DATA IS DISPLAYED IN A SIMPLE PIE CHART TO ILLUSTRATE A %. PIE CHARTS AS A PICTURE PROVIDE A COMPELLING DESCRIPTION
yes no
FIGURE 12: THE TWO-VARIABLE PLOT SHOWS TWO SETS OF DATA, EACH POINT REPRESENTS AN ORGANISATION. INCREASED CAPACITY AGAINST HOURS OF TECHNICAL ASSISTANCE IS TRACKED
0
5
10
15
20
25
30
35
40
45
50
0 5 10 15
Ho
urs
of
tech
nic
al a
ssis
tan
ce
Point increase in capacity index
© CHS Alliance 2016 HR Metrics Dashboard: A Toolkit 15
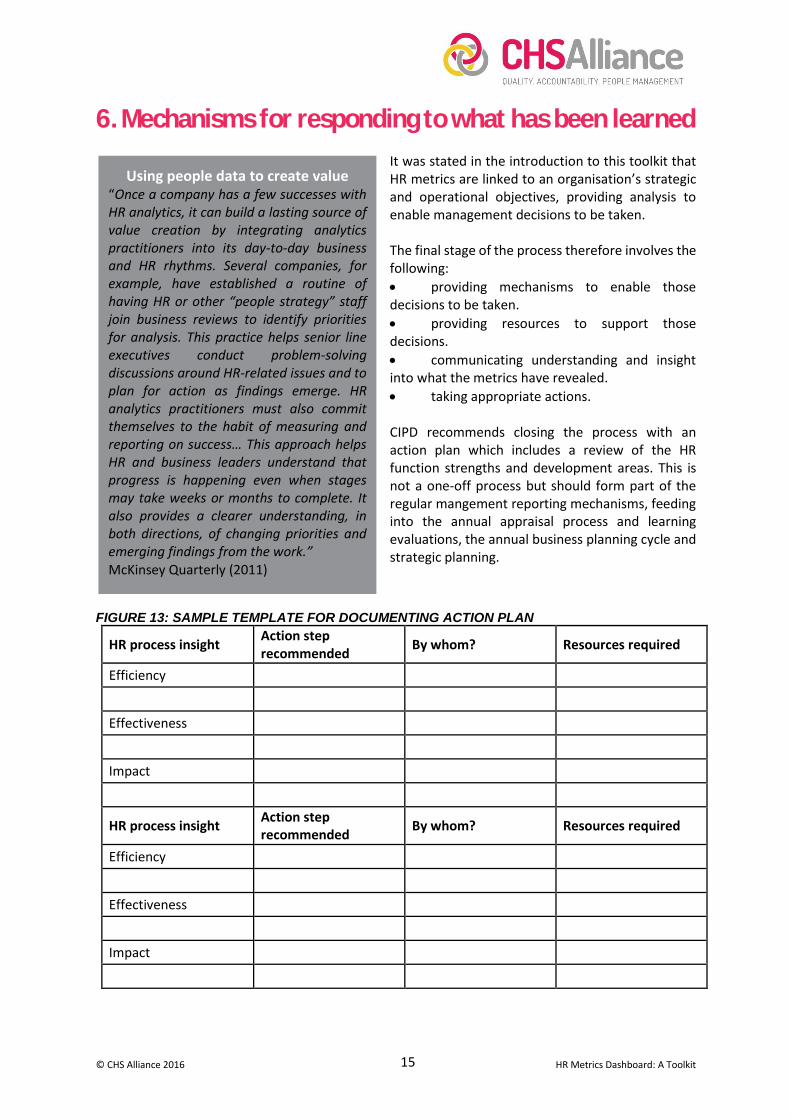
6. Mechanisms for responding to what has been learned
It was stated in the introduction to this toolkit that HR metrics are linked to an organisation’s strategic and operational objectives, providing analysis to enable management decisions to be taken. The final stage of the process therefore involves the following:
providing mechanisms to enable those decisions to be taken.
providing resources to support those decisions.
communicating understanding and insight into what the metrics have revealed.
taking appropriate actions. CIPD recommends closing the process with an action plan which includes a review of the HR function strengths and development areas. This is not a one-off process but should form part of the regular mangement reporting mechanisms, feeding into the annual appraisal process and learning evaluations, the annual business planning cycle and strategic planning.
FIGURE 13: SAMPLE TEMPLATE FOR DOCUMENTING ACTION PLAN
HR process insight Action step recommended
By whom? Resources required
Efficiency
Effectiveness
Impact
HR process insight Action step recommended
By whom? Resources required
Efficiency
Effectiveness
Impact
Using people data to create value “Once a company has a few successes with HR analytics, it can build a lasting source of value creation by integrating analytics practitioners into its day-to-day business and HR rhythms. Several companies, for example, have established a routine of having HR or other “people strategy” staff join business reviews to identify priorities for analysis. This practice helps senior line executives conduct problem-solving discussions around HR-related issues and to plan for action as findings emerge. HR analytics practitioners must also commit themselves to the habit of measuring and reporting on success… This approach helps HR and business leaders understand that progress is happening even when stages may take weeks or months to complete. It also provides a clearer understanding, in both directions, of changing priorities and emerging findings from the work.” McKinsey Quarterly (2011)
© CHS Alliance 2016 HR Metrics Dashboard: A Toolkit 16
7. Glossary of acronyms and abbreviations
CHS: Core Humanitarian Standard on Quality and Accountability (CHS)
CEO: Chief executive officer
HR: Human resources
HRIT: HR information technology
NGO: Non-governmental organisation
INGO: International NGO
KPI: Key performance indicator
L&D: Learning and development
OD: Organisation development
OGSM: Objectives, goals, strategies framework
PDP: Personal development plan
ROI: Return on investment
© CHS Alliance 2016 HR Metrics Dashboard: A Toolkit 17
8. References Archpoint Consulting (2014). OGSM: Developing, Aligning and Deploying Strategy, http://myogsm.com/OGSM-Whitepaper.pdf. Baruch Y. and Ramalho N. (2006). Communalities and Distinctions in the Measurement of Organizational Performance and Effectiveness Across For-Profit and Nonprofit Sectors, Nonprofit and Voluntary Sector Quarterly vol. 35, no. 1, March 2006 pp.39-65, http://nvs.sagepub.com/cgi/content/abstract/35/1/39. Becker E. B., Huselid M.A. and Ulrich D, (2001). The HR Scorecard: Linking People Strategy, and Performance. USA, Harvard Business School Press. Carlson K.D. and Kavanagh M.J. (2004). HR Metrics and Workforce Analytics Saratoga. Institute/SHRM Human Resources, http://www.uk.sagepub.com/upm-data/41672_6.pdf CEB Corporate Leadership Council https://www.cebglobal.com/human-resources/corporate-leadership-council.html CHS Alliance (2015). CHS Guidance Notes and Indicators. http://www.corehumanitarianstandard.org/resources/chs-guidance-notes-and-indicators CHS Alliance (2015). Staff Survey Toolkit. CHS Alliance and Agenda Consulting. http://www.chsalliance.org/resources?basic_search=1&text=employee+survey CIPD in conjunction with pensions and investment research consultants (2015). Human Capital Reporting: Investing for sustainable growth. CIPD (2011) http://www.cipd.co.uk/hr-resources/practical-tools/using-hr-metrics-for-maximum-impact.aspx Conference Board (2012). The State of Human Capital 2012: A False Summit. McKinsey and Conference Board. https://www.conference-board.org/publications/publicationdetail.cfm?publicationid=2328 Deloitte (2015 ). Global Human Capital Trends 2015 Leading in the new world of work. http://www2.deloitte.com/content/dam/Deloitte/at/Documents/human-capital/hc-trends-2015.pdf Gallup (2015). State of the American Manager: Analytics and Advice for leaders. Washington D.C. Gallup. Gardner, N. McGranahan, D. and Wolf, W. (March 2011). Question for your HR chief: Are we using our ‘people data’ to create value? McKinsey Quarterly. http://www.mckinseyquarterly.com/ Guba, E. G. & Stufflebeam, D.L. (1970). Evaluation: The process of stimulating, aiding, and abetting insightful action. Indiana: Indiana University. Iveta, G. (2012). Human Resources Key Performance Indicators. Journal of Competitiveness. Vol. 4, Issue 1, p. 117-128, March 2012.
© CHS Alliance 2016 HR Metrics Dashboard: A Toolkit 18
McLean G.N. (2005). Examining approaches to HR evaluation: The strengths and weaknesses of popular measurement methods. Strategic HR review Volume 4 Issue 2 January/February 2005 Niven, P.R. (2003). Blanced Scorecard for Government and Nonprofit agencies. New Jersey. Wiley. Parry, R. (2013). Maximise the Impact of your People Survey. Agenda Consulting. http://www.agendaconsulting.co.uk/2014/12/29/maximise-the-impact-of-your-people-survey-2/ Phillips J. Phillips P.P. and Ray R.L. (2012). Measuring Leadership development: Quantify your program’s impact and ROI on Organisational performance. USA, McGraw Hill. Phillips J.J., (2014). How to address the challenging ROI issues. The Performance Improvement Conference. www.roiinstitute.net Phillips P. and Ray R., (2014) Human Capital Analytics @ Work Available at Conference Board https://www.conference-board.org/workinggroups/wkgGrpDescribe.cfm?councilid=327 PWC (2014) A new vision for growth: Key trends in human Capital p 25 http://www.pwc.com/en_GX/gx/hr-management-services/pdf/pwc-key-trends-in-human-capital-2014.pdf Steen, A. and Welch, D. (2011), Are Accounting Metrics Applicable to Human Resources? The Case of Return on Valuing Assignments, Australasian Accounting, Business and Finance Journal, 5(3), 57-72. http://ro.uow.edu.au/aabfj/vol5/iss3/5 Stufflebeam, D. L. (1983). The CIPP model for program evaluation. In G. Madaus, Scriven, M & Stufflebeam, D.L. (Ed.), Evaluation models: View points on educational and human services evaluation (pp. 117-142). Boston: Kluwen-Nijhoff